Application of Realistic Wind Loads to the Roof of a...
13
Application of Realistic Wind Loads to the Roof of a Full-Scale, Wood-Frame House Murray J. Morrison 1 , Gregory A. Kopp 2 1 PhD candidate, Boundary Layer Wind tunnel Laboratory, University of Western Ontario, London, ON, Canada, [email protected] 2 Professor, Boundary Layer Wind tunnel Laboratory, University of Western Ontario, London, ON, Canada, [email protected] ABSTRACT Realistic structural testing of buildings and building components can now be conducted using Pressure Loading Actuators (PLAs) developed at the University of Western Ontario. In the present work, the roof of a full-scale, 2 story house, built to the Ontario building code, was tested using 58 PLAs to examine the performance of toe-nailed roof-to-wall connection. The loading for this test were obtained from a wind tunnel study conducted on a 1:50 scale model of the test house. Details of the test set-up and experimental design are presented, along with preliminary analysis of the data. INTRODUCTION Over the past 30 years there have been significant advances in our understanding of wind loads on low-rise buildings. As Surry [1] pointed out: “We know enough about the wind loads on low buildings now, so that disastrous failures (such as seen during Hurricane Andrew) to storms other than severe tornadoes, are much more likely to be due to faults in codes, or construction and inspection practices, than due to a lack of basic wind engineering knowledge.” This statement remains true today. While there may be deficiencies in the wind load coefficients in building codes, e.g., such as those pointed out by [5], these are not due to a lack of understanding of the aerodynamic wind loading or to severe mismatches between wind tunnel and full-scale data [2-4]. However, our understanding of how structural systems, as well as building cladding and components, respond under these wind loads is less advanced for structures like wood frame houses. The main reason for this is houses have many structural members, significant variability in both material and connection (e.g., toe-nails) properties and extensive use of non-structural materials which affect performance. There have been many standard tests developed and used by industry to examine the performance of different building products or components. Examples of this are the ASTM E1592-01 [6] to test sheet metal roof and siding, ASTM E1300-04 [7] to test load resistance of glass, or the cyclical SIDGERS test [8] to test flexible membrane roofs. Most of these tests apply constant loading to the specimen for a predefined amount of time, some are cyclical tests, although usually at a rate which is much less than the actual loading rate generated by real wind. “BRERWULF,” which was developed at the British Research Establishment [9], is able to apply fluctuating wind-induced pressures to cladding specimen, provided the airbox and specimen are nominally air-tight. While the above mentioned tests have provided excellent comparative performance data for roof components, they also have several
-
Upload
truongtram -
Category
Documents
-
view
215 -
download
0
Transcript of Application of Realistic Wind Loads to the Roof of a...

Application of Realistic Wind Loads to the Roof of aFull-Scale, Wood-Frame House
Murray J. Morrison1, Gregory A. Kopp2
1PhD candidate, Boundary Layer Wind tunnel Laboratory, University of Western Ontario, London, ON, Canada,[email protected]
2Professor, Boundary Layer Wind tunnel Laboratory, University of Western Ontario, London, ON, Canada,[email protected]
ABSTRACT
Realistic structural testing of buildings and building components can now be conducted usingPressure Loading Actuators (PLAs) developed at the University of Western Ontario. In thepresent work, the roof of a full-scale, 2 story house, built to the Ontario building code, wastested using 58 PLAs to examine the performance of toe-nailed roof-to-wall connection. Theloading for this test were obtained from a wind tunnel study conducted on a 1:50 scale model ofthe test house. Details of the test set-up and experimental design are presented, along withpreliminary analysis of the data.
INTRODUCTION
Over the past 30 years there have been significant advances in our understanding of wind loadson low-rise buildings. As Surry [1] pointed out:
“We know enough about the wind loads on low buildings now, so that disastrous failures(such as seen during Hurricane Andrew) to storms other than severe tornadoes, are muchmore likely to be due to faults in codes, or construction and inspection practices, than dueto a lack of basic wind engineering knowledge.”
This statement remains true today. While there may be deficiencies in the wind load coefficientsin building codes, e.g., such as those pointed out by [5], these are not due to a lack ofunderstanding of the aerodynamic wind loading or to severe mismatches between wind tunneland full-scale data [2-4].
However, our understanding of how structural systems, as well as building cladding andcomponents, respond under these wind loads is less advanced for structures like wood framehouses. The main reason for this is houses have many structural members, significant variabilityin both material and connection (e.g., toe-nails) properties and extensive use of non-structuralmaterials which affect performance. There have been many standard tests developed and usedby industry to examine the performance of different building products or components. Examplesof this are the ASTM E1592-01 [6] to test sheet metal roof and siding, ASTM E1300-04 [7] totest load resistance of glass, or the cyclical SIDGERS test [8] to test flexible membrane roofs.Most of these tests apply constant loading to the specimen for a predefined amount of time, someare cyclical tests, although usually at a rate which is much less than the actual loading rategenerated by real wind. “BRERWULF,” which was developed at the British ResearchEstablishment [9], is able to apply fluctuating wind-induced pressures to cladding specimen,provided the airbox and specimen are nominally air-tight. While the above mentioned tests haveprovided excellent comparative performance data for roof components, they also have several

drawbacks. First, they are spatially uniform, while real wind loads on low rise buildings havesignificant spatial variations, even over short distances, as shown in Figure 1. This may besignificant for larger components with multiple connections leading to significant load sharing.Thus, for such tests, the applied load is significantly different than real fluctuating windpressures. While cyclical testing is able to model fatigue characteristics that are not captured bystatic tests, the true extent of the effects of real wind loading versus cyclic or static loading is stilllargely unknown. A notable exception is the experiments performed at Mississippi StateUniversity (MSU) using electromagnets capable of applying both temporally and spatiallyvarying wind loads on standing seam metal roofs [10].
Figure 1 Contour plot of wind-induced pressure coefficients, at one moment in time, on the gable roof of ahouse, obtained from wind tunnel experiments.
Experiments conducted at the Cyclone Testing Station [11] have applied loads to full scalehouses using wiffle-trees and were able to test entire houses to failure. Such experiments haveprovided significant insight into how a structural system performs as a whole, along with thesignificant role of non-structural components, such as drywall, in the load sharing for residentialhousing.
The goal of the “Three Little Pigs” Project (3LP) at the University of Western Ontario (UWO) isto examine the performance of full scale structures and components under realistic spatially andtemporally varying wind loads. The first full house experiments involve testing a typically-builtCanadian house to failure. The approach taken at UWO is to model the wind-induced pressures,rather than modeling the wind itself. In this sense, it is similar to the standard airbox type testingdiscussed above. This concept prompted the design of pressure loading actuators (PLAs), whichwill be discussed in more detail below, and a flexible airbag system that can be attached to thestructure or specimen to apply the loads to the structure while providing minimal interference tothe structural response of the system. By having many PLAs and airbags of different sizes, boththe spatial gradients and temporal fluctuations of the wind loads can also be modeled using thistechnique. The objective of the present work is to present preliminary results from the firstexperiments on a full-scale house, focussing on failures of roof-to-wall connections.

EXPERIMENTAL SETUP
PRESSURE LOADING ACTUATORS (PLAS)In order to apply realistic wind loads to the structure, the primary requirement of the PLA is itsability to follow a specific pressure trace in an accurate, reliable and repeatable way so that whenmultiple units are used, the overall structural loads are accurately replicated. In addition, whilethis technique is well suited to taking wind tunnel measurements and applying them to realstructures, this approach can also be used to apply loads from full scale measurements shouldthey be available. Moreover, it is also possible to simulate other types of wind events such astornadoes, downburst or gust fronts if the pressure time series on a structure are known for theseevents.
Due to the large number of PLAs required to test a full structure (which we have limited to 100in the current project) each individual unit needs to be accurately synchronized to all the otherunits in the system in order to generate loads with the proper spatial gradients. Since manybuilding materials are porous, the PLAs have to be able to handle a certain amount of leakage(through the specimen) while still maintaining the fidelity of the pressure trace. Table 1 lists thedesign requirements for the PLAs for different airbox sizes. These requirements were derivedfrom the worst aerodynamic coefficients scaled to a Category 5 Hurricane wind speeds. WhileTable 1 provides the design specifications for a single PLA unit, multiple units can be connectedto a single airbag and used together in order to improve performance for larger airbags or to testcomponents with large leakage flow rates.
Table 1 Design specifications for the Pressure Loading Actuators
Air BoxDimensions
MaximumPressure (kPa)
MinimumPressure (kPa)
LeakageFlow Rates(m3/s)
FrequencyResponse(Hz)
0.6 m x 0.6 m +5 -18 0.2 61.2 m x 1.2 m +5 -15 0.7 42.4 m x 2.4 m +4.5 -11 1.0 4
In order to test the performance of the PLAs a wood frame wall with dimensions of 3.66m highby 6.71m long was built and loaded with 10 PLAs, each connected to its own airbag, the totalloaded area on the wall was 20.4 m2. Figure 2 (Left) shows a portion of the scaled wind tunnelpressure trace for a single airbag along with the output achieved by the PLA. The match isexcellent and typical trace fidelities for individual boxes are greater than 95%. Figure 2 (Right)displays the total reaction force on the wall along with the applied force from the PLAs and thetarget force from the wind tunnel pressure measurements. All three show good agreement, withthe average error between the measured and applied force being approximately 7%.

Figure 2 (Left) Comparison of the demand (wind tunnel, WT) and supplied (PLA) pressure from the PLAconnected to a 1.2 x 1.2 m2 airbox. (Right) Comparison of the demand (WT), applied (PLA), and measured
loads on a test wall using 10 PLAs covering 20.4m2.
FULL SCALE HOUSE TESTING
A typical 2 story Canadian house was built by Building Technology students from FanshaweCollege at the Insurance Research Lab for Better Homes (IRLBH). The house is shown inFigure 3. The house was built to the Ontario building code (OBC), has plan dimension of 9.0mby 8.9m, an eaves height of 8.0 m and a gable roof slope of 4:12. The studded walls areconstructed of 2 x 4’s on 16” centers, the exterior walls are covered with 25mm foam insulationwhich is then covered by a brick veneer. The roof trusses are placed 0.6m on center and aresecured to the top plate using standard toenails with 16d nails. While the number and quality oftoenails varies connection to connection, each connection was documented in detail noting thenumber and location of the nails along with any observed defects. Following construction of thehouse it was inspected by 30 professional building inspectors from across Southern Ontario andwas found to be of typical construction quality for the region. Also shown in Figure 3 is the steelreaction frame surrounding the house which is used to mount the airbags and the PLAs.
Figure 3 Photograph of the first test house at IRLBH.

Roofs of houses experience large suction pressures which are greater than the load experiencedby any other part of the building. A breach of the windward can cause internal pressures whichcan increase this loading by as much as 70%. The most common type of roof to wall connectionused in wood-frame construction is a toe-nail connection. The capacity of toe-nail connectionscan vary significantly on the type of wood, number and type of nails used along with the qualityof construction. Several studies [12-14] have investigated the ultimate capacity of toe-nails andfound that the connection strength can vary between 1130N to 2840N, depending on the factorsdiscussed above. These tests apply load at a constant displacement rate and measure the requiredforce to keep the connection moving at this rate. Typical deflection rates for these tests rangefrom 2.54 to 6.35 mm/min. Hurricane straps can provide a substantial increase in the connectionstrength [13-14] and are now required in Florida and other hurricane prone regions, but are notstandard construction for other regions of North America. Many non-hurricane regions canexperience intense winds during thunderstorms such as tornadoes and microbursts. While thetests mentioned above provide information of the ultimate capacity of the nails, how theconnections respond to a highly fluctuating load or the effect of load sharing between adjacentroof-to-wall connections is still unknown. The first experiment to be conducted on the test housewill try and address these questions by applying wind loads to the roof of the test house only.
WIND TUNNEL SIMULATION
In order to apply realistic wind loads to the full scale house using the PLAs the pressuredistribution must be known first. A wind tunnel study was conducted on a 1:50 scale model ofthe test house in Boundary Layer Wind Tunnel II at UWO. The model was tested in a typicalopen country terrain with no surrounding buildings, which is the base case used in most buildingcodes. Figure 4 shows the measured mean velocity and turbulence intensity profiles along withthe target profiles (ESDU) for an open country terrain (zo=0.01). The mean wind velocity hasbeen normalised to eaves height and both the mean and turbulence intensity show reasonableagreement with the target profiles. Figure 5 presents the longitudinal wind tunnel spectra at roofheight along with the target (ESDU) spectra. While the match between measured and targetspectra is good it is not perfect with too much fine scale turbulence, which is not unusual forwind tunnel simulations at this scale (see [15] for a more detailed discussion). The model had atotal of 432 pressure taps that were sampled at a rate of 400 Hz. The tests were conducted at areference speed of 13.7 m/s and 1 hour of full scale data was collected assuming a velocity scaleof 1:4.

Figure 4 Comparison of measured and ESDU mean normalized wind speed and turbulence intensity profilesfor open country, z0=0.01m
To test the uplift capacity of the roof-to-wall connections the entire roof needed to be cover withairbags. The correct number, size, and location of each airbag on the house is a balance betweenadequately capturing the spatial gradients of the wind pressures and the physical and technicalconstraints inherent to the system. For example the foot print of a PLA is approximately 0.6mby 0.6m which essentially limits the minimum bag size. Through careful analysis of the windpressure distribution, the final airbag layout of the roof is shown in Figure 6. In total 58 bagswere used to cover the entire roof, with the highest density of bags located at the windwardcorner of the roof. A cornering wind was chosen for the full scale tests as this produced thelargest suction pressures on the roof of the house.
Figure 5 Comparison of measured and ESDU mean normalized wind speed and turbulence intensity profilesfor open country, z0=0.01m

Figure 6 Airbag layout on the roof of the test house
INSTRUMENTATION AND TEST PROTOCOLS
The goal of the current tests was to examine the performance of the toe-nail connections of theas-built house. In order to facilitate this test, several minor modifications were made to thestructure. The shingles were removed from the house to allow the physical attachment of the airbags to the roof of the house. It is noted that doing so will lower the overall weight of the houseand thereby increasing the loads on the structural connection. However, since the weight isevenly distributed over the entire roof this reduction in weight can be accounted for in themagnitude of loads applied to the structure. In addition, since the goal of the current experimentwas to test roof-to-wall connections to failure, and not to test the uplift capacity of the plywoodroof sheathing, the sheathing was screwed to the roof trusses to prevent it from failing during thetests. Finally, the soffits and first 2 cords of brick were removed in order to provide access to theroof to wall connections. Since both are non structural elements this should not affect thestructural response of the toe-nail connections. Installation of the airbags and PLAs, wasperformed by University Machine Services at UWO and took 3 individuals nearly 3 months tocomplete. Figure 7 shows a portion of the roof covered by the air bags (blue material seen inFigure 7) which are mounted to the steel reaction frame and the hoses connecting the airbags tothe PLAs. The smaller bags in the picture are 0.6m x 0.6m in size while the larger bags are 1.2mx 1.2m. The bag frames are mounted 6” above the roofs surface, the bag material which is gluedto both the surface of the roof and frame allows for deflections up to 4 inches in either direction.
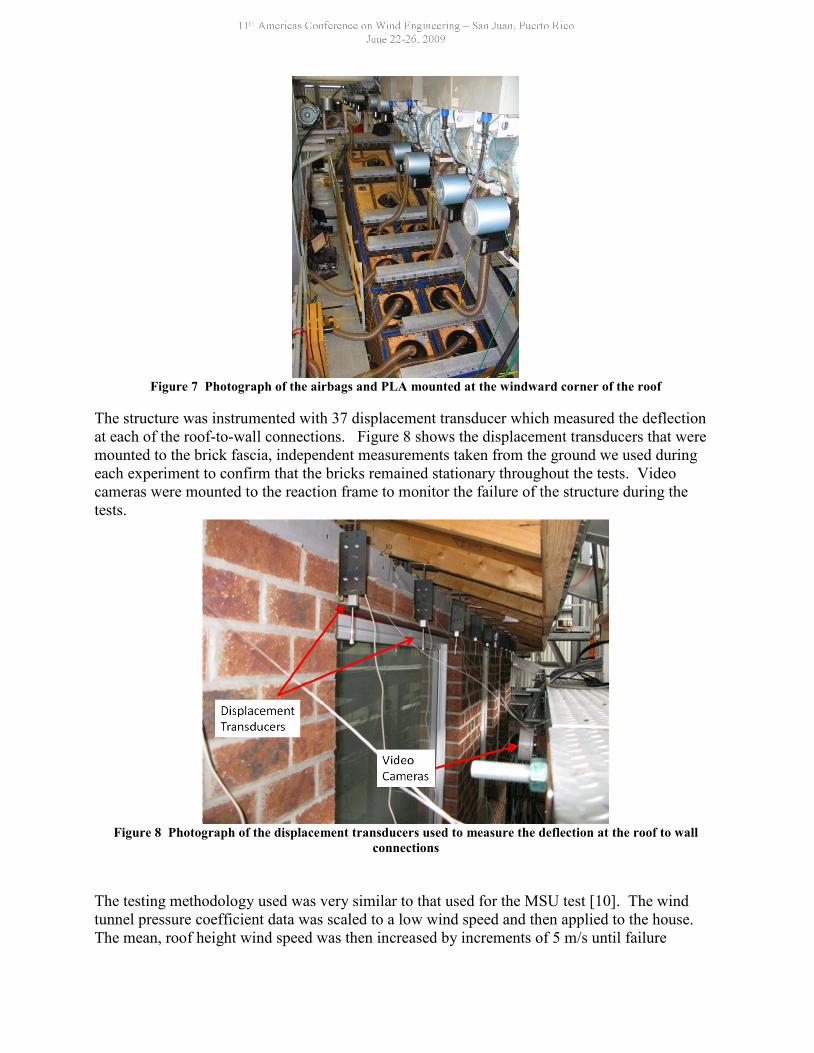
Figure 7 Photograph of the airbags and PLA mounted at the windward corner of the roof
The structure was instrumented with 37 displacement transducer which measured the deflectionat each of the roof-to-wall connections. Figure 8 shows the displacement transducers that weremounted to the brick fascia, independent measurements taken from the ground we used duringeach experiment to confirm that the bricks remained stationary throughout the tests. Videocameras were mounted to the reaction frame to monitor the failure of the structure during thetests.
Figure 8 Photograph of the displacement transducers used to measure the deflection at the roof to wallconnections
The testing methodology used was very similar to that used for the MSU test [10]. The windtunnel pressure coefficient data was scaled to a low wind speed and then applied to the house.The mean, roof height wind speed was then increased by increments of 5 m/s until failure

occurred. It is noted that the response of the connections at higher wind speed tests could beaffected by the previous tests. However, this method of load application is not too dissimilar toan actual hurricane even where the mean wind speed increases gradually as the storm passes.Rather than use the entire pressure record obtained from the wind tunnel tests a 15 minutesection (scaled at the lowest wind speed) or 15% of the entire time record was selected and thenscaled for each test. Figure 9 shows a portion of the wind loading trace for the box with thehighest pressures scaled to mean roof height wind speeds of 20, 30 and 40 m/s. The peakpressures are proportional to the square of the wind speed while the duration is inverselyproportional the wind speed. This means that while the loads for the 40 m/s test are 4 times aslarge as those for the 20 m/s test they last half as long.
Figure 9 A portion of the applied pressure trace for a single airbag scaled to 3 different mean roof heightwind speeds.
RESULTS
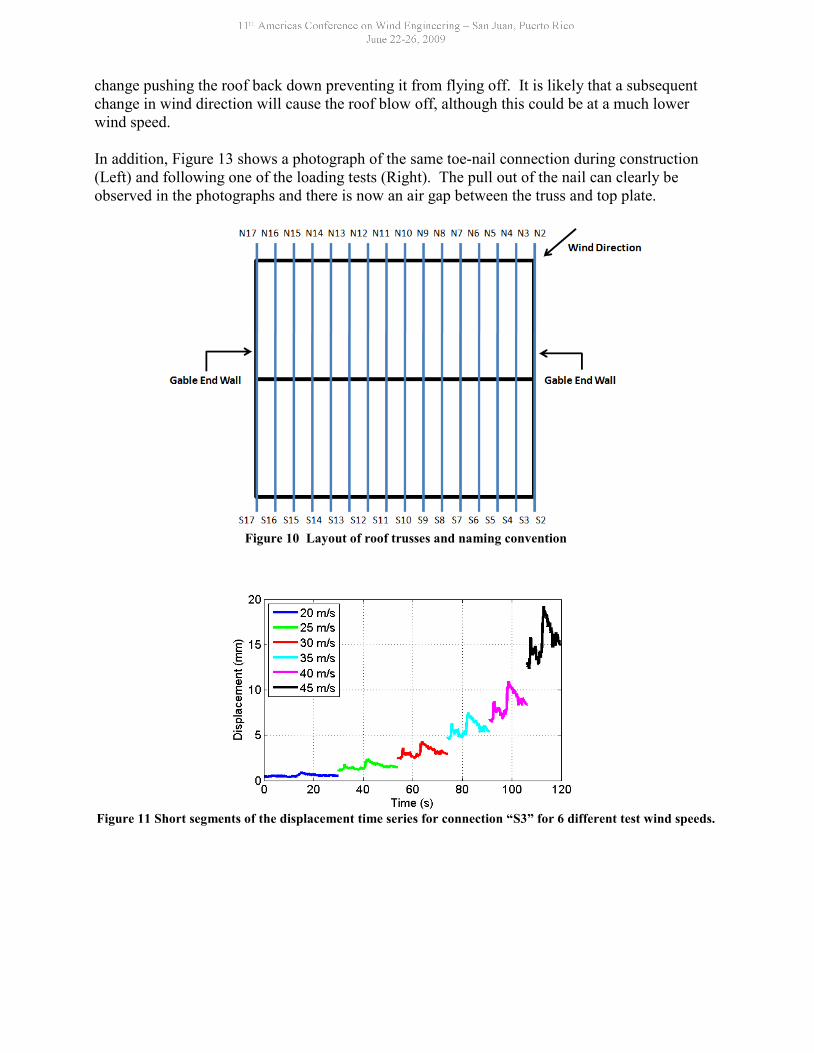
The worst suction pressures on the roof of the house are located on the leeward side of the ridgeclose to the gable end wall, as shown in Figure 1. While loads applied to the roof are known theloads at each roof-to-wall connection were not measured directly. An estimation of the loads ateach connection can be made by assuming a geometric tributary area approach. This assumptioncould be removed by replacing the toe-nail connections with load cells and repeating exactly thesame loading used in the deflections tests. Under this approach the worst loaded roof to wallconnection is located on the gable end wall on the leeward side (South) of the roof (“S2” seeFigure 10 for a truss layout). However, the gable end walls have significantly more weight andadditional connections that effectively reduce the load applied to the toe-nail connections “S2”and “N2”. As a result the largest deflections, and likely the most highly loaded toe-nailconnection, occur at the adjacent connection “S3”. A portion of the deflection time series for the“S3” connection is shown in Figure 11, each colour represents a different scaling wind speedused to calculated the full scale loading. The deflection data shown for each scaling wind speedrepresents the same portion of data obtained from the wind tunnel. At higher wind speeds, thetoe-nails experience significantly larger deflections, which are not proportional to the appliedload. Figure 12 shows the deflection for the same truss as Figure 11 only for the Northconnection (“N3”). The deflections at the “N3” connection are significantly less than that of“S3”. In fact for the first two tests (20 and 30 m/s) the deflections are actually negative. Thisindicates that the roof is rotating towards the wind. In such a configuration once all theconnections have failed and the roof begins to lift up the aerodynamics loads on the roof will
change pushing the roof back down preventing it from flying off. It is likely that a subsequentchange in wind direction will cause the roof blow off, although this could be at a much lowerwind speed.
In addition, Figure 13 shows a photograph of the same toe-nail connection during construction(Left) and following one of the loading tests (Right). The pull out of the nail can clearly beobserved in the photographs and there is now an air gap between the truss and top plate.
Figure 10 Layout of roof trusses and naming convention
Figure 11 Short segments of the displacement time series for connection “S3” for 6 different test wind speeds.

Figure 12 Displacement time series for connection “N3” scaled to 6 test wind speeds
Figure 13 Photograph of a toe-nail connection during construction (Left) and following one of the loadingtests (Right)
The analysis of the experimental results is on-going and a more detail discussion of theexperimental result will be presented at the conference.
CONCLUSIONS
The new loading system developed at UWO allows the application of real wind loading to a fullscale structure. The first test involved applying loads to the roof of the structure to examine theperformance of the toe-nail connections. The connections were found to fail on the leeward sideof the roof first and the roof is rotating about the windward wall.
ACKNOWLEDGEMENTS
The infrastructure reported herein has been provided through the Canada Foundation forInnovation, Ontario Innovation Trust, Insurance Bureau of Canada, Canadian Institute for SteelConstruction and the University of Western Ontario. Seed funding for the project was providedby the Institute for Catastrophic Loss Reduction and the Natural Sciences and EngineeringResearch Council of Canada. Operating funds for research have been provided by grants from

the Natural Science and Engineering Research Council, the Institute for Catastrophic LossReduction, and the Boundary Layer Wind Tunnel Laboratory. Mr. M. J. Morrison gratefullyacknowledges scholarship support from NSERC. Dr. G. A. Kopp gratefully acknowledges thesupport provided by the Canada Research Chairs Program.

REFERENCES
[1] D. Surry, Wind loads on low-rise buildings: past, present and future., Proc. 10th Int. Conf. Wind Eng.,Copenhagen, vo.l 1 1999. p. 105-114.
[2] L.S Cochran, J.E. Cermak, Full- and model-scale cladding pressures on the Texas Tech Universityexperimental building, J. Wind Eng. Ind. Aerodyn.. 43(3) (1992) 1589-1600.
[3] Y.L. Xu, G.F. Reardon, Full-scale and model-scale wind pressure and fatigue loading on the texastech university building, Cyclone Structural Testing Station JCU, technical report No. 42 1996.
[4] J.X. Lin , D. Surry, The variation of peak loads with tributary area near corners on flat low buildingroofs, J.Wind Eng.Ind.Aerodyn., 77-78 (1998) 185-196.
[5] L.M. St. Pierre, G.A. Kopp, D. Surry, T.C.E. Ho, The UWO contribution to theNIST aerodynamicdatabase for wind loads on low buildings: Part 2. Comparison of data with wind load provisions, J.Wind Eng. Ind. Aerodyn.. 93(1) (2005) 31-59.
[6] ASTM , Standard test method for structural performance of sheet metal roof and siding systems byuniform static air pressure difference, Designation E 1592-01, Philadelphia, USA, 2001.
[7] ASTM , Standard Practice for Determining Load Resistance of Glass in Buildings DesignationE1300-04, Philadelphia, USA, 2004.
[8] A. Baskaran, Y. Chen,Wind load cycle development for evaluating mechanically attached single-plyroofs, J.Wind Eng.Ind.Aerodyn., 77-78 (1998) 83-96.
[9] N.J. Cook, A.P. Keevil, R.K. Stobart, BRERWULF – The Big Bad Wolf, J. Wind Eng. Ind. Aerodyn.,vol. 29 (1988) pp. 99-107.
[10] D. Surry, R.R. Sinno, B. Nail, T.C.E. Ho, S. Farquhar, G.A. Kopp, Structurally effective static windloads for roof panels, J. Struct. Eng., 133(6) (2007) 871-885.
[11] G. Reardon, Simulated Wind Load Testing of Full Size Houses. Joint IStructE/ City UniversityInternational Seminar, City University, London, 1996.
[12] J. Cheng, Testing and analysis of the toe-nailed connection in the residential roof-to-wall system,54(4) (2004) 58-65.
[13] T.D. Reed, D.V. Rosowsky, S.D. Schiff, Uplift Capacity of Light-Frame Rafter to Top PlateConnections, J.Arch.Engrg., 3(4) (1997) 156-163.
[14] M.A. Riley, F. Sadek, Experimental Testing of Roof to Wall Connections in Wood Frame Houses,National Institute of Standards and Technology, NISTIR 6938, 2003.
[15] G.A. Kopp, D. Surry, C. Mans, Wind effects of parapets on low buildings: Part 1. Basicaerodynamics and local loads, J. Wind Eng. Ind. Aerodyn.. vol. 93 (2005) 817-841