Application of Impact Resonance Method for Evaluation of ...
100
Application of Impact Resonance Method for Evaluation of the Dynamic Elastic Properties of Polypropylene Fiber Reinforced Concrete by Adham El-Newihy BASc, American University in Cairo, 2013 A Thesis Submitted in Partial Fulfillment of the Requirements for the Degree of Master of Applied Science in the Department of Mechanical Engineering Adham El-Newihy, 2017 University of Victoria All rights reserved. This thesis may not be reproduced in whole or in part, by photocopy or other means, without the permission of the author.
Transcript of Application of Impact Resonance Method for Evaluation of ...

Application of Impact Resonance Method for Evaluation of the Dynamic Elastic Properties of
Polypropylene Fiber Reinforced Concrete
by
Adham El-Newihy
BASc, American University in Cairo, 2013
A Thesis Submitted in Partial Fulfillment
of the Requirements for the Degree of
Master of Applied Science
in the Department of Mechanical Engineering
Adham El-Newihy, 2017
University of Victoria
All rights reserved. This thesis may not be reproduced in whole or in part, by photocopy or other means,
without the permission of the author.
ii
Supervisory Committee
Impact Resonance Method for Evaluation of the Dynamic Elastic Properties of
Polypropylene Fiber Reinforced Concrete
by
Adham El-Newihy
BASc, American University in Cairo, 2013
Supervisory Committee
Dr. Rishi Gupta, Department of Civil Engineering
Supervisor
Dr. Rodney Herring, Department of Mechanical Engineering
Departmental Member

iii
Abstract
For evaluation and quality control of concrete structures, the impact resonant frequency method is
widely accepted for monitoring structure in-service properties and detecting structural damage. Common
defects in concrete include consolidation problems during casting and development of micro-cracks during
stages of hydration. Monitoring the dynamic characteristics of concrete plays an essential role in detecting
real-time and early stages of deterioration. Ample research is focused on detecting large defects, however
not much information is available on detection of minor defects of composites like fiber reinforced concrete.
Change of elastic behavior when Polypropylene fibers are added as reinforcement is investigated.
Destructive tests on structures in-service are not always feasible thus leaving non-destructive condition
assessment as the only option. Amongst the various non-destructive tests available, vibrational tests provide
a practical method to predict the dynamic moduli of structures (dynamic modulus of elasticity, dynamic
modulus of rigidity and dynamic Poisson’s ratio). The objective of this research is to assess the dynamic
elastic properties of Polypropylene Fiber Reinforced Concrete (PFRC) in correlation with induced cracks
and common consolidation defects using a lab developed non-destructive testing method that relies on
impulse excitation and stress wave propagation to measure changes in the resonant frequency when
polypropylene fibers are added to concrete.
In the experimental program, two fiber sizes, macro and micro, with various volume contents have
been used for casting PFRC cylinders and prisms. Fundamental resonant frequencies were measured for all
cylinders and prisms in the transverse and longitudinal directions. All measured frequencies are directly
related to the low-strain dynamic modulus of elasticity. In addition, PFRC prisms were used to investigate
the relationship between the dynamic modulus of elasticity and modulus of rigidity. Several batches of
similar mixtures are used to investigate different parameters that affect the resonant frequency of concrete
such as the water to cement ratio, curing condition and age. Results indicated a decrease in the resonant
frequency and elastic properties with an increase of the fiber content or length. Micro fibers showed higher
dynamic elastic moduli when compared to macro fibers of the same mixture under saturated curing
conditions. Post-cracked PFRC cylinders and flexural fractured prisms retained some of the resonant
frequency with macro fibers exhibiting better elastic recovery when cracked.
iv
Table of contents
SUPERVISORY COMMITTEE II
ABSTRACT III
TABLE OF CONTENTS IV
LIST OF FIGURES VII
LIST OF TABLES VIII
LIST OF ACRONYMS IX
LIST OF SYMBOLS AND UNITS X
DEDICATION XI
ACKNOWLEDGEMENTS XII
1 INTRODUCTION 1
1.1 Overview 1
1.2 Proposed Work 3
1.3 Objectives 4
2 BACKGROUND AND LITERATURE REVIEW 7
2.1 Introduction 7
2.2 Polypropylene Fiber Reinforced Concrete (PFRC) 8 2.2.1 Polypropylene Fiber 8 2.2.2 PFRC Properties 9 2.2.3 Application of Polypropylene Fiber in Concrete 9
2.3 Significance of Non-destructive Testing (NDT) 10
2.4 Resonant Frequency Testing 11 2.4.1 Modulus of Elasticity of Concrete 12 2.4.2 Principles of Resonant Frequency Testing 13

v
2.4.3 Theoretical Background 14 2.4.4 Resonance Frequency Testing Techniques 18 2.4.5 Influencing Parameters on RFT Measurements 21
2.5 Application of Impact Resonance Method on Polypropylene Fiber Reinforced Concrete 24
2.6 Summary 26
3 EXPERIMENTAL PROGRAM 27
3.1 Materials 27 3.1.1 Cement 27 3.1.2 Fly Ash 27 3.1.3 Aggregates 27 3.1.4 Fibers 27 3.1.5 Water 28 3.1.6 Admixtures 28
3.2 Mixture Proportions 29
3.3 Specimen Preparation 30
3.4 Testing 31 3.4.1 Standard Concrete Testing 31 3.4.2 Resonant Frequency Testing 34 3.4.3 Induced Crack RFT Testing 36 3.4.4 Microscopic observation 37
3.5 Repeatability and Validation 37 3.5.1 Effect of Impact Force Variation 38 3.5.2 Effect of Accelerometer Attachment Variation 39 3.5.3 Validation with Isotropic Material 40 3.5.4 Validation with Existing Models 41
3.6 Summary 42
4 RESULTS AND DISCUSSION 43
4.1 Standard Concrete Properties 43 4.1.1 Fresh Concrete Properties 43 4.1.2 Hardened Concrete Properties 44
4.2 Repeatability 47 4.2.1 Effect of Force Variation 47 4.2.2 Effect of Accelerometer Attachment 48 4.2.3 Validation with Isotropic Material 50 4.2.4 Summary 51
4.3 Dynamic Elastic Properties of Concrete 52
vi
4.3.1 Resonant Frequency 52 4.3.2 Dynamic Elastic Properties 62 4.3.3 Relationship between Transverse and Longitudinal Dynamic Modulus of Elasticity 66 4.3.4 Relationship between Dynamic Moduli of Elasticity and Modulus of Rigidity 67 4.3.5 Relationship between Dynamic Modulus of Elasticity and Compressive Strength 67 4.3.6 Relationship between Dynamic Moduli of Elasticity and Density 68 4.3.7 Summary 69
5 CONCLUSION 70
6 REFERENCES 72
APPENDIX A MATERIAL AND EQUIPMENT SPECIFICATIONS 77
APPENDIX B COMPRESSIVE STRENGTH 82
APPENDIX C RESONANT FREQUENCY STUDY RESULTS 83
APPENDIX D REPEATABILITY STUDY 87

vii
List of Figures FIGURE 1-1: EXPERIMENTAL PROGRAM OVERVIEW 5 FIGURE 2-1: STRESS-STRAIN DIAGRAM OF CONCRETE WITH MODULUS OF ELASTICITY TYPES 12 FIGURE 2-2: FORCED RESONANCE METHOD 20 FIGURE 2-3: SPECIMEN SETUP FOR TRANSVERSE, LONGITUDINAL AND TORSIONAL MODES OF TESTING (ADAPTED FROM ASTM C215) 21 FIGURE 3-1: MACRO (LEFT) AND MICRO (RIGHT) POLYPROPYLENE FIBERS 28 FIGURE 3-2: FORNEY COMPRESSION MACHINE USED FOR DETERMINATION OF COMPRESSIVE STRENGTH 33 FIGURE 3-3: A) THIRD POINT LOADING TEST SETUP B) FLEXURE LOADING SCHEMATIC (ADAPTED FROM ASTM C1609) 33 FIGURE 3-4: RESONANT FREQUENCY TESTING USING IMPACT METHOD 34 FIGURE 3-5: (A) RESONANCE FREQUENCY TESTING EQUIPMENT (B) SETUP FOR CYLINDRICAL SPECIMEN (TRANSVERSE MODE) AND (C)
SETUP FOR PRISMATIC SPECIMEN (TORSIONAL MODE) 34 FIGURE 3-6: SETUP FOR CRACKING (A) SCIJ FRONT VIEW (B) CYLINDER HELD IN SCIJ ISOMETRIC VIEW (C) LONGITUDINAL IMPULSE
DIRECTION SETUP 36 FIGURE 3-7: TYPICAL CRACK PROPAGATION FOR MACRO AND MICRO PFRC 37 FIGURE 3-8: REPRESENTATIVE LIGHT (TOP), MEDIUM AND HARD (BOTTOM) IMPACTS 38 FIGURE 3-9: ACCELEROMETER LOCATION ON CONCRETE CYLINDER 39 FIGURE 3-10: VALIDATION OF TESTING WITH ISOTROPIC SPECIMENS 40 FIGURE 4-1: BATCH 1 - FLEXURAL STRENGTH OF 0%, 0.6% AND 1% PFRC 45 FIGURE 4-2: MICRO FIBER CRACK BRIDGING OBSERVED USING OPTICAL MICROSCOPY 46 FIGURE 4-3: MACRO FIBER NATURE OBSERVED THROUGH CRACK USING OPTICAL MICROSCOPY 46 FIGURE 4-4: EFFECT OF FORCE VARIATION ON FREQUENCY RESPONSE 47 FIGURE 4-5: EFFECT OF CONNECTION TYPE OF ACCELEROMETER ON FREQUENCY RESPONSE 48 FIGURE 4-6: EFFECT OF ATTACHMENT/REATTACHMENT OF ACCELEROMETER ON FREQUENCY RESPONSE 49 FIGURE 4-7: EFFECT OF ACCELEROMETER POSITION ON FREQUENCY RESPONSE 50 FIGURE 4-8: TRANSVERSE AND LONGITUDINAL FREQUENCY RESPONSE OF ALUMINUM CYLINDERS 51 FIGURE 4-9: BATCH 1 - RESONANT FREQUENCY OF PFRC PRISMS WITH 0%, 0.6% AND 1% MACRO PP FIBER 53 FIGURE 4-10: BATCH 1 - RESONANT FREQUENCY OF PFRC CYLINDERS WITH 0%, 0.6% AND 1% MACRO PP FIBER 53 FIGURE 4-11: BATCH 1 – TRANSVERSE FREQUENCY DRIFT OF PFRC PRISM (LOW FIBER VOLUME FRACTION) 55 FIGURE 4-12: BATCH 1 – LONGITUDINAL FREQUENCY DRIFT OF PFRC PRISM (LOW FIBER VOLUME FRACTION) 55 FIGURE 4-13: BATCH 1 – TORSIONAL FREQUENCY DRIFT OF PFRC PRISM (LOW FIBER VOLUME FRACTION) 56 FIGURE 4-14: BATCH 1 – TRANSVERSE FREQUENCY DRIFT OF PFRC PRISM (HIGH FIBER VOLUME FRACTION) 56 FIGURE 4-15: BATCH 1 – TRANSVERSE FREQUENCY DRIFT OF PFRC PRISM (HIGH FIBER VOLUME FRACTION) 57 FIGURE 4-16: BATCH 1 – TORSIONAL FREQUENCY DRIFT OF PFRC PRISM (HIGH FIBER VOLUME FRACTION) 57 FIGURE 4-17: BATCH 2 - EFFECT OF AGE ON PFRC PRISMS RESONANT FREQUENCY 58 FIGURE 4-18: BATCH 2 - EFFECT OF AGE ON PFRC CYLINDERS RESONANT FREQUENCY 58 FIGURE 4-19: BATCH 3 - TYPICAL WAVE DAMPING IN TRANSVERSE VIBRATION OF MICRO PFRC CYLINDER 59 FIGURE 4-20: BATCH 3 - TYPICAL FREQUENCY DRIFT OF MICRO PFRC CYLINDER 60 FIGURE 4-21: BATCH 3 – TRANSVERSE AND LONGITUDINAL RESONANT FREQUENCY 61 FIGURE 4-22: BATCH 1 - AVERAGE DYNAMIC MODULI OF ELASTICITY AND RIGIDITY OF PFRC PRISMS 63 FIGURE 4-23: BATCH 1 - AVERAGE DYNAMIC MODULI OF ELASTICITY OF CYLINDERS 64 FIGURE 4-24: BATCH 2 - DYNAMIC MODULI OF ELASTICITY AND RIGIDITY OF PFRC PRISMS WITH AGE 64 FIGURE 4-25: BATCH 2 - DYNAMIC MODULI OF ELASTICITY OF PFRC CYLINDERS WITH AGE 65 FIGURE 4-26: BATCH 3 - TRANSVERSE AND LONGITUDINAL DYNAMIC MODULUS 65 FIGURE 4-27: RELATIONSHIP BETWEEN TRANSVERSE AND LONGITUDINAL DYNAMIC ELASTICITY 66 FIGURE 4-28: RELATIONSHIP BETWEEN DYNAMIC MODULI OF ELASTICITY AND RIGIDITY 67 FIGURE 4-30: RELATIONSHIP BETWEEN MODULUS OF ELASTICITY AND COMPRESSIVE STRENGTH 68 FIGURE 4-29: RELATIONSHIP BETWEEN DYNAMIC MODULI OF ELASTICITY AND DENSITY 68

viii
List of Tables
TABLE 2-1: TYPICAL NDT ASTM STANDARDS USED FOR CONSTRUCTION AND CEMENTITIOUS MATERIALS 11 TABLE 2-2: APPROXIMATE RANGE OF FREQUENCIES FOR CONCRETE SPECIMENS 21 TABLE 3-1: COARSE AND FINE AGGREGATE PROPERTIES 27 TABLE 3-2: POLYPROPYLENE FIBER PROPERTIES 28 TABLE 3-3: SUMMARY OF ADMIXTURE PROPERTIES 29 TABLE 3-4: MIXTURE PROPORTIONS FOR CONCRETE 30 TABLE 3-5: SPECIMEN TESTING BREAKDOWN 31 TABLE 3-6: ACCELEROMETER SPECIFICATIONS 35 TABLE 3-7: EXISTING MODELS BASED ON THE RELATIONSHIP BETWEEN THE COMPRESSIVE STRENGTH, STATIC AND DYNAMIC MODULI OF
ELASTICITY OF CONCRETE 41 TABLE 3-8: K1 VALUES (NOGUCHI ET AL., 2009) 42 TABLE 3-9: K2 VALUES (NOGUCHI ET AL., 2009) 42 TABLE 4-1: FRESH CONCRETE PROPERTIES 44 TABLE 4-2: HARDENED CONCRETE PROPERTIES 45 TABLE 4-3: RESONANT FREQUENCY RESPONSE OF HIGH, MEDIUM, AND LOW IMPACTS 47 TABLE 4-4: RESONANT FREQUENCY RESPONSE USING DIFFERENT ADHESIVES 48 TABLE 4-5: RESONANT FREQUENCY RESPONSE BY CHANGING ACCELEROMETER POSITION 49 TABLE 4-6: RESONANT FREQUENCY RESPONSE AND CALCULATED ELASTIC MODULI FOR ALUMINUM CYLINDERS 50 TABLE 4-7: TRANSVERSE, LONGITUDINAL AND TORSIONAL RESONANT FREQUENCY OF PFRC SPECIMENS 52 TABLE 4-8: TRANSVERSE, LONGITUDINAL AND TORSIONAL RESONANT FREQUENCIES OF SELECTED PFRC PRISMS 54 TABLE 4-9: T VALUES FOR TRANSVERSE DYNAMIC ELASTIC MODULUS CALCULATION 62 TABLE 4-10: DYNAMIC PROPERTIES OF PFRC SPECIMENS 63

ix
List of Acronyms
AASHTO American Association of State Highway and Transportation Officials
ACI American Concrete Institute
AEA Air Entraining Admixture
CV Coefficient of Variation
FRC Fiber Reinforced Concrete
FRM Forced Resonance Method
GU General Use
IRM Impact Resonance Method
RFT Resonant Frequency Testing
PFRC Polypropylene Fiber Reinforced Concrete
PP Polypropylene
SCC Self-Compacting Concrete
SCIJ Standard Crack Inducing Jig
SCM Secondary Cementitious Materials
WRA Water Reducing Admixture
w/c Water to Cement Ratio

x
List of Symbols and Units
b Width (millimeters)
d Diameter (millimeters)
Ed Dynamic Modulus of Elasticity (gigapascals)
Edt Transverse Dynamic Modulus of Elasticity (gigapascals)
Edl Longitudinal Dynamic Modulus of Elasticity (gigapascals)
Es Static Modulus of Elasticity (gigapascals)
f Fundamental transverse frequency (Hertz)
f’ Fundamental longitudinal frequency (Hertz)
f” Fundamental torsional frequency (Hertz)
Fc Compressive Strength (megapascals)
Fr Modulus of Rupture or Flexure Strength (megapascals)
G Dynamic Modulus of Rigidity (gigapascals)
GPa GigaPascal
Hz Hertz
K Radius of Gyration (meters)
Kg Kilogram
kN KiloNewton
L Span length (millimeters)
m Mass (kilograms)
N Number of samples
MPa MegaPascal
P Maximum Load at Failure (newtons)
R Shape factor
t thickness at direction of driven wave (millimeters)
T Correction factor
μm Micrometer
μs Microstrain

xi
Dedication
I am grateful for my parents, Mr. Fouad El-Newihy and Dr. Noura Omar, and my dear sister Nadoooda
who have provided me with moral and emotional support throughout my thesis and beyond.
To my heart and soul, Kristina Frolova. You have always read me like an open book and always found the
best in me.
I dedicate this thesis to my cats, Kitty and Sully.

xii
Acknowledgements
First, I would like to thank my dear Supervisor, Dr. Rishi Gupta, for his guidance throughout my
blessed journey. I am very thankful for his continuous motivation and great moments in learning now one
of my favorite materials, Concrete.
Also, I would like to thank my Academic advisor, Dr. Rodney Herring, for teaching me innovations
in materials and the pure joy behind microscopy.
I am immensely grateful to Dr. Svetlana Brzev and my Academic committee for their comments
on an earlier version of this manuscript, yet any errors of my own should not tarnish the reputation of these
esteemed persons mentioned above.
To extend, I would like to deeply thank Mechanical Engineering Department Secretary, Ms. Susan
Wignall, for her high spirit and continuous support. I also wish to extend my thanks to UVIC’s Advance
Microscopy Facility manager, Dr. Elaine Humphrey for her thoughtful teachings in the wonders behind
microscopy.
Special gratitude goes out to Civil Engineering Technical Support, Dr. Armando Tura and Mr.
Matthew Walker for great chats and more exceptional meals. I would also like to thank Civil Engineering
Department Secretary Christine Doszecki for making it easier during my questioning days.
I would like to express my gratitude to Mechanical Engineering Faculty Member, Dr. Caterina
Valeo, for her kind support during the course of this research. I am also grateful to the following university
staff: Mechanical Engineering Staff Mr. Patrick Chang and Mr. Barry Kent, Faculty of Graduate Studies
Program Clerk Ms. Karen McKenzie, and University Welcome Center Director Ms. Juanita Shorkey for all
their help and continuous support.
I would like to thank all my friends and colleagues of the Faculty of Engineering and the Civil
Engineering Research Group. Special thanks go out to my colleagues Pejman Azarsa and Peiman Azarsa
for their support in the obstacles of my journey. Moreover, I would like to thank my colleague Chen Yang
for fun times in testing concrete.
1
1 Introduction
1.1 Overview
Concrete, the second most used material in the world, is a composite one with relatively low tensile
strength. It exhibits a tendency to fail under a tensile load almost 15% of its attainable compressive strength.
This failure can be prevented by using reinforcement having higher toughness and tensile strength
properties (Krstulovic-Opara et al., 1994).
Different types of reinforcement are used for specific purposes to provide adequate strength and
ductility to the concrete matrix. Concrete structures are usually reinforced by embedding steel rebar in a
passive condition before the concrete sets. Reinforcing concrete with steel bars accommodates tensile
stresses, minimizes crack propagation and, increases the bond strength with the concrete matrix. Usually,
the bars are extruded with a rugged homogeneous surface to provide a stronger bond to the concrete matrix.
Deformed steel bars and steel wire meshes are used to compensate the lack of tensile strength that concrete
partakes.
As reinforcement bars are embedded in a thick cover of concrete with low permeability, it is likely
that steel corrosion will not take place since a passive oxide layer of calcium hydroxide forms protecting
the steel surface. While concrete provides an alkaline medium and large cover mass for the steel to avoid
corrosion, weakening of the structure can occur due to corrosion happening along the rebar when moisture
and chlorides diffuse through generated cracks. Aggressive environments such as marine sites and high
chloride areas impact the passive layer and gradually corrode the steel.
When reinforcements corrode, products like iron oxides and iron hydroxides accumulate on the steel
surface causing expansive stress due to the space restriction between concrete and steel. Accordingly,
corrosion of embedded steel reinforcement is invariably one of the main factors contributing to the
deterioration of concrete structures. Hence, parallel alternatives to conventional steel to resolve the inherent
crack generation within structures, several researchers investigated integrating fibers to the concrete matrix
in order to extend the composite durability, control shrinkage cracking and increase surface toughness
(Naaman et al., 1989; Brown et al., 2001; Banthia and Gupta, 2006; Deng and Li, 2007).
According to American Concrete Institute (ACI) Committee 544.3R-08, FRC is “concrete made
primarily of hydraulic cements, aggregates and discrete reinforcing fibers” (ACI Committee 544 and
American Concrete Institute, 2008). Fibers are commonly distributed randomly within the concrete matrix
to contribute to composite toughness and conceal micro-crack propagations. Nowadays, more development
in Fiber Reinforced Concrete (FRC) is used for improving the endurance of concrete towards mechanical
and environmental influences (Zheng and Feldman, 1995; Kurtz and Balaguru, 2000; Deng and Li, 2007).
As multiscale reinforcement, fibers come in various types and sizes. Originally, the use of glass fibers
as reinforcement in cement based materials started in the mid-60’s (Biryukovich et al., 1965). Glass Fiber
Reinforced Concrete (GFRC) is composed of short length discrete glass fibers dispersed in fresh plain
concrete. Although, glass fibers improve the concrete composite by increasing the tensile and impact
strength, a limitation of using these fibers in concrete is fiber embrittlement due to the high alkalinity of
cement binder (Ferreira & Branco, 2007). Contemporary materials that are commonly used as fibers in
concrete include of steel, glass, natural (wood, fruit, or grass) or synthetic (polypropylene, nylon and
polyester) that have a variety of different shapes and sizes per the required purpose. Unlike steel bar

2
reinforcement, fibers are relatively distributed homogenously throughout the concrete making an effective
load distribution. The structural purpose and mechanical properties of fibers, along with their environmental
impact, play an important role for selecting the optimum fiber type and quantity. For instance, metallic
fibers such as steel enhance concrete ductility, flexure strength, and fracture toughness; however, they are
subjected to the same type of corrosion deterioration as steel reinforcement. Consequently, the durability
of Steel Fiber Reinforced Concrete (SFRC) is reduced in high sulphate and chloride exposed environments
(Mu, et al., 2002). Steel and glass fibers depend on adhesive chemical interaction. However, polymer
organic fibers such as polypropylene and nylon rely on an interlocking mechanical mechanism and exhibit
hydrophobicity, when added to cementitious medium. (Naaman et al., 1989). The most common type of
synthetic fiber reinforcement used in concrete is polypropylene for its high impact resistance,
environmental stability, and low production cost. Polypropylene Fiber Reinforced Concrete (PFRC) exhibit
a better tensile strength and toughness than regular concrete. However, the increase in strength is not
significant since the fibers have a low modulus of elasticity. A disadvantage to polypropylene fibers arises
from its hydrophobic nature that can affect the fiber bond with the cement matrix. Although the fibers are
not likely to bond chemically with the matrix, chemical admixtures can be used to facilitate bonding.
Typical properties that define concrete’s structural integrity are its compressive strength and modulus
of elasticity. The elastic modulus of concrete is of great interest as a design factor for structures and a
reliable condition indicator of in-service structures. It can be determined through the static and dynamic
behavior of structural elements. The static modulus of elasticity of concrete can be measured through quasi-
static or uniaxial compressive loading measured according to ASTM C469 (ASTM C469, 2014). The static
modulus of elasticity (Es) is obtained from direct loading of specimens to a load lower than the elastic limit
of a concrete specimen. On the other hand, the elastic properties of concrete can also be found using
vibration resonance according to ASTM C215 (ASTM C215, 2014). The resulting modulus is referred to
as the Dynamic modulus of elasticity (Ed). Measurement of the dynamic modulus of elasticity will be
covered in Section 2.4.
The advantage of using Ed, in monitoring the mechanical properties of concrete over Es, is that the
dynamic modulus is sensitive to changes within the composite such as cracks, mineral admixtures and
porosity that provide crucial in-service properties. It is considered more appropriate to assess the dynamic
modulus of elasticity in case of dynamically loaded structures since it captures the full cycle of loading and
relies fully on non-destructive approaches (Mindess et al., 2003). The non-linear nature of concrete arises
from discontinuities within the material such as micro-pores and cracks. Concrete embedded reinforcements
and sensors, of different sizes, increase the potential of discontinuities within a concrete structure. These
affect the dynamic response of concrete in relation to its microstructure.
Generally, the (Ed) is obtained using sonic vibration techniques that are mainly non-destructive in
nature. Some Non-destructive Testing (NDT) methods rely on determining concrete properties using
surface hardness or wave propagation properties. Using these methods, the concrete microstructural
properties are indirectly determined by means of the measured parameters and empirical relations. Surface
hardness methods predict the compressive strength of concrete using compression wave surface rebound
properties when concrete is subjected to an impulse load. Similarly, stress wave propagation methods rely
on sound, vibrational impulses or low load impacts that provide an evaluation of concrete compressive
strength and modulus of elasticity. Both strength and elastic properties are affected by a range of factors
including concrete curing conditions, temperature, mixture proportions, water to cement ratio (w/c),
aggregate properties, reinforcements, and the presence of cracks. However, Ed is predominantly affected
by the coarse aggregate size, type and mineral admixtures used (Noguchi et al., 2009).

3
Currently, NDTs for measuring the dynamic elastic modulus of concrete depend on methods that
entail stress wave propagation properties such as wave velocity and resonant frequency. Regular assessment
using non-destructive monitoring of reinforced concrete structures saves restoration time and cost during a
maintenance cycle. Vibration parameters are assessed by studying the frequency response of concrete to
stress wave propagation. Stress waves can be induced using sound or impact vibration. A review and
summary of the NDT techniques used in this study is included in Section 2.3.
Structural damage evaluation using non-destructive resonant frequency testing has reached
considerable attention in recent years. The natural frequency is considered a reliable property that indicates
the strength and durability of a structure. In addition, it is directly affected by significant deterioration and
cracks within the structure. Any change directly related to the mass, stiffness or damping properties of the
structure will lead to changes in the dynamic elastic properties such as the resonant frequencies, mode
shapes and damping loss factors (He, 1999). Studies show a significant benefit of monitoring the dynamic
behavior of a structure using RFT as resonant frequency changes are less susceptible to random error
sources such as electronic noise in surrounding circuits and irregular change signal change due to random
vibration.(He, 1999).
Vibration is characterized by the mode of testing which predominantly concentrates on the support
condition and excitation of concrete specimens. By supporting a concrete specimen in a flexural,
longitudinal, and torsional mode, the calculated dynamic moduli of elasticity, modulus of rigidity and
Poisson’s ratio provide significant information in estimating current strength properties and evaluating the
structure’s condition in-service. Resonant frequency testing of concrete is further discussed in Section
2.4.Since resonance is generated from the elastic and inertial properties of a material, monitoring the
mechanical properties of concrete using vibration test data is achievable. Modification in the resonant
frequency, modal shape and damping of an induced vibration can specify possible damage in the composite.
This modification is attributed to the location, nature, and severity of the damage. As structural damage
modifies the modes of vibration, stress wave propagation methods can be used to monitor the health of
concrete structures.
A great number of studies have been conducted on using the RFT method for measuring the dynamic
modulus of elasticity of concrete, but few experiments have been conducted on using this technique to
measure the dynamic moduli of PFRC considering evaluation of induced cracks and defects. This study
gives a broader application of PFRC in construction industry that can help in evaluating structure
performance and integrity using RFT. There is a dire demand to develop a cost-effective, reliable, and
repeatable technique to measure dynamic elastic property of concrete to provide engineers and researchers
a valuable tool to evaluate health of any composite structure in-service and detect signs of deterioration. By
knowing the original dynamic elastic properties of a structure, using RFT as a NDT method will allow
structural designers to identify the extent of damage and act to avoid the probability of structural failure.
1.2 Proposed Work
Currently, several valuable reports have been established as guidelines for non-destructive testing
and resonant frequency measurements to assess the overall dynamic characteristics of concrete (Malhotra
and Carino, 2004; Shkolnik, 2005; Lamond and Pielert, 2006; Bungey et al., 2006; Noguchi et al., 2009;
Neville and Brooks, 2010). Some laboratory experiments have been conducted to investigate the effect of
polypropylene fibers on the resonant frequency of concrete (Manolis et al., 1997; Leung and Balendran,
4
2002; Leung et al., 2003), however the author recommends to pursue the correlation between PFRC and its
reference concrete through the dynamic modulus of elasticity since it accounts for specimen weight,
dimensions and geometrical correction factors.
While field examination provides supportive information on the mechanical behavior of concrete
structures, it delivers minimal opportunity to assess the constraints surrounding vibrational impulses.
Therefore, the main purpose of this study is to investigate the dynamic elastic properties of PFRC in
concurrent evaluation of common defects, such as honeycombing or induced cracks, using a non-destructive
method, that can be applied in monitoring the integrity of concrete structures. Ultimately, results from this
study will contribute in assessing the performance of existing and new PFRC structures to provide
guidelines for structural designers and field examiners. This proposed work provides details on fundamental
changes in resonant frequency signatures of PFRC when compared to the control concrete matrix while
relating the resonant frequency change of PFRC due to induced matrix cracks after concrete hardening
using a lab developed NDT. To the author’s knowledge, no previous studies in this area were reported.
Studies investigating the dynamic elastic properties of PFRC only considered the resonant frequency
without considering mass and size of the tested samples. Hence, to bridge the gap, selected factors such as
fiber volume fraction, fiber size, concrete age, and curing conditions of FRC are correlated using the
dynamic elastic moduli calculated from the resonant frequency; considering geometrical and density
variations of each tested concrete specimen. In addition, this study includes the affect of induced cracks on
the dynamic modulus of elasticity of PFRC. Recommendations are given throughout this study by
evaluating the repeatability of impact resonant frequency testing. Consequently, the overall objective of
this thesis is to bring to light the effects of polypropylene fibers on the dynamic properties of concrete. For
fulfilling the study objectives, an experimental program was developed and completed in the Civil
Engineering Material Facility at the University of Victoria which will be explained in Section 3.
1.3 Objectives
The fundamental goal of this thesis is to investigate the dynamic elastic properties of polypropylene fiber
reinforced concrete using a non-destructive testing method that is reliable, repeatable, and economical. The
primary purpose of fiber addition is to improve the mechanical properties of concrete prior and after
deterioration occurs.
Objective I Review the repeatability of the impact resonant frequency method of PFRC
Objective II Investigate the effect of increasing fiber volume fraction on PFRC elastic properties
Objective III Investigate the effect of curing age on PFRC elastic properties
Objective IV Assess the performance of fibers in deterioration and crack bridging
Scope of Work
Chapter 1 Introduction
A brief overview providing the significance of fibers in concrete and the application of resonant frequency
testing. Study objectives and proposed work is included in this chapter.
Chapter 2 Literature Review

5
This chapter serves as the backbone of this study for understanding the underlying concepts, advantages
and limitations served in throughout this research. The chapter is divided into the following sections: The
first section of the chapter describes the benefits of using fibers in concrete and the application of
polypropylene fiber in concrete. The second section highlights the significance of non-destructive testing
of concrete. The third section provides an overview of resonant frequency testing and its application in
concrete including predominant factors that affect the test outcome. The fourth section is literature review
of the application of impact resonant frequency testing on polypropylene fiber reinforced concrete.
Chapter 3 Experimental Program
The chapter provides a detailed description of the materials used for developing the PFRC mixtures of this
study. Identifying material properties and maintaining a constant source is crucial for having adequate
results and not influence the test outcome. Mixture proportioning and sample preparation of PFRC cylinders
and prisms of this study were accomplished using three batches. The chart below shows an overview of the
selected batches and their purpose. Only the RFT testing samples are included. Supplementary tests such
as the compressive strength, flexural strength, induced crack testing is described in this chapter.
Figure 1-1: Experimental Program Overview
ExperimentalProgram
Batch 1
- To compare the effect of using a low and high fiber content of macro polypropyelene fibers on the dynamic elastic properties of plain concrete.- To investigate the application of resonsant frequency testing on measuring the extent of deteriortation through flexural failure
Fiber Type: Macro9 Cylinders9 PrismsLow fiber volume fraction: 0.6%High fiber volume fraction: 1%Curing: Water-saturated at 23˚C to 56 Days
Batch 2
- To assess the effect of age, using a low fiber content of micro polypropyelene fibers, on the dynamic elastic properties of plain concrete
Fiber Type: Micro6 Cylinders6 PrismsLow fiber volume fraction: 0.6%Curing: Water-saturated at 23˚C for 56 days
Batch 3
- To compare the dynamic elastic properties prior and post-cracking of macro and micro PFRC with different curing conditions
Fiber Type: Macro/Micro24 CylindersLow macro fiber volume fraction: 0.6%Low micro fiber volume fraction: 0.3%Wet Curing: Water-saturated at 23˚C for 28 daysDry Curing: Ambient air dry at 22˚C

6
Finally, a repeatability study confirms the optimal connectivity, adhesive attachment, and applied force on
the resulting frequency response.
Chapter 4 Results and Discussion
This chapter is divided into three sections. Section 1 covers the standard concrete properties including the
PFRC workability, air content, density, and temperature in fresh state. Hardened concrete properties such
as the compressive strength, flexural strength and static modulus of elasticity is included. Section 2 covers
the repeatability results on selected PFRC samples and validation with a homogenous isotropic material –
Aluminum. Section 3 includes the resonant frequency results and dynamic elastic properties of all
aforementioned batches.
Chapter 5 Conclusions and Recommendations for Future work
A summary of the results and study highlights are included in this chapter. Recommendation for future
work is also provided.

7
2 Background and Literature Review
2.1 Introduction
Concrete, as a viscoelastic amorphous material at early age of hydration, is relatively brittle under the
tensile loading when hardened. Once subjected to the tensile stresses, plain concrete will crack, and
eventually fail. Hence, to modify concrete properties in both plastic and hardened stages, it is typically
reinforced with steel rebar and various types of fibers. However, dispersed fibers in concrete offer a variety
of advantages than steel reinforced concrete as summarized below (Mehta & Monteiro, 2006):
• uniformly distributed fibers in three-dimensions within the concrete matrix, using superplasticizers,
perform effective load distribution;
• fiber, typically organic fibers, are less sensitive to corrosion and environmental changes than
conventional reinforcing steel bars;
• fibers are more economical and reduce labor cost of steel bar placement.
The concept of using fibers in construction materials has been applied since archaic times when
horsehair was mixed into mortars and straw in mud bricks. In 1898, asbestos fibers were introduced to
reinforce cement based panels known as the Hatschek process. Later on, (Biryukovich et al., 1965) applied
glass fibers for reinforcing cement paste and mortar. Since Fiber Reinforced Concrete (FRC) has become
an important construction material, then to result in a more durable one, the type of fiber plays an essential
role for defining the structural purpose of FRC. In FRCs, fibers can be selected from a variety of synthetic
organic materials such as polypropylene or carbon, synthetic inorganic materials such as glass or steel,
natural organic materials such as cellulose or sisal to inorganic asbestos. Based on the concrete application,
optimal type of fiber can be determined and directed to its properties such as diameter, specific gravity,
Young’s modulus, tensile strength, and other mechanical properties.
Polymer fibers generally improve the impact strength and toughness of concrete since they have a low
modulus of elasticity. Similarly, natural fibers, like fruit or coir fibers, exhibit properties as polypropylene
fibers (Idicula, et al., 2006). Besides, organic fibers minimize the potentials of early age cracking and are
less sensitive to corrosion unlike steel fibers. Yet, synthetic fibers like polypropylene can be manufactured
in various shapes depending on the required structural service. Therefore, through this work, from the
category of synthetic polymeric fibers, Polypropylene has been utilized due to its high toughness and tensile
strength.
A considerable amount of research has been conducted to assess the Polypropylene Fiber Reinforced
Concrete (PFRC) properties at volume percentage varying from 0.1% - 5.0%. However, PFRC properties
are greatly controlled by fiber’s size, concentration, and properties while its effectiveness depends on the
bond between the fiber and matrix. Though polypropylene fiber is generally known for its low elastic
modulus and poor physicochemical bonding with cement paste, the load carrying capacity of a structure
under flexural loading may be significantly increased (Brown et al., 2001). The following sections describe
general material properties of polypropylene and concrete fiber prerequisites such as size, volume content,
and standard guide recommendations.
8
2.2 Polypropylene Fiber Reinforced Concrete (PFRC)
2.2.1 Polypropylene Fiber As a thermoplastic material, polypropylene is particularly stiff and changes its failure mechanism
to brittle at low temperatures. Polypropylene is a type of Polyolefin (Polyalkane) that exhibits a high melting
point and can withstand service temperatures above 105˚C (Maier and Calafut, 1998). As a thermoplastic,
polypropylene can be widely modified by softening and extrusion through to the required cross section
shape and size. This also contributes to its interlocking with the cement medium in concrete and steadily
increasing market share growth rate. Moreover, Polypropylene has the highest shear bond strength between
the cement matrix when compared to other synthetic fibers such as Polyacrylic, Polyester, Polyamide
(Nylon) and Polyaramid (Kevlar).
Polypropylene fibers are formed through melt spinning processing where molten polypropylene
chips are forced through a spinneret. The molten polymer develops as a continuous strand of fiber that is
cooled through water quenching or by air cooling and spooled for cutting and storage. The cross-section
of the fiber and fiber orientation is aligned by drawing and heating the fibers to a temperature close to the
polypropylene melting point, approximately 165 ˚C, before being stretched. Fibers are typically produced
in monofilament or multifilament arrangements. Monofilament fibers are produced though a single
extruded filament from melt spinning and cooled by water quenching. Through cylindrical monofilaments,
fibrillated polypropylene fibers can be produced by expansion of a polymer film which is separated into
strips and slit to expand into an open network of fibers. They are categorized by their translucent
appearance, negligible absorption capacity and high tensile strength. Multifilament fibers are composed of
a single continuous bundle of monofilaments and are categorized by their flexibility and hydrophobic
nature.
Polypropylene fiber surpasses other fiber materials due to its low density, manufacturing, and
recyclability cost. Polypropylene fibers provide concrete with improved durability and high resistance to
plastic shrinkage since they are more uniformly dispersed in the concrete matrix than traditional
reinforcement methods. Moreover, macro fibers promote concrete’s fracture toughness by demonstrating
greater post-cracking resistance than plain concrete and when compared to micro fibers (Beaudoin, 1990).
Unlike steel fibers, polypropylene fibers are environmental stable due to their non-corrosive nature and are
easier to place and finish in concrete.
Polypropylene shows a moderate to no increase in strength; however, it provides an extensive
increase in ductility, decrease in plastic shrinkage and resistance to impact (Banthia et al., 1987; Mindess
and Vondran, 1988; Barragan et al., 2012). According to ASTM C1116, Polypropylene (Type III
Synesthetic Fiber Reinforced Concrete) is known to be durable and chemically stable within concrete
(ASTM C1116, 2015). The fibers come in macro and micro sizes per fiber denier and length that is
discussed in depth through (ASTM D7508, 2015). Polypropylene fibers are the most used synthetic fibers
in reinforcing concrete for their flexibility in sizes and shapes.
For the mechanical properties of PFRC, polypropylene fibers do not contribute much to the
improvement of the composite tensile strength however it significantly improves the flexure strength,
toughness and ductility. The primary use of fibers in concrete is to improve concrete’s tensile response post
cracking and to control crack propagation (Shah and Rangan, 1971). Like most fibers when mixed with
concrete, polypropylene fiber length, shape, aspect ratio and more importantly volume content affect both
the microstructure of PFRC and its mechanical response to applied stress (Shah and Rangan, 1971).

9
2.2.2 PFRC Properties 2.2.2.1 Fiber Volume fraction
Any addition of fibers into a plain concrete mixture affects its properties in both fresh mixture and
hardened composite. The binder to fiber volume fraction and fiber aspect ratio affect the workability of
fresh mixture FRC. Studies show that increase in fiber content decreases the workability of the composite
due to high specific surface area of fibers (Zhang and Li, 2013). Hence, the smaller the fibers, the lower the
workability. A fiber content above 1% requires a change in the concrete binder content to maintain adequate
workability. This affects fiber dispersion which can lead to unfavourable effects in the performance of FRC
and therefore preventing the competence of the fibers in the matrix (Mehta and Monteiro, 2006).
A volume content between 0.1-0.5% of fibers is added to concrete mainly to reduce early age shrinkage
cracking when concrete hardens (Banthia and Gupta, 2006). These fractions of fiber are added to large
surface exposed concrete structures that commonly have a high tendency to shrinkage cracking. As the
percentage of fibers added increases, the relative toughness and composite strength correspondingly
increase when compared to plain concrete (Mehta and Monteiro, 2006). Like toughness, polypropylene
fiber reinforcement showed that the fibers decrease the overall composite crack sensitivity even in poor
curing conditions (Yew et al., 2015).
Usually, low volume fraction of polypropylene fibers (<0.3%) are used for overlays, pavements,
slabs, flooring, crash barricades and reservoirs (Zheng and Feldman, 1995). These fibers are advantageous
in being environmentally stable as they are chemically inert, hydrophobic, passive when encountered by
water or high chloride environments, and are non-reactive with the concrete alkaline medium (Deng and
Li, 2007).
2.2.2.2 Fiber Size Fibers prevent bundling and coagulation from occurring during fresh concrete mixing. Fibers added
to concrete are categorized in two types: Macro or Micro fibers. Macro fibers (length at least 20 mm)
promote crack bridging and offer structural support to hardened concrete matrix. On the other hand, micro
fibers (length up to 15 mm) help improve concrete’s response to early crack development arising from
drying and plastic shrinkage. Microfibers have a larger aspect ratio and exhibit low dispersion due to
intermolecular Van der Waal interactions. Although these attractive forces are considered weak when
compared to ionic, metallic, or covalent bonds, micro fibers show lower dispersion and agglomerate during
concrete mixing when compared to macro fibers. Thus, superplasticisers are used to promote a consistent
concrete mixture. Moreover, fiber separation and mixing techniques are recommended by ACI 544 to
ensure homogeneous distribution of fibers throughout the mixing process (ACI Committee 544 and
American Concrete Institute, 2008). Short fibers have a high aspect ratio promoting crack bridging
capabilities in concrete, which is a great advantage for strengthening at a small crack resolution.
2.2.3 Application of Polypropylene Fiber in Concrete This section reports various researches that assess the performance of FRC integrated
polypropylene fiber in the composite. The effect of polypropylene fibers on shrinkage and cracking of
concretes, evaluated by (Aly et al., 2008), showed that increasing dosages of polypropylene fibers with
different volume fractions ranging from 0.05%-0.5% resulted in small but consistent increases of the overall
total shrinkage strain of concrete. Even though, the increase in shrinkage are considerable in specimens
without any curing (exposed only 1-day), the differences are not notable in 7-days moist curing samples.
Incorporating 15% and 30% fly ash into PFRC specimen also reduced drying shrinkage of the mix,
regardless separately or together (Karahan and Atiş, 2011).
Freeze-thaw resistance of polypropylene fiber concrete, as a factor defining the durability of PFRC
was studied by (Karahan and Atiş, 2011; Zhang and Li, 2013). Both studies indicated that freeze-thaw
10
resistance of PFRC containing silica fume and fly-ash slightly increased in comparison to plain concrete.
Investigation on fire resistance of polypropylene and steel fibers in High Strength Concrete (HSC),
conducted by (Kodur et al., 2003), showed an improvement in the ductility of HSC samples and also
reduction in spalling; while promoting the composite fire resistance.
Pullout behaviour of 50 × 1.25 × 0.2 mm polypropylene fibers from cementitious matrix was
studied by (Singh et al., 2004). In their work, it was concluded that fiber abrasion effect becomes dominant
by increasing in its embedded length which eventually causes an increase in pullout load in the fractional
sliding zone of the pullout. Once mechanical indentation of the fiber surface is applied, the authors stated
that the bond strength between polypropylene fibers and cement matrix increased by a factor of three with
optimum level of dent modification.
Polypropylene fiber reinforced silica fume concrete was also studied by (Toutanji et al., 1998) to
measure its chloride permeability and impact resistance. Using different length and volume fraction of the
fibrillated polypropylene fibers, it was deduced that incorporating polypropylene fiber in the matrix led to
an increase in the permeability of concrete samples containing no silica fume. Also, the permeability of
plain and silica fume reduced in this study when fiber length decreased from 19 to 12.5 mm, with an
equivalent volume fraction. Adding polypropylene fibers into silica fume concrete improved the impact
resistance.
Using aggregate fibers like polypropylene, of moderate to low strength and elastic modulus, can be
valuable in conserving the integrity of concrete. A lower modulus of aggregates allows for compressibility
when encountered with volumetric change due to swelling or thermal stresses. Therefore, aggregate
compressibility reduces stress concentrations within the concrete unlike rigid aggregates that promote crack
development (Neville and Brooks, 2010).
In recent years, several researchers conducted experimental studies to examine the effect of various
fibers on dynamic mechanical properties of concrete elements. However, to the author’s knowledge, only
limited studies have been completed on investigating the dynamic modulus of elasticity of polypropylene
fibers in the concrete elements. Finding the true material properties, especially using polypropylene fibers,
is a challenging task as there are limitations arising from prerequisite conditions and dimensions for testing.
However, using NDT methods on concrete increase the confidence levels of results. Therefore, this study
is mainly focused on testing the dynamic elastic properties of PFRC by means of a reliable and repeatable
NDT method discussed in Section 2.3.
2.3 Significance of Non-destructive Testing (NDT)
Nowadays, civil engineering applications call for the ability to predict and monitor existing structural
properties and their durability using non-invasive testing techniques. Direct determination of concrete
properties requires loading representative or core samples to failure. This may delay concrete evaluation of
existing structures. Hence, using a variety of standardized Non-Destructive Testing (NDT) methods can be
applied to any existing concrete structure being reliable, comprehensive, and cost effective. NDT implies
that testing is carried out without damaging or altering the structure being tested. Effective NDTs should
integrate flexible testing, according to the location and size of structures.
The advantages of NDTs of direct core testing are summarized as follows: 1) Reduction in labor
consumption 2) Reduction in time for test preparation 3) Examining concrete structures where direct testing
is not applicable 4) Minimizing structural impact for testing 5) Cost effective method for testing existing
structures. However, finding true material properties using NDTs is challenging as there are limitations
arising from the prerequisite conditions and dimensions for testing. Hence, NDT methods are frequently
used concurrently with sample direct testing to obtain higher confidence intervals.

11
Application of NDTs in concrete is focused on quality control of pre-cast structures, eliminating
uncertainties of apparent noncomplying material specification, as summarized in Table 2-1. For monitoring
the strength development of structures from initial casting conditions, NDTs provide the opportunity to
locate cracks or embedded reinforcement. Since concrete’s response to quasi-static and dynamic loading is
nonlinear, multiple factors determine its stress-strain response predominantly focusing on the
microstructure of concrete and materials embedded within it. Testing concrete mechanical properties using
NDTs is divided into two types - The first type involves NDTs that are used for estimating strength
properties, represented by surface hardness and results of penetration tests. The second type applies stress
wave propagation methods that utilize sonic vibrations and pulse velocities to determine mechanical
properties of concrete.
Table 2-1: Typical NDT ASTM Standards used for Construction and Cementitious Materials
ASTM Standards Standard Test Method for
C215 Fundamental Transverse, Longitudinal, and Torsional Resonant
Frequencies of Concrete Specimens
C597 Pulse Velocity through Concrete
C803 Penetration Resistance of Hardened Concrete
C805 Rebound Number of Hardened Concrete
C900 Pullout Strength of Hardened Concrete
C1074 Estimating Concrete Strength by the Maturity Method
C1383 Measuring the P-Wave and the Thickness of Concrete Plates using the
Impact Echo Method
C1740 Evaluating the Condition of Concrete Plates using the Impulse-
Response Method
NDT explores material and mechanical properties without affecting the serviceability of the part or
system (Workman & Moore, 2012). The motive behind concrete NDT is driven by an economic advantage
and safe construction optimization, as well as overall aid in structure maintenance. Factors, such as
acquisition resolution, signal to noise ratio and information about the tested structure, are required for
having an optimal, reliable, sensitive, and assessable NDT method (McCann & Forde, 2001). For carrying
out a successful NDT, it is essential to understand the physical nature and dimensional discontinuities
within a property. Additionally, understanding the fundamental process and limitations are critical for
choosing an economic, environmental, and reliable NDT method (Shull, 2002). The following section
outlines the Resonant Frequency Testing (RFT), as the chosen NDT method, applied in determining the
dynamic elastic properties of concrete using a linear stress wave propagation.
2.4 Resonant Frequency Testing
The resonant frequency of vibration is an important parameter in defining the dynamic elastic
response of concrete. The free vibration of a structure at a particular frequency of oscillation is the natural
frequency of the system. The natural or resonant frequency of material vibration is an intrinsic property for
any material with elastic properties and mass. Concrete’s natural frequency is proportionally related to its
12
modulus of elasticity. Measuring the resonant frequency of concrete NDT methods can be used for
classification of strength and durability. These methods use empirical equations to predict the dynamic
elastic properties of concrete. The dynamic elastic properties of concrete can be determined numerically
using the static elastic modulus, compressive strength, and density.
2.4.1 Modulus of Elasticity of Concrete For designing fiber reinforced concrete structures, the Young’s modulus of elasticity (E) provides
vital information for assessing structural design and durability. The elastic modulus of concrete is a
fundamental factor for evaluating structural deformation. It is important for defining the stress to strain
relationship in design of structural members subjected to compressive, flexure and tensile loads (ACI
Committee 318 and American Concrete Institute, 2014). The modulus of elasticity is expressed as the ratio
of axial stress to strain for a material subject to uniaxial loading (Neville & Brooks, 1987).
Since concrete is a composite made primarily of aggregates and cement, both elements contribute
to most of the elastic modulus of concrete. Aggregates usually provide a large percentage of the modulus
of elasticity of concrete. Thus, concrete’s stress/strain curve is positioned between the aggregate and cement
stress/strain curve. Since concrete modulus of elasticity is lower, when compared to that of its aggregate
modulus, the actual stress at the interface of each aggregate within the concrete is larger compared to that
of the applied nominal compressive stress (Neville and Brooks, 2010). There are no standard guidelines for
testing the aggregate modulus of elasticity; however, the aggregate size, type, shape and aggregate-cement
bond dominates concrete’s elastic modulus. The difference between the aggregate and hydrated cement
paste modulus of elasticity adversely affects microcrack development and propagation between the cement-
aggregate interface hence, the incompatibility is advantageous to the global concrete properties (Neville
and Brooks, 2010).
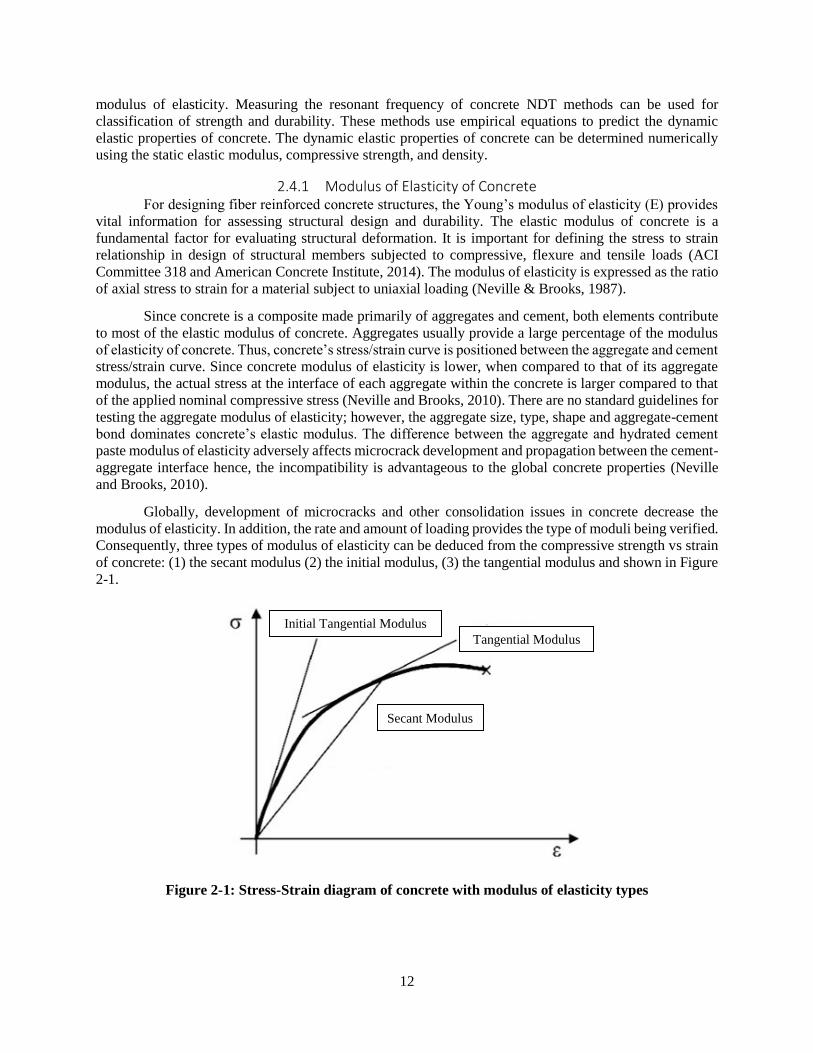
Globally, development of microcracks and other consolidation issues in concrete decrease the
modulus of elasticity. In addition, the rate and amount of loading provides the type of moduli being verified.
Consequently, three types of modulus of elasticity can be deduced from the compressive strength vs strain
of concrete: (1) the secant modulus (2) the initial modulus, (3) the tangential modulus and shown in Figure
2-1.
Figure 2-1: Stress-Strain diagram of concrete with modulus of elasticity types
Initial Tangential Modulus
Tangential Modulus
Secant Modulus

13
The secant modulus of elasticity is obtained from the gradient between any two points in the stress-
strain diagram. Usually, this modulus is experimentally provided by quasi-static loading of concrete
samples to stresses ranging 15-50% of the ultimate strength for failure. Similar to secant modulus, the chord
modulus (Static) line is drawn starting from 50 με to 40% of the ultimate compressive strength, unlike the
secant modulus which starts from the origin (Neville and Brooks, 2010). However, in a compression testing
machine, a small stress or strain is applied to position the concrete specimen in a steady state. The static
modulus of elasticity (Es) is inherently applied to the linear portion of the loading cycle of concrete. The
common stress-strain response of concrete can be described as linear when lower than 40% in stress and
1000 με in strain (Lamond and Pielert, 2006).
The initial tangential modulus of elasticity (Dynamic) is defined by the tangent line inclination
from the origin of the stress-strain diagram. This modulus can be used to define concrete deflection exposed
to low stress levels. Hence, the modulus can be defined as the sonic modulus or dynamic modulus of
elasticity. The tangent modulus of elasticity can be provided at any given stress. This line can be used to
relate different loading and unloading stages for in-service structures. If small changes of loading are
considered, a tangential modulus of elasticity can be used at any point on the stress/strain curve (Neville
and Brooks, 2010).
Usually, for testing modulus of elasticity concrete, the secant modulus and initial tangential
modulus are used to define the deformation nature of concrete to express the 1) Static Modulus of Elasticity
(Es) and 2) Dynamic Modulus of Elasticity (Ed) respectively. These moduli are differentiated by the strain-
rate of the applied load (Bischoff and Perry, 1991). This difference is related to the rate at which load is
applied and is primarily dependent on the strength and w/c ratio of the concrete (Sharma and Gupta, 1960).
The inconsistency between the moduli in concrete is recognized by 1) nonlinearities in the moduli between
unconfined compression testing with axial loading (static) and unconstrained impact excitation by
determining the compression wave velocity (dynamic) 2) difficulty in measuring the static moduli at a
similar strain range as used in dynamic testing 3) confusion about which type of moduli is measured during
dynamic testing (Whitehurst, 1967). In addition, factors such as cyclic fatigue, creep and micro-cracking
during axial loading differentiate the static modulus from the dynamic modulus of elasticity (Neville and
Brooks, 2010). Accordingly, resonant frequency testing, used for calculating the dynamic modulus of
elasticity, subjects concrete to low strain loads at a higher strain rate therefore, the testing method is
considered as non-destructive.
2.4.2 Principles of Resonant Frequency Testing Determining the modulus of elasticity from wave propagations was first reported by Rayleigh in
1877 (Rayleigh and Lindsay, 1945). Using the velocity of sound moving through a material with a known
resonant frequency, Rayleigh developed a mathematical model to determine the dynamic modulus of
elasticity from the wave velocity passing a specimen and the specimen’s resonant frequency. This model
was modified to provide an upper bound estimation of the natural resonant frequency (Rayleigh and
Lindsay, 1945). According to this model, the total energy of the closed system remains unchanged.
Therefore, it is based on the kinetic and potential energies of a closed system to be equal. Equations
developed by Rayleigh were determined as perfectly elastic, homogenous, and isotropic systems such that
the material composition and density are uniform. Such a system is known as a conservative system.
As a composite material, concrete is heterogenous and appears to exhibit some inelastic strain prior
to failure under compression. Typically, the stain at fracture is 2 × 10⁻⁹. Therefore, in practice, concrete
designers treat concrete as an inelastic material and do not recommend it for structures that are subjected to
high impact loads unless the concrete is reinforced with steel bars or fiber reinforced polymer bars (Mehta
and Monteiro, 2006). The property for a material that defines the decrease in amplitude of free vibration is
known as damping or wave attenuation. Although damping for any given vibration occurs, it can be
negligible when compared to the total system energy. However, damping in concrete occurs due to
14
scattering and absorption of compression waves from aggregate particles and the presence of cracks and
pores in concrete. Hence, a significant increase in damping can indicate the presence of pores, defects, or
weakness in the interfacial transition zone between the aggregates and cement.
Later, during the 1940s, Powers first established measuring the natural resonant frequency by
matching the tone of a hammer struck concrete specimen to a musical tone of a frequency calibrated
orchestra bell (Powers, 1938). Although there is an apparent error when using this method, it gave a start
to developing methods that are more refined. Later, the resonant frequency method was distinguished using
electronic circuitry by Hornibrook for measuring the freeze-thaw resistance of concrete (Hornibrook, 1939).
Hornibrook’s work is considered as the groundwork for optimization of measuring the resonant frequency
by exciting concrete prisms to their fundamental resonant frequency (Thomson, 1940; Stanton, 1944).
Measuring the resonant frequency of concrete is found using a constant vibration and low amplitude or an
impulse vibration with a low strain. Thus, these measurement practices are distinguished as 1) Forced
resonance method (FRM) and the 2) Impact resonance method (IRM) which are covered in Section 2.4.4.
Stress wave propagation methods for concrete rely on exciting a dense medium for a short period
to respond in linear and angular accelerations. (Mehta & Monteiro, 2006). Stress waves propagate in a solid,
through compression waves and shear waves, and on the solid surface through particle motion. Any external
transient stress pulse on concrete travels through the structure through dilatational, distortional, and surface
waves known as Raleigh waves. Compression waves are longitudinal modes of wave vibration where wave
particles pulsate back and forth parallel in the direction of wave propagation. As the particles travel, the
compressive volume change causes the particle to rapidly propagate; hence terming them as Primary waves
(P waves). On the other hand, shear wave particles move transverse (or vertical) to the direction of wave
propagation. Unlike P waves, shear waves create no volume change during wave propagation and are slower
than P waves, thus termed as Secondary Waves (S waves). P waves and S waves propagate through a
structure and are reflected by internal defects such as voids or cracks and through the external boundary of
the structure. These waves can be used to provide the elastic properties of a concrete medium through wave
velocity and resonant frequency.
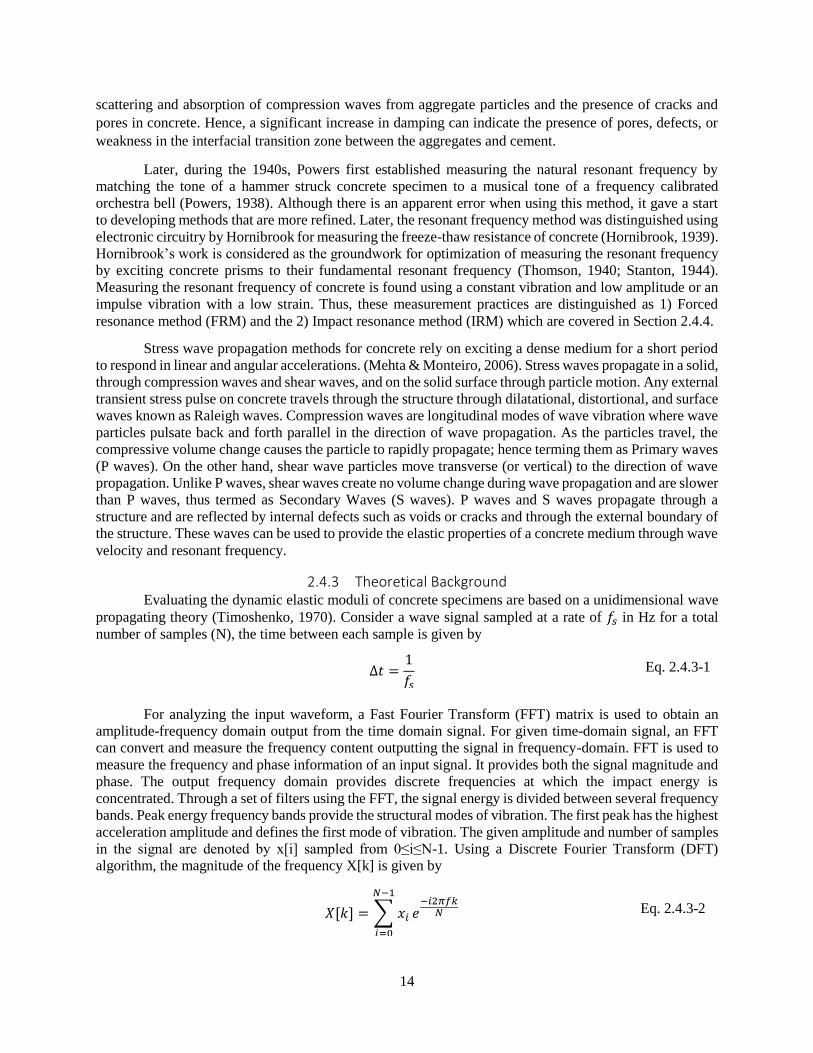
2.4.3 Theoretical Background Evaluating the dynamic elastic moduli of concrete specimens are based on a unidimensional wave
propagating theory (Timoshenko, 1970). Consider a wave signal sampled at a rate of 𝑓𝑠 in Hz for a total
number of samples (N), the time between each sample is given by
∆𝑡 =1
𝑓𝑠 Eq. 2.4.3-1
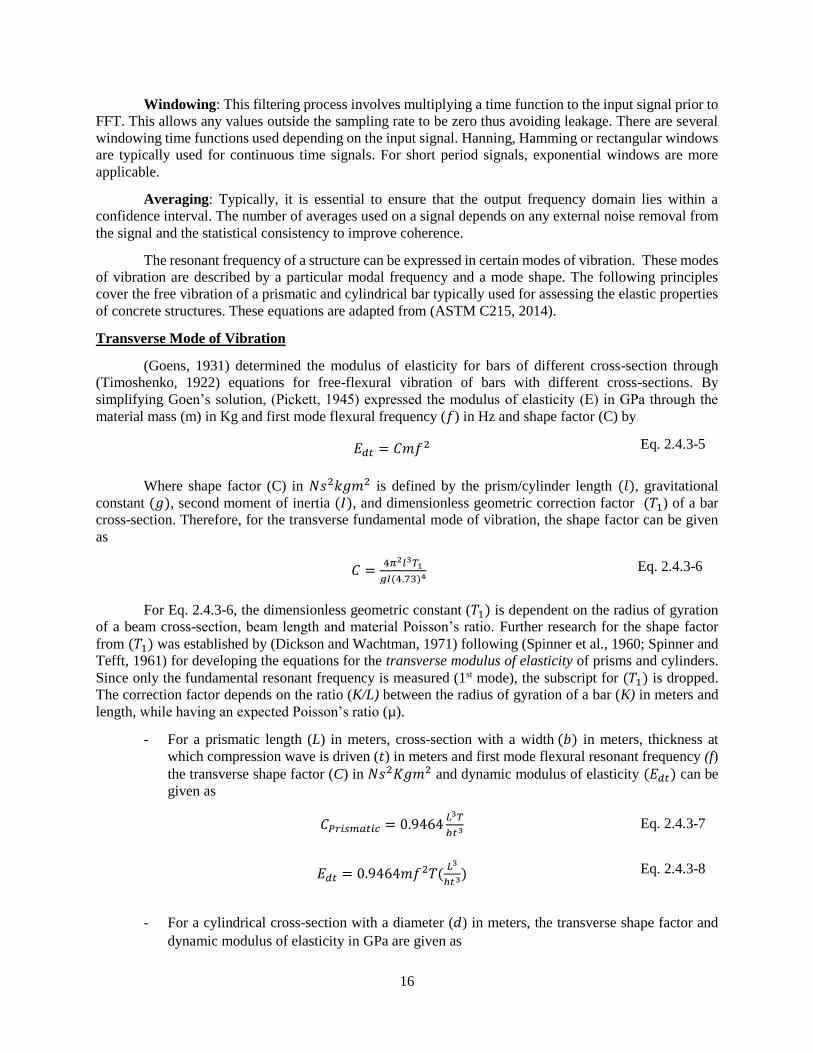
For analyzing the input waveform, a Fast Fourier Transform (FFT) matrix is used to obtain an
amplitude-frequency domain output from the time domain signal. For given time-domain signal, an FFT
can convert and measure the frequency content outputting the signal in frequency-domain. FFT is used to
measure the frequency and phase information of an input signal. It provides both the signal magnitude and
phase. The output frequency domain provides discrete frequencies at which the impact energy is
concentrated. Through a set of filters using the FFT, the signal energy is divided between several frequency
bands. Peak energy frequency bands provide the structural modes of vibration. The first peak has the highest
acceleration amplitude and defines the first mode of vibration. The given amplitude and number of samples
in the signal are denoted by x[i] sampled from 0≤i≤N-1. Using a Discrete Fourier Transform (DFT)
algorithm, the magnitude of the frequency X[k] is given by
𝑋[𝑘] = ∑ 𝑥𝑖
𝑁−1
𝑖=0
𝑒−𝑖2𝜋𝑓𝑘
𝑁 Eq. 2.4.3-2

15
for 0 ≤ k ≤ N – 1. For the output frequency domain, the frequency (∆𝑓) resolution is given by
∆𝑓 =1
𝑁∆𝑡=
𝑓𝑠
𝑁 Eq. 2.4.3-3
To discretize the required analog signal, the collected signal using the accelerometer is converted
from time-domain to frequency-domain using a defined sampling rate (𝑓𝑠) and number (N); giving the FFT.
Digital filter and FFT techniques are used to provide bandwidth and vibrational decay measurements from
measured modal resonant frequencies. A comparison between digital filter and FFT methods shows that
FFT techniques provide a higher resolution for determining the bandwidth and have no limitation regarding
low damping. However, as damping increases, the transfer rate of the spectra is limited (Gade and
Herlufsen, 1994). The FFT function is a reliable tool for determining and analyzing signals collected via
data acquisition (DAQ) devices.
For a given single spectrum signal input, the FFT output is a two-sided spectrum in complex form
having real positive and imaginary negative numeric sequences. The complex form should be scaled and
converted to polar form to obtain the signal magnitude and phase. In actual frequency analysis, testing
instruments display only the positive half of the frequency spectrum since the input signal spectrum is
symmetrical around the divide between the frequency spectrums. Therefore, the negative frequency
information is redundant. For a two-sided frequency spectrum, the energy is divided equally between the
positive and negative spectrums. Therefore, for having a single frequency spectrum, disregard half of the
output spectrum and multiply every sample magnitude point by 2 except the initial magnitude where the
imaginary factor equals 0.
The Nyquist frequency (𝑓𝑛) is translated as half the Sampling Frequency (𝑓𝑠). Approximately
double the sampling rate is required for the FFT in consequence to the Nyquist theorem. It outlines that for
the highest frequency of a continuous time signal, the highest frequency in a discrete-time sequence is
almost half that of the signal. Accordingly, a signal should be sampled twice as fast to capture resonance.
Therefore, the periodicity of the discrete transform is between 0 and 𝑓𝑠.
Frequency resolution (Δ𝑓), also known as digital step, should be compensated with the number of
discrete values (N) compiled. Consequently, the following equations give the frequency resolution and
Nyquist maximum obtainable frequency. The signal length can be maximized until 𝑓𝑛 reaches the highest
required frequency for a given number of samples.
𝑓𝑛 =1
2∆𝑡=
1
2𝑓𝑠 Eq. 2.4.3-4
The larger the sampling frequency, the better the frequency resolution for a given number of
samples. It is important to have a higher` sampling rate for determining the true resonant frequency of a
structure. Oversampling is noted as having a sampling rate almost double the Nyquist frequency and is
usually preferred since signals are not perfectly filtered and often contain higher frequency components.
For obtaining the Nyquist frequency, the output frequency domain is divided by the sampling frequency of
the system. This will give an output frequency spectrum from zero to one, where one is the Nyquist ratio.
Some important features are used to limit the length of the time history. This ensures to filter out
discretization approximations that may lead to errors. A phenomenon known as aliasing occurs if the
Nyquist theorem condition is not met. Aliasing occurs from under-sampling below 𝑓𝑛 and is considered a
false lower frequency component. To prevent aliasing inside the spectrum of interest, the input signal is
monitored to confirm that the resonant frequency is excited based on the desired frequency resolution and
sampling rate. Another problem, known as leakage, can arise if the discrete time of the signal does not
coincide with the assumed periodicity. Spectral lines close to the true frequency are introduced with signal
energy leakage. This can be corrected by the following:
16
Windowing: This filtering process involves multiplying a time function to the input signal prior to
FFT. This allows any values outside the sampling rate to be zero thus avoiding leakage. There are several
windowing time functions used depending on the input signal. Hanning, Hamming or rectangular windows
are typically used for continuous time signals. For short period signals, exponential windows are more
applicable.
Averaging: Typically, it is essential to ensure that the output frequency domain lies within a
confidence interval. The number of averages used on a signal depends on any external noise removal from
the signal and the statistical consistency to improve coherence.
The resonant frequency of a structure can be expressed in certain modes of vibration. These modes
of vibration are described by a particular modal frequency and a mode shape. The following principles
cover the free vibration of a prismatic and cylindrical bar typically used for assessing the elastic properties
of concrete structures. These equations are adapted from (ASTM C215, 2014).
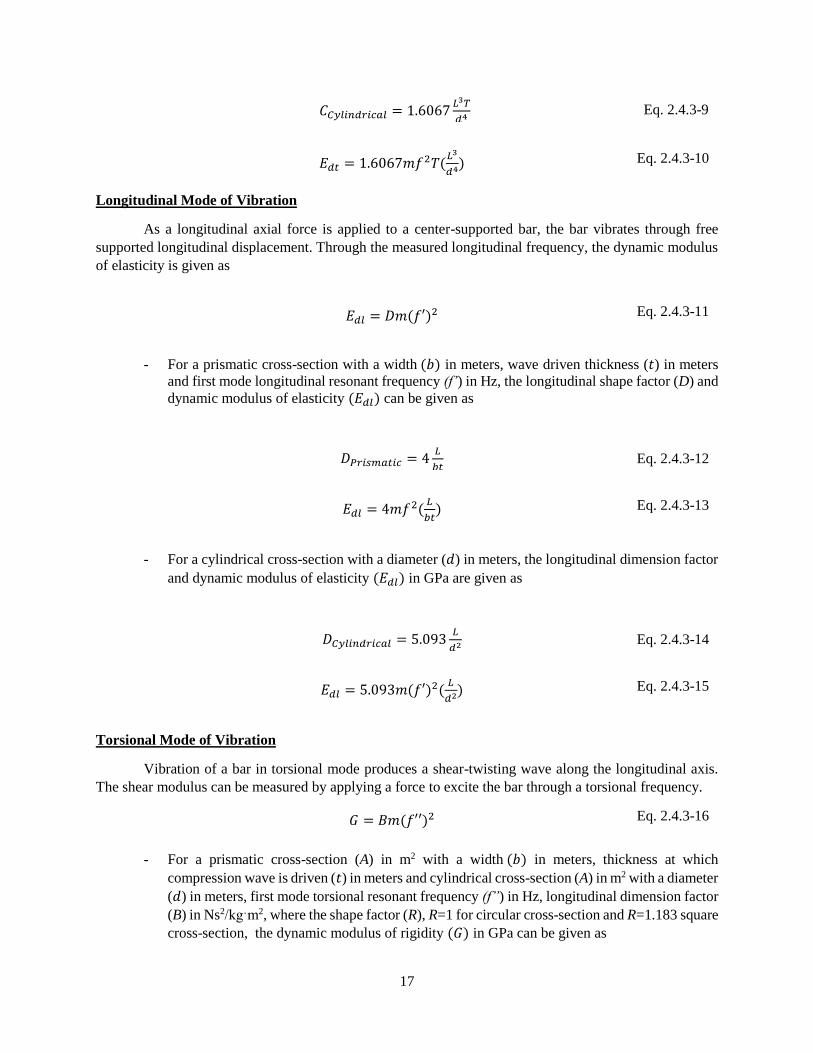
Transverse Mode of Vibration
(Goens, 1931) determined the modulus of elasticity for bars of different cross-section through
(Timoshenko, 1922) equations for free-flexural vibration of bars with different cross-sections. By
simplifying Goen’s solution, (Pickett, 1945) expressed the modulus of elasticity (E) in GPa through the
material mass (m) in Kg and first mode flexural frequency (𝑓) in Hz and shape factor (C) by
𝐸𝑑𝑡 = 𝐶𝑚𝑓2 Eq. 2.4.3-5
Where shape factor (C) in 𝑁𝑠2𝑘𝑔𝑚2 is defined by the prism/cylinder length (𝑙), gravitational
constant (𝑔), second moment of inertia (𝐼), and dimensionless geometric correction factor (𝑇1) of a bar
cross-section. Therefore, for the transverse fundamental mode of vibration, the shape factor can be given
as
𝐶 =4𝜋2𝑙3𝑇1
𝑔𝐼(4.73)4 Eq. 2.4.3-6
For Eq. 2.4.3-6, the dimensionless geometric constant (𝑇1) is dependent on the radius of gyration
of a beam cross-section, beam length and material Poisson’s ratio. Further research for the shape factor
from (𝑇1) was established by (Dickson and Wachtman, 1971) following (Spinner et al., 1960; Spinner and
Tefft, 1961) for developing the equations for the transverse modulus of elasticity of prisms and cylinders.
Since only the fundamental resonant frequency is measured (1st mode), the subscript for (𝑇1) is dropped.
The correction factor depends on the ratio (K/L) between the radius of gyration of a bar (K) in meters and
length, while having an expected Poisson’s ratio (µ).
- For a prismatic length (L) in meters, cross-section with a width (𝑏) in meters, thickness at
which compression wave is driven (𝑡) in meters and first mode flexural resonant frequency (f)
the transverse shape factor (C) in 𝑁𝑠2𝐾𝑔𝑚2 and dynamic modulus of elasticity (𝐸𝑑𝑡) can be
given as
𝐶𝑃𝑟𝑖𝑠𝑚𝑎𝑡𝑖𝑐 = 0.9464𝐿3𝑇
𝑏𝑡3 Eq. 2.4.3-7
- For a cylindrical cross-section with a diameter (𝑑) in meters, the transverse shape factor and
dynamic modulus of elasticity in GPa are given as
𝐸𝑑𝑡 = 0.9464𝑚𝑓2𝑇(𝐿3
𝑏𝑡3) Eq. 2.4.3-8
17
𝐶𝐶𝑦𝑙𝑖𝑛𝑑𝑟𝑖𝑐𝑎𝑙 = 1.6067𝐿3𝑇
𝑑4 Eq. 2.4.3-9
𝐸𝑑𝑡 = 1.6067𝑚𝑓2𝑇(𝐿3
𝑑4) Eq. 2.4.3-10
Longitudinal Mode of Vibration
As a longitudinal axial force is applied to a center-supported bar, the bar vibrates through free
supported longitudinal displacement. Through the measured longitudinal frequency, the dynamic modulus
of elasticity is given as
- For a prismatic cross-section with a width (𝑏) in meters, wave driven thickness (𝑡) in meters
and first mode longitudinal resonant frequency (f’) in Hz, the longitudinal shape factor (D) and
dynamic modulus of elasticity (𝐸𝑑𝑙) can be given as
𝐷𝑃𝑟𝑖𝑠𝑚𝑎𝑡𝑖𝑐 = 4𝐿
𝑏𝑡 Eq. 2.4.3-12
- For a cylindrical cross-section with a diameter (𝑑) in meters, the longitudinal dimension factor
and dynamic modulus of elasticity (𝐸𝑑𝑙) in GPa are given as
𝐷𝐶𝑦𝑙𝑖𝑛𝑑𝑟𝑖𝑐𝑎𝑙 = 5.093𝐿
𝑑2 Eq. 2.4.3-14
Torsional Mode of Vibration
Vibration of a bar in torsional mode produces a shear-twisting wave along the longitudinal axis.
The shear modulus can be measured by applying a force to excite the bar through a torsional frequency.
𝐺 = 𝐵𝑚(𝑓′′)2 Eq. 2.4.3-16
- For a prismatic cross-section (A) in m2 with a width (𝑏) in meters, thickness at which
compression wave is driven (𝑡) in meters and cylindrical cross-section (A) in m2 with a diameter
(𝑑) in meters, first mode torsional resonant frequency (f”) in Hz, longitudinal dimension factor
(B) in Ns2/kgˑm2, where the shape factor (R), R=1 for circular cross-section and R=1.183 square
cross-section, the dynamic modulus of rigidity (𝐺) in GPa can be given as
𝐸𝑑𝑙 = 𝐷𝑚(𝑓′)2 Eq. 2.4.3-11
𝐸𝑑𝑙 = 4𝑚𝑓2(𝐿
𝑏𝑡) Eq. 2.4.3-13
𝐸𝑑𝑙 = 5.093𝑚(𝑓′)2(𝐿
𝑑2) Eq. 2.4.3-15
18
𝐵 = 4𝐿𝑅
𝐴 Eq. 2.4.3-17
Poisson’s Ratio
Considering concrete as an isotropic solid, the ratio of lateral to longitudinal strain (ν) can be given
using 𝐸𝑑𝑙 and 𝐺 as follows
𝜈 = (𝐸𝑑𝑙
2𝐺) − 1 Eq. 2.4.3-19
As recommended by ASTM C215, the dynamic Poisson’s ratio (𝜈) may vary between 0.10 – 0.25
for dry and saturated specimens respectively. Since concrete is more saturated at early age, higher values
of 𝜈 are expected (ASTM C215, 2014).
Determination of the resonant frequency equations were derived from experimental analysis of
different concrete sections with different size, age, and composition. RFT can be applied to concrete given
that the test specimen is large with respect to its constituent materials for free vibration to occur (Malhotra
and Carino, 2004).
2.4.4 Resonance Frequency Testing Techniques
Methods of defining the modulus of elasticity in concrete can be divided into direct, contact or non-
contact tests. First, direct measurement of stress and strain relies on mechanical compressing of a concrete
cylinder to obtain concrete deflection until 40% of the applied compression force. The static modulus of
elasticity can be obtained via direct testing and is calculated using the equations adapted from (ASTM
C469, 2014). Contact methods are non-destructive techniques that rely on wave propagation and resonance
methods. Resonant Frequency Testing (RFT) adopted from (ASTM C215, 2014) and Impact-echo testing
(IE) are predominant methods used for damage detection or location respectively. These methods depend
on contact vibration, using a pulse vibrator or impact hammer, to measure the dynamic modulus of elasticity
via the reflected wave velocity, resonant frequency, density, and geometry of a concrete specimen.
Non-contact methods to analyze the dynamic elastic properties of concrete include sonic or laser
vibrometer techniques. When a sonic speaker or laser is applied on a concrete surface, the reflective wave
properties frequency and wave velocity can be used to determine the in-situ dynamic modulus of elasticity.
Using Ultrasonic Pulse Velocity (UPV) testing adopted from ASTM C597 is mainly focused on contact
and non-contact vibration, using a speaker or ultrasonic transducer, to obtain the velocity of the wave
passing through concrete which is related to dynamic modulus of elasticity (ASTM C597, 2016).
(Popovics, 2008) investigated and reported the difference between the dynamic and static moduli
of elasticity. The authors compared the static and dynamic moduli via ASTM C469 and ASTM C215
respectively. The results showed that the dynamic elastic modulus is always greater than the static modulus
relying on the composite nature of concrete rather than the nonlinear behavior to applied strain rates. This
was confirmed by preparing two phase concrete samples indicating the influence of the composite.
Moreover, the author highlighted that the relation between static and dynamic moduli is affected mostly by
the dynamic modulus. In addition, the author indicated that the measured elastic moduli using UPV has
shown to overestimate the modulus. Similarly, (Lee et al., 2015) determined the dynamic elastic moduli of
concrete cylinders using UPV and RFT. The authors determined that the coefficient of variation (CV) using
𝐺 = 4𝑚(𝑓′′)2(𝐿𝑅
𝐴) Eq. 2.4.3-18
19
UPV is higher than that of RFT. In addition, the authors instigated that it is inappropriate to predict the
static elastic modulus using UPV values for having considerably large error.
This study only focuses on measuring the dynamic elastic properties using the resonant frequency
testing as the primary testing method for the dynamic modulus of elasticity. Resonant Frequency Testing
(RFT) methods for concrete are measured through two alternate procedures:
• Resonant frequency by constant vibration known as the Forced resonance method
• Resonant frequency through impulse vibration known as the Impact resonance method
2.4.4.1 Forced Resonance Method (FRM)
All early investigations of measuring the resonant frequency of concrete used a constant contact
vibration known as the forced resonant frequency method. It consists of two phases – the first part is
vibration induction using sinusoidal excitation and the second part senses that vibration. This method states
that the resonant frequency is determined when vibrations, induced in concrete specimens, result in a
maximum response amplitude. Concrete prisms and cylinders are tested according to ASTM C215 Section
8 for forced resonance testing (ASTM C215, 2014).
This method implies a constant vibrational input to determine the resonant frequency of concrete.
Figure 2-2 shows the components required for forced resonance testing. Vibration is generated using an
electronic audio-frequency oscillator. Ideal mechanical vibration is adjusted by amplifying the oscillator.
The vibration is collected using a pick-up transducer located at specific areas on a concrete specimen. The
pick-up circuit consists of a piezoelectric transducer unit, an amplifier and signal indicator that converts the
mechanical vibration to electrical AC voltage output. To find the resonant frequency, the rate of vibration
is altered until its amplitude reaches its maximum and the resonant frequency is read from a variable driving
audio-oscillator. The oscillator, vibrator and pickup are compiled in a testing unit known as a Sonometer.
The driving oscillator consists of a variable frequency audio oscillator, an amplifier unit and a driving unit.
The driver should be calibrated for a resolution of ± 2%. For detecting the natural frequency, the driving
vibration frequency is increased until the maximum potential deflection is shown on the signal indicator
reading the natural resonant frequency. The fundamental modes of vibration can be observed from the
cathode-ray oscilloscope (Malhotra and Carino, 2004).
For a hardware check, the pickup is placed at both ends of the vibrating specimen and at the support
nodes. Support and position of transducers for forced resonance are given in Section 8 of ASTM C215 and
Figure 2-3 in this study (ASTM C215, 2014). At the vibrating end, the oscilloscope reaches a maximum
amplitude shown while at the support nodes, a horizontal line is displayed on the oscilloscope indicating
no vibration. Several authors have widely used it, however, since the oscillator has large surface area
compared to general concrete lab samples, it is difficult to vibrate curved, thin or irregular specimens in
their fundamental modes.

20
Figure 2-2: Forced Resonance Method
2.4.4.2 Impact Resonance Method (IRM)
An impact resonant frequency approach proposed by (Gaidis and Rosenburg, 1986) relies on
impacting the test specimen with a ball-tip hammer rather than using a forced vibration to induce a stress
wave. The stress wave is picked up by an accelerometer set at different locations on the test specimen that
define the transverse, longitudinal and torsional modes of testing. Accelerometer data is collected in time
domain and then converted to a defined frequency domain using the FFT function to determine the natural
resonant frequency for a given vibration. The highest peak in an amplitude-frequency graph defines the
resonant frequency of the tested concrete. This method, along with the standards developed, only applied
to laboratory sized specimens like cylinders and beams. Currently, a standardized method for larger sized
or irregular specimens is unavailable. The representative impact resonant frequency data acquisition setup
is shown in Figure 2-3.
Specimen support is vital for assuring that the measured frequency is the natural resonant
frequency. For transverse vibration, the support nodes are located at a distance equal to 0.224 times the
length of the specimen (L) away from the ends of the specimen. Vibrations in transverse mode are zero at
the two nodal points and maximum at the ends of the specimen. For the longitudinal and torsional modes,
the vibration node is zero at the center and maximum at the ends. The support should enable the specimen
to vibrate freely by aligning the support with the zero vibration nodes of the specimen. Balance is
maintained during testing by measuring the length of each specimen prior to testing and adjust the supports
correspondingly.
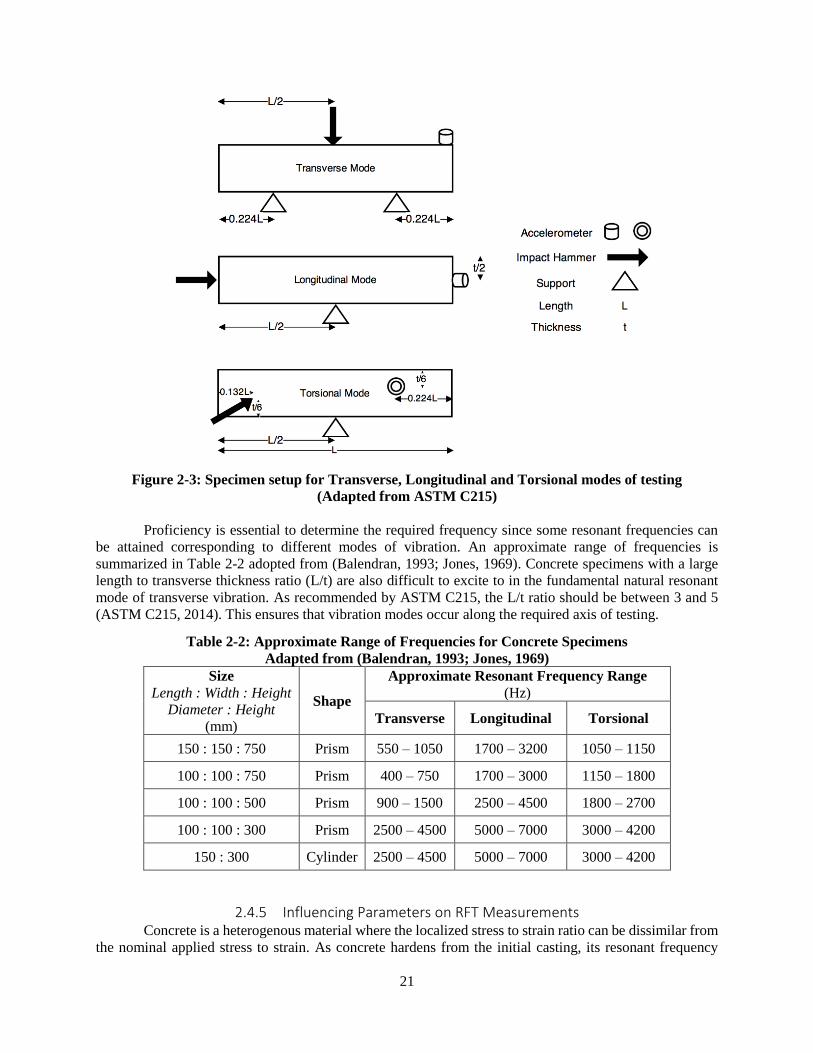
21
Figure 2-3: Specimen setup for Transverse, Longitudinal and Torsional modes of testing
(Adapted from ASTM C215)
Proficiency is essential to determine the required frequency since some resonant frequencies can
be attained corresponding to different modes of vibration. An approximate range of frequencies is
summarized in Table 2-2 adopted from (Balendran, 1993; Jones, 1969). Concrete specimens with a large
length to transverse thickness ratio (L/t) are also difficult to excite to in the fundamental natural resonant
mode of transverse vibration. As recommended by ASTM C215, the L/t ratio should be between 3 and 5
(ASTM C215, 2014). This ensures that vibration modes occur along the required axis of testing.
Table 2-2: Approximate Range of Frequencies for Concrete Specimens
Adapted from (Balendran, 1993; Jones, 1969)
Size
Length : Width : Height
Diameter : Height
(mm)
Shape
Approximate Resonant Frequency Range
(Hz)
Transverse Longitudinal Torsional
150 : 150 : 750 Prism 550 – 1050 1700 – 3200 1050 – 1150
100 : 100 : 750 Prism 400 – 750 1700 – 3000 1150 – 1800
100 : 100 : 500 Prism 900 – 1500 2500 – 4500 1800 – 2700
100 : 100 : 300 Prism 2500 – 4500 5000 – 7000 3000 – 4200
150 : 300 Cylinder 2500 – 4500 5000 – 7000 3000 – 4200
2.4.5 Influencing Parameters on RFT Measurements Concrete is a heterogenous material where the localized stress to strain ratio can be dissimilar from
the nominal applied stress to strain. As concrete hardens from the initial casting, its resonant frequency
22
increases at a high rate during the initial 3 days of curing and increases at a low rate during the remaining
time of curing. The high rate increase is caused by a decrease in porosity as the reaction products, Calcium-
Silicate-Hydrate (C-S-H) and Calcium Hydroxide (CaOH2), of concrete enlarge when hardened.
Like the compressive strength of concrete, the modulus of elasticity increases as hydration is
continued. Both strength and elastic properties of concrete are affected by a range of factors including
aggregate properties, curing conditions, temperature, mixture proportions, water to cement ratio (w/c), and
the presence of reinforcement and internal microcracks within the composite (Bungey et al., 2006). Other
important factors include concrete age and coarse aggregate type (Malhotra and Carino, 2004). The
following section focuses on several influential factors pertaining to the dynamic modulus of elasticity and
fundamental frequency of concrete.
2.4.5.1 Mixture Proportions and Admixtures
One of the factors, influencing the concrete dynamic modulus of elasticity, is the basic moduli of
its ingredients and their relative proportions. Although concrete is a composite material primarily made of
aggregates and cement binder, its characteristics do not follow the rule of mixtures (Mehta and Monteiro,
2006). For example, under compressive loading both the aggregates and cement binder, when individually
tested, would fail elastically. However, concrete itself exhibits inelastic behavior prior to fracture.
Moreover, concrete strength is lower than the individual strength of its components. Such irregularities can
be explained on the basis of its microstructure predominantly defined through the interfacial transition zone
between the coarse aggregates and the cement binder (Mehta and Monteiro, 2006).
In (Jones, 1969) and reported by (Malhotra and Carino, 2004), it is evaluated that the elastic
modulus of hardened concrete increases for a given cement paste composition having the same w/c ratio,
as the total aggregate percentage increases. However, a reduction in the dynamic modulus of elasticity has
been observed once the water content and volume of entrapped air increases. Also, in an unpublished study
conducted by Canada Center for Mineral and Energy Technology (CANMET), it is stated that the values
of static and dynamic moduli were comparatively higher than concrete strength for concretes containing
high volume of low-calcium fly ashes. They believed that the higher value mostly resulted from the un-
hydrated fly ash particles behaving as fine filler in the matrix.
The advantage of having polypropylene fibrous concrete with fly ash was report by (Karahan and
Atiş, 2011). The authors used a fly ash content of 0%, 15% and 25% by mass with fiber volume fractions
of 0%, 0.05, 0.1, and 0.2% by volume. By monitoring the compressive strength, static elastic modulus,
porosity and water absorption of PFRC, the authors concluded that addition of polypropylene and fly ash
in concrete will reduce the overall composite unit weight. Moreover, polypropylene fibers reduce the
workability of concrete while the addition of fly ash improves it. The presence of polypropylene fibers and
fly ash was also found to increase the freeze-thaw resistance of PFRC having fly ash as the more dominant
enhancer.
(Chavan and Vyawahare, 2015) also experimentally attempted to compare the static and dynamic
modulus of elasticity in Self-Compacting Concrete (SCC) incorporating silica fume and fly ash. Since the
SCC has uniform consistence than normally vibrated concrete, it was observed the values of static and
dynamic modulus are strongly correlated. The average static elastic modulus was about 4 GPa lower than
the dynamic modulus. SCC however has a uniform consistency when compared to normal compact of
concrete. With better cement matrix distribution in concrete, the modulus of elasticity is consistent since
the regular amorphous microstructure is not present. Adding cement binder replacements, such as fly ash
and Silica Fume, affect the resonant frequency of PFRC. At early age curing, fly ash alters the reaction rate
of calcium silicates and calcium aluminate.

23
A previous study conducted by the author was used to investigate the influence of matrix strength
between standard cast plain concrete and defect cast plain concrete due to honeycombing from
consolidation errors (Gupta and El-Newihy, 2015). All specimens were cast for 32 MPa concrete. The
dynamic elastic properties for 150×150×550 mm plain concrete prisms and 100×200 cylinders were tested.
The results showed a substantial decrease in elasticity of honeycombed specimens when compared to
normal cast beams of the same mixture. However, the longitudinal modulus showed more consistency
throughout testing when compared to the transverse modulus. Porosity of the honeycombed structure is the
main factor affecting the elastic properties along with a slight mass difference from porosity when compared
to the reference concrete. From resonant frequency testing, wave propagation increasingly disperses with
the presence of cavities in the composite producing a lower resonant frequency; hence, the elastic moduli
decrease.
2.4.5.2 Specimen Size
The value of the dynamic modulus is affected by variation in size of concrete specimens.
According to (Obert and Duvall, 1941) study, the specimens with larger dimensions, and thus more weight,
have lower resonant frequency.(Kesler and Higuchi, 1945) perceived that longer beams resonating at lower
frequencies showed higher elastic moduli compared to proportionally smaller beams while as reported
(Jones, 1969), little change in the moduli for various samples having a frequency range 70 to 10,000 Hz.
As it is described in (Malhotra and Carino, 2004) by (Thorton and Alexander, 1987), the resonant frequency
of the fundamental flexural mode increases with the increase in thickness or decrease in length of the sample
even if other parameters are kept constant.
In a recent experimental study, conducted by (Lee et al., 2015) on investigating the effects of
cylinder size (150×300 mm and 100×200 mm) on empirical relation of static and dynamic modulus of
elasticity and compressive strength of concrete, it was concluded that the different cylinder sizes do not
have an effect on concrete moduli for normal strength concrete (≤40 MPa). However, for high strength
concrete greater than 40 MPa, they pointed out that the size of sample become critical. Therefore, special
care is required for comparison between static and dynamic moduli of high strength concrete for samples
with different dimensions. Correlation of the static and dynamic modulus of elasticity of conventional
concrete is not affected by w/c ratio and aggregate content (Zhou et al., 2015). Aggregate content and water
to cement ratio are the two dominant factors that affect static and dynamic moduli as their relationship is
mainly controlled by the aggregate in plain concrete (Zhou et al., 2015).
2.4.5.3 Curing Condition
Although the dependency of the dynamic modulus of elasticity on the moisture content has been
recognised (Obert and Duvall, 1941), the study found small changes in the elastic modulus with age after
3-4 days of drying. Moreover, according to their study, a large reduction in the value of dynamic moduli
takes place within the first 48 hours of oven drying, although, the subsequent change is rather small. As
low a temperature as 34˚C in oven drying curing even leads to an irreversible reduction of the elastic
modulus. This reduction can be explained by micro-cracking of paste from shrinkage phenomena which
causes the subsequent decrease in its stiffness, and thus influencesthe dynamic moduli. It was also found in
(Kesler and Higuchi, 1945) that the dynamic modulus of elasticity increases as the strength increases for
the same curing conditions and it rises with age if concrete is kept moist. However, other studies on large
blocks incorporating Secondary Cementitious Materials (SCM) have identified that longer periods of air-
drying do not have any detrimental influences on both static and dynamic moduli of elasticity. Due to slow
pozzolanic reaction of SCMs, it is concluded that strength obtained in these concrete specimens over a
longer period seems to lead to higher elastic moduli.

24
(Zhou et al., 2015) study reported that curing temperature affects the development of both the static
and dynamic moduli of elasticity while it did not influence the correlation between both moduli.
Furthermore, the dynamic elastic modulus of air-cured concrete may slightly decrease due to continuing
moisture loss of concrete through time. The elastic modulus of saturated (water cured) concrete can be up
to 5% greater than that of air-dried concrete (Bungey et al., 2006). A study performed by (Graft-Johnson
and Bawa, 1969) showed a decrease of the damping coefficient with increase in age, aggregate-to-cement
ratio, density and compressive strength. It was also noted that air-cured samples gave much higher values
possibly due to evaporation changing the rigidity of the cement.
(Jones, 1969) study on beam specimens, moist-cured for 25 days and afterward air-cured for 150
days, showed significant changes in the elastic moduli readings taken from flexural and longitudinal
resonance tests. The author believed that the difference in modulus, resulted from the moisture loss, mainly
consequence in gradients for moisture content, elastic modulus, and density in each dimension of the beam
which eventually affect the flexural and dynamic moduli. Hence, curing conditions have critical effects on
the resonance frequency and dynamic moduli and it is recommended to test specimens in water-saturated
or saturated-surface-dry (SSD) conditions.
2.4.5.4 Age
The modulus of elasticity of concrete varies under loading and with age (Graft-Johnson and Bawa,
1969). As concrete hardens from the initial casting, its resonant frequency increases at a high rate during
the initial 3 days of curing and increases at a low rate during the remaining time of curing. The high rate
increase is caused by a decrease in porosity as the reaction products, Calcium Silicate Hydrate and Calcium
Hydroxide, of concrete develop. A study by on plain concrete specimens yet confirmed that age and curing
condition both affects the internal structure and density of concrete and thus potentially could have an
influence on the modulus, especially through development of hydration product and internal cracking.
Plachy’s study also evaluated the static Young’s moduli which later compared with dynamic moduli
(Plachy et al., 2009). According to their study during one year monitoring of concrete specimens, there
were no significance variations in the value of dynamic and also static modulus in time. (Han and Kim,
2004) found no major correlation between sample age and the relationship between the moduli, but all
samples were tested up to 28 days of age.
2.4.5.5 Temperature
(Bahr et al., 2013) studied the effect of high temperature on the modulus of elasticity of concrete
to determine the concrete’s fire resistance through temperature dependent factor. Using an impulse
excitation technique, the authors investigated the elastic properties of fire exposed concrete and found a
degradation trend in the elastic modulus with an increase in temperature. Subsequently, the authors
proposed a new temperature dependent model.
Several studies have used this technique for studying the defects in lab specimen, however, limited
information is available in correlating the influence of polypropylene fibers along with the effect of
consolidation and induced defects on the dynamic elastic modulus of plain concrete.
2.5 Application of Impact Resonance Method on Polypropylene Fiber Reinforced
Concrete
Various studies have been conducted to measure mechanical properties of FRC such as flexure
strength, fiber pullout strength, abrasion resistivity. However, there is limited research evidence regarding
the assessment of the dynamic elastic properties of PFRC using different size fibers and concrete specimens.
25
Typically, the resonant frequency of PFRC decreases in both air and moisture curing conditions. This can
be related to the lower density of the polypropylene fibers when compared to that of other aggregates used.
This section includes a review of previous literature conducted on resonant frequency testing of FRC
focusing on the use of polypropylene fiber. Other research pertaining to the evaluation of dynamic
properties of concrete using RFT are also considered.
The dynamic properties of PFRC disc slabs were determined by (Manolis et al., 1997). In their
experiment, 19 mm fibrillated polypropylene fibers with three volume fractions, 0 %, 0.1 % and 0.5 % of
the same mixture, were cast in a circular slab 20 cm thick. They reported that polypropylene fiber content
did not have a significant influence on first natural frequency, yet it enhanced the impact resistance of
concrete specimens, especially for these specimens containing 0.5% polypropylene fiber. It was
recommended to investigate the effects of fiber length or utilize various mix designs to maximize the fibers’
contribution to strength development.
An initial study, conducted by (Leung and Balendran, 2002), showed that the resonant frequency of
PFRC is can be affected by the presence of polypropylene fibers, curing condition and the partial
replacement of cement by mineral admixtures such as silica fume and fly ash. The authors used 0.2%
polypropylene fibers by volume of concrete for all mixtures. The results showed a slight decrease in the
resonant frequency when adding polypropylene fibers. Moreover, the addition of fly ash with the fibers
decreases the resonant frequency of the concrete at early age (3 Days and 7 Days), however, the resonant
frequency tends to increase with age (28 Days and 91 Days) (Leung and Balendran, 2002). Yet, the benefits
of polypropylene fibers show come into effect after cracking occurs and play a role in crack width control
and abrasion resistance. To expand the comparison, specimens could be assessed though their dynamic
elastic properties. This ensures that most variables, including variation in concrete density and geometry,
are considered when comparing samples of the same mixture.
(Ward et al., 2008) evaluated the effect of fatigue and thermal cycling on carbon fiber reinforced
polymer (CFRP) beams using the impact resonance method. The authors experimented 1.2m long
reinforced beams subjected to thermal cycling between 23˚C and -18 ˚C. Moreover, they evaluated fatigue
loading cycled between high and low stress levels to study IRM in damage detection. The FFT frequency
spectrum, modal fundamental frequency and dynamic properties were used to asses the damage of the
beams. The authors summarized that the IRM for thermal cycling was inconclusive. However, for fatigue
cycling, the dynamic elastic moduli showed a decrease in stiffness from the measured fundamental
frequency. The largest decrease was observed for the longitudinal frequency as about54% less than the
original dynamic moduli and about 32% less than the original P-wave velocity. Moreover, the authors
indicated a that CFRP strengthened beams retained a higher stiffness from both elastic and P-wave
velocities under loading when compared to un-strengthened beams.
(Zhang and Li, 2013) investigated the effect of polypropylene fibers on the freeze-thaw resistance
of concrete using four different fiber volume fractions (0.06%, 0.08%, 0.1% and 0.12%). Addition of
polypropylene fibers greatly improved the durability of concrete containing fly ash and silica fume and
slightly increased the freeze-thaw resistance when compared to plain concrete. RFT can be used to
determine changes in dynamic properties of concrete undergoing freeze-thaw cycles. (Hamoush, 2011)
studied the effect of freeze-thaw cycles of Very High Strength Concrete (VHSC). By determining the
dynamic moduli and Poisson’s ratio, the authors showed that both above mentioned factors increase at 40
cycles of freeze-thaw while the modulus of elasticity decreases with more freeze-thaw cycles as cracks
initiate and develop.
(Ali et al., 2012) studied the relation between the static and dynamic elastic moduli of coconut fiber
reinforced concrete beams based on resonant frequency and damping ratio. Their results show that concrete
exhibited a high damping ratio and a lower modulus when coconut fibers are added. The authors concluded
that the elastic properties improve when the fiber volume fraction reaches 5% and length of 50 mm.

26
The effect of the steel fiber (0.5% and 1%) and carbon fiber (0.5%) on mechanical properties of
concrete incorporating 10% silica fume has been experimentally investigated in (Giner et al., 2012). For
each mix design, three prismatic (100×100×400 mm) specimens for evaluation of their fundamental
longitudinal, transverse, and torsional resonant frequencies and three cylindrical (Ø150×300 mm) samples
for measuring their compressive strength were cast in this study. Out of the three modes of vibration, it was
concluded that the addition of carbon fibers relatively increase the resonant frequencies of concrete samples.
In contrast, resonant frequency values tend to decrease as the steel fiber content increases. Although the
modulus of elasticity of concrete is expected to increase with an increase in steel fiber content, the authors
indicate that the decrease in resonant frequency values can be related to the increase of porosity and air
content that is produced by the addition of more fibers. A similar trend has been observed for the dynamic
elastic properties. It is reported that the static elastic modulus shows lower values compared to their
dynamic counterparts for all mixes.
2.6 Summary
Reinforcing concrete with polypropylene fibers has been proven to provide an economical and
efficient method to promote better environmental stability and higher impact and shrinkage resistance of
concrete. The local mechanical properties of PFRC are affected by fiber length, volume fraction and type
of fiber used. Global factors include the concrete age, water/cement ratio, mixture proportions, temperature,
curing conditions and aggregate size/type. Yet the effect of polypropylene fibers on the compressive
strength and elastic modulus properties of concrete is unclear. Some cases showed a slight increase in both
properties when polypropylene fibers are added. Still, polypropylene fibers are known to be dominantly
significant in increasing impact resistance, promoting toughness and controlling plastic shrinkage of
concrete. Furthermore, polypropylene fibers offer extensive crack bridging and slow down crack
propagation.
Based on the literature review, it can be concluded that the resonant frequency method is practical
for determining dynamic properties of concrete. Moreover, it is repeatable, convenient, and reliable for
correlating the dynamic elastic and shear moduli of different concrete mixtures. The lab developed NDT
method presented in this thesis has been applied to a limited number of PFRC samples with different
dimensions. The impact resonance method shows a potential for viable assessment of concrete dynamic
properties using selected specimens of different sizes and reinforcements.

27
3 Experimental Program
This section comprises the materials, mixture composition, casting, curing conditions and preparation
of specimens including the testing procedures that are investigated during this study. The specimens are
divided into three batches with the following specifications:
• Batch 1: To study the effects of macro fibers on Polypropylene Fiber Reinforced Concrete (PFRC)
using low and high fiber quantities, when compared to unreinforced (plain) concrete of the same
mixture. To review the dynamic elastic modulus of flexure cracked PFRC beams.
• Batch 2: To evaluate the effects of micro fibers on the dynamic properties of PFRC monitored from
Day 1 (after casting) to 56 Days when compared to plain concrete of the same mixture.
• Batch 3: To evaluate the dynamic properties of macro and micro PFRC cylinders, prior to cracking
and post-cracking, accounting for saturated and dry curing conditions.
Currently, there are normalized standard procedures for determining the dynamic elastic properties of
concrete using stress wave propagation techniques in accordance to the American Society for Testing and
Materials (ASTM), British Standard Institute (BSI) and Deutscher Ausschaussfur Stahlbeton (DAS). All
standard associations have a similar testing procedure; however, there are dimensional correction factors in
defining the dynamic modulus of elasticity differs. Through this study, testing of fresh and hardened
concrete properties was performed according to ASTM standards. ASTM C215 – Standard Test Method for
the Transverse, Longitudinal and Torsional Resonant Frequency of Concrete (ASTM C215, 2014) has been
the primary focus of this study to investigate the dynamic elastic properties of concrete specimens.
3.1 Materials
3.1.1 Cement Portland cement Type GU was used for all concrete batches. Appendix A.A shows the used cement
type in accordance with ASTM C150 – Type 1 general use.
3.1.2 Fly Ash Fly ash used was obtained from Centralia power plant, located in Centralia, Washington, USA. The
fly ash is classified as Class F per ASTM C618.
3.1.3 Aggregates Natural gravel with a nominal size of 12.5 mm containing a small amount of partially crushed
material was used as coarse aggregates for all mixtures. Sand collected from Sechelt Pit was also used as
fine aggregate. Table 3-1 includes the properties of the used aggregates. Appendix A includes the sieve
analysis of the coarse and fine aggregates along with other properties.
Table 3-1: Coarse and fine aggregate properties
Aggregate Coarse Fine
Maximum Size (mm) 12.5 4.75
Specific Gravity 2.8 2.7
Water Absorption (%) 0.45 1.2
Fineness - 2.61
3.1.4 Fibers Two different polypropylene fibers were considered in this study developed by (Propex Operating
Company, 2016). Type 1 (Enduro® 600) is a macro-monofilament fiber with a patented sinusoidal
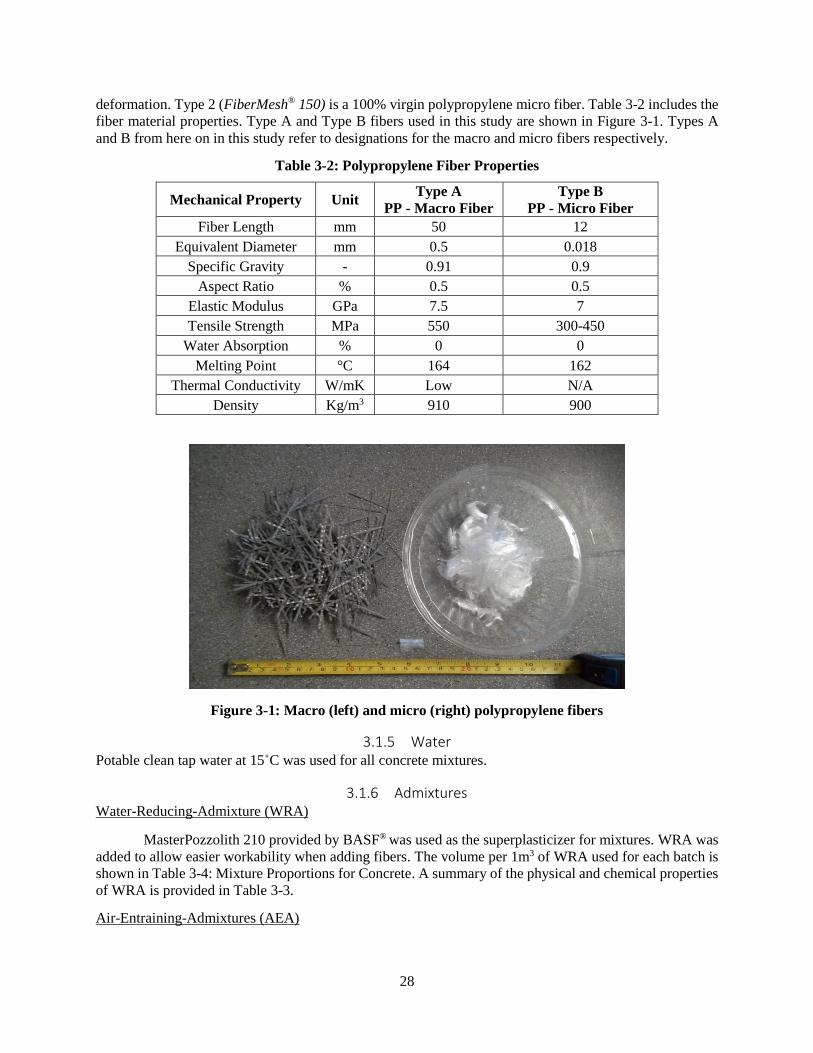
28
deformation. Type 2 (FiberMesh® 150) is a 100% virgin polypropylene micro fiber. Table 3-2 includes the
fiber material properties. Type A and Type B fibers used in this study are shown in Figure 3-1. Types A
and B from here on in this study refer to designations for the macro and micro fibers respectively.
Table 3-2: Polypropylene Fiber Properties
Mechanical Property Unit Type A
PP - Macro Fiber
Type B
PP - Micro Fiber
Fiber Length mm 50 12
Equivalent Diameter mm 0.5 0.018
Specific Gravity - 0.91 0.9
Aspect Ratio % 0.5 0.5
Elastic Modulus GPa 7.5 7
Tensile Strength MPa 550 300-450
Water Absorption % 0 0
Melting Point °C 164 162
Thermal Conductivity W/mK Low N/A
Density Kg/m3 910 900
Figure 3-1: Macro (left) and micro (right) polypropylene fibers
3.1.5 Water Potable clean tap water at 15˚C was used for all concrete mixtures.
3.1.6 Admixtures Water-Reducing-Admixture (WRA)
MasterPozzolith 210 provided by BASF® was used as the superplasticizer for mixtures. WRA was
added to allow easier workability when adding fibers. The volume per 1m3 of WRA used for each batch is
shown in Table 3-4: Mixture Proportions for Concrete. A summary of the physical and chemical properties
of WRA is provided in Table 3-3.
Air-Entraining-Admixtures (AEA)

29
DAREX ED provided by Grace Canada, Inc. was used as for active air-entrainment during fresh
concrete mixing. The admixture is an Alkyl Sulphate liquid composed essentially of Tall oil. Tall oil is a
by-product of chemical pulping of coniferous trees, like Pine trees, and is fundamentally made of fatty acids
and other alkyl hydrocarbon derivates. AEA was added to supply concrete with microscopic air bubbles
that protect the concrete through freeze-thaw cycles. A summary of the physical and chemical properties
of AEA is included in Table 3-3.
Table 3-3: Summary of admixture properties
Item WRA AEA
Supplier BASF Canada, Inc. Grace Canada, Inc
Trade Name POZZOLITH 210 DAREX AEA ED
MSDS ID 30605620/SDS_GEN_CA/EN D-07092
Form Liquid Liquid, Oil based
Color Dark brown Light brown
pH 6 - 11 11
Density (Kg/m3) 1125 - 1155 1000
Solubility in water Completely soluble
Solubility in other solvents
3.2 Mixture Proportions
The following mixture proportions were applicable for moderate to high strength concrete 31 – 45
MPa. According to AASHTO-AGC-ARTBA Joint Committee, it is advised to increase the mortar fraction
and reduce the coarse aggregate content to accommodate the increase in surface area due to polypropylene
fiber addition (AASHTO-AGC-ARTBA Joint Cooperation Committee, 2001).
Three separate batches of PFRC were prepared by modifying some variables between each batch.
The mixture proportions are given in Table 3-4. CC designates the control concrete mixture of Batch 1 and
Batch 2. A higher fiber content of 1% is indicated by H in Batch 1. FRC comprises polypropylene fiber
reinforced concrete with macro and micro fibers designated as A and B correspondingly for all batches.
The total cementitious unit weight used for mixing is the same for each batch; however, for Batch 1
and Batch 2, 20% of the total cement weight was substituted with Fly Ash. Fiber mixtures were regulated
by modifying the quantity of WRA used while all AEA volumes remained constant between each batch.
WRA dosages were adjusted to accommodate for low workability of fiber mixtures and maintain slump
between all batches. A w/c ratio of 0.5 was chosen for Batch 2 to investigate the effect of increasing the
water content on the dynamic elastic properties of PFRC. No fly ash was used as a mineral admixture for
Batch 3 to highlight the effect of substituting finely pulverized fly ash into the cementitious mixture.
Moreover, Batch 3 focuses on testing concrete cylinders
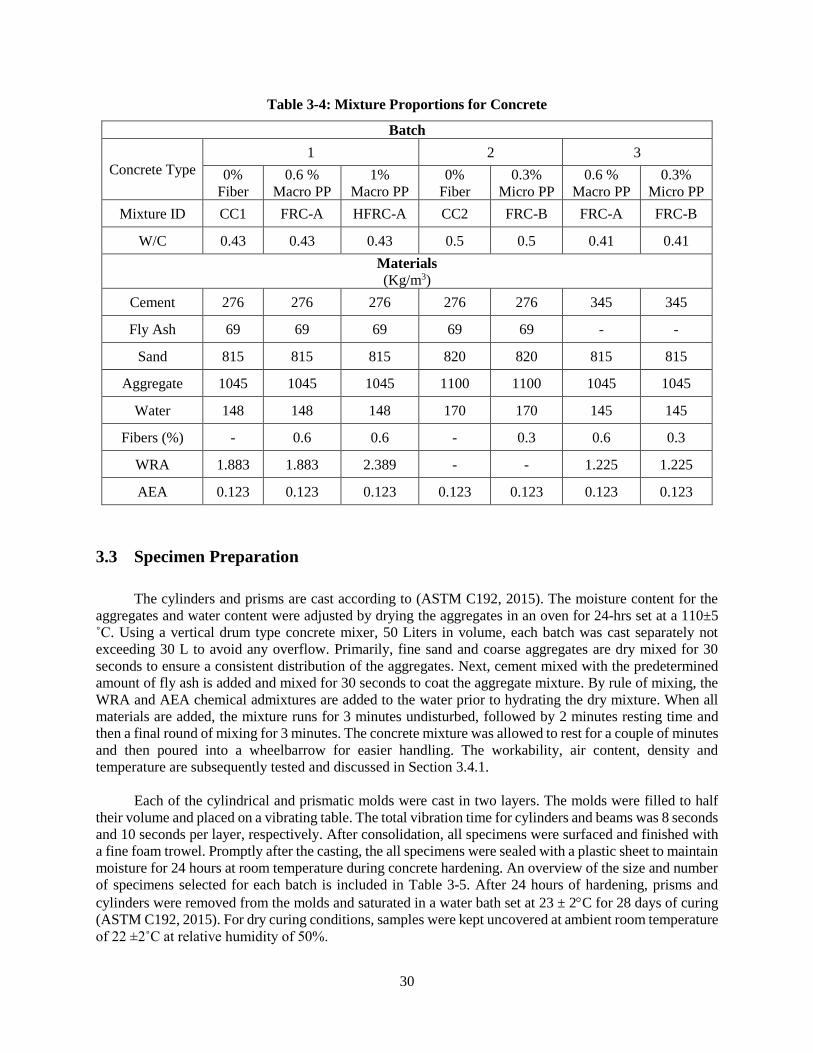
30
Table 3-4: Mixture Proportions for Concrete
Batch
Concrete Type
1 2 3
0%
Fiber
0.6 %
Macro PP
1%
Macro PP
0%
Fiber
0.3%
Micro PP
0.6 %
Macro PP
0.3%
Micro PP
Mixture ID CC1 FRC-A HFRC-A CC2 FRC-B FRC-A FRC-B
W/C 0.43 0.43 0.43 0.5 0.5 0.41 0.41
Materials
(Kg/m3)
Cement 276 276 276 276 276 345 345
Fly Ash 69 69 69 69 69 - -
Sand 815 815 815 820 820 815 815
Aggregate 1045 1045 1045 1100 1100 1045 1045
Water 148 148 148 170 170 145 145
Fibers (%) - 0.6 0.6 - 0.3 0.6 0.3
WRA 1.883 1.883 2.389 - - 1.225 1.225
AEA 0.123 0.123 0.123 0.123 0.123 0.123 0.123
3.3 Specimen Preparation
The cylinders and prisms are cast according to (ASTM C192, 2015). The moisture content for the
aggregates and water content were adjusted by drying the aggregates in an oven for 24-hrs set at a 110±5
˚C. Using a vertical drum type concrete mixer, 50 Liters in volume, each batch was cast separately not
exceeding 30 L to avoid any overflow. Primarily, fine sand and coarse aggregates are dry mixed for 30
seconds to ensure a consistent distribution of the aggregates. Next, cement mixed with the predetermined
amount of fly ash is added and mixed for 30 seconds to coat the aggregate mixture. By rule of mixing, the
WRA and AEA chemical admixtures are added to the water prior to hydrating the dry mixture. When all
materials are added, the mixture runs for 3 minutes undisturbed, followed by 2 minutes resting time and
then a final round of mixing for 3 minutes. The concrete mixture was allowed to rest for a couple of minutes
and then poured into a wheelbarrow for easier handling. The workability, air content, density and
temperature are subsequently tested and discussed in Section 3.4.1.
Each of the cylindrical and prismatic molds were cast in two layers. The molds were filled to half
their volume and placed on a vibrating table. The total vibration time for cylinders and beams was 8 seconds
and 10 seconds per layer, respectively. After consolidation, all specimens were surfaced and finished with
a fine foam trowel. Promptly after the casting, the all specimens were sealed with a plastic sheet to maintain
moisture for 24 hours at room temperature during concrete hardening. An overview of the size and number
of specimens selected for each batch is included in Table 3-5. After 24 hours of hardening, prisms and
cylinders were removed from the molds and saturated in a water bath set at 23 ± 2C for 28 days of curing
(ASTM C192, 2015). For dry curing conditions, samples were kept uncovered at ambient room temperature
of 22 ±2˚C at relative humidity of 50%.

31
Table 3-5: Specimen Testing Breakdown
Batch Mixture ID Concrete Type Prism1 Cylinder2
Dynamic Moduli3 Compression4
1
(w/c = 0.43)
CC1 Plain Concrete 3A 3 3
FRC - A 0.6% Macro PFRC 3A 3 3
HFRC - A 1% Macro PFRC 3A 3 3
2
(w/c = 0.5)
CC2 Plain Concrete 3 3 3
FRC - B 0.3% Macro PFRC 3 3 3
3
(w/c = 0.43)
FRC - A 0.6% Macro PFRC - 12B 6C
FRC - B 0.3% Micro PFRC - 12B 6C
1 Size: 100×100×350 mm & 150×150×550 mm 2 Size: 100x200 mm
3 According to ASTM C215 4 According to ASTM C39 at 28 days A Additional prisms were tested for modulus of rupture according to ASTM C1609 B Same set are tested after cracking C Additional three cylinders were tested for compressive strength at 14 days
3.4 Testing
3.4.1 Standard Concrete Testing 3.4.1.1 Fresh Concrete Properties
Workability
Workability of fresh concrete was measured using a slump test in accordance with (ASTM C143,
2015). Slump is measured by the change in height (mm) of compacted concrete undergoing a normal
viscous reaction to gravity when the cone is pulled upwards releasing the fresh concrete. For optimal results,
the test should go uninterrupted, from start of filling the mold to removing the cone, in an elapsed time of
2.5 minutes relating to ASTM C143 procedures. All mixtures were tested using the same apparatus and
results are averaged to the nearest 5 mm.
Air Content
Air content is defined by the percentage of air present in a fresh concrete mixture. From ASTM
C231, a Type B air meter was used for testing the percentage air in both plain concrete and FRC mixtures
as concrete the mixtures consist of relatively dense aggregates (ASTM C231, 2014). The mechanism behind
the apparatus starts by air being pumped into a pressure cap air chamber that is sealed air tight with a
constant volume base. The air meter is calibrated to initial pressure. As the air is released from the pressure
cap air chamber to the base, the percentage is the resulting air content of the concrete mixture. Air content
testing was repeated twice to ensure consistent values.
Density
Density of the concrete is can be regulated on the stage of fresh mixture preparation through the
average density of composed materials. The density of a fresh concrete batch is measured in accordance
32
with ASTM C138 and it is theoretically defined as the mass to volume ratio (ASTM C138, 2014). For
measuring fresh mixture density, a container of known volume and weight is filled to the brim with the
freshly prepared concrete mixture. The fresh mixture was rodded to compensate the possibility of excessive
loss in entrained air (ASTM C138, 2014).
Temperature
Temperature of fresh concrete mixture was measured in accordance with (ASTM C1064, 2012).
The standard defines the types and precision of temperature measurement devices required to use. using a
standard glass thermometer or resistance thermometers, to the nearest 0.5°C. Moreover, the size of the
sample plays a role in overall temperature change. According to ASTM C1064, the smaller the sample, the
greater the temperature loss or gain from the surrounding (ASTM C1064, 2014). Concrete mixture sample
should be large enough to allow a minimum depth of 75 mm to surround the thermometer. Any aggregate
size 12.5 mm or greater might cause the thermometer to obtain an equilibrium reading at a longer period.
A thermometer was placed in different location of the mixture after the mixing process is complete and
average reading of the temperature is reported.
3.4.1.2 Hardened Concrete Properties
Compressive Strength
Compressive strength of concrete can be defined as the maximum compressive strength a concrete
specimen withstands when loaded to failure. In this study, cylindrical specimens Ø100x200 mm are
compressed along their longitudinal axis. Each cylinder side was surface ground using a diamond grit
grinding disc having about2mm cut-off per side. This ensures even distribution of the load applied on the
cylinder surface. The cylinders were saturated surface dry before each test. An average of 3-cylinder
compression tests are used to define the structures compressive strength at 28 days from casting (ASTM
C39, 2016). The compressive strength (Fc) of the cylinder is calculated using the following equation:
𝐹𝑐 =𝑃
𝜋𝑟2 Eq. 3.4.1-1
Where 𝐹𝑐 in N/mm2 is the compressive strength, P in Newtons is the failure load and r is radius of
the cylinder in mm.
All cylinders were tested according to ASTM C39 Standard Test Method for Compressive Strength
of Cylindrical Concrete Specimens (ASTM C39, 2016). The compression machine, shown in below Figure
3-2, has a maximum capacity of 3000KN with an applied loading rate maintained at 0.25 MPa/s for every
test. At 7 days from curing, some cylinders were used to assess the compressive strength of each mixture.

33
Figure 3-2: Forney Compression Machine Used for Determination of Compressive Strength
Flexural strength
Flexural strength (𝐹𝑡) of the specimens was determined using (ASTM C1609, 2012). The
maximum flexure strength of a concrete prism is determined through the first peak load facture of the
concrete prism. The test comprises a 100×100×350 mm simply supported concrete beam under third-point
loading as shown in Figure 3-3.
𝐹𝑡 =𝑃𝐿
𝑏𝑑2 Eq. 3.4.1-2
Where Ft is the flexure strength in MPa, P is the applied force in Newtons, L is the effective span length
in meters, and b and d are the prism width and effective depth in millimetres.
Figure 3-3: a) Third point loading test setup b) Flexure loading schematic
(adapted from ASTM C1609)
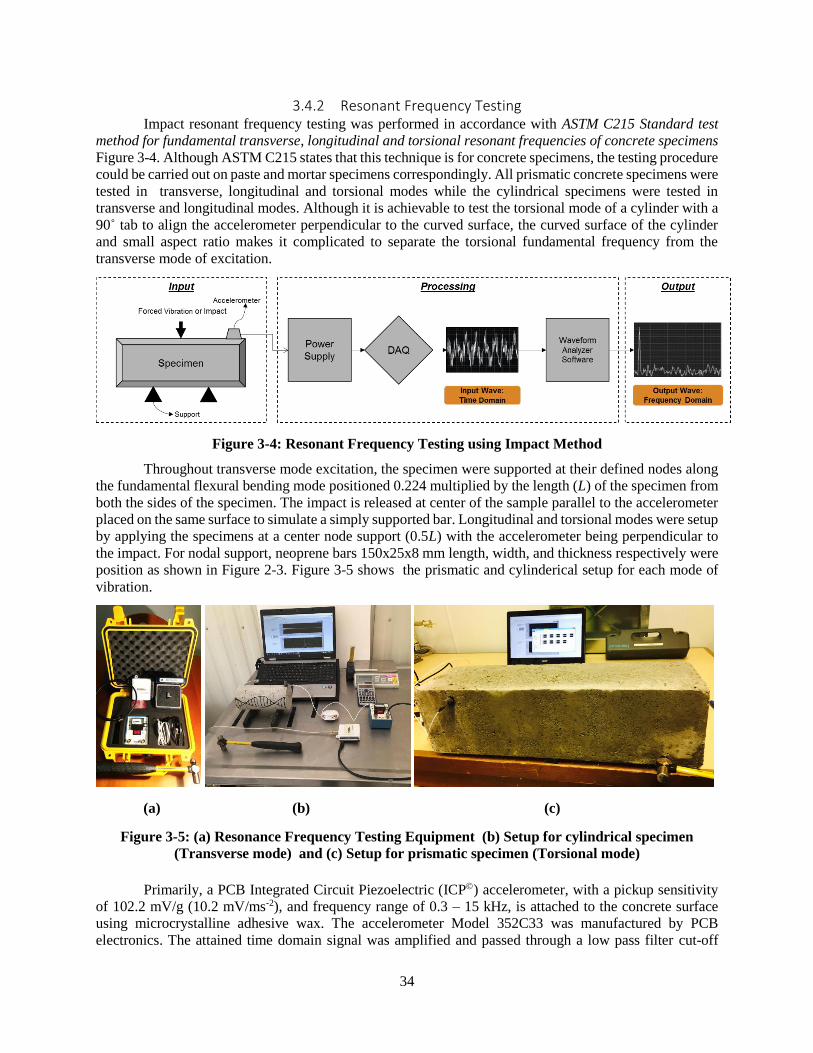
34
3.4.2 Resonant Frequency Testing Impact resonant frequency testing was performed in accordance with ASTM C215 Standard test
method for fundamental transverse, longitudinal and torsional resonant frequencies of concrete specimens
Figure 3-4. Although ASTM C215 states that this technique is for concrete specimens, the testing procedure
could be carried out on paste and mortar specimens correspondingly. All prismatic concrete specimens were
tested in transverse, longitudinal and torsional modes while the cylindrical specimens were tested in
transverse and longitudinal modes. Although it is achievable to test the torsional mode of a cylinder with a
90˚ tab to align the accelerometer perpendicular to the curved surface, the curved surface of the cylinder
and small aspect ratio makes it complicated to separate the torsional fundamental frequency from the
transverse mode of excitation.
Figure 3-4: Resonant Frequency Testing using Impact Method
Throughout transverse mode excitation, the specimen were supported at their defined nodes along
the fundamental flexural bending mode positioned 0.224 multiplied by the length (L) of the specimen from
both the sides of the specimen. The impact is released at center of the sample parallel to the accelerometer
placed on the same surface to simulate a simply supported bar. Longitudinal and torsional modes were setup
by applying the specimens at a center node support (0.5L) with the accelerometer being perpendicular to
the impact. For nodal support, neoprene bars 150x25x8 mm length, width, and thickness respectively were
position as shown in Figure 2-3. Figure 3-5 shows the prismatic and cylinderical setup for each mode of
vibration.
(a) (b) (c)
Figure 3-5: (a) Resonance Frequency Testing Equipment (b) Setup for cylindrical specimen
(Transverse mode) and (c) Setup for prismatic specimen (Torsional mode)
Primarily, a PCB Integrated Circuit Piezoelectric (ICP) accelerometer, with a pickup sensitivity
of 102.2 mV/g (10.2 mV/ms-2), and frequency range of 0.3 – 15 kHz, is attached to the concrete surface
using microcrystalline adhesive wax. The accelerometer Model 352C33 was manufactured by PCB
electronics. The attained time domain signal was amplified and passed through a low pass filter cut-off

35
frequency at 10 kHz. Table 3-6 shows the properties of the uniaxial accelerometer used for this study. The
input compression wave voltage is collected using a 4 channel NI USB6009 DAQ with a built in Analog to
Digital Convertor (ADC). After attaching the accelerometer and positioning the concrete samples to the
required mode of testing, a standard ball tip hammer weighing 110 ± 2 grams with a tip diameter of 10 mm,
is used to strike the surface at precise locations on the samples being tested.
Table 3-6: Accelerometer Specifications
Type PCB - ICP
Model 352C33
Height 15.7 mm
Weight 5.8 g
Sensitivity 10.2 mV/(m/s2)
Frequency Range 0.3 – 15000 Hz
Non-linearity <1 %
Transverse Sensitivity <5 %
Temperature Range -54 to 93 ̊C
The FFT requirements are modeled in a visual instrument (VI) program using National Instrument’s
LabVIEW 2014 (NI LabVIEW). The program was exclusively developed for this study considering (ASTM
C215, 2014) for acquisition requirements. Exponential windowing and averaging, along with a discrete
frequency domain, were examined to ensure output noise reduction and coherence. All waveform
acceleration responses were digitized in the time domain to 1024 samples at a sampling acquisition rate of
20 kHz. The sampling rate of a data acquisition system should be large enough for determining the highest
predicted frequency to fulfill the Nyquist frequency. This led to a signal response time of 51.2 ms along
with a sample interval (SI) of 25 μs. The spectral line spacing in the frequency domain, or digital step, is
19.5 Hz and the Nyquist frequency for the response is 10 kHz.
From the output amplitude-frequency graph, the first amplitude peak value verifies the natural
resonant frequency according to the tested mode of vibration. The RFT tests were performed three times
and averaged for all modes of vibration for each specimen. Any results deviating 10% from the mean
frequency are disregarded and the test was repeated. Dynamic elastic and shear moduli are calculated
according to the equations described in Section 2.4.3 for impact resonant frequency testing.
For all cases, the specimen orientation was kept constant during testing to ensure that any changes
observed in the specimen vibration response would not arise from changing the testing setup. Transverse
vibration was carried out parallel to the direction of casting for all concrete prisms and perpendicular for
all concrete cylinders. This was maintained to ensure that the dominant vibrational thickness is accounted
for in the transverse vibration of prisms and longitudinal vibration of cylinders. When testing concrete
through multiple impacts, the surface may crumble. For reliable practice suggested by (Malhotra and
Carino, 2004), consecutive readings are measured at the same contact location of the hammer on the
concrete surface and omitting the first two readings from the measured set to remove anomalies. The mode
of vibration and equivalent resonant frequency for each mode are reported to nearest 10 Hz while the
dynamic modulus of elasticity and dynamic modulus of rigidity are calculated to the nearest 0.5 GPa. In
addition, the dynamic Poisson's ratio is reported to the nearest 0.01 ratio.

36
3.4.3 Induced Crack RFT Testing Figure 3-6 shows the Standard Crack Inducing Jig (SCIJ) developed by (Gupta and Biparva, 2015).
This jig houses a Ø100x200 mm cylinder between v-shaped cutting edges that act as stress concentrators.
Ideally, the SCIJ develops cracks ranging 0.1 – 0.5 mm in width. For achieving a consistent crack, the
authors recommended that the ideal age to induce cracks is between 2-3 days of curing. This is due to the
fact that that at earlier age (E.g. 1 day of curing), the concrete fractures in a ductile manner. While at later
ages (E.g. 28 days of curing), the crack fracture behaves in a brittle manner. However, it is recommended
by the authors to investigate the cracking of each mixture on sample cylinders to ensure a consistent crack
width. Hence, the aim of Batch 3 is to investigate the recovered dynamic moduli of macro and micro PFRC
during two curing regimes prior to crack induction. For constant testing, the uniaxial tension is terminated
as the concrete cylinder cracks for maintaining a constant crack width. With pilot investigation of the
suggested cracks for the concrete mixture of this study, cylinders were cracked at 14 days.
The crack generated by the SCIJ should be measured from each face of the concrete cylinder. An
average of five readings of the crack width were taken for each sample. After cracking the cylinder, the
RFT was carried out again, in Transverse mode, having the impulse direction perpendicular to the
indentation line to capture the full plane of cracking. Subsequently, the cracked PFRC cylinder was tested
in the longitudinal mode as shown in Figure 3-6 (c). Since the crack area is along the longitudinal dimension
of the cylinders, the expected longitudinal vibration may be inconsistent to interpret in the frequency
domain. By that, the longitudinal frequency variation may not indicate a notable change. All cracked
cylinders are positioned in the same orientation for transverse and longitudinal testing. During testing,
signal variations can occur due to external vibration, insecurely supported cables, or by disturbance in the
accelerometer. Any frequency measurements that deviated by 10% from the average value were disregarded
and the test was repeated.
(a) (b) (c)
Figure 3-6: Setup for cracking (a) SCIJ Front view (b) cylinder held in SCIJ Isometric view
(c) Longitudinal Impulse Direction Setup

37
3.4.4 Microscopic observation
Microscopic imaging in this study followed the procedures as outlined in ASTM C856 ‘Standard
Practice for Petrographic Examination of Hardened Concrete’ (ASTM C856, 2017). During concrete
repair, rubble and concrete shattered pieces are considered useful for petrographic examination of concrete
mixtures. Yet, as recommended by ASTM C856, imaging concrete at from its original state of unaltered
deterioration, similar to cracks developed in this study, clearly demonstrate the nature of crack propagation.
Cracks developed in this study are imaged as discussed in Section 3.4.3. Images were captured from a
concrete surface area (78.55 cm2) when compared to the crack size distribution (4.1 cm2) of the same
surface. When handling the cylinders, no forceps or external tools were used to handle the cylinders after
crack induction.
For petrographic imaging, a Firefly® GT800 digital microscope was used to observe and locate the
bridging mechanism of macro and micro polypropylene fibers after cracking. The microscope is equipped
with a 2-megapixel camera having a maximum working distance of 200 mm along with an optical
magnification up to 160X and 500x digital magnification). The handheld microscope allows for cracks to
be imaged from the PFRC surface as shown in Figure 3-7 that were cracked using the setup shown in Figure
3-6. For locating fibers with active crack bridging, images were captured at a working distance of 14 mm
having a field of view of 5.4 mm × 4.1 mm. The cylinders were surface ground prior to cracking for an
attempt to locate polypropylene fiber bridging in the depth of the crack. Images were captured using a
standard video imaging software and the microscope was calibrated using a universal calibration slide.
Figure 3-7: Typical crack propagation for macro and micro PFRC
3.5 Repeatability and Validation
The resonant frequency method has been used by several researchers as a reliable method for
monitoring changes in concrete properties and for carrying out repeatable tests using the same concrete
specimen (Kolluru et al., 2000; Malhotra and Carino, 2004; Li and Yang, 2007; Ward et al., 2008; Popovics,

38
2008; Noguchi et al., 2009; Giner et al., 2012; Lee et al., 2015). For consistently determining the resonant
frequencies, several measurements have been performed throughout this study to inspect and validate the
repeatability of impact testing. The transverse mode of vibration was investigated in this section using a
cylindrical (Ø100x200 mm) plain concrete specimen as the representative sample. Reference aluminum
cylinders were tested for evaluating the transverse and longitudinal resonant frequencies in comparison
with the predicted elastic modulus. Since aluminum is an isotropic homogenous material when compared
to concrete’s true heterogenous and anisotropic nature, a comparison between the experimental and
theoretical value of aluminum is expected to indicate the reliability of the experimentally determined elastic
moduli. All tests were conducted at an ambient temperature of 21 ± 2 ˚C. The findings from these
measurements are intended to enable a practical implementation of IRM.
3.5.1 Effect of Impact Force Variation For this study, the effect of varying the impact force was used to investigate any variation in the
resonant frequency and force amplitude determined from a frequency response function. Force variation
was applied by noting three light impacts, three medium impacts and three hard impacts with a load
approximately <0.5V, <1V and >2V (Volts) respectively as shown in Figure 3-8. For harder impacts, the
compression wave experiences more forced vibration when compared to light and medium impacts.
Therefore, a wave delay can occur as shown in Figure 3-8. This can arise from the brittle nature of the
concrete surface during the impact and from the pick up voltage range of -5V to 5V. An average of the
frequency response function is determined for each impact. The representative cylinder is setup in
transverse mode as presented in Figure 2-3. For reliability, the accelerometer was carefully positioned and
attached without being removed during the force variation testing. A similar repeatability study was
published by (Gudmarsson, 2014) on disc-shaped asphalt concrete considering force variation,
accelerometer reattachment, accelerometer position and equipment operator as repeatability parameters on
the same specimen.
Figure 3-8: Representative light (top), medium and hard (bottom) impacts
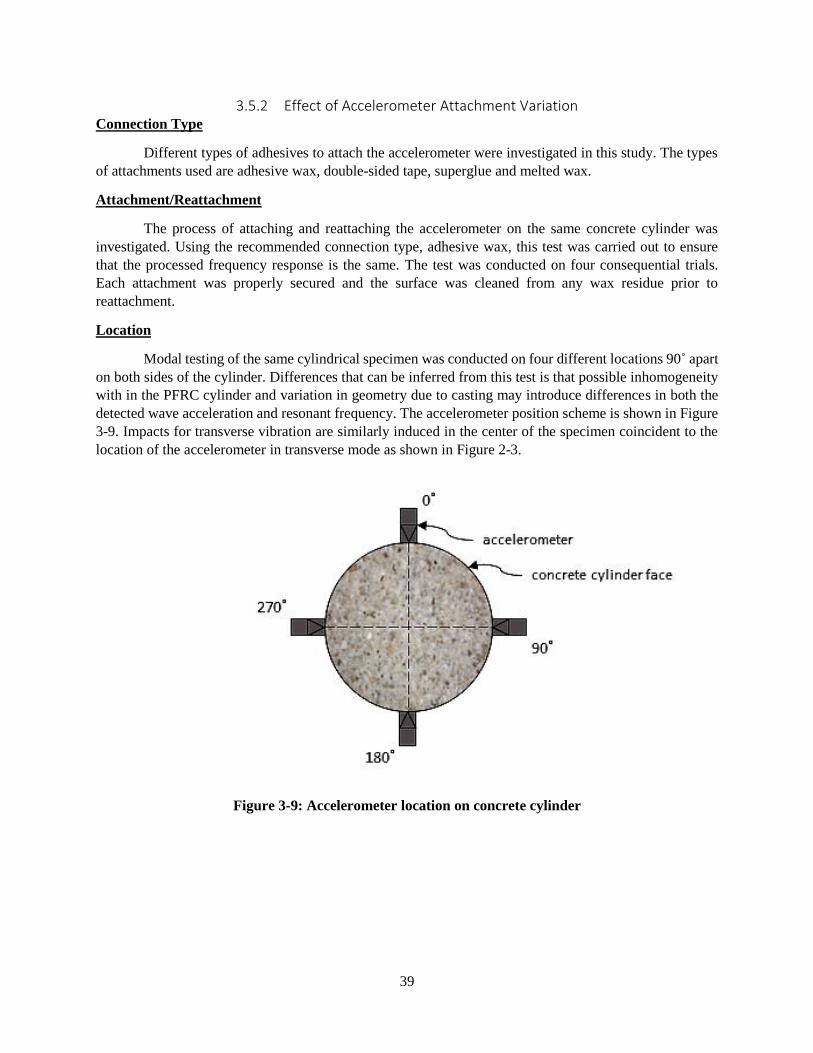
39
3.5.2 Effect of Accelerometer Attachment Variation Connection Type
Different types of adhesives to attach the accelerometer were investigated in this study. The types
of attachments used are adhesive wax, double-sided tape, superglue and melted wax.
Attachment/Reattachment
The process of attaching and reattaching the accelerometer on the same concrete cylinder was
investigated. Using the recommended connection type, adhesive wax, this test was carried out to ensure
that the processed frequency response is the same. The test was conducted on four consequential trials.
Each attachment was properly secured and the surface was cleaned from any wax residue prior to
reattachment.
Location
Modal testing of the same cylindrical specimen was conducted on four different locations 90˚ apart
on both sides of the cylinder. Differences that can be inferred from this test is that possible inhomogeneity
with in the PFRC cylinder and variation in geometry due to casting may introduce differences in both the
detected wave acceleration and resonant frequency. The accelerometer position scheme is shown in Figure
3-9. Impacts for transverse vibration are similarly induced in the center of the specimen coincident to the
location of the accelerometer in transverse mode as shown in Figure 2-3.
Figure 3-9: Accelerometer location on concrete cylinder
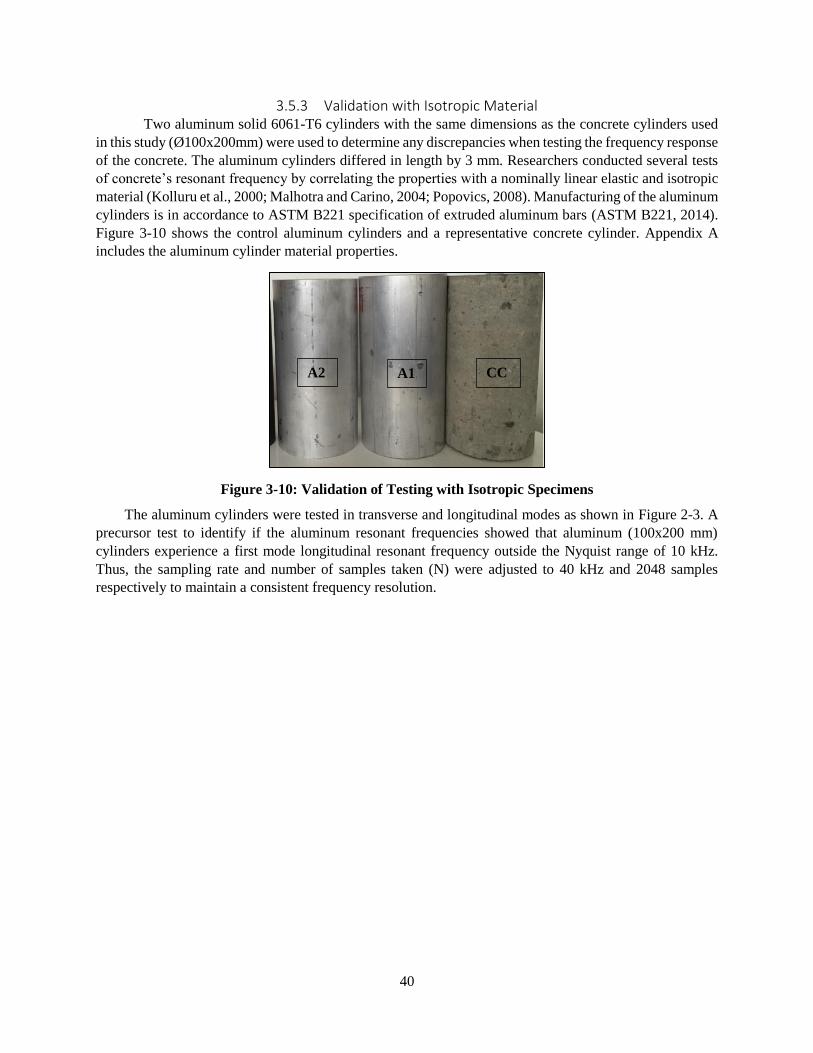
40
3.5.3 Validation with Isotropic Material Two aluminum solid 6061-T6 cylinders with the same dimensions as the concrete cylinders used
in this study (Ø100x200mm) were used to determine any discrepancies when testing the frequency response
of the concrete. The aluminum cylinders differed in length by 3 mm. Researchers conducted several tests
of concrete’s resonant frequency by correlating the properties with a nominally linear elastic and isotropic
material (Kolluru et al., 2000; Malhotra and Carino, 2004; Popovics, 2008). Manufacturing of the aluminum
cylinders is in accordance to ASTM B221 specification of extruded aluminum bars (ASTM B221, 2014).
Figure 3-10 shows the control aluminum cylinders and a representative concrete cylinder. Appendix A
includes the aluminum cylinder material properties.
Figure 3-10: Validation of Testing with Isotropic Specimens
The aluminum cylinders were tested in transverse and longitudinal modes as shown in Figure 2-3. A
precursor test to identify if the aluminum resonant frequencies showed that aluminum (100x200 mm)
cylinders experience a first mode longitudinal resonant frequency outside the Nyquist range of 10 kHz.
Thus, the sampling rate and number of samples taken (N) were adjusted to 40 kHz and 2048 samples
respectively to maintain a consistent frequency resolution.
A2 A1 CC

41
3.5.4 Validation with Existing Models For designing concrete structures, usually concrete compressive strength (fc), and static modulus of
elasticity (Es) are recommended by design codes. Yet, for field measurement, structure condition and
concrete quality assessment, the dynamic modulus of elasticity (Ed) is commonly used. Some models have
been developed by (Balendran, 1993; Han and Kim, 2004; Popovics, 2008; Neville, 2012; Zhou et al., 2015)
which provide a relationship between the pre-mentioned moduli based on multiple design parameters such
as w/c ratio, curing condition and aggregate size and volume.
The static modulus of elasticity can be estimated from its compressive strength. The relationship
between fc and Es is recommended by numerous standardized guidelines shown in Table 3-7. These models
are used along with linear Ed estimation from Es to assess the experimental Ed longitudinal moduli and
compressive strength.
Table 3-7: Existing models based on the relationship between the compressive strength, static and
dynamic moduli of elasticity of concrete
Reference Equation Units
ACI 318 𝐸𝑠 = 4700√𝑓𝑐 𝐸𝑠: MPa 𝑓𝑐:MPa
ACI 363 𝐸𝑠 = 3300√𝑓𝑐 + 6900 𝐸𝑠: MPa 𝑓𝑐:MPa
CSA A23.3 𝐸𝑠 = 4500√𝑓𝑐 𝐸𝑠: MPa 𝑓𝑐:MPa
EC-2 𝐸𝑠 = 22(𝑓𝑐
10)0.3 𝐸𝑠: GPa 𝑓𝑐:MPa
(Noguchi et al., 2009) 𝐸𝑠 = 3.35×10⁴(𝑘1. 𝑘2) (𝜌
2400)
2
(𝑓𝑐
60)
13
𝐸𝑠: GPa 𝑓𝑐:MPa
𝑘1 & 𝑘2: experimental constants
(Neville, 2012) 𝐸𝑠 = 1.25𝐸𝑑 − 19 𝐸𝑠: GPa 𝐸𝑑:GPa
(Balendran, 1993) 𝐸𝑠 = 0.83𝐸𝑑 𝐸𝑠: GPa 𝐸𝑑:GPa
(Popovics, 2008) 𝐸𝑠 =446.09𝐸𝑑
1.4
𝜌 𝐸𝑠: GPa 𝐸𝑑:GPa 𝜌: kg/m3
(Jin and Li, 2001) 𝐸𝑑 = 7.077(𝑓𝑐)0.4467 𝐸𝑑: GPa 𝑓𝑐:MPa
These models estimate (Es) using empirical equations and the experimental dynamic modulus of
elasticity results. They also define the static modulus of elasticity (Es), using the compressive strength,
density, and/or dynamic elastic modulus properties of concrete. The models were chosen for their practical
reliability for comparison of concrete specimens however, empirical equations may be inaccurate when
compared to direct measurement values. Some codes may have an error of estimation up to 60% with low
strength concrete (Yildirim, 2011).
The ratio of the static to dynamic modulus of elasticity increases with higher concrete strength
(Popovics, 2008). Popovics proposed the best prediction of the dynamic modulus of elastic of high strength
concrete (Popovics, 2008). Also, the method advised by (Swamy and Rigby, 1971) provides a relation
between the static (𝐸𝑠) and dynamic (𝐸𝑑) elastic modulus of concrete (Neville, 2012). Currently, the
equation is addressed in the British Testing Standard – BS 1992-1-1:2004 (British Standard BS EN 1992-
1-1, 2004). This equation does not apply for lightweight concrete and concrete having more than 500 Kg/
m3 of cement (Neville, 2012; Popovics, 2008).
(Noguchi et al., 2009) model estimates the elastic modulus of concrete by statistically analyzing
more than 3000 datasets from various types of concrete considering the types of coarse aggregates, mineral
admixtures, and density of concrete. The authors defined a correction factor, K1, in their equation
considering the effect of different types of coarse aggregates on the modulus of elasticity of concrete, as
reported in Table 3-8.
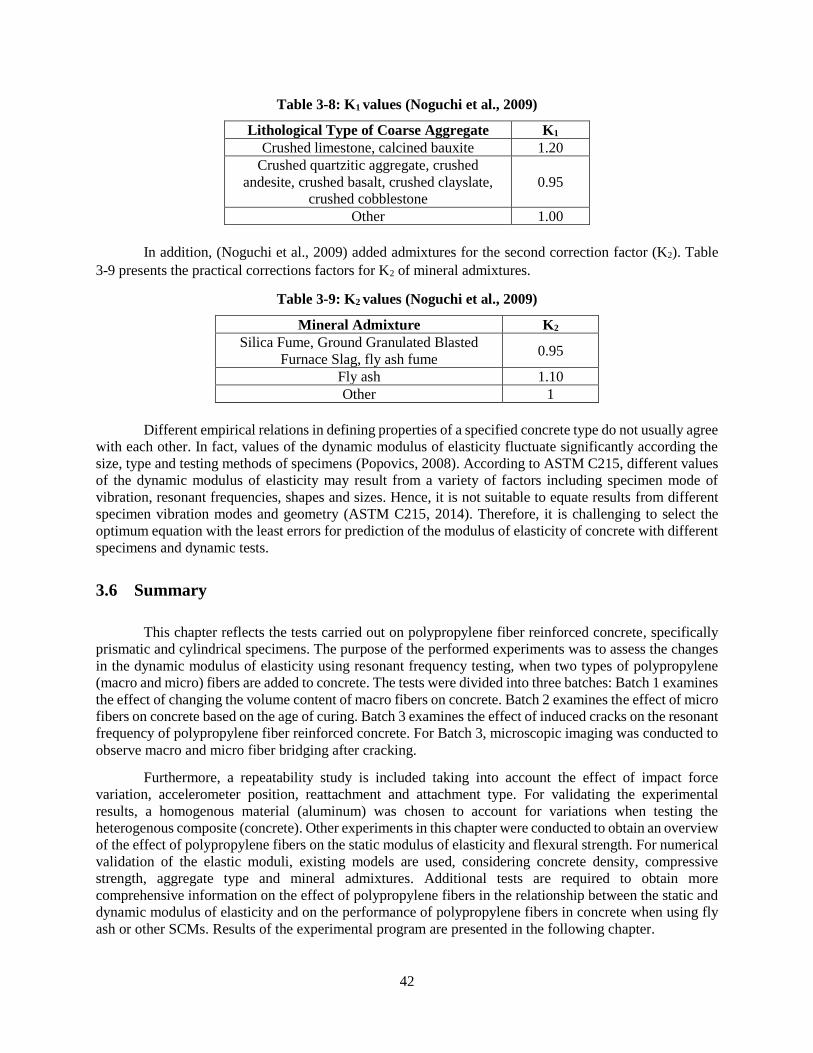
42
Table 3-8: K1 values (Noguchi et al., 2009)
Lithological Type of Coarse Aggregate K1
Crushed limestone, calcined bauxite 1.20
Crushed quartzitic aggregate, crushed
andesite, crushed basalt, crushed clayslate,
crushed cobblestone
0.95
Other 1.00
In addition, (Noguchi et al., 2009) added admixtures for the second correction factor (K2). Table
3-9 presents the practical corrections factors for K2 of mineral admixtures.
Table 3-9: K2 values (Noguchi et al., 2009)
Mineral Admixture K2
Silica Fume, Ground Granulated Blasted
Furnace Slag, fly ash fume 0.95
Fly ash 1.10
Other 1
Different empirical relations in defining properties of a specified concrete type do not usually agree
with each other. In fact, values of the dynamic modulus of elasticity fluctuate significantly according the
size, type and testing methods of specimens (Popovics, 2008). According to ASTM C215, different values
of the dynamic modulus of elasticity may result from a variety of factors including specimen mode of
vibration, resonant frequencies, shapes and sizes. Hence, it is not suitable to equate results from different
specimen vibration modes and geometry (ASTM C215, 2014). Therefore, it is challenging to select the
optimum equation with the least errors for prediction of the modulus of elasticity of concrete with different
specimens and dynamic tests.
3.6 Summary
This chapter reflects the tests carried out on polypropylene fiber reinforced concrete, specifically
prismatic and cylindrical specimens. The purpose of the performed experiments was to assess the changes
in the dynamic modulus of elasticity using resonant frequency testing, when two types of polypropylene
(macro and micro) fibers are added to concrete. The tests were divided into three batches: Batch 1 examines
the effect of changing the volume content of macro fibers on concrete. Batch 2 examines the effect of micro
fibers on concrete based on the age of curing. Batch 3 examines the effect of induced cracks on the resonant
frequency of polypropylene fiber reinforced concrete. For Batch 3, microscopic imaging was conducted to
observe macro and micro fiber bridging after cracking.
Furthermore, a repeatability study is included taking into account the effect of impact force
variation, accelerometer position, reattachment and attachment type. For validating the experimental
results, a homogenous material (aluminum) was chosen to account for variations when testing the
heterogenous composite (concrete). Other experiments in this chapter were conducted to obtain an overview
of the effect of polypropylene fibers on the static modulus of elasticity and flexural strength. For numerical
validation of the elastic moduli, existing models are used, considering concrete density, compressive
strength, aggregate type and mineral admixtures. Additional tests are required to obtain more
comprehensive information on the effect of polypropylene fibers in the relationship between the static and
dynamic modulus of elasticity and on the performance of polypropylene fibers in concrete when using fly
ash or other SCMs. Results of the experimental program are presented in the following chapter.
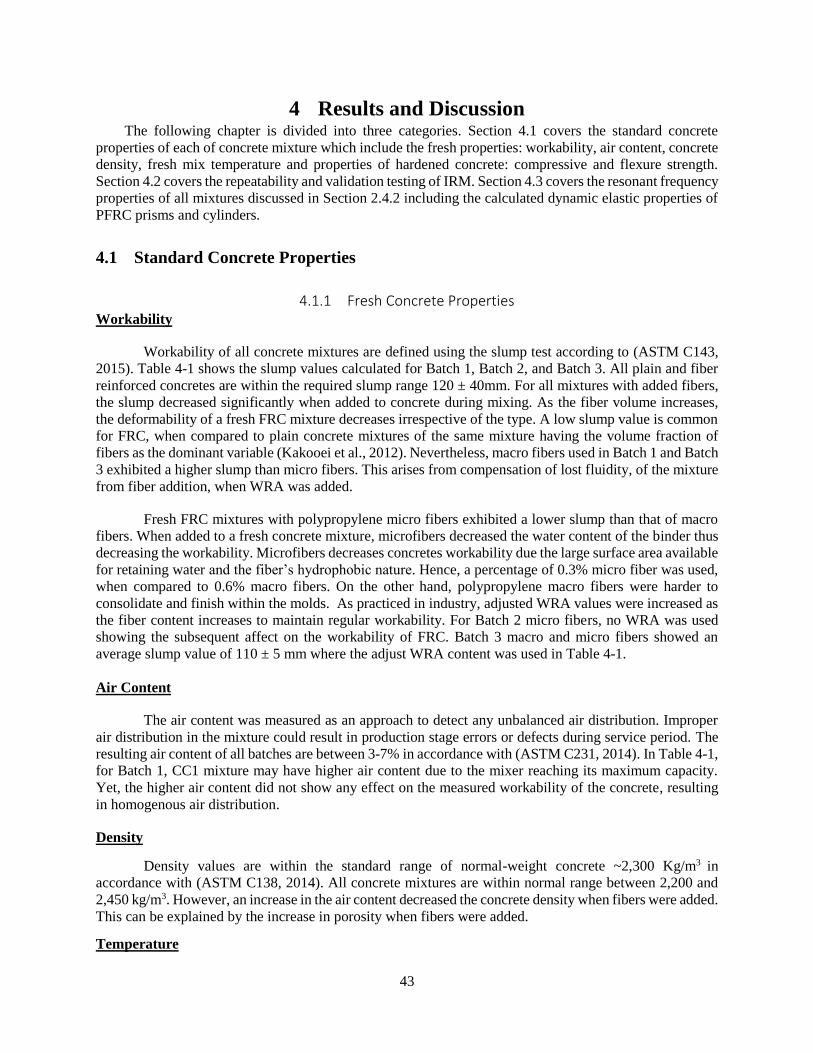
43
4 Results and Discussion The following chapter is divided into three categories. Section 4.1 covers the standard concrete
properties of each of concrete mixture which include the fresh properties: workability, air content, concrete
density, fresh mix temperature and properties of hardened concrete: compressive and flexure strength.
Section 4.2 covers the repeatability and validation testing of IRM. Section 4.3 covers the resonant frequency
properties of all mixtures discussed in Section 2.4.2 including the calculated dynamic elastic properties of
PFRC prisms and cylinders.
4.1 Standard Concrete Properties
4.1.1 Fresh Concrete Properties Workability
Workability of all concrete mixtures are defined using the slump test according to (ASTM C143,
2015). Table 4-1 shows the slump values calculated for Batch 1, Batch 2, and Batch 3. All plain and fiber
reinforced concretes are within the required slump range 120 ± 40mm. For all mixtures with added fibers,
the slump decreased significantly when added to concrete during mixing. As the fiber volume increases,
the deformability of a fresh FRC mixture decreases irrespective of the type. A low slump value is common
for FRC, when compared to plain concrete mixtures of the same mixture having the volume fraction of
fibers as the dominant variable (Kakooei et al., 2012). Nevertheless, macro fibers used in Batch 1 and Batch
3 exhibited a higher slump than micro fibers. This arises from compensation of lost fluidity, of the mixture
from fiber addition, when WRA was added.
Fresh FRC mixtures with polypropylene micro fibers exhibited a lower slump than that of macro
fibers. When added to a fresh concrete mixture, microfibers decreased the water content of the binder thus
decreasing the workability. Microfibers decreases concretes workability due the large surface area available
for retaining water and the fiber’s hydrophobic nature. Hence, a percentage of 0.3% micro fiber was used,
when compared to 0.6% macro fibers. On the other hand, polypropylene macro fibers were harder to
consolidate and finish within the molds. As practiced in industry, adjusted WRA values were increased as
the fiber content increases to maintain regular workability. For Batch 2 micro fibers, no WRA was used
showing the subsequent affect on the workability of FRC. Batch 3 macro and micro fibers showed an
average slump value of 110 ± 5 mm where the adjust WRA content was used in Table 4-1.
Air Content
The air content was measured as an approach to detect any unbalanced air distribution. Improper
air distribution in the mixture could result in production stage errors or defects during service period. The
resulting air content of all batches are between 3-7% in accordance with (ASTM C231, 2014). In Table 4-1,
for Batch 1, CC1 mixture may have higher air content due to the mixer reaching its maximum capacity.
Yet, the higher air content did not show any effect on the measured workability of the concrete, resulting
in homogenous air distribution.
Density
Density values are within the standard range of normal-weight concrete ~2,300 Kg/m3 in
accordance with (ASTM C138, 2014). All concrete mixtures are within normal range between 2,200 and
2,450 kg/m3. However, an increase in the air content decreased the concrete density when fibers were added.
This can be explained by the increase in porosity when fibers were added.
Temperature
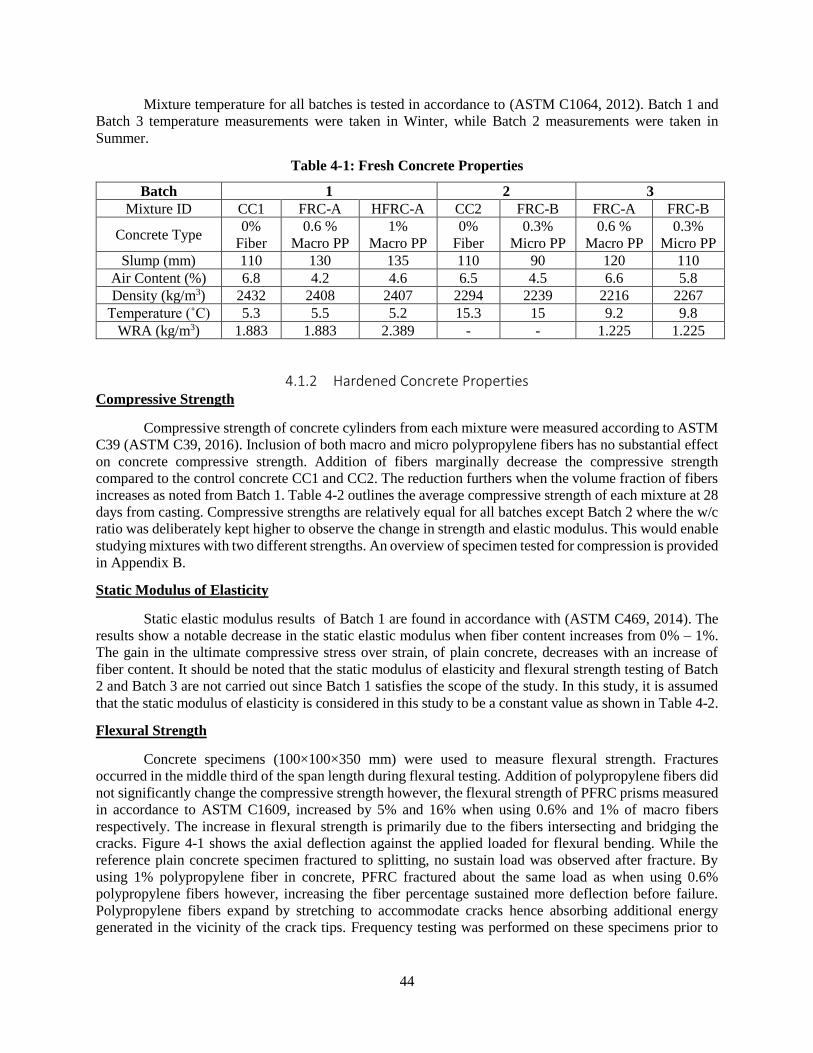
44
Mixture temperature for all batches is tested in accordance to (ASTM C1064, 2012). Batch 1 and
Batch 3 temperature measurements were taken in Winter, while Batch 2 measurements were taken in
Summer.
Table 4-1: Fresh Concrete Properties
Batch 1 2 3
Mixture ID CC1 FRC-A HFRC-A CC2 FRC-B FRC-A FRC-B
Concrete Type 0%
Fiber
0.6 %
Macro PP
1%
Macro PP
0%
Fiber
0.3%
Micro PP
0.6 %
Macro PP
0.3%
Micro PP
Slump (mm) 110 130 135 110 90 120 110
Air Content (%) 6.8 4.2 4.6 6.5 4.5 6.6 5.8
Density (kg/m3) 2432 2408 2407 2294 2239 2216 2267
Temperature (˚C) 5.3 5.5 5.2 15.3 15 9.2 9.8
WRA (kg/m3) 1.883 1.883 2.389 - - 1.225 1.225
4.1.2 Hardened Concrete Properties Compressive Strength
Compressive strength of concrete cylinders from each mixture were measured according to ASTM
C39 (ASTM C39, 2016). Inclusion of both macro and micro polypropylene fibers has no substantial effect
on concrete compressive strength. Addition of fibers marginally decrease the compressive strength
compared to the control concrete CC1 and CC2. The reduction furthers when the volume fraction of fibers
increases as noted from Batch 1. Table 4-2 outlines the average compressive strength of each mixture at 28
days from casting. Compressive strengths are relatively equal for all batches except Batch 2 where the w/c
ratio was deliberately kept higher to observe the change in strength and elastic modulus. This would enable
studying mixtures with two different strengths. An overview of specimen tested for compression is provided
in Appendix B.
Static Modulus of Elasticity
Static elastic modulus results of Batch 1 are found in accordance with (ASTM C469, 2014). The
results show a notable decrease in the static elastic modulus when fiber content increases from 0% – 1%.
The gain in the ultimate compressive stress over strain, of plain concrete, decreases with an increase of
fiber content. It should be noted that the static modulus of elasticity and flexural strength testing of Batch
2 and Batch 3 are not carried out since Batch 1 satisfies the scope of the study. In this study, it is assumed
that the static modulus of elasticity is considered in this study to be a constant value as shown in Table 4-2.
Flexural Strength
Concrete specimens (100×100×350 mm) were used to measure flexural strength. Fractures
occurred in the middle third of the span length during flexural testing. Addition of polypropylene fibers did
not significantly change the compressive strength however, the flexural strength of PFRC prisms measured
in accordance to ASTM C1609, increased by 5% and 16% when using 0.6% and 1% of macro fibers
respectively. The increase in flexural strength is primarily due to the fibers intersecting and bridging the
cracks. Figure 4-1 shows the axial deflection against the applied loaded for flexural bending. While the
reference plain concrete specimen fractured to splitting, no sustain load was observed after fracture. By
using 1% polypropylene fiber in concrete, PFRC fractured about the same load as when using 0.6%
polypropylene fibers however, increasing the fiber percentage sustained more deflection before failure.
Polypropylene fibers expand by stretching to accommodate cracks hence absorbing additional energy
generated in the vicinity of the crack tips. Frequency testing was performed on these specimens prior to

45
fracturing the prisms. Residual strength, toughness and other flexure parameters are not addressed in this
study.
Figure 4-1: Batch 1 - Flexural strength of 0%, 0.6% and 1% PFRC
Table 4-2: Hardened Concrete Properties
Batch 1 2 3
Concrete Type 0%
Fiber
0.6 %
Macro PP
1%
Macro PP
0%
Fiber
0.3%
Micro PP
0.6 %
Macro PP
0.3%
Micro PP
Average Compressive Strength
(MPa) 33.21 32.67 30.33 30.34 33.40 31.55 34.91
Static Modulus of Elasticity
(MPa) 27957 21075 18245
Flexural Strength
(MPa) 4.19 6.63 6.32
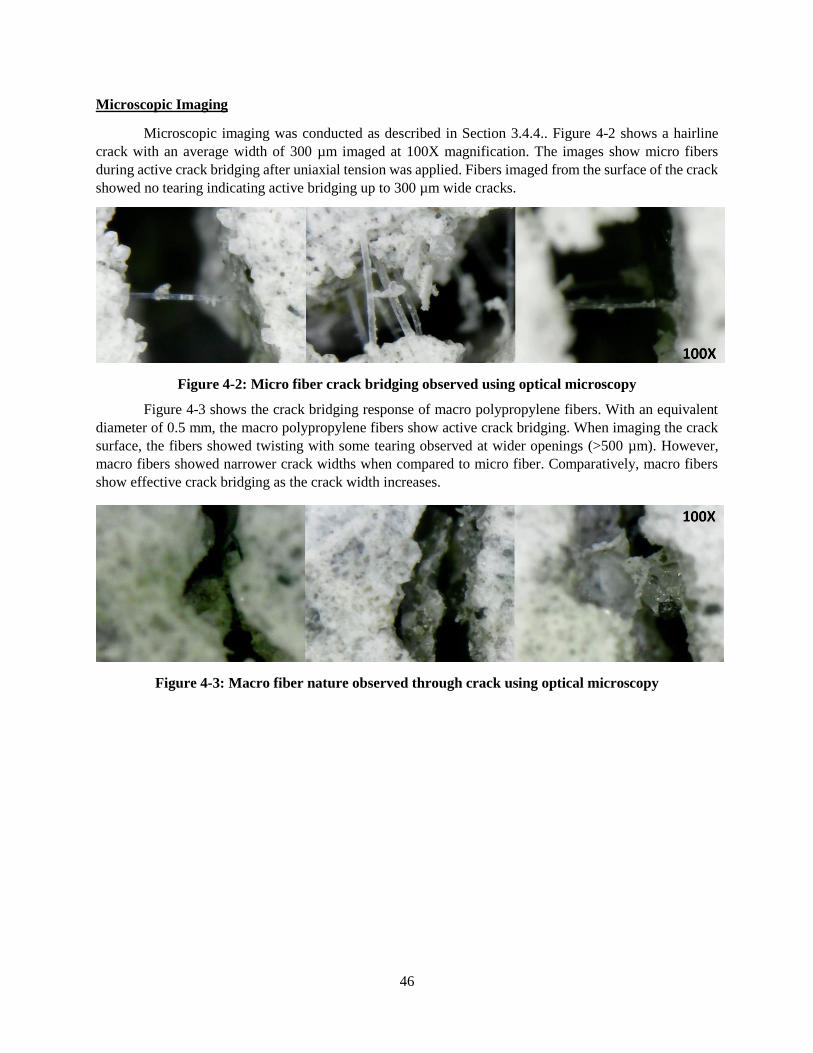
46
Microscopic Imaging
Microscopic imaging was conducted as described in Section 3.4.4.. Figure 4-2 shows a hairline
crack with an average width of 300 µm imaged at 100X magnification. The images show micro fibers
during active crack bridging after uniaxial tension was applied. Fibers imaged from the surface of the crack
showed no tearing indicating active bridging up to 300 µm wide cracks.
Figure 4-2: Micro fiber crack bridging observed using optical microscopy
Figure 4-3 shows the crack bridging response of macro polypropylene fibers. With an equivalent
diameter of 0.5 mm, the macro polypropylene fibers show active crack bridging. When imaging the crack
surface, the fibers showed twisting with some tearing observed at wider openings (>500 µm). However,
macro fibers showed narrower crack widths when compared to micro fiber. Comparatively, macro fibers
show effective crack bridging as the crack width increases.
Figure 4-3: Macro fiber nature observed through crack using optical microscopy

47
4.2 Repeatability
4.2.1 Effect of Force Variation A series of three hard, three medium and three light impacts were applied to a sample concrete
cylinder as discussed in Section 3.5.1. Figure 4-4 shows the resultant frequency response of the impact
forces. Response amplitude varied significantly showing a descending trend from high to low impacts.
However, the resonant frequency presented clear independence from the applied load averaging at 5265 ±
10Hz. The frequency dispersion of the impacts given by the Coefficient of Variation (CV) is 1.8%. A
statistical overview is presented in Appendix D.
Figure 4-4: Effect of force variation on frequency response
From Table 4-3, the results show that high load impacts resulted in a slightly lower frequency (~20
Hz) than both medium and low load impacts. As high impacts exhibit a higher damping rate, the sampling
window may not have captured the full extent of the wave attenuation thus, lowering the detected frequency
of the full wave. Note that the frequency resolution of 19.5 Hz is the shift between the lower and higher
impact frequencies. The shift will decrease as the resolution is refined. For refining the resolution, the
sampling frequency (20 kHz) should be halved (10kHz) while having the same number of samples. Note
that by doing this, the required Nyquist frequency domain is also halved (5 kHz). This will affect the result
through frequency aliasing and will not detect the true resonant frequency. A sampling rate of 80 kHz can
be used with 2048 number of samples; however, the accelerometer is limited to a maximum frequency of
15 kHz.
Table 4-3: Resonant frequency response of high, medium, and low impacts
Impact High Medium Low
Designation H1 H2 H3 M1 M2 M3 L1 L2 L3
Magnitude 0.59 0.53 0.25 0.07 0.08 0.06 0.05 0.02 0.02
Frequency (Hz) 5253.91 5253.91 5253.91 5273.44 5273.44 5253.91 5273.44 5273.44 5273.44
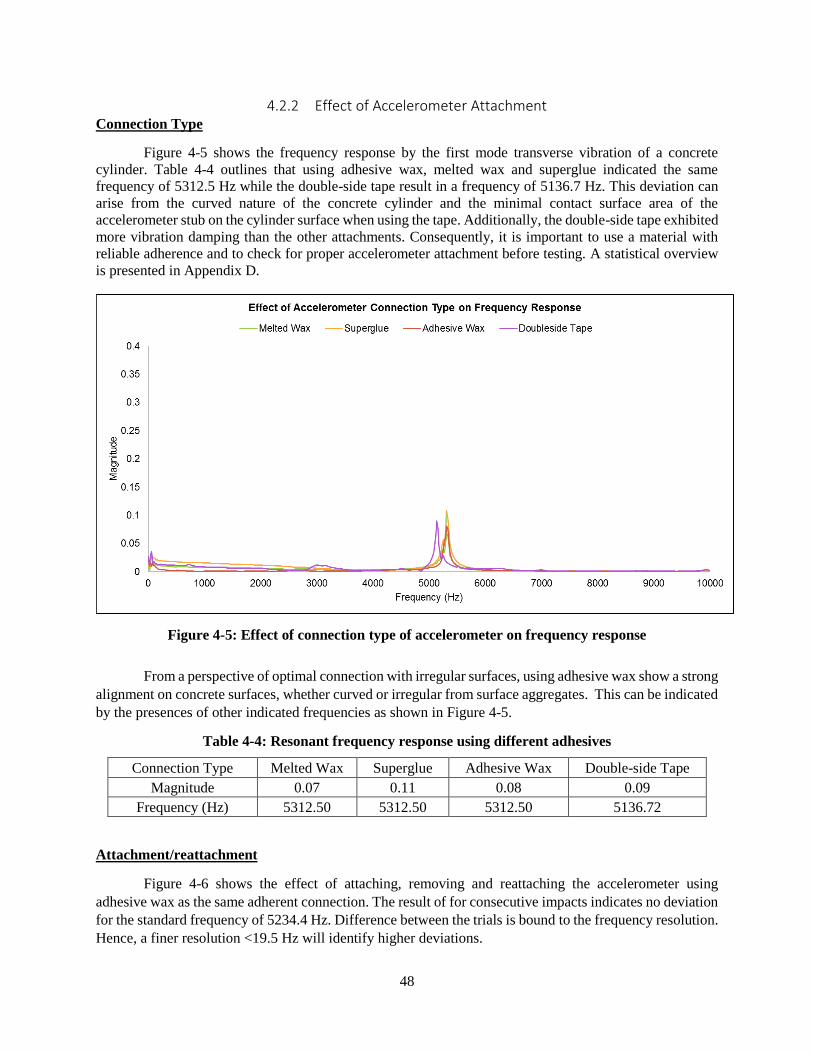
48
4.2.2 Effect of Accelerometer Attachment Connection Type
Figure 4-5 shows the frequency response by the first mode transverse vibration of a concrete
cylinder. Table 4-4 outlines that using adhesive wax, melted wax and superglue indicated the same
frequency of 5312.5 Hz while the double-side tape result in a frequency of 5136.7 Hz. This deviation can
arise from the curved nature of the concrete cylinder and the minimal contact surface area of the
accelerometer stub on the cylinder surface when using the tape. Additionally, the double-side tape exhibited
more vibration damping than the other attachments. Consequently, it is important to use a material with
reliable adherence and to check for proper accelerometer attachment before testing. A statistical overview
is presented in Appendix D.
Figure 4-5: Effect of connection type of accelerometer on frequency response
From a perspective of optimal connection with irregular surfaces, using adhesive wax show a strong
alignment on concrete surfaces, whether curved or irregular from surface aggregates. This can be indicated
by the presences of other indicated frequencies as shown in Figure 4-5.
Table 4-4: Resonant frequency response using different adhesives
Connection Type Melted Wax Superglue Adhesive Wax Double-side Tape
Magnitude 0.07 0.11 0.08 0.09
Frequency (Hz) 5312.50 5312.50 5312.50 5136.72
Attachment/reattachment
Figure 4-6 shows the effect of attaching, removing and reattaching the accelerometer using
adhesive wax as the same adherent connection. The result of for consecutive impacts indicates no deviation
for the standard frequency of 5234.4 Hz. Difference between the trials is bound to the frequency resolution.
Hence, a finer resolution <19.5 Hz will identify higher deviations.

49
Figure 4-6: Effect of attachment/reattachment of accelerometer on frequency response
Location
Figure 4-7 shows the frequency response of transverse excitation at eight different nodes (four per
cylinder side) around a concrete cylinder as described in Section 3.5.2. The magnitude of the frequency
response varied significantly for each node. This can result from both the difference in impact load,
orientation of accelerometer and differential density in the specimen at the location testing. The average
resonant frequency obtained for the nodes is 5288 ± 25Hz for the frequency values shown for each rotation
angle in Table 4-5. Difference in the frequency can arise from the composite nature of concrete whereby
any difference in specific gravity will cause a shift in the resonant frequency.
Table 4-5: Resonant frequency response by changing accelerometer position
Location around cylinder 0˚ 90˚ 180˚ 270˚
Magnitude 0.08 0.29 0.11 0.31
Frequency (Hz) 5273.44 5312.50 5253.91 5312.50
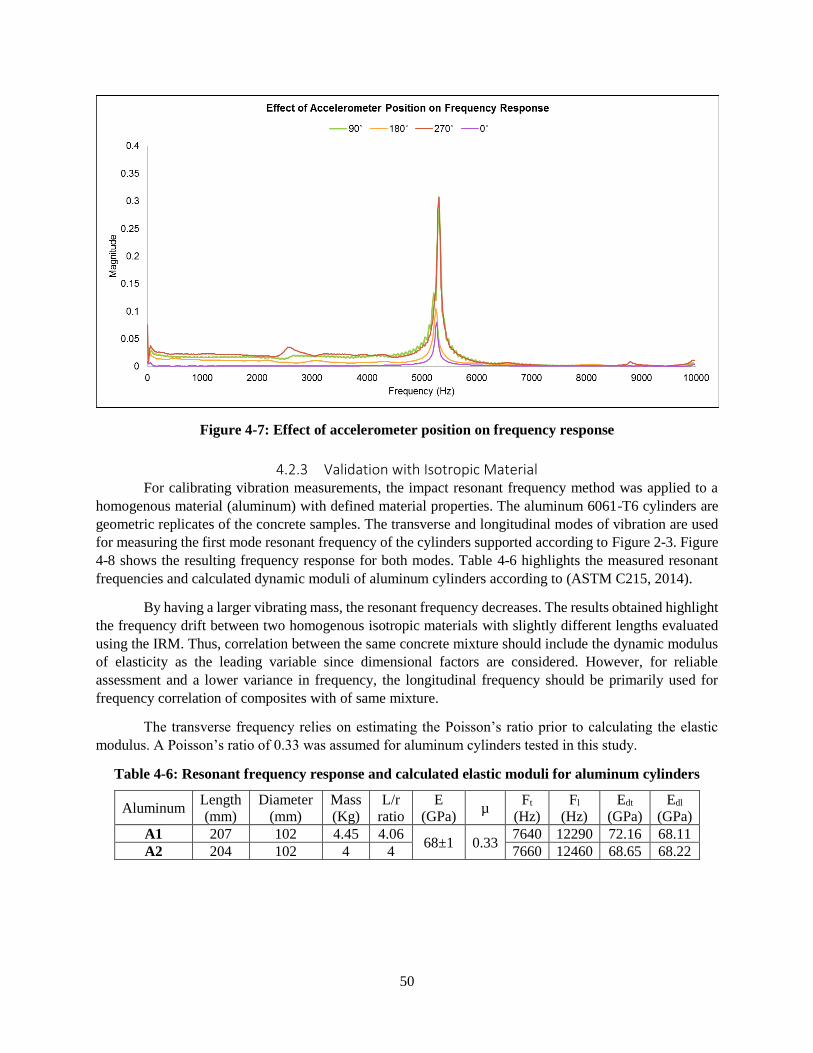
50
Figure 4-7: Effect of accelerometer position on frequency response
4.2.3 Validation with Isotropic Material For calibrating vibration measurements, the impact resonant frequency method was applied to a
homogenous material (aluminum) with defined material properties. The aluminum 6061-T6 cylinders are
geometric replicates of the concrete samples. The transverse and longitudinal modes of vibration are used
for measuring the first mode resonant frequency of the cylinders supported according to Figure 2-3. Figure
4-8 shows the resulting frequency response for both modes. Table 4-6 highlights the measured resonant
frequencies and calculated dynamic moduli of aluminum cylinders according to (ASTM C215, 2014).
By having a larger vibrating mass, the resonant frequency decreases. The results obtained highlight
the frequency drift between two homogenous isotropic materials with slightly different lengths evaluated
using the IRM. Thus, correlation between the same concrete mixture should include the dynamic modulus
of elasticity as the leading variable since dimensional factors are considered. However, for reliable
assessment and a lower variance in frequency, the longitudinal frequency should be primarily used for
frequency correlation of composites with of same mixture.
The transverse frequency relies on estimating the Poisson’s ratio prior to calculating the elastic
modulus. A Poisson’s ratio of 0.33 was assumed for aluminum cylinders tested in this study.
Table 4-6: Resonant frequency response and calculated elastic moduli for aluminum cylinders
Aluminum Length
(mm)
Diameter
(mm)
Mass
(Kg)
L/r
ratio
E
(GPa) µ
Ft
(Hz)
Fl
(Hz)
Edt
(GPa)
Edl
(GPa)
A1 207 102 4.45 4.06 68±1 0.33
7640 12290 72.16 68.11
A2 204 102 4 4 7660 12460 68.65 68.22

51
Figure 4-8: Transverse and Longitudinal Frequency Response of Aluminum Cylinders
Both aluminum cylinders exhibit similar properties in the first mode resonant frequencies in the
transverse and longitudinal modes of vibration. The difference between the cylinders for the transverse
frequencies is 20 Hz while the longitudinal is 175 Hz. Since A1 is almost 3 mm longer than A2, for the
same diameter, the elastic modulus increases as the overall mass increases. Amplitudes for the frequency
response rely on the impact force applied during testing. The elastic moduli calculated from Section 2.4.3
are proportional to the detected frequencies. Comparing the transverse elastic modulus between A1 and A2
is dependent on the correction factor (T) and therefore shows an over estimation as formerly studied
(Popovics, 2008). The transverse modulus using ASTM C215 showed an over estimation of ~2GPa when
the L/D ratio was modified. Yet, the longitudinal moduli seemed to be more consistent regarding the ratio.
Hence. the L/D ratio is important to consider for comparing the two moduli of the same material.
4.2.4 Summary The repeatability studies outline several factors to consider when performing IRM. The type of
material used for attaching the accelerometer, adherent contact and position may affect the resulting
frequency response; hence, affecting the proportional dynamic modulus of elasticity. However, the effect
is more prominent on the viscous component of vibration or amplitude. The amplitude is more sensitive to
the applied load, accelerometer position and attachment. To maintain controlled resonant frequency testing,
the latter should be considered for consistent results. Although, the maximum percentage change in
transverse and longitudinal frequencies are 0.69% and 0.13% respectively. Nevertheless, this would result
in a percentage change in the transverse and longitudinal elastic modulus of 2.49% and 0.08% respectively.
However, it is important to consider that the sample mass and length had a slight difference as noted in
Table 4-6. The resulting dynamic elastic values are reliably acceptable given the typical %CV in various
concrete related tests.

52
4.3 Dynamic Elastic Properties of Concrete
This section is divided between the experimentally tested resonant frequency of all batches and the
calculated dynamic elastic properties considering concrete mass and dimensional variation. A full layout
of the results is provided in Appendix C.
4.3.1 Resonant Frequency The resonant frequencies for concrete prisms and cylinders of three batches were evaluated using
the IRM discussed in Section 2.4.4.2. Tests were conducted according to (ASTM C215, 2014). Resonant
frequency results were measured to the nearest 10 Hz as per the standard. In general, the results show that
both macro (Type A) and micro (Type B) polypropylene fibers decrease the resonant frequency of PFRC
when compared to plain concrete of the same mixture. Moreover, for the same type of concrete, as the
specimen size increases, the resonant frequency decreases. Although this study includes lab developed
samples that are studied using low impact excitation at higher frequencies, the recognition of frequency
variation for any given sample is achievable. Some limitations arise from both averaging and resolution of
frequency since there is a finite number of samples, or bins, to generate the frequency domain.
Table 4-7 shows the first mode fundamental resonant frequencies of prismatic specimens in this
study. For Batch 1 (100×100×350) and Batch 2 (150×150×550) prisms, the transverse, longitudinal and
torsional mode of vibration were tested at 28 days. The results indicate the increase in resonant frequencies
with a decrease of the specimen size. Variation in frequency between samples of the same mixture can be
a product of difference in a length and frequency resolution. Only prisms were used to measure the resonant
frequencies in the torsional direction since cylinder testing exhibits complex support requirements that
affect the results.
Table 4-7: Transverse, longitudinal and torsional resonant frequency of PFRC specimens
Batch ID Resonant Frequency (Hz)
Transverse Longitudinal Torsional
Prisms: B1 (100×100×350 mm)/B2 (150×150×550 mm)
1
CC1 2823±47 6177±25 3573±35
FRC - A 2850±105 6100±53 3537±25
HFRC - A 2703±55 6000±36 3360±72
2 CC2 1650±26 3583±25 2070±0
FRC - B 1600±26 3440±40 2000±20
Cylinders: (Ø100×200 mm)
1
CC1 6017±15 9827±231
FRC - A 5927±6 9717±146
HFRC - A 5577±15 9317±15
2 CC2 6086±71 9750±53
FRC - B 5780±26 9303±80
3 FRC - A 5760±35 9407±37
FRC - B 5943±24 9747± 9
Batch 1: concrete mixture was used to investigate the effect of adding polypropylene synthetic
fiber on the frequency response of concrete by increasing macro fiber volume fraction. No significant

53
variation in the resonant frequency results were observed for the samples of the same concrete mixture.
This is a good indicator for having consistent measurement for each mixture. This is specified by the
coefficient of variation (CV), for plain concrete (CC1) <0.02%; yet slightly higher for NFRC and PFRC
<0.04%. Figure 4-9 and Figure 4-10 show the resonant frequency measured for control plain concrete
(CC1), 0.6% polypropylene fiber reinforced concrete (NFRC) and 1% polypropylene fiber reinforced
concrete (HFRC).
From Figure 4-9 and Figure 4-10, addition of 0.6% and 1% fiber slightly decreased the resonant
frequency of PFRC. However, this is not the same for CC1 and NFRC prisms as shown in Table 4-7. The
resonant frequency average of NFRC is slightly higher than CC1. This is due to fact that the resonant
frequency depends on the vibration mode and density of the concrete samples. In addition, the density of
polypropylene is lower than that of the aggregates and cement matrix. This agrees with the work of (Leung
and Balendran, 2002) discussed previously in Section 2.5. Also, these results add to identifying more
prominent changes of PFRC when the volume percentage is altered.
Figure 4-9: Batch 1 - Resonant Frequency of PFRC prisms with 0%, 0.6% and 1% macro PP fiber
Figure 4-10: Batch 1 - Resonant Frequency of PFRC cylinders with 0%, 0.6% and 1%
macro PP fiber
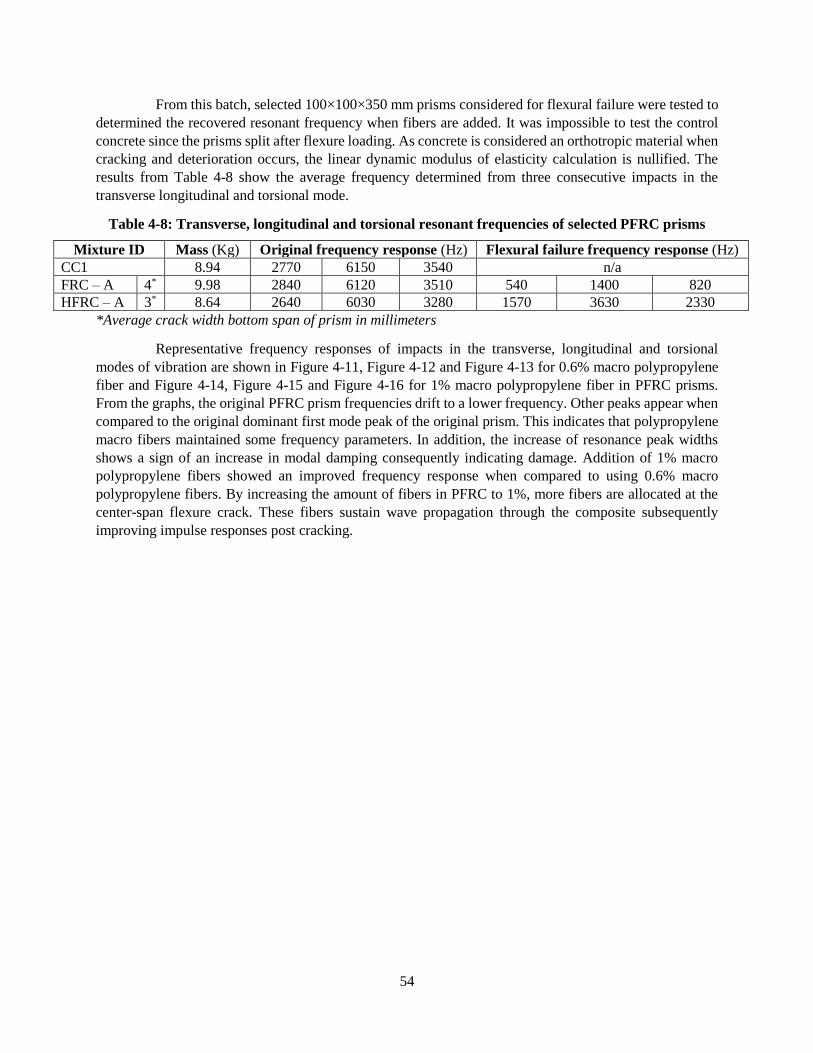
54
From this batch, selected 100×100×350 mm prisms considered for flexural failure were tested to
determined the recovered resonant frequency when fibers are added. It was impossible to test the control
concrete since the prisms split after flexure loading. As concrete is considered an orthotropic material when
cracking and deterioration occurs, the linear dynamic modulus of elasticity calculation is nullified. The
results from Table 4-8 show the average frequency determined from three consecutive impacts in the
transverse longitudinal and torsional mode.
Table 4-8: Transverse, longitudinal and torsional resonant frequencies of selected PFRC prisms
Mixture ID Mass (Kg) Original frequency response (Hz) Flexural failure frequency response (Hz)
CC1 8.94 2770 6150 3540 n/a
FRC – A 4* 9.98 2840 6120 3510 540 1400 820
HFRC – A 3* 8.64 2640 6030 3280 1570 3630 2330
*Average crack width bottom span of prism in millimeters
Representative frequency responses of impacts in the transverse, longitudinal and torsional
modes of vibration are shown in Figure 4-11, Figure 4-12 and Figure 4-13 for 0.6% macro polypropylene
fiber and Figure 4-14, Figure 4-15 and Figure 4-16 for 1% macro polypropylene fiber in PFRC prisms.
From the graphs, the original PFRC prism frequencies drift to a lower frequency. Other peaks appear when
compared to the original dominant first mode peak of the original prism. This indicates that polypropylene
macro fibers maintained some frequency parameters. In addition, the increase of resonance peak widths
shows a sign of an increase in modal damping consequently indicating damage. Addition of 1% macro
polypropylene fibers showed an improved frequency response when compared to using 0.6% macro
polypropylene fibers. By increasing the amount of fibers in PFRC to 1%, more fibers are allocated at the
center-span flexure crack. These fibers sustain wave propagation through the composite subsequently
improving impulse responses post cracking.
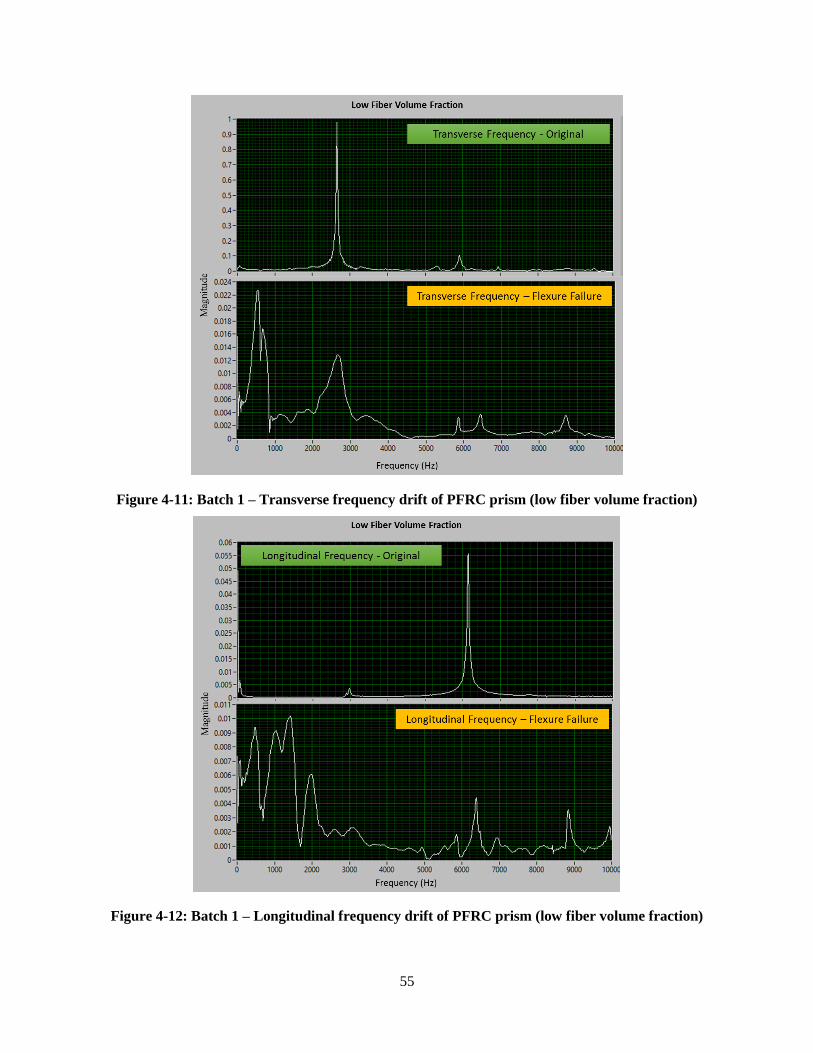
55
Figure 4-11: Batch 1 – Transverse frequency drift of PFRC prism (low fiber volume fraction)
Figure 4-12: Batch 1 – Longitudinal frequency drift of PFRC prism (low fiber volume fraction)
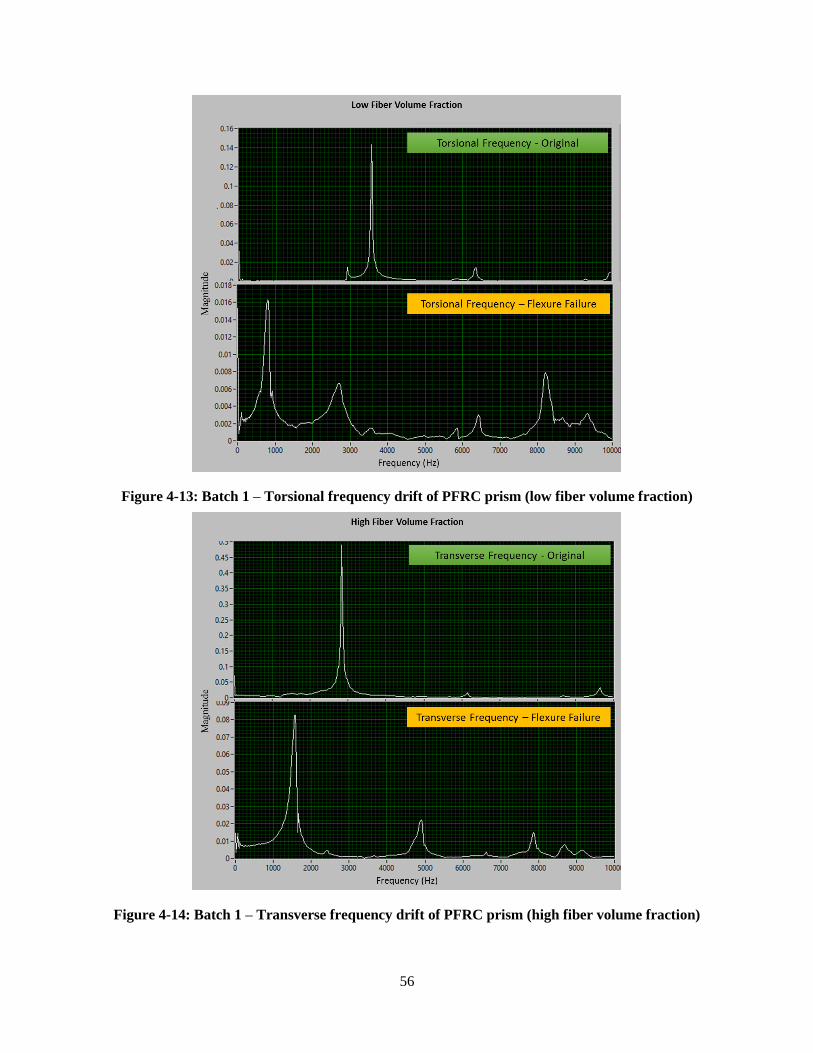
56
Figure 4-13: Batch 1 – Torsional frequency drift of PFRC prism (low fiber volume fraction)
Figure 4-14: Batch 1 – Transverse frequency drift of PFRC prism (high fiber volume fraction)

57
Figure 4-15: Batch 1 – Transverse frequency drift of PFRC prism (high fiber volume fraction)
Figure 4-16: Batch 1 – Torsional frequency drift of PFRC prism (high fiber volume fraction)

58
Batch 2: This concrete mixture was used to investigate the effect of adding polypropylene micro
fiber on the frequency response of concrete with age. Based on the analysed results, there is no noticeable
variation in the resonant frequency results for the samples of the same concrete mixture. For plain concrete
(CC2), the coefficient of variation (CV) is <0.011%; yet it is slightly lower for micro fibers <0.008%. Figure
4-17 and Figure 4-18 show the resonant frequency measured in various ages for control plain concrete
(CC1) and micro polypropylene fiber reinforced concrete (FRC-B).
Figure 4-17 and Figure 4-18 provides an overview of the experimental results obtained. As concrete
specimens aged, the resonant frequency for both CC2 and FRC-B samples increased because of on-going
hydration, however, beyond 14-days of age, the increase in values are minimal. Still, incorporating
polypropylene micro fibers into concrete resulted in lower resonant frequency for all modes when compared
to plain concrete.
Figure 4-17: Batch 2 - Effect of age on PFRC prisms resonant frequency
Figure 4-18: Batch 2 - Effect of age on PFRC cylinders resonant frequency

59
Batch 3: Concrete cylinders were cast to study the effect of adding polypropylene micro and macro
fibers on the frequency response of concrete when crack induced considering wet and dry curing conditions.
By developing cracks in the cylinders, outlined in Section 3.4.3, both polypropylene macro and micro fibers
effectively restrained crack propagation with macro fibers having a better performance in crack width
closure. The regain in dynamic elastic properties post cracking illustrates the ductility of PFRC composites.
Figure 4-19 and Figure 4-20 show the detected transverse vibration and the resulting resonant frequency of
water cured micro fiber PFRC cylinder. The measured original transverse resonant frequency and post-
cracking frequency is 5.95 kHz and 4.11 kHz respectively.
Vibration damping can be observed through the shortening and fast decay of the time domain
signal. Wave decay, or damping, can be indicated through both figures. In Figure 4-19, the wave attenuation
in the cracked PFRC cylinder is indicated by the faster decay or short time span of the impulse.
Correspondingly a bell width expansion indicates damping shown in Figure 4-20. The area under the
highest peak magnitude increases when compared to its original frequency. As a result, IRM seems to
capture the retained elastic properties of concrete, after inducing cracks, owing to the interlocking of micro
fibers for cracking bridging. As the resonant frequency is proportional to its dynamic modulus, a decrease
in stiffness was detected when calculating the dynamic modulus.
Figure 4-19: Batch 3 - Typical wave damping in transverse vibration of micro PFRC cylinder

60
Figure 4-20: Batch 3 - Typical frequency drift of micro PFRC cylinder
As shown in Figure 4-21, the cracks relatively decreased the transverse frequency while slightly
affected the longitudinal frequency. A similar response was observed for macro fibers. This is due to the
direction of the applied impulse load parallel axial for longitudinal and perpendicular for transverse.
Moreover, the indication that micro fibers have higher frequency responses than macro fibers is more
prominent when calculating the dynamic elastic moduli. As shown in Figure 4-21, both dry and wet cured
micro PFRC specimens showed ~500 Hz lower resonant frequencies when compared to macro fibers. This
relates to the high-water uptake of micro fibers and greater adsorption capacity when compared to macro
fibers.
Furthermore, the calculated resonant frequencies are affected by curing conditions. Dry cured
PFRC cylinders samples produced ~300 Hz lower resonant frequencies when compared to water cured
cylinders. Water evaporation with air curing affects the hydration rate and quality of concrete. Excess
evaporation contributes to the accumulation of more voids and un-hydrated cement particles, therefore, the
resonant frequency of air cured samples is lower. This aligns with the work by (Leung and Balendran,
2002); however, in this study, dry samples were air cured after 24 hours of concrete hardening for 28 days
prior to test.
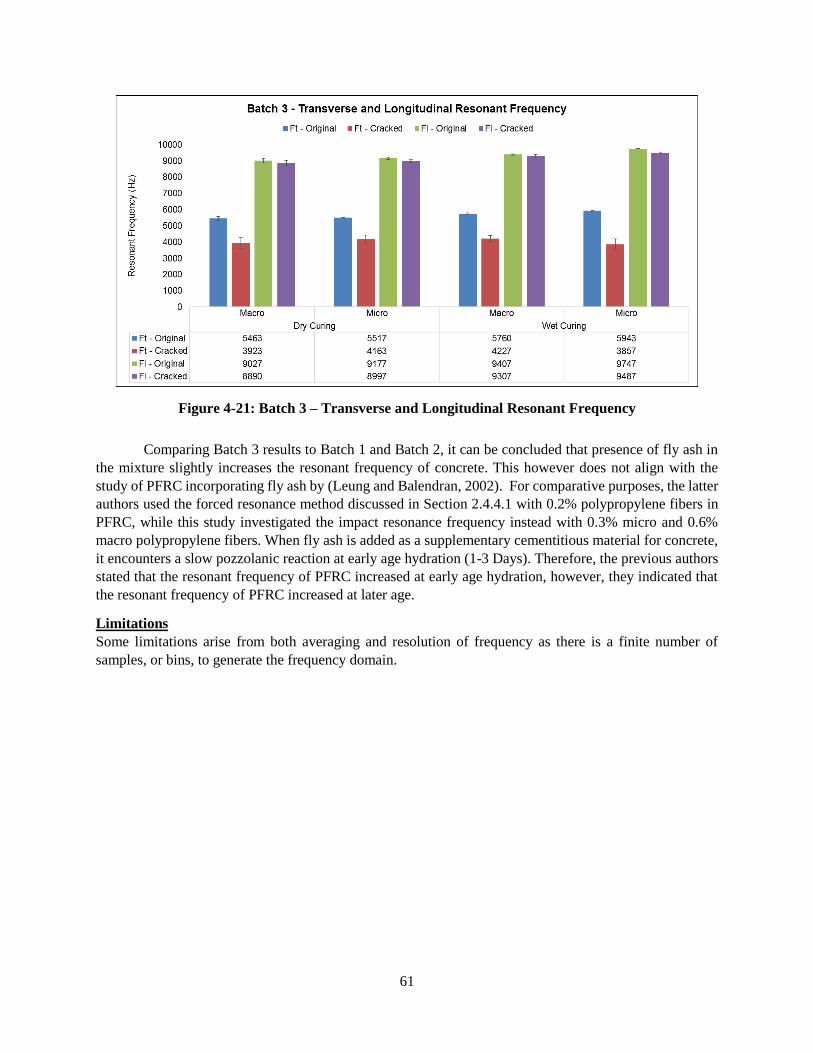
61
Figure 4-21: Batch 3 – Transverse and Longitudinal Resonant Frequency
Comparing Batch 3 results to Batch 1 and Batch 2, it can be concluded that presence of fly ash in
the mixture slightly increases the resonant frequency of concrete. This however does not align with the
study of PFRC incorporating fly ash by (Leung and Balendran, 2002). For comparative purposes, the latter
authors used the forced resonance method discussed in Section 2.4.4.1 with 0.2% polypropylene fibers in
PFRC, while this study investigated the impact resonance frequency instead with 0.3% micro and 0.6%
macro polypropylene fibers. When fly ash is added as a supplementary cementitious material for concrete,
it encounters a slow pozzolanic reaction at early age hydration (1-3 Days). Therefore, the previous authors
stated that the resonant frequency of PFRC increased at early age hydration, however, they indicated that
the resonant frequency of PFRC increased at later age.
Limitations
Some limitations arise from both averaging and resolution of frequency as there is a finite number of
samples, or bins, to generate the frequency domain.

62
4.3.2 Dynamic Elastic Properties
4.3.2.1 Dynamic Modulus of elasticity and Modulus of Rigidity
The results of the elastic moduli calculated for PFRC prisms and cylinders is analyzed in this
section. Generally, calculating the dynamic modulus of elasticity using the longitudinal mode showed better
consistency. Moreover, since the transverse elastic modulus is dependent on correction factors, the
longitudinal modulus was concsidered more consistent between the samples. The latter aligns with the
investigations developed by (Kolluru et al., 2000; Malhotra and Carino, 2004; Popovics, 2008) in the
relationship between the two moduli.
The following results provide the dynamic moduli empirically calculated from the IRM in
transverse (Edt) and longitudinal (Edl) modes of vibration. Moreover, the modulus of rigidity (G) is
calculated using torsional mode of vibration. The calculated modulus variations can occur if weights
between samples of the same mixture are different since the weight of the sample is directly related to the
modulus of elasticity of concrete as shown in Section 2.4.3. As the specimen weight increases, the dynamic
modulus of elasticity proportionally increases. Table 4-9 summarizes the prism and cylinder (Edt) correction
factor (T), as discussed previously.
Table 4-9: T values for transverse dynamic elastic modulus calculation
Specimen Size / Type T
100×100×350 mm / prism 1.49
150×150×550 mm / prism 1.58
Ø100×200 mm / cylinder 2.11
Through this study, dynamic properties of PFRC specimens from various batches are determined
using IRM, as the values are reported in Table 4-10. Batch 1 exhibited the highest dynamic elastic properties
in comparison with other batches since Batch 2 had a higher w/c ratio while Batch 3 was with no added fly
ash. Fly ash is a finely pulverized powder with spherical packed particles in fresh state. By that, fly ash it
is considered to improve the cement-aggregate matrix reduces porosity thus improving strength
development of concrete and elastic properties. This can be deduced when comparing FRC-A cylinders of
Batch 1 and Batch 3.
Batch 1: Figure 4-22 and Figure 4-23 show the dynamic moduli measured for control plain
concrete (CC1), 0.6% polypropylene fiber (NFRC) and 1% polypropylene fiber (HFRC). As there is a direct
relation between resonant frequency values and dynamic moduli of concrete, the calculated dynamic moduli
confirm a similar relationship to results reported in Section 4.3.1. As an example, the transverse (Edt) and
longitudinal (Edl) dynamic elastic moduli decreases by ~3GPa when adding 0.6% volume of fibers and
decreases by ~6GPa when adding 1% volume of fibers. From the rule of mixtures of two phase composites,
the total composite modulus of elasticity is bound by each of its component modulus and volume. Hence,
when fiber volume fraction of polypropylene fibers increase, the composite PFRC elastic modulus
decreased. This however, does not neglect the fact that micropore and dry shrinkage crack development in
PFRC can alter the results. Yet, PFRC specimens in this study were carefully consolidated in their molds
with prompt vibration. In addition, pilot investigations were considered to negate any prementioned errors.
Consequently, it is apparent that the density of polypropylene fiber and increase of volume content will
proportionally decrease the PFRC dynamic elastic properties when compared to plain concrete of the same
mixture.

63
Table 4-10: Dynamic properties of PFRC specimens
Batch ID Dynamic Elastic Properties
Edt (GPa) Edl (GPa) G (GPa) υ
Prisms: B1 (100×100×350 mm) / B2 (150×150×550 mm)
1
CC1 42.77±0.64 46.54±0.80 18.43±0.11 0.26±0.01
FRC - A 40.18±0.54 44.67±1.56 17.76±0.42 0.26±0.03
HFRC - A 37.39±1.35 44.28±0.87 16.45±1.16 0.35±0.07
2 CC2 32.04±1.84 33.71±0.58 13.31±0.29 0.27±0.01
FRC - B 28.62±1.02 30.06±0.70 12.02±0.24 0.25±0.01
Cylinders: (Ø100×200 mm)
1
CC1 40.4±0.47 39.2±1.69
FRC - A 39.0±0.34 38.1±1.35
HFRC - A 33.6±0.50 34.2±0.46
2 CC2 37.3±1.02 36.1±0.54
FRC - B 32.9±0.53 32.1±0.74
3 FRC - A 33.97±0.35 32.70±0.14
FRC - B 37.47±0.23 36.37±0.12
Figure 4-22: Batch 1 - Average dynamic moduli of elasticity and rigidity of PFRC prisms
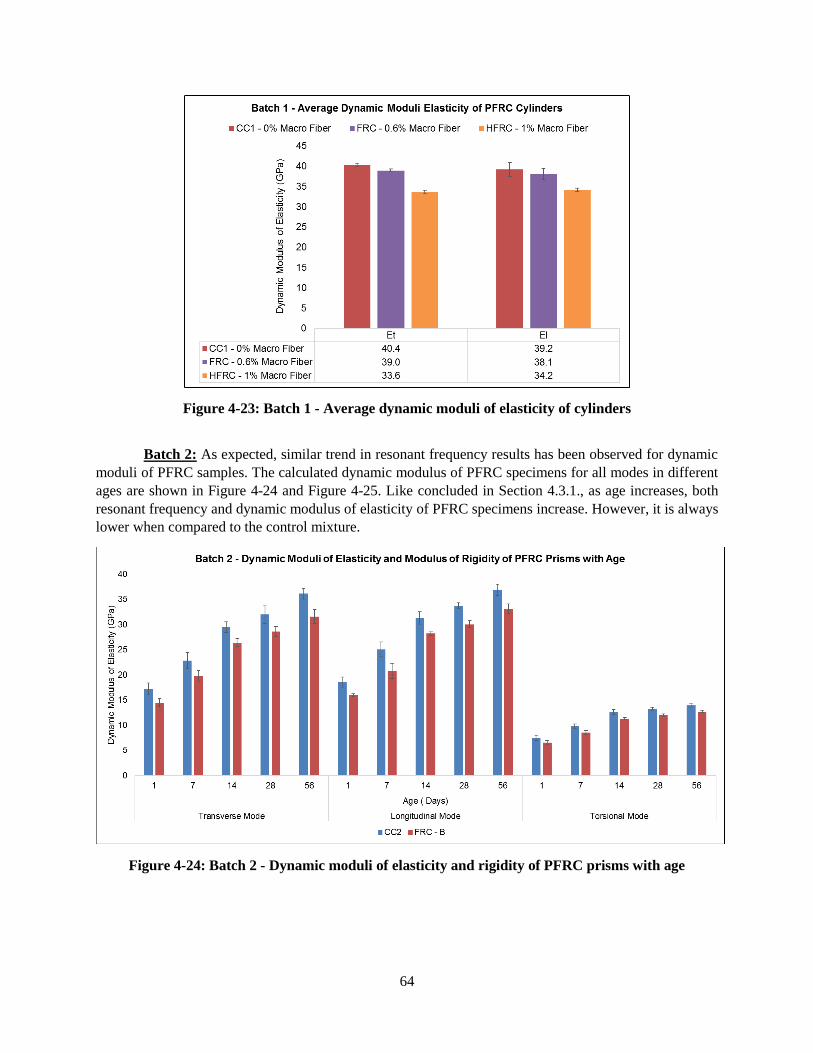
64
Figure 4-23: Batch 1 - Average dynamic moduli of elasticity of cylinders
Batch 2: As expected, similar trend in resonant frequency results has been observed for dynamic
moduli of PFRC samples. The calculated dynamic modulus of PFRC specimens for all modes in different
ages are shown in Figure 4-24 and Figure 4-25. Like concluded in Section 4.3.1., as age increases, both
resonant frequency and dynamic modulus of elasticity of PFRC specimens increase. However, it is always
lower when compared to the control mixture.
Figure 4-24: Batch 2 - Dynamic moduli of elasticity and rigidity of PFRC prisms with age
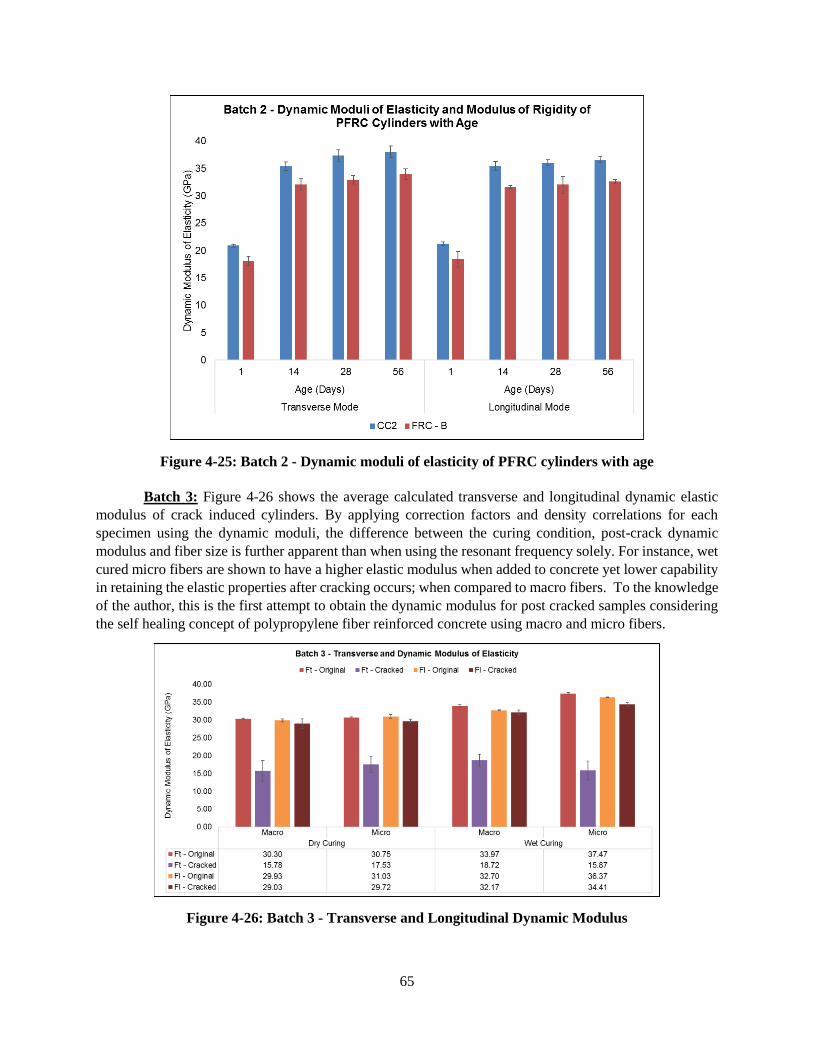
65
Figure 4-25: Batch 2 - Dynamic moduli of elasticity of PFRC cylinders with age
Batch 3: Figure 4-26 shows the average calculated transverse and longitudinal dynamic elastic
modulus of crack induced cylinders. By applying correction factors and density correlations for each
specimen using the dynamic moduli, the difference between the curing condition, post-crack dynamic
modulus and fiber size is further apparent than when using the resonant frequency solely. For instance, wet
cured micro fibers are shown to have a higher elastic modulus when added to concrete yet lower capability
in retaining the elastic properties after cracking occurs; when compared to macro fibers. To the knowledge
of the author, this is the first attempt to obtain the dynamic modulus for post cracked samples considering
the self healing concept of polypropylene fiber reinforced concrete using macro and micro fibers.
Figure 4-26: Batch 3 - Transverse and Longitudinal Dynamic Modulus
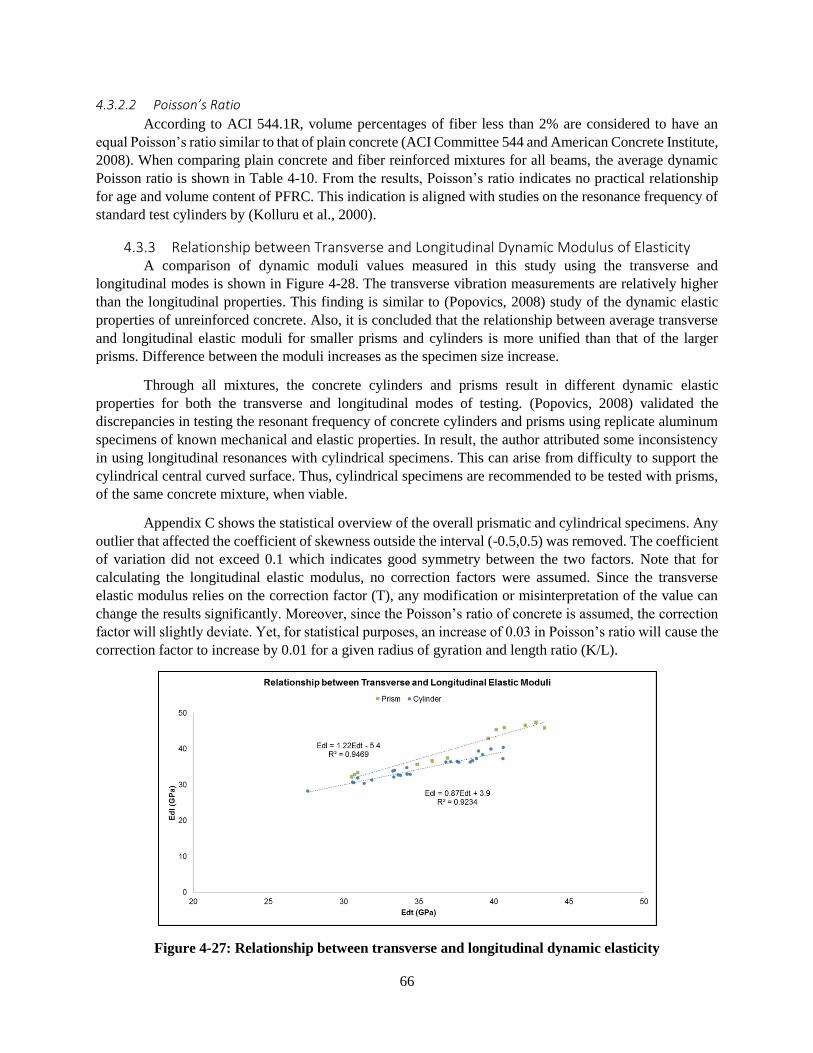
66
4.3.2.2 Poisson’s Ratio
According to ACI 544.1R, volume percentages of fiber less than 2% are considered to have an
equal Poisson’s ratio similar to that of plain concrete (ACI Committee 544 and American Concrete Institute,
2008). When comparing plain concrete and fiber reinforced mixtures for all beams, the average dynamic
Poisson ratio is shown in Table 4-10. From the results, Poisson’s ratio indicates no practical relationship
for age and volume content of PFRC. This indication is aligned with studies on the resonance frequency of
standard test cylinders by (Kolluru et al., 2000).
4.3.3 Relationship between Transverse and Longitudinal Dynamic Modulus of Elasticity A comparison of dynamic moduli values measured in this study using the transverse and
longitudinal modes is shown in Figure 4-28. The transverse vibration measurements are relatively higher
than the longitudinal properties. This finding is similar to (Popovics, 2008) study of the dynamic elastic
properties of unreinforced concrete. Also, it is concluded that the relationship between average transverse
and longitudinal elastic moduli for smaller prisms and cylinders is more unified than that of the larger
prisms. Difference between the moduli increases as the specimen size increase.
Through all mixtures, the concrete cylinders and prisms result in different dynamic elastic
properties for both the transverse and longitudinal modes of testing. (Popovics, 2008) validated the
discrepancies in testing the resonant frequency of concrete cylinders and prisms using replicate aluminum
specimens of known mechanical and elastic properties. In result, the author attributed some inconsistency
in using longitudinal resonances with cylindrical specimens. This can arise from difficulty to support the
cylindrical central curved surface. Thus, cylindrical specimens are recommended to be tested with prisms,
of the same concrete mixture, when viable.
Appendix C shows the statistical overview of the overall prismatic and cylindrical specimens. Any
outlier that affected the coefficient of skewness outside the interval (-0.5,0.5) was removed. The coefficient
of variation did not exceed 0.1 which indicates good symmetry between the two factors. Note that for
calculating the longitudinal elastic modulus, no correction factors were assumed. Since the transverse
elastic modulus relies on the correction factor (T), any modification or misinterpretation of the value can
change the results significantly. Moreover, since the Poisson’s ratio of concrete is assumed, the correction
factor will slightly deviate. Yet, for statistical purposes, an increase of 0.03 in Poisson’s ratio will cause the
correction factor to increase by 0.01 for a given radius of gyration and length ratio (K/L).
Figure 4-27: Relationship between transverse and longitudinal dynamic elasticity

67
4.3.4 Relationship between Dynamic Moduli of Elasticity and Modulus of Rigidity A comparison between dynamic moduli values measured in this study using the transverse and
longitudinal modes with the modulus of rigidity is shown in Figure 4-29. The results show a linear
relationship between both flexural (Edt) and compressive (Edl) elastic moduli with the concretes dynamic
modulus of rigidity (G). As mentioned in (Malhotra and Carino, 2004) and introduced by (Swamy and
Rigby, 1971), the modulus of rigidity is about 40% of the modulus of elasticity. Both modal relationships
provided have a G/Ed percentage of 38.1% and 41.7% for Edt (R2=0.93) and Edl (R2=0.89) respectively,
indicating representable coherence.
Figure 4-28: Relationship between dynamic moduli of elasticity and rigidity
4.3.5 Relationship between Dynamic Modulus of Elasticity and Compressive Strength This section describes resulting relationship between the dynamic longitudinal modulus and
compressive strength of concrete and their comparison with existing models. Figure 4-27 presents the
empirical relationship between Ed and fc by (Jin and Li, 2001) and other published works mentioned in
Section 3.5.4 for sake of comparison with the obtained data in this study. To validate the calculated dynamic
modulus of elasticity values, equations from studies presented in Table 3-7, were used. The calculated
dynamic Edt and Edl elastic moduli in Figure 4-27 show a promising relation between the model established
by (Jin and Li, 2001). In addition, the estimation for the static elastic modulus proposed by (Noguchi et al.,
2009) was used in relationship between the static and dynamic moduli mentioned by (Neville and Brooks,
2010). Note that the model proposed by (Noguchi et al., 2009) solely relies on the measured compressive
strength and density of each cylinder. Moreover, the model developed by (Jin and Li, 2001) is related
between 0.5 and 0.6 w/c ratios at 28 days of wet curing conditions. In this study, having w/c ratios of 0.4
and 0.5, the model proposed by (Jin and Li, 2001) for predicting Ed from cylinder compressive strength is
coherent when compared to experimental calculated dynamic moduli in this study.
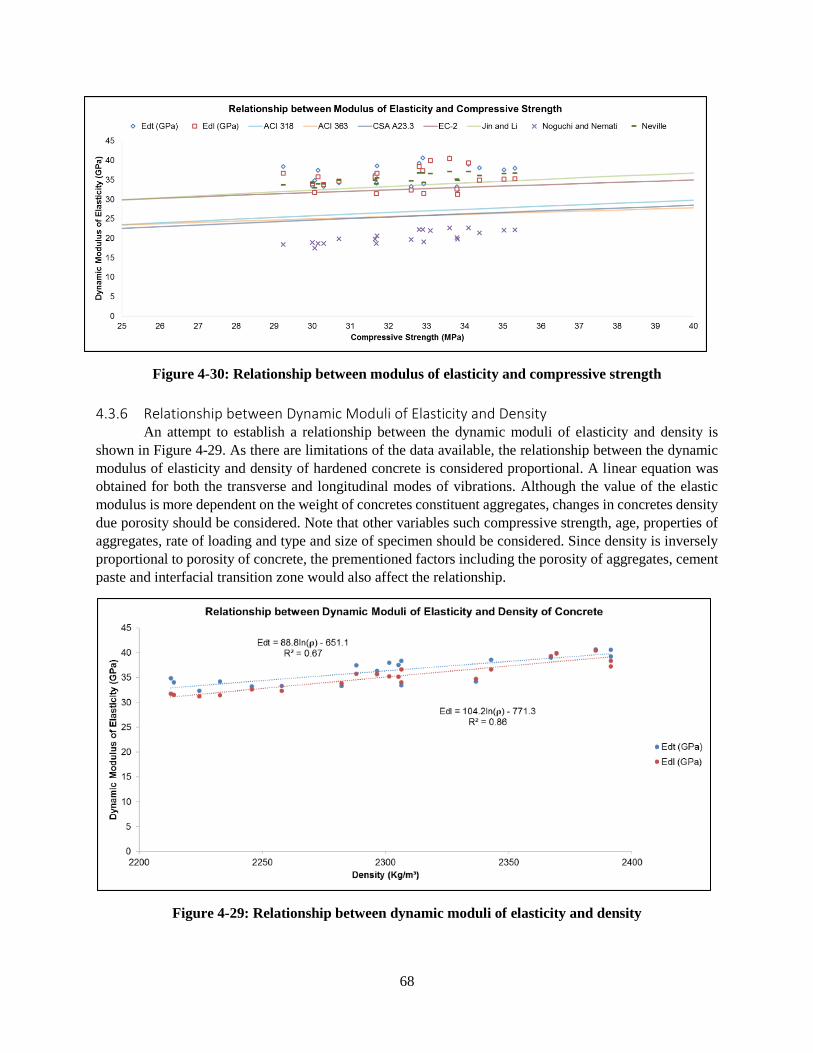
68
Figure 4-30: Relationship between modulus of elasticity and compressive strength
4.3.6 Relationship between Dynamic Moduli of Elasticity and Density An attempt to establish a relationship between the dynamic moduli of elasticity and density is
shown in Figure 4-29. As there are limitations of the data available, the relationship between the dynamic
modulus of elasticity and density of hardened concrete is considered proportional. A linear equation was
obtained for both the transverse and longitudinal modes of vibrations. Although the value of the elastic
modulus is more dependent on the weight of concretes constituent aggregates, changes in concretes density
due porosity should be considered. Note that other variables such compressive strength, age, properties of
aggregates, rate of loading and type and size of specimen should be considered. Since density is inversely
proportional to porosity of concrete, the prementioned factors including the porosity of aggregates, cement
paste and interfacial transition zone would also affect the relationship.
Figure 4-29: Relationship between dynamic moduli of elasticity and density

69
4.3.7 Summary The impact resonance frequency method demonstrated reliable demography for assessing the dynamic
elastic properties of concrete and detecting cracks present within concrete. By testing (150×150×550 mm)
prisms as larger samples and (100×200mm) cylinders as smaller samples, smaller samples exhibited higher
sample variation in frequency. However, these variations are statistically insignificant. The transverse
elastic modulus is higher than that of the longitudinal elastic modulus. This is reliant on the correction factor
(T) for calculating the elastic modulus and dimensional measurements.
From this study, it can be reasoned that a higher modulus is attributed to larger peak stresses. As the
peak stresses increase, the concrete is more prone to cracking. The decrease in the dynamic modulus of
PFRC, when compared to that of the relative plain concrete mixture, allows concrete to endure higher
impulse stresses while maintaining crack expansion. Having a lower modulus provides concrete more
flexibility to endure impact or cyclic loading and decreases the occurrence of microcracks at the interfacial
transition zone between aggregates and cement. Therefore, reduced rigidity is somewhat beneficial for
concrete structures susceptible to dynamic loads. As polypropylene fibers exhibit a ductile manner and
high impact absorption capacity within concrete, having a lower elastic modulus is valuable.
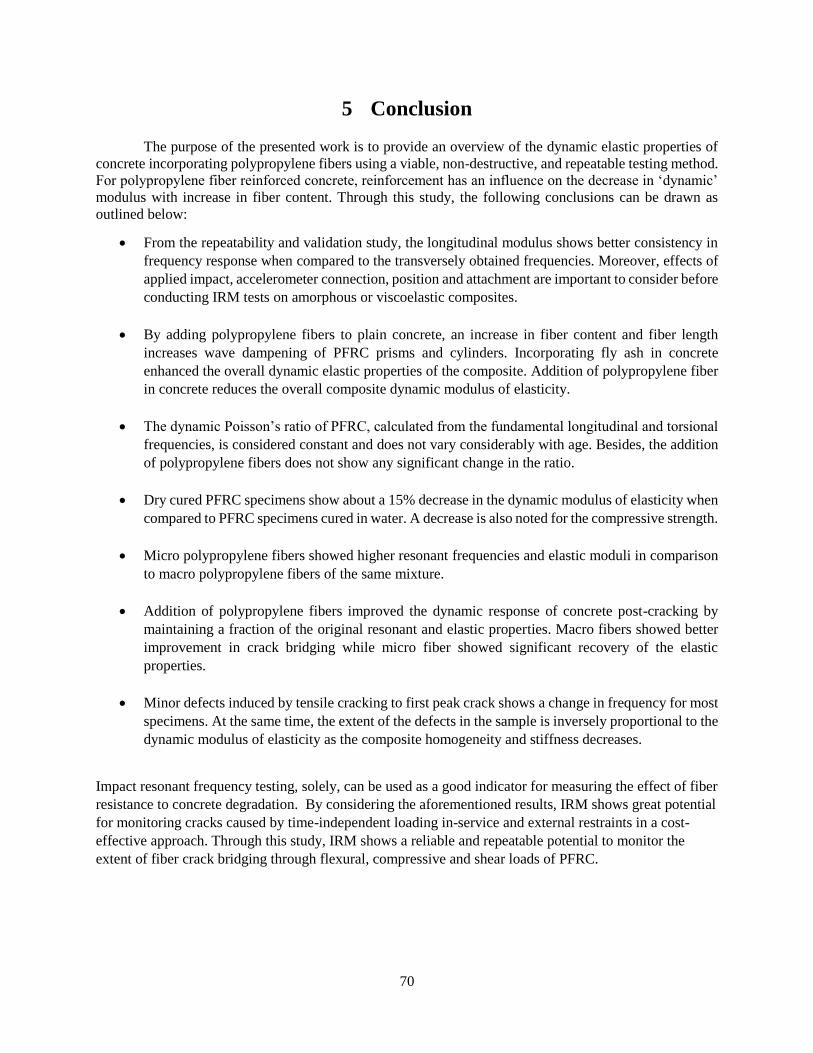
70
5 Conclusion
The purpose of the presented work is to provide an overview of the dynamic elastic properties of
concrete incorporating polypropylene fibers using a viable, non-destructive, and repeatable testing method.
For polypropylene fiber reinforced concrete, reinforcement has an influence on the decrease in ‘dynamic’
modulus with increase in fiber content. Through this study, the following conclusions can be drawn as
outlined below:
• From the repeatability and validation study, the longitudinal modulus shows better consistency in
frequency response when compared to the transversely obtained frequencies. Moreover, effects of
applied impact, accelerometer connection, position and attachment are important to consider before
conducting IRM tests on amorphous or viscoelastic composites.
• By adding polypropylene fibers to plain concrete, an increase in fiber content and fiber length
increases wave dampening of PFRC prisms and cylinders. Incorporating fly ash in concrete
enhanced the overall dynamic elastic properties of the composite. Addition of polypropylene fiber
in concrete reduces the overall composite dynamic modulus of elasticity.
• The dynamic Poisson’s ratio of PFRC, calculated from the fundamental longitudinal and torsional
frequencies, is considered constant and does not vary considerably with age. Besides, the addition
of polypropylene fibers does not show any significant change in the ratio.
• Dry cured PFRC specimens show about a 15% decrease in the dynamic modulus of elasticity when
compared to PFRC specimens cured in water. A decrease is also noted for the compressive strength.
• Micro polypropylene fibers showed higher resonant frequencies and elastic moduli in comparison
to macro polypropylene fibers of the same mixture.
• Addition of polypropylene fibers improved the dynamic response of concrete post-cracking by
maintaining a fraction of the original resonant and elastic properties. Macro fibers showed better
improvement in crack bridging while micro fiber showed significant recovery of the elastic
properties.
• Minor defects induced by tensile cracking to first peak crack shows a change in frequency for most
specimens. At the same time, the extent of the defects in the sample is inversely proportional to the
dynamic modulus of elasticity as the composite homogeneity and stiffness decreases.
Impact resonant frequency testing, solely, can be used as a good indicator for measuring the effect of fiber
resistance to concrete degradation. By considering the aforementioned results, IRM shows great potential
for monitoring cracks caused by time-independent loading in-service and external restraints in a cost-
effective approach. Through this study, IRM shows a reliable and repeatable potential to monitor the
extent of fiber crack bridging through flexural, compressive and shear loads of PFRC.
71
Recommendations for Future Studies
As a result of adding polypropylene fibers in concrete, the free vibration testing using low impulse
excitation provides some indication of material damping properties and alternate elastic properties in post
cracking stage. Using the impact resonance method allowed for quantifying the extent of damage through
cracked cylinders and fractured prisms. Reinforcing concrete with polypropylene fibers helped retain elastic
properties when defects are present and after failure occurs. However, it is important to note that the signal
behaviour would likely differ with high amplitude random excitation or seismic activity. Therefore, further
research in the behaviour of PFRC under seismic loads is necessary. An evaluation of the regained elastic
properties of concrete should enable improved assessment of in-service structures reinforced with
polypropylene. In addition, the following points are recommended to be considered in future studies:
- For FRC undergoing freeze-thaw cycles, the structure of the internal air pore system can be of
interest to monitor. The resonant frequency method can be used to monitor this occurrence.
The air pore distribution can be studied in relation to the amount and type of fly ash and air
entraining admixtures used.
- When cracked specimens are immersed in water or present in high relative humidity
environment, natural self-healing of concrete can initiate. The resonant frequency method can
be used to quantify the extent of healing by monitoring water flow rate through cracks or adding
a premeasured amount of self-sealing agent.
- For a more economical approach, a portable lab resonant frequency device is prototyped and
can be developed to allow for immediate onsite testing while maintaining the same resolution
of laboratory RFT instruments.
- Research on resonant frequency testing can be established on alternative fibers such as Kevlar
and carbon nanotubes introduced to concrete. Testing polypropylene fibers in this study has
shown promising results in measuring the frequency variation of different sized polypropylene
fibers.

72
6 References
ASTM Standards
ASTM B221-14, Standard Specification for Aluminum and Aluminum-Alloy Extruded Bars, Rods, Wire,
Profiles, and Tubes, ASTM International, West Conshohocken, PA, 2014, www.astm.org
ASTM C39/C39M-16b, Standard Test Method for Compressive Strength of Cylindrical Concrete
Specimens, ASTM International, West Conshohocken, PA, 2016, www.astm.org
ASTM C94/C94M-16a, Standard Specification for Ready-Mixed Concrete, ASTM International, West
Conshohocken, PA, 2016, www.astm.org
ASTM C138 / C138M-14, Standard Test Method for Density (Unit Weight), Yield, and Air Content
(Gravimetric) of Concrete, ASTM International, West Conshohocken, PA, 2014, www.astm.org
ASTM C143/C143M-15a, Standard Test Method for Slump of Hydraulic-Cement Concrete, ASTM
International, West Conshohocken, PA, 2015, www.astm.org
ASTM C150 / C150M-17, Standard Specification for Portland Cement, ASTM International, West
Conshohocken, PA, 2017, www.astm.org
ASTM C618-15, Standard Specification for Coal Fly Ash and Raw or Calcined Natural Pozzolan for Use
in Concrete, ASTM International, West Conshohocken, PA, 2015, www.astm.org
ASTM C215-14, Standard Test Method for Fundamental Transverse, Longitudinal, and Torsional Resonant
Frequencies of Concrete Specimens, ASTM International, West Conshohocken, PA, 2014, www.astm.org
ASTM C231/C231M-14, Standard Test Method for Air Content of Freshly Mixed Concrete by the Pressure
Method, ASTM International, West Conshohocken, PA, 2014, www.astm.org
ASTM C469 / C469M-14, Standard Test Method for Static Modulus of Elasticity and Poisson’s Ratio of
Concrete in Compression, ASTM International, West Conshohocken, PA, 2014, www.astm.org
ASTM C597-16, Standard Test Method for Pulse Velocity Through Concrete, ASTM International, West
Conshohocken, PA, 2016, www.astm.org
ASTM C642-13, Standard Test Method for Density, Absorption, and Voids in Hardened Concrete, ASTM
International, West Conshohocken, PA, 2013, www.astm.org
ASTM C876-15, Standard Test Method for Corrosion Potentials of Uncoated Reinforcing Steel in Concrete,
ASTM International, West Conshohocken, PA, 2015, www.astm.org
ASTM C856-17, Standard Practice for Petrographic Examination of Hardened Concrete, ASTM
International, West Conshohocken, PA, 2017, www.astm.org
ASTM C1064 / C1064M-12, Standard Test Method for Temperature of Freshly Mixed Hydraulic-Cement
Concrete, ASTM International, West Conshohocken, PA, 2012, www.astm.org

73
ASTM C1609 / C1609M-12, Standard Test Method for Flexural Performance of Fiber-Reinforced Concrete
(Using Beam With Third-Point Loading), ASTM International, West Conshohocken, PA, 2012,
www.astm.org
ASTM C1116 / C1116M-10a(2015), Standard Specification for Fiber-Reinforced Concrete, ASTM
International, West Conshohocken, PA, 2015, www.astm.org
ASTM D7508 / D7508M-10(2015), Standard Specification for Polyolefin Chopped Strands for Use in
Concrete, ASTM International, West Conshohocken, PA, 2015, www.astm.org
Citations
AASHTO-AGC-ARTBA Joint Cooperation Committee, 2001. The use and state-of-the-practice of fiber
reinforced concrete. Am. Assoc. State Highw. Transp. Off. Wash. DC.
ACI Committee 318, American Concrete Institute, 2014. Building code requirements for structural
concrete (ACI 318-14): an ACI standard : commentary on building code requirements for
structural concrete (ACI 318R-14), an ACI report.
ACI Committee 544, American Concrete Institute, 2008. Guide for specifying, proportioning, and
production of fiber-reinforced concrete (ACI 544R). American Concrete Institute, Farmington
Hills, MI.
Ali, M., Liu, A., Sou, H., Chouw, N., 2012. Mechanical and dynamic properties of coconut fibre
reinforced concrete. Constr. Build. Mater. 30, 814–825. doi:10.1016/j.conbuildmat.2011.12.068
Aly, T., Sanjayan, J., Collins, F., 2008. Effect of polypropylene fibers on shrinkage and cracking of
concretes. Mater. Struct. 41, 1741.
Bahr, O., Schaumann, P., Bollen, B., Bracke, J., 2013. Young’s modulus and Poisson’s ratio of concrete
at high temperatures: Experimental investigations. Mater. Des. 45, 421–429.
doi:10.1016/j.matdes.2012.07.070
Balendran, R.V., 1993. Building Materials Laboratory Manual 2. Department of Building and
Construction: City Polytech-nic of Hong Kong.
Banthia, N., Gupta, R., 2006. Influence of polypropylene fiber geometry on plastic shrinkage cracking in
concrete. Cem. Concr. Res. 36, 1263–1267. doi:10.1016/j.cemconres.2006.01.010
Banthia, N.P., Mindess, S., Bentur, A., 1987. Impact behaviour of concrete beams. Mater. Struct. 20,
293–302. doi:10.1007/BF02485926
Barragan, B., Conforti, A., Minelli, F., Moro, S., Plizzari, G.A., Toffoli, L., 2012. Shear Behavior of
Shallow Beams in Polypropelene Fiber Reinfroced Concrete. BEFIB2012 – Fibre Reinf. Concr.
Beaudoin, J.J., 1990. Handbook of fiber-reinforced concrete: principles properties, developments and
applications. Noyes Publications, Park Ridge, N.J., U.S.A.
Biryukovich, K.L., Biryukovich, Y.L., Biryukovich, D.L., 1965. Glass-fibre-reinforced cement.
Bischoff, P.H., Perry, S.H., 1991. Compressive behaviour of concrete at high strain rates. Mater. Struct.
24, 425–450. doi:10.1007/BF02472016
British Standard BS EN 1992-1-1, 2004. Eurocode 2: Design of Concrete Structures (No. EN 1992-1-
1:2004). Bristish Standards.
Brown, M., Sellers, G., Folliard, K., Fowler, D., 2001. Restrained shrinkage cracking of concrete bridge
decks: State-of-the-Art Review.
Bungey, J.H., Millard, S.G., Grantham, M., 2006. Testing of concrete in structures, 4th ed. ed. Taylor &
Francis, London ; New York.
Chavan, P., Vyawahare, M., 2015. Correlation of static and Dyanmic Modulus of Elasticity for Different
SCC Mixes. Int. J. Recent Innov. Trends Comput. Comun. 3, 4914–4919.
Deng, Z., Li, J., 2007. Mechanical behaviors of concrete combined with steel and synthetic macro-fibers.
Comput. Concr. 4, 207–220. doi:10.12989/cac.2007.4.3.207
74
Dickson, R.W., Wachtman, J.B., 1971. An alumina standard reference material for resonance frequency
and dynamic elastic moduli measurement. I. For use at 25 C. J. Res. Natl. Bur. Stand. Sect. Phys.
Chem. 75A, 155. doi:10.6028/jres.075A.016
Gade, H., Herlufsen, S., 1994. Digital Filter Techniques vs. FFT Techniques for Damping Measurements.
Bruel Kjaer 1, 1–35.
Gaidis, M., Rosenburg, J.M., 1986. New Test for Determining Fundamental Frequencies of Concrete.
Cem. Concr. Aggreg. 8, 117.
Giner, V.T., Baeza, F.J., Ivorra, S., Zornoza, E., Galao, ó., 2012. Effect of steel and carbon fiber
additions on the dynamic properties of concrete containing silica fume. Mater. Des. 34, 332–339.
doi:10.1016/j.matdes.2011.07.068
Goens, E., 1931. Über die Bestimmung des Elastizitätsmoduls von Stäben mit Hilfe von
Biegungsschwingungen. Ann. Phys. 403, 649–678. doi:10.1002/andp.19314030602
Graft-Johnson, J.W.., Bawa, N.S., 1969. Effect of mix proportion, water-cement ratio, age and curing
conditions of the dynamic modulus of elasticity of concrete. Build. Sci. 3, 171–177.
Gudmarsson, A., 2014. Resonance testing of asphalt concrete. Architecture and the Built Environment,
KTH Royal Institute of Technology, Stockholm.
Gupta, R., Biparva, A., 2015. Innovative Test Technique to Evaluate “Self-Sealing” of Concrete. J. Test.
Eval. 43, 1091–1098. doi:10.1520/JTE20130285
Gupta, R., El-Newihy, A., 2015. Effectiveness of resonance frequency based method to predict moduli of
concrete and detection flaws. JCI: International Conference on the Regeneration and
Conservation of Concrete Structures.
Hamoush, 2011. Freezing and Thawing Durability of Very High Strength Concrete. Am. J. Eng. Appl.
Sci. 4, 42–51. doi:10.3844/ajeassp.2011.42.51
Han, S.-H., Kim, J.-K., 2004. Effect of temperature and age on the relationship between dynamic and
static elastic modulus of concrete. Cem. Concr. Res. 34, 1219–1227.
He, J., 1999. Damage Detection and Evaluation I, in: Silva, J.M.M., Maia, N.M.M. (Eds.), Modal
Analysis and Testing. Springer Netherlands, Dordrecht, pp. 325–344.
Hornibrook, F.B., 1939. Application of Sonic Method to Freezing and Thawing Studies of Concrete.
ASTM Bull. No. 101, 5.
Jin, X., Li, Z., 2001. Dynamic Property Determination for Early-Age Concrete. ACI Mater. J. 98, 365–
370.
Jones, R., 1969. A review of the non-destructive testing of concrete. Institution of Civil Engineers.
Kakooei, S., Akil, H.M., Jamshidi, M., Rouhi, J., 2012. The effects of polypropylene fibers on the
properties of reinforced concrete structures. Constr. Build. Mater. 27, 73–77.
doi:10.1016/j.conbuildmat.2011.08.015
Karahan, O., Atiş, C.D., 2011. The durability properties of polypropylene fiber reinforced fly ash
concrete. Mater. Des. 32, 1044–1049.
Kesler, C.E., Higuchi, Y., 1945. Problems in the sonic testing of plain concrete, in: Int. Symp. on
Nondestructive Testing of Materials and Structures. RILEM, Paris, p. 45.
Kodur, V.K.R., Cheng, F.-P., Wang, T.-C., Sultan, M.A., 2003. Effect of Strength and Fiber
Reinforcement on Fire Resistance of High-Strength Concrete Columns. J. Struct. Eng. 129, 253–
259. doi:10.1061/(ASCE)0733-9445(2003)129:2(253)
Kolluru, S.V., Popovics, J.S., Shah, S.P., 2000. Determining Elastic Properties of Concrete Using
Vibrational Resonance Frequencies of Standard Test Cylinders. Cem. Concr. Aggreg. CCAGDP
22, 81–89.
Krstulovic-Opara, N., Watson, K.A., LaFave, J.M., 1994. Effect of increased tensile strength and
toughness on reinforcing-bar bond behavior. Cem. Concr. Compos. 16, 129–141.
Kurtz, S., Balaguru, P., 2000. Postcrack creep of polymeric fiber-reinforced concrete in flexure. Cem.
Concr. Res. 30, 183–190. doi:10.1016/S0008-8846(99)00228-8
75
Lamond, J., Pielert, J. (Eds.), 2006. Significance of Tests and Properties of Concrete and Concrete-
Making Materials. ASTM International, 100 Barr Harbor Drive, PO Box C700, West
Conshohocken, PA 19428-2959.
Lee, B.J., Kee, S.-H., Oh, T., Kim, Y.-Y., 2015. Effect of Cylinder Size on the Modulus of Elasticity and
Compressive Strength of Concrete from Static and Dynamic Tests. Adv. Mater. Sci. Eng. 2015,
1–12. doi:10.1155/2015/580638
Leung, H.Y., Balendran, R.V., 2002. Resonant frequency in polypropylene fibre reinforced concrete
(PFRC) with pozzolanic materials. J. Civ. Eng. Manag. 8, 169–176.
doi:10.1080/13923730.2002.10531273
Leung, H.Y., Balendran, R.V., Nadeem, A., Maqsood, T., Rana, T.M., 2003. Resonant Frequency in Fiber
Reinforced Concrte: Effect of Pozzolans and Curing Condtions. ICPCM, p. 4.
Li, V., Yang, E., 2007. Self Healing in Concrete Materials. Self Heal. Mater. Altern. Approach 20
Centuries Mater. Sci. 161–193.
Maier, C., Calafut, T., 1998. Polypropylene: the definitive user’s guide and databook, PDL handbook
series. Plastics Design Library, Norwich, NY.
Malhotra, V.M., Carino, N.J. (Eds.), 2004. Handbook on nondestructive testing of concrete, 2nd ed. ed.
CRC Press, Boca Raton, Fla.
Manolis, G.D., Gareis, P.J., Tsonos, A.D., Neal, J.A., 1997. Dynamic properties of polypropylene fiber-
reinforced concrete slabs. Cem. Concr. Compos. 19, 341–349. doi:10.1016/S0958-
9465(97)00030-9
Mehta, P., Monteiro, P.J.M., 2006. Concrete: Microstructure, Properties, and Materials, McGraw Hill
professional. McGraw-Hill Education.
Mindess, S., Vondran, G., 1988. Properties of concrete reinforced with fibrillated polypropylene fibres
under impact loading. Cem. Concr. Res. 18, 109–115. doi:10.1016/0008-8846(88)90127-5
Mindess, S., Young, J.F., Darwin, D., 2003. Concrete, 2nd ed. ed. Prentice Hall, Upper Saddle River, NJ.
Naaman, A.E., Namur, G., Najm, H., Elwan, J., 1989. Bond mechanisms in fiber reiforced cement-based
composites (No. UMCE 89-9). University of Michigan, Ann Arbor, MI.
Neville, A.M., 2012. Properties of Concrete. Pearson Education.
Neville, A.M., Brooks, J.J., 2010. Concrete technology, 2nd ed. Prentice Hall, Harlow.
Noguchi, T., Tomosawa, F., Nemati, K., Chiaia, B., Fantilli, A., 2009. A Practical Equation for Elastic
Modulus of Concrete. ACI Struct. J. 106. doi:10.14359/51663109
Obert, L., Duvall, W.., 1941. Discussion of the dynamic methods of testing concrete with sugesstions for
standardization. Proc. ASTM 41, 1053.
Pickett, G., 1945. Equations for Computing Elastic Constants From Flexural and Torsional Resonant
Frequencies of Vibration of Prisms and Cylinders. Proc. ASTM 45, 846–865.
Plachy, T., Padevet, P., Polak, M., 2009. Comparison of two experimental techniques for determination of
Young’s modulus of concrete specimens. Recent Adv. Appl. Theor. Mech. Puerto Cruz 14–16.
Popovics, J.., 2008. A Study of Static and Dynamic Modulus of Elasticity of Concrete (No. Final Report).
University of Illinois, Urbana, IL.
Powers, T.C., 1938. Measuring Young’s Modulus of Elasticity by Means of Sonic Vibrations. ASTM
Proceeding 38, 460–469.
Propex Operating Company, 2016. Product Guide Specification.
Rayleigh, J.W.S., Lindsay, R.B., 1945. The theory of sound, 2nd ed. Dover Publications.
Shah, S.P., Rangan, B.V., 1971. Fiber Reinforced Concrete Properties. J. Proc. 68. doi:10.14359/11299
Sharma, B.L., Gupta, M.R., 1960. Sonic modulus as related to strength and static modulus of high
strength concrete. Indian Concr. J. 34.
Shkolnik, I.E., 2005. Effect of nonlinear response of concrete on its elastic modulus and strength. Cem.
Concr. Compos. 27, 747–757. doi:10.1016/j.cemconcomp.2004.12.006
Singh, S., Shukla, A., Brown, R., 2004. Pullout behavior of polypropylene fibers from cementitious
matrix. Cem. Concr. Res. 34, 1919–1925.

76
Spinner, S., Reichard, T.W., Tefft, W.E., 1960. A comparison of experimental and theoretical relations
between Young’s modulus and the flexural and longitudinal resonance frequencies of uniform
bars. J. Res. Natl. Bur. Stand. Sect. Phys. Chem. 64A, 147. doi:10.6028/jres.064A.014
Spinner, S., Tefft, W., 1961. A method for determining mechanical resonance frequencies for calculating
elastic moduli from these frequencies. Proc. ASTM 61, 1221–1233.
Stanton, T.., 1944. Comparing the modulus of elasticity of portland cement concreteby the dynamic
(sonic) and compression methods. Proc ASTM 17.
Swamy, G., Rigby, N., 1971. Dynamic properties of hardened paste, mortar and concrete. Mat Constr 4,
13–40. doi:10.1007/bf02473927
Thomson, W.., 1940. Measuring changes in physical properties of concrete by the dynamic method. Proc
ASTM 1113.
Thorton, H., Alexander, A., 1987. Development of impact and resonant vibration signature for inspection
of concrete structures. ACI Spec Publ SP 100 667.
Timoshenko, J.N., StephenGoodier, 1970. Theory of elasticity. McGraw-Hill.
Timoshenko, S.P., 1922. On the transverse vibrations of bars of uniform cross-section. Philos. Mag. Ser.
6 43, 125–131. doi:10.1080/14786442208633855
Toutanji, H., McNeil, S., Bayasi, Z., 1998. Chloride permeability and impact resistance of polypropylene-
fiber-reinforced silica fume concrete. Cem. Concr. Res. 28, 961–968.
Ward, C., Rattanawangcharoen, N., Gheorghiu, C., 2008. Impact resonance method for damage detection
in carbon-fibre-reinforced polymer–strengthened reinforced concrete beams subjected to fatigue
and thermal cycling. Can. J. Civ. Eng. 35, 1251–1260. doi:10.1139/L08-066
Whitehurst, E.A., 1967. Evaluation of Concrete Properties from Sonic Tests, ACI monograph. American
Concrete Institute.
Yew, M.K., Mahmud, H.B., Shafigh, P., Ang, B.C., Yew, M.C., 2015. Effects of polypropylene twisted
bundle fibers on the mechanical properties of high-strength oil palm shell lightweight concrete.
Mater Struct 49, 1221–1233. doi:10.1617/s11527-015-0572-z
Yildirim, O., HasanSengul, 2011. Modulus of elasticity of substandard and normal concretes. Constr.
Build. Mater. 25, 1645–1652. doi:10.1016/j.conbuildmat.2010.10.009
Zhang, P., Li, Q., 2013. Effect of polypropylene fiber on durability of concrete composite containing fly
ash and silica fume. Compos. Part B Eng. 45, 1587–1594.
doi:10.1016/j.compositesb.2012.10.006
Zheng, Z., Feldman, D., 1995. Synthetic fibre-reinforced concrete. Prog. Polym. Sci. 20, 185–210.
doi:10.1016/0079-6700(94)00030-6
Zhou, Y., Gao, J., Sun, Z., Qu, W., 2015. A fundamental study on compressive strength, static and
dynamic elastic moduli of young concrete. Constr. Build. Mater. 98, 137–145.
doi:10.1016/j.conbuildmat.2015.08.110

77
Appendix A Material and Equipment Specifications A. Materials
QUIKRETE® Portland Cement is used for making high strength repair mortars, concrete and for any other
applications requiring Type I
Aluminum 6061-T6 Cylinder Properties
Material Property Value
Density 2700 kg/m3
Tensile Strength 310 MPa
Yield Strength 270 MPa
Modulus of Elasticity 68 GPa
Modulus of Rigidity 26 GPa
Poisson’s Ratio 0.33
Element Composition (%)
Silicon 0.4 – 0.8
Iron 0 – 0.7
Copper 0.15 – 0.4
Manganese 0 – 0.15
Magnesium 0.8 – 1.2
Chromium 0.04 – 0.35
Zinc 0 – 0.25
Titanium 0 – 0.15
Aluminum 95.85 – 98.55

78

79
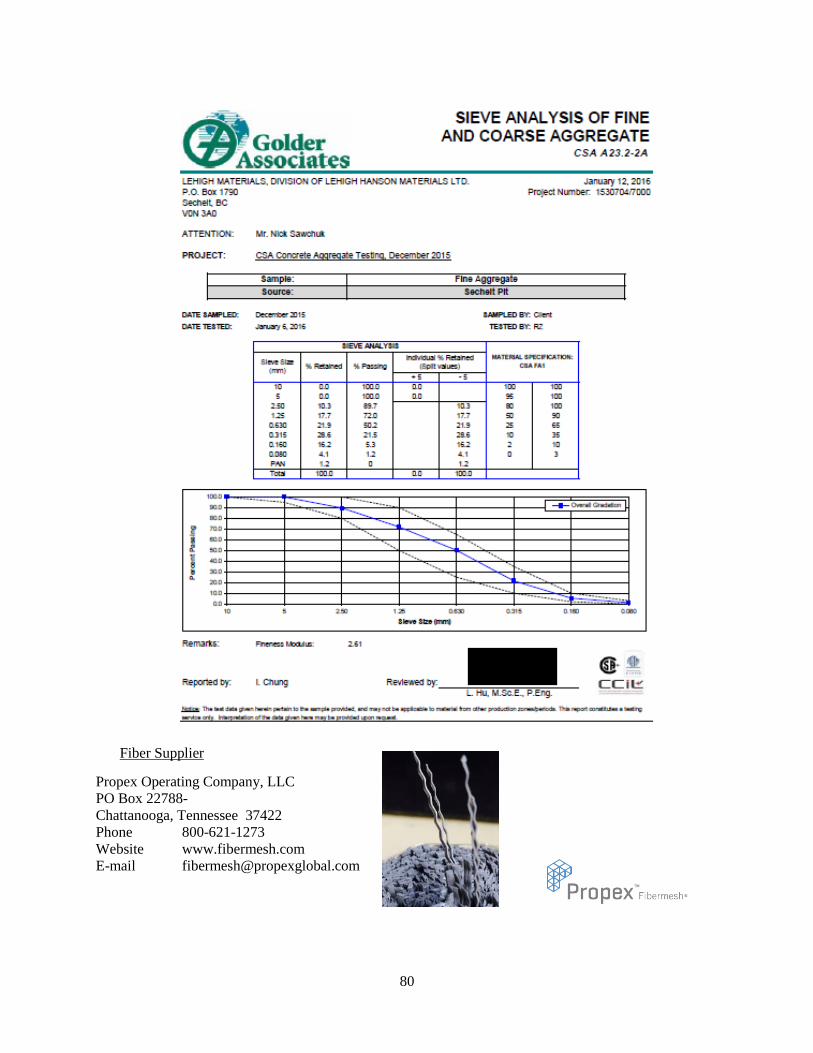
80
Fiber Supplier
Propex Operating Company, LLC
PO Box 22788-
Chattanooga, Tennessee 37422
Phone 800-621-1273
Website www.fibermesh.com
E-mail [email protected]
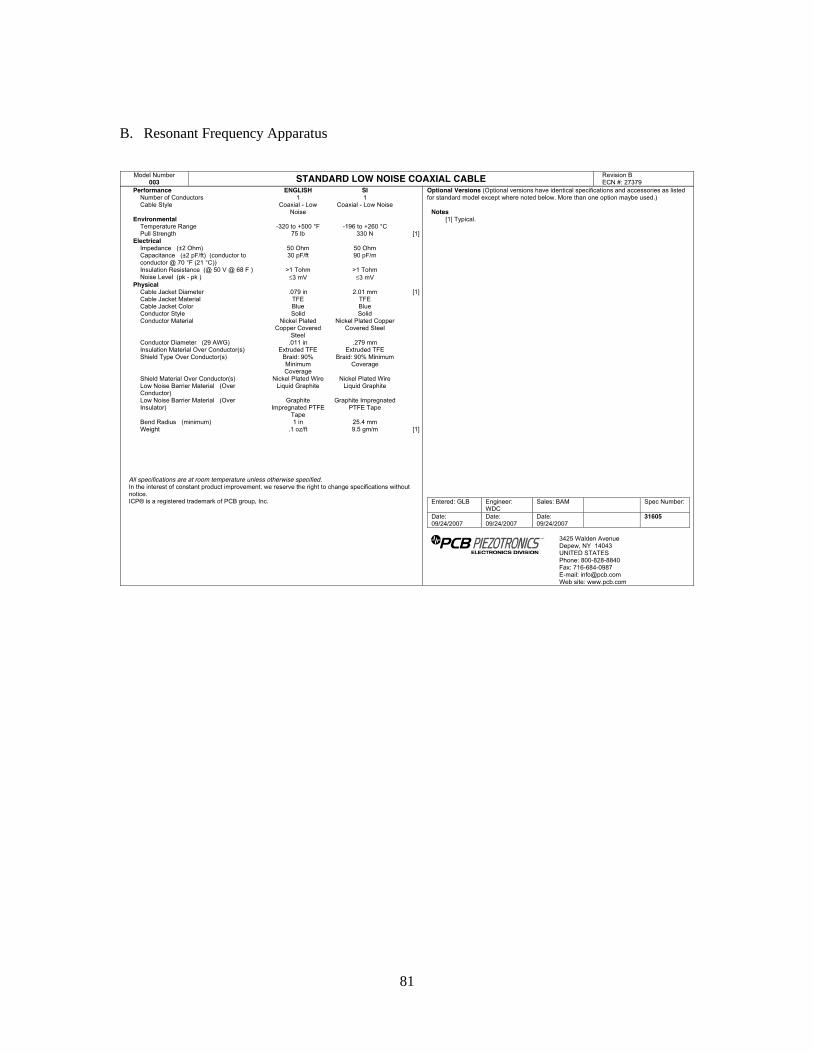
81
B. Resonant Frequency Apparatus

82
Appendix B Compressive Strength
The following tables contain the properties of concrete cylinders tested for compressive strength including
the maximum load at fracture and density of cylinders. Tests were performed on Ø100×200 concrete cured
in a water-bath set at 23±1˚C for each batch. Batch 3 includes the compressive strength of air dry specimens
at an ambient temperature 22±2˚C with a relative humidity of 50%.
Water-saturated Curing
Batch Mixture ID Cylinder # Mass
(Kg)
Density
(Kg/m3)
Load
(KN)
Compressive Strength
(MPa)
1
CC1
1 3.93 2385 274.59 33.6
2 3.90 2369 270.50 33.1
3 3.94 2391 268.87 32.9
FRC - A
1 3.90 2367 278.68 34.1
2 3.94 2391 268.05 32.8
3 3.86 2343 259.06 31.7
HFRC - A
1 3.85 2337 250.89 30.7
2 3.76 2282 247.62 30.3
3 3.80 2308 245.17 30.0
2
CC2
1 3.80 2306 238.93 29.7
2 3.78 2296 236.79 29.4
3 3.77 2288 246.42 30.6
FRC - B
1 3.72 2258 256.41 31.9
2 3.66 2224 266.38 33.1
3 3.70 2246 276.22 34.3
3
FRC - A
1 3.58 2172 244.89 31.7
2 3.54 2152 235.67 30.1
3 3.55 2153 239.11 32.9
FRC - B
1 3.69 2238 248.65 35.3
2 3.70 2242 226.25 35.0
3 3.67 2230 251.05 34.4
Ambient Curing
Batch Mixture ID Cylinder # Mass
(Kg)
Density
(Kg/m3)
Load
(KN)
Compressive Strength
(MPa)
3
FRC - A
1 3.56 2222 211.64 26.9
2 3.55 2206 211.86 27.0
3 3.51 2210 200.24 25.5
FRC-B
1 3.58 2246 236.32 30.1
2 3.552 2217 228.18 29.0
3 3.556 2241 224.60 28.6
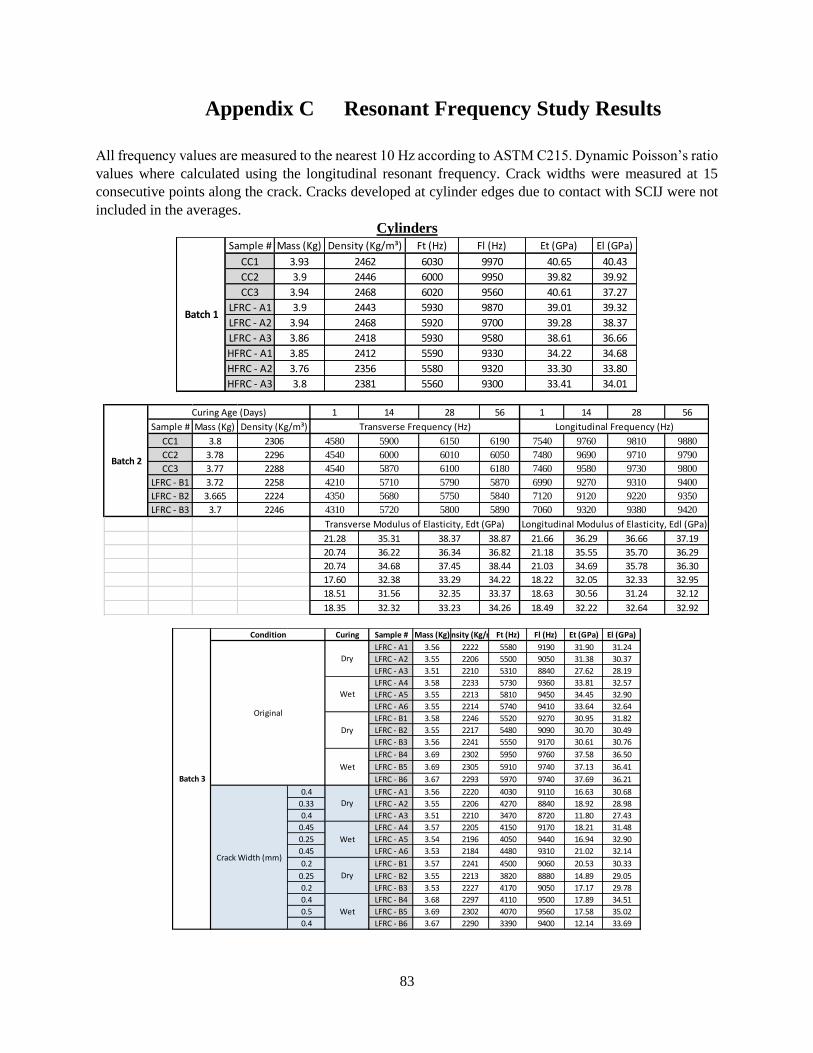
83
Appendix C Resonant Frequency Study Results
All frequency values are measured to the nearest 10 Hz according to ASTM C215. Dynamic Poisson’s ratio
values where calculated using the longitudinal resonant frequency. Crack widths were measured at 15
consecutive points along the crack. Cracks developed at cylinder edges due to contact with SCIJ were not
included in the averages.
Cylinders
Sample # Mass (Kg) Density (Kg/m³) Ft (Hz) Fl (Hz) Et (GPa) El (GPa)
CC1 3.93 2462 6030 9970 40.65 40.43
CC2 3.9 2446 6000 9950 39.82 39.92
CC3 3.94 2468 6020 9560 40.61 37.27
LFRC - A1 3.9 2443 5930 9870 39.01 39.32
LFRC - A2 3.94 2468 5920 9700 39.28 38.37
LFRC - A3 3.86 2418 5930 9580 38.61 36.66
HFRC - A1 3.85 2412 5590 9330 34.22 34.68
HFRC - A2 3.76 2356 5580 9320 33.30 33.80
HFRC - A3 3.8 2381 5560 9300 33.41 34.01
Batch 1
1 14 28 56 1 14 28 56
Sample # Mass (Kg) Density (Kg/m³)
CC1 3.8 2306 4580 5900 6150 6190 7540 9760 9810 9880
CC2 3.78 2296 4540 6000 6010 6050 7480 9690 9710 9790
CC3 3.77 2288 4540 5870 6100 6180 7460 9580 9730 9800
LFRC - B1 3.72 2258 4210 5710 5790 5870 6990 9270 9310 9400
LFRC - B2 3.665 2224 4350 5680 5750 5840 7120 9120 9220 9350
LFRC - B3 3.7 2246 4310 5720 5800 5890 7060 9320 9380 9420
21.28 35.31 38.37 38.87 21.66 36.29 36.66 37.19
20.74 36.22 36.34 36.82 21.18 35.55 35.70 36.29
20.74 34.68 37.45 38.44 21.03 34.69 35.78 36.30
17.60 32.38 33.29 34.22 18.22 32.05 32.33 32.95
18.51 31.56 32.35 33.37 18.63 30.56 31.24 32.12
18.35 32.32 33.23 34.26 18.49 32.22 32.64 32.92
Longitudinal Modulus of Elasticity, Edl (GPa)
Longitudinal Frequency (Hz)
Batch 2
Curing Age (Days)
Transverse Frequency (Hz)
Transverse Modulus of Elasticity, Edt (GPa)
Curing Sample # Mass (Kg)Density (Kg/m³)Ft (Hz) Fl (Hz) Et (GPa) El (GPa)
LFRC - A1 3.56 2222 5580 9190 31.90 31.24
LFRC - A2 3.55 2206 5500 9050 31.38 30.37
LFRC - A3 3.51 2210 5310 8840 27.62 28.19
LFRC - A4 3.58 2233 5730 9360 33.81 32.57
LFRC - A5 3.55 2213 5810 9450 34.45 32.90
LFRC - A6 3.55 2214 5740 9410 33.64 32.64
LFRC - B1 3.58 2246 5520 9270 30.95 31.82
LFRC - B2 3.55 2217 5480 9090 30.70 30.49
LFRC - B3 3.56 2241 5550 9170 30.61 30.76
LFRC - B4 3.69 2302 5950 9760 37.58 36.50
LFRC - B5 3.69 2305 5910 9740 37.13 36.41
LFRC - B6 3.67 2293 5970 9740 37.69 36.21
0.4 LFRC - A1 3.56 2220 4030 9110 16.63 30.68
0.33 LFRC - A2 3.55 2206 4270 8840 18.92 28.98
0.4 LFRC - A3 3.51 2210 3470 8720 11.80 27.43
0.45 LFRC - A4 3.57 2205 4150 9170 18.21 31.48
0.25 LFRC - A5 3.54 2196 4050 9440 16.94 32.90
0.45 LFRC - A6 3.53 2184 4480 9310 21.02 32.14
0.2 LFRC - B1 3.57 2241 4500 9060 20.53 30.33
0.25 LFRC - B2 3.55 2213 3820 8880 14.89 29.05
0.2 LFRC - B3 3.53 2227 4170 9050 17.17 29.78
0.4 LFRC - B4 3.68 2297 4110 9500 17.89 34.51
0.5 LFRC - B5 3.69 2302 4070 9560 17.58 35.02
0.4 LFRC - B6 3.67 2290 3390 9400 12.14 33.69
Dry
Wet
Batch 3
Wet
Dry
Wet
Dry
Dry
Wet
Condition
Original
Crack Width (mm)

84
Prisms
Sample # Mass (Kg) Density (Kg/m³) Ft (Hz) Fl (Hz) Fto (Hz) Et (GPa) El (GPa) G (Gpa) v
CC1 8.94 2474 2770 6150 3540 42.81 47.34 18.55 0.28
CC2 8.88 2410 2840 6180 3570 42.12 46.55 18.38 0.27
CC3 8.5 2353 2860 6200 3610 43.39 45.74 18.35 0.25
LFRC - A1 8.4 2325 2750 6040 3540 39.65 42.90 17.43 0.23
LFRC - A2 8.98 2390 2840 6120 3510 40.19 45.28 17.62 0.28
LFRC - A3 9.38 2404 2960 6140 3560 40.72 45.84 18.23 0.26
HFRC - A1 9.42 2483 2740 5960 3420 38.13 44.62 17.38 0.28
HFRC - A2 9.24 2459 2730 6010 3380 38.21 44.93 16.81 0.34
HFRC - A3 8.64 2354 2640 6030 3280 35.83 43.29 15.15 0.43
Batch 1
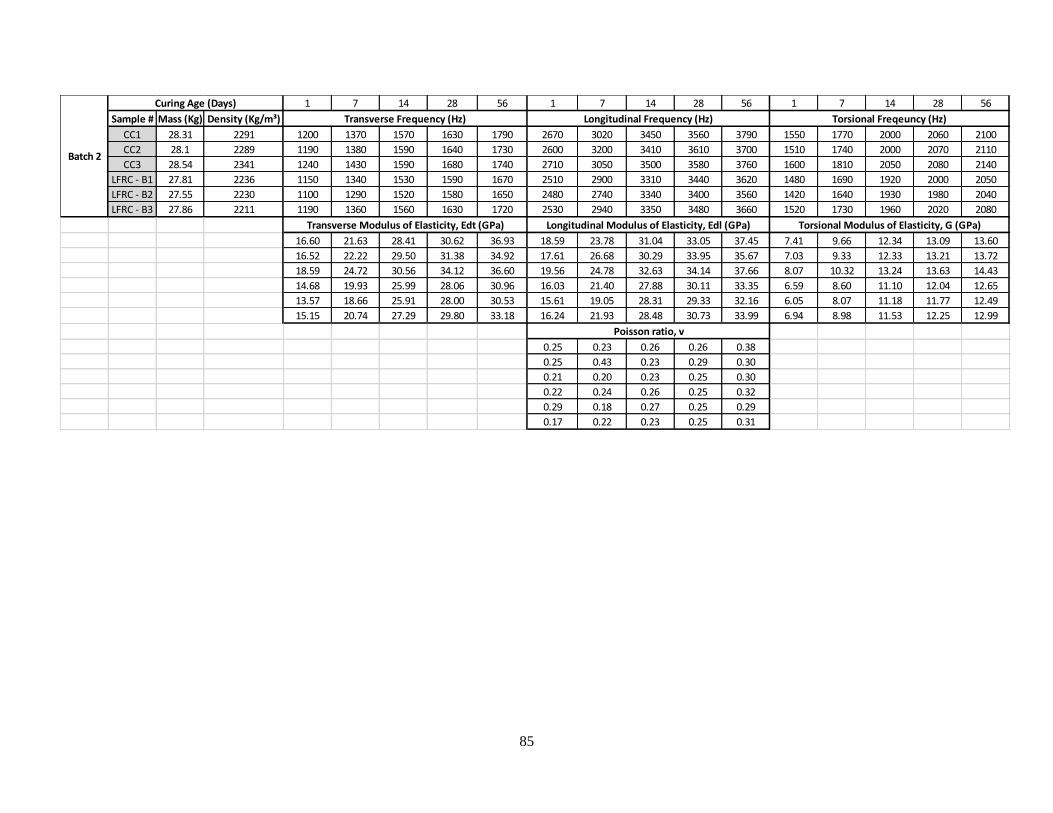
85
1 7 14 28 56 1 7 14 28 56 1 7 14 28 56
Sample # Mass (Kg) Density (Kg/m³)
CC1 28.31 2291 1200 1370 1570 1630 1790 2670 3020 3450 3560 3790 1550 1770 2000 2060 2100
CC2 28.1 2289 1190 1380 1590 1640 1730 2600 3200 3410 3610 3700 1510 1740 2000 2070 2110
CC3 28.54 2341 1240 1430 1590 1680 1740 2710 3050 3500 3580 3760 1600 1810 2050 2080 2140
LFRC - B1 27.81 2236 1150 1340 1530 1590 1670 2510 2900 3310 3440 3620 1480 1690 1920 2000 2050
LFRC - B2 27.55 2230 1100 1290 1520 1580 1650 2480 2740 3340 3400 3560 1420 1640 1930 1980 2040
LFRC - B3 27.86 2211 1190 1360 1560 1630 1720 2530 2940 3350 3480 3660 1520 1730 1960 2020 2080
16.60 21.63 28.41 30.62 36.93 18.59 23.78 31.04 33.05 37.45 7.41 9.66 12.34 13.09 13.60
16.52 22.22 29.50 31.38 34.92 17.61 26.68 30.29 33.95 35.67 7.03 9.33 12.33 13.21 13.72
18.59 24.72 30.56 34.12 36.60 19.56 24.78 32.63 34.14 37.66 8.07 10.32 13.24 13.63 14.43
14.68 19.93 25.99 28.06 30.96 16.03 21.40 27.88 30.11 33.35 6.59 8.60 11.10 12.04 12.65
13.57 18.66 25.91 28.00 30.53 15.61 19.05 28.31 29.33 32.16 6.05 8.07 11.18 11.77 12.49
15.15 20.74 27.29 29.80 33.18 16.24 21.93 28.48 30.73 33.99 6.94 8.98 11.53 12.25 12.99
0.25 0.23 0.26 0.26 0.38
0.25 0.43 0.23 0.29 0.30
0.21 0.20 0.23 0.25 0.30
0.22 0.24 0.26 0.25 0.32
0.29 0.18 0.27 0.25 0.29
0.17 0.22 0.23 0.25 0.31
Poisson ratio, v
Batch 2
Transverse Frequency (Hz) Longitudinal Frequency (Hz) Torsional Freqeuncy (Hz)
Curing Age (Days)
Transverse Modulus of Elasticity, Edt (GPa) Longitudinal Modulus of Elasticity, Edl (GPa) Torsional Modulus of Elasticity, G (GPa)
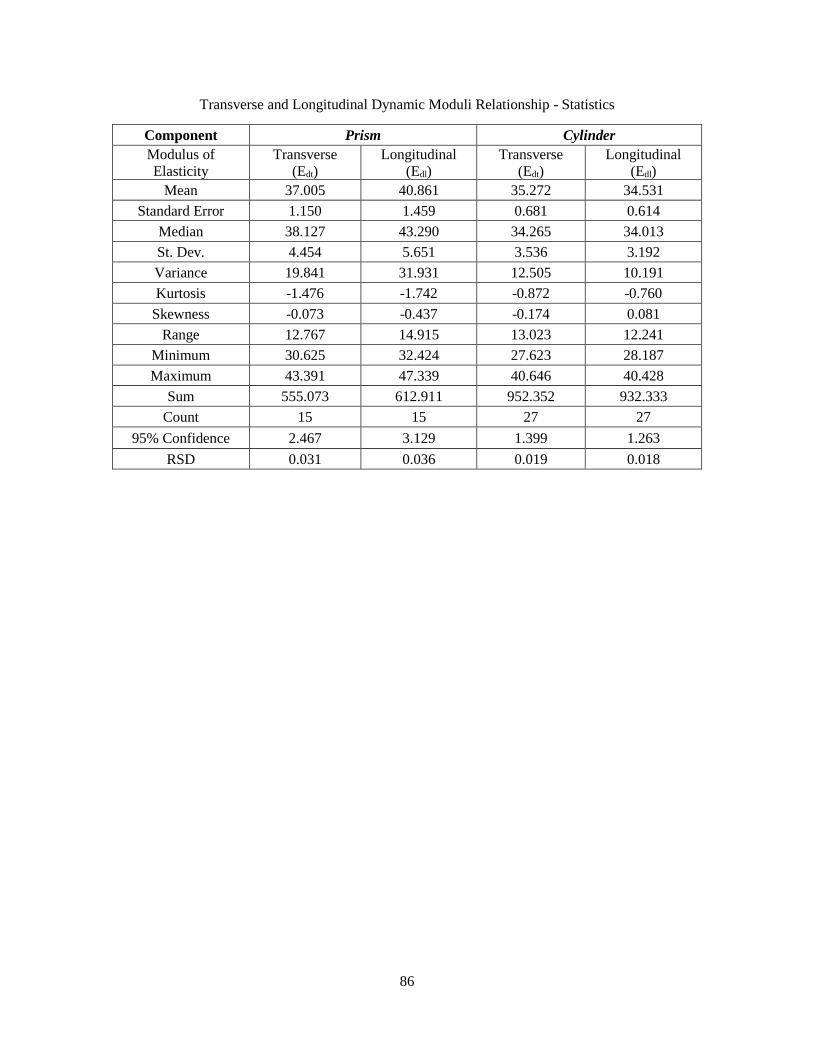
86
Transverse and Longitudinal Dynamic Moduli Relationship - Statistics
Component Prism Cylinder
Modulus of
Elasticity
Transverse
(Edt)
Longitudinal
(Edl)
Transverse
(Edt)
Longitudinal
(Edl)
Mean 37.005 40.861 35.272 34.531
Standard Error 1.150 1.459 0.681 0.614
Median 38.127 43.290 34.265 34.013
St. Dev. 4.454 5.651 3.536 3.192
Variance 19.841 31.931 12.505 10.191
Kurtosis -1.476 -1.742 -0.872 -0.760
Skewness -0.073 -0.437 -0.174 0.081
Range 12.767 14.915 13.023 12.241
Minimum 30.625 32.424 27.623 28.187
Maximum 43.391 47.339 40.646 40.428
Sum 555.073 612.911 952.352 932.333
Count 15 15 27 27
95% Confidence 2.467 3.129 1.399 1.263
RSD 0.031 0.036 0.019 0.018

87
Appendix D Repeatability Study Force Variation
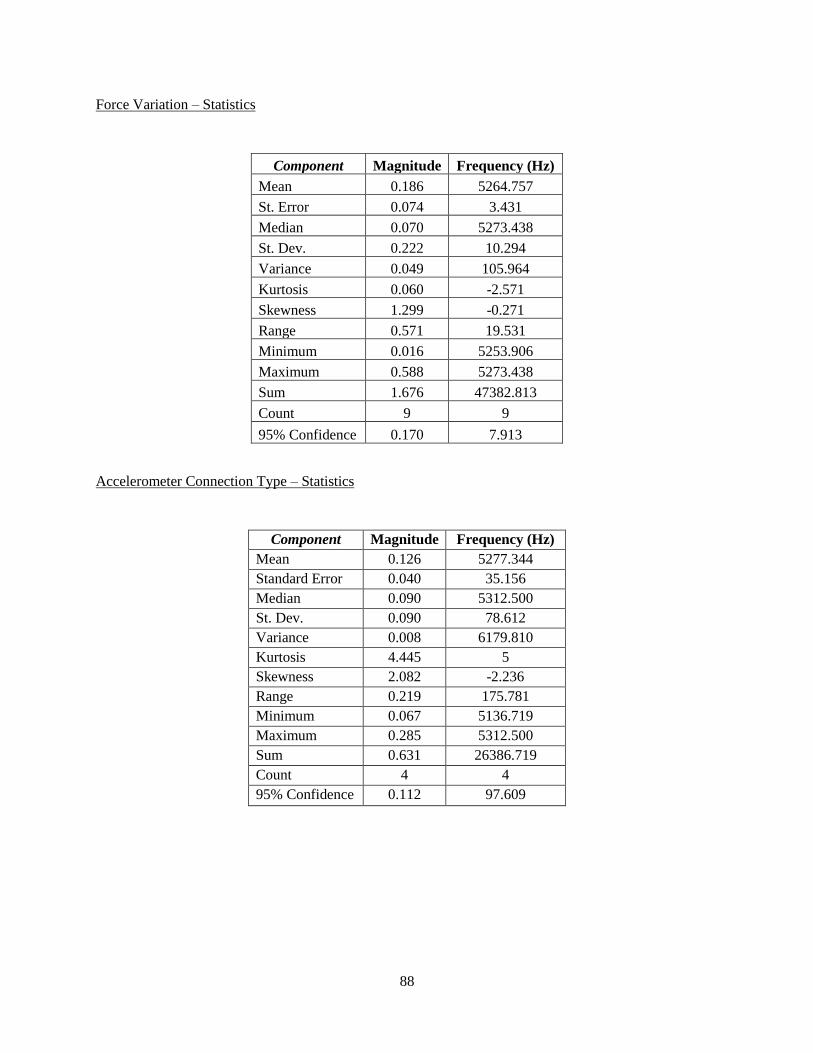
88
Force Variation – Statistics
Component Magnitude Frequency (Hz)
Mean 0.186 5264.757
St. Error 0.074 3.431
Median 0.070 5273.438
St. Dev. 0.222 10.294
Variance 0.049 105.964
Kurtosis 0.060 -2.571
Skewness 1.299 -0.271
Range 0.571 19.531
Minimum 0.016 5253.906
Maximum 0.588 5273.438
Sum 1.676 47382.813
Count 9 9
95% Confidence 0.170 7.913
Accelerometer Connection Type – Statistics
Component Magnitude Frequency (Hz)
Mean 0.126 5277.344
Standard Error 0.040 35.156
Median 0.090 5312.500
St. Dev. 0.090 78.612
Variance 0.008 6179.810
Kurtosis 4.445 5
Skewness 2.082 -2.236
Range 0.219 175.781
Minimum 0.067 5136.719
Maximum 0.285 5312.500
Sum 0.631 26386.719
Count 4 4
95% Confidence 0.112 97.609