Multiparameric t Magneic t Resonance Imaging in Evaluation ...
13
THIEME 65 Multiparametric Magnetic Resonance Imaging in Evaluation of Clinically Significant Prostate Cancer Sarang M. Ingole 1 Rajeev U. Mehta 1 Zubair N. Kazi 1 Rutuja V. Bhuyar 1 1 Department of Imaging Sciences and Pathology, Saifee Hospital, Mumbai, Maharashtra, India Address for correspondence Dr. Sarang Ingole, MBBS, DMRD, DNB Radiodiagnosis, FVIR, B - 303, Kanchan Sarita Apartments, 16, Farmland, Ramdaspeth, Nagpur - 440 010, Maharashtra, India (e-mail: [email protected]). Aim In this prospective study, we evaluate the role of multiparametric magnetic resonance imaging (mp-MRI) in the assessment of clinically significant prostate cancer at 1.5 T without endorectal coil (ERC). Materials and Methods Forty-five men with clinical suspicion of prostate cancer (prostate-specific antigen [PSA] level > 4 ng/mL, hard prostate on digital rectal exam- ination, and suspicious area at transrectal ultrasound [TRUS]) were evaluated using the mp-MRI protocol over a period of 24 months. All cases were interpreted using the Prostate Imaging Reporting and Data System (PI-RADS) version 2 guidelines and cor- related with histopathology. Statistical Analysis Used A chi-squared test was used for analysis of nominal/cate- gorical variables and receiver operating characteristic (ROC) curve and one-way analy- sis of variance (ANOVA) test for continuous variables. Results The mean age was 67 years and the mean PSA was 38.2 ng/mL. Eighty percent had prostate cancer and 20% were benign (11% benign prostatic hyperpla- sia [BPH] and 9% chronic prostatitis). Eighty-six percent of all malignancies were in the peripheral zone. The PI-RADS score for T2-weighted (T2W) imaging showed good sensitivity (81%) but low specificity (67%). The PI-RADS score for diffusion weighted imaging (DWI) with sensitivity of 92% and specificity of 78% had a better accuracy overall than T2W imaging alone. The mean apparent diffusion coefficient (ADC) value (×10 –6 mm 2 /s) was 732 ± 160 in prostate cancer, 1,009 ± 161 in chronic prostatitis, 1,142 ± 82 in BPH, and 663 in a single case of granulomatous prostatitis. Low ADC val- ues (<936) have shown good correlation (area under curve [AUC]: 0.87) with the pres- ence of cancer foci. Inverse correlation was observed between Gleason scores and ADC values. Dynamic contrast-enhanced (DCE) imaging has shown 100% sensitivity/nega- tive predictive value (NPV), but moderate specificity (67%) in predicting malignancy. The final PI-RADS score had 100% sensitivity and NPV with good overall positive pre- dictive value (PPV) of 95%. Conclusions T2W imaging and DWI remain the mainstays in diagnosis of prostate cancer with mp-MRI. DCE-MRI can be a problem-solving tool in case of equivocal find- ings. Because assessment with mp-MRI can be subjective, use of the newly developed PI-RADS version 2 scoring system is helpful in accurate interpretation. Abstract DOI https://doi.org/ 10.1055/s-0041-1730093 ISSN 0971-3026 © 2021. Indian Radiological Association This is an open access article published by Thieme under the terms of the Creative Commons Attribution-NonDerivative-NonCommercial-License, permitting copying and reproduction so long as the original work is given appropriate credit. Contents may not be used for commercial purposes, or adapted, remixed, transformed or built upon. (https://creativecommons.org/licenses/by-nc-nd/4.0/). Thieme Medical and Scientific Publishers Private Ltd. A-12, Second Floor, Sector -2, NOIDA -201301, India Indian J Radiol Imaging 2021;31:65–77. Keywords ► DCE-MRI ► diffusion weighted Imaging ► mp-MRI ► multiparametric MRI ► PI-RADS ► prostate cancer Original Article published online May 23, 2021 Published online: 2021-05-23
Transcript of Multiparameric t Magneic t Resonance Imaging in Evaluation ...
THIEME
65
Multiparametric Magnetic Resonance Imaging in Evaluation of Clinically Significant Prostate Cancer Sarang M. Ingole 1 Rajeev U. Mehta 1 Zubair N. Kazi 1 Rutuja V. Bhuyar 1
1 Department of Imaging Sciences and Pathology, Saifee Hospital, Mumbai, Maharashtra, India
Address for correspondence Dr. Sarang Ingole, MBBS, DMRD, DNB Radiodiagnosis, FVIR, B - 303, Kanchan Sarita Apartments, 16, Farmland, Ramdaspeth, Nagpur - 440 010 , Maharashtra , India (e-mail: [email protected] ) .
Aim In this prospective study, we evaluate the role of multiparametric magnetic resonance imaging (mp-MRI) in the assessment of clinically significant prostate cancer at 1.5 T without endorectal coil (ERC). Materials and Methods Forty-five men with clinical suspicion of prostate cancer (prostate-specific antigen [PSA] level > 4 ng/mL, hard prostate on digital rectal exam-ination, and suspicious area at transrectal ultrasound [TRUS]) were evaluated using the mp-MRI protocol over a period of 24 months. All cases were interpreted using the Prostate Imaging Reporting and Data System (PI-RADS) version 2 guidelines and cor-related with histopathology. Statistical Analysis Used A chi-squared test was used for analysis of nominal/cate-gorical variables and receiver operating characteristic (ROC) curve and one-way analy-sis of variance (ANOVA) test for continuous variables. Results The mean age was 67 years and the mean PSA was 38.2 ng/mL. Eighty percent had prostate cancer and 20% were benign (11% benign prostatic hyperpla-sia [BPH] and 9% chronic prostatitis). Eighty-six percent of all malignancies were in the peripheral zone. The PI-RADS score for T2-weighted (T2W) imaging showed good sensitivity (81%) but low specificity (67%). The PI-RADS score for diffusion weighted imaging (DWI) with sensitivity of 92% and specificity of 78% had a better accuracy overall than T2W imaging alone. The mean apparent diffusion coefficient (ADC) value (×10 –6 mm 2 /s) was 732 ± 160 in prostate cancer, 1,009 ± 161 in chronic prostatitis, 1,142 ± 82 in BPH, and 663 in a single case of granulomatous prostatitis. Low ADC val-ues (<936) have shown good correlation (area under curve [AUC]: 0.87) with the pres-ence of cancer foci. Inverse correlation was observed between Gleason scores and ADC values. Dynamic contrast-enhanced (DCE) imaging has shown 100% sensitivity/nega-tive predictive value (NPV), but moderate specificity (67%) in predicting malignancy. The final PI-RADS score had 100% sensitivity and NPV with good overall positive pre-dictive value (PPV) of 95%. Conclusions T2W imaging and DWI remain the mainstays in diagnosis of prostate cancer with mp-MRI. DCE-MRI can be a problem-solving tool in case of equivocal find-ings. Because assessment with mp-MRI can be subjective, use of the newly developed PI-RADS version 2 scoring system is helpful in accurate interpretation.
Abstract
DOI https://doi.org/10.1055/s-0041-1730093ISSN 0971-3026
© 2021. Indian Radiological AssociationThis is an open access article published by Thieme under the terms of the Creative Commons Attribution-NonDerivative-NonCommercial-License, permitting copying and reproduction so long as the original work is given appropriate credit. Contents may not be used for commercial purposes, or adapted, remixed, transformed or built upon. (https://creativecommons.org/licenses/by-nc-nd/4.0/).Thieme Medical and Scientific Publishers Private Ltd. A-12, Second Floor, Sector -2, NOIDA -201301, India
Indian J Radiol Imaging 2021;31:65–77.
Keywords ► DCE-MRI ► diffusion weighted
Imaging ► mp-MRI ► multiparametric MRI ► PI-RADS ► prostate cancer
Original Article
published onlineMay 23, 2021
Published online: 2021-05-23

66
Indian Journal of Radiology and Imaging Vol. 31 No. 1/2021 ©2021. Indian Radiological Association
Multiparametric MRI in Evaluating Clinically Significant Prostate Cancer Ingole et al.
IntroductionProstate cancer (PCa) is the second most frequent malignancy (after lung cancer) in men and the fifth leading cause of death worldwide.1 Detection and clinical staging of PCa currently includes a prostate-specific antigen (PSA) test, a digital rec-tal examination (DRE), and a transrectal ultrasound (TRUS) guided prostate biopsy. However, the biology of PCa is indo-lent, and incidence does not reflect mortality. Also, the cur-rent diagnostic pathway for PCa has resulted in overdiagnosis and consequent overtreatment as well as underdiagnosis and missed diagnoses in many men. This has led to reframed screening guidelines pivoting around serum PSA and concep-tualizing clinically significant PCa (CSC).2 Multiparametric magnetic resonance imaging (mp-MRI) of the prostate is a novel promising tool for diagnosis of clinically significant PCa and to reduce overdiagnosis of insignificant PCa.3 In 2012, European Society of Urogenital Radiology (ESUR) pros-tate MRI working group developed and published Prostate Imaging Reporting and Data System version 1 (PI-RADS v1) for standardizing the acquisition, interpretation, and report-ing of prostate MRI. Although PI-RADS v1 served this import-ant purpose, its adoption was limited because of potential weaknesses in the proposed reporting system and ongoing evolution in the field itself. In 2015, American College of Radiology published PI-RADS v2, which addressed many of the shortcomings associated with PI-RADS v1 by providing specific algorithm for deriving an overall assessment on the basis of a lesion’s individual scores on T2-weighted imaging (T2WI), diffusion weighted imaging (DWI), and dynamic contrast-enhanced MRI (DCE-MRI).
In developing countries, widespread availability of 3-T MRI is still a challenge and cost of upgrading from the existing 1.5 to 3 T or use of endorectal coil (ERC) does not justify its rou-tine use.
The scope of the current study was to evaluate the role of mp-MRI-based PI-RADS v2 for the assessment of clinically significant PCa at 1.5 T without using ERC.
Materials and MethodsThis prospective study was conducted in tertiary care hospi-tal and approved by the institutional review board.
Study PopulationA total of 45 male patients within the study period from 2015 to 2017 with strong clinical suspicion of PCa (lower urinary tract symptoms and DRE) and raised PSA value (>4 ng/mL) or TRUS biopsy-proven cases of PCa were evalu-ated. Patients who had undergone prostatic biopsy less than 6 weeks before the MRI, post-hormonal/radiation therapy, and who had general contraindication for MRI were excluded from study.
Mp-MRI ProtocolMRI was performed on MAGNETOM Avanto (Siemens Healthcare, Erlangen, Germany), Syngo MR 2004 V, 1.5-T 18-channel equipment. A dedicated body matrix coil was used for imaging the prostate. The imaging protocol used is given in detail in ►Table 1.
All images were analyzed by two radiologists with >10 and >20 years of experience.
The following assessments were made: volume of the prostate gland, distribution of lesions (focal or dif-fuse), and location of the lesion either in the central gland (transition/central zone) or the peripheral gland (peripheral zone [PZ]) or both.
The prostate was viewed in T1WI, T2WI, and DWI sequences with calculation of ADC values using the ADC maps and any abnormality was identified. When multiple lesions were noted, the most representative lesion or the largest of the lesions was taken as the index lesion. The PI-RADS score was assigned to the index lesion on T2WI and DWI separately. In addition, early enhancement on DCE-MRI and Cho + Cr/Ci ratio on magnetic resonance spectroscopy (MRS) in the index
Table 1 Multiparametric magnetic resonance imaging (mp-MRI) protocol
Image plane Acquisition scheme Slice thickness (mm)
TR TE FOV (mm) Matrix Flip angle
T2 axial Fast spin echo 3 4,100 102 220/100 320 × 224 150
T2 coronal Fast spin echo 3 4,760 102 220/100 320 × 224 150
T2 sagittal Fast spin echo 3 4,500 96 220/100 320 × 224 150
DWI Echo planar imaging (EPI) b value = 50,400,800
3 3,700 80 340/100 192 × 192 –
T1 axial Fast Spin echo 3 720 11 220/100 320 × 224 150
T1WDCE 3D fast spoiled gradient recalled (FSPGR-VIBE)a
– 4.7 1.6 260/100 138 × 192 12
STIR axial/coronal IR 3 3,100 55 220/100 179 × 256 150
Abbreviations: DCE, dynamic contrast-enhanced; DWI, diffusion weighted imaging; FOV, field of view; IR, inversion recovery; STIR, short tau inversion recovery; TE, echo time; TR, repetition time; T1W, T1-weighted; VIBE, volumetric interpolated breath-hold examination.aObtained immediately before, during, and after bolus administration of 0.1 mmol/kg body weight MultiHance (gadobenate dimeglumine; Gd-BOPTA, Bracco SpA, Milano, Italy) at a rate of 2 mL/s using a power injector Medrad Spectris Solaris EP MR injection system(Bayer Vital GmbH, Bayer HealthCare, Leverkusen, Germany) followed by 15-mL saline flush. The acquisitions were obtained every 5 seconds.

67Multiparametric MRI in Evaluating Clinically Significant Prostate Cancer Ingole et al.
Indian Journal of Radiology and Imaging Vol. 31 No. 1/2021 ©2021. Indian Radiological Association
lesion was also studied. In equivocal cases on DWI for lesions in the PZ, DCE curve was referred to and a final PI-RADS score was given, whereas in equivocal cases for lesion in the transi-tion zone (TZ), the DWI score was referred to and accordingly the final PI-RADS score was given (►Figs. 1 and 2). In addi-tion, assessment of pelvic soft-tissue structures was done for the involvement of extra prostatic/capsular extension (ECE), seminal vesicles (SV), neurovascular bundle (NVB), and pel-vic lymph nodes (LN).
All patients a underwent 12-core TRUS-guided biopsy with which individual and combined parameters on various MRI sequences and PI-RADS v2 score were correlated.
Biopsy was performed with each core from the medial and lateral aspects of the gland at the apex, mid-gland, and base in right and left halves. Biopsy specimens were fixed in form-aldehyde, embedded in paraffin, and stained with hematoxy-lin and eosin. Lesions were reported as cancer (and assigned Gleason scores) or as benign tissue for each core. The pathol-ogists were blinded to the results of MRI examination. The index lesion was plotted on PI-RADS sector map and histopa-thology finding of the corresponding core—benign prostatic hyperplasia (BPH), prostatitis, cancer with its Gleason score—was taken into consideration. Ten patients of this cohort also underwent radical prostatectomy at our institute, with which staging parameters were correlated.
Statistical AnalysisContinuous variables were summarized as mean and stan-dard deviations, and nominal/categorical variables as proportions (%).Chi-squared test was used for analysis of
nominal/categorical variables. Receiver operating character-istic (ROC) curve and one-way analysis of variance (ANOVA) test were used for continuous variables. Diagnostic accu-racy for various sequences of MRI was assessed by means of sensitivity, specificity, positive predictive value (PPV), and negative predictive value (NPV). A p < 0.05 was considered significant. IBM SPSS Statistics 22.0 and MedCalc v12.5 were used for all statistical calculations.
Results
In our study, the mean age of the study population was 67 years with majority of patients belonging to the 65 to 74 years age group (52%). The mean PSA was 38.2 ng/mL with most of the malignant lesions belonging to the high-suspicion group (>10 ng/mL; ►Table 2). However, no significant cor-relation between rising PSA values and PCa could be conclu-sively established.
Of the 45 patients evaluated in our study, 26 (57%) had focal lesions, of which 22 were malignant and 4 were benign. The remaining 19 patients (43%) had diffuse lesions, of which 14 were malignant and 5 were benign. PCa was seen in ~84% of focal lesions (n = 22) and 73% of diffuse lesions (n = 14); no statistically significance difference was found in the distribu-tion of lesions.
Most of the cases in our study cohort were distributed in the PZ (51%, n = 23); ~33% (n = 15) of lesions involved both the PZ and the TZ and 16% (n = 7) were seen only in the TZ. Approximately 86% (n = 31) of malignancies involved the PZ, whereas only 13% (n = 5) of PCa were seen in the TZ.
Fig. 1 Flowchart for peripheral zone lesion. ADC, apparent diffusion coefficient; BPH, benign prostatic hyperplasia; DCE, dynamic contrast enhanced; DWI, diffusion weighted imaging; PI-RADS, Prostate Imaging Reporting and Data System; T2WI, T2-weighted image.
68
Indian Journal of Radiology and Imaging Vol. 31 No. 1/2021 ©2021. Indian Radiological Association
Multiparametric MRI in Evaluating Clinically Significant Prostate Cancer Ingole et al.
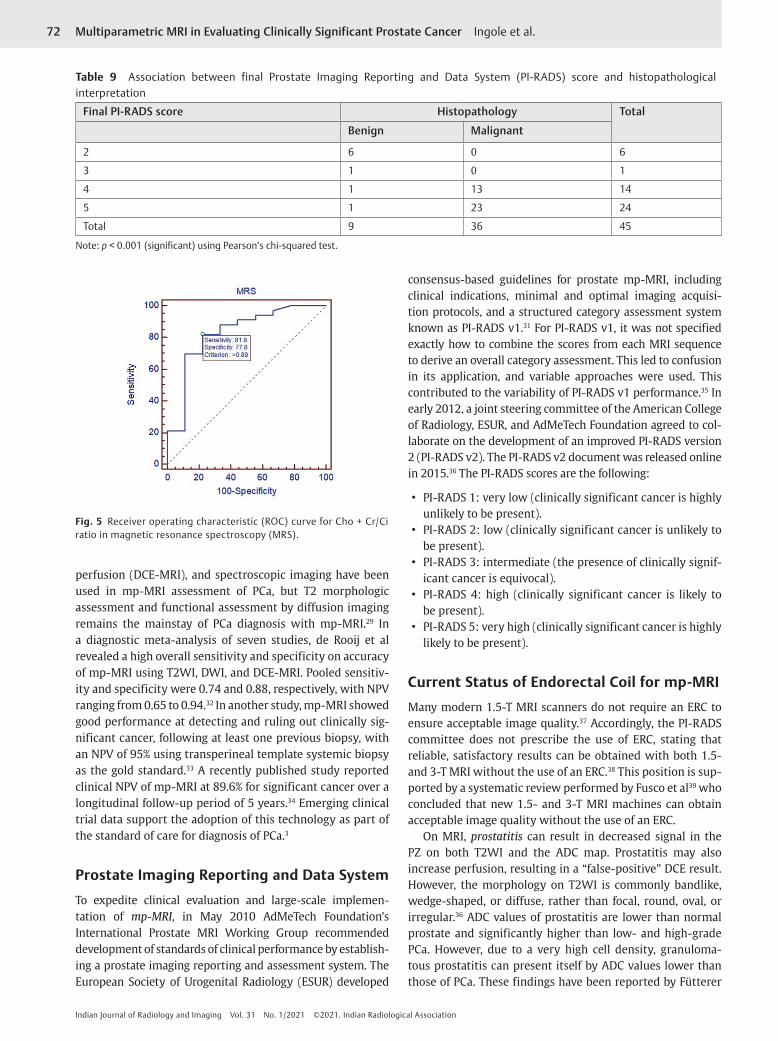
On post biopsy follow-up, 80% (n = 36) of the study cohort had PCa and 20% of cases (n = 9) were benign. Among the benign cases, 11% (n = 5) had BPH and 9% (n = 4) had chronic prostatitis, a single case (2%) of which had dense granuloma-tous prostatitis with microabscesses (►Table 3).
In our study, of the five cases that were given a PI-RADS score of 2 (clinically significant cancer unlikely to be pres-ent), based on T2WI, only one turned out to be malignant. Of the eight cases reported as PI-RADS 3 (equivocal presence of clinically significant cancer), six turned out to be malignant. Of the nine cases reported as PI-RADS 4 (clinically significant cancer likely to be present), two turned out to be benign.
Twenty-two of 23 cases reported as PI-RADS 5 (clinically sig-nificant malignancy highly likely to be present) turned out to be malignant (►Table 4). PI-RADS score for T2WI showed good sensitivity (81%) but low specificity (67%) with good PPV (91%) for PI-RADS scores 4 and 5.
On DWI, none of the six cases that were given a PI-RADS score of 2 (clinically significant cancer unlikely to be pres-ent) turned out to be malignant. Of the four cases reported as PI-RADS 3 (equivocal presence of clinically significant cancer), three were malignant. Of the 10 cases reported as PI-RADS 4 (clinically significant cancer likely to be present), only 1 was benign. Twenty-four of the 25 cases reported as PI-RADS 5 (clinically significant malignancy highly likely to be present) turned out to be malignant (►Table 5). The PI-RADS scores for DWI had sensitivity of 92%, specificity of 78%, PPV of 94%, and NPV of 70%, with overall accuracy better than T2WI alone.
The malignant lesions had a mean ADC value of 732 ± 160 × 10–6 mm2/s, benign prostatic hypertrophy had mean of 1,142 ± 82 × 10–6 mm2/s and chronic prostatitis had mean 1,009 ± 161 × 10–6 mm2/s. However, a single case of dense granulomatous prostatitis with microabscesses had a
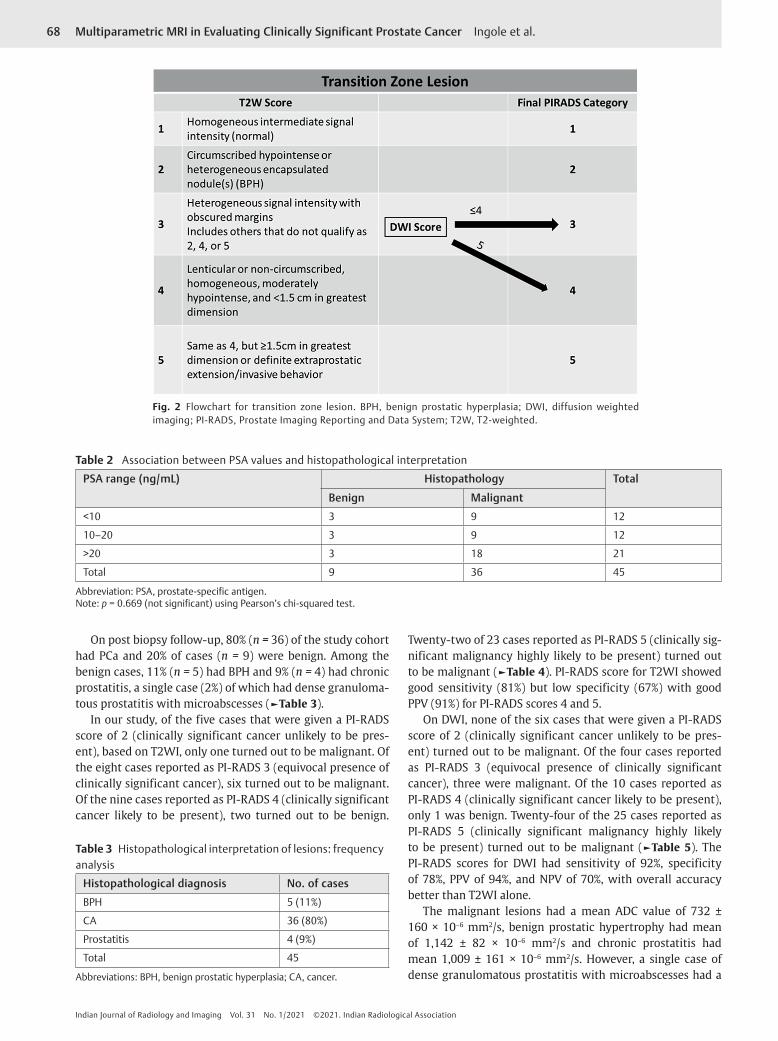
Fig. 2 Flowchart for transition zone lesion. BPH, benign prostatic hyperplasia; DWI, diffusion weighted imaging; PI-RADS, Prostate Imaging Reporting and Data System; T2W, T2-weighted.
Table 2 Association between PSA values and histopathological interpretation
PSA range (ng/mL) Histopathology Total
Benign Malignant
<10 3 9 12
10–20 3 9 12
>20 3 18 21
Total 9 36 45
Abbreviation: PSA, prostate-specific antigen.Note: p = 0.669 (not significant) using Pearson’s chi-squared test.
Table 3 Histopathological interpretation of lesions: frequency analysis
Histopathological diagnosis No. of cases
BPH 5 (11%)
CA 36 (80%)
Prostatitis 4 (9%)
Total 45
Abbreviations: BPH, benign prostatic hyperplasia; CA, cancer.

69Multiparametric MRI in Evaluating Clinically Significant Prostate Cancer Ingole et al.
Indian Journal of Radiology and Imaging Vol. 31 No. 1/2021 ©2021. Indian Radiological Association
mean ADC value of 663 × 10–6 mm2/s (►Table 6). ROC curve analysis showed a statistical difference in the ADC values of benign and malignant lesions with suggested cutoff crite-rion of <936 (►Fig. 3). In addition, inverse correlation was observed between Gleason score and ADC values in patho-logically proven cases of cancer (36 cases), that is, lower the value, higher the grade of tumor (►Table 7 and ►Fig. 4).
DCE-MRI was performed in 44 of 45 cases. In one case, DCE-MRI could not be performed due to raised serum creat-inine. Thirty-eight of 44 cases showed early enhancement, of which 35 turned out to be malignant. None of the six cases that did not show early enhancement turned out to be malignant. The sensitivity and specificity of DCE-MRI for PCa diagnosis was 100% and 67%, respectively (►Table 8). Of the four cases with PI-RADS category 3 on DWI, three were in the PZ and showed early enhancement. So the final PI-RADS score was upgraded to 4 according to the new guidelines, and all of them turned out to be malignant on histopathology.
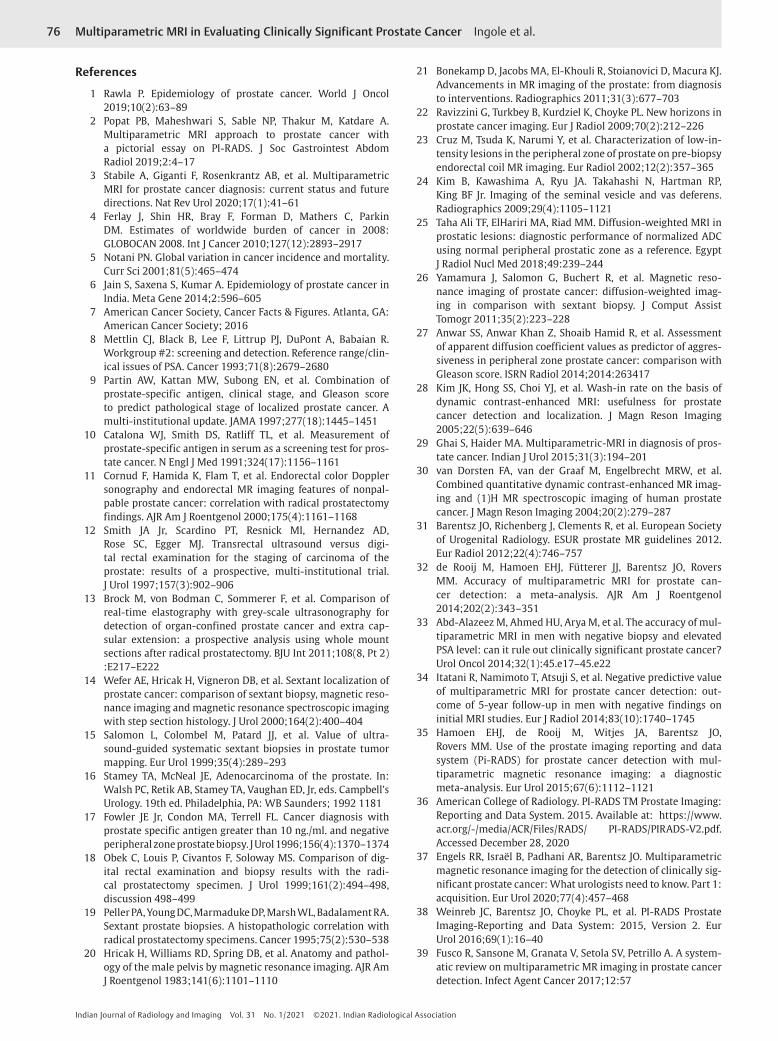
The final PI-RADS score had almost 100% sensitivity and NPV, with good overall PPV (95%). Moderate specificity (78%) may be due to few false-positive cases of chronic prostatitis and microabscesses. However, none of the malignant cases were missed in the final PI-RADS scoring (►Table 9).
MRS was performed for 42 of 45 patients and it showed moderate sensitivity (81%) and specificity (78%), good PPV (93%), but poor NPV (53%) with suggested Cho + Cr/Ci ratio cutoff criterion >0.89 (►Fig. 5).
The ROC curve analysis showed the highest area under curve (AUC) and in turn the diagnostic performance for the final PI-RADS score (0.90), which integrated the mp-MRI
protocol, followed by DWI alone (0.89), T2WI alone (0.83), and MRS alone (0.82).
The role of 1.5-T MRI in staging was correlated in 10 patients who underwent radical prostatectomy at our institute. In our study, use of 1.5-T MRI without ERC has shown low sensitiv-ity and specificity for detection of ECE and NVB involvement. However, excellent specificity was seen in detection of SV involvement and pelvic lymph nodal metastasis.
DiscussionThe worldwide PCa burden is expected to grow to 1.7 million new cases and 499,000 new deaths by 2030 simply due to the growth and aging of the global population.4 Although the incidence rates of PCa are considered low in Asian and North African countries, ranging from 1 to 9/100,000 persons, demo-graphic and epidemiological transitions in developing coun-tries like India have shown an increasing trend in the burden of various cancer cases including PCa.5 Data from national can-cer registries show that the incidence rates of certain cancers are on rise in India. The cancers that are showing significant increase in incidence rates include prostate, mouth, and kidney cancers in males; corpus uteri, breast, and thyroid in females; and lung cancer in both males and females. The prostate is the second leading site of cancer among males in large Indian cit-ies like Delhi, Kolkata, Pune, and Thiruvananthapuram; third leading site of cancer in cities like Bangalore and Mumbai; and it is among the top 10 leading sites of cancers in the rest of the population based cancer registries (PBCRs) of India.6 The 5-year survival rate is close to 100% if the disease is diagnosed in its early stages; however, the survival rate drops to 28% if the
Table 4 Association between T2 PI-RADS score and histopathological interpretation
T2W PI-RADS score Histopathology Total
Benign Malignant
2 4 1 5
3 2 6 8
4 2 7 9
5 1 22 23
Total 9 36 45
Abbreviations: PI-RADS, Prostate Imaging Reporting and Data System; T2W, T2-weighted.Note: p = 0.002 (significant) using Pearson’s chi-squared test.
Table 5 Association between DWI PI-RADS score and histopathological interpretation
DWI PI-RADS score Histopathology Total
Benign Malignant
2 6 0 6
3 1 3 4
4 1 9 10
5 1 24 25
Total 9 36 45
Abbreviations: DWI, diffusion weighted imaging; PI-RADS, Prostate Imaging Reporting and Data System.Note: p < 0.001 (significant) using Pearson’s chi-squared test.

70
Indian Journal of Radiology and Imaging Vol. 31 No. 1/2021 ©2021. Indian Radiological Association
Multiparametric MRI in Evaluating Clinically Significant Prostate Cancer Ingole et al.
disease is metastatic at the time of diagnosis.7 So early diagno-sis is pivotal in the management of PCa.
DRE is only limited to detecting lesions protruding the sur-face of the prostate. It has a very low sensitivity of only 30% and a specificity of 40% for the diagnosis of organ-confined disease.8,9
PSA has been used worldwide for screening PCa. Elevation of PSA level above 4 ng/mL indicates 22% probability of PCa, and a further increase above 10 ng/mL raises the cancer risk to 63%.10 It has been shown that many men may harbor PCa despite low levels of PSA. Several refinements to the standard PSA measurement have been introduced to try and increase the accuracy of prostate-specific cancer identification. These refinements include PSA density (PSA divided by the prostate volume), PSA TZ density (PSA divided by the volume of the TZ), free-to-total PSA ratio (the fraction of unbound serum PSA), and PSA velocity (the rate of change in PSA over time). However, these new refinements have not yet entered into widespread clinical practice.
On TRUS, PCa appears as a hypoechoic lesion in the PZ.11 However, many cancers are undetectable, and are pre-sumably isoechoic. Thus, TRUS has poor sensitivity (18.3%) and is also not highly specific.13
TRUS-guided biopsy is the current standard of reference for diagnosis of PCa in a patient who has an abnormal DRE or PSA.14-19 Approximately 20% of patients with an elevated PSA
and a negative initial biopsy will have a subsequent positive biopsy, presumably due to sampling error. Also, true Gleason scores may not be represented in the scores obtained due to sampling error. In an effort to improve the results from biopsy, several investigators have advocated routine use of up to 12 biopsies.
MRI findings in PCa were first described in the early 1980s.20 Limitations in evaluating the location, volume, local extent of disease, and the risk of progression by traditional methods of assessment are major roadblocks to improving the management of patients with PCa. As a result, there is considerable interest in other assessment modalities, partic-ularly MRI.
T1-weighted sequences are mainly used (1) for detection of post biopsy hemorrhage; (2) for evaluation of the contour of the prostate and the status of the NVB, which are well seen in the bright periprostatic fat; and (3) as a baseline sequence for calculation of precontrast T1WI and DCE-MRI for pur-poses of subtraction.21
The zonal anatomy of the prostate gland is best depicted on high-resolution T2W images. The central zone and TZ can-not be distinguished and are collectively called the central gland. Differentiation between the two cannot be made by imaging appearances but is based primarily on anatomic location, which is separated from the PZ by a thin pseudo-capsule.22 On T2W images, the PZ shows high signal inten-sity (SI), which is either equal to or more than that of the fat in the vicinity23 and attributed to the fluid-filled ductal and acinar components, with age-related increase in the SI.24 Compared with the PZ, the central gland displays a low or heterogeneous T2 SI since it contains fewer glandular structures and smooth muscles and appears heterogeneous due to the presence of nodules and cysts. The true capsule, seen as a low-intensity rim, is best appreciated on the poste-rior and posterolateral aspects of the gland. This capsule is an important imaging landmark in PCa as extracapsular exten-sion (ECE) can upstage the tumor to T3.
DWI demonstrates the restriction of diffusion and the reduction of apparent diffusion coefficient (ADC) values in cancerous tissue. This technique allows short acquisi-tion time and provides high contrast resolution between cancer and normal tissue, but individual variability in ADC values may erode diagnostic performance. Using high b-values enhances the DWI sensitivity by reduction of the long T2 relaxation time tissue hyperintensity and therefore cancelling T2 shine-through.25 In our study, we used three b-values (50, 400, and 800), with gradients applied in all the three directions. These are the same sequence parameters that were used by Yamamura et al26 and Anwar et al.27
DCE-MRI allows assessment of parameters that are useful for differentiating cancer from normal tissue. It allows mea-surement of the SI of regions of interest (ROI) before arrival of contrast agent (base line) and observes the increase in SI during the wash-in phase and the decrease of SI during the wash-out phase. The advantages of this technique include direct depiction of tumor vascularity and, possibly, obviation of an ERC; however, there also are disadvantages, such as lim-ited visibility of cancer in the TZ. At 1.5 T, DCE-MRI improves
Table 6 Mean ADC values in different prostatic lesions
Histopathology No. ADC value (× 10–6 mm2/s) mean ± SD
BPH 5 1,142.40 ± 82.60
Prostatitis 3 1,009.67 ± 161.73
Adenocarcinoma 36 732.33 ± 160.41
Microabscess 1 663.00
Total 45 794.84 ± 206.74
Abbreviations: ADC, apparent diffusion coefficient; BPH, benign pros-tatic hyperplasia; SD, standard deviation.
Fig. 3 Receiver operating characteristic (ROC) curve for apparent diffusion coefficient (ADC) value.

71Multiparametric MRI in Evaluating Clinically Significant Prostate Cancer Ingole et al.
Indian Journal of Radiology and Imaging Vol. 31 No. 1/2021 ©2021. Indian Radiological Association
accuracy, sensitivity, and specificity for PCa detection by 26, 31, and 22%, respectively, relative to T2WI as reported by Kim et al.28 Because of overlap of enhancement pattern with benign conditions such as prostatitis in the PZ and BPH nodules in the TZ, DCE-MRI is not considered a domi-nant imaging sequence in isolation for assessment of cancer, either in the PZ or in the TZ, and is often applied as an adjunct to T2WI and DWI findings in mp-MRI.29
not directly depict the periprostatic area, and is frequently affected by artifacts.
Mp-MRI, which includes high-resolution T2WI and at least two functional MRI techniques, is the recommended tech-nique of MRI in PCa.31 Mp-MRI has shown promising results in diagnosis, localization, risk stratification, and staging of clinically significant PCa. It has also opened up opportuni-ties for focal treatment of PCa. Combinations of T2WI, DWI,
Table 7 Association between Gleason score and mean ADC values in prostate cancer cases
Gleason score Mean ADC value ± SD n
High grade (8,9) 681.37 ± 185.31 16
Intermediate (7) 715.83 ± 114.41 12
Low (≤6) 859.00 + 98.80 8
Abbreviations: ADC, apparent diffusion coefficient; SD, standard deviation.Note: p = 0.027 (significant) using one-way analysis of variance (ANOVA) test.
Fig. 4 Association between Gleason score and mean apparent diffusion coefficient (ADC) values in prostate cancer cases.
Table 8 Association between DCE MRI and histopathological interpretation
DCE MRI Histopathology Total
Benign Malignant
Negative (–) 6 0 6
Positive (+) 3 35 38
Total 9 35 44a
Abbreviations: CKD, chronic kidney disease; DCE MRI, dynamic contrast-enhanced magnetic resonance imaging.Note: p < 0.001 (significant) using Pearson’s chi-squared test.aDCE MRI was not performed in one case of CKD.
The accuracy of MRS, which depicts a higher ratio of Cho + Cr/Ci in cancerous tissue than in normal tissue, is generally accepted. In stromal BPH, however, citrate and polyamine lev-els can be strongly suppressed and there may be elevation of choline due to the presence of proliferative elements, leading to significant overlap with the findings of PCa. In addition, prostatitis has previously been found to be able to mimic PCa.30 This leads to possible significant difficulty in distin-guishing PCa from prostatitis and stromal BPH, especially in the TZ. Moreover, MRS requires a long acquisition time, does
72
Indian Journal of Radiology and Imaging Vol. 31 No. 1/2021 ©2021. Indian Radiological Association
Multiparametric MRI in Evaluating Clinically Significant Prostate Cancer Ingole et al.
perfusion (DCE-MRI), and spectroscopic imaging have been used in mp-MRI assessment of PCa, but T2 morphologic assessment and functional assessment by diffusion imaging remains the mainstay of PCa diagnosis with mp-MRI.29 In a diagnostic meta-analysis of seven studies, de Rooij et al revealed a high overall sensitivity and specificity on accuracy of mp-MRI using T2WI, DWI, and DCE-MRI. Pooled sensitiv-ity and specificity were 0.74 and 0.88, respectively, with NPV ranging from 0.65 to 0.94.32 In another study, mp-MRI showed good performance at detecting and ruling out clinically sig-nificant cancer, following at least one previous biopsy, with an NPV of 95% using transperineal template systemic biopsy as the gold standard.33 A recently published study reported clinical NPV of mp-MRI at 89.6% for significant cancer over a longitudinal follow-up period of 5 years.34 Emerging clinical trial data support the adoption of this technology as part of the standard of care for diagnosis of PCa.3
Prostate Imaging Reporting and Data System
To expedite clinical evaluation and large-scale implemen-tation of mp-MRI, in May 2010 AdMeTech Foundation’s International Prostate MRI Working Group recommended development of standards of clinical performance by establish-ing a prostate imaging reporting and assessment system. The European Society of Urogenital Radiology (ESUR) developed
consensus-based guidelines for prostate mp-MRI, including clinical indications, minimal and optimal imaging acquisi-tion protocols, and a structured category assessment system known as PI-RADS v1.31 For PI-RADS v1, it was not specified exactly how to combine the scores from each MRI sequence to derive an overall category assessment. This led to confusion in its application, and variable approaches were used. This contributed to the variability of PI-RADS v1 performance.35 In early 2012, a joint steering committee of the American College of Radiology, ESUR, and AdMeTech Foundation agreed to col-laborate on the development of an improved PI-RADS version 2 (PI-RADS v2). The PI-RADS v2 document was released online in 2015.36 The PI-RADS scores are the following:
• PI-RADS 1: very low (clinically significant cancer is highly unlikely to be present).
• PI-RADS 2: low (clinically significant cancer is unlikely to be present).
• PI-RADS 3: intermediate (the presence of clinically signif-icant cancer is equivocal).
• PI-RADS 4: high (clinically significant cancer is likely to be present).
• PI-RADS 5: very high (clinically significant cancer is highly likely to be present).
Current Status of Endorectal Coil for mp-MRIMany modern 1.5-T MRI scanners do not require an ERC to ensure acceptable image quality.37 Accordingly, the PI-RADS committee does not prescribe the use of ERC, stating that reliable, satisfactory results can be obtained with both 1.5- and 3-T MRI without the use of an ERC.38 This position is sup-ported by a systematic review performed by Fusco et al39 who concluded that new 1.5- and 3-T MRI machines can obtain acceptable image quality without the use of an ERC.
On MRI, prostatitis can result in decreased signal in the PZ on both T2WI and the ADC map. Prostatitis may also increase perfusion, resulting in a “false-positive” DCE result. However, the morphology on T2WI is commonly bandlike, wedge-shaped, or diffuse, rather than focal, round, oval, or irregular.36 ADC values of prostatitis are lower than normal prostate and significantly higher than low- and high-grade PCa. However, due to a very high cell density, granuloma-tous prostatitis can present itself by ADC values lower than those of PCa. These findings have been reported by Fütterer
Table 9 Association between final Prostate Imaging Reporting and Data System (PI-RADS) score and histopathological interpretation
Final PI-RADS score Histopathology Total
Benign Malignant
2 6 0 6
3 1 0 1
4 1 13 14
5 1 23 24
Total 9 36 45
Note: p < 0.001 (significant) using Pearson’s chi-squared test.
Fig. 5 Receiver operating characteristic (ROC) curve for Cho + Cr/Ci ratio in magnetic resonance spectroscopy (MRS).

73Multiparametric MRI in Evaluating Clinically Significant Prostate Cancer Ingole et al.
Indian Journal of Radiology and Imaging Vol. 31 No. 1/2021 ©2021. Indian Radiological Association
et al40 and Bour et al41 and was also observed in our single case of chronic granulomatous prostatitis with microabscess (►Fig. 6). Granulomatous prostatitis, if idiopathic with no supportive clinical history such as Bacillus Calmette–Guerin (BCG) instillation for bladder cancer, tuberculosis, etc., may mimic a PI-RADS 4/5 lesion.2
BPH is low in SI on T1WI and homogenous/ heterogeneous on T2WI in appearance, ranging from medium to high in SI. Compression of the adjacent PZ results in a low SI band referred to as the surgical pseudocapsule. DWI heterogene-ity also manifested as foci of low ADC values interspersed with high ADC values. On T2WI, BPH appears as circum-scribed hypointense or heterogeneous encapsulated nodules (PI-RADS 2; ►Fig. 7).
PZ carcinoma appears as discrete homogenous low signal focus/mass on T2WI against normally hyperintense PZ and if it is confined to prostate and <1.5 cm, it is scored as PI-RADS 4 (►Fig. 8). Similar findings with invasive behavior/capsule bulging is scored as PI-RADS 5 (►Figs 9–11). For the PZ, DWI is the primary determining sequence. Thus, if the DWI score is 4 and T2WI score is 2, the PI-RADS assessment category should be 4.36
The TZ carcinoma appears as a heterogeneous low signal on T2WI with ill-defined margins to give it an erased char-coal sign, and is scored PI-RADS 4 (►Fig. 12); if it involves the anterior fibromuscular stroma, then it is lenticular or water drop shaped and is scored PI-RADS 5 (►Fig. 13). For the TZ, T2WI is the primary determining sequence. Thus, if the T2WI score is 4 and DWI score is 2, then the PI-RADS assessment category should be 4.36
Due to the increased cell density, malignancy typically shows restricted diffusion with very low ADC values on the diffusion weighted images. Similar low ADC values were also demonstrated by Zelhof et al,42 Pickles et al,43 and Itou et al44 in PZ carcinoma and by Turkbey et al45 and McNeal et al46 in TZ carcinoma.
In our study, the ROC curve was analyzed to compare the performance of ADC in differentiation of cancerous and noncancerous prostatic lesions and statistically significant difference (p-value< <0.0001) was found between them with suggested cutoff criterion of ADC value of <936 × 10–6 mm2/s to predict malignancy. Similar values were also obtained in previous studies by Gibbs et al47 and Kim et al.48 In addition, inverse correlation was observed between Gleason scores and ADC values in pathologically proven cases of cancer (36 cases), that is, lower the value, the higher the grade of tumor, which is in concordance with a previous study by Itou et al.44
Tumor localization using T2WI demonstrated overesti-mation of cancer presence signified by the high sensitivity (80.5%) and low specificity (66.7%). This is most likely due to the difficulty in identifying cancer separately from other benign diseases, leading to a high false-negative rate.
In DCE-MRI, areas demonstrating early, rapid, and intense contrast uptake with subsequent plateau or washout phase were considered suspicious for the presence of malignancy. DCE-MRI alone is very sensitive but has moderate specificity due to significant overlap of early arterial enhancement in nonmalignant conditions like BPH nodules and prostatitis. However, DCE-MRI in the PZ has improved the final PI-RADS score in equivocal cases (►Fig. 14). Hence, this technique offers diagnostic benefits when compared with conventional MRI alone and as part of a multiparametric prostate MRI examination as suggested by Verma et al.49
MRS was optional in initial PI-RADS. However, due to low specificity and additional scanning time required, it has been removed in PI-RADS v2. In our study, too, the final PI-RADS score, which did not take MRS into account, did not miss any positive lesion. However, we continued investigating its role
Fig. 6 Chronic granulomatous prostatitis with microabscesses. (a) T2-weighted axial image showing ill-defined hypointensity in both the peripheral zone (PZ) and the central gland with focal bulge on the right side (arrow). (b) Heterogeneous early enhancement was seen on dynamic contrast-enhanced (DCE) imaging. (c) Multiple focal areas of restricted diffusion noted on diffusion weighted imaging (DWI) with largest/index lesion showing apparent diffusion coefficient (ADC) value up to 663 × 10–6 mm2/s. (d) Magnetic resonance spectroscopy (MRS) shows significantly elevated choline peak and reduced citrate peak.
Fig. 7 Benign prostatic hyperplasia (BPH). (1a) Axial, (1b) sagittal, and (1c) coronal T2-weighted images showing heterogeneous signal in the central gland with multiple well-circumscribed nodules. (2a) Diffusion weighted imaging (DWI) and (2b) apparent diffusion coef-ficient (ADC) map do not show the restricted diffusion mean ADC value (1,023 × 10–6 mm2/s). (3) MR spectroscopy: Cho + Cr/Ci ratio is normal.

74
Indian Journal of Radiology and Imaging Vol. 31 No. 1/2021 ©2021. Indian Radiological Association
Multiparametric MRI in Evaluating Clinically Significant Prostate Cancer Ingole et al.
at 1.5 T without ERC and our study suggest Cho + Cr/Ci ratio cutoff criterion of >0.89. Cirillo et al50 also used a similar ratio of 0.86 as cutoff to differentiate between a benign and a malignant lesion.
Recommendations of our StudyMp-MRI at 1.5 T without ERC can be used for detection of clinically significant PCa.
Recommended cutoffs for malignancy at 1.5 T without ERC from our observations are the following:
• ADC value: <936 × 10–6 mm2/s. • Cho + Cr/Ci ratio: >0.89.
Fig. 8 Peripheral zone carcinoma. (a) T2-weighted axial image show-ing focal circumscribed area of moderate hypointensity (arrow) in the right peripheral zone. (b) Corresponding area showing restricted diffusion on diffusion weighted imaging (DWI) and hypointensity on apparent diffusion coefficient (ADC) map. (c) Early arterial enhance-ment on dynamic contrast-enhanced (DCE) imaging noted in the corresponding area (arrow). (d) Magnetic resonance spectroscopy (MRS) shows elevated choline peak and reduced citrate peak with voxel placement in the suspicious area.
Fig. 9 Peripheral zone carcinoma. (a) T2-weighted axial images show focal area of hypointensity in the right peripheral zone with focal bulge suggesting extracapsular extension. (b) Diffusion weighted imaging (DWI) and corresponding apparent diffusion coefficient (ADC) maps show focal area of restricted diffusion. (c) Dynamic contrast-enhanced magnetic resonance imaging (DCE-MRI) demon-strating focal area of early arterial enhancement. (d) MR spectros-copy reveal elevated choline peak and reduced citrate peak.
Fig. 10 Prostate cancer with seminal vesicle involvement, bladder base invasion, and bone metastases. (a) T2-weighted (T2W) axial image shows diffuse hypointense signal in both the peripheral zone (PZ) and the transition zone (TZ). (b) T2W axial image show-ing hypointense signal in the left seminal vesicle (blue arrow) and polypoidal growth in the bladder base. (c) STIR axial image showing multiple focal areas of hyperintense signal in pelvic bones (head of femur—arrow and pubic symphysis). (d) T1FS postcontrast sagittal image showing heterogeneous enhancement of the prostate with involvement of the adjacent bladder base.
Fig. 11 Prostate cancer with extracapsular extension and involve-ment of seminal vesicle. (1a) T2-weighted axial image showing hypointense signal in the root of the right seminal vesicle (arrow). (1b) Diffuse hypointense signal in both the transition zone (TZ) and the peripheral zone (PZ) with extracapsular extension (ECE). (2) Dynamic contrast-enhanced magnetic resonance imaging (DCE-MRI) showing early arterial enhancement. (3a) Area of restricted diffu-sion on diffusion weighted imaging (DWI) with (3b) correspond-ing hypointensity on apparent diffusion coefficient (ADC) map. (4) Magnetic resonance spectroscopy (MRS) showing raised choline and decrease citrate peak.

75Multiparametric MRI in Evaluating Clinically Significant Prostate Cancer Ingole et al.
Indian Journal of Radiology and Imaging Vol. 31 No. 1/2021 ©2021. Indian Radiological Association
Limitations of Study
We acknowledge that there may be limitations to our study due to limited number of subjects. As two radiologists ana-lyzed the mp-MRI, interobserver variability is possible. However, the two radiologists who participated in our study have more than 10 and 20 years of clinical experience. Also, we depended mainly on TRUS biopsy; our results need to be supported by additional studies including prostatectomy. Moreover, our study was performed using an external surface coil, which provided limited signal-to-noise ratio with partial volume effects. ERC increases the signal-to-noise ratio by 4 to 10 times and is preferred over external surface coil at 1.5 T.
Conclusion
Mp-MRI at 1.5 T without ERC has shown promising results in diagnosis, localization, characterization, and, to a limited extent, in staging of clinically significant PCa. Combinations of T2WI, DWI, DCE-MRI, and spectroscopic imaging have been used in mp-MRI assessment of PCa, but T2 morphologic assessment and functional assessment by diffusion imaging remain the mainstays of PCa diagnosis with mp-MRI. DCE
imaging can be a problem-solving tool in case of equivo-cal findings on other sequences. Because assessment with mp-MRI can be subjective, use of the newly developed stan-dardized PI-RADS scoring system is helpful for accurate interpretation.
Financial Support and SponsorshipNil.
Conflict of InterestThere are no conflicts of interest.
AcknowledgmentsWe thank Dr. Raj Koticha and Dr. Sayalee Athavale for their contributions.
Fig. 12 Transition zone carcinoma. (a) T2-weighted axial image showing ill-defined homogenous and moderately hypointense sig-nal in the transition zone (R > L). (b) Focal area of hypointensity on apparent diffusion coefficient (ADC), which appears hyperintense on high b-value diffusion weighted imaging (DWI). (c) Corresponding area shows early enhancement on dynamic contrast-enhanced (DCE) imaging.
Fig. 13 Transition zone carcinoma. (a) T2-weighted (T2W) axial image showing ill-defined hypointensity involving predominantly left transition zone with extracapsular extension (arrow). (b) Dynamic contrast-enhanced (DCE) imaging shows early arterial enhancement in the corresponding area. (c) Focal area of restricted diffusion and apparent diffusion coefficient (ADC) hypointensity in the corre-sponding area. (d) Loss of normal T2W hyperintense signal in left seminal vesicle (above) with postcontrast enhancement (below). (e) Magnetic resonance spectroscopy (MRS) shows elevated choline and reduced citrate peak.
Fig. 14 Peripheral zone (PZ) carcinoma. (a) The right PZ hypointensity that is equivocal (Prostate Imaging Reporting and Data System ver-sion 3 [PI-RADS 3]). (b) Focal mildly hypointense on apparent diffusion coefficient (ADC) and mildly hyperintense on high b-value diffusion weighted imaging (DWI; PI-RADS 3). (c) Dynamic contrast-enhanced (DCE) imaging showing intense and early arterial enhancement in the corresponding area. So the final PI-RADS score was 4 and post biopsy histopathology turned out to be carcinoma.
76
Indian Journal of Radiology and Imaging Vol. 31 No. 1/2021 ©2021. Indian Radiological Association
Multiparametric MRI in Evaluating Clinically Significant Prostate Cancer Ingole et al.
References
1 Rawla P. Epidemiology of prostate cancer. World J Oncol 2019;10(2):63–89
2 Popat PB, Maheshwari S, Sable NP, Thakur M, Katdare A. Multiparametric MRI approach to prostate cancer with a pictorial essay on PI-RADS. J Soc Gastrointest Abdom Radiol 2019;2:4–17
3 Stabile A, Giganti F, Rosenkrantz AB, et al. Multiparametric MRI for prostate cancer diagnosis: current status and future directions. Nat Rev Urol 2020;17(1):41–61
4 Ferlay J, Shin HR, Bray F, Forman D, Mathers C, Parkin DM. Estimates of worldwide burden of cancer in 2008: GLOBOCAN 2008. Int J Cancer 2010;127(12):2893–2917
5 Notani PN. Global variation in cancer incidence and mortality. Curr Sci 2001;81(5):465–474
6 Jain S, Saxena S, Kumar A. Epidemiology of prostate cancer in India. Meta Gene 2014;2:596–605
7 American Cancer Society, Cancer Facts & Figures. Atlanta, GA: American Cancer Society; 2016
8 Mettlin CJ, Black B, Lee F, Littrup PJ, DuPont A, Babaian R. Workgroup #2: screening and detection. Reference range/clin-ical issues of PSA. Cancer 1993;71(8):2679–2680
9 Partin AW, Kattan MW, Subong EN, et al. Combination of prostate-specific antigen, clinical stage, and Gleason score to predict pathological stage of localized prostate cancer. A multi-institutional update. JAMA 1997;277(18):1445–1451
10 Catalona WJ, Smith DS, Ratliff TL, et al. Measurement of prostate-specific antigen in serum as a screening test for pros-tate cancer. N Engl J Med 1991;324(17):1156–1161
11 Cornud F, Hamida K, Flam T, et al. Endorectal color Doppler sonography and endorectal MR imaging features of nonpal-pable prostate cancer: correlation with radical prostatectomy findings. AJR Am J Roentgenol 2000;175(4):1161–1168
12 Smith JA Jr, Scardino PT, Resnick MI, Hernandez AD, Rose SC, Egger MJ. Transrectal ultrasound versus digi-tal rectal examination for the staging of carcinoma of the prostate: results of a prospective, multi-institutional trial. J Urol 1997;157(3):902–906
13 Brock M, von Bodman C, Sommerer F, et al. Comparison of real-time elastography with grey-scale ultrasonography for detection of organ-confined prostate cancer and extra cap-sular extension: a prospective analysis using whole mount sections after radical prostatectomy. BJU Int 2011;108(8, Pt 2) :E217–E222
14 Wefer AE, Hricak H, Vigneron DB, et al. Sextant localization of prostate cancer: comparison of sextant biopsy, magnetic reso-nance imaging and magnetic resonance spectroscopic imaging with step section histology. J Urol 2000;164(2):400–404
15 Salomon L, Colombel M, Patard JJ, et al. Value of ultra-sound-guided systematic sextant biopsies in prostate tumor mapping. Eur Urol 1999;35(4):289–293
16 Stamey TA, McNeal JE, Adenocarcinoma of the prostate. In: Walsh PC, Retik AB, Stamey TA, Vaughan ED, Jr, eds. Campbell’s Urology. 19th ed. Philadelphia, PA: WB Saunders; 1992 1181
17 Fowler JE Jr, Condon MA, Terrell FL. Cancer diagnosis with prostate specific antigen greater than 10 ng./ml. and negative peripheral zone prostate biopsy. J Urol 1996;156(4):1370–1374
18 Obek C, Louis P, Civantos F, Soloway MS. Comparison of dig-ital rectal examination and biopsy results with the radi-cal prostatectomy specimen. J Urol 1999;161(2):494–498, discussion 498–499
19 Peller PA, Young DC, Marmaduke DP, Marsh WL, Badalament RA. Sextant prostate biopsies. A histopathologic correlation with radical prostatectomy specimens. Cancer 1995;75(2):530–538
20 Hricak H, Williams RD, Spring DB, et al. Anatomy and pathol-ogy of the male pelvis by magnetic resonance imaging. AJR Am J Roentgenol 1983;141(6):1101–1110
21 Bonekamp D, Jacobs MA, El-Khouli R, Stoianovici D, Macura KJ. Advancements in MR imaging of the prostate: from diagnosis to interventions. Radiographics 2011;31(3):677–703
22 Ravizzini G, Turkbey B, Kurdziel K, Choyke PL. New horizons in prostate cancer imaging. Eur J Radiol 2009;70(2):212–226
23 Cruz M, Tsuda K, Narumi Y, et al. Characterization of low-in-tensity lesions in the peripheral zone of prostate on pre-biopsy endorectal coil MR imaging. Eur Radiol 2002;12(2):357–365
24 Kim B, Kawashima A, Ryu JA. Takahashi N, Hartman RP, King BF Jr. Imaging of the seminal vesicle and vas deferens. Radiographics 2009;29(4):1105–1121
25 Taha Ali TF, ElHariri MA, Riad MM. Diffusion-weighted MRI in prostatic lesions: diagnostic performance of normalized ADC using normal peripheral prostatic zone as a reference. Egypt J Radiol Nucl Med 2018;49:239–244
26 Yamamura J, Salomon G, Buchert R, et al. Magnetic reso-nance imaging of prostate cancer: diffusion-weighted imag-ing in comparison with sextant biopsy. J Comput Assist Tomogr 2011;35(2):223–228
27 Anwar SS, Anwar Khan Z, Shoaib Hamid R, et al. Assessment of apparent diffusion coefficient values as predictor of aggres-siveness in peripheral zone prostate cancer: comparison with Gleason score. ISRN Radiol 2014;2014:263417
28 Kim JK, Hong SS, Choi YJ, et al. Wash-in rate on the basis of dynamic contrast-enhanced MRI: usefulness for prostate cancer detection and localization. J Magn Reson Imaging 2005;22(5):639–646
29 Ghai S, Haider MA. Multiparametric-MRI in diagnosis of pros-tate cancer. Indian J Urol 2015;31(3):194–201
30 van Dorsten FA, van der Graaf M, Engelbrecht MRW, et al. Combined quantitative dynamic contrast-enhanced MR imag-ing and (1)H MR spectroscopic imaging of human prostate cancer. J Magn Reson Imaging 2004;20(2):279–287
31 Barentsz JO, Richenberg J, Clements R, et al. European Society of Urogenital Radiology. ESUR prostate MR guidelines 2012. Eur Radiol 2012;22(4):746–757
32 de Rooij M, Hamoen EHJ, Fütterer JJ, Barentsz JO, Rovers MM. Accuracy of multiparametric MRI for prostate can-cer detection: a meta-analysis. AJR Am J Roentgenol 2014;202(2):343–351
33 Abd-Alazeez M, Ahmed HU, Arya M, et al. The accuracy of mul-tiparametric MRI in men with negative biopsy and elevated PSA level: can it rule out clinically significant prostate cancer? Urol Oncol 2014;32(1):45.e17–45.e22
34 Itatani R, Namimoto T, Atsuji S, et al. Negative predictive value of multiparametric MRI for prostate cancer detection: out-come of 5-year follow-up in men with negative findings on initial MRI studies. Eur J Radiol 2014;83(10):1740–1745
35 Hamoen EHJ, de Rooij M, Witjes JA, Barentsz JO, Rovers MM. Use of the prostate imaging reporting and data system (Pi-RADS) for prostate cancer detection with mul-tiparametric magnetic resonance imaging: a diagnostic meta-analysis. Eur Urol 2015;67(6):1112–1121
36 American College of Radiology. PI-RADS TM Prostate Imaging: Reporting and Data System. 2015. Available at: https://www.acr.org/-/media/ACR/Files/RADS/ PI-RADS/PIRADS-V2.pdf. Accessed December 28, 2020
37 Engels RR, Israël B, Padhani AR, Barentsz JO. Multiparametric magnetic resonance imaging for the detection of clinically sig-nificant prostate cancer: What urologists need to know. Part 1: acquisition. Eur Urol 2020;77(4):457–468
38 Weinreb JC, Barentsz JO, Choyke PL, et al. PI-RADS Prostate Imaging-Reporting and Data System: 2015, Version 2. Eur Urol 2016;69(1):16–40
39 Fusco R, Sansone M, Granata V, Setola SV, Petrillo A. A system-atic review on multiparametric MR imaging in prostate cancer detection. Infect Agent Cancer 2017;12:57

77Multiparametric MRI in Evaluating Clinically Significant Prostate Cancer Ingole et al.
Indian Journal of Radiology and Imaging Vol. 31 No. 1/2021 ©2021. Indian Radiological Association
40 Fütterer JJ, Barentsz JO, Heijmink SWTPJ. Value of 3-T mag-netic resonance imaging in local staging of prostate cancer. Top Magn Reson Imaging 2008;19(6):285–289
41 Bour L, Schull A, Delongchamps NB, et al. Multiparametric MRI features of granulomatous prostatitis and tubercular prostate abscess. Diagn Interv Imaging 2013;94(1):84–90
42 Zelhof B, Pickles M, Liney G, et al. Correlation of diffu-sion-weighted magnetic resonance data with cellularity in prostate cancer. BJU Int 2009;103(7):883–888
43 Pickles MD, Gibbs P, Sreenivas M, Turnbull LW. Diffusion-weighted imaging of normal and malignant prostate tissue at 3.0T. J Magn Reson Imaging 2006;23(2):130–134
44 Itou Y, Nakanishi K, Narumi Y, Nishizawa Y, Tsukuma H. Clinical utility of apparent diffusion coefficient (ADC) values in patients with prostate cancer: can ADC values contribute to assess the aggressiveness of prostate cancer? J Magn Reson Imaging 2011;33(1):167–172
45 Turkbey B, Shah VP, Pang Y, et al. Is apparent diffusion coefficient associated with clinical risk scores for prostate cancers that are visible on 3-T MR images? Radiology 2011;258(2):488–495
46 McNeal JE, Redwine EA, Freiha FS, Stamey TA. Zonal distri-bution of prostatic adenocarcinoma. Correlation with his-tologic pattern and direction of spread. Am J Surg Pathol 1988;12(12):897–906
47 Gibbs P, Pickles MD, Turnbull LW. Diffusion imaging of the prostate at 3.0 tesla. Invest Radiol 2006;41(2):185–188
48 Kim JH, Kim JK, Park BW, Kim N, Cho KS. Apparent dif-fusion coefficient: prostate cancer versus noncancer-ous tissue according to anatomical region. J Magn Reson Imaging 2008;28(5):1173–1179
49 Verma S, Turkbey B, Muradyan N, et al. Overview of dynamic contrast-enhanced MRI in prostate cancer diagnosis and man-agement. AJR Am J Roentgenol 2012;198(6):1277–1288
50 Cirillo S, Petracchini M, Della Monica P, et al. Value of endorec-tal MRI and MRS in patients with elevated prostate-specific antigen levels and previous negative biopsies to localize peripheral zone tumours. Clin Radiol 2008;63(8):871–879