Application of Copper Indium Gallium Diselenide …voltaic cells, made out of Copper Indium Gallium...
154
Calhoun: The NPS Institutional Archive Theses and Dissertations Thesis Collection 2010-09 Application of Copper Indium Gallium Diselenide photovoltaic cells to extend the endurance and capabilities of the Raven RQ-11B Unmanned Aerial Vehicle Coba, Javier V. Monterey, California. Naval Postgraduate School http://hdl.handle.net/10945/5118
Transcript of Application of Copper Indium Gallium Diselenide …voltaic cells, made out of Copper Indium Gallium...

Calhoun: The NPS Institutional Archive
Theses and Dissertations Thesis Collection
2010-09
Application of Copper Indium Gallium Diselenide
photovoltaic cells to extend the endurance and
capabilities of the Raven RQ-11B Unmanned Aerial Vehicle
Coba, Javier V.
Monterey, California. Naval Postgraduate School
http://hdl.handle.net/10945/5118

NAVAL
POSTGRADUATE SCHOOL
MONTEREY, CALIFORNIA
THESIS
Approved for public release; distribution is unlimited
APPLICATION OF COPPER INDIUM GALLIUM DISELENIDE PHOTOVOLTAIC CELLS TO EXTEND THE ENDURANCE AND CAPABILITIES OF THE RAVEN RQ-
11B UNMANNED AERIAL VEHICLE
by
Javier V. Coba
September 2010
Thesis Advisor: Sherif Michael Second Reader: Todd Weatherford

THIS PAGE INTENTIONALLY LEFT BLANK

i
REPORT DOCUMENTATION PAGE Form Approved OMB No. 0704-0188Public reporting burden for this collection of information is estimated to average 1 hour per response, including the time for reviewing instruction, searching existing data sources, gathering and maintaining the data needed, and completing and reviewing the collection of information. Send comments regarding this burden estimate or any other aspect of this collection of information, including suggestions for reducing this burden, to Washington headquarters Services, Directorate for Information Operations and Reports, 1215 Jefferson Davis Highway, Suite 1204, Arlington, VA 22202-4302, and to the Office of Management and Budget, Paperwork Reduction Project (0704-0188) Washington DC 20503. 1. AGENCY USE ONLY (Leave blank)
2. REPORT DATE September 2010
3. REPORT TYPE AND DATES COVERED Master’s Thesis
4. TITLE AND SUBTITLE Application of Copper Indium Gallium Diselenide Photo-voltaic Cells to Extend the Endurance and Capabilities of the Raven RQ-11B Unmanned Aerial Vehicle 6. AUTHOR(S) Javier V. Coba
5. FUNDING NUMBERS
7. PERFORMING ORGANIZATION NAME(S) AND ADDRESS(ES) Naval Postgraduate School Monterey, CA 93943-5000
8. PERFORMING ORGANIZATION REPORT NUMBER
9. SPONSORING /MONITORING AGENCY NAME(S) AND ADDRESS(ES)
Unmanned Aerial Systems Weaponization Laboratory, Naval Air Warfare Center Weapons Division (NAWCWD) China Lake, CA
10. SPONSORING/MONITORING AGENCY REPORT NUMBER
11. SUPPLEMENTARY NOTES The views expressed in this thesis are those of the author and do not reflect the official policy or position of the Department of Defense or the U.S. Government. IRB Protocol number ______N/A________. 12a. DISTRIBUTION / AVAILABILITY STATEMENT Approved for public release; distribution is unlimited
12b. DISTRIBUTION CODE
13. ABSTRACT (maximum 200 words)
Prior thesis work has demonstrated the possibility of extending the flight time of military Small Unmanned Aerial Vehicles (SUAV) by 200% with the implementation of thin-film photovoltaic (TFPV) cells. In this thesis, we investigate how thin-film photo-voltaic cells, made out of Copper Indium Gallium Di-Selenide (CIGS) semiconductor mate-rials and mounted on the wings of the Raven RQ-11B SUAV, provide sufficient electrical power to fully operate the UAV for extended periods of time. This research focuses on extending the flight time of the Raven RQ-11B and on minimizing its sole dependence on lithium-ion batteries. This research will also demonstrate that increasing the size of the wings, adding a DC to DC power converter, and using a Maximum Power Point Tracker (MPPT) will enable the Raven RQ-11B to keep its lithium-ion battery charging continu-ously, while operating under varying daylight conditions. Additionally, this research will investigate the advantage of enabling systems on the ground to “self-charge.” This will enable tactical units to operate in any field, to include areas where power sources are unavailable.
15. NUMBER OF PAGES
153
14. SUBJECT TERMS Thin-Film Photovoltaics, CIGS, Unmanned Aerial Systems, UAV, Solar Panel, Maximum Power Point Tracker (MPPT), Lithium-ion
16. PRICE CODE
17. SECURITY CLASSIFICATION OF REPORT
Unclassified
18. SECURITY CLASSIFICATION OF THIS PAGE
Unclassified
19. SECURITY CLASSIFICATION OF ABSTRACT
Unclassified
20. LIMITATION OF ABSTRACT
UU NSN 7540-01-280-5500 Standard Form 298 (Rev. 2-89) Prescribed by ANSI Std. 239-18

ii
THIS PAGE INTENTIONALLY LEFT BLANK

iii
Approved for public release; distribution is unlimited
APPLICATION OF COPPER INDIUM GALLIUM DISELENIDE PHOTOVOLTAIC CELLS TO EXTEND THE ENDURANCE AND CAPABILITIES
OF THE RAVEN RQ-11B UNMANNED AERIAL VEHICLE
Javier V. Coba Captain, United States Marine Corps
B.A., San Diego State University, 2004
Submitted in partial fulfillment of the requirements for the degree of
MASTER OF SCIENCE IN ELECTRICAL ENGINEERING
from the
NAVAL POSTGRADUATE SCHOOL September 2010
Author: Javier V. Coba
Approved by: Sherif Michael Thesis Advisor
Todd Weatherford Second Reader
Clark Robertson Chairman, Department of Electrical and Computer Engineering

iv
THIS PAGE INTENTIONALLY LEFT BLANK

v
ABSTRACT
Prior thesis work has demonstrated the possibility of ex-
tending the flight time of military Small Unmanned Aerial
Vehicles (SUAV) by 200% with the implementation of thin-
film photovoltaic (TFPV) cells. In this thesis, we inves-
tigate how thin-film photovoltaic cells, made out of Copper
Indium Gallium Di-Selenide (CIGS) semiconductor materials
and mounted on the wings of the Raven RQ-11B SUAV, provide
sufficient electrical power to fully operate the UAV for
extended periods of time. This research focuses on extend-
ing the flight time of the Raven RQ-11B and on minimizing
its sole dependence on lithium-ion batteries. This re-
search will also demonstrate that increasing the size of
the wings, adding a DC to DC power converter, and using a
Maximum Power Point Tracker (MPPT) will enable the Raven
RQ-11B to keep its lithium-ion battery charging continu-
ously, while operating under varying daylight conditions.
Additionally, this research will investigate the advantage
of enabling systems on the ground to “self-charge.” This
will enable tactical units to operate in any field, to in-
clude areas where power sources are unavailable.

vi
THIS PAGE INTENTIONALLY LEFT BLANK

vii
TABLE OF CONTENTS
I. INTRODUCTION ............................................1 A. BACKGROUND .........................................1 B. OBJECTIVE ..........................................2 C. RELATED WORK .......................................3 D. APPROACH ...........................................5 E. ORGANIZATION .......................................6
II. RAVEN RQ-11B UAV ........................................9 A. HISTORY OF THE RAVEN PROGRAM .......................9 B. ACQUISITION STRATEGY ..............................14
1. Acquisition and Cost .........................14 2. Training .....................................15
C. SYSTEM CHARACTERISTICS AND COMPONENTS .............17 1. System Composition ...........................17 2. Performance ..................................19 3. Payload ......................................20 4. Navigation ...................................21 5. Engine .......................................21 6. Ground Control Unit ..........................22 7. Portability ..................................22
D. SYSTEM LIMITATIONS ................................22 1. Battery Life .................................22 2. Altitude .....................................23 3. Wind Speed ...................................23 4. Temperature ..................................23
III. CIGS TFPV CELLS ........................................25 A. INTRODUCTION ......................................25 B. SOLAR SPECTRUM AND SOLAR RADIATION ................26 C. SOLAR CELLS .......................................28
1. P-N Junctions ................................28 2. Band Gap .....................................29 3. Photovoltaic Effect ..........................30 4. Solar Cell Structure .........................30 5. Thin-Film Photovoltaic Cells .................31
D. CIGS AND SILICON ..................................33 E. CIGS STRUCTURE ....................................33 F. CIGS DEGRADATION ..................................35
IV. POWER INTEGRATION ......................................37 A. DC-DC POWER CONVERTER .............................37 B. MAXIMUM POWER POINT TRACKER .......................39 C. BALANCER CHARGER ..................................40 D. LITHIUM-ION BATTERIES .............................41

viii
V. DESIGN AND ASSEMBLY ....................................44 A. WING MODIFICATION AND CONSTRUCTION ................44 B. SOLAR PANEL DESIGN ................................49
1. Area vs. Power ...............................49 2. Solar Cell Arrangement .......................50
C. CUTTING AND HANDLING OF SOLAR CELLS ...............53 1. Handling .....................................53 2. Cutting ......................................54
D. LAMINATION AND ENCAPSULATION ......................55 E. WIRING AND CONNECTIONS ............................58 F. MAXIMUM POWER POINT TRACKER .......................62 G. BALANCER CHARGER ..................................65 H. SYSTEM INTEGRATION ................................66
VI. TEST AND ANALYSIS ......................................69 A. LABVIEW ...........................................69 B. REFERENCE SOLAR CELL ..............................73 C. BATTERY CAPACITY TESTS ............................73 D. ENERGY CALCULATIONS ...............................75
1. Fully Charged Battery ........................75 2. Raven’s Energy Consumption ...................76 3. Load Energy Consumption ......................77
E. BATTERY ENDURANCE TESTS ...........................80 1. Raven’s Energy Consumption ...................80 2. Load Energy Consumption ......................83
F. BATTERY ENDURANCE CALCULATIONS WITH SOLAR PANEL ...84 1. Load with Solar Panel ........................84 2. Raven with Solar Panel (100%-55%) ............87 3. Raven with Solar Panel (100%-65%) ............90 4. Raven with Solar Panel (100%-70%) ............93
G. BATTERY ENDURANCE TESTS WITH SOLAR PANEL ..........96 1. Load with Solar Panel ........................96 2. Raven with Solar Panel (100%-55%) ...........100 3. Raven with Solar Panel (100%-65%) ...........102 4. Raven with Solar Panel (100%-70%) ...........105
H. OBSERVATIONS .....................................106 1. Modified Wing ...............................106 2. Current Test ................................107 3. Daily Energy Variations .....................108 4. Temperature .................................109 5. MPPT Fluctuations ...........................110 6. Weight ......................................110 7. Charging Other Batteries ....................111 8. Specific Energy Calculation .................113
I. FLIGHT TEST RESULTS ..............................114 J. COST ESTIMATE ....................................114

ix
VII. CONCLUSIONS ..........................................117 A. RECOMMENDATIONS ..................................119
1. Eliminate Boost Converter ...................120 2. Solar Design for Original Wing ..............120 3. New Technology CIGS and Power Electronics ...121
LIST OF REFERENCES .........................................123
INITIAL DISTRIBUTION LIST ..................................129

x
THIS PAGE INTENTIONALLY LEFT BLANK

xi
LIST OF FIGURES
Figure 1. Sunrise I, 1974 (From [1]).......................3 Figure 2. QinetiQ’s Zephyr Solar UAV (From [2])............4 Figure 3. FQM-151 Pointer (From [7]).......................9 Figure 4. Flashlight SUAV (From [9])......................10 Figure 5. Raven Block I UAV (From [9])....................11 Figure 6. Raven Block II (From [9]).......................12 Figure 7. Raven RQ-11B SUAV (From [12])...................13 Figure 8. Preflight checks of the Raven UAV (From [15])...16 Figure 9. RAVEN RQ-11B SYSTEM (From [16]).................18 Figure 10. Raven RQ-11B Parts Breakdown (From [16])........19 Figure 11. Day and Night Video Imagery (From [8])..........21 Figure 12. CIGS TFPV Cell (From [20])......................26 Figure 13. Air Mass (After [23])...........................27 Figure 14. Band Gap Diagram (From [24])....................29 Figure 15. Solar Cell Structure (From [25])................31 Figure 16. CIGS Cell Structure (After[28]).................34 Figure 17. Boost Converter Schematic (After [31])..........38 Figure 18. Raven SUAV Wing Dimensions......................45 Figure 19. Modified Wing Dimensions........................45 Figure 20. Original vs. Modified Raven Wings...............46 Figure 21. Tooling to Cast the Foam (From [37])............47 Figure 22. Cast Clamped to Pour Foam (From [37])...........48 Figure 23. Foam Core (From [37])...........................48 Figure 24. Final Modified Wing.............................49 Figure 25. CIGS TFPV Cells from Global Solar (From [38])...51 Figure 26. Solar Cell Arrangement..........................52 Figure 27. Cutting CIGS Solar Cell.........................55 Figure 28. CIGS Module Cross-Section (From [38])...........56 Figure 29. Carpet Protection Film (From [39])..............57 Figure 30. CIGS Cell Lamination............................58 Figure 31. Copper Conductor Tape...........................60 Figure 32. Wire Glue Used on Solar Cell....................61 Figure 33. Solar Panel Wiring..............................61 Figure 34. Solar Panel.....................................62 Figure 35. GV26-4 Boost Solar Charge Controller............63 Figure 36. Integrated Circuit on Fuselage of Raven RQ-11B..65 Figure 37. Ultra-Balancer Charger..........................66 Figure 38. System Configuration............................67 Figure 39. Test Equipment Connection.......................69 Figure 40. LABVIEW Front Panel.............................71 Figure 41. LABVIEW Block Diagram...........................72 Figure 42. Reference Solar Cell (From [5]).................73 Figure 43. High Power Resistors............................78

xii
Figure 44. Power Consumption 100% to 55% Raven.............80 Figure 45. Power Consumption 100% to 65% Raven.............82 Figure 46. Power Consumption 100% to 70% Raven.............82 Figure 47. Power Consumption 100% to 55% Similar Load......83 Figure 48. IV Curve Plot for Wing Solar Panel..............84 Figure 49. Mobile Laboratory...............................96 Figure 50. Power Input to Load w/SP Test...................98 Figure 51. Power Consumption Load w/ Solar Panel...........99 Figure 52. Power Input to Raven w/SP 100%-55% Throttle
Test...........................................101 Figure 53. Power Consumption Raven w/SP 100%-55% Throttle.102 Figure 54. Power Input to Raven w/SP 100%-65% Throttle
Test...........................................103 Figure 55. Power Consumption to Raven w/SP 100%-65%
Throttle.......................................104 Figure 56. Power Input Raven w/SP 100-70% Throttle Test...105 Figure 57. Power Consumption Raven w/SP 100%-70% Throttle.106 Figure 58. Current Test Connection........................108

xiii
LIST OF TABLES
Table 1. Raven System Composition (From [16])............17 Table 2. Raven Specifications (From [16])................20 Table 3. Summaries Thin Cells Efficiencies (From [30])...36 Table 4. Raven RQ-11B Wing Dimensions....................45 Table 5. GV24-6 Boost Specifications (After [41])........64 Table 6. Raven Battery Capacity Bench Test...............74 Table 7. Energy of a Fully Charged Battery...............76 Table 8. Energy and Time Used at 100% and 55% throttle...76 Table 9. Energy Used at 100% and 65% throttle............77 Table 10. Energy Used at 100% and 70% throttle............77 Table 11. Battery Capacity Similar Load...................79 Table 12. Energy Used and Battery Endurance w/ Similar
Load............................................79 Table 13. Calculated vs. Actual Time (100-55%)............80 Table 14. Calculated vs. Actual Time (100-65%)............81 Table 15. Calculated vs. Actual Time (100-70%)............81 Table 16. Calculated vs. Actual Time Similar Load.........83 Table 17. Battery Endurance Calculation Load w/SP (17Wh)..85 Table 18. Battery Endurance Calculation Load w/SP (12Wh)..86 Table 19. Battery Endurance w/Load........................87 Table 20. Battery Endurance Calculation Raven w/SP (100%-
55% Throttle) 12Wh Energy Input.................88 Table 21. Battery Endurance Calculation Raven w/SP (100%-
55% Throttle) 17Wh Energy Input................89 Table 22. Battery Endurance Raven w/SP (100%-55%).........90 Table 23. Battery Endurance Calculation Raven w/SP (100%-
65% Throttle) 12Wh Energy Input.................91 Table 24. Battery Endurance Calculation Raven w/SP (100%-
65% Throttle) 17Wh Energy Input.................92 Table 25. Battery Endurance Raven w/SP (100%-65%).........93 Table 26. Battery Endurance Calculation Raven w/SP (100%-
70% Throttle) 12Wh Energy Input.................94 Table 27. Battery Endurance Calculation Raven w/SP (100%-
70% Throttle) 17Wh Energy Input.................95 Table 28. Battery Endurance Raven w/SP (100%-70%).........95 Table 29. Battery Endurance Calculation Load w/SP Test 1..97 Table 30. Battery Endurance Calculation Load W/SP Test 2..98 Table 31. Calculated vs. Actual Time.....................100 Table 32. Actual Time and Improvement....................102 Table 33. Actual Time Results and Improvement............104 Table 34. Actual Time and Improvement....................106 Table 35. Final Added Weight.............................111 Table 36. Li-po Battery Recharge Time....................112

xiv
Table 37. Solar Modification Cost........................115 Table 38. Summary of Testing Results.....................119

xv
EXECUTIVE SUMMARY
Since 2006, the Raven RQ-11B Unmanned Aerial Vehicle (UAV)
has become the preferred miniature unmanned aerial vehicle
(MUAV) used by the U.S. Army, USSOCOM, U.S. Marines, U.S.
Air Force, and U.S. allies. The Raven unmanned aerial ve-
hicle (UAV) characterizes itself by providing units with
real-time color or infrared imagery, lightweight portabil-
ity, long-range transmission, manual and programmable op-
eration, etc., which make this type of aircraft a tremen-
dous asset to units conducting low-altitude reconnaissance
and surveillance missions.
Due to their higher energy density compared to other
rechargeable batteries, the Raven RQ-11B uses one recharge-
able lithium-ion battery for its full operation. Unfortu-
nately, a fully charged lithium battery takes from 30 min-
utes to 1 hour to discharge. Therefore, the Raven UAV has
a flight-time limitation that relates directly to the
amount of time it takes for the battery to discharge. The
battery is the only source of electrical power provided to
the aircraft, and once the battery discharges, it forces
the Raven operator to bring the aircraft back from its mis-
sion.
Another limitation encountered in the Raven UAV is its
weight. Being a small unmanned aerial vehicle (SUAV), the
aircraft is designed to lift a maximum weight of 4.2lb.
Hence, there is no room to mount additional batteries to
overcome the limited operating time that one battery pro-
vides. Besides, adding more batteries defeats the advan-
tages of the SUAV, which is its portability. Soldiers and

xvi
Marines cannot add more weight to their already heavy packs
to operate the Raven for more than 1 hour.
The objective of this research was to investigate an
alternative way to provide constant electrical power to the
Raven UAV and/or to recharge the embedded lithium-ion bat-
tery on the aircraft without adding additional batteries,
and therefore, extending its endurance. For this, we
looked at thin-film photovoltaic (TFPV) cells made out of
copper indium gallium di-selenide (CIGS) semiconductor ma-
terials, with a power efficiency of 13%, to generate addi-
tional electric power from sunlight.
In the past, similar thesis work, performed on re-
motely piloted vehicles (RPV), has demonstrated that the
flight time can be extended by three times with the use of
TFPV. This thesis was designed to proof this concept on
the Raven RQ-11B UAV, which is a heavier aircraft and whose
power consumption is higher due to its payload.
Another part of the research consisted of using the
wing-mounted solar cells to recharge UAV batteries or other
electronics, reducing the need for an external power sup-
ply. One great advantage of using solar cells to recharge
batteries or other electronics is the fact that it could do
its job in absolute silence, preventing friendly forces
from being detected by the enemy.
The improvement of endurance of the Raven could
greatly benefit all military units who currently use this
type of aircraft for intelligence, surveillance, and recon-
naissance (ISR) missions. Additionally, this added capabil-
ity could be of great interest in areas that require con-
stant surveillance such as border, maritime, forestry, ag-
riculture, etc.

xvii
LIST OF ACRONYMS AND ABBREVIATIONS
ACC/TYCOM Aircraft Control Custodian Type Command
ACTD Advanced Concept Technology Demonstration
AGL Above Ground Level
Al Aluminum
ALR Automatic Launch and Recovery
a-Si Amorphous Silicon
BCT Brigade Combat Teams
BOIP Basis Of Issue Plan
CBD Chemical bath Deposition
CBE Concept-Based Experimentation
CdS Cadmium Sulfide
CdTe Cadmium Telluride
CIGS Cupper Indium Gallium Selenide
COTS Commercial Off-The-Shelf
Cu Cupper
DDL Digital Data Link
DoD Department of Defense
EO Electro-Optical
FMV Full Motion Video
FY Fiscal Year
GCS Ground Control Station
GCU Ground Control Unit
GPS Global Positioning System

xviii
IED Improvised Explosive Devices
IR Infra-red
ISR Intelligence, Surveillance, Reconnaissance
Li-ion Lithium Ion
Li-po Lithium Polymer
LRIP Low Rate Initial Production
MCE Maneuver Center of Excellence
MCTSSA Marine Corps Tactical Support Systems Activity
Mo Molybdenum
MOUT Military Operations in Urban Terrain
MPPT Maximum Power Point Tracker
MTT Mobile Training Teams
MUAV Miniature Unmanned Aerial Vehicle
NETT New Equipment Training Teams
Ni-Cd Nickel Cadmium
NREL National Renewable Energy Laboratory
OEF Operation Enduring Freedom
OIF Operation Iraqi Freedom
ORD Operational Requirements Document
OSRVT One System Remote Video Terminal
PM-UAS Program Manager Unmanned Aerial Systems
POI Program of Instruction
PVD Physical Vapor Deposition
RPV Remotely Piloted Vehicles
SOCOM Special Operations Command

xix
SC Solar Cell
SP Solar Panel
SUAV Small Unmanned Aerial Vehicle
TFPV Thin-Film Photovoltaic
TFSC Thin-Film Solar Cells
TSP Training Support Package
UAV Unmanned Aerial Vehicle
UGV Unmanned Ground Vehicles
UGS Unattended Ground Sensors
USAACE United States Army Aviation Center of Excellence
USMC United States Marine Corps
USSOCOM U.S. Special Operations Command
Wh Watt hour
ZnO Zinc Oxide

xx
THIS PAGE INTENTIONALLY LEFT BLANK

xxi
ACKNOWLEDGMENTS
First, I would like to express my utmost gratitude to
the most important persons in my life, my wife Doris, and
children Andrew and Amy. Thank you for your unwavering
support throughout the long hours and difficult times.
Once again, you have made this journey an enjoyable experi-
ence.
Second, I would like to thank my thesis advisor, Dr.
Sherif Michael, for his patience and assistance with this
work. His knowledge on this subject was crucial to the
successful accomplishment of this thesis work.
I would also like to thank Mr. Jeff Knight, John Mob-
ley, and James Calusdian. Their technical support and ex-
pertise was instrumental to complete my design.
Lastly, I would like to thank Mr. Samuel Thompson, An-
drew Tree, Scott Brown, Elijah Soto, Daniel Allen, and Mr.
Felipe Jauregui, members of the Science & Technology Ad-
vanced Systems Unmanned Systems Activity at the Naval Air
Warfare Center Weapons Division in China Lake, California,
for providing me with a Raven RQ-11B asset to conduct my
thesis, and for funding the entire project.

xxii
THIS PAGE INTENTIONALLY LEFT BLANK

1
I. INTRODUCTION
A. BACKGROUND
Small Unmanned Aerial Vehicles (SUAVs), small enough
to be launched by hand and carried in a backpack, have
proven to be a valuable asset for troops on the ground,
specifically the Raven RQ-11B. Its portability and capabil-
ity to expose enemy activity beyond the horizon, which oth-
erwise would not be detected, make this Small Unmanned Ae-
rial Vehicle (SUAV) a unique and essential piece of equip-
ment for the military.
Several are the reasons that make the Raven UAV the
preferred UAV of battalion commanders in Iraq and in Af-
ghanistan. First, its operation is so simple that it does
not require a highly trained pilot to fly it. Second, this
aircraft is ideal for quick peeks to see what is on the
other side of the obstructed terrain. Many Ravens are used
to identify the location of Improvised Explosive Devices
(IEDs). Third, their infra-red (IR) and Electro-Optical
(EO) cameras provide enough resolution to show someone car-
rying a weapon. Some say that they are better than the cam-
eras carried by the AH-64 Apache Attack Helicopter. Fourth,
its price per unit is affordable compared to other large
UAVs. Finally, its size and weight are perhaps the most at-
tractive advantages, since it can be easily carried by Spe-
cial Forces scouts and squads.
However, despite their enormous contributions in the
battlefield, the Raven UAV, also known as a SUAV, has cer-
tain constraints that limit its operation. One of them is
the partial amount of time the battery lasts on a single

2
mission. Each battery can provide a maximum of 90 minutes
of flight, after which time the aircraft needs to be re-
trieved to recharge the battery. Unfortunately, for cer-
tain missions, one 1.5 hours is not enough time to conduct
intelligence, surveillance, and reconnaissance (ISR) type
operations, and adding more batteries represent more weight
to the already heavy packs those soldiers and Marines carry
on the battlefield. Therefore, it is imperative to look
for alternative sources of energy to provide the Raven
Small Unmanned Aerial Vehicle with additional power to con-
duct ISR operations for long periods of time without rely-
ing solely on batteries.
B. OBJECTIVE
Thanks to the recent advances in solar cell technology
and the development of thin-film photovoltaic (TFPV) cells
made out of CIGS semiconductor materials, the potential for
replacing battery power with solar power on SUAV is greater
every day. These lightweight, high efficiency, and flexi-
ble solar cells, mounted to the wings of the aircraft,
could provide sufficient electrical power to operate the
UAV without relying solely on battery power, thus, increas-
ing the endurance and/or capabilities of the aircraft. In
this research, we investigated the advantages of using sun-
light as an alternative source of power for the Raven UAV.
Another part of this research included a small modifi-
cation in the structure of the aircraft. By increasing the
size of the center wing, we attempted to increase the lift,
which reduces the amount of power provided by the battery,
and at the same time, increases the area necessary to mount
more solar cells.

3
Additionally, we tested Raven RQ-11B SUAV prior and
during flight to determine the power consumption rate of
the onboard lithium-ion battery at different speeds in or-
der to identify different means to conserve electrical pow-
er and ways to recharge the battery while on flight. We
also investigated the fact that, when the Raven is not in
flight, wing-mounted solar cells can still be used to re-
charge other electronic equipment, reducing the need for
troops to plug in to a power source or carry additional
batteries.
Finally, this investigation took into consideration
the cost benefit (increased flight time versus initial and
recurring costs) of modifying the aircraft, as well as any
other maintenance, training, special handling, storage
needs, and potential negative impact on flight parameters.
C. RELATED WORK
On 4 November 1974, the Sunrise I (Figure 1), designed
by R.J. Boucher from Astro Flight Inc., impressed many re-
searchers around the world when his solar-powered aircraft
flew 20 minutes at an altitude of around 100m during its
inaugural flight.
Figure 1. Sunrise I, 1974 (From [1]).
4
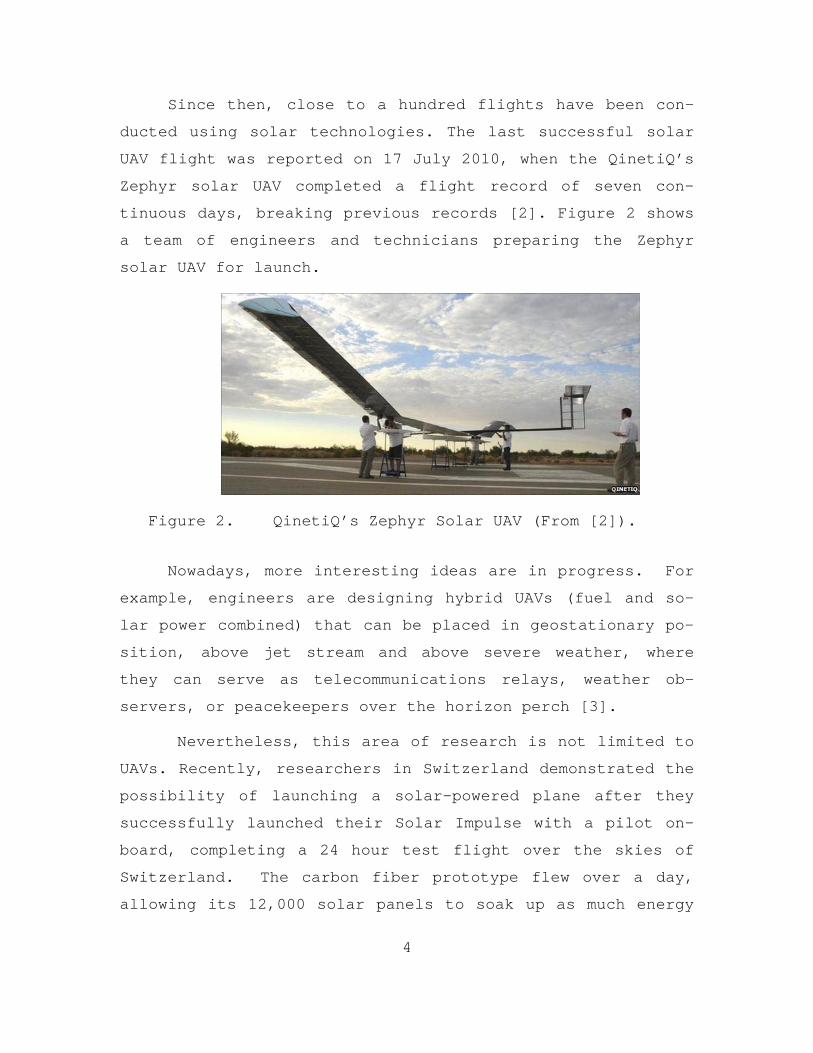
Since then, close to a hundred flights have been con-
ducted using solar technologies. The last successful solar
UAV flight was reported on 17 July 2010, when the QinetiQ’s
Zephyr solar UAV completed a flight record of seven con-
tinuous days, breaking previous records [2]. Figure 2 shows
a team of engineers and technicians preparing the Zephyr
solar UAV for launch.
Figure 2. QinetiQ’s Zephyr Solar UAV (From [2]).
Nowadays, more interesting ideas are in progress. For
example, engineers are designing hybrid UAVs (fuel and so-
lar power combined) that can be placed in geostationary po-
sition, above jet stream and above severe weather, where
they can serve as telecommunications relays, weather ob-
servers, or peacekeepers over the horizon perch [3].
Nevertheless, this area of research is not limited to
UAVs. Recently, researchers in Switzerland demonstrated the
possibility of launching a solar-powered plane after they
successfully launched their Solar Impulse with a pilot on-
board, completing a 24 hour test flight over the skies of
Switzerland. The carbon fiber prototype flew over a day,
allowing its 12,000 solar panels to soak up as much energy

5
as possible, charging the batteries enough to keep the
plane aloft through the dark of night [4].
On September 2009, [5] attempted a related type of re-
search. Using a small commercial off-the-shelf (COTS)
plane with similar characteristics to the Raven UAV, and
mounting 8% efficient CIGS TFPV cells on the wings and with
no additional electronic hardware such as a Maximum Power
Point Tracker (MPPT) or power converter, he demonstrated
that his plane could fly 2.5 times longer with solar cells
than without. Hurd’s research concluded that although the
Raven is much heavier and has greater power consumption due
to its payload, similar improvements could be seen using
higher efficiency CIGS cells, a much improved construction,
and a maximum power point tracker circuit. He also con-
cluded that the cost of such solar modification is about 3%
of the initial cost of a single Raven [5].
Our research is designed to apply the same concept to
an actual Raven UAV and to improve its endurance and capa-
bility by modifying the structure of the aircraft, install-
ing a maximum power point tracking circuit, and mounting
13% efficiency CIGS cells. With all these added parts, we
expect the Raven RQ-11B to maintain, if not surpass, Wil-
liam Hurd’s design and concept.
These previous discoveries gave us the confidence to
continue our research and seek similar endurance results on
smaller aircraft such as the Raven RQ-11B SUAV.
D. APPROACH
To even consider the possibility of conducting this
research, it was imperative to get our hands around an ac-
6
tual Raven RQ-11B SUAV. Thanks to the Marines from Marine
Corps Tactical Support Systems Activity (MCTSSA) and to the
technical representatives from the Naval Weapons Center in
China Lake, California, we were able to borrow one asset in
which we were able to apply our concept.
Another important focus of this research was to ex-
plore the latest high-efficiency TFPV cells on the market.
Global Solar, a German company, turned out to be our best
vendor of solar cells for this project after they developed
a 13% efficiency CIGS TFPV cell.
Similarly, DC-DC power converters, as well as maximum
power point trackers and other electronic components, were
necessary to investigate in order to improve the power con-
sumption of the battery that powers the Raven SUAV.
Lastly, it was necessary to study the possibility of
extending the size of the wing in order to improve its lift
capacity. It is worth mentioning that this research focused
on any modifications that would have the greatest opera-
tional impact for a significant number of years.
E. ORGANIZATION
Chapter II reviews the Raven UAV Program and fo-
cuses on its acquisition, characteristics, and
limitations, as well as capabilities.
Chapter III reviews the theory of operation of
solar cells, and compares available thin-film
photovoltaic technology such as CIGS and Silicon.

7
Chapter IV reviews different power electronic de-
vices that needed to be integrated into the cir-
cuit in order to acquire the best possible output
power from the solar panel.
Chapter V covers the design and physical assembly
of the aircraft components, as well as, its cir-
cuitry. Additionally, it reviews the construc-
tion of the modified wing along with other mate-
rials that were used to put the solar panel to-
gether.
Chapter VI provides testing methods and results,
to include bench tests, stationary outdoor, and
flight tests.
Chapter VII gives conclusions, and makes recom-
mendations for future research.

8
THIS PAGE INTENTIONALLY LEFT BLANK

9
II. RAVEN RQ-11B UAV
A. HISTORY OF THE RAVEN PROGRAM
The Raven program started in 1999, when the U.S. Army
acquired four FQM-151 Pointer UAVs from AeroVironment dur-
ing Military Operations in Urban Terrain (MOUT) ACTD (Ad-
vanced Concept Technology Demonstration) program (FY98-02).
The program was established to identify technology solu-
tions to support dismounted forces fighting in urban ter-
rain. The Army was looking for a lightweight, small, simple
user interface, low cost, reliable and robust system [6].
The FQM-151 Pointer UAV operated by U.S. Marines is seen in
Figure 3.
Figure 3. FQM-151 Pointer (From [7]).
Although the Pointer system provided that technology
solution for gathering intelligence, it had some shortfalls
that included the lack of an IR camera for night operations
and a global positioning system (GPS). Additionally, its
large ground control station (GCS) made the system unat-
10
tractive to commanders on the ground, due to its lack of
portability. AeroVironment was, therefore, asked to de-
velop a smaller station, and, in turn, the company also de-
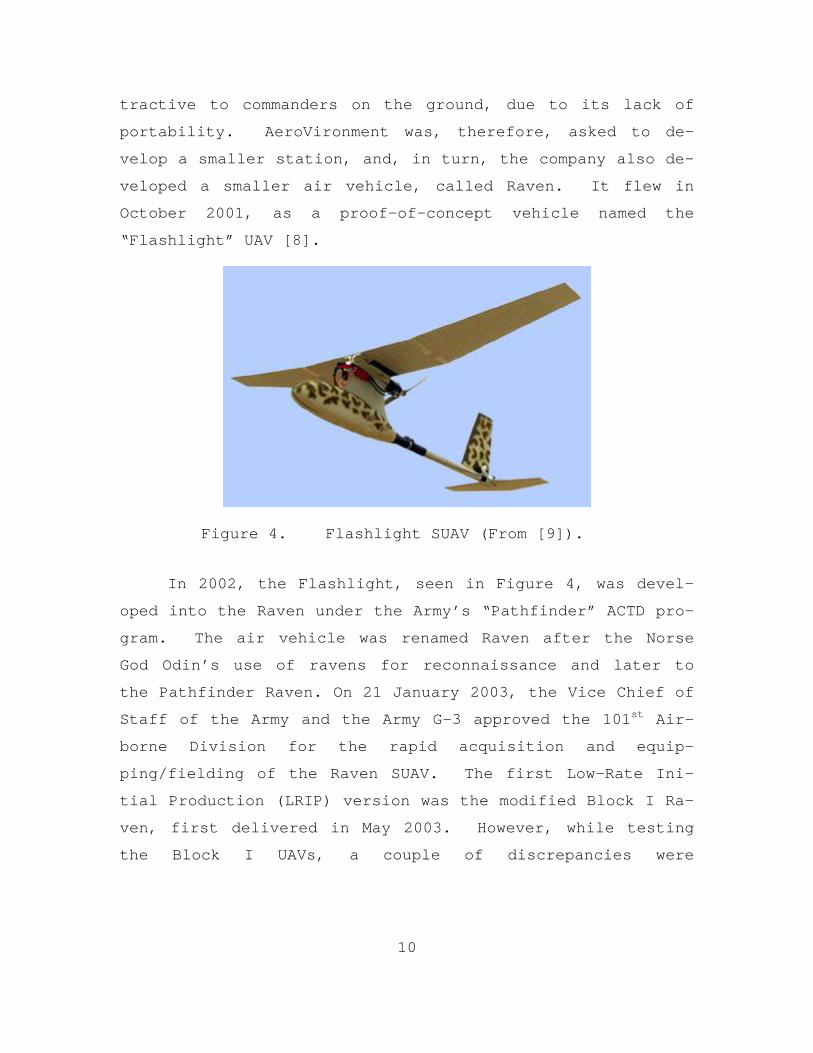
veloped a smaller air vehicle, called Raven. It flew in
October 2001, as a proof-of-concept vehicle named the
“Flashlight” UAV [8].
Figure 4. Flashlight SUAV (From [9]).
In 2002, the Flashlight, seen in Figure 4, was devel-
oped into the Raven under the Army’s “Pathfinder” ACTD pro-
gram. The air vehicle was renamed Raven after the Norse
God Odin’s use of ravens for reconnaissance and later to
the Pathfinder Raven. On 21 January 2003, the Vice Chief of
Staff of the Army and the Army G-3 approved the 101st Air-
borne Division for the rapid acquisition and equip-
ping/fielding of the Raven SUAV. The first Low-Rate Ini-
tial Production (LRIP) version was the modified Block I Ra-
ven, first delivered in May 2003. However, while testing
the Block I UAVs, a couple of discrepancies were

11
encountered, including a difficult launch procedure and in-
sufficient flight stability [6]. The Raven Block I is shown
in Figure 5.
Figure 5. Raven Block I UAV (From [9]).
Corrections to these shortcomings were made in the
Block II version, which was delivered in September 2003.
The Block II was evaluated in Afghanistan, and the U.S.
Special Operations Command eventually ordered a batch of
179 Raven systems with three UAVs each. The Raven Block II
is seen in Figure 6. In late 2004, the official designa-
tion RQ-11A was allocated to the Raven air vehicle. Be-
sides the size there was essentially no difference between
the Raven RQ-11A and the FQM-151 Pointer. They both could
carry the same navigation system, control equipment, and
payload [6].

12
Figure 6. Raven Block II (From [9]).
In 2005, after a competitive source selection process,
AeroVironment Inc. in Simi Valley, California, was chosen
by the U.S. Army for their upgraded Raven, the B model. A
Milestone C decision was approved in October 2005. The Ra-
ven B went through Initial Operational Test and Evaluation
from May to June 2006 at Fort Bliss, Texas. Full Rate Pro-
duction decision occurred in October of that same year. The
Raven B Basis Of Issue Plan (BOIP) for Army acquisition ob-
jective was 2,182 systems. Current procurement objective is
2,079 systems. There are approximately 855 Raven B systems
fielded to the Army and National Guard. Raven B is fielded
to the Brigade Combat Teams (BCTs) with 15 systems each. In
Operation Iraqi Freedom (OIF) there were 255 systems and 41
Raven B systems supporting Operation Enduring Freedom
(OEF). U.S. Special Operations Command (USSOCOM), the U.S.
Marine Corps, and U.S. Air Force also employ the Raven B
[10].
In late 2006, the Army began fielding the Raven RQ-11B
version. The RQ-11B, shown in Figure 7, is manufactured by
AeroVironment. The RQ-11B system is an upgraded version of
the battle-proven Raven A, which is no longer produced. It

13
is a lightweight system designed for rapid deployment and
high mobility for both military and commercial applica-
tions. The Raven B is the most advanced Small Unmanned Ae-
rial System (SUAS) deployed with U.S. armed forces [11].
Figure 7. Raven RQ-11B SUAV (From [12]).
In December 2009, the Raven B was upgraded to Digital
Data Link (DDL), replacing its analog command link and vid-
eo. Additional upgrades include digital/encrypted Full-
Motion Video (FMV) and aircraft control, and future inter-
operability with Unmanned Ground Vehicles (UGV) and Unat-
tended Ground Sensors (UGS) [10].
The Pathfinder Raven SUAV has become the first mili-
tary useful man-portable SUAV to be produced in large quan-
tities and represents an essential part in the fight
against Terrorism.

14
B. ACQUISITION STRATEGY
1. Acquisition and Cost
The demand for the Raven RQ-11B has been such among
combatant commanders that in November 2005, the Raven be-
came the official U.S. Army SUAV, responding to a USSOCOM
Operational Requirements Document (ORD). Full rate produc-
tion began in 2006 and is expected to last until 2014. The
initial buy was for 1,328 systems plus training and logis-
tics support. The current Army objective for Raven acqui-
sition is 2,182 systems, representing over 6,000 aerial ve-
hicles owned by DoD. The latest order was received in Feb-
ruary 2009, as the U.S. Army awarded AeroVironment an order
worth $41.7 million for Raven SUAS, fulfilling requirements
for Army, SOCOM and the USMC. Apart from the U.S. forces,
Raven operators include the Italian, Dutch, Danish and
Spanish forces. This year, the Army is planning to buy 704
more new Ravens at a price tag of $79.65 million. Simi-
larly, the Navy and the Marine Corps are spending $55.4
million for 517 new Ravens. This is all included in the
fiscal 2010 U.S. Department of Defense (DoD) proposed budg-
et [13].
In February 2010, the U.S. Department of Defense
awarded a $37.8 million contract to AeroVironment to design
and develop advanced digital Ravens, retrofit kits and
spare parts, and provide repair and training services to
the U.S. Army and U.S. Marine Corps. The advanced digital
Raven system offers higher communication security through
signal encryption. The deliveries of the upgraded digital
Ravens are scheduled to begin in the next 12 months [11].

15
Despite the enormous amounts of money spent by the DoD
on a single unmanned aircraft, no one can deny that what
makes the Raven so popular is its cost. The price tag for a
single Raven aircraft is about $35,000, and the total sys-
tem costs $250,000.
2. Training
Regardless of the different levels of autonomy encoun-
tered in the Raven UAV, its successful operation depends on
a well trained operator. Army Raven B operators are either
trained during unit fielding by the Program Manager of Un-
manned Aerial Systems (PM-UAS)/vendor New Equipment Train-
ing Teams (NETT) or at the 2nd Battalion, 29th Infantry Regi-
ment, 197th Infantry Brigade located at Fort Benning, Geor-
gia. This facility includes institutional training, Mobile
Training Teams (MTT). The training for the Raven B is di-
vided into three programs of instruction: the operator’s
course, one system remote video terminal (OSVRT) course,
and the Master Trainer’s course. Fort Benning conducts 24
classes per year with 12 students per class, turning out
between 350 and 500 Raven operators per year. Their Mo-
bile Training Teams also contribute a significant number of
new operators each year [14]. From Figure 8, it can be seen
two soldiers performing preflight checks on the Raven UAV.

16
Figure 8. Preflight checks of the Raven UAV (From [15]).
USSOCOM also conducts institutional operator training
for USSOCOM personnel at Eglin Air Force Base, Florida, and
San Clemente Island, California. PM-UAS, Fort Benning and
USSOCOM all use the current United States Army Aviation
Center of Excellence (USAACE) Program of Instruction
(POI)/Training Support Package (TSP). The operator course
is 10 training days and the Master Trainer course is five
training days. The U.S. Army Aviation Center of Excellence
at Fort Rucker and the Maneuver Center of Excellence (MCE)
at Fort Benning are reviewing the feasibility of master
trainers’ ability to train and certify operators at home
station [10].
The great capabilities offered to the commanders on
the field by the Raven B have increased the demand for this
asset. As a result, the need for more operators becomes
critical. Fortunately, the Army is developing a formalized
UAS training strategy that will support the breadth and
depth of UAS operations [14].
17
C. SYSTEM CHARACTERISTICS AND COMPONENTS
1. System Composition
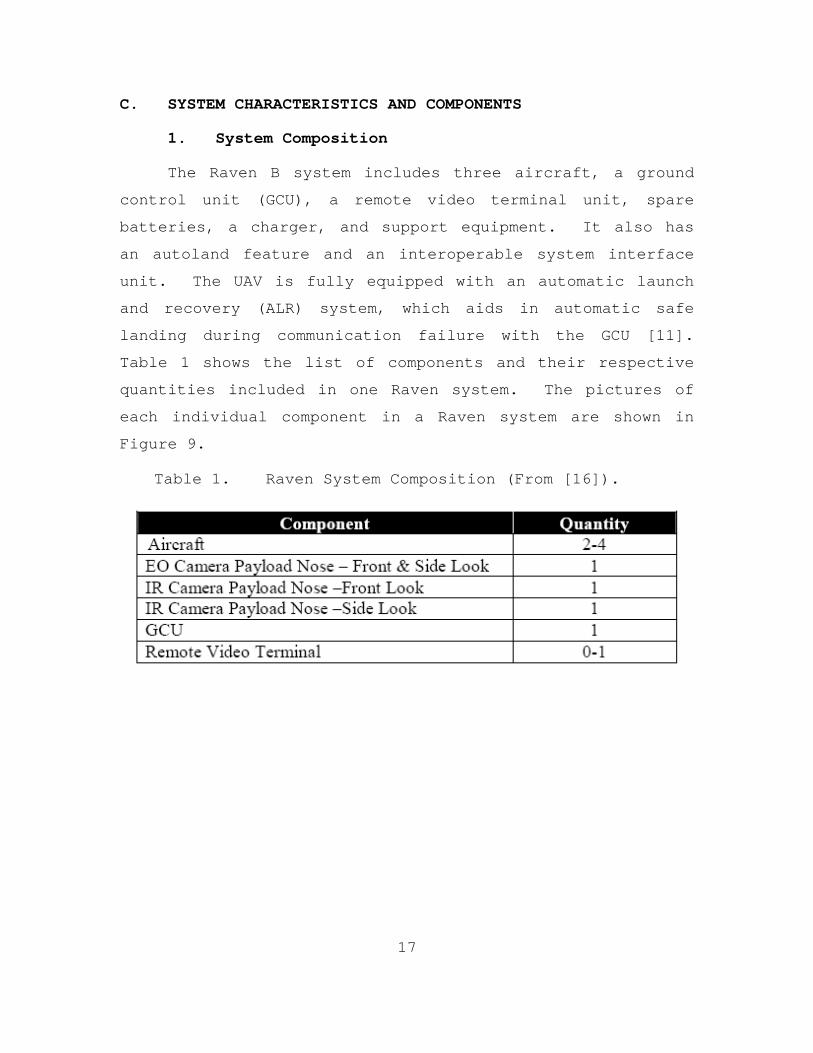
The Raven B system includes three aircraft, a ground
control unit (GCU), a remote video terminal unit, spare
batteries, a charger, and support equipment. It also has
an autoland feature and an interoperable system interface
unit. The UAV is fully equipped with an automatic launch
and recovery (ALR) system, which aids in automatic safe
landing during communication failure with the GCU [11].
Table 1 shows the list of components and their respective
quantities included in one Raven system. The pictures of
each individual component in a Raven system are shown in
Figure 9.
Table 1. Raven System Composition (From [16]).

18
Figure 9. RAVEN RQ-11B SYSTEM (From [16]).
As shown in Figure 10, each individual Raven SUAV con-
sists of the following parts:
Nose cone - encloses Infrared (IR) and Electro-
Optical (EO) cameras
Fuselage - houses the electric motor, propeller,
pitot-static tubing, payload electronics, and a
rechargeable lithium-ion battery
Wing – divided in three sections: left/right wing
tips and one center wing
Tailboom – connects the rudder and stabilizer to
the fuselage
Stabilizer

19
Figure 10. Raven RQ-11B Parts Breakdown (From [16]).
2. Performance
The RQ-11B UAV can fly at a maximum altitude of 500ft
(152m). The maximum cruising speed of the aircraft varies
between 32km/h and 81km/h. The range and service ceiling of
the aircraft are 10km and 4,500m, respectively. Its maximum
endurance is 90min. The aircraft weighs around 4.2lb
(1.9kg). It has a wingspan of 4.5ft and reaches 36 inches
in length [11]. The performance characteristics of the Ra-
ven UAV can be seen in Table 2.

20
Table 2. Raven Specifications (From [16]).
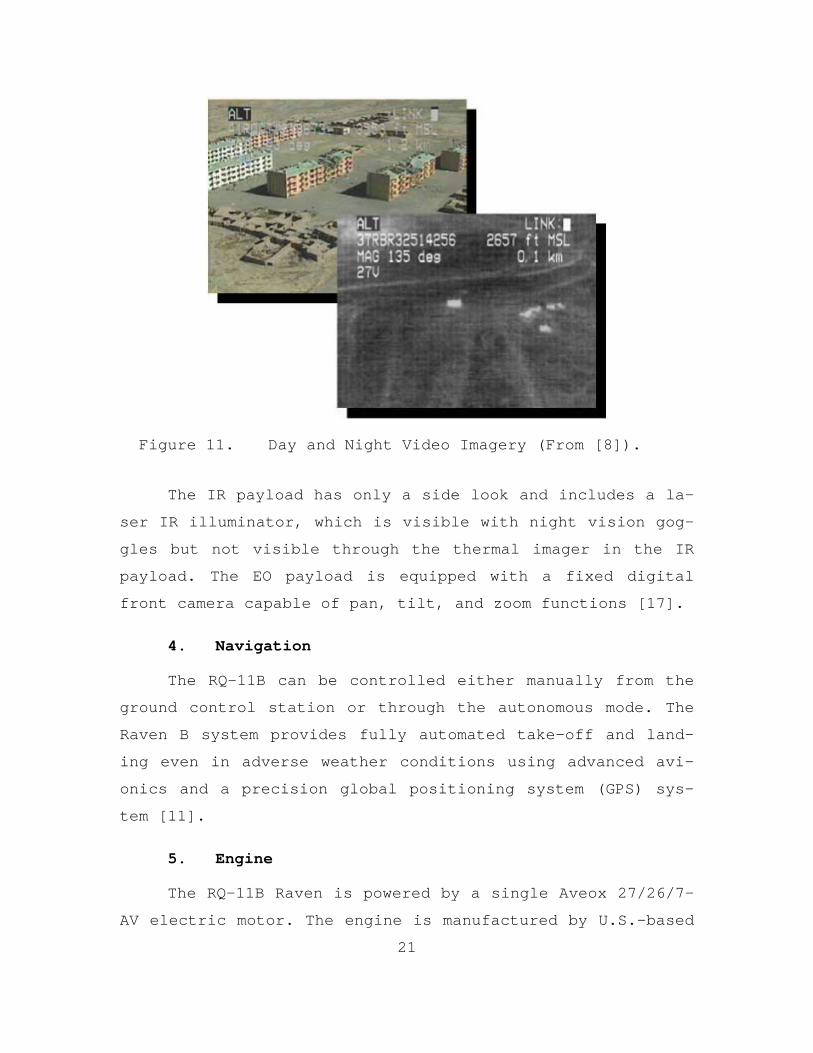
3. Payload
The Raven carries an Electro-Optical (EO) or Infrared
(IR) payload which provides aerial observation, day or
night, at line-of-sight ranges up to 10 kilometers (shown
in Figure 11). Both cameras are located inside the nose
cone and together weigh 6.6 ounces. The EO sensor converts
light rays into electronic signals for capturing images,
real-time data and videos. It had a front and side look
camera. This data is then delivered to the ground control
and remote viewing stations [6].
21
Figure 11. Day and Night Video Imagery (From [8]).
The IR payload has only a side look and includes a la-
ser IR illuminator, which is visible with night vision gog-
gles but not visible through the thermal imager in the IR
payload. The EO payload is equipped with a fixed digital
front camera capable of pan, tilt, and zoom functions [17].
4. Navigation
The RQ-11B can be controlled either manually from the
ground control station or through the autonomous mode. The
Raven B system provides fully automated take-off and land-
ing even in adverse weather conditions using advanced avi-
onics and a precision global positioning system (GPS) sys-
tem [11].
5. Engine
The RQ-11B Raven is powered by a single Aveox 27/26/7-
AV electric motor. The engine is manufactured by U.S.-based
22
Aveox. Each engine features an integrated starter or gen-
erators, flight surface actuation systems, integrated gear-
boxes, shafts, cooling fans and pumps [11].
6. Ground Control Unit
The Ground Control Unit (GCU) is a compact and light-
weight system, which displays real-time videos or images
captured by the vehicle's payload cameras [11].
The processing, retrieving and storing of the real-
time data provided by the UAV is carried out at the GCU. It
also plays back videos for target evaluation and alleviate
retransmission of videos and meta data to the operations
network [11].
The GCU can be operated as a remote video terminal
(RVT) when implanted at remote location. It also enables
the command centers to view and analyze the data. The
ground control unit can be easily assembled or disassembled
in just 2 minutes [11].
7. Portability
The Raven has the advantage that it can be easily
transported in three small cases that can fit into a ruck
sack. The wing is divided into three small sections which
facilitates its transportation. It can be launched within
minutes by hand and it lands by itself without requiring a
landing gear or a landing strip.
D. SYSTEM LIMITATIONS
1. Battery Life
One of the constrictions encountered on this UAV is
the limited amount of flight time it provides to the opera-

23
tor on a single mission. The Raven SUAV is a battery oper-
ated aircraft. Six lithium-ion (Li-ion) polymer cells make
up the RQ-11B rechargeable battery pack. It has a fully
charge voltage of 25.2VDC and a capacity of 4 Ampere hours
(Ah). The battery can last from 60 to 90 minutes under
normal flying conditions on a single mission. Additional
factors that may affect the endurance of the aircraft are:
altitude, wind currents, winds speeds, temperature, etc.
2. Altitude
The maximum flight altitude is 10,500ft; however, fly-
ing at that level may impact flight performance, primarily
reduced climb rate and flight endurance [17].
The normal operating altitude is 150ft to 1,000ft
above ground level (AGL). Operating above 500ft AGL reduces
video sensor performance [17].
3. Wind Speed
The Raven UAV is designed to sustain wind speeds of up
to 20 knots to include flying under blowing sand and dust.
It could operate in winds higher than 20 Knots but with re-
duced mission capability and higher risk of damage during
launch, landing, and recovery. Flying at that rate also
implies reduction in flight endurance, since more battery
power is consumed [17].
4. Temperature
Additionally, its system components have maximum oper-
ating temperature range of 50-degrees Celsius and a minimum
of 29-degrees Celsius. However, operating under extreme
low temperatures reduces the battery life of the UAV [17].

24
Without a doubt, the success of the Raven program is
attributed to the well-thought aircraft design, which
evolved around supporting that soldier and Marine on the
ground. The performance characteristics described in this
chapter has made the Raven SUAV the weapon choice for com-
batant commanders on the field, providing them with "over
the hill" intelligence in direct support of their respec-
tive battalion's activities. Despite their limited flight
endurance, Ravens continue to support Army and Marine Corps
units in Iraq and Afghanistan. Indeed, more needs to be
done with respect to extending flight endurance of the Ra-
ven RQ-11B SUAV. Only the application of the latest solar
cell technology can greatly improve its performance and
provide hours of uninterrupted route reconnaissance, battle
damage assessment, force protection, convoy protection,
surveillance, intelligence gathering, etc., without the
need for retrieving the Raven every 90 minutes to replace
its battery.

25
III. CIGS TFPV CELLS
A. INTRODUCTION
CuInGaSe2 (CIGS) polycrystalline thin film photo-
voltaic cells are a realistic option for reaching the goal
of low-cost, high efficiency power conversion from renew-
able energy sources [18].Equation Chapter (Next) Section 3
One of the great advantages offered by a CIGS TFPV
cell is its efficiency, i.e., the ability to produce the
greatest amount of electricity for a given illumination
level. Research groups around the world have successfully
reported a steady increase in efficiency of laboratory de-
vices. For example, in March 2008, the National Renewable
Energy Laboratory (NREL) reported an efficiency of 19.9%.
Recently, the Centre for Solar Energy and Hydrogen Research
in Germany reported a record of 20.1% efficiency in thin
film CIGS cells [19].
Although much improvement in efficiency is seeing in
laboratory devices, the manufacturing arena is slowly lev-
eling the field. For example, Global Solar, the leading
manufacturer of CIGS thin-film solar on a flexible sub-
strate, has developed 10% and 13% efficient thin film
cells. A single CIGS thin-film solar cell is shown in Fig-
ure 12.

26
Figure 12. CIGS TFPV Cell (From [20]).
Other advantages of this type of cell include its
flexibility and lightweight which make this type of photo-
voltaic (PV) cell suitable for a variety of applications
such as the one included in this research. It is worth
mentioning that our research was conducted using 13% effi-
ciency CIGS TFPV cells from Global Solar.
B. SOLAR SPECTRUM AND SOLAR RADIATION
Solar radiation at the Earth’s surface varies due to
atmospheric effects, latitude and location, season of the
year, and time of the day. Elements encountered in the at-
mosphere absorb the incident photons resulting from solar
radiation. Gases like ozone, carbon dioxide, and water va-
por absorb those photons with similar bond energy than
those gases. Nonetheless, dust particles and aerosols have
a greater impact on reducing the power from solar radia-
tion. They not only absorb photons, they also produce
scattering of light [21].

27
The solar spectrum is referenced through the Air Mass
(AM), which quantifies the reduction in the power of light
as it passes through the atmosphere. Outside the Earth’s
atmosphere the reference spectrum is (AM 0), which corre-
sponds to a solar radiation with an intensity of approxi-
mately 1370 watts per square meter. This is considered the
solar constant and it is the value at mean Earth-Sun dis-
tance at the top of the atmosphere [22]. This spectrum is
normally used to predict the performance of solar cells ex-
pected to be used in space. At the surface of the Earth, on
the other hand, the solar spectrum reference is (AM 1.5),
which has a normalized solar radiation intensity of 1,000
Watts per square meter. From Figure 13, the different path
lengths of irradiation can be observed. Air mass varies
with location on the surface of the Earth.
Figure 13. Air Mass (After [23]).

28
C. SOLAR CELLS
PV cells, commonly known as “Solar Cells,” come in a
variety of materials and processes that can potentially sa-
tisfy the requirements for photovoltaic energy conversion,
but in practice nearly all photovoltaic energy conversion
uses semiconductor materials in the form of a p-n junction
[21].
1. P-N Junctions
P-n junctions result from joining n-type and p-type
semiconductor materials. The n-type region contains high
electron concentration and the p-type high hole concentra-
tion. Thus, electrons diffuse from the n-type side to the
p-type side, recombining with holes. Similarly, holes flow
by diffusion from the p-type side to the n-type side. If
the electrons and holes were not charged, this diffusion
process would continue until the concentration of electrons
and holes on the two sides were the same, as happens if two
gasses come into contact with each other. However, in a p-n
junction, when the electrons and holes move to the other
side of the junction, they leave behind exposed charges,
creating an electric field between the positive ion cores
in the n-type material and negative ion cores in the p-type
material. This region is called the "depletion region"
since the electric field quickly sweeps free carriers out,
hence the region is depleted of free carriers. A "built in"
potential Vbi due to the electric field is formed at the
junction [21].

29
2. Band Gap
The band gap of a semiconductor is the minimum energy
required to free an electron from its orbit to become a mo-
bile charge carrier and participate in conduction. To bet-
ter understand the band structure of a semiconductor a band
diagram is used to show the energy of the electrons as they
move inside the semiconductor material. The valence band is
the lower energy level of a semiconductor and the conduc-
tion band is where an electron is considered free. The
band gap is the distance between the conduction band and
valence band [21]. Figure 14 shows the band diagram of a p-
n junction and how carriers are generated by an incident
photon and separated by the built-in electric field of the
depletion region. The Fermi level depicted in Figure 14
indicates the type of conducting material.
Figure 14. Band Gap Diagram (From [24]).

30
As the electron in the conduction band moves freely
about the semiconductor and participates in conduction, the
movement of an electron to the conduction band leaves be-
hind an empty space for an electron. Another electron from
a neighboring atom can move into this empty space; hence,
leaving behind another space. This repeated movement of the
space for an electron is called a "hole" and can be consid-
ered as the movement of a positively charged particle
through the crystal structure. As a result, we observe
movement of electrons in the conduction band and holes in
the valence band. This movement of electrons and holes
that participate in conduction are called "carriers" [21].
3. Photovoltaic Effect
Simply put, the photovoltaic effect is the transforma-
tion of radiation or solar energy into electrical energy.
As shown in Figure 14, when light hits the surface of a so-
lar cell (SC), incident photons are absorbed, creating
electron hole pairs. This happens only if the photon has
greater energy than the band gap of the semiconductor mate-
rials that conforms the SC. The p-n junction collects
these carriers and separate electrons and holes through the
built-in electric field of the depletion region, preventing
recombination and creating voltage or a corresponding elec-
tric current [21].
4. Solar Cell Structure
A solar cell or photovoltaic cell is layered structure
comprising different layers, such as antireflection, light
absorbing material, metal electrical contact. The antire-
flection layer is made of an electrically conductive mate-

31
rial that permits light to pass to the absorber. The ab-
sorber is a layer of semiconductor material in the form of
a p-n junction that absorbs the light photons necessary to
generate electrons via the photovoltaic effect. This type
of material absorbs wavelengths of solar light that reach
the Earth’s surface. Lastly, each solar cell must have a
front and back metal contact which is where the device gen-
erates a voltage differential and electrical current, de-
pending on the intensity of the light. The front electri-
cal contact layer is in the form of a grid pattern to avoid
shelf-shading. The cross sectional area of a solar cell is
shown in Figure 15.
Figure 15. Solar Cell Structure (From [25]).
5. Thin-Film Photovoltaic Cells
When looking for a quick description of what a CIGS
TFPV cells are, most search engines on the Internet would
describe them as:
CIGS belongs in the category of thin film solar cells (TFSC). The semiconductors used as absorber layer in TFPV exhibit direct band gaps allowing
32
the cells to be a few micrometers thin; hence, the term TFSC is used to refer to them. [26]
Thin-film photovoltaic cells are made of one or more
thin layers of absorber or photovoltaic material on a sub-
strate. It is this characteristic that makes these solar
cells flexible and lightweight. TFPV cells are cheaper
than thick-film solar cells because they are manufactured
with a smaller amount of light absorbing materials. This
leads to reduced processing costs from that of bulk materi-
als, but at the same time, reduces the energy conversion
efficiency of the cell. TFSC are usually categorized ac-
cording to the light absorbing material used. The most
common photovoltaic materials used are: Amorphous Silicon,
Cadmium Telluride, Copper Indium Gallium Selenide. For the
purpose of this research, we focused on CIGS TFPV cells,
only [26].
Throughout the years, great achievements in energy
conversion efficiencies for these types of cells have been
made. In 2008, the National Renewable Energy Laboratory
(NREL) reported a 19.9% efficiency which was by far the
highest compared with those achieved by other thin film
technologies such as Cadmium Telluride (CdTe) or amorphous
silicon (a-Si) [27]. On 29 April 2010, scientists from the
Centre for Solar Energy and Hydrogen Research based in
Stuttgart, Germany reported a new record efficiency of
20.1% efficiency on a 0.5 square centimeter cell. They
further claim that this efficiency obtained is for thin
film cells in general and not only for CIGS [19]. It is
important to note that these are lab-scale achievements and
have not made their way into production. The industry of
TFPV cells still displays lower energy conversion efficien-

33
cies of 10% and 13%. In the long-term however, thin-film
technology is expected to overtake thick-film technology in
terms of growth. It will go hand in hand with the worldwide
demand for photovoltaic systems [20].
D. CIGS AND SILICON
CIGS TFPV cells differ from silicon TFPV cells in that
their semiconductor material interface occurs between re-
gions of dissimilar crystalline semiconductors with differ-
ent band gaps. As mentioned before, CIGS TFPV cells are
not as efficient as crystalline silicon solar cells but
they are expected to be substantially cheaper due to the
reduced amount of absorbing material used in its fabrica-
tion, which results in a much lower cost for material and
fabrication. Being a direct band gap material, i.e., elec-
trons in the semiconductor material can shift from the low-
est energy state in the conduction band to the highest en-
ergy state in the valence band without a change in the
crystal momentum, CIGS have very strong light absorption,
and therefore, they can be made with a very thin active
layer. Often 1-2µm of CIGS is enough to absorb most of the
sunlight. The opposite occurs with silicon since greater
thickness of crystalline silicon is required for the same
absorption [26].
E. CIGS STRUCTURE
Most p-type CIGS TFPV cells are fabricated on glass,
mylar or stainless steel substrates. Nevertheless, the most
common substrate is soda-lime glass because it is electri-
cally insulating, comparatively cheap, temperature stable
and with a smooth surface. This substrate is coated using
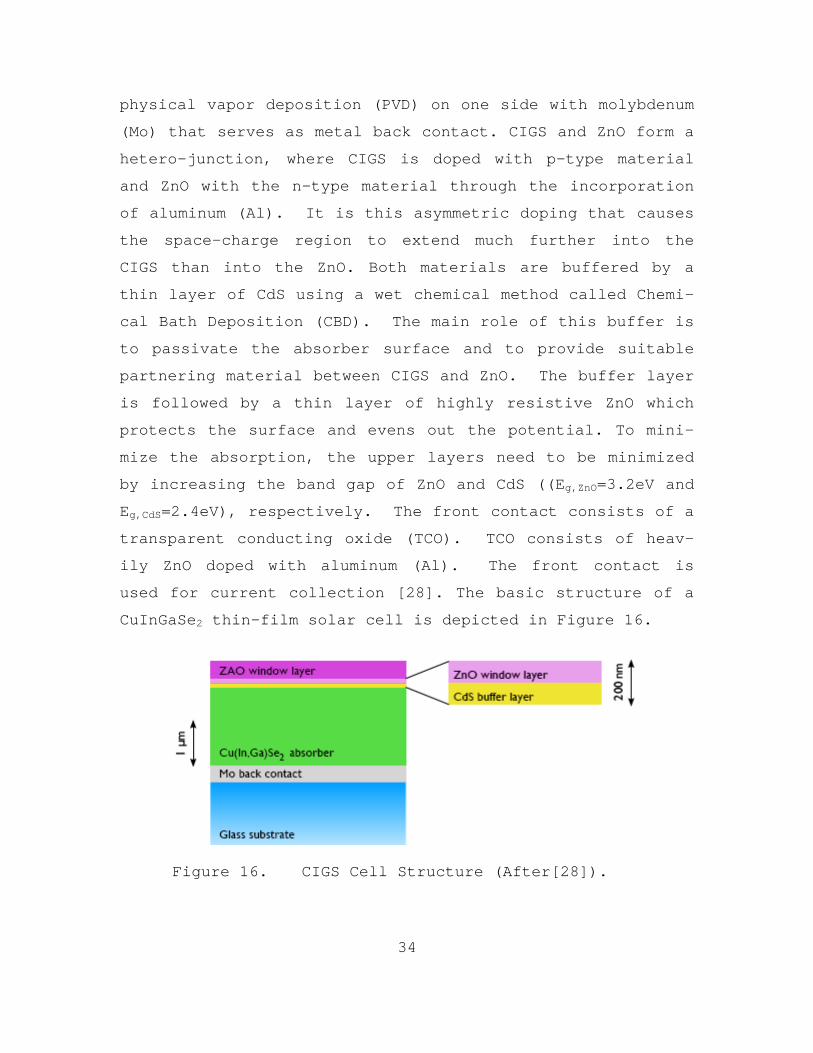
34
physical vapor deposition (PVD) on one side with molybdenum
(Mo) that serves as metal back contact. CIGS and ZnO form a
hetero-junction, where CIGS is doped with p-type material
and ZnO with the n-type material through the incorporation
of aluminum (Al). It is this asymmetric doping that causes
the space-charge region to extend much further into the
CIGS than into the ZnO. Both materials are buffered by a
thin layer of CdS using a wet chemical method called Chemi-
cal Bath Deposition (CBD). The main role of this buffer is
to passivate the absorber surface and to provide suitable
partnering material between CIGS and ZnO. The buffer layer
is followed by a thin layer of highly resistive ZnO which
protects the surface and evens out the potential. To mini-
mize the absorption, the upper layers need to be minimized
by increasing the band gap of ZnO and CdS ((Eg,ZnO=3.2eV and
Eg,CdS=2.4eV), respectively. The front contact consists of a
transparent conducting oxide (TCO). TCO consists of heav-
ily ZnO doped with aluminum (Al). The front contact is
used for current collection [28]. The basic structure of a
CuInGaSe2 thin-film solar cell is depicted in Figure 16.
Figure 16. CIGS Cell Structure (After[28]).

35
F. CIGS DEGRADATION
To date, the level of understanding of performance de-
gradation among different TFPV cells is still inadequate.
Oxygen and temperature seem to be a major cause of degrada-
tion. Recent studies conducted by the National Renewable
Energy Laboratory on thin-film CdS/CdTe solar cells have
concluded that oxygen affects the cell performance by sup-
pressing the interdifussion at the junctions.
Without the presence of oxygen, the interdifus-sion can be substantial, resulting in fully con-sumed CdS regions, which have same effects as pinholes, and high Te concentration CdS1xTex re-gions, which have a lower bandgap than CdS. This leads to reduced Voc and Jsc for the CdS/CdTe solar cell. [29]
It was then determined that oxygen impurity in CBD-CdS
films is therefore proposed to be the main cause for the
different solar performance using CBD-CdS and non-CBD-CdS
as window layers [29].
Another study conducted by NREL scientists on CdTe de-
vices determined that at temperatures from 90-degrees Cel-
sius and 120-degrees Celsius, degradation is dominated by
Cu diffusion from the back contact towards the electrical
junction. At lower temperatures degradation is not known.
Nonetheless, these findings greatly affect the encapsula-
tion process and the need to find materials that can cure
at room temperatures [30].
Nevertheless, the thickness of the light absorbing ma-
terials used in the fabrication of TFPV cells can also de-
grade its performance. As seen in Table 3, using semicon-
ductor materials with less than 1µm thickness can greatly
reduce the energy conversion efficiency [30].

36
Table 3. Summaries Thin Cells Efficiencies (From [30]).
t (µm) VOC (V) JSC (mA/cm2)
FF (%)
Efficiency (%)
1.0 CIGS 0.676 31.96 79.47 17.16 NREL
0.75 CIGS 0.652 26.0 74.0 12.5 0.40 CIGS 0.565 21.3 75.7 9.1 0.47 CIGS 0.576 26.8 64.2 9.9
EPV 1. CIGSS
Module 25.26 2.66 69.2 12.8
Shell Solar
0.87 CdTe 0.772 22.0 69.7 11.8 U. of Toledo
The introduction of TFPV cells technology has revolu-
tionized the industry of solar energy. To date, CIGS are
being incorporated to many applications due its flexibil-
ity, low cost, and lightweight benefits. Our research is
based on the use of CIGS TFPV cells along with other power
electronic devices that would generate enough power to ex-
tend the flight time of the Raven RQ-11B, which are de-
scribed in the next chapter.

37
IV. POWER INTEGRATION
As explained in Chapter III, the amount of power pro-
vided by a solar cell varies throughout the day and is
based on external factors such as temperature, irradiance,
angle of incidence, etc. For this reason, we first look
into other electronic components that could overcome this
effect and help us achieve the desired power levels.
Equation Chapter (Next) Section 4
A. DC-DC POWER CONVERTER
As it will be described later in Chapter V, the sur-
face area available for this project allowed a total of
forty solar cells connected in series to serve as an addi-
tional power source. Given the fact that each CIGS TFPV
cell had maximum output voltage of 0.5VDC and an efficiency
of 13%, our initial calculations estimated a maximum output
voltage from the solar panel of 17VDC, as seen in equations
4.1 and 4.2.
panel cell cells cell ffV V N V E (4.1)
0.5 40 0.5 0.13 17.40VDCpanelV (4.2)
In equation 4.1, panelV represents the total voltage of
the solar panel, cellV is the voltage given by a single CIGS
solar cell, cellN represents the number of solar cells, and
ffE is the efficiency of the solar cells obtained for this
project.
38
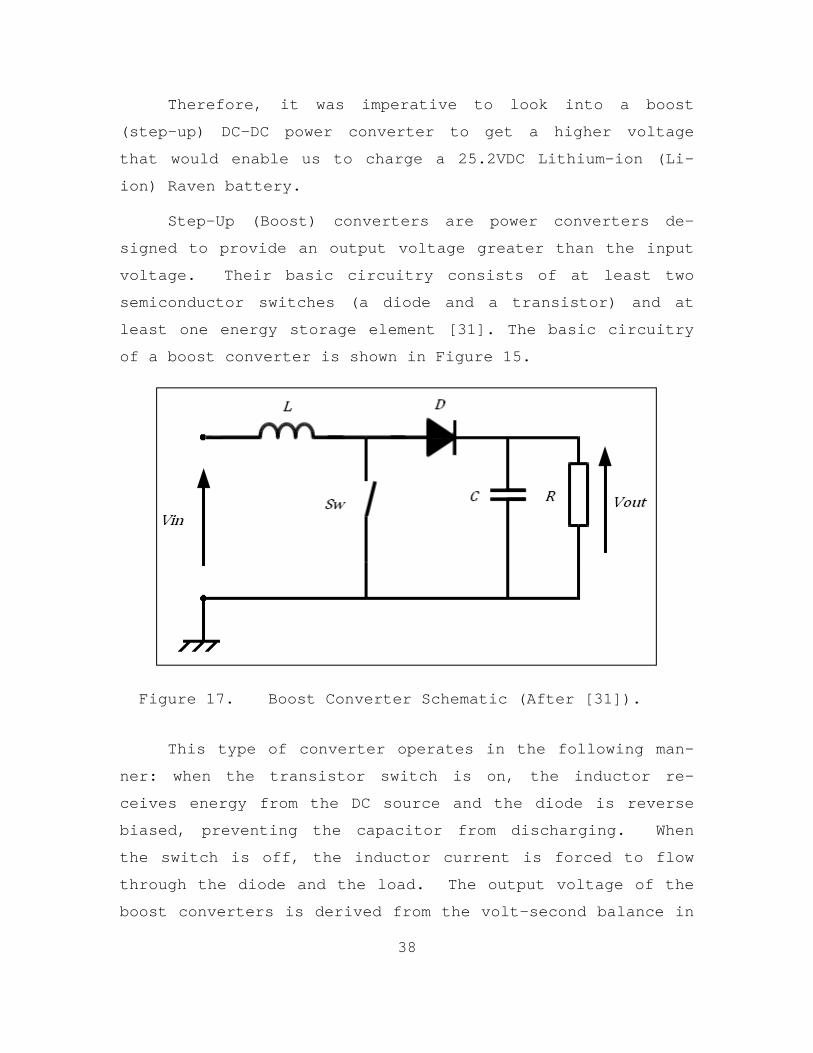
Therefore, it was imperative to look into a boost
(step-up) DC-DC power converter to get a higher voltage
that would enable us to charge a 25.2VDC Lithium-ion (Li-
ion) Raven battery.
Step-Up (Boost) converters are power converters de-
signed to provide an output voltage greater than the input
voltage. Their basic circuitry consists of at least two
semiconductor switches (a diode and a transistor) and at
least one energy storage element [31]. The basic circuitry
of a boost converter is shown in Figure 15.
Figure 17. Boost Converter Schematic (After [31]).
This type of converter operates in the following man-
ner: when the transistor switch is on, the inductor re-
ceives energy from the DC source and the diode is reverse
biased, preventing the capacitor from discharging. When
the switch is off, the inductor current is forced to flow
through the diode and the load. The output voltage of the
boost converters is derived from the volt-second balance in

39
the inductor. With a duty ratio D of the switch, the out-
put voltage outV is given by equations 4.3 and 4.4, where ont
is the time when the switch is on, offt is the time when the
switch is off, and inV is the input voltage:
on
on off
tD
t t
(4.3)
1
inout
VV
D
(4.4)
Thus, for all values of D less than 1, the output vol-
tage is always greater than the input voltage. The capaci-
tor needs to be large to maintain a constant output voltage
[32].
High efficiency in a DC-DC power converter is a neces-
sity. Ideally, we would like to have 100% efficiency; in
practice, power converters have efficiencies between 70%
and 95%. For this research, we were able to acquire a
boost converter that had an efficiency of 96% to 98%.
B. MAXIMUM POWER POINT TRACKER
A more suitable component used in photovoltaic appli-
cations is the Maximum Power Point Tracker (MPPT). An MPPT
is nothing more than a fully electronic system that varies
the electrical operating point of the solar panel so that
it can deliver maximum available power. To extract the
maximum power from the source, the MPPT matches the resis-
tance of the load to obtain a voltage from the source that

40
is suitable for the load. This operation agrees with the
basis of the Maximum Power Transfer Theorem, which states
that the maximum power is transferred from the source to
the load when the resistance of the source is equal to the
resistance of the load. It connects between the solar mod-
ule and the discharged battery. It is a system that calcu-
lates the voltage at which the PV module is able to produce
maximum power, regardless of the present battery voltage.
Additionally, the MPPT includes a DC-DC converter which
converts the calculated voltage at maximum power from the
PV module to battery voltage; hence, eliminating the need
for a separate power converter [33].
The charge current produced by the solar module can be
calculated using equation 4.5:
argsp
ch e spbatt
VI I
V (4.5)
In equation 4.5, spV and spI are the calculated voltage
and current of the solar panel at maximum power. battV is the
voltage of the discharged battery [33].
C. BALANCER CHARGER
Dealing with Li-Ion batteries, which will be described
in the next section, requires extreme caution. Electro-
chemical reactions may occur when over-charging and over-
discharging Li-Ion batteries. These reactions can decrease
the life of the cell as well as present a safety hazard.
To minimize this effect, manufacturers have placed maximum
and minimum voltage limits on individual Li-ion cells.
Typical values are 4.0V to 4.2V and 2.5V to 3.0V for the
maximum and minimum voltages, respectively. Nevertheless,

41
due to the variations in cell manufacturing processes and
raw materials, it is necessary to control the voltages of
the individual Li-ion cells within the Li-ion battery pack
to avoid cell to cell imbalances [34].
A balancer charger is the electronic component de-
signed to control the voltages of the individual cells in a
Li-ion battery. Balancer chargers are built with different
charge control strategies. Some monitor the battery volt-
age level, some monitor the cell voltage level, and others
manage the cell voltage levels through dissipative and non-
dissipated components such as resistors and capacitors.
For the purpose of this research, we concentrated our
efforts in locating a balancer charger that would be light
in weight and small in size compared to others in the mar-
ket.
D. LITHIUM-ION BATTERIES
Since 1991, lithium-ion rechargeable batteries have
been commercialized all over the world and have become a
fastest growing system due to their high-energy density and
lightweight. The Sony Corporation was the first one to put
this product out on the market and most of their applica-
tions are now seeing in notebook computers, cell phones,
and medical devices [35].
Lithium-ion batteries are preferred for their high-
energy density (Wh/Kg), which refers to the amount of en-
ergy they can hold. The higher the energy density, the
longer the runtime will be. They have twice the energy
density and three times the voltage per cell compared to
standard Nickel Cadmium (Ni-Cd) batteries [35].

42
Another advantage that makes these batteries so popu-
lar is the low maintenance needed. Most Ni-Cd batteries
require being discharged 1V per cell periodically to pre-
vent crystalline formation and to prolong their lifetime.
This is normally caused by memory.
Ni-Cd batteries have a cyclic memory which means that it remembers how much energy was drawn on preceding discharges. On a longer schedule dis-charge the battery voltage would drop rapidly and it would lose power. [35]
Lithium-ion batteries have also a lower self-discharge
rate than other type of chemical batteries. When not being
used or in storage, they slowly discharge. Li-ion batter-
ies can discharge at a rate of 5% per month or lower com-
pared to other Nickel based batteries that have a self-
discharge rate of 10%-30% [36].
On the other hand, Li-ion batteries have certain draw-
backs. For once, they require a protection circuit to lim-
it the peak voltage of each cell while charging and prevent
the cell voltage from going too low on discharge. However,
this protection circuit causes problems after a long stor-
age period. Isidor Buchmann, president of Cadex, Inc.,
states:
If the battery is left discharged after use, the self-discharge will further drain the pack and eventually drop the protection circuit at about 2.5 volts per cell. At this point, the charger will no longer recognize the pack and the pack appears dead. [35]

43
In this chapter, we described the additional elec-
tronic components that would provide the best possible out-
put power from our solar panel (SP). In the next chapter,
we show how we put everything together, every step of the
way.

44
V. DESIGN AND ASSEMBLY
After reviewing the history of the Raven SUAV program
and its performance characteristics, understanding how CIGS
TFPV cells work, and describing additional electronic com-
ponents needed for this research, it was time to configure
the Raven RQ-11B with PV cells in order to complement, if
not, substitute the aircraft’s battery power, and therefore
extend its flight time.Equation Chapter (Next) Section 5
A. WING MODIFICATION AND CONSTRUCTION
Our initial goal was to implement this idea over the
original wings of the Raven SUAV. Nevertheless, our spon-
sors insisted us that we apply our concept on an extended
wing which was designed and manufactured by mechanical en-
gineers from the Composites Laboratory at the Naval Air
Warfare Station in China Lake, California. Their intent
was to increase the lift in order to add more electronics
to the UAV. This idea turned out to be ideal since, at the
same time, it gave us more flexibility to find the best de-
sign possible for our solar cells.
It was important to consider that the smaller the cell
the less current that was going to put out. By having a
larger area, we felt no need to make the cells too small
which reduced the amount of labor involved in making the
connections.
This modified wing was 40cm longer in the center sec-
tion of the wing compared to the original. The wing tips
had exactly the same dimensions as in the original wing
tips. The dimensions of the wing are described in Table 4.

45
Table 4. Raven RQ-11B Wing Dimensions.
Length Width Area
Center Wing 43.8cm 20.5cm 897.9sqcm
Right Wing 43cm 20.5cm/13.5cm 731sqcm
Left Wing 43cm 20.5cm/13.5cm 731sqcm
Figures 18 and 19 are picture representations of the
original and modified Raven Wings. The shaded areas in
Figure 19 represent the two extended areas designed which
gave us more area to place more solar cells.
Figure 18. Raven SUAV Wing Dimensions.
Figure 19. Modified Wing Dimensions.

46
Although the modification of the new wing was an ad-
vantage in regards to area available for solar absorption,
it was manufactured as one big solid section which defeated
its portability benefit. The difference in dimensions be-
tween the modified and original wings is shown in Figure
20.
Figure 20. Original vs. Modified Raven Wings.
The original wing of the Raven RQ-11B comes in three
separate sections, which is intentionally done to quickly
disassemble the Raven UAV and place it inside a ruck sack
to facilitate its transport.
The construction of the wing took several weeks to
complete. However, it was critical to have a product with
very similar characteristics as the original wings. The
customized wing was made up of foam and fiberglass, exactly
the same materials used on the original wings.

47
First, tooling was required to cast the foam. The two
pieces that formed the cast for the foam are shown in Fig-
ure 21.
Figure 21. Tooling to Cast the Foam (From [37]).
Second, both pieces of tooling were clamped together
to form a mold. After the mold was constructed, it was ne-
cessary to pour the liquid foam through the cavity, as
shown in Figure 22.

48
Figure 22. Cast Clamped to Pour Foam (From [37]).
Once the foam core was made, as seen in Figure 23, it
was removed from the mold and was then wrapped with fiber
glass.
Figure 23. Foam Core (From [37]).

49
The final product is seen in Figure 24, next to the
original Raven wings. Two modified wings were given to
prove this concept.
Figure 24. Final Modified Wing.
B. SOLAR PANEL DESIGN
The next step was to come up with the best arrangement
of solar cells that would give us the most output power,
and at the same time, the least amount of cuts and connec-
tions possible. This was necessary to minimize the labor
and the amount of handling involved.
1. Area vs. Power
A critical step in the design of the solar panel de-
pended on the amount of energy provided from the sun. With
the modified wing on hand and the information provided in
Chapter III, we calculated the power per square centimeter
that we expected to obtain from the solar panel.
50
Knowing that the standard AM1.5G spectrum has been
normalized to give an intensity of 1KW/m2, or 0.1W/cm2 and
that the area of our modified wing had a total surface area
of 3,180cm2, we obtained an input power inP from the sun of
318 W. The CIGS TFPV cells had an output efficiency of
13%; therefore, we knew that our prospect solar panel would
give us approximately 42W of output power ExpectedP (See equa-
tions 5.1 and 5.2). Nevertheless, it was necessary to con-
sider that by leaving space in between cells and depending
on daylight conditions, our output power would be somewhat
lower than projected.
2 20.1 / 3,180 318inP W cm cm W (5.1) 318 0.13 41.8ExpectedP W W (5.2)
2. Solar Cell Arrangement
Given the surface area of the modified wing, there
were many possible solutions to achieve maximum output pow-
er from a solar panel. However, after trying different de-
signs, we opted for one that would give us the least amount
of cuts, less number of solder connections, and the greater
amount of solar cell area.
Global Solar Energy, our provider of CIGS TFPV cells,
manufactures thin-film CIGS in strings of 18 cells con-
nected in series, as seen in Figure 25. Each solar cell
had 21cm in length and 10cm in width.

51
Figure 25. CIGS TFPV Cells from Global Solar (From [38]).
As mentioned earlier, it was not in our interest to
make the cells too small. First, by reducing the area of
each cell, we would be drastically reducing the amount of
current. Perhaps, the benefit of making the cells small
and connecting them in series is that we could have in-
creased the amount of output voltage coming from the panel;
however, by doing that we would have been reducing the to-
tal output current since it will always take the value of
the smallest area of the solar cell on the panel. There-
fore, it would have also reduced the power.
Another thing to consider was to cut the cells along
the length of the string to minimize the number of solder
connections that we would have to make between cells. On
the other hand, cutting the cells across the width of the
string was difficult because the center busses that ran
across the cell were harder to cut and would short out the
cell due to the pressure applied when cutting it.

52
With these considerations in mind, we proceeded to
mount a total of 40 solar cells onto the surface area of
the wing. Twenty-four cells measuring 6.3cm in width and
10cm in length were placed on the center section, covering
an area of 1,512cm2.
The layout for the wing tips was a bit challenging to
make due to their trapezoidal shape. Also, it was neces-
sary to take into account that while the aircraft would be
flying and turning to either side, one of the wing tips
would not be facing the sun directly; thus, the current for
the entire panel would depend on the solar cells facing
away from the sun. To minimize this effect, we made the
area of the wing tip cells bigger compared to the cells on
the center section. Regardless of their shape, we wanted
the area of these cells not to go below 75cm2. In the end,
we covered an area of 383.28cm2 in each wing tip, which gave
us an overall solar cell area of 2,278cm2. The final layout
of the solar panel with the dimensions of each solar cell
is depicted in Figure 26.
Figure 26. Solar Cell Arrangement.

53
After determining this new area of the wing that will
be covered with solar cells, we went back to re-calculate
the expected power ExpectedP that would be produced by our so-
lar panel, using the same equations as in section 5A. The
calculated expected power is seen in equations 5.3 and 5.4.
2 20.1 / 2,279 228inP W cm cm W (5.3)
228 0.13 29.64ExpectedP W W (5.4)
This time, we expected our solar panel to produce al-
most 30W of power, i.e., 12W lower than the 42W that we
calculated using the entire area of the modified wing. Of
course, this output power would be accurate only if we were
under AM1.5G irradiance conditions.
C. CUTTING AND HANDLING OF SOLAR CELLS
1. Handling
Dealing with thin-film photovoltaic cells was not an
easy task; especially, when the cells were not encapsu-
lated. We decided to purchase CIGS cells without encapsu-
lation to facilitate the cutting and to reduce the overall
weight of the cells. Extra care needed to be taken when
handling bare cells. For instance, we wore clean gloves to
avoid adhesion-impact of moisture and oil from our hands.
We also had to be extremely careful of not bending the
string structure to avoid stress on the ribbon-cell bonds.
Normally, an encapsulated cell will have a thick lami-
nation surrounding the cell which weighs 0.7-Oz compared to

54
0.2-Oz, which accounts for the weight of a single bare
cell. Nevertheless, when a solar cell is not laminated, it
runs the risk of degrading due to exposure to oxygen, hu-
midity, and heat, as it was explained in Chapter III. Al-
so, there is a good chance of damaging the cell due to ac-
cidental folding and bending of the cell.
For this reason, the manufacturer shipped its product
in a hermetically sealed box. The minimum purchase order
consisted of 50 strings of 18 cells each. Each cell’s di-
mensions consisted of 21cm by 10cm. For our project we on-
ly needed one string which equaled a total of 18 cells.
To remove the strings from the box it was necessary to
obtain a vacuum sealer to extract all the oxygen that leaks
inside the box after removing the strings. This was done
to prevent the rest of the cells from degrading. Addition-
ally, we inserted nitrogen gas to eliminate any residual of
oxygen.
After the cells were removed, it was necessary to
place them in a sealed container or bag until they were
ready to be worked on or connected.
2. Cutting
Cutting the cells was difficult and required some
skill; thus, it was necessary to come up with the arrange-
ment that would give us the least amount of cuts possible.
Finding the right cutting tool was also a must. We tested
several tools such as scissors, paper cutters, knives,
etc., but every time we cut the cell we noticed that the
mechanical movement of the tool created enough pressure on
the anode side against the cathode side of the cell that

55
ended up shorting the cell out. We concluded that nothing
worked better than a regular clean razor blade. In Figure
27, it can be seen our cutting technique on a bare CIGS so-
lar cell.
Figure 27. Cutting CIGS Solar Cell.
Without a doubt, the most difficult part about cutting
the cells was cutting over the center conductor which was
thicker compared to the cell grid. In order to avoid this
obstacle, we peeled off the conductor before we made any
cuts.
It is worth mentioning that every solar cell was
tested for voltage and current under a halogen lamp to en-
sure that it was not shorted out and that it continue to
maintain its functionality.
D. LAMINATION AND ENCAPSULATION
Before the cells were mounted and connected, they
needed to be protected. Different types of plastic films
were tested to determine its strength, transparency, adhe-
siveness, and durability. Strength in a plastic was needed

56
to sustain different weather conditions, high temperatures,
as well as, tears or punctures. Transparency in a plastic
was as important since it needed to allow the sunlight to
go through without reflection. Adhesiveness was critical
since it was necessary to hold the cells in place against
the airframe of the wing of the Raven UAV. Finally, it was
important to find a durable plastic material that would
last a long time without changing its properties, i.e.,
discoloration or de-lamination.
We knew that Global Solar Energy, the manufacturer,
uses some type of adhesive and moisture barrier for the la-
mination process, as seen in Figure 28, but using those ma-
terials increased the weight of the cell dramatically which
was not convenient for our project.
Figure 28. CIGS Module Cross-Section (From [38]).
After trying many different products in the market,
the decision was made to acquire a clear, self-adhering
protective film used on all types of carpeting. This plas-

57
tic film is a special blend of polyethylene and it coin-
cided with all of our requirements that we had previously
listed. The type of carpet protection film that we used is
shown in Figure 29.
Figure 29. Carpet Protection Film (From [39]).
We laminated each solar cell individually. Although,
tedious and lengthy, we found this method to be the best
solution to avoid air gaps between the cell and the film
and to prevent creases on the film.
Each solar cell was tested for voltage and current un-
der a halogen lamp before and after lamination to ensure
that no significant changes were present. For the most
part, in all the tests, an increase of 1mA in current was
observed after a single layer of plastic, since once the
plastic was adhered to the cell it improved the absorption
of light. The lamination process of a bare CIGS cell with
carpet protection film is shown in Figure 30.

58
Figure 30. CIGS Cell Lamination.
Our sponsors did not allow us to make any permanent
changes/additions to the wing; thus, we could not glue
every solar cell to the wing. Instead, a second layer of
carpet protection film was necessary to secure the whole
arrangement against the wing.
E. WIRING AND CONNECTIONS
By cutting the majority of the cells along the length
of the string, we avoided doing too many connections. The
only connections left were in the wing tips and the connec-
tions coming from the panel to connect to the rest of the
circuitry.
There were a few things to consider before connecting
the solar cells. First, we were not sure about what type
wire or conductor we needed to use. On one hand, we knew
that the surface area of the modified wing would give us

59
approximately 40W of power and since our cells connected in
series put out a voltage of 20V, we expected a maximum of
2A of current to flow through the wiring of the solar pan-
el. Therefore, we had the option to choose a solid round
wire anywhere from gauge 26AWG to 18AWG. However, a round
conductor would have impacted adversely the air flow around
the wing during flight due to its bulkiness. Another fac-
tor was its weight. Adding round solid wires would have
increased the weight since the insulation of the wires also
takes part into the equation.
We decided to use the same material used in the manu-
facturing process that came with the string of cells.
Global Solar Energy uses 0.10mm X 25mm of tinned Copper
(Cu) flat material that did not required lead tinning. Un-
fortunately, the number of flat conductors that we were
able to obtain was not enough to complete the entire solar
panel connection. Hence, we needed to use an alternative
type of material but with similar characteristics as the
pre-fabricated buss material. Cu conductor tape turned out
to be the best solution for this situation. Cu conductor
tape is flat and has the ability to adhere to any surface
firmly. Additionally, its adhesive material is conductive
which eliminates the use of soldering or any other methods
to establish connectivity. Nonetheless, we decided to use
solder to ensure the connections would not come apart while
the UAV was flying. Figure 31 shows Cu conductor tape that
we purchased for our project.
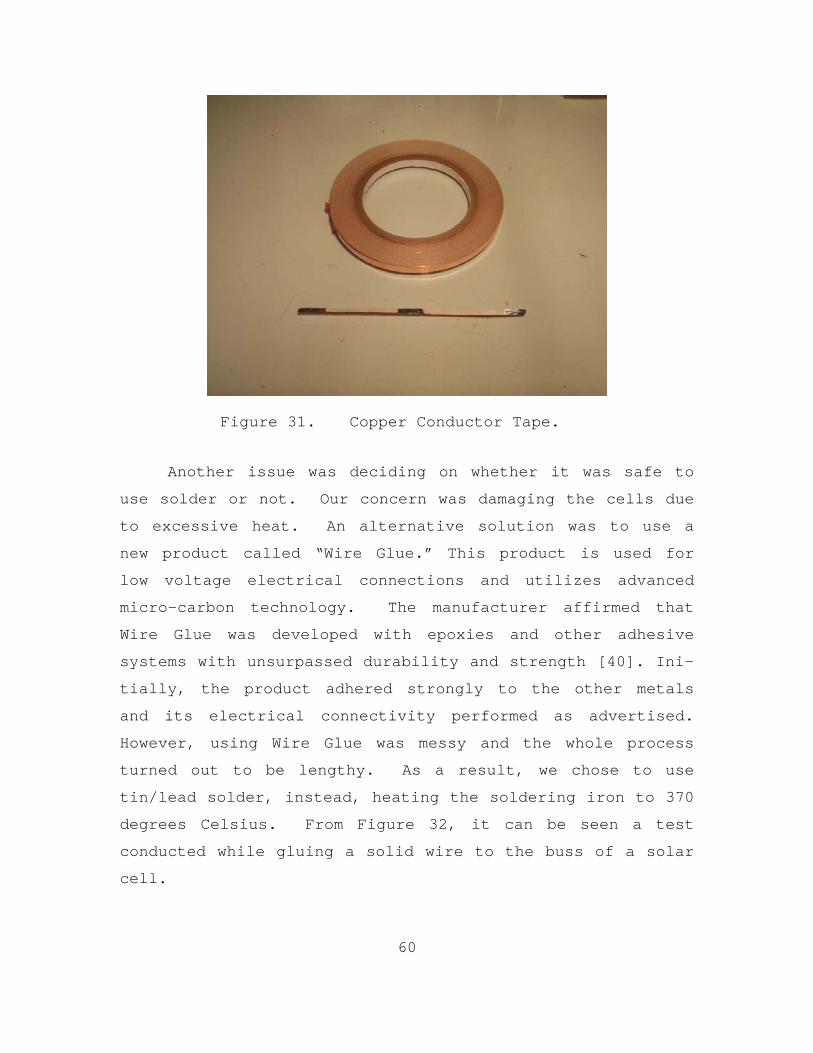
60
Figure 31. Copper Conductor Tape.
Another issue was deciding on whether it was safe to
use solder or not. Our concern was damaging the cells due
to excessive heat. An alternative solution was to use a
new product called “Wire Glue.” This product is used for
low voltage electrical connections and utilizes advanced
micro-carbon technology. The manufacturer affirmed that
Wire Glue was developed with epoxies and other adhesive
systems with unsurpassed durability and strength [40]. Ini-
tially, the product adhered strongly to the other metals
and its electrical connectivity performed as advertised.
However, using Wire Glue was messy and the whole process
turned out to be lengthy. As a result, we chose to use
tin/lead solder, instead, heating the soldering iron to 370
degrees Celsius. From Figure 32, it can be seen a test
conducted while gluing a solid wire to the buss of a solar
cell.

61
Figure 32. Wire Glue Used on Solar Cell.
Finally, with the cells arranged on the wing, we
looked at different ways to connect them in series. It was
essential to make the connections short to minimize the re-
sistance in the conductors. The best wiring connection
that we came up with is seen in Figure 33.
Figure 33. Solar Panel Wiring.

62
The final product is seen in Figure 34. The solar
cells were attached to the wing with double sided tape. As
mentioned earlier a second layer of carpet protection film
was used to secure the solar cell arrangement on the wing.
Figure 34. Solar Panel.
F. MAXIMUM POWER POINT TRACKER
As described in Chapters III and IV, different factors
influenced the output of a solar cell, such as irradiance,
temperature, angle of incidence, etc. Hence, the output
power from the solar panel will always be fluctuating
throughout the day. In order to get the most power from the
panel, it was necessary to add into our circuitry a MPPT.
Additionally, we knew that the output voltage of the
solar panel would be lower than the voltage required to
charge the battery. Therefore, we needed a DC-DC power
converter to continuously boost the voltage to 25.2V which
was the voltage of the Li-ion battery.
While looking through the products and their respec-
tive manufacturers used in previous research [5], we came
across a GVB24-6 Boost Solar Charge Controller from GENASUN
Advanced Energy Systems, seen in Figure 35, which included
both needed components, MPPT and boost converter. Since

63
the voltage of a Raven’s fully charged battery was 25.2V,
we asked the manufacturer to program the boost solar charge
controller to that voltage value. In Table 5, the original
specifications of the component are displayed.
Figure 35. GV26-4 Boost Solar Charge Controller.

64
Table 5. GV24-6 Boost Specifications (After [41]).
Tracking Efficiency 99% Electrical Efficiency (typical) 90-96% Input Current (Maximum) 6A Panel Voltage (Voc) 0-63V Min. Panel Voltage for Charging 5V Night Consumption 6mA Absorption Voltage 28.4V Float Voltage 27.6V Temperature Compensation 56mV/°C
Compact and Light 5.5x2.5x1.2" (14x6.5x3.1 cm) / 6.5 oz. (185 g)
Connections 4-pos. clamp-style terminal block for 10-30AWG wire
Environmental Stainless Hardware Nickel-Plated Brass Contacts
Additional Features
Multi-Stage Charging Temperature Compensation Can Charge from a DC Source Automatic Recovery from Fault Con-ditions LED Status Indicator Reverse Panel Protection Overload Protected (No blown fus-es!) Over-Temperature Protected with Current Foldback Shade-Tolerant Tracking Suitable for Gel/AGM/Sealed Lead-Acid Batteries Surface-Mountable Box Reverse Battery Protection Custom Voltages Available for Lith-ium and Other Batteries
One concern we had when looking for electronic compo-
nents was their weight and size. The MPPT/power converter
(Solar Charge Controller) weighed 6.5-Oz, but without the
casing it weighed only 3.6-Oz. We preferred to use it
without the casing. The dimensions of the charge controller
were 14cmx6.5cmx3.1cm. Besides the wing and the horizontal
stabilizer, the Raven RQ-11B did not provide any other flat
surface where additional components could be mounted. In-
ternal compartments of the aircraft were taken with other
payload components. The only area available was on top of

65
the fuselage, as seen in Figure 36. This location was
ideal because it had enough space for the charge controller
and the balancer charger and because it was close to the
solar panel and to the battery, which reduced the amount of
wiring needed for connections.
Figure 36. Integrated Circuit on Fuselage of Raven RQ-11B.
G. BALANCER CHARGER
As mentioned in Chapter IV, Li-ion batteries required
extreme caution when charging. Since our objective was to
recharge the battery during flight, it was important to en-
sure that the charge for each battery cell inside the bat-
tery pack was correctly balanced. To do that, we were re-
quired to use a balancer charger. There were many products
available to choose from, but we decided to purchase the
Ultra-Balancer from Common Sense RC. This balancer charger
was designed to charge 2-6 Lithium Polymer battery packs.
This balancer was ideal for this project because it was
small in size and light-weight. Its dimensions were 4.1cm
X 6.2cm and weighed 0.5-Oz. Another positive factor that
helped gain confidence about this product was the fact it
had been previously experimented with by engineers from Na-

66
val Air Warfare Station in China Lake, California. They
obtained positive results and recommended this product.
The balancer charger is shown in Figure 37.
Figure 37. Ultra-Balancer Charger.
Another benefit of the balancer charger is that it
contains three different color LED lights that makes the
user aware of whether the voltage of one of the cells is
below 3.2V, above 3.7V, or if they are equally charged,
when conducting stationary tests. It has also six addi-
tional LED lights for every cell in the battery that alerts
the user of any cell that higher voltage.
H. SYSTEM INTEGRATION
The final step in the design was the assembly and in-
tegration of all the components. The final circuitry de-
sign is shown in Figure 38. In the diagram below, the so-
lar panel is connected to the MPPT. A diode P/N: HEP170
from Motorola was placed on the positive terminal of the

67
solar panel to prevent the battery from charging the solar
panel, and thus, damaging the solar cells. The MPPT and
the balancer charger were connected to the battery while
the battery was powering the Raven UAV.
Figure 38. System Configuration.
Once the solar panel was constructed and all the other
components were put in place, it was time to determine the
amount of input power we would be getting from the sun and
determine to whether it would actually extend the endurance
of the battery. The next chapter shows the tests and re-
sults obtained from this circuit.

68
THIS PAGE INTENTIONALLY LEFT BLANK

69
VI. TEST AND ANALYSIS
A. LABVIEW
To facilitate our data collection, we needed some type
of software that would enable us to take voltage and cur-
rent readings simultaneously and autonomously between the
solar panel (SP) and the MPPT, and between the battery and
the Raven. For this purpose, we opted to use LABVIEW. From
Figure 39, it can be seen how we connected our test equip-
ment.
Figure 39. Test Equipment Connection.
LABVIEW is a graphical system design platform that al-
lows engineers and scientists to interface with any meas-
urement device and design tool. It is a programming lan-
guage that has common programming devices like data types
(numbers, strings, arrays, etc.), structures (For Loops,
While Loops, case structures, event handling) and functions
70
(file I/O, comparisons, etc.) [42]. Nevertheless, it does
not require any programming experience since it has built-
in functions for common tasks such as data acquisition and
analysis, and a wide array of tool kits and modules that
offer specific functionality in areas such as real-time
control, RF design, motion control and machine vision, etc.
For our experiment, we used two FLUKE multi-meters to
interface with LABVIEW. Each one of these measurement de-
vices had the option of taking two readings, simultane-
ously. We placed one multi-meter between the solar panel
and the MPPT, and the other between the battery and the Ra-
ven UAV. We programmed LABVIEW so that it would take the
two readings from each multi-meter every one second with
use of a time stamp function. Additionally, we created an
alarm function that would signal if the acquired battery
voltage reading went below 21.2V. Finally, we added a
chart that would enable to see how much power would be con-
sumed by the battery, and how much power would be coming in
from the solar panel.
The front panel of our program in LABVIEW is shown in
Figure 40. The front panel displays controls and indica-
tors. For our test, we used two separate LABVIEW front pan-
els and block diagrams. The block diagram which is where
the program was created is shown in Figure 41.

71
Figure 40. LABVIEW Front Panel.

72
Figure 41. LABVIEW Block Diagram.

73
B. REFERENCE SOLAR CELL
A silicon solar cell was used to measure the intensity
of the sunlight at every test to ensure that the tests were
done under similar conditions. The silicon cell was con-
nected to a multi-meter set to measure current and it was
placed next to the solar panel and with the same angle fac-
ing the sun. Our tests were normally conducted between
11:00AM and 3:00PM and the readings were always between
0.27A and 0.31A. The highest current readings observed
were in Carmel Valley, California. There, the current from
the silicon cell stayed between 0.30A and 0.31A. The ref-
erence solar cell is shown in Figure 42.
Figure 42. Reference Solar Cell (From [5]).
C. BATTERY CAPACITY TESTS
The Raven RQ-11B comes with six Li-ion polymer cells
inside a battery pack. It has a fully charged voltage of
25.2V and a minimum voltage of 21V. It has a capacity of 4
Ampere hours (Ah) [17].
To better understand its capacity, we ran different
tests while the battery was connected to the Raven at dif-
ferent throttle settings, which represented the actual op-

74
erating speeds of the UAV during regular missions. These
settings were chosen by the Raven’s operator, Mr. Scott
Brown, a technician from the Naval Air Warfare Center Weap-
ons Division, in China Lake, California [43].
We first obtained battery capacity and discharge rate
values at 55%, 65%, 70%, and 100% throttle levels. Table 6
shows these results. We did several tests at each individ-
ual level and averaged them to ensure that our values were
accurate. Table 6 also displays the capacity of the bat-
tery at different throttle levels.
Table 6. Raven Battery Capacity Bench Test.
Throttle 55% 65% 70% 100%
Avg. Current (A) 1.32 1.64 1.75 5.43
Avg. Voltage (V) 22.7 22.96 22.4 21.72
Time (hours) 1 1 1 1
Avg. Resistance 17.19 14 12.80 4
Capacity (Ah) 1.32 1.64 1.75 5.43
The capacity C of the battery was calculated by multi-
plying the average current avgI by the time t it took for the
battery to reach 21.2V, as seen in equation 6.1 [44].
avgC I t (5.5)
For our cut-off low voltage, we used a conservative
battery voltage value of 21.2V to ensure the battery would
not over-discharge; thus, running the risk of damaging the
battery, as it was explained in the previous chapter.
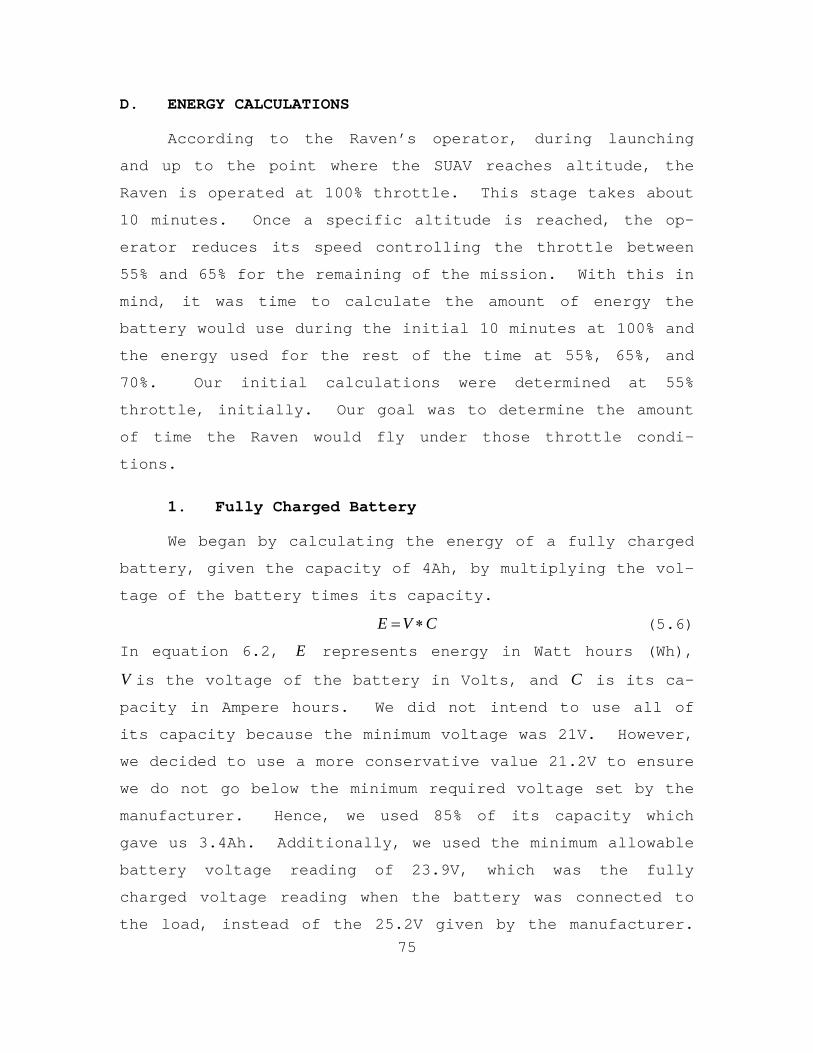
75
D. ENERGY CALCULATIONS
According to the Raven’s operator, during launching
and up to the point where the SUAV reaches altitude, the
Raven is operated at 100% throttle. This stage takes about
10 minutes. Once a specific altitude is reached, the op-
erator reduces its speed controlling the throttle between
55% and 65% for the remaining of the mission. With this in
mind, it was time to calculate the amount of energy the
battery would use during the initial 10 minutes at 100% and
the energy used for the rest of the time at 55%, 65%, and
70%. Our initial calculations were determined at 55%
throttle, initially. Our goal was to determine the amount
of time the Raven would fly under those throttle condi-
tions.
1. Fully Charged Battery
We began by calculating the energy of a fully charged
battery, given the capacity of 4Ah, by multiplying the vol-
tage of the battery times its capacity.
E V C (5.6)
In equation 6.2, E represents energy in Watt hours (Wh),
V is the voltage of the battery in Volts, and C is its ca-
pacity in Ampere hours. We did not intend to use all of
its capacity because the minimum voltage was 21V. However,
we decided to use a more conservative value 21.2V to ensure
we do not go below the minimum required voltage set by the
manufacturer. Hence, we used 85% of its capacity which
gave us 3.4Ah. Additionally, we used the minimum allowable
battery voltage reading of 23.9V, which was the fully
charged voltage reading when the battery was connected to
the load, instead of the 25.2V given by the manufacturer.

76
We did this because wanted to get a value that would repre-
sent the actual condition of the battery as it prepares to
launch. The maximum and actual minimum energy results are
shown in Table 7.
Table 7. Energy of a Fully Charged Battery.
Voltage (V) Capacity (Ah) Energy (Wh) Energy (J)
Maximum 25.2 4 100.8 363K
Actual (min) 21.2 3.4 72.08 260K
2. Raven’s Energy Consumption
Next, we calculated the energy that the Raven would
use in a single mission at full throttle (100%) for the
first 10 minutes. Using equation (6.2) and the values ob-
tained in Tables 6 and 7, we calculated the energy to be:
23.9 5.43 0.1667 21.63E V Ah h Wh (5.7)
In our previous tests, we noticed that after running
the Raven for 10 minutes at full throttle the battery volt-
age usually dropped about 1V. Thus, we used this fact to
calculate the energy at 55% power.
22.9 1.32 1 30.23E V Ah h Wh (5.8)
Notice that after 1 hour and 10 minutes the total en-
ergy used was calculated to be 51.86Wh. The energy values
calculated at these throttle levels can be seen in Table 8.
Table 8. Energy and Time Used at 100% and 55% throttle.
100% 55% Subtotal Extra Time Total
Energy (Wh) 21.63 30.23 51.86
Time 10min 1h 1h 10min 40min 1h 50min
Since the energy of a fully charged battery was 72.08
Wh (Table 7), there was 20.22Wh of energy left which indi-
cated that the Raven would run for another 40 minutes at
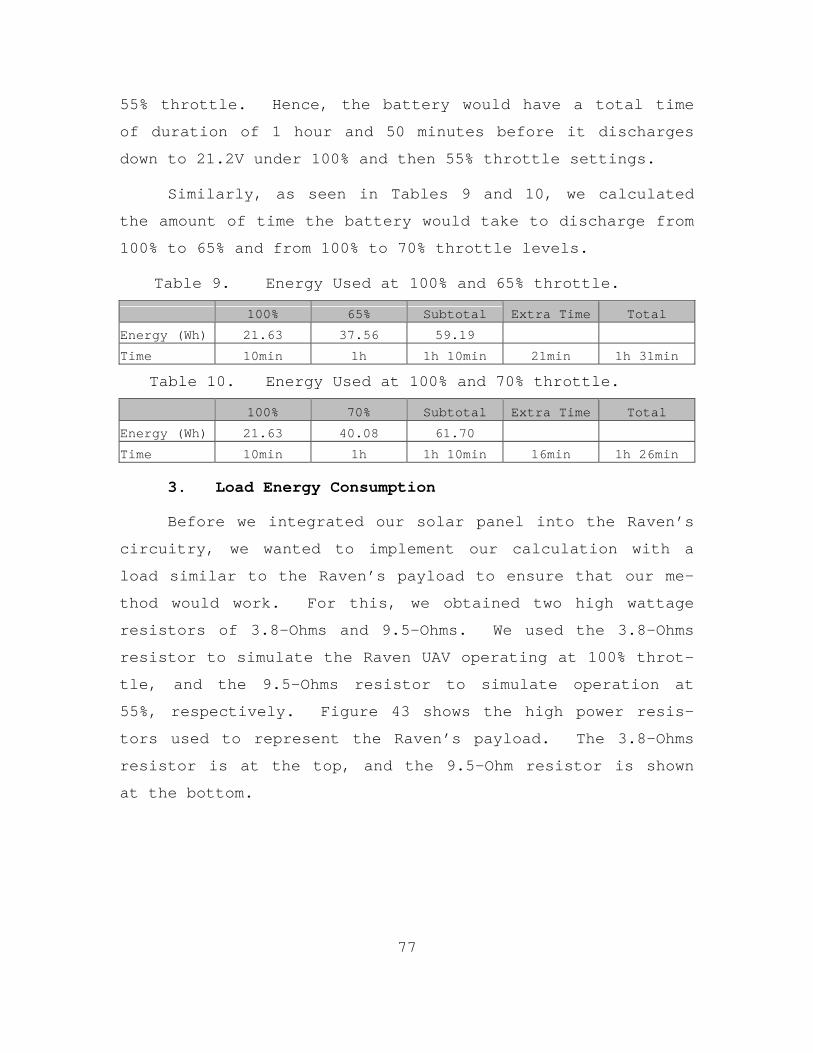
77
55% throttle. Hence, the battery would have a total time
of duration of 1 hour and 50 minutes before it discharges
down to 21.2V under 100% and then 55% throttle settings.
Similarly, as seen in Tables 9 and 10, we calculated
the amount of time the battery would take to discharge from
100% to 65% and from 100% to 70% throttle levels.
Table 9. Energy Used at 100% and 65% throttle.
100% 65% Subtotal Extra Time Total
Energy (Wh) 21.63 37.56 59.19
Time 10min 1h 1h 10min 21min 1h 31min
Table 10. Energy Used at 100% and 70% throttle.
100% 70% Subtotal Extra Time Total
Energy (Wh) 21.63 40.08 61.70
Time 10min 1h 1h 10min 16min 1h 26min
3. Load Energy Consumption
Before we integrated our solar panel into the Raven’s
circuitry, we wanted to implement our calculation with a
load similar to the Raven’s payload to ensure that our me-
thod would work. For this, we obtained two high wattage
resistors of 3.8-Ohms and 9.5-Ohms. We used the 3.8-Ohms
resistor to simulate the Raven UAV operating at 100% throt-
tle, and the 9.5-Ohms resistor to simulate operation at
55%, respectively. Figure 43 shows the high power resis-
tors used to represent the Raven’s payload. The 3.8-Ohms
resistor is at the top, and the 9.5-Ohm resistor is shown
at the bottom.

78
Figure 43. High Power Resistors.
Since our resistances were not exactly the same as
those obtained in Table 6, we had to calculate a new capac-
ity value /Battery w LoadC using the ratio of resistances, as seen
in equation 6.5, where RavenR represented the resistance of
the Raven, High wattageR was the resistance of the high power re-
sistor, and /Battery w RavenC represented the capacity obtained pre-
viously.
/ /Raven
Battery w Load Battery w Ravenhigh wattage
RC C
R
(5.9)
From Table 11, it can be seen the new battery capacity
values for the corresponding similar loads.

79
Table 11. Battery Capacity Similar Load.
Throttle R Raven R Load C w/ Raven C w/ Load
100% 4Ω 3.8Ω 5.43 Ah 5.71 Ah
55% 17.25Ω 13.3Ω 1.32 Ah 1.71 Ah
With these capacity values, we calculated the energy
used by battery under these comparable loads using equa-
tions 6.3 and 6.4. The energy used by the battery under a
similar load to the Raven’s is shown in Table 12.
Table 12. Energy Used and Battery Endurance w/ Similar Load.
Throttle Level 100% 55% 55%
Elapsed Time (min) +10 +60 +16
Energy Fully Charged Battery 72.08
Energy Out - Load (Wh) 22.79 39.15 61.94 10.14
Energy In – Solar Panel (Wh) 10.14
Energy Left after 1hr 10 min (Wh) 10.14
Energy Left after extra 16 min (Wh) 0.00
Total Elapsed Time 86 min = 1 hr 26 min
Since the energy of a fully charged battery was
72.08Wh (Table 7), there were 10.14Wh of energy left, which
indicated that the Raven would run for another 16 minutes.
Therefore, the battery would have a total time of duration
of 1 hour and 26 minutes before it discharges down to 21.2V
at 100% and 55% throttle settings.

80
E. BATTERY ENDURANCE TESTS
1. Raven’s Energy Consumption
To ensure our calculations taken in the previous sec-
tion were correct, we tested the battery while connected to
the Raven and let it run under those settings (100-55%
throttle). A comparison between our calculated time, from
section C-2, and the actual time is shown in Table 13.
Table 13. Calculated vs. Actual Time (100-55%).
Time
Calculated 1h 50min
Actual Test 1h 53min
As expected, a small difference was observed mostly
due to the different voltage levels among fully charged
batteries. As seen in Figure 44, the battery power con-
sumption at 100% to 55% throttle lasted 6,780-seconds.
0 1000 2000 3000 4000 5000 6000 700020
40
60
80
100
120
140
160
Time in Seconds
Pow
er
Battery Power Consumption 100%-55% Raven Load
Figure 44. Power Consumption 100% to 55% Raven.

81
In similar fashion, we tested the power consumption of
the battery while connected to the Raven at 100% and 65%
and at 100% and 70% throttle levels. The relationship be-
tween the calculated times and the actual times obtained
from the test is observed in Tables 14 and 15.
Table 14. Calculated vs. Actual Time (100-65%).
Time
Calculated 1h 31min
Actual Test 1h 34min
Table 15. Calculated vs. Actual Time (100-70%).
Time
Calculated 1h 26min
Actual Test 1h 26min
Again, we observed a small difference between our cal-
culated values and our actual test, but for the most part
it indicated that our calculations were correct. The power
consumption of the battery under those specific throttle
settings are seen in Figures 45 and 46, respectively. In
Figure 45, we noticed how the battery of the Raven lasted
5,640-seconds, while operating at 100% and then at 65%
throttle.
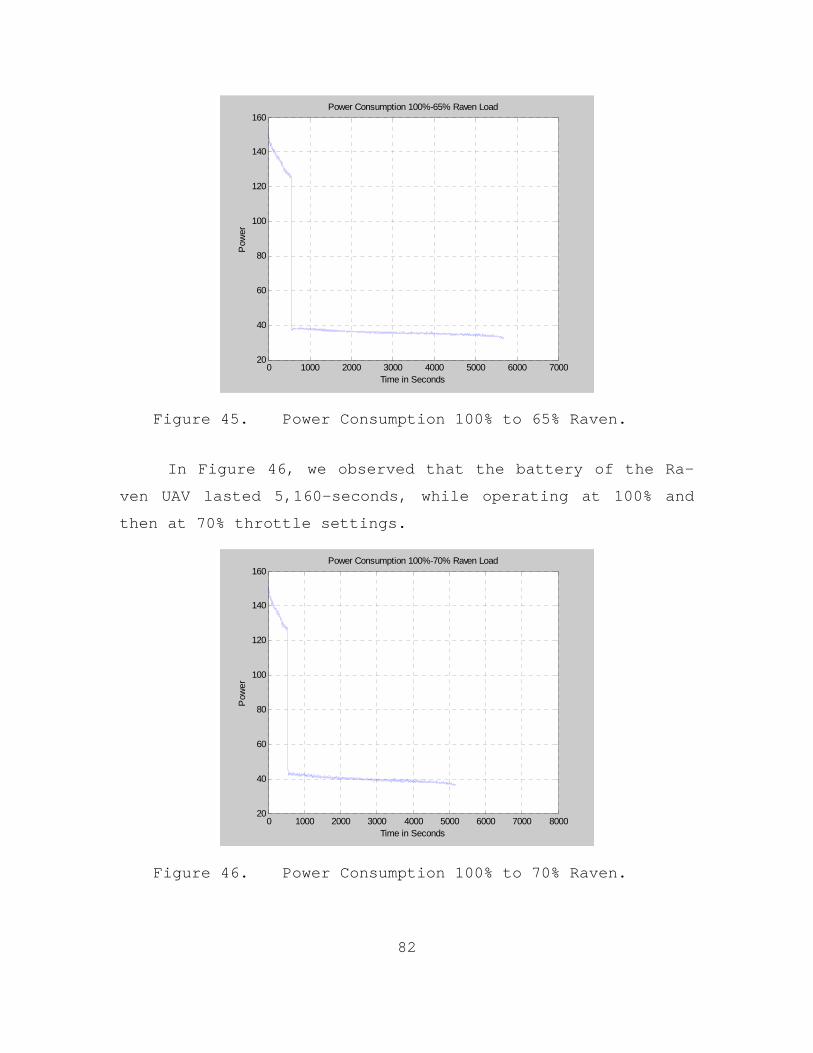
82
0 1000 2000 3000 4000 5000 6000 700020
40
60
80
100
120
140
160
Time in Seconds
Pow
er
Power Consumption 100%-65% Raven Load
Figure 45. Power Consumption 100% to 65% Raven.
In Figure 46, we observed that the battery of the Ra-
ven UAV lasted 5,160-seconds, while operating at 100% and
then at 70% throttle settings.
0 1000 2000 3000 4000 5000 6000 7000 800020
40
60
80
100
120
140
160
Time in Seconds
Pow
er
Power Consumption 100%-70% Raven Load
Figure 46. Power Consumption 100% to 70% Raven.

83
2. Load Energy Consumption
Again, to ensure our calculations from section C-3
were correct, we tested the battery while connected to the
load similar to the Raven’s. A comparison between our cal-
culated time and the actual time is observed in Table 16.
Table 16. Calculated vs. Actual Time Similar Load.
Time
Calculated 1h 26min
Actual Test 1h 29min
The results in Table 16 show that our computations
were correct. In Figure 47, we observe the power consump-
tion of the battery while connected to a similar load.
Again, this test represented the Raven RQ-11B load operat-
ing at 100% throttle for the first 10 minutes and at 55%
throttle for the rest of the time. In Figure 47, it can be
seen that the power of the battery lasted 5,340-seconds un-
der a similar load
0 1000 2000 3000 4000 5000 600020
40
60
80
100
120
140
160
Time in Seconds
Pow
er
Battery Power Consumption Under Similar Load
Figure 47. Power Consumption 100% to 55% Similar Load.

84
F. BATTERY ENDURANCE CALCULATIONS WITH SOLAR PANEL
1. Load with Solar Panel
After confirming that our calculations matched our
test results, we wanted to add the input from the solar
panel into our calculations. Previously, we conducted sev-
eral tests to determine the IV curve of the solar panel
that we built. The IV curve obtained from our solar panel
on 3 August 2010 is shown in Figure 48.
0 5 10 15 20 250
0.2
0.4
0.6
0.8
1
1.2
1.4
1.6
1.8I-V Curve 3 Aug
Voltage
Cur
rent
Figure 48. IV Curve Plot for Wing Solar Panel.
In Figure 48, we noticed that the knee of curve indi-
cated that the maximum power was somewhere around 17W. In
addition, we noted that throughout most part the day, the
solar panel would provide 12W of power to the battery.
Therefore, we used 17Wh and 12Wh in our calculations as our
energy input boundaries to represent our best and worst
case energy input in relation to the Monterey Area. The

85
amount of time the battery would last while connected to a
similar load would depend on the amount of energy left in
it.
Following the same calculations as in the previous
sections, we obtained the amount of time it would take for
the battery to discharge to 21.2V, as seen in Table 17.
Table 17. Battery Endurance Calculation Load w/SP (17Wh).
Throttle Level 100% 55% 55% 55% 55% 55%
Elapsed Time (min) 10 60 45 19 8 3
Energy Fully Charged Battery 72.08
Energy Out - Load (Wh) 22.77 39.16 61.93 29.60 12.59 5.36 2.28
Energy In – Solar Panel (Wh) 2.84 17.00 19.84 12.85 5.47 2.33 0.99
MPPT 2% Power Loss 0.06 0.34 0.40 0.26 0.11 0.05 0.02
Energy Gain (Wh) 29.60
Energy Gain (Wh) 12.59
Energy Gain (Wh) 5.36
Energy Gain (Wh) 2.28
Energy Gain (Wh) 0.97
Average Energy Input (Wh) 17.00 17.00 17.00 17.00 17.00 17.00
Total Elapsed Time (min) 146
Total Elapsed Time (hr)(min) 2 26
Since the total energy of the battery (Table 7) was
72.08Wh, it meant that the battery would have 29.60Wh of
energy left. This would give us an additional 45 minutes
to the time obtained in Table 12, i.e., only if the solar
panel would stop providing energy. Nevertheless, we ex-
pected the solar panel to be connected to the battery dur-
ing those extra 45 minutes; hence, overall we would get ad-
ditional 30 minutes of energy at 17Wh of constant input.
As a result, our calculations predicted 60 minutes of extra
time, which total 2 hours and 26 minutes compared to the 1

86
hour and 26 minutes given by the battery alone (Table 12).
Overall, we estimated a 70% improvement in battery endur-
ance.
Following the same calculation method seen in Table
17, we noticed that for an average energy input of 12Wh, we
would get a total of 36 minutes of extra time, giving a to-
tal of 122 minutes or 2 hours and 2 minutes of battery en-
durance. In this case, we observed a 42% improvement in
battery endurance. These calculations are shown in Table
18.
Table 18. Battery Endurance Calculation Load w/SP (12Wh).
Throttle Level 100% 55% 55% 55% 55% 55%
Elapsed Time (min) 10 60 37 11 3 1
Energy Fully Charged Battery 72.08
Energy Out - Load (Wh) 22.77 39.16 61.93 23.88 7.17 2.15 0.65
Energy In – Solar Panel (Wh) 2.00 12.00 14.00 7.32 2.20 0.66 0.20
MPPT 2% Power Loss 0.04 0.24 0.28 0.15 0.04 0.01 0.00
Energy Gain (Wh) 23.88
Energy Gain (Wh) 7.17
Energy Gain (Wh) 2.15
Energy Gain (Wh) 0.65
Energy Gain (Wh) 0.19
Average Energy Input (Wh) 12.00 12.00 12.00 12.00 12.00 12.00
Total Elapsed Time (min) 122
Total Elapsed Time (hr)(min) 2 2
In Table 19, we can appreciate the difference in bat-
tery endurance between our calculations with and without
solar panel at certain energy input levels. As explained
before, we used 12Wh and 17Wh as our low and maximum input
energy levels.

87
Table 19. Battery Endurance w/Load.
Calculations Energy IN from SP Time Improvement
Load w/o SP 0Wh 1h 26min 0%
Load w/ SP 12Wh 2h 2min 42%
Load w/ SP 17Wh 2h 26min 70%
2. Raven with Solar Panel (100%-55%)
Similarly, it was necessary to calculate the energy
going into the battery and the energy coming out of the
battery to determine the amount of time the battery would
last.
From Table 8, we knew that the energy used by the Ra-
ven at 100% for the first 10 minutes was 21.63Wh and
30.23Wh at 55% for 1 hour; hence, we estimated the time the
battery would last, as seen in Tables 20 and 21. To better
estimate the time, we made our calculations using a low en-
ergy average input value of 12Wh, to represent worst ir-
radiance conditions, and 17Wh, to represent sunny condi-
tions. In Table 20, we observe the results obtained for an
average input energy of 12Wh. From Table 21, it can be
seen the results obtained for an average input of 17Wh.

88
Table 20. Battery Endurance Calculation Raven w/SP (100%-55% Throttle) 12Wh Energy Input.
Throttle Level 100% 55% 55% 55% 55% 55% 55% 55%
Elapsed Time (min) 10 60 67 26 10 4 2 1
Energy Fully Charged Battery 72.08
Energy Out - Raven (Wh) 21.63 30.23 51.86 33.95 13.21 5.14 2.00 0.78 0.30
Energy In – Solar Panel (Wh) 2.00 12.00 14.00 13.48 5.24 2.04 0.79 0.31 0.12
MPPT 2% Power Loss 0.04 0.24 0.28 0.27 0.10 0.04 0.02 0.01 0.00
Energy Gain (Wh) 33.95
Energy Gain (Wh) 13.21
Energy Gain (Wh) 5.14
Energy Gain (Wh) 2.00
Energy Gain (Wh) 0.78
Energy Gain (Wh) 0.30
Energy Gain (Wh) 0.12
Average Energy Input (Wh) 12.00 12.00 12.00 12.00 12.00 12.00 12.00 12.00
Total Elapsed Time (min) 180
Total Elapsed Time (hr)(min) 3 0

89
Table 21. Battery Endurance Calculation Raven w/SP (100%-55% Throttle) 17Wh Energy Input.
Throttle Level 100% 55% 55% 55% 55% 55% 55% 55% 55%
Elapsed Time (min) 10 60 79 43 24 13 7 4 2
Energy Fully Charged Battery 72.08
Energy Out - Raven (Wh) 21.63 30.23 51.86 39.66 21.86 12.05 6.64 3.66 2.02 1.11
Energy In – Solar Panel (Wh) 2.84 17.00 19.84 22.31 12.29 6.78 3.73 2.06 1.13 0.63
MPPT 2% Power Loss 0.06 0.34 0.40 0.45 0.25 0.14 0.07 0.04 0.02 0.01
Energy Gain (Wh) 39.66
Energy Gain (Wh) 21.86
Energy Gain (Wh) 12.05
Energy Gain (Wh) 6.64
Energy Gain (Wh) 3.66
Energy Gain (Wh) 2.02
Energy Gain (Wh) 1.11
Energy Gain (Wh) 0.61
Average Energy Input (Wh) 17.00 17.00 17.00 17.00 17.00 17.00 17.00 17.00 17.00
Total Elapsed Time (min) 243
Total Elapsed Time (hr)(min) 4 3

90
As seen in Table 22, our calculations predicted that,
under those specific average energy input conditions, the
Raven UAV with solar panel can last 64% and 121% longer,
compared to the almost two hours that it will endure with-
out a solar panel.
Table 22. Battery Endurance Raven w/SP (100%-55%).
Calculations Energy IN from SP Time Improvement
Raven w/o SP 0Wh 1h 50min 0%
Raven w/ SP 12Wh 3h 64%
Raven w/ SP 17Wh 4h 3min 121%
3. Raven with Solar Panel (100%-65%)
After obtaining the calculations for the Raven while
operating at 100% and 55% throttle levels with a solar pan-
el attached, it was necessary to do the same thing but for
the next set of throttle settings (100%-65%), described by
the Raven’s operator. The energy used and battery endur-
ance under a constant energy input of 12Wh and 17Wh are
shown in Tables 23 and 24, respectively.

91
Table 23. Battery Endurance Calculation Raven w/SP (100%-65% Throttle) 12Wh Energy Input.
Throttle Level 100% 65% 65% 65% 65% 65%
Elapsed Time (min) 10 60 43 13 4 1
Energy Fully Charged Battery 72.08
Energy Out - Raven (Wh) 21.63 37.56 59.19 26.62 8.34 2.61 0.82
Energy In – Solar Panel (Wh) 2.00 12.00 14.00 8.51 2.66 0.83 0.26
MPPT 2% Power Loss 0.04 0.24 0.28 0.17 0.05 0.02 0.01
Energy Gain (Wh) 26.62
Energy Gain (Wh) 8.34
Energy Gain (Wh) 2.61
Energy Gain (Wh) 0.82
Energy Gain (Wh) 0.26
Average Energy Input (Wh) 12.00 12.00 12.00 12.00 12.00 12.00
Total Elapsed Time (min) 132
Total Elapsed Time (hr)(min) 2 12

92
Table 24. Battery Endurance Calculation Raven w/SP (100%-65% Throttle) 17Wh Energy Input.
Throttle Level 100% 65% 65% 65% 65% 65% 65% 65%
Elapsed Time (min) 10 60 52 23 10 5 2 1
Energy Fully Charged Battery 72.08
Energy Out - Raven (Wh) 21.63 37.56 59.19 32.34 14.34 6.36 2.82 1.25 0.56
Energy In – Solar Panel (Wh) 2.84 17.00 19.84 14.64 6.49 2.88 1.28 0.57 0.25
MPPT 2% Power Loss 0.06 0.34 0.40 0.29 0.13 0.06 0.03 0.01 0.01
Energy Gain (Wh) 32.34
Energy Gain (Wh) 14.34
Energy Gain (Wh) 6.36
Energy Gain (Wh) 2.82
Energy Gain (Wh) 1.25
Energy Gain (Wh) 0.56
Energy Gain (Wh) 0.25
Average Energy Input (Wh) 17.00 17.00 17.00 17.00 17.00 17.00 17.00 17.00
Total Elapsed Time (min) 163
Total Elapsed Time (hr)(min) 2 43

93
In Table 23, we observed a 45% improvement of the bat-
tery endurance thanks to the solar panel. The battery was
expected to last 41 minutes longer, than without solar
cells. In Table 24, the improvement was even higher due to
the high input energy of 17Wh. All these observations are
summarized in Table 25.
Table 25. Battery Endurance Raven w/SP (100%-65%).
Calculations Energy IN from SP Time Improvement
Raven w/o SP 0Wh 1h 31min 0%
Raven w/ SP 12Wh 2h 12min 45%
Raven w/ SP 17Wh 2h 43min 79%
4. Raven with Solar Panel (100%-70%)
Finally, we did the same calculation with a higher
throttle setting of 70% to cover all the speed control lev-
els chosen by the operator. In Table 26, we expected the
battery to last 36 minutes longer than without solar cells.
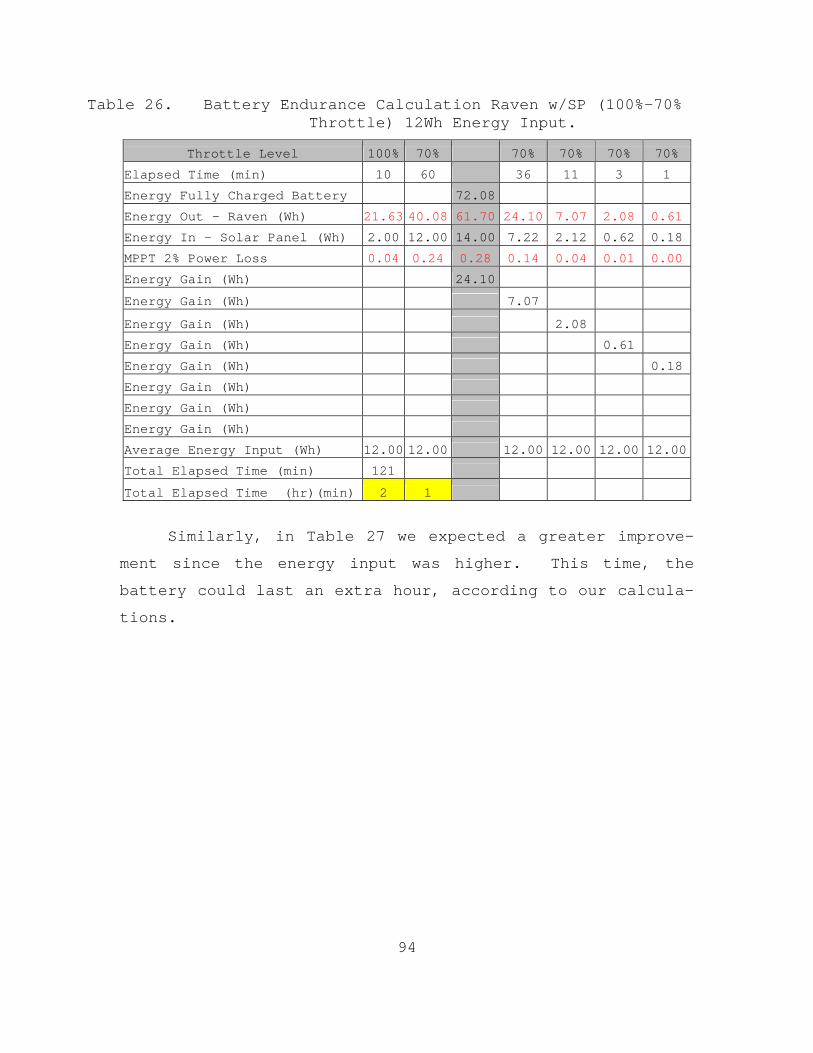
94
Table 26. Battery Endurance Calculation Raven w/SP (100%-70% Throttle) 12Wh Energy Input.
Throttle Level 100% 70% 70% 70% 70% 70%
Elapsed Time (min) 10 60 36 11 3 1
Energy Fully Charged Battery 72.08
Energy Out - Raven (Wh) 21.63 40.08 61.70 24.10 7.07 2.08 0.61
Energy In – Solar Panel (Wh) 2.00 12.00 14.00 7.22 2.12 0.62 0.18
MPPT 2% Power Loss 0.04 0.24 0.28 0.14 0.04 0.01 0.00
Energy Gain (Wh) 24.10
Energy Gain (Wh) 7.07
Energy Gain (Wh) 2.08
Energy Gain (Wh) 0.61
Energy Gain (Wh) 0.18
Energy Gain (Wh)
Energy Gain (Wh)
Energy Gain (Wh)
Average Energy Input (Wh) 12.00 12.00 12.00 12.00 12.00 12.00
Total Elapsed Time (min) 121
Total Elapsed Time (hr)(min) 2 1
Similarly, in Table 27 we expected a greater improve-
ment since the energy input was higher. This time, the
battery could last an extra hour, according to our calcula-
tions.

95
Table 27. Battery Endurance Calculation Raven w/SP (100%-70% Throttle) 17Wh Energy Input.
Throttle Level 100% 70% 70% 70% 70% 70% 70% 70%
Elapsed Time (min) 10 60 45 19 8 3 1 1
Energy Fully Charged Battery 72.08
Energy Out - Raven (Wh) 21.63 40.08 61.70 29.82 12.40 5.15 2.14 0.89 0.37
Energy In – Solar Panel (Wh) 2.84 17.00 19.84 12.65 5.26 2.19 0.91 0.38 0.16
MPPT 2% Power Loss 0.06 0.34 0.40 0.25 0.11 0.04 0.02 0.01 0.00
Energy Gain (Wh) 29.82
Energy Gain (Wh) 12.40
Energy Gain (Wh) 5.15
Energy Gain (Wh) 2.14
Energy Gain (Wh) 0.89
Energy Gain (Wh) 0.37
Energy Gain (Wh) 0.15
Energy Gain (Wh)
Average Energy Input (Wh) 17.00 17.00 17.00 17.00 17.00 17.00 17.00 17.00
Total Elapsed Time (min) 146
Total Elapsed Time (hr)(min) 2 26
In Table 28, we can compare the battery endurance cal-
culated for the Raven with and without solar cells and its
corresponding improvement.
Table 28. Battery Endurance Raven w/SP (100%-70%).
Calculations Energy IN from SP Time Improvement
Raven w/o SP 0Wh 1h 25min 0%
Raven w/ SP 12Wh 2h 1min 42%
Raven w/ SP 17Wh 2h 26min 72%

96
G. BATTERY ENDURANCE TESTS WITH SOLAR PANEL
Our initial test was conducted in the Monterey Bay
Area, but due to the variable weather conditions, we had to
find a way to take the test equipment to a location where
clear skies and good sunlight could be available throughout
the day. As seen in Figure 49, we found a way to mount all
the test equipment on a mid-size pick-up and travelled to
Carmel Valley and Salinas in California, where the weather
conditions were more accommodating for our research.
Figure 49. Mobile Laboratory.
1. Load with Solar Panel
To validate the calculations obtained in section E-1,
it was necessary to test the solar panel while connected to
the MPPT, battery, and to the load. We did two tests on

97
three separate days. Test 1 was interrupted due to heavy
clouds and lack of sunlight; hence, it was completed in two
days.
As seen in Figure 50, the input energy coming from the
solar panel into the battery was different each test day.
During the first test, we observed an initial average input
energy of 16.45Wh. During the second part of the test, we
noticed that the energy input increased and stayed fixed
around 17.24Wh. Using the same method of calculation as in
the previous sections, we decided to use the average of
these two values (16.85Wh) as our energy input from our so-
lar panel. Our estimated time of duration of 2 hours and
25 minutes is shown in Table 29.
Table 29. Battery Endurance Calculation Load w/SP Test 1.
Throttle Level 100% 55% 55% 55% 55% 55%
Elapsed Time (min) 10 60 45 19 8 3
Energy Fully Charged Battery 72.08
Energy Out - Load (Wh) 22.77 39.16 61.93 29.42 12.41 5.23 2.21
Energy In – Solar Panel (Wh) 2.81 16.85 19.66 12.66 5.34 2.25 0.95
MPPT 2% Power Loss 0.06 0.34 0.39 0.25 0.11 0.05 0.02
Energy Gain (Wh) 29.42
Energy Gain (Wh) 12.41
Energy Gain (Wh) 5.23
Energy Gain (Wh) 2.21
Energy Gain (Wh) 0.93
Average Energy Input (Wh) 16.85 16.85 16.85 16.85 16.85 16.85
Total Elapsed Time (min) 145
Total Elapsed Time (hr)(min) 2 25
The second test had an average input energy of
14.55Wh. Similarly, we use this value to calculate our
time of duration. The time duration of 2 hours and 13 min-
utes is reflected in Table 30.

98
Table 30. Battery Endurance Calculation Load W/SP Test 2.
Throttle Level 100% 55% 55% 55% 55% 55%
Elapsed Time (min) 10 60 41 15 5 2
Energy Fully Charged Battery 72.08
Energy Out - Load (Wh) 22.77 39.16 61.93 26.79 9.76 3.55 1.29
Energy In – Solar Panel (Wh) 2.43 14.55 16.98 9.96 3.63 1.32 0.48
MPPT 2% Power Loss 0.05 0.29 0.34 0.20 0.07 0.03 0.01
Energy Gain (Wh) 26.79
Energy Gain (Wh) 9.76
Energy Gain (Wh) 3.55
Energy Gain (Wh) 1.29
Energy Gain (Wh) 0.47
Average Energy Input (Wh) 14.55 14.55 14.55 14.55 14.55 14.55
Total Elapsed Time (min) 133
Total Elapsed Time (hr)(min) 2 13
0 1000 2000 3000 4000 5000 6000 7000 8000 90000
5
10
15
20
25
30
Time in Seconds
Pow
er
Power In from Solar Panel Into Battery with Load
Test1
Test2
Figure 50. Power Input to Load w/SP Test.
In Figure 51, we decided to plot the power consumption
of the battery without the solar panel, as seen in section
D-2 to compare it with the actual test results obtained
with the solar panel. During test 1, the power of the bat-

99
tery was consumed in 2 hours and 24 minutes. On test day 2
the battery lasted 2 hours and 10 minutes.
0 1000 2000 3000 4000 5000 6000 7000 8000 900020
40
60
80
100
120
140
160
Time in Seconds
Pow
er
Battery Power Consumption with Load and Solar Panel
Load
SP and Load Test 1SP and Load Test 2
Figure 51. Power Consumption Load w/ Solar Panel.
Evidently, the different input energy values greatly
affected the endurance of the battery. In Table 31, we
show all the calculated and actual test results obtained
from testing of the load that represented the Raven with
and without the solar panel. Here again, we noted that our
computations came very close to the real values obtained
from the experiment.

100
Table 31. Calculated vs. Actual Time.
Energy IN from SP
Calculated Time
Calculated Improvement
Load w/o SP 0Wh 1h 26min 0%
Raven w/ SP 14.55Wh 2h 13min 54%
Raven w/ SP 16.85Wh 2h 25min 69%
Energy IN from SP Actual Time
Actual Im-provement
Load w/o SP 0Wh 1h 29min 0%
Raven w/ SP 14.55Wh 2h 10min 46%
Raven w/ SP 16.85Wh 2h 24min 62%
2. Raven with Solar Panel (100%-55%)
We conducted two tests with the Raven and with solar
panel at 100% and 55% throttle. In our first test, we had
an average energy input of 13.55Wh. The test was started
at around 3:00pm. Unfortunately, 2 hours later the sunny
conditions began to deteriorate due to the presence of
heavy clouds; hence, we observed a big drop at the end of
the test. During our second test, we noticed an average
energy input of 12.7Wh. These two energy input values
stayed between our calculated range, as previously shown in
Tables 20 and 21. The input energy of both test days is
shown in Figure 52.

101
0 2000 4000 6000 8000 10000 120000
5
10
15
20
25
30
Time in Seconds
Pow
er
Power In from Solar Panel Into Battery w/ Raven 100-55% Throttle
Test Day 1
Test Day 2
Figure 52. Power Input to Raven w/SP 100%-55% Throttle Test.
In Figure 53, we show the results for the two tests
with solar panel and compare them with the original power
consumption test performed without the solar panel at 100%
to 55% throttle. During the first day, the test lasted
11,540-seconds which corresponded to 3 hours and 12 min-
utes. During the second day, the test lasted 3 hours and 5
minutes. The difference in time was due to the difference
in input energy received from the solar panel on both days,
as seen previously in Figure 52.

102
0 2000 4000 6000 8000 10000 1200020
40
60
80
100
120
140
160
Time in Seconds
Pow
er
Raven Power Consumption w/ Solar Panel 100-55% Throttle
Test w/o SP
Test Day 1Test Day 2
Figure 53. Power Consumption Raven w/SP 100%-55% Throttle.
As in the previous section, we wanted to show the cal-
culated and actual time results at the average energy input
levels obtained the day of the tests. These results are
shown in Table 32.
Table 32. Actual Time and Improvement.
Energy IN from SP Actual Time Improvement
Load w/o SP 0Wh 1h 53min 0%
Raven w/SP Test 1 13.55Wh 3h 12min 70%
Raven w/SP Test 2 12.70Wh 3h 5min 64%
3. Raven with Solar Panel (100%-65%)
This was the last test to be conducted and by this
time, we only had one battery left for the test. The other
batteries were accidentally over-discharged and were no
longer usable. Moreover, the battery that we used for this
test was not holding up the energy. Needleless to say, we
carried on with the test to see if even under these condi-

103
tions, the battery could still last a little longer. We
conducted two tests at 100%-65% throttle to see if the en-
durance time of the battery would fall between the calcu-
lated values obtained in Tables 22 and 23. In Figure 54,
we noticed that the input energy obtained during the first
day of the test averaged 11.94Wh. The average energy input
during the second test was 10.62Wh.
0 1000 2000 3000 4000 5000 6000 70000
5
10
15
20
25
30
Time in Seconds
Pow
er
Power In Raven w/Solar Panel 100-65%
Test 1
Test 2
Figure 54. Power Input to Raven w/SP 100%-65% Throttle Test.
In Figure 55, we noticed that the first test with the
battery lasted 1 hour and 53 minutes i.e., 19 minutes
shorter compared to the projected time of 2 hours and 12
minutes. During the second test, the battery lasted 7,606-
seconds which represented 2 hours and 6 minutes, exactly 1-
minute longer than expected. However, we also noticed that
the power consumption during the initial 10 minutes at 100%
was not the same compared to all the other plots. Addi-
tionally, we observed a square type signal output that re-
flected the consumption of the battery. As mentioned be-

104
fore, we believed that by this time our batteries were
reaching their end of their life cycles and we could not
continue performing more tests due to the lack of more
spare batteries. Although our experiment values did not
match our calculated ones, we still observed a small im-
provement. Nevertheless, we think that more tests need to
be done at this throttle setting to demonstrate that our
calculation method is accurate.
0 1000 2000 3000 4000 5000 6000 7000 800020
40
60
80
100
120
140
160
Time in Seconds
Pow
er
Battery Endurance Raven w/Solar Panel 100-65%
Test 1
Test 2
Figure 55. Power Consumption to Raven w/SP 100%-65% Throt-tle.
The actual time results and improvement observed dur-
ing the test conducted on the Raven with solar panel at
100% and 65% throttle settings are shown in Table 33.
Table 33. Actual Time Results and Improvement.
Energy IN from SP Actual Time Improvement
Raven w/o SP 0Wh 1h 34min 0%
Raven w/SP Test 1 11.94Wh 1h 53min 20%
Raven w/SP Test 2 10.62 2h 06min 34%

105
4. Raven with Solar Panel (100%-70%)
When conducting the test at 100% and 70% throttle, we
observed an average energy input of approximately 12.5Wh,
as seen in Figure 56. .
0 1000 2000 3000 4000 5000 6000 7000 80000
2
4
6
8
10
12
14
16
Time in Seconds
Pow
er
Power In from Solar Panel 100%-70% Test
Figure 56. Power Input Raven w/SP 100-70% Throttle Test.
Nevertheless, the duration the test lasted 1 hour 58
minutes, 2 minutes shorter than what we calculated. The
overall time that it took for the battery to discharge down
to 21.2V is seen in Figure 57.

106
0 1000 2000 3000 4000 5000 6000 7000 800020
40
60
80
100
120
140
160
Time in Seconds
Pow
er
Power Consumption 100%-70% Raven Load
Test w/o SP
Test w/ SP
Figure 57. Power Consumption Raven w/SP 100%-70% Throttle.
Again in Table 34, we showed the actual time obtained
for the test conducted with the Raven and solar panel at
100% and 70% throttle settings. In this case, we still no-
ticed an improvement of 37%.
Table 34. Actual Time and Improvement.
Energy IN from SP Actual Time Improvement
Raven w/o SP 0Wh 1h 26min 0%
Raven w/SP Test 1 12.55 1h 58min 37%
H. OBSERVATIONS
1. Modified Wing
As mentioned earlier, the tests conducted in this re-
search were based on the inputs provided by the operator of
the Raven RQ-11B UAV. It is important to keep in mind
that, according to the operator, the Raven UAV requires no

107
power to descend and that its elongated wing provides more
lift; thus, we can expect the endurance of the Raven to be
longer.
The modified wing, without solar cells, was tested on
10 May 2010, during a flight demonstration at the Concept-
Based Experimentation (CBE) conference at Camp Roberts,
California. The flight test lasted an additional time of
34 minutes. Hence, according to the sponsors of the pro-
ject, the elongated wing improved the flight time by 37%
[45]. This means that the improvement in battery endurance
could be actually higher than calculated, when the Raven
flies with the solar panel and the modified wing.
2. Current Test
After determining the power consumption and the endur-
ance of the battery at 55%, 65%, and 70% throttle settings
with the solar panel, we were curious to find out what
would be the throttle level in which the solar panel could
provide enough energy to run the motor without relying on
battery power.
To do this, we connected a third multi-meter between
the positive terminal of the battery and the point where
the MPPT and the load were connected, as seen in Figure 58.

108
Figure 58. Current Test Connection.
We noted that at 40% throttle the current going into
the battery and the current going out from the battery was
the same. We also noticed that at 15% throttle the solar
panel was actually driving the motor of the UAV and charg-
ing the battery.
3. Daily Energy Variations
Unfortunately, these improvements greatly depend on
the amount solar energy the wing could absorb during a sin-
gle mission. The tests conducted in the Monterey area were
difficult to do because of the constant presence of clouds
in the area. On the other hand, the tests conducted in
Carmel Valley, California were more consistent. Therefore,
we anticipated that testing the solar panel in areas where

109
there is a higher index of irradiance, such as the deserts
of Africa or Arizona; the improvement could be much higher.
4. Temperature
Another factor that limited our ability to obtain a
longer endurance was temperature. Studies have determined
that a solar cell loses approximately 2mV for every degree
Celsius above room temperature [46]. To prove this fact,
we first measure the temperature and the voltage of a sin-
gle cell under sunlight, while the entire panel was being
cooled down by a fan. Using an IR thermometer and a multi-
meter, we obtained 35-degree Celsius and 23.7V. Then, we
placed the solar panel on the floor and block any wind cur-
rents to prevent any cooling of the cell. Using the same
measurement devices, we obtained 66-degrees Celsius and
21.6V from the same solar cell. It is worth mentioning
that the voltage measured was open circuit voltage. Over-
all, we observed a difference of 29-degrees Celsius and
2.1V between both tests. Using the fact stated in [46] and
knowing that we had close to a 30-degree Celsius increase
in temperature and 40 cells on the panel, we expected to
have a voltage drop of 2.4V. Thus, we confirmed that tem-
perature drastically affected our input power coming from
the solar panel by approximately 10%. Luckily, we are con-
fident that temperature would not play a big roll while the
solar panel is mounted on the Raven RQ-11B and flying,
since it would have sufficient wind to keep the solar cells
cool and because temperature decreases as the Raven reaches
altitudes above 2,000ft.
110
5. MPPT Fluctuations
Throughout all of our tests, we observed a constant
dip in our input power, as it was seen in Figures 50, 52,
54, and 56. This phenomenon took place every 300-second and
became one more factor that lessened the input power pro-
vided by the solar panel. On 2 September 2010, we asked
the technicians of GENASUN about our constant resetting of
the MPPT Boost Charge Controller to find out if it was due
to a defective component. They replied saying that the ap-
pearance of those dips in the input power is the result of
the internal operation of the MPPT. They added that the
MPPT Boost charge controller periodically auto-zeroes the
current measurement to ensure proper operation at maximum
power, but it happens in fractions of a second that has no
major impact on the average current of the solar panel.
Hence, the device was operating normally [47].
6. Weight
In order to do any modification on the Raven UAV, the
Aircraft Controlling Custodian Type Commander (ACC/TYCOM)
needs to authorize it, provided that the alteration would
not affect the structure and would not impact drastically
the weight and balance of the aircraft. For this part of
the research, a total of weight of 560gr was authorized to
incorporate solar cells onto the Raven UAV [48]. This
weight included the modified wing. We weighed the original
and the modified wings without solar cells to see the dif-
ference between them. The original wing weighed 10.4-Oz
(295gr) and the modified wing weighed 18.6-Oz (527gr),
i.e., 8.2-Oz (232gr) heavier than the original.

111
The weight for the solar portion of the project, which
includes the solar cell, MPPT, and balancer charger was on-
ly 221gr. The overall weight was below the authorized max-
imum given by the ACC/TYCOM. The breakdown of weights by
item is described in Table 35. Therefore, our project com-
plied with the modification request.
Table 35. Final Added Weight.
Weight (Oz) Weight (gr) Solar cells 3.7 105 MPPT 3.6 102 Balancer Charger 0.5 14 Modified Wing 8.2 232 Total 16.0 453
7. Charging Other Batteries
Another part of this research consisted on recharging
other batteries using the solar panel as our source of en-
ergy. For this portion of the research, we decided to use
three Lithium Polymer (Li-po) batteries of 11.1V. Their
capacity was 1200mA, 1300mA, and 1350mA. Our solar panel,
as described throughout this chapter, gave us an average
energy input between 12Wh and 17Wh. During our tests the
average input voltage oscillated between 11V and 13V enough
voltage to charge 11.1V Li-po batteries. However, since
the voltage from the solar panel was higher than the volt-
age of the batteries, it was necessary to use a MPPT/buck
converter that would keep the voltage from overcharging the
batteries. The MPPT used for this test was the GV-4 Low
Power Charge Controller from GENASUN used in previous the-
sis work [5]. This MPPT was programmed to charge up to
12.5V. Additionally, we used a balancer charger to ensure
that every cell in the battery would charge equally.

112
First, we discharged each battery using three 10-Ohms
resistors connected in parallel. Each battery was dis-
charged to 9.7V. We did not want to go below the minimum
battery voltage of 9.6V. Then, we disconnected the load
from the battery and connected the solar panel.
The recommended charging rate is C/3, which represents
1/3 of the capacity of the battery. This means that if the
capacity was 1200mAh, then charging current rate has to be
400mAh, and it should last 3 hours approximately to fully
charge the battery. Nevertheless, our solar panel and MPPT
were providing around 1A of charging current, which meant
that our charging rate was about 1C.
In all three tests, it took about 1 hour and 20 min-
utes for the batteries to reach peak voltage of 12.47V,
12.44V, and 12.45V. We used the LED indicators on the bal-
ancer charger to determine whether the battery was fully
charged or not. This occurred when the charging current
reached 9% of the rated current of each battery. We also
took voltage readings at the end of the test to verify that
the battery reached full charge status. The MPPT also in-
dicated when the battery reached full charge status when
the green LED status indicator stopped flashing. In Table
36 we can see the time it took to recharge each battery.
Table 36. Li-po Battery Recharge Time.
Battery Initial Voltage Final Voltage Time Battery #1 9.7V 12.47V 84-min Battery #2 9.7V 12.44V 80-min Battery #3 9.7V 12.45V 88-min
Since our charging rate current was higher than recom-
mended, it shortened the charging time compared to other

113
tests conducted in similar research [5]. In the end, the
solar panel successfully charged the two Li-po batteries.
8. Specific Energy Calculation
Our intent was to leave the reader of this thesis re-
search with the idea of how much of a specific energy per
weight ratio should be needed to achieve longer flight
time.
First, we considered the energy consumed by the Raven
with its original payload. Since, the weight of the Raven
was 4.2-lbs (1.9Kg) and the energy used in 1 hour and 50
minutes at 100% and 55% throttle configuration was 72.08Wh,
we obtained a ratio of 0.038, as seen in equation 6.6.
72.08
0.0381902.6
usednergy per eight
eight
E WhE W
W g (5.10)
Second, we then considered the same energy consumed by
the Raven with the original payload, but we included the
modification in support structure, i.e., the modified wing.
In this case, since the flight time was 2 hours and 4 min-
utes, the energy consumed was actually lower (69.28Wh).
Moreover, the weight of the modified wing was also heavier
by 232g. As a result, the specific energy per weight ratio
turned out to be 0.032, as seen in equation 6.7.
69.28
0.0322134.6
usednergy per eight
eight
E WhE W
W g (5.11)
Finally, we obtained a third specific energy per
weight ratio that included the energy consumed by the Raven
with the payload, modified wing, and the solar modification
circuit. However, in equation 6.8, we noticed that the en-
ergy used by the Raven was zero because it flew 3 hours,

114
i.e., 1 hour and 10 minutes longer without using a single
Watt hour of energy from the battery.
0
0.02355.6
usednergy per eight
eight
E WhE W
W g (5.12)
With this calculation, we could say that the lower
the specific energy per weight ratio is, the more flight
time improvement we can get. Nevertheless, this is true
only if the added weight includes support structure that
could improve the lift and/or solar modification that could
reduced the amount of energy used from the battery.
I. FLIGHT TEST RESULTS
Unfortunately, we were not able to test our design
during flight due to a lack of Raven assets authorized to
fly with the solar wing. However, the next opportunity to
proof-our concept flight would be in November 2010 at Camp
Roberts, during the next CBE Conference.
J. COST ESTIMATE
The amount of money spent on solar cells and other
components necessary to conduct this research was only a
small fraction of the tag price for a single Raven UAV,
which is about $35,000.00. A breakdown of the money spent
on this project is described in Table 37.

115
Table 37. Solar Modification Cost.
Minimum Purchase Order Expenditure per Unit
Item Description Unit of Issue Qty Price Qty Used Cost
CIGS Solar Cells (19 cells per string) String 50 $5,000.00 1 $100.00
Boost MPPT Charge Controller EA 1 $255.00 1 $255.00
Balancer Charger EA 1 $29.95 1 $29.95
Carpet Protection Film Roll 1 $45.99 1 $45.99
Connector EA 1 $1.99 1 $1.99
Wiring Spool 1 $6.00 1 $6.00
Copper Conductor Tape Roll 1 $25.86 1 $25.86
Miscellaneous $50.00
Subtotal $514.79
Labor and Assembly $500.00
Total $1,014.79
Global Solar Energy Inc., the manufacturer of CIGS
TFPV cells, could not sell individual strings. Therefore,
we were required to purchase a minimum order of 50 strings.
Nonetheless, we calculated that the entire solar modifica-
tion to the Raven RQ-11B could cost around $1,000.00. This
represented only 3% of the cost of a single Raven asset,
which made this research cost effective.
In this estimate, we did not include the cost for the
modification of the wing, since it was modified by the me-
chanical engineers of the Naval Weapons Center in China
Lake, California.

116
THIS PAGE INTENTIONALLY LEFT BLANK

117
VII. CONCLUSIONS
In this thesis research, we looked at the entire Raven
RQ-11B UAV Program and examined the benefits as well as the
limitations provided to ground forces fighting in urban
terrain. Throughout this research we examined the begin-
nings of the Raven UAV, different prototypes built, system
configuration and capabilities, cost per unit, training,
etc. We intended to give the reader a good appreciation of
the potential and incredible advantages that this particu-
lar unmanned aerial vehicle gives to the military.
Next, we briefly submerged ourselves into the intri-
cate world of solar cells; specifically, CIGS solar cells.
We wanted to get a better understanding of their operation,
structure, factors that affect their performance, and the
advantages of using thin film photovoltaic cells. We dem-
onstrated that in order to achieve the highest improvement
in battery endurance, we ought to seek the highest effi-
ciency CIGS TFPV cells available in today’s market. We
were fortunate to find 13% efficient CIGS cells.
Additionally, we spent some time looking into other
power electronic devices that required to be integrated in-
to our research. We examined their operation, functional-
ity, characteristics, but for the most part, we focused on
how they contributed to give us the maximum output power
from our solar panel.
The design and assembly of our solar wing panel was,
perhaps, the pinnacle of this research. It was essential
to come up with the most efficient solar cell arrangement
to cover every single area available on the wing. Such ar-

118
rangement entailed minimizing labor by reducing the number
of cuts and connections, and maximizing the output power.
Here, we also explained the challenges encountered when
working and handling uncovered CIGS TFPV cells. Although
it was a tedious and time consuming process, it was a nec-
essary step to avoid damaging the cells and adding more
weight to the aircraft. Furthermore, we discussed the in-
corporation of additional power electronic devices neces-
sary to obtain the power required to charge the battery
while on flight.
To proof our concept, we conducted tests at different
throttle configurations to match the normal operation of
the Raven UAV during regular missions. Our tests were con-
ducted inside our laboratory, initially, and then outdoors
to measure the improvements obtained from the solar panel.
We made an effort to take readings at different locations
where the average energy input was higher.
In this thesis, we also performed a cost benefit anal-
ysis to determine how costly it could be to make this solar
modification. We determined that the entire modification
would cost $1,000.00, which represented only 3% of the cost
for a single asset.
In the end, although the weather conditions where our
tests were conducted were not favorable for this type of
research, we observed a considerable endurance improvement
by using solar cells on the wing of the Raven UAV, which
validated our thesis. A summary of the results obtained is
shown in Table 38.

119
Table 38. Summary of Testing Results.
100% - 55% Throttle Test
Energy IN from SP Actual Time Improvement
Raven w/o SP 0Wh 1h 53min 0%
Raven w/SP Test 1 13.55Wh 3h 12min 70%
Raven w/SP Test 2 12.70Wh 3h 5min 64%
100%-65% Throttle Test
Raven w/o SP 0Wh 1h 34min 0%
Raven w/SP Test 1 11.94Wh 1h 53min 20%
Raven w/SP Test 2 10.62 2h 06min 34%
100% - 70% Throttle Test
Raven w/o SP 0Wh 1h 26min 0%
Raven w/SP Test 1 12.55 1h 58min 37%
In Table 38, we compared the different tests performed
with the solar panel to the tests conducted without the so-
lar modification at those specific throttle configurations.
We noticed that under low average energy input conditions
we obtained somewhere around 70% improvement when operating
between 100% and 55% throttle, and around 40% when operat-
ing at the other throttle configurations. We truly be-
lieved that more tests are needed at higher average energy
input levels to observe improvements equal or greater than
100% at any throttle setting.
A. RECOMMENDATIONS
Although this thesis has proven that the application
of CIGS TFPV improves the flight endurance of the Raven
UAV, there is more that could be done to optimize our find-
ings.

120
1. Eliminate Boost Converter
Since the voltage provided by the solar panel was low-
er than the voltage of the battery, it was imperative to
find a DC-DC converter that would step up the voltage from
the solar panel to 25.2V to charge the battery. To our
benefit, the MPPT that we chose came with a boost converter
built-in on the same circuit. The efficiency of this de-
vice, according to the manufacturer [41], was 96% to 98%;
hence, it loses between 4% to 2% while stepping up the vol-
tage. Adding more cells to the solar panel would increase
the voltage to a point where no power converter would be
required, and thus, improving the efficiency of the MPPT.
To do this, the area of the solar cells would need to
be shorter. However, making the area of the solar cells
shorter also implies that the output current would be re-
duced. Moreover, it becomes more challenging since there
are not that many center conductors available on top of the
solar cell that could be used to connect them with one an-
other. Therefore, the cell would have to be cut around the
center conductors to ensure that each cell would have a
place to connect to another cell. Unfortunately, many so-
lar cells would be sacrificed to make others work, result-
ing in wasteful use of solar cells and added cost to the
modification. Without a doubt, it is a difficult task, but
it is also one that could bring positive results.
2. Solar Design for Original Wing
The advantage of having a modified wing is that it
provides more room to place more solar cells. However,
there is also a big disadvantage that most battalion com-
manders in the battlefield are not willing to take. Un-

121
less, mechanical engineers find a way to make the modified
wing a man-portable item, it would not be accepted by op-
erational units in the field. Thus, there still a need to
apply this concept on the original size wing, which has a
smaller area. Once again, for this case the area of the
solar cells would also need to be shorter to increase the
voltage of the solar panel. In addition it would be neces-
sary to make each detachable piece of the center wing and
the horizontal stabilizer a separate solar panel with the
same number of solar cells connected in series, and the pa-
nels connected in parallel. This would give the same out-
put voltage, but it would also increase the amount of cur-
rent.
3. New Technology CIGS and Power Electronics
Technology is constantly moving at a fast rate. In
the area of CIGS TFPV cells, huge improvements in effi-
ciency are being observed every day. As explained in Chap-
ter III, up to 20.1% efficient CIGS cells have been at-
tained [19]. This is an indication that in the near future
the manufacturing industry would be able to produce higher
efficient cells that would allow us to obtain better re-
sults on applications similar to the one conducted on this
thesis. Similarly, power electronic devices, such as the
ones used in this thesis research, would be available in
smaller dimensions and perhaps with higher efficiency.
This is the case of the SPV1020 boost converter from
STMicroelectronics, which is a single chip that uses a com-
bination of a DC-DC converter with a digital logic circuit
to perform as an MPPT. This device is designed to increase
the efficiency of solar panels [49].

122
THIS PAGE INTENTIONALLY LEFT BLANK

123
LIST OF REFERENCES
[1] R. J. Boucher, "History of solar flight," presented at
AIAA/SAE/ASME 20th Joint Propulsion Conference, Cin-cinnati, OH, 1984.
[2] Joseph, Flatley, “Zephyr solar UAV sets yet another
flight record: 7 days and counting!” Engadget. Jul. 2010. [Online]. Available: http://www.engadget.com/2010/07/17/zephyr-solar-uav-sets-yet-another-flight-record-7-days-and-coun/. [Ac-cessed Jul. 31, 2010].
[3] Global Security, “High altitude airship (HAA),” Global
Security. May 2008. [Online]. Available: http://www.globalsecurity.org/intell/systems/haa.htm. [Accessed 4 June 2010].
[4] Martha Falconi, “Solar plane passes big test, flies 24
hours straight.” AOL News. Jul. 2010. [Online]. Avail-able: http://www.aolnews.com/tech/article/solar-impulse-plane-powered-by-the-sun-lands-safely-after-24 hour-test-flight/19546048. [Accessed 11 July 2010].
[5] William Hurd, “Application of cupper indium gallium
diselenide photovoltaic cells to extend the endurance and capabilities of unmanned aerial vehicles,” M.S. thesis, Naval Postgraduate School, Monterey, CA, 2009.
[6] Global Security, “RQ-11 raven,” Apr. 2005. [Online].
Available: http://www.globalsecurity.org/intell/systems/ raven.htm. [Accessed 17 July 2010].
[7] Directory of U.S. Military Rockets and Missiles,
“AeroVironment FQM-151 pointer,” Designation-Systems. Jan. 2006. [Online]. Available: http://www.designation-systems.net/dusrm/index.html. [Accessed 24 July 2010].

124
[8] A. Mawn and P. Tokamaru, “The pathfinder raven small unmanned aerial vehicle,” in Proc. Of 24th Army Science Conf. 2004. [Online]. Available: http://handle.dtic.mil/100.2/ADA432526. [Accessed 1 August 2010].
[9] Directory of U.S. Military Rockets and Missiles,
“AeroVironment RQ-11,” Designation-Systems. Sep. 2006. [Online]. Available: http://www.designation-systems.net/dusrm/app2/q-11.html. [Accessed 24 July 2010].
[10] United States Army. “RQ-11B raven small unmanned air-
craft system (SUAS).” Mar. 2010. [Online]. Available: http://www.rucker.army.mil/docs/usaace_info/USAACE%20Info%20Paper%20TCM-UAS%20RQ-11B%20Raven%20UAS%2022%20Mar%2010.pdf. [Accessed 25 July 2010].
[11] Army Technology, “RQ-11 raven unmanned aircraft sys-tem, USA.” Army-Technology. 2010. [Online]. Available: http://www.army-technology.com/projects/rq11-raven. [Accessed 17 July 2010].
[12] Unmanned Aerial System, “Raven RQ-11B,” Unmanned Ae-rial System. 2009. [Online]. Available: http://www.af.mil/shared/media/photodb/photos/070706-f-6751b-204.jpg. [Accessed 24 July 2010].
[13] John Keller, "Unmanned vehicle spending in the 2010 dod budget to reach $5.4 billion." Military and Aero-space Electronics. Dec. 2009. [Online]. Available: http://www.militaryaerospace.com/index/display/article-display/363553/articles/military-aerospace-electronics/executive-watch/unmanned-vehicle-spending-in-the-2010-dod-budget-to-reach-54-billion.html.[Accessed 10 July 2010].
[14] U.S.Army, “U.S. army roadmap for UAS 2010-2035.” Stand-To.Army. Apr. 2010. [Online]. Available: http://www.rucker.army.mil/usaace/uas/U.S.%20Army%20UAS%20RoadMap%202010%202035.pdf. [Accessed 17 July 2010].
[15] B. Cossel, “Raven pre-flight checks,” Defend America.
Oct. 2004. [Online]. Available: http://www.defendamerica.mil/photoessays/oct2004/p101904b1.html. [Accessed 1 August 2010].
http://www.rucker.army.mil/docs/usaace_info/USAACE Info Paper TCM-UAS RQ-11B Raven UAS 22 Mar 10.pdf
http://www.rucker.army.mil/docs/usaace_info/USAACE Info Paper TCM-UAS RQ-11B Raven UAS 22 Mar 10.pdf

125
[16] J. Glenn and W. Snodgrass, ”The Raven small unmanned aerial vehicle (SUAV), investigating potential di-chotomies between doctrine and practice.” M.S. Thesis, Naval Postgraduate School, Monterey, CA, 2005.
[17] Operator and Field Maintenance Manual, “Small unmanned aircraft system (SUAS) RQ-11B NSN 1550-01-538-99256.” Department of the Army. 2008.
[18] K. Ramanathan, J. Keane, and R. Noufi, “Properties of
high-efficiency cigs thin-film solar cells.” National Renewable Energy Laboratory. Feb. 2005. [Online]. Available:http://www.nrel.gov/docs/fy05osti/37404.pdf. [Accessed 24 July 2010].
[19] M. Osborne. “CIGS record of 21% efficiency reported by researchers at ZSW,” PV-Tech. Apr. 2010. [Online]. Available: http://www.pv-tech.org/news/_a/cigs_record_of_20.1_efficiency_reported_by_researchers_at_zsw/. [Accessed 24 June 2010].
[20] Global Solar Energy, “G2 thin film string data sheet,” Global Solar. Jul. 2010. [Online]. Available: http://www.globalsolar.com/en/products/cigs-thin-film-material.html. [Accessed 30 August 2010].
[21] Christiana Honsberg and Stuart Bowden, PVCDROM. Aug. 2010. [Online]. Available: http://www.pveducation.org/pvcdrom. [Accessed 29 Au-gust 2010].
[22] Eppley Laboratory, “What is solar radiation?” Discover Solar Energy. Jul. 2008. [Online]. Available: http://www.discoversolarenergy.com/solar/radiation.htm. [Accessed 29 August 2010].
[23] Newport, “Air mass conditions,” Opto IQ. May. 2009.
[Online]. Available: http://www.optoiq.com/index/photonics-technologies-applications/lfw-display/lfw-article-display/361941/articles/laser-focus-world/features/photovoltaics-measuring-the-sun.html. [Accessed 29 August 2009].

126
[24] Renewable Energy, “Band gap diagram with photovoltaic effect,” Durham University. Aug. 2010. [Online]. Available: http://www.dur.ac.uk/images/renewable.energy/pvfig3.gif. [Accessed 29 August 2010].
[25] “Solar cell: structure,” Encyclopedia Britannica. 2005. [Online]. Available: http://www.britannica.com/EBchecked/topic-art/552875/1406/A-commonly-used-solar-cell-structure. [Accessed 29 August 2010].
[26] “Cooper indium gallium selenide,” Wikipedia. Aug.
2010. [Online]. Available: http://en.wikipedia.org/wiki/Copper_indium_gallium_selenide. [ Accessed 17 July 2010].
[27] I. Repins, M. Contreras, B. Egaas, C. Dehart, J. Scharf, C. Perkins, B. To, R. Noufi, "19.9%-efficient ZnO/CdS/CuInGaSe2 solar cell with 81.2% fill factor". Progress in Photovoltaics: Research and applications. 2008. [Online]. Available: doi:10.1002/pip.822. [Ac-cessed 29 August 2010].
[28] U. Malm,”Modelling and degradation characteristics of thin-film CIGS solar cells,” Ph.D. dissertation, Upp-sala Universitet, Uppsala, Sweden, 2008.
[29] Y. Yan, D. Albin, and M. Al-Jassim,“The effects of oxygen on junction properties in CdS/CdTe solar cells,” National Renewable Energy Laboratory. Pre-sented at NCPV Program Review Meeting, Colorado, Octo-ber 2001. [Online]. Available: http://www.nrel.gov/docs/fy02osti/31036.pdf. [Accessed 22 July 2010].
[30] R. Noufi and K. Zweibel, “High-efficiency CdTe and CIGS thin-film solar cells: highlights and chal-lenges,” in 4th World IEEE Conference On Photovoltaic Energy, 2007.
[31] Wikipedia,“Boost converter,” Wikipedia. Aug. 2010.
[Online]. Available: http://en.wikipedia.org/wiki/Boostconverter. [Accessed 8 August 2010].

127
[32] Dorf, Richard, “The engineering handbook.” 2nd Ed. Boca Raton: CRC Press, 2004, pp.175.
[33] Richard A. Cullen, “Frequently asked questions& tech-
nical tips.” Blue Sky Energy Inc. Apr. 2004.[Online]. Available: http://www.blueskyenergyinc.com/uploads/pdf/BSE_What_is_MPPT.pdf. [Accessed Aug. 9, 2010].
[34] M.J. Isaacson, R.P. Hollandsworth, P.J. Giampaoli,
F.A.Linkowsky, A. Salim, and V.L. Teofilo, “Advanced lithium ion battery charger.” IEEE Explore. Aug. 2002. [Online]. Available: http://ieeexplore.ieee.org/stamp/stamp.jsp?tp=&arnumber=574108. [Accessed 9 August 2010].
[35] Cadex Electronics, “Is lithium-ion the ideal battery?” Cadex Electronix Inc. 2005. [Online].Available: http://www.batteryuniversity.com/partone-5.htm. [Ac-cessed 29 August 2010].
[36] A. Moore, “Lithium polymer (lipo) battery guide,” Pro-totalk. Nov. 2008. [Online]. Available: http://prototalk.net/forums/showthread.php?t=22. [Ac-cessed Aug. 29, 2010].
[37] Gilbert Magana ([email protected]), “Re: Com-posite wing,” July 27,2010.
[38] Global Solar Energy,“G2 thin film string datasheet,” Global Solar. July 2008.
[39] Plasticover, “Carpet protection film,” Plasticover. 2010. [Online]. Available: http://www.plasticover.com/protector/carpet-protector.html. [Accessed 6 August 2010].
[40] Wire Glue, “Wire glue,” Wire Glue. 2010. [Online].
Available: http://www.wireglue.us. [Accessed 8 August 2010].
[41] GenaSun, “GV-boost specifications,” GenaSun. 2010. [Online]. Available: http://www.genasun.com/gvb.shtml. [Accessed 7 August 2010].

128
[42] National Instruments, “Introduction to labview and computer-based measurements hands-on seminar,” Na-tional Instruments; Ed. January 2010.
[43] S. Brown (private communication), 2010.
[44] PowerStream. “How to calculate battery run-time,” Pow-
erStream. [Online]. Available: http://www.powerstream.com/battery-capacity-calculations.htm. [Accessed 10 August 2010].
[45] S. Thompson (private communication), 2010. [46] Sherif Michael, “EC2320 space power and radiation ef-
fects solar basics,” 2009. [Class Notes – Unpub-lished].
[47] A. Hayman ([email protected]), “Re: Technical ques-tion about GVB26-4,” September 2, 2010.
[48] “Raven/RQ-11B Aircraft Modification Request,” Naval Air Warfare Center Weapons Division, China Lake, Cali-fornia, VX-31-2010-00027, March 2010.
[49] STMicroelectronics. “Interleaved DC-DC boost converter with built-in MPPT algorithm,” STMicroelectronics. [Online]. Available: http://www.st.com/stonline/products/literature/ds/17588.pdf. [Accessed 9 September 2010].

129
INITIAL DISTRIBUTION LIST
1. Defense Technical Information Center Ft. Belvoir, Virginia
2. Dudley Knox Library Naval Postgraduate School Monterey, California
3. Marine Corps Representative Naval Postgraduate School Monterey, California
4. Director, Training and Education, MCCDC, Code C46 Quantico, Virginia
5. Director, Marine Corps Research Center, MCCDC, Code C40RC Quantico, Virginia
6. Marine Corps Tactical Systems Support Activity (Attn: Operations Officer) Camp Pendleton, California
7. Dr. R. Clark Robertson, Chairman
Department of Electrical and Computer Engineering Naval Postgraduate School Monterey, California
8. Dr. Sherif Michael Department of Electrical and Computer Engineering Naval Postgraduate School Monterey, California
9. Dr. Todd Weatherford
Department of Electrical and Computer Engineering Naval Postgraduate School Monterey, California