Application of Consequence Analysis and Risk Assessment in ERDMP Dr. Asit K Patra Disaster...
53
Application of Consequence Analysis and Risk Assessment in ERDMP Dr. Asit K Patra Disaster Management Institute Bhopal
-
date post
21-Dec-2015 -
Category
Documents
-
view
216 -
download
1
Transcript of Application of Consequence Analysis and Risk Assessment in ERDMP Dr. Asit K Patra Disaster...

Application of Consequence Analysis and Risk Assessment in ERDMP
Dr. Asit K Patra
Disaster Management Institute
Bhopal
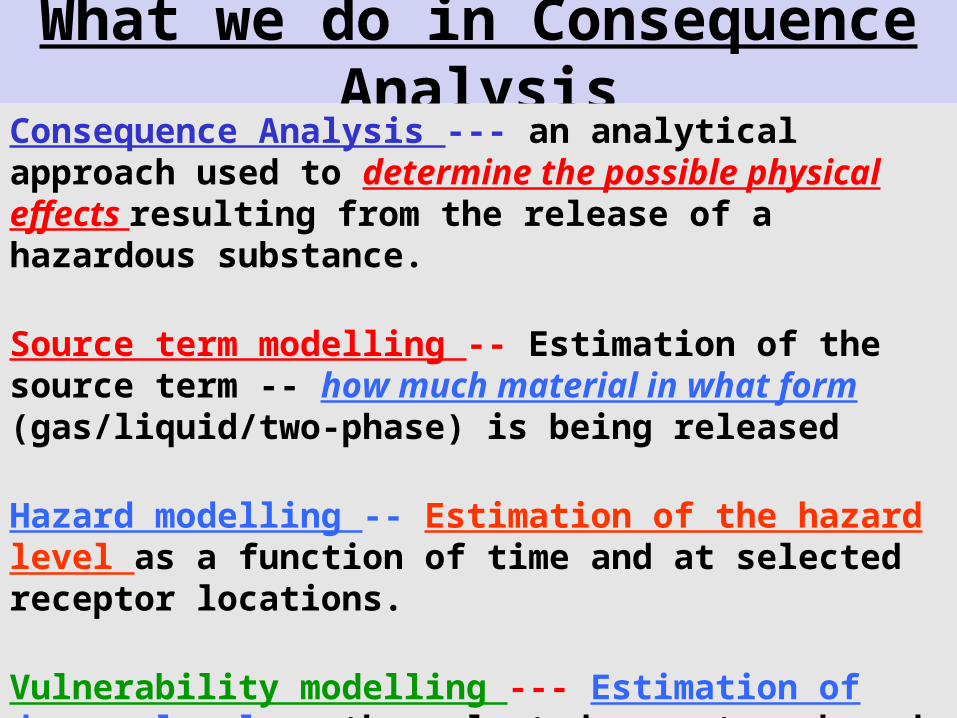
What we do in Consequence AnalysisConsequence Analysis --- an analytical approach used to determine the possible physical effects resulting from the release of a hazardous substance.
Source term modelling -- Estimation of the source term -- how much material in what form (gas/liquid/two-phase) is being released
Hazard modelling -- Estimation of the hazard level as a function of time and at selected receptor locations.
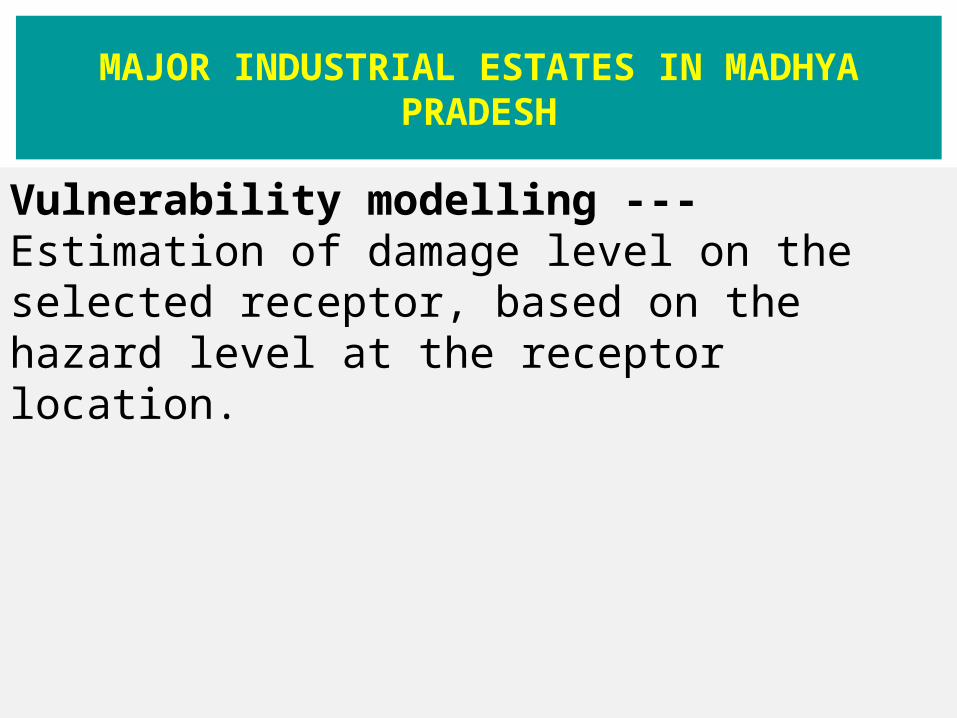
Vulnerability modelling --- Estimation of damage level on the selected receptor, based on the hazard level at the receptor location.

1. Discharge Models : Loss of containment/Release scenarios.
2. Dispersion Models : Transport and dispersion of released flammable/Explosive/toxic chemicals.
3. Consequence/Effect models: Effect on people, property and environment.
What we do in Consequence Analysis *****Contd.

(A) Liquid Discharges
* Hole in atmospheric storage tank or other atmospheric storage vessel or pipe under liquid head.* Hole in vessel or pipe containing pressurized liquid below its normal boiling point.
(B) Gas Discharges * Hole in equipment (pipe, vessel) containing gas under pressure * Relief valve discharge (of vapour only) Contd..
Typical Release Scenarios

* Evaporation from liquid pool (e.g., naptha,
heavy cut etc.) * Relief valve discharge from top of pressurized storage tank * Generation of toxic combustion products as a result of fire
(C) Two-Phase Discharges
* Hole in pressurized storage tank or pipe containing a liquid above its normal boiling point. * Relief valve discharge (e.g., due to a runaway reaction or foaming liquid)

……. …….. ……… …. .. .
+++++++++++++++++++++++++++++++++++++++ ++++++++++++++++
Leak
Aerosol
TBOILING POINT < T AMBIENT
Pool Spread
Boiling Pool
Flash
Example: Super-heated release (Release of Liquid Chlorine)
Tank with liquid

EXAMPLE – RELEASE OF PRESSURISED GAS
Release
Jet fire
No ignitionSafe dispersion
Ignition
Delayedignition
Immediate ignition
Open atmosphere
Congested atmosphere Vapour cloud explosion
Flash fire

EXAMPLE – RELEASE OF A REFRIGERATED LIQUEFIED GAS
Release
Pool fire
No ignitionSafe dispersion
Ignition
Delayedignition
Immediate ignition
Open atmosphere
Congested atmosphere Vapour cloud explosion
Flash fire

EXAMPLE – EVENT TREE FOR RELEASING OF LIQUEFIED GAS UNDER PRESSURE
Release
No ignitionSafe dispersion
Ignition
Delayedignition
Open atmosphere
Congested atmosphereVCE
Flash fire
Immediateignition
No cooling
CoolingJet fire
BLEVE

Atmospheric Dispersion
The process of dilution of a hazardous substance by the surrounding fluid. Initial Acceleration & Dilution Internal Negative Buoyancy
Ambient Turbulence
Source Emission Transition to Ambient Turbulence
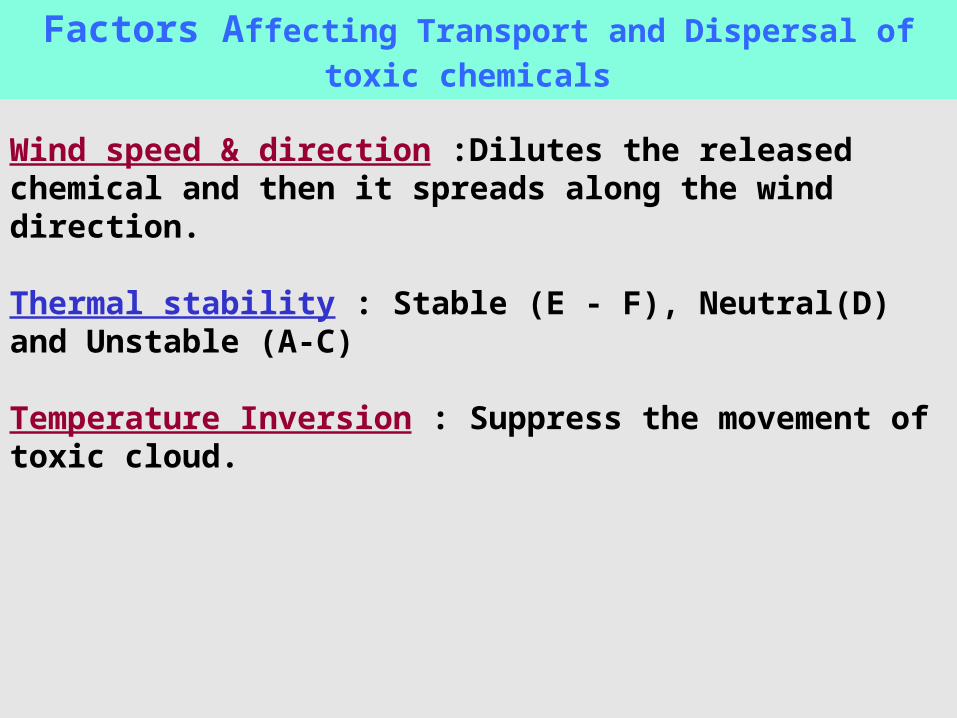
Wind speed & direction :Dilutes the released chemical and then it spreads along the wind direction. Thermal stability : Stable (E - F), Neutral(D) and Unstable (A-C)
Temperature Inversion : Suppress the movement of toxic cloud.
Factors Affecting Transport and Dispersal of toxic chemicals

Procedures : CA
Two types of analysis that make up an Consequence Analysis (CA): (i) Worst Case Release Scenario Analysis (WCRSA) : how far away ------- the worst possible accident release scenario .
(ii) Alternative Case Release Scenario Analysis (ACRSA) : circumstances that are more likely to occur accidentally.

Scenario: Jet Fire Scenario of Natural Gas while being transported through underground pipeline
Pipe Diameter: 20 inches Pipe Length: 10 KmPipe Press: 500 psia Pipe Temperature: 35° CWind: 5 meters/second Ground Roughness: Industrial Air Temperature: 35° C Stability Class: DRelative Humidity: 70% *******************************************************THREAT ZONE: Threat Modeled: Thermal radiation from jet fire 4.5 Kw/m2 (Blue Zone) 168 12.5 Kw/m2 (Orange Zone) 99 37.5 Kw/m2 (Red Zone) 45 meters
Consequence Analysis

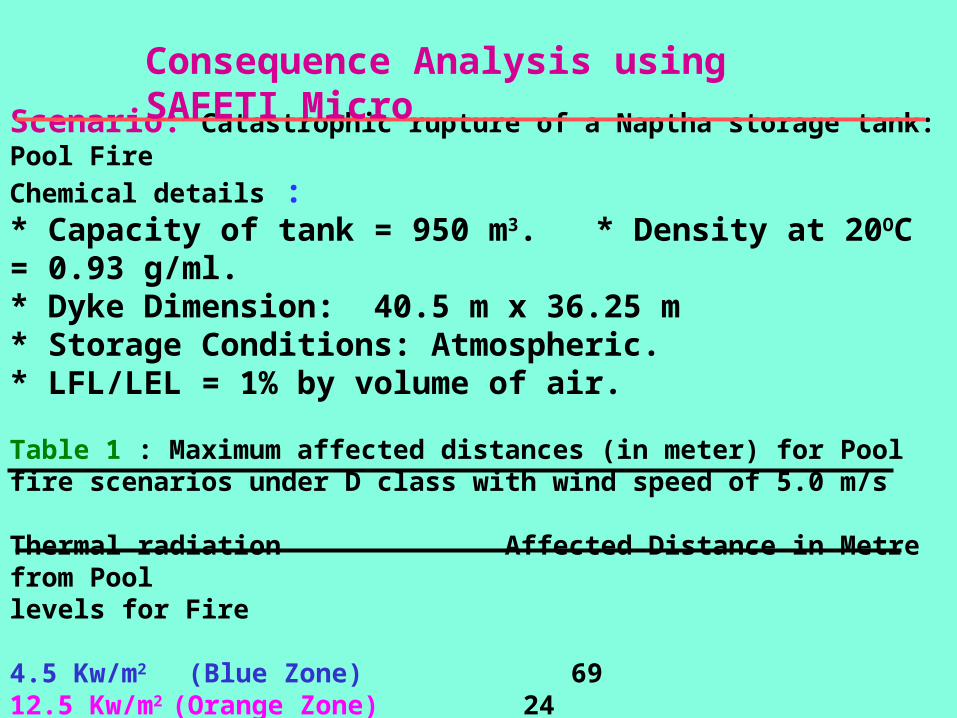
Scenario: Catastrophic rupture of a Naptha storage tank: Pool Fire Chemical details : * Capacity of tank = 950 m3. * Density at 20OC = 0.93 g/ml.* Dyke Dimension: 40.5 m x 36.25 m* Storage Conditions: Atmospheric.* LFL/LEL = 1% by volume of air.
Table 1 : Maximum affected distances (in meter) for Pool fire scenarios under D class with wind speed of 5.0 m/s
Thermal radiation Affected Distance in Metre from Pool levels for Fire 4.5 Kw/m2 (Blue Zone) 69 12.5 Kw/m2 (Orange Zone) 24 37.5 Kw/m2 (Red Zone) Not Reached
Consequence Analysis using SAFETI Micro

RISK ANALYSIS DMI
Definition of Risk : Chance of happening ofan event (say, industrial accident) thatwill have negative/undesirableimpact on human beings, environmentand economic values.
Risk Analysis : Quantitative Estimate of Risk
(i) How often an accident/ event may occur(frequency)
(ii) Magnitude of its probable consequences.

Risk Presentation
A. Individual Risk
Frequency/year that a person will be lethally affected by the consequences of possible accidents say in a chemical plant.
B. Societal Risk
Cumulative frequency that a minimum number of off-site people will be killed simultaneously due to possible accidents

Case Study: Consequence and Risk Analysis of Natural Gas Release scenarios (Transportation
Mode: Underground Pipeline)

Analysis identifies release of NG due to two events
(i) Rupture of pipeline.
(ii) Hole in the pipeline.
Consequences
1. Jet Fire – Most Credible release Scenario
2. Vapour cloud Explosion – Credible Scenarios
3. Flash fire - Credible Scenarios
4. Fireball – Not possible
5. Pool Fire – Not possible
Identification of Hazards

FMEA: Mode, Causes and Consequences.

Cause-Effect Analysis: Causes and Consequences.

Failure Frequency Assessment: Pipeline and Scenarios
European Pipeline Incident Data Group (EPIDG)
The failure rate reported for on-shore gas pipeline with design pressure greater than 15 bar is 4.76 x 10⁻⁴ per km per year.
Criteria: Almost 2 million kilometer year of pipeline operations is used to determine a failure frequency for gas pipeline system. Full bore rupture represents 13% of the cases (6.188 x 10⁻⁵ failure /km/yr.) and 87 % of the cases represent leaks (4.14 x 10⁻⁴ failure /km/yr.).

** Normally Fire ball scenario is not expected. It’s frequency of occurrence is low.
** Jet fire and flash fire are the credible scenarios with sufficient frequencies of occurrences.
** VCE chances are considered as only 10% and remaining 90% cases results in flash fire incidents.
Failure Frequency Assessment: Pipeline and Scenarios

Probability of Ignition
Leak Size Ignition Probability
10 mm – 20 mm (Small Leak) -------- 0.01 – 0.03
~ 50 mm (Medium Leak) --------------- 0.07
Full Bore Rupture ------------------------ 0.3

Event tree for hazardous incident outcomes of NG pipeline

SELECTION OF MAXIMUM CREDIBLE LOSS SCENARIOS
Maximum pipeline length in between two sectionalizing valves = 32 km with 20 inches diameter.
Worst-case Scenario: Full bore rupture
Alternative-case Scenario: Release through Leak sizes of 20 mm (small hole) and 40 mm (medium hole).
Operating Pressure = 37 kgf/cm2
Volume pack in the line = 232736 m3 = 180131 kg.

SELECTION OF MAXIMUM CREDIBLE LOSS SCENARIOS
Other Input Parameters
Average temperature = 30OC
Average relative humidity = 70%
Wind speeds = 1.5 m/s to 5 m/s
Atmospheric Stability = B, D and F
Angles of release for jet fire scenario: 45O and 90O to the pipeline.

CONSEQUENCE ANALYSIS RESULTS:FIRE
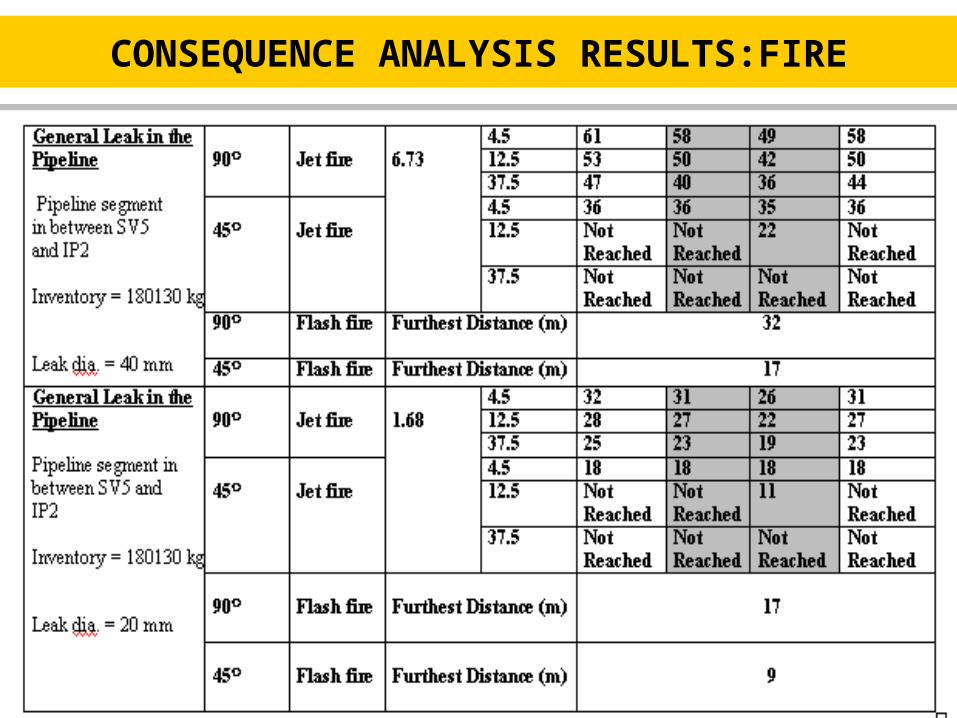
CONSEQUENCE ANALYSIS RESULTS:FIRE

Radiation radii of jet fire for rupture of pipeline when the angle of release is 90 degree with the pipeline.

Overpressure radii of vapour cloud explosion of NG for rupture of pipeline when the angle of release is 90 degree with the pipeline.

Pipeline Risk = Linear Risk
Risk contours for a pipeline = Risk transects = Risk at given transverse distances from the pipeline.
Pipeline Risk

POPULATION DENSITY USED IN RISK CALCULATION

FATALITY RISK TRANSECT OF PIPELINE

Outcome of Consequence & Risk Analysis
(a) Maximum loss scenarios
(b) Consequences in terms of Heat radiation, Over pressure and intoxication.
© Identification of vulnerable zones and classification of units which have the potential for creating an off-site emergency.
(d)Identification of important facilities which are coming into the vulnerable zones.

Concern for man himself and his safety must always form the chief interest of all technical endeavours. Never forget this in the midst of your diagrams and equations.
------ Einstein.
DMI

. Complete Inventory of hazardous processes, chemicals, details of storage (T, P, type of vessel etc.) etc.
. Expert professionals having thorough understanding of the process thermodynamics and atmospheric dispersion.
. Meteorological data and knowledge of stability classes.
. Relevant Software to predict vulnerable zones
DMI Infrastructures required for Consequence/Risk Analysis

Part I: Baseline Information
Consequence Analysis --- an analytical approach used to determine the possible physical effects resulting from the release of a hazardous substance.
The credibility of any given modelling result depends upon the credibility of the release scenario (hazardous event) chosen, the supporting assumptions made in the analysis and the technical merits of the model itself.
A good understanding of the underlying physics of the scenario is essential to the success of model selection.

MAJOR INDUSTRIAL ESTATES IN MADHYA PRADESH
Source term modelling ---- Estimation of the source term -- how much material in what form (gas/liquid/two-phase) is being released from containment as a function of time, and development of the release scenarios or possible hazard outcomes (toxic cloud, fire, explosion, etc.) following the release (i.e, an event tree: event trees are commonly used in quantifying the frequency of these various Outcomes Frequency Analysis),

MAJOR INDUSTRIAL ESTATES IN MADHYA PRADESH
Hazard modelling ---Estimation of the hazard level as a function of time and at selected receptor locations.
Estimation of:
· Thermal radiation flux for fires (for a jet fire, pool fire, or fireball)
· Overpressure for explosions (for a confined explosion, boiling liquid expanding vapour explosion [BLEVE], or vapour cloud explosion (VCE)
* Ambient concentrations for a toxic or flammable gas release (for modelling the effects of a toxic cloud or flash fire),
MAJOR INDUSTRIAL ESTATES IN MADHYA PRADESH
Vulnerability modelling --- Estimation of damage level on the selected receptor, based on the hazard level at the receptor location.

Logic Diagram for Consequence /Risk Analysis
Release of Hazardous Substance
Discharge & Dispersion Models
Explosion & Fire Models
Consequence Models
Risk Calculation
Flammable Release
Toxic Release
Mitigation Factors
DMI

Brief Description of ABCD pipeline
MODE: ABCD receives natural gas from Oil India Ltd. through a 200 km underground pipeline starting from A to D. The pipelines are of level PSL 2 as per API 5L.
OPERATING CONDITIONS: The maximum operating pressure and temperature at the pipeline is 45 kgf/cm2 and 60OC respectively with the design pressure of 92 kgf/cm2.
PIPELINE ROUTE DESCRIPTION WITH FACILITIES:
(i) ABCD starts at the A dispatch station located near Oil India Ltd. well No. 50 .

Brief Description of ABCD
(ii) From dispatch section, the ABCD goes to 22 km with 20” pipeline. One sectionalizing valve station (SV1) is installed in this section. The river R1 with a width of 517 m is situated at a distance of 9.0 km from dispatch section.
(iii) From SV1, ABCD goes on to a distance of 31 km with 20” pipeline. One sectionalizing valve station (SV2) is installed.
(iv) From SV2, the pipeline system goes on to a distance of 23 km with 20” pipeline. One sectionalizing valve station (SV3) is installed. There are two rivers – river R2 with width of 90 m and R3 with width of 120 m - located at the distances of 6 km and 12 km respectively from SV2.
Brief Description of ABCD
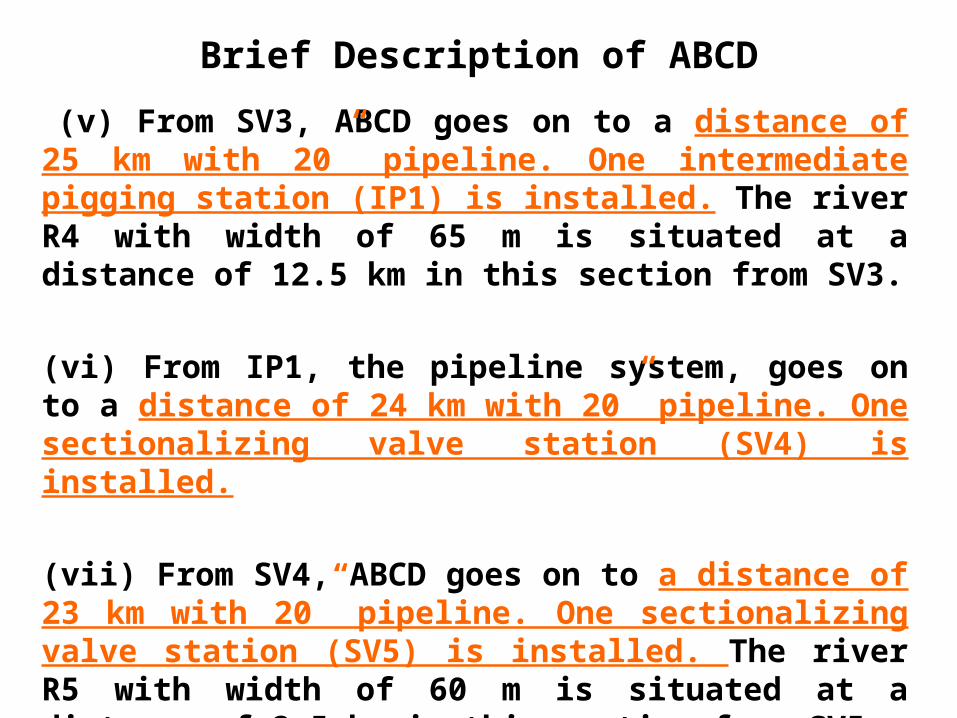
(v) From SV3, ABCD goes on to a distance of 25 km with 20” pipeline. One intermediate pigging station (IP1) is installed. The river R4 with width of 65 m is situated at a distance of 12.5 km in this section from SV3.
(vi) From IP1, the pipeline system, goes on to a distance of 24 km with 20” pipeline. One sectionalizing valve station (SV4) is installed.
(vii) From SV4, ABCD goes on to a distance of 23 km with 20” pipeline. One sectionalizing valve station (SV5) is installed. The river R5 with width of 60 m is situated at a distance of 2.5 km in this section from SV5.

Brief Description of ABCD
(viii) From SV5, ABCD goes on to a distance of 32 km with 20” pipeline. One intermediate pigging station (IP2) is installed. This is the longest stretch in between two sectionalizing valves.
(ix) From IP2, the pipeline system, goes on to a distance of 14 km with 16” pipeline. The receiving station at D is installed in this section. The river R6 with width of 160 m is situated at a distance of 10 km in this section.
(x) The receiving station of D refinery is the end point of ABCD.

Identification of Hazards
(i) Manufacture, Storage and Import of Hazardous Chemicals (MS&IHC) Rules of 1989 as amended in 2000 of Environment (Protection) Act of 1986, Govt. of India.
(ii) Failure Mode and Effect Analysis (FMEA)

Identification of Hazards as per MS&IHC Rules
Hazards of NG: The natural gas to be transported by the pipelines predominantly contains methane (around 92%). Other components of the gas include ethane, propane and butane. As per the MS&IHC Rules 1989 as amended in 2000, methane comes under Flammable gas category. Its Lower Flammability/Explosivity Level (LFL/LEL) is 5% and upper level range (UFL/UEL) is 15% by volume of air. Its flash point is -188OC.
The minimum ignition energy for pure Methane at atmosphere pressure is 0.29 mJ, which is very low when compared to static discharge of 22 mJ (on walking) or ordinary spark plug discharge of 25 mJ. Hence ignition can occur at any time during the gas release.

References
1. Loss Prevention in Chemical Process Industries. Volume 1, 2 & 3. by F. P. Lees, 1996. Butterworth Publications.
2. Guidelines for Chemical Process Quantitative Risk Analysis. 2nd Edition, CCPS, AIChE, 2000.
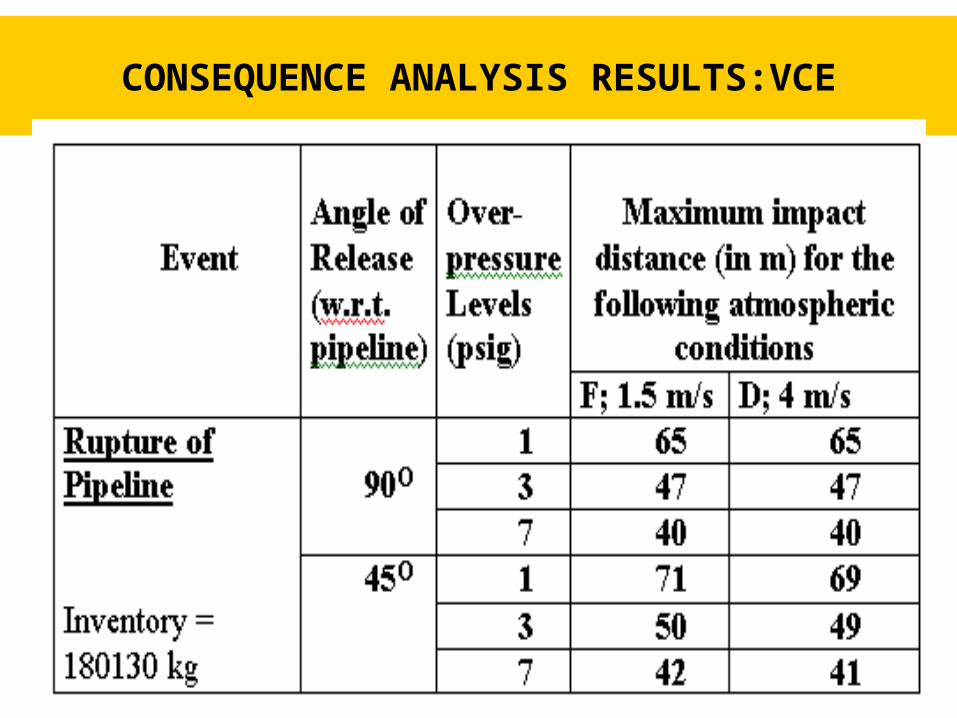
CONSEQUENCE ANALYSIS RESULTS:VCE

CONSEQUENCE ANALYSIS RESULTS:VCE

Pipeline Risk = Linear Risk
Risk follows the entire pipeline length, in contrast to a fixed hazardous facility, where the risk extends only to alimited distance from the facility.
Risk contours for a pipeline are represented as running parallel to the pipeline. Risk levels for linear risks are often presented in the form of risk transects, showing the risk at given transverse distances from the pipeline.
Pipeline Risk