Application of CDF modelling to mill classifier designukerc.rl.ac.uk/pdf/DTICC217_file18809.pdf ·...
118
Application of CDF modelling to mill classifier design Report No. COAL R240 DTI/Pub URN 04/700 March 2004
-
Upload
truongthien -
Category
Documents
-
view
223 -
download
3
Transcript of Application of CDF modelling to mill classifier designukerc.rl.ac.uk/pdf/DTICC217_file18809.pdf ·...

Application of CDF modelling to mill classifier design Report No. COAL R240 DTI/Pub URN 04/700 March 2004
iii
by D J Foster, W R Livingston, J Wells, J Williamson, W H Gibb & D Bailey Mitsui Babcock Energy Limited, Porterfield Road, Renfrew, PA4 8DJ Tel: 0141 885 3873 First published 2004 © Mitsui Babcock copyright 2004
The work described in this report was carried out under contract as part of the DTI Cleaner Coal Research and Development Programme. The programme is managed by Mott MacDonald Ltd. The views and judgements expressed in this report are those of the contractor and do not necessarily reflect those of the DTI or Mott MacDonald Ltd
Report No: 35/03/042 Issue No.: 1
10 June 2003 Page 3 of 118 © Mitsui Babcock 2004
SUMMARY
In order to reduce the carbon in ash (CIA) levels arising from the application of advanced low NOX technologies, it is necessary to improve the quality and consistency of the coal milling process. In many low NOX retrofit applications, mill upgrades, including classifier upgrades, are required to achieve the improved milling performance. Unfortunately, plant space constraints often make it impossible to install classifiers of ideal geometries and the performance of non-ideal geometries is difficult to predict using existing design methods. In addition, low quality coals are increasingly being used, alone or in blends, to reduce plant operating costs. The grinding and classification behaviour of low quality coals and their blends has been found to differ from that of UK and world-traded bituminous coals. Consequently, classifier design rules that have been derived from the extensive experience of milling bituminous coals are less reliable when applied to low quality coals. There is a clear requirement to improve and extend the range of applicability of classifier design methods so that they may be used to design classifiers of non-ideal geometries and for coals outside the conventional range of experience.
This report summarises the findings of the DTI Cleaner Coal Technology R and D Programme Project 217 ‘Application of CFD Modelling to Mill Classifier Design’.
A procedure for modelling classifier performance using the FLUENT CFD code has been developed. The method has been validated against physical model flow field and particle separation behaviour measurements and plant performance data.
A 1/3 scale physical model of a typical E mill classifier design was designed, manufactured and tested to provide detailed flow field and particle separation behaviour data against which the CFD modelling procedures were developed and assessed.
A series of trials was carried out at a UK power station during February 2002 to provide performance data against which the CFD modelling procedures were further developed and validated.
The CFD simulation of the physical model included the selection of the kω turbulence model for use in subsequent modelling activities, based on accuracy of prediction and computational efficiency. Flow field prediction was shown to be largely grid independent, but it is recommended that classifier model meshes feature additional grid refinement around the vanes and vortex finder. The validity of using periodic slice models, to maximise computational efficiency while maintaining accuracy of prediction, was demonstrated.
CFD modelling reproduced the physical model flow field with a reasonable degree of accuracy. Axial and radial velocities compared most favourably, with slightly poorer agreement in the prediction of tangential velocity and kinetic energy. The effects of vane angle and geometry changes on the flow field, pressure drop, particle collection efficiency and product particle size distribution were correctly modelled.
CFD models correctly predicted the measured trend of plant particle collection efficiency and mill product fineness decreasing with increasing air flow rate.
The modelling procedure developed was applied to the investigation of the effects of modifications to classifier geometry on performance. The results dispelled several of the myths surrounding the effects of classifier geometric parameters on performance. They provide guidance regarding those parameters whose variation may be used to improve classifier performance.
The modelling procedure was also successfully applied to the simulation of the primary classification that occurs in the mill body.
Report No: 35/03/042 Issue No.: 1
10 June 2003 Page 4 of 118 © Mitsui Babcock 2004
1. INTRODUCTION
Ever more stringent emissions legislation has led to the installation of advanced low NOX burners and other NO X control technologies on new plant and as retrofits on existing plant. It is universally recognised that the use of low NO X technologies on coal-fired plant tends to increase levels of carbon in ash (CIA) and hence, reduce cycle efficiency. High CIA levels can also lead to ash disposal problems. In order to reduce the CIA levels arising from the application of advanced low NO X technologies, it is necessary to improve the quality and consistency of the coal milling process. In many low NOX retrofit applications, mill upgrades, including classifier upgrades, are required to achieve the improved milling performance. Unfortunately, plant space constraints often make it impossible to install classifiers of ideal geometries and the performance of non-ideal geometries is difficult to predict using existing design methods. In addition, low quality coals are increasingly being used, alone or in blends, to reduce plant operating costs. The grinding and classification behaviour of low quality coals and their blends has been found to differ from that of UK and world-traded bituminous coals. Consequently, classifier design rules that have been derived from the extensive experience of milling bituminous coals are less reliable when applied to low quality coals. There is a clear requirement to improve and extend the range of applicability of classifier design methods so that they may be used to design classifiers of non-ideal geometries and for coals outside the conventional range of experience. Computational Fluid Dynamics (CFD) modelling ought to be the ideal tool for investigating the effects of the various parameters on classifier performance and development of design rules. However, the approaches to modelling particle-laden flows that are available for use in CFD codes are known to suffer several shortcomings. Before CFD modelling can be used in this application, these limitations must be quantified. In order to test the predictive capabilities of the CFD models, it will be necessary to acquire high quality data regarding the structure of the particle-laden flows within classifiers. This can best be achieved through use of physical modelling with Laser Doppler Anemometry (LDA) and Particle Image Velocimetry (PIV). The predictive capabilities of the CFD models, with regard to classifier overall performance, can also be tested against available plant data. The DTI – funded project ‘Application of CFD Modelling to Mill Classifier Design’ was set-up to address these issues. The specific objectives of the project were to improve and extend the range of applicability of mill classifier design methods and model primary classification that occurs in the mill body.
The objectives were achieved through completion of the following tasks:
• Task A: Review existing classifier design methods and plant data (Mitsui Babcock).
• Task B: Manufacture of physical model (University of Edinburgh).
• Task C: Physical model testing (University of Edinburgh).
• Task D: Physical model data analysis and reportage (University of Edinburgh).
• Task E: Develop CFD simulations of the physical model and evaluate the performance of the different modelling approaches, that are available within the FLUENT code, with regard to internal flow patterns, particle collection efficiency and cut size (Mitsui Babcock).

Report No: 35/03/042 Issue No.: 1
10 June 2003 Page 5 of 118 © Mitsui Babcock 2004
• Task F: Undertake plant trials to acquire classifier performance versus coal and air flow rate data and corresponding mill product, grinding zone exit, classifier inlet and classifier oversize return particulate samples (Mitsui Babcock).
• Task G: Test the performance of the CFD models against plant data (Mitsui Babcock).
• Task H: Develop improved design rules based on the results of the CFD modelling work (Mitsui Babcock).
• Task I: Develop CFD simulation of primary classification in mill body (Mitsui Babcock).
This report summarises the results of the project.
2. CLASSIFIER DESIGN
A sketch of a typical classifier is presented in Figure 1. The left hand side of the sketch shows a typical E mill classifier, as installed on the majority of E mills, and the right hand side shows an alternative E mill classifier design.
A schematic diagram showing the air and particle streams in an E mill is presented in Figure 2. Raw coal (1) is fed onto the rotating table via a central chute. The raw coal (1) mixes with returned oversize material (7) and (8) to form a mixed stream (2) that passes between the grinding balls and bottom grinding ring (3). The top grinding ring is loaded to provide the grinding pressure. The coal size is reduced with each passage between the grinding balls and bottom grinding ring (3). The combined effects of centrifugal force and displacement of the coal layer by the balls cause partly ground coal to spill off the outside edge of the bottom grinding ring. The high velocity air stream passing through the throat entrains the partially ground coal (4) and lifts it into the mill body. As the flow area increases above the top grinding ring/spider level, the air velocity decreases and coarse particles (7) fall back to mix with the raw coal (1) on the rotating table while the finer particles (5) are carried to the classifier inlet. This initial separation of particles is termed primary classification. Secondary classification takes place in the classifier, which is located at the top of the mill housing. The air/coal mixture (5) enters the classifier through angled vanes, which impart a swirl to the flow. Coarse particles (8) impact on the wall, are trapped and are returned to mix with the raw coal (1) on the rotating table. The fine particles (6) remain suspended in the air stream and leave the mill through the vortex finder, turret and pf outlet pipes. The pf is conveyed to the burners in a direct firing system or to a bin in an indirect firing system.
3. REVIEW OF E MILL CLASSIFIER PROCESS DATA AND DESIGN RULES
3.1 Analysis of Existing Classifier Designs
The characteristics of existing classifier designs have been analysed in three different ways. The first compared the physical characteristics of classifiers installed in large E mills, the second analysed all available classifier performance data and the third analysed classifier performance data at close to base operating conditions.
3.1.1 Review of Physical Characteristics

Report No: 35/03/042 Issue No.: 1
10 June 2003 Page 6 of 118 © Mitsui Babcock 2004
The physical characteristics of ten designs of classifier installed in large E mills (27 to 75 t h-1 coal throughput) were analysed. Air only velocities and corresponding plug flow residence times in several sections of the classifiers at the base air flow rates were evaluated. Classifier volumes, centrifugal force to drag force ratios and height scaling factors were also evaluated. The presence of trends in each of the various parameters across the range of classifier designs was investigated.
3.1.2 Review of Available Test Data
Classifier performance data from plant trials conducted on seventeen different mill types at fifteen different sites were analysed. Results from approximately 150 individual tests were included.
Mill Product Fineness
Mill product fineness versus percentage base air flow rate data are presented in Figures 3 and 4. In both cases, although there is much scatter, there is a slight trend for fineness to decrease with increasing percentage base air flow rate.
The trends in Figures 3 and 4 show poor correlation coefficients. This is to be expected in graphs plotted from this data set, since the classifier designs for the selected mills are different in terms of geometric details (such as number of inlet vanes, different vane arrangements, degree of penetration of the vortex finder into the cone and the ratios of the various vertical dimensions). Different methods of pf sampling, different coals ground and different throat and body velocities that affect the classifier inlet particle size distribution also contribute to the poor correlation coefficients. Consequently, while no precise conclusions can be drawn from the data, the above-mentioned trends are evident.
The bottom discharge arrangements of the classifiers, although similar in design, could lead to constrained flow from the bottom of the classifiers in some instances. In such cases, the level of classifier oversize return material in the body of the classifier may become undesirably high. Practical experience at several sites has shown that classification efficiency was fairly rapidly lost if the mill operated with a high level of material in the classifier cone. The level of material in the classifier cone is unknown for most of the test results plotted.
Mill Product Fineness Versus Percentage Base Air Flow Rate – Individual Sites
The mill product fineness versus percentage base air flow rate data for the individual sites are presented in Figures 5 and 6. Trend lines have been added for the Site A, Site M and Site B data. The expected trends are for mill product %<75 µm and %<300 µm to decrease with increasing percentage base air flow rate.
The Sites A, M and B %<75 µm results all show the expected trends. The data for most of the other mills also show the expected trends, but those for Site F are too scattered to permit a trend to be seen.
The %<300 µm data are more confused. The Sites M, H, E and G %<300 µm results show the expected trends. However, the Site B %<300 µm increases slightly with increasing percentage base air flow rate and the Site A %<300 µm is almost invariant with changes in percentage base air flow rate.
It must be noted that, in most of the test series, coal flow rate was varied at the same time as the air flow rate was varied.
Report No: 35/03/042 Issue No.: 1
10 June 2003 Page 7 of 118 © Mitsui Babcock 2004
Mill Product Fineness Versus Classifier Plug Flow Residence Time – Individual Sites
The mill product fineness versus classifier actual residence time data for the individual sites are presented in Figures 7 and 8. Trend lines have been added for the Site A, Site M, Site E and Site B data. The expected trends are for mill product %<75 µm and %<300 µm to increase with increasing classifier plug flow residence time. Classifier plug flow residence time is inversely proportional to percentage base air flow rate in the classifier. Again, it must be noted that, in most of the test series, coal flow rate was varied at the same time as air flow rate was varied.
The Sites A, M, E and B %<75 µm results all show the expected trends as do the results for most of the other mills. The Site F results are too scattered to permit a trend to be seen.
The Site F and Site G results were obtained from small residence time classifiers that were designed on the same basis. Both appear to give good fineness at better than 65%<75 µm. There are several larger residence time classifiers that do not perform as well.
The %<300 µm data are more confused. The Sites M, G and E %<300 µm results show the expected trends. However, the Site B %<300 µm decreases slightly with increasing classifier plug flow residence time and the Site A %<300 µm is almost invariant with changes in classifier plug flow residence time. The Site B trend agrees with that for %<300 µm versus percentage base air flow rate.
The Site A classifier has the largest base residence time. The Site A data suggest that increased classifier base residence time results in increased mill product %<300 µm. However, it must be noted that the Site A classifier geometry is significantly different from that of any of the other classifiers and other factors may contribute to its superior coarse end performance. The design was a deliberate attempt to produce a taller design of classifier, more in tune with the proportions of classical cyclone design to produce a better size cut. Increased classifier base residence time appears to have little effect on mill product %<75 µm.
The performance of the Site F classifier appears to compare very well with that of larger residence time classifiers.
The better the coarse end classifier performance, the better the effect on reducing boiler unburnt carbon.
Mill Product Fineness Versus Percentage Mill Capacity – Individual Sites
The mill product fineness versus percentage mill capacity (corrected for Hardgrove Index (HGI)) data for the individual sites is presented in Figures 9 and 10. Trend lines have been added for the Site A, Site M and Site E data. The expected trends are for mill product %<75 µm and %<300 µm to decrease with increasing percentage mill capacity.
The Sites A, M and E %<75 µm results all show the expected trends. The data for most of the other mills also show the expected trends, but those for Site F are too scattered to permit a trend to be seen.

Report No: 35/03/042 Issue No.: 1
10 June 2003 Page 8 of 118 © Mitsui Babcock 2004
The data for most of the mills are relatively closely grouped. However, the Site O %<75 µm results are significantly lower than the main group and the Site C %<75 µm results are significantly higher.
The %<300 µm data are more confused. The Sites M, H, F, E, G and B %<300 µm results show the expected trends. However, the Site D %<300 µm increases slightly with increasing percentage mill capacity whereas the Site A and Site K %<300 µm are almost invariant with changes in percentage mill capacity.
Again, the data for most of the mills are relatively closely grouped. However, the Site O %<300 µm results are generally significantly lower than the main group and the Site A %<300 µm results are greater than those for any of the other mills.
It must be noted that, in most of the test series, air flow rate was varied at the same time as coal flow rate was varied.
3.3 Full Load Data Analysis
Selected full load process data for existing large E mill classifier designs were analysed. A number of different mill designs were considered in the review.
The analysis showed that the large base residence time, low base centrifugal force to drag ratio classifiers perform little better than low base residence time, high base centrifugal force to drag force ratio classifiers.
The Site A mill classifier was a deliberate attempt to produce a taller design of classifier, more in tune with the proportions of classical cyclone design to produce a better size cut. A better size cut was achieved, with no particles greater than 300 µm present in all but one of the 20 tests carried out on the mills. However, the Site A design carries severe economic penalties since it is very tall.
The high centrifugal force to drag force ratio classifiers are small, compact units with good performance at both the coarse and fine ends of the particle size spectrum.
3.4 Review of Existing Classifier Design Rules
The existing Mitsui Babcock classifier design rules that are applicable to static classifiers were reviewed. Based on the review of E mill classifier process data and design rules, the following work was recommended to improve the understanding of the effects of classifier geometry and coal specific gravity on classifier performance and develop new design rules:
1. The effects of classifier inlet vane detail design on classifier performance should be investigated through a combined programme of physical and CFD modelling. The parameters to be investigated should include: vane angle, vane length (including different leading and trailing lengths), vane profile, vane spindle pitch circle diameter (PCD) and number of vanes.
2. The effects of low specific gravity coals on classifier performance should be assessed through CFD modelling.
3. Optimised classifier designs and rules for their specification should be developed.

Report No: 35/03/042 Issue No.: 1
10 June 2003 Page 9 of 118 © Mitsui Babcock 2004
4. PHYSICAL MODEL TESTING
4.1 Experimental Apparatus
4.1.1 Classifier Geometry – Existing Design (Mark 1)
The physical model of the coal mill static classifier was designed to replicate only the aerodynamic features of the classifier, so the grinding table and related components were not included. Figure 11 shows a schematic view of the physical model. The intake of air and particles was separated in order to ensure a uniform air and particle distribution to the inlet of the classifier model. Due to safety considerations, it was decided to run the facility under suction. Furthermore, this eliminated the need for any pipe work underneath the classifier that may have affected the uniformity of the flow distribution. The particles were fed via the particle inlet pipe and then entrained into the air flow, after being evenly spread by the splitter cone. The splitter cone also served to distribute the incoming air flow and as a collection vessel for particles rejected by the classifier. This meant that the model was operated as a “once-through” system, such that no particles were recycled, as in the full-scale plant, in order to control the inlet particle size distribution.
The dimensions of the physical model were geometrically scaled from the dimensions of a typical E mill. The size of the model was limited by the focal length of the Laser Doppler Anemometry (LDA) lenses, restricting the distance between the outside of the particle inlet pipe and the outside of the model to less than 500mm. This resulted in a 1:3.37 scale model of the full size E mill classifier. The classifier vanes consist of sixteen tapered panels pivoted at the top and bottom. The vane angle, relative to the radial line through the centre of the classifier model, could be varied between 0º and 60º. The model was constructed of Perspex and polycarbonate sheeting as much as possible, to allow full optical access to the outer body and main classifier cone. The model was assembled using flanged sections to allow components to be interchanged easily and for rapid disassembly for cleaning the model during experiments.
The critical operating condition of the coal mill classifier was evaluated to be the bulk air velocity at the inlet to the classifier vanes. Hence, constant velocity scaling was applied to the reduced scale physical model to achieve this condition. Constant residence time scaling in the classifier volume was deemed inappropriate, as it required either very low velocities or extreme distortions in the model geometry.
4.1.2 Classifier Geometry – Alternative Design (Mark 2)
An alternative classifier design, incorporating a number of geometric parameter changes was also modelled. The changes focused on altering the inlet conditions by changing the vane design, increasing the residence time in the classifier cone by making it longer, and altering the length of the vortex finder slightly. The design changes were incorporated into the existing physical model assembly used for the Mk 1 tests (Figure 12). The Mk 2 assembly is shown in Figure 13. The number of vanes increased from 16 to 24 and their design was simplified. The length of the vortex finder was increased slightly, and the length of the classifier cone was altered (by increasing the length of the classifier cylindrical section). The turret section, splitter/reject collector cone, frame and air inlet section were not altered. This required the addition of a spacer flange at the base of the physical model to account for the new location of the lower cone brackets.
The design operating conditions for the Mk 1 model and Mk 2 model were identical.

Report No: 35/03/042 Issue No.: 1
10 June 2003 Page 10 of 118 © Mitsui Babcock 2004
4.1.3 Other Experimental Apparatus
Other experimental apparatus, including a fan, cyclone, auger and hoppers, were required to operate the physical model in all experimental conditions. These components were connected to the model and incorporated into the available laboratory space as shown in Figure 14.
4.2 Flow Visualisation
Flow visualisation experiments were undertaken to investigate the instantaneous and spatial dynamics of the classifier model. In order to facilitate the use of standard video equipment these experiments were conducted at a reduced air flow rate. Preliminary experiments indicated that the overall flow dynamics in the Mk 1 model appeared similar at the design conditions and at the reduced flow rate. Furthermore, previous experiments on cyclones have demonstrated that the aerodynamic features in a cyclone also remain the same at reduced velocities.
A schematic diagram of the apparatus used for the flow visualisation experiments is shown in Figure 15. The output beam from a 15W Spectra-Physics 171 Argon-ion laser was transformed into a parallel scanning beam by using a high-speed rotating mirror and parabolic mirror. The scan time of the beam across the 0.5m length of the sheet was 0.5ms. Three laser-sheet orientations were used: two in a vertical plane, through the axis of the main conical component of the classifier, and through the vanes, vortex finder and turret, and in a horizontal plane through the main conical section of the classifier, just below the vortex finder. Seeding was provided by manually pulsing a ROSCO 1700 fog generator, located adjacent to the inlet of the classifier model, so that the fog was entrained into the model by the incoming air. The fog particles have a mean diameter estimated to be 1µm, and a density relative to air of 800. Hence, the particles are sufficiently small to follow the flow with negligible time lag. The scattered laser light was captured by a Sony colour digital video camera positioned at right angles to the laser sheet, except for the horizontal laser sheet, which was slightly off axis. The camera was operated with an aperture of f/1.6 for all tests and a shutter speed of 1/150s. As the imaged region was large and the spatial and temporal resolution of the camera relatively poor, fine-scale structures could not be adequately captured. However the experimental equipment was sufficient to reveal the effect of vane angle upon the bulk characteristics of the flow within the classifier model, which was the main aim of this set of experiments.
The standard experimental procedure was to ramp the fan up to a constant speed and let it settle for approximately thirty seconds. Image capture then began for between two and three minutes, while fog, in manually controlled pulses, was allowed to enter the classifier. The fan was then turned off, and image capture and fog pulses maintained until the velocities dropped to extremely low levels.
4.3 Laser Doppler Anemometry (LDA)
A three-component Dantec LDA system was used to obtain three-dimensional velocity measurements. This system consists of one head housing pairs of frequency shifted green and blue beams and the other housing a pair of violet beams, which have been split from their source at a 5 Watt Coherent Innova 90C Argon-ion laser. A fibre-optic system was used for delivery and collection, in back-scatter mode, with a beam spacing of 75mm and a focal length of 500mm. The probe volume has a length of 1.7mm and a nominal waist diameter of 126µm for the green beam, 1.9mm by 141µm for the blue beam, and 1.8mm by 133µm for the violet beam. Flow seeding was provided by using the ROSCO 1700 fog machine to manually pulse fog into the
Report No: 35/03/042 Issue No.: 1
10 June 2003 Page 11 of 118 © Mitsui Babcock 2004
classifier model. Time-averaged measurements were performed in burst-and-coincidence mode to provide simultaneous three-component velocity measurements. The Burst Spectrum Analyser automatically processes the recorded signal burst information and converts it to velocity data for recording on a personal computer. Most of the measurements were obtained with the LDA heads positioned horizontally, normal to the model. Additional measurements with the heads inclined upwards or rotated around a vertical axis were also required to allow optical access to the more difficult to reach measurement locations or to improve the number of data points recorded at a specific location. Transformation matrices were calculated for each orientation so that the raw LDA signal could be converted into the required components of velocity.
The pair of LDA heads were mounted on a Dantec 3-axis traverse that has a positional accuracy of 0.05mm in three orthogonal directions. Measurements were conducted along radial profiles at nine selected vertical (axial) locations throughout the model. The axis orientation used for the present radial (U), tangential (V) and axial (W) velocity measurements is shown on the flow visualisation schematic, Figure 14. The traverse was programmed to execute the measurements at each axial position automatically. The fan was then turned off, the data processed and stored on the PC and the LDA then moved to the next axial location. The locations of the measurement profiles in the Mk 1 and Mk 2 models are shown in Figures 16 and 17 respectively.
All the experiments were undertaken with the fan and its control damper at the same condition. The flow rate through the Mk 1 model was initially calibrated by measuring velocity profiles through the outlet pipes at the top of the turret section of the model. The damper on the fan outlet was gradually adjusted to give an estimated flow rate close to the design flow rate. Detailed LDA measurements just prior to the vane inlet of the physical model were then used to check the exact flow rate through the model in both the Mk 1 and 2 models.
4.4 Particle Selection and Testing
The particles used in the test programme were selected after carrying out a literature search and contacting suitable manufacturers. Coal was not considered, primarily for safety reasons, but also because of its “dirtiness” in a laboratory environment and its variation in properties. Particles conveyed in plastics are particularly prone to build-up of electro-static charge, with a consequent explosion risk if they are combustible. The final choice was of “SG Fillite” particles, supplied by Trelleborg Fillite, of Runcorn, Cheshire. Fillite particles are lightweight, hollow, spherical, low density, free-flowing, alumino-silicate cenospheres or microspheres extracted from pulverised fuel ash. The particles were selected because their particle size distribution was the most similar of any available particle type to that of coal at the inlet to a full-scale mill classifier. However, the density of the particles, ρ=794kgm-3, is much smaller than that of coal (approximately ρ=1,500 kgm-3). The particles were stored in a large hopper adjacent to the rig and transported to the particle inlet tube of the model by the auger.
The particle flow rate and the limited volume of the reject collector dictated the run time of the auger supplying particles to the classifier model. The run time of the auger was measured using a stop-watch and reviewing the flow visualisation sequences captured with the video camera. Once the auger was turned off, the fan was left running at constant speed for approximately one minute, then also turned off. Mass balances were calculated by weighing the particles collected in the classifier reject collector and in the downstream cyclone. The total mass was cross-checked with the

Report No: 35/03/042 Issue No.: 1
10 June 2003 Page 12 of 118 © Mitsui Babcock 2004
mass flow rate and time of operation of the auger. Samples were also taken for particle size analysis. As some particles remained in the system, the fan was subsequently turned on for a further minute and again separate samples from the reject collector and cyclone were acquired. Particle size distributions were measured for the rejected particles and those captured by the cyclone.
Flow visualisation movies were recorded to give an indication of the particle movements inside the model. LDA and PIV were not possible due to the short model run times, limited visibility and scratching of the Perspex surfaces by the particles. Flow visualisation was accomplished by using the same laser sheet apparatus as used in the air-flow visualisation experiments described in Section 4.2. The laser sheet was orientated vertically through the axis of the main conical component of the classifier and operated at maximum intensity and a scan time of 0.5ms. A Sony colour video camera was used to capture the particle dynamics illuminated by the scattering of laser light from the particles. The camera was positioned at right angles to the laser sheet and manually focussed on the laser sheet with an aperture of f/1.6 for all tests and a shutter speed of 1/150s.
4.5 Particle Size Distribution Measurement
A new technique using a colour video camera set on a microscope and image analysis software was used to measure the particle size distribution of the inlet particles and cyclone and rejects samples obtained from the classifier models.
The measured particle size distribution of the input SG Fillite particles, compared with the quoted size distribution from Fillite and dry sieve and laser diffraction measurement techniques performed by Mitsui Babcock are shown in Figure 18. The image analysis technique shows good agreement with the Fillite particle size distribution for diameters less than 150µm and reports higher values for diameters greater than 150µm.
4.6 Experimental Results – Existing Design (Mark 1)
4.6.1 Flow Visualisation
The flow visualisation experiments on the Mk 1 classifier model were conducted at vane angles ranging from 0º to 60º. This is a much broader range than would be used in plant, but enabled the full range of possible classifier aerodynamics to be observed and the conditions of most interest for detailed investigation by LDA to be selected.
The flow visualisation experiments demonstrated that there is a wide spectrum of flow characteristics within the range of vane settings investigated. Within this spectrum there are three main flow regimes defined by their dominant characteristics, Table 1. At low vane angles (0º to 15º), the flow is predominantly axisymmetric and very little of interest appears to occur in the main cone volume, apart from some occasional recirculation. At moderate vane angles (30º to 50º), corresponding to the typical classifier operating conditions in industrial applications, a central core dominated flow regime exists, characterised by a central core of upward moving flow around the particle inlet tube. In both these flow regimes a high proportion of flow can be seen short-circuiting the classifier volume, passing directly from the inlet vanes to the vortex finder and out through the turret section. As the vane angle increases the proportion of flow short-circuiting the main cone volume decreases. Similarly the residence time in the cone appeared to increase with vane angle. At high vane angles (55º to 60º) the flow can be best described as a swirl dominated flow regime.
Report No: 35/03/042 Issue No.: 1
10 June 2003 Page 13 of 118 © Mitsui Babcock 2004
In this case the proportion of flow short-circuiting the classifier is very small and the residence time much higher than for any of the other flow regimes. The presence of a Precessing Vortex Core (PVC) was also suggested by the characteristic movement of the central core at these high vane angles. Between the three main flow regimes the flow characteristics are transitory and share features with the nearby regimes.
The flow visualisation experiments demonstrated that it would be extremely difficult, if not impossible to obtain high quality Particle Image Velocimetry (PIV) data from the physical model. Hence it was decided to focus on obtaining high quality LDA data for the validation of the computational model.
4.6.2 Velocity Measurements
Following the results of the flow visualisation experiments, comprehensive velocity measurements using LDA were conducted on the classifier model within the range of vane angles from 30º to 50º in 5º steps. This corresponds to the range of typical operating conditions in industrial applications. Additional measurements were also undertaken at a vane angle of 40º to validate the axisymmetry of the air flow in the model. Measurements were conducted along radial profiles at nine selected vertical (axial) heights. In the following section the vertical position of the measurement profiles, z, is referenced to the top of the lower support flange, see Figure 16.
The air flow rate through the model was initially calibrated by taking measurements through the outlet pipes. However, detailed measurements along a radial traverse at the height of the flange in which the vanes pivot demonstrated that, although the flow rate was approximately constant for all the measurements, it was slightly lower than the design condition (by ~6%).
The pressure drop across the entire physical model, as well as the flexible ducting connecting it to the fan, was measured. Figure 19 demonstrates a consistent trend between pressure drop and vane angle for the three LDA tests. The trend indicates that the maximum pressure drop is at a vane angle of 30º and decreases with increasing vane angle to approximately 45º. Increasing the vane angle beyond 45º appears to cause the pressure drop to start to increase again. There is no obvious explanation for the discrepancy between the pressure measurements of each test. However, the difference between the tests is consistent, and the same trend is apparent in each case.
4.6.2.1 Mean Velocity Vectors
The LDA measurements were used to calculate the mean and fluctuating components of velocity in the radial, axial and tangential directions. The mean velocity measurements were then used to calculate the velocity vectors at every measurement location, for each vane angle. A typical example of these vectors is shown in both three-dimensional form and two-dimensional cross-section in Figure 20. The velocity vector images suggest that there are broadly three main regions inside the classifier model characterised by their own aerodynamic features. The first region, in which the tangential velocity component is very small, is in the outer body of the model, and is dominated by a large recirculating vortex. The second region is in the top part of the classifier cone in the vicinity of the vortex finder. While there is some tangential component to the velocity in this region, it is dominated by the large amount of flow that passes straight through from the vanes to the vortex finder, “short-circuiting” the classifier, with a very high axial component of velocity. The third region is in the bottom section of the classifier cone, and is characterised by very

Report No: 35/03/042 Issue No.: 1
10 June 2003 Page 14 of 118 © Mitsui Babcock 2004
small radial and axial components of velocity and almost constant tangential velocity component.
4.6.2.2 Effect of Vane Angle on Velocity and Kinetic Energy Profiles
The effect of vane angle on the aerodynamic characteristics inside the classifier model can be quantified by inspecting the radial profiles of the mean tangential (V), axial (W) and radial (U) components of velocity as well as the turbulent kinetic energy at different axial locations through the classifier model. Typical comparisons are shown in Figures 21 to 24.
The mean velocity vector results discussed previously indicated that there are two distinct regions of flow within the classifier cone. A review of the literature reveals that the velocity profiles obtained at level E and below strongly resemble those detected in previous cyclone measurements. Cyclones and vertical spindle coal mill classifiers are comparable industrial devices as their primary function is to separate particulate matter in a flow by inducing a strongly swirling flow.
The results demonstrate that the radial velocity component within the classifier cone and below level E is very small, consistent with the conclusions of previous research into cyclones. The axial velocity profiles within this region are similar to those measured in cyclones in that they are slightly negative at higher radii, and increase to positive velocities very close to the inner tube. The tangential velocity profiles are also similar to the expected flow within a cyclone in that they increase rapidly from near the inner tube to a maximum velocity then gradually decrease with increasing radii.
4.6.2.3 Tests for Axisymmetry
A series of tests was conducted to check for any bias in the inlet flow, between the classifier and outer cylinder, and within the classifier volume. The results indicate some small differences in the inlet/outer flow towards the bottom of the model, which rapidly become insignificant as the flow approaches the vane inlet. This appears to be due to the location of the fog machine. The results confirm that within the classifier itself the flow is axisymmetric.
4.6.3 Particle Laden Experiments
4.6.3.1 Flow Visualisation
Detailed experiments were performed to assess the effects of vane angle and particle loading on the reject ratio and classification efficiency.
The flow visualisation technique was useful, but was hampered by the particles scratching the Perspex and by the fact that the incoming particles tended to obscure the patterns in the core of the classifier model. However, it was still possible to observe that, in general, the particle trajectories in the classifier cone appeared similar to the flow visualisation results with air only. The principal similarities between the experiments were that some of the particles appeared to short-circuit the classifier and pass straight to the vortex finder; there was a “swirl-dominated” region between the vortex finder and the classifier cone, just under the transition from the cylindrical section to the conical shape, where most of the particles could be seen; and a core near the particle inlet pipe. The particles remained in the swirl dominated region for long residence times – some particles could still be observed in this region minutes after the auger had been turned off and only the fan remained on.

Report No: 35/03/042 Issue No.: 1
10 June 2003 Page 15 of 118 © Mitsui Babcock 2004
The most noticeable feature was the formation of ‘ropes’ around the inside surface of the classifier cone. These ropes consisted of bands of particles, concentrated in two regions – just below the cylindrical-cone transition and just above the reject collector and appeared to be heavily flow rate dependent. The bands formed very rapidly and increased in extent with increasing particle flow rate, but also disappeared very quickly once the particle supply was stopped.
4.6.3.2 Mass Balances
In the detailed experiments, the reject ratio was calculated by dividing the mass of particles captured in the reject collector by the amount captured in the cyclone. The results obtained indicate that the reject ratio is very sensitive to the vane angle and increases dramatically with an increase in the vane angle. Furthermore, the reject ratios determined in the original and repeated experiments are consistent and indicate a slight decrease in the reject ratio with an increase in the actual particle loading and reject ratio at each vane angle. The decrease in reject ratio with increased particle loading is not as pronounced above 50% of the design flow rate, so that the reject ratio at 30º vane angle converges towards a value of 1.3, 4.3 at 40º vane angle, and 6.0 at 45º vane angle.
4.6.3.3 Particle Size Analysis
The Particle Size Distribution (PSD) of the reject and cyclone samples was measured for all the Mk 1 classifier test conditions, and Figure 25 shows typical data for a vane angle of 40º. Cyclone samples are on the left side of the input distribution (thick line) while reject samples are on the right side, indicating that the larger particles are found in the rejects and smaller particles are found in the cyclone, as expected.
The effect of particle loading was investigated at vane angles of 30º, 40º and 45º. Although there is some variation between the PSD of reject and cyclone samples, there was no consistent trend at the three different vane angles. It was concluded that particle loading was not a significant factor in the performance of the classifier.
The effect of vane angle was studied at three nominal particle loadings. The results demonstrate a clear and consistent effect of the vane angle at each loading. A vane angle of 30º produces significantly different results, with the coarsest distribution of particles collected in the cyclone and rejected in the classifier. While the particle size distributions for 40º and 45º vane angles are reasonably similar, it appears that a vane angle of 40º produces the finest PSD collected in the cyclone and classifier reject.
4.7 Experimental Results – Alternative Design (Mark 2)
4.7.1 Flow Visualisation
The flow visualisation experiments on the Mk 2 classifier model were conducted over a limited range of vane angles (30º, 40º and 45º). Furthermore, only two laser sheet orientations, vertically and horizontally through the classifier cone, were considered, as these were the most useful in revealing the aerodynamics of the classifier. The visualisation experiments were conducted at a reduced flow rate using a similar procedure to the Mk 1 experiments.
There was no significant difference between the aerodynamic characteristics observed in the Mk 2 and Mk 1 classifier models. In particular, at the vane angles investigated in the Mk 2 design, the flow features are very similar to those of the
Report No: 35/03/042 Issue No.: 1
10 June 2003 Page 16 of 118 © Mitsui Babcock 2004
“central core” dominated regime described previously. In this regime, the flow is characterised by a central core of upward moving flow around the particle inlet tube and a high proportion of flow short-circuiting the classifier volume, passing directly from the inlet vanes to the vortex finder and out through the turret section. The most noticeable difference between the Mk 1 and Mk 2 classifier designs was the formation of an unstable recirculation zone near the join between the cylindrical and conical sections of the classifier in the Mk 2 model. Recirculation was detected in the Mk 1 model, but much closer to the top of the classifier volume, near the bottom of the vanes. Furthermore, the strength of this recirculation appears to increase with an increase in the vane angle. The only other effect of the vane angle appears to be to cause an increase in the speed of rotation of flow structures in the classifier.
4.7.2 Velocity Measurements
Following the results of the flow visualisation experiments, velocity measurements using LDA were conducted on the Mk 2 classifier model at vane angles of 30º, 40º and 45º. The most detailed measurements were undertaken at 40º, with velocity profiles measured at ten vertical locations in the classifier and the outer section. Ten profiles were also measured at 45º, although most of these were just within the classifier. Only four profiles at 30º were measured within the classifier cone.
The effect of vane angle on the pressure drop in the Mk 2 classifier model is shown in Figure 26. The results indicate that the pressure drop across the model is less than the average of the pressure drop measurements of the Mk 1 model, although this also included the ductwork from the model to the fan. Measurements were only made of the pressure drop at the same location (in the outlet pipes) in the two designs at a vane angle of 40º. These measurements indicated the pressure drop in the Mk 1 model was 199 mmH2O, compared with 183 mmH2O for the Mk 2 model. Hence, there is a relative saving in terms of pressure drop in the Mk 2 classifier model design. The trend between the pressure drop and vane angle is reasonably similar in both cases: the maximum pressure drop is at 30º, the minimum pressure drop is approximately at 40º and the pressure drop appears to increase with a further increase in vane angle.
4.7.2.1 Mean Velocity Vectors
The LDA measurements were used to calculate the mean and fluctuating components of velocity in the radial, axial and tangential directions. The mean velocity measurements were then used to calculate the velocity vectors at every measurement location, at vane angles of 40º and 45º. The vectors are consistent with the flow visualisation observations and confirm that the aerodynamic features of the Mk 1 and Mk 2 classifier designs are similar. The highly three-dimensional flow between the vane inlet and the vortex finder is observed in both models, although this region is slightly larger in the Mk 2 design due to the slightly longer vortex finder and the bigger cylindrical section of the classifier. Within the classifier cone itself, the flow has very small radial and axial components of velocity and almost constant tangential velocity component. The most noticeable difference is the formation of a pronounced recirculating region near the join of the cylindrical and conical elements of the classifier. The flow in the outer section, before it reaches the inlet vanes, is broadly similar in both Mk 1 and Mk 2 classifier models.
4.7.2.2 Effect of Vane Angle on Velocity and Kinetic Energy Profiles
The effects of the vane angle on the aerodynamic characteristics inside the Mk 2 classifier model are quantified using the radial profiles of the mean tangential (V),
Report No: 35/03/042 Issue No.: 1
10 June 2003 Page 17 of 118 © Mitsui Babcock 2004
axial (W) and radial (U) components of velocity and the turbulent kinetic energy at each axial measurement location. Profiles similar to those in the Mk 1 classifier model were measured.
The effect of vane angle on the aerodynamics in the Mk 2 classifier model appears very similar to the results discussed in relation to the Mk 1 classifier model. In particular, the main effect of increasing the vane angle is to alter only the tangential velocity profile. While the shape of the tangential velocity profile does not change with vane angle, the magnitude of the tangential velocity profile is approximately proportional to the vane angle, again consistent with the Mk 1 classifier results. The mean radial velocity is very close to zero at measurement profile E and below and does not change significantly with vane angle. The mean axial velocity is not significantly affected by the vane angle, except at the closest measurement point to the inner pipe. The turbulent kinetic energy increases with increasing vane angle in the lower section of the classifier cone, while in the top of the classifier it is difficult to detect a clear trend.
Despite the increased length of the cylindrical section of the classifier cone profile and the slight increase in the length of the vortex finder, it still appears that the cut-off point between the three-dimensional flow region and the cyclone-like flow region in the classifier is between levels E and F. This suggests that the vortex finder controls the separation between these distinct flow regions.
4.7.2.3 Comparison of Mk 1 and Mk 2 Velocity Profiles
The measured velocity component profiles at three vertical locations in the Mk 1 and Mk 2 classifier models were compared at a vane angle of 40º. Comparisons were made at levels C and E, which are within the conical section of the classifier in both designs. A further comparison was made at the measurement location through the vortex finder at level I in the Mk 1 model and level H in the Mk 2 model (Figures 27 and 28). The results confirm the deductions made in the previous sections: that the changes in inlet vane design, cylinder length and vortex finder length have had a minimal effect upon the aerodynamics within the classifier. The only noticeable difference is that the tangential velocity component is slightly higher in magnitude in the Mk 2 model, although the shape of the velocity profile is very similar in both cases. This can be attributed to the slightly increased volumetric flow rate of air in the Mk 2 model experiments. Hence, the conclusions made from the analysis of the effect of the vane angle on the velocities and swirl number for the Mk 1 model can be extended to the Mk 2 classifier design.
4.7.3 Particle Laden Experiments
4.7.3.1 Flow Visualisation
A total of eleven tests were carried out with particle laden flow in the Mk 2 classifier model. As in the Mk 1 tests, the high particle concentration in the classifier when particles were being fed to the model by the auger reduced the visibility and insight of the flow visualisation experiments significantly. Within the classifier, it was possible to briefly observe that the particles appeared to follow similar trajectories to those observed in the flow visualisation experiments, particularly around the vortex finder. The formation of ropes on the inside surface of the classifier cone was observed in the Mk 2 classifier model. These ropes were located in similar positions to those seen in the Mk 1 experiments, with respect to the cone: just below the cylindrical section and cone join and just above where the cone joined to the reject collector. However, something that was not noted in the Mk 1 experiments was that the size of
Report No: 35/03/042 Issue No.: 1
10 June 2003 Page 18 of 118 © Mitsui Babcock 2004
the ropes appeared to vary with the vane angle. At a vane angle of 30º, the ropes were more of a band when particles were being fed to the classifier, and rapidly disappeared once the auger was turned off, but the fan remained on. At a vane angle of 40º, the ropes were distinct and remained present after the auger was turned off. At a vane angle of 45º the ropes were large and remained so even after the auger was turned off. In all cases particles, remained suspended throughout most of the classifier, particularly in the recirculation region close to the join of the cylindrical and conical sections.
4.7.3.2 Mass Balances
Although the air only experiments indicated that the aerodynamics within the Mk 1 and Mk 2 classifier models were very similar, the particle laden experiments demonstrated significant differences in the performance of the two designs. Figure 29 shows the effect of particle loading on the reject ratio at the three different vane angles. This figure demonstrates that, while in the Mk 1 design the reject ratio was also sensitive to the particle loading, in the Mk 2 design the change in the reject ratio with increasing particle loading is much more pronounced. Furthermore, the reject ratio is significantly higher in the Mk 2 model compared with the Mk 1 model at every vane angle and particle loading. For both designs, the reject ratio decreases with increased loading. For the Mk 2 design at high vane angles, and at lower loadings, this is particularly pronounced, and the reject ratios at 20% loading are very high.
4.7.3.3 Particle Size Analysis
The particle size distributions (PSDs) of the reject and cyclone samples were measured at all test conditions. Figure 30 presents typical results at a vane angle of 40º.
The effect of particle loading on the PSDs of the reject and cyclone samples in the Mk 2 classifier model was determined at three different vane angles of 30º, 40º and 45º. The results are consistent with those for the Mk 1 classifier model and indicate that, whilst the particle loading may have an effect upon the PSD of the reject and cyclone samples, there is no consistent trend.
The effect of vane angle at constant particle loading on the PSDs of the reject and cyclone samples in the Mk 2 classifier model was also measured. The results demonstrate a clear trend in the case of the cyclone samples, which is that increasing the vane angle increases the amount of fine particles passing through the classifier model. A similar trend is observed in the reject samples at nominal particle loadings of 25% and 50%, reasonably consistent with the measurements in the Mk1 model. However this trend is not seen at 75% nominal particle loading, as the PSD of the reject sample at 30º is very similar to that at 45º and the 40º sample has the coarsest distribution.
4.7.3.4 Comparison of Mk 1 and Mk 2 Particle Size Analysis
The effect of the classifier design on the PSDs of the reject and cyclone samples were compared. At a vane angle of 30º, the only difference in cyclone PSD is a slightly finer distribution for particles above 125 microns in size at 50% loading. The PSDs of the reject samples are very similar at 50% loading, but substantially finer in the case of the Mk 2 classifier model at 75% loading. At a vane angle of 40º (e.g. Figure 31), any differences between the classification performance of the Mk 1 and Mk 2 models appear to become clearer with increasing particle loading. At 25% nominal particle loading, the reject and cyclone PSDs are almost identical for both

Report No: 35/03/042 Issue No.: 1
10 June 2003 Page 19 of 118 © Mitsui Babcock 2004
designs. At 50% nominal particle loading, the cyclone PSDs are very similar, while the reject samples indicate the Mk 1 classifier produces a slightly finer reject PSD. At the highest particle loading, 75%, the Mk 1 classifier produces a finer cyclone PSD and coarser reject sample. At a vane angle of 45º it is very difficult to detect a clear difference between the Mk 1 and Mk 2 classifier designs at any of the three particle loadings investigated. The only distinctions are that, at 50% loading, the Mk 2 classifier appears to produce a slightly finer range of particle size distributions in the cyclone sample; and, at 25% and 75% loading, the Mk2 produces a finer reject PSD.
It therefore seems that the various design changes between the Mk 1 and Mk 2 classifier models do not produce a substantial difference in their ability to classify the inlet particle stream.
Comparing the results for the highest loadings, the increased fineness of the reject sample for the Mk1 design compared to the Mk2 agrees with the higher reject ratio found earlier, and indicates that reject ratio cannot be seen here to be an indication of efficiency, but as a result of recycling of fine product. At the design value of a vane angle of 40º the Mk 1 design shows considerably better PSD classification performance than the Mk 2, Figure 31.
4.8 DISCUSSION
The aerodynamics and particle separation performance of a one-third scale model of a vertical spindle coal mill static classifier, using two different classifier designs, have been successfully quantified at different inlet vane angles. The Mk 1 classifier design was based on an existing Mitsui Babcock E mill classifier design, while the Mk 2 classifier design was based on an alternative design. Flow visualisation experiments enabled a qualitative understanding of the aerodynamics of both classifier designs over a broad range of vane angles. Velocity measurements obtained using an LDA technique have provided high quality data for the validation of a CFD model of the classifier designs and insight into the aerodynamics within the classifier for the first time. Particle-laden experiments have provided data to validate the classification efficiency of the vertical spindle coal mill static classifier. Furthermore, the effect of vane angle on the mean velocity and turbulence quantities and particle separation performance has been established.
The flow visualisation experiments were used to quickly characterise the dominant flow features of the classifier at different inlet vane angles in the Mk 1 classifier model. The results demonstrated that there are three main flow regimes within the range of 0º to 60º vane angle: axisymmetric, central-core and swirl dominated. The central-core dominated flow regime spans vane angles between 30º and 50º and hence the typical operating vane angle is characterised by this flow regime. It is not clear if this flow regime is optimal for the best particle separation efficiency - it is unlikely that the axisymmetric flow regime would be suitable, but the reduced short-circuiting and high degree of swirl observed in flows at vane angles above 50º could be appropriate, as long as the particle throughput was still sufficient.
Measurements of the velocity under air only conditions demonstrate that the aerodynamic features and velocity profiles at the same axial measurement location are very similar in both classifier designs. In both classifier designs the aerodynamics are characterised by two very distinct regions of air flow. The bottom section of the classifier cone, below levels E to F relative to the top of the lower flange of both models, can be described as a Rankine vortex flow, the characteristic feature of cyclonic flow. Hence, cyclone derived modelling principles may be confidently applied
Report No: 35/03/042 Issue No.: 1
10 June 2003 Page 20 of 118 © Mitsui Babcock 2004
within this zone of a classifier to predict particle separation performance. However, the air flow in the top section of the classifier is highly three-dimensional with significant “short-circuiting” of air passing straight from the vanes to the vortex finder. Cyclone models are not valid for this part of the classifier. Reducing the amount of flow short-circuiting the classifier should increase the particle separation efficiency of the classifier and hence is one aspect in which the classifier design could be improved. A reduction in the short-circuiting flow could be achieved by altering the vane design to force the flow down in the classifier volume, or by increasing the length of the vortex finder.
The effect of the classifier inlet vane angle has been shown principally to affect only the tangential velocity component throughout the classifier and the axial velocity component near the inner pipe. This is the case in both the Mk 1 and Mk 2 classifier designs. The effect of vane angle on these velocity components has been quantified and been shown to depend upon which region of the classifier cone the measurement point is located in. Within the main section of the classifier cone (below level F) the tangential, or swirling, velocity component is approximately proportional to the vane angle throughout the entire classifier. The radial and axial velocity components were shown to be independent of the vane angle throughout the classifier, except for the axial component adjacent to the inner particle supply pipe, which increases in proportion with the increasing vane angle. The degree of similarity in the air-flow only measurements in the Mk1 and Mk2 classifier models suggests that the flow within a vertical spindle mill static classifier is predominantly a function of its overall geometry and cannot be altered significantly by making slight changes to any of its components. Therefore, more drastic changes to the existing classifier design than those included in the Mk2 model must be considered if significant changes in the classifier aerodynamics are required.
Frequency analysis of the tangential velocity measurements indicated the possible presence of a Precessing Vortex Core (PVC) in the main body of the classifier. The results suggested that the presence of a PVC becomes clearer with increasing vane angle, consistent with observations made during the flow visualisation experiments. The effect of vane angle on the swirl number of the flow at different axial positions within the flow was also quantified. These calculations indicated that there was not a strong correlation between vane angle and swirl number, but did highlight again the different behaviour of the flow in the bottom section of the classifier cone and the upper part of the cone.
The remarkable similarity of the aerodynamic features of the Mk 1 and Mk 2 classifier designs was matched to a certain extent in the performance of the designs with particle-laden flow. In both cases the reject ratio, that is the ratio of particles being rejected by the classifier to particles exiting the classifier, was shown to increase with increasing vane angle. The reject ratio also decreased with an increase in particle loading for both model designs. However, the reject ratio was significantly higher for the Mk 2 classifier model compared with Mk 1 classifier.
Despite the significant difference in reject ratio with vane angle, particle loading and classifier design, similar changes in the particle size distributions of the reject and cyclone (throughput) samples were not detected. In both classifier designs, there was no consistent correlation between particle loading and any changes in the reject and cyclone PSDs. The effect of the vane angle was slightly clearer, suggesting that the fineness of the throughput and reject material increased with vane angle. However, the optimum classification efficiency was found to be at 40º for the Mk 1 design.

Report No: 35/03/042 Issue No.: 1
10 June 2003 Page 21 of 118 © Mitsui Babcock 2004
The inconsistency in the particle size distribution results may be due to experimental error, or be an implicit aspect of the classifier operation. However, the technique developed in this project for measuring the particle size distribution of a particular sample was validated against data obtained by other techniques on the input SG Fillite material and checked for repeatability. The short run-times of the particle experiments may also contribute to any experimental error. However, this would not explain any variation in the effect of the vane angle, which were conducted at a particular particle loading and hence, run-time. Furthermore, the reject ratio results were consistent across the different run-times and conditions. Therefore, the observed variation in particle size distributions with particle loading and vane angle must be attributed to variations in the operation of the classifier model.
Direct comparison of the cyclone and reject particle size distributions at the same conditions in the Mk1 and Mk2 classifier model designs does not indicate a significant difference in the particle separation efficiency of the classifiers. This is consistent with the observations made regarding the aerodynamic similarities of the two classifier models and hence also implies that more significant design changes must be considered to improve the particle separation efficiency of the vertical spindle coal mill static classifier.
5. CFD SIMULATION OF PHYSICAL MODEL
5.1 Fluid Phase Modelling
The validation of the fluid flow modelling capability of the mathematical model was judged against flow visualisation and LDA measurements of velocity and turbulence undertaken by the University of Edinburgh for a variety of arrangements. A number of mathematical models of the physical model were set-up with the aim of investigating the turbulence model to be applied, grid dependency, the validity of the assumption of periodic conditions, and vane angle. The vane angle models were re-run to replicate model conditions during the flow visualisation study in order to provide a direct comparison, the original runs having been undertaken in advance of the experimental work. Mathematical modelling of the physical model was undertaken using the commercially available CFD package FLUENT 6.0.12.
5.1.1 Model Set-up
The following models were set-up and run:
• Selection of Turbulence Model: Vane angle of 40°: Five 22.5° slice models.
Further to selection of the most suitable turbulence model:
• Grid Dependency: Refined 22.5° slice model.
• Validation of Periodicity: Vane angle of 40°: Half (180°) and full (360°) models.
• Effect of Vane Angle (30° and 45°).
• Flow Visualisation Study (30°, 40° and 45° with reduced air flow rate to replicate experimental conditions).
Report No: 35/03/042 Issue No.: 1
10 June 2003 Page 22 of 118 © Mitsui Babcock 2004
5.1.2 Model Definition
Figure 32 presents the Mark I modelled arrangement, built according to component and assembly drawings supplied by the University of Edinburgh.
Given the radial equi-spacing of the 16 vanes within the classifier, it was decided that a 22.5° ‘slice’ model represented a computationally efficient starting point (i.e. a single classifier vane). Grid and mesh detail are shown in Figure 33. As is the case with the physical model, the vanes are set to give clockwise swirl, as viewed from above. Grid sensitivity was investigated.
Periodic conditions were exploited for the 22.5° and the 180° (half) models. The 180° and 360° models were constructed by a process of copying and rotating the 22.5° mesh and then uniting this with the outlet turret section, as shown in Figure 34. Therefore the mesh density is identical for the three models.
5.1.3 Results and Discussion
5.1.3.1 Measurement versus Prediction
The capability of the CFD model was assessed by comparison of predicted axial, radial and tangential velocities (i.e. the component velocities of a cylindrical co-ordinate system) and turbulence kinetic energy, k, to measured data for these quantities.
The traverses examined are presented in Figure 35. Note that there is a bias of traverses towards the entry to the vortex finder, as it was anticipated that significant flow gradients would be apparent in this region.
Predicted static, dynamic and total pressure drops were reported from the models at various stages through the classifier (inlet, vane inlet, vane outlet, vortex finder entry, and outlet). The locations of the reportage planes are also illustrated in Figure 35. As compressibility effects are negligible, the total gauge pressure is equal to the sum of the static and dynamic pressures. FLUENT works on the basis of achieving zero static pressure at the model outlet.
5.1.3.2 Selection of Turbulence Model
Turbulent flows are characterised by fluctuating flow fields. Since these fluctuations can be of small scale and high frequency, they are computationally too “expensive” to simulate directly in practical engineering calculations. Instead, a modified set of equations is chosen to approximate the governing equations. As these modified equations contain additional unknown variables, turbulence models are needed to determine these variables in terms of known quantities.
Unfortunately, no single turbulence model is universally applicable. Indeed, the choice of turbulence model is dependent upon a number of factors (e.g. the physics of the flow, the level of accuracy required).
The following turbulence models were considered:
• Standard kε
• Realizable kε (rkε)
Report No: 35/03/042 Issue No.: 1
10 June 2003 Page 23 of 118 © Mitsui Babcock 2004
• Standard kω (kω)
• Renormalisation Group kε (RNG kε)
• Reynolds Stress Model (RSM)
5.1.3.2.1 Gross Flow Patterns
Prior to comparison with measured data, predictions from the models were studied with regard to gross flow patterns. Velocity vectors on a mid-model plane of 11.25° (midway between the classifier vane spindles) are presented for the five turbulence models in Figure 36, where it is evident that each turbulence model has given rise to differing flow fields. Progressing through the model, it is immediately apparent that model selection will be partially dependent upon flow field prediction in the outer body of the classifier. At this stage the flow is not swirling and therefore a reasonable approximation to the actual flow would be expected. At the vane seat level and through the vanes, the flow fields appear to be similar in all cases, with regions of stagnation below the seat itself and towards the outer roof. Due to the large portion of swirling flow within the inner body, it is difficult to analyse this region. However, a substantial amount of the flow is seen to short-circuit to the vortex finder, setting up a recirculation zone that extends to the outlet. The kε model under predicts this recirculation relative to the other turbulence models.
A better appreciation of the flow field can be gained by studying the component velocity fields; contours of axial, radial and tangential velocity at the mid-model plane were compared for all models. The axial and radial velocity data highlight the strength of the flow moving past the vortex finder, with the radial velocity also emphasising the differences in the outer body predictions. However, it is the differences between the predictions of the tangential velocity component that are most apparent. The kε and RSM models give the lowest tangential velocities in the inner body and show large areas of unswirling flow. The five models are all consistent in showing the greatest tangential velocities through the outlet section. Contours of kinetic energy for the different turbulence models show those regions where a high degree of turbulence is being created: at the outer body restriction, over the vane seat, and past the vortex finder. Relative to the other models, the kω and RNG kε models under predict kinetic energy through the outlet section.
5.1.3.2.2 Flow Fields
Graphs of measured and predicted axial, radial and tangential velocities were prepared for all traverses, a typical example being presented in Figure 37.
For traverses 1 and 2, the significant error in the prediction of the outer body flow field by the kε , rkε and RNG kε models is apparent from the axial and radial profiles. Moving up through the outer body, the bulk of the flow is correctly predicted to have little radial or tangential component, and a developing bias towards the outer casing. By the vane seat the flow becomes more biased towards the vanes, though the extent of this bias seems somewhat under predicted by all five models.
Within the classifier cone, the kω model gives the best approximation to the measured data, particularly with regard to axial and tangential velocity. Through the vanes and just below the vanes, the turbulence models all give very similar profiles, as would be expected. The inner body tangential velocity profile is considerably under predicted by the kε model and over predicted by the RNG kε model. Perhaps
Report No: 35/03/042 Issue No.: 1
10 June 2003 Page 24 of 118 © Mitsui Babcock 2004
most surprisingly of all, the RSM model, reputed to be most suitable for highly swirling flows, gives a poor account of itself in comparison to the physical model data. Velocity profiles within the vortex finder differ quite substantially. Unfortunately, due to physical restrictions and laser reflectivity concerns, LDA measurements could not be taken, and there therefore exists a degree of uncertainty over the flow fields in this region.
5.1.3.2.3 Summary
Given the lack of physical model data within the vortex finder, it is difficult to select a turbulence model on the basis of good predictive capability throughout the whole of the classifier model. However, the accurate simulation of the flow field within the classifier cone is of greatest interest as this is where the bulk of particulate separation occurs, with small particles passing to the outlet and large particles being thrown outwards to the cone. In this respect, it was decided that the kω model represented the most accurate and efficient means of turbulence modelling and therefore this was applied to all subsequent models.
5.1.3.3 Grid Dependency
A refined mesh 22.5° model was run using the kω turbulence model. Operating conditions were maintained as baseline. Given the reasonable comparison observed between baseline and refined mesh models, and the computational expense of additional mesh elements, it was decided that the original meshing methodology used should be applied to subsequent models.
5.1.3.4 Validity of Periodic Conditions
The validity of the assumption that periodicity could be exploited without jeopardising the solution of the internal flow field was studied using the 180° and 360° models. The kω turbulence model was applied to both models, and air flow rate and physical properties maintained the same as the baseline case. Two radial traverses (one intersecting the outlets, the other perpendicular to this plane) were used for comparison against the measured data.
Firstly, it should be acknowledged that the use of larger periodic or even ‘entire’ models, which include the true extent of the geometry being modelled, is a recommended practice. However, the use of efficient models, which replicate the true conditions, but at low computational expense, is also an important consideration. Given the likeness that has been observed between the variables of interest for the models studied, and in light of current limitations in computing resource, the use of a 22.5° model was shown to be acceptable and was adopted for continuing development work.
5.1.3.5 Effect of Vane Angle
The effect of varying classifier vane angle was investigated using two additional 22.5° models with vane angle settings of 30° and 45°. These angles were selected as they represent the extremes of the range of typical plant operation. Operating conditions were identical for the three models.
5.1.3.5.1 Gross Flow Patterns
Velocity vectors on a mid-model plane are presented for the three vane angle models in Figure 38. Varying vane angle has very little effect on the flow field in the outer

Report No: 35/03/042 Issue No.: 1
10 June 2003 Page 25 of 118 © Mitsui Babcock 2004
body. Studying the inner body, the effect of increasing vane angle is marked, as the air flow moves further into the classifier cone, and the extent of short-circuiting near the vortex finder is reduced.
The effect of vane angle on the flow field is well illustrated by contours of axial and tangential velocity. Moving from 30°, through 40°, to 45°, the amount of flow being forced downwards into the classifier cone increases, as does that proportion of the flow that is highly swirled. At a vane angle of 30°, a large amount of the flow is seen to bypass the inner body.
5.1.3.5.2 Flow Fields
Graphs of measured and predicted axial, radial and tangential velocities were prepared for all traverses. The outer body flow fields for both models were consistent with those for the baseline 40° model as expected.
• 30°
The lower traverses indicate that the flow field within the inner body of the 30° vane angle classifier model is relatively well predicted, as the model has correctly identified the flat profile of tangential velocities in this region. Axial velocity profiles also level off, indicative of more flow bypassing the lower inner body as vane angle is reduced.
At traverse 5 and upward, the mathematical model manages to predict the bias of the free vortex towards the coal inlet pipe. As was the case in the 40° model, a discrepancy exists near the vortex finder at traverse 9, where the velocities within the vortex finder have not been predicted correctly. Overall, the typical error between measured and predicted data is similar to that seen in the 40° model. The difficultly in achieving good quality, repeatable measured data is indicated at traverse 10, where the two LDA data sets show quite different data. This is most likely due to the close proximity of this traverse to the vanes, where the flow field will be subject to turbulent fluctuations and will therefore show time-dependent features.
• 45°
At the lower traverses, the axial velocity profiles show that more flow is returning upwards from the lower regions of the cone, consistent with the greater volume utilisation anticipated from the strongly swirling flow.
The marked increase in tangential velocity magnitude through the classifier becomes very apparent when comparing the two extreme cases of 30° and 45°. As with the 30° and 40° data sets, the CFD again over predicts the tangential velocities but, encouragingly, does appear to capture the change in profile through traverses 2 to 4. Consistent with the two other vane angle cases, the most significant over prediction is seen at those traverses close to the vortex finder, in particular traverse 7.
5.1.3.5.3 Pressure Drops
Measurements of total pressure were taken during three LDA test series (main profile tests, inclined LDA tests and blade region tests) for vane angles of 30° to 50°, in 5° increments. A pressure tapping was fitted at the inlet to the ID fan. Therefore, the readings represent the total pressure drop across the entire physical model arrangement, inclusive of the turret, outlets and downstream ducting.
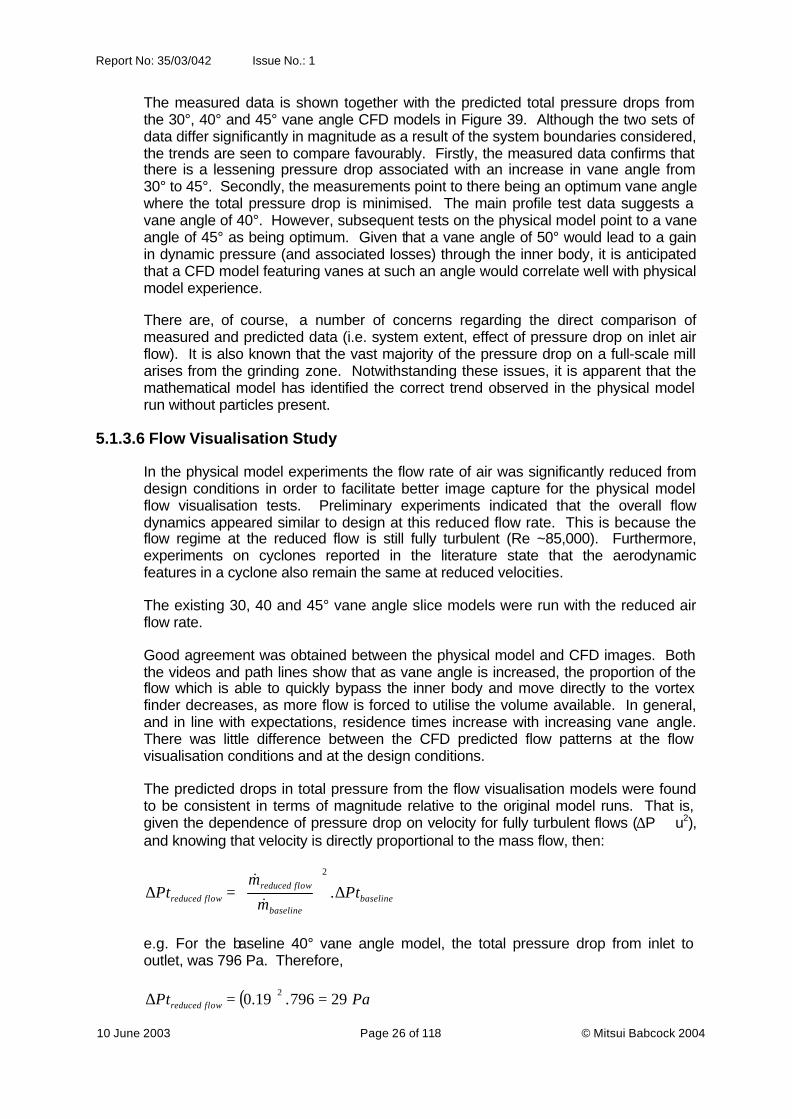
Report No: 35/03/042 Issue No.: 1
10 June 2003 Page 26 of 118 © Mitsui Babcock 2004
The measured data is shown together with the predicted total pressure drops from the 30°, 40° and 45° vane angle CFD models in Figure 39. Although the two sets of data differ significantly in magnitude as a result of the system boundaries considered, the trends are seen to compare favourably. Firstly, the measured data confirms that there is a lessening pressure drop associated with an increase in vane angle from 30° to 45°. Secondly, the measurements point to there being an optimum vane angle where the total pressure drop is minimised. The main profile test data suggests a vane angle of 40°. However, subsequent tests on the physical model point to a vane angle of 45° as being optimum. Given that a vane angle of 50° would lead to a gain in dynamic pressure (and associated losses) through the inner body, it is anticipated that a CFD model featuring vanes at such an angle would correlate well with physical model experience.
There are, of course, a number of concerns regarding the direct comparison of measured and predicted data (i.e. system extent, effect of pressure drop on inlet air flow). It is also known that the vast majority of the pressure drop on a full-scale mill arises from the grinding zone. Notwithstanding these issues, it is apparent that the mathematical model has identified the correct trend observed in the physical model run without particles present.
5.1.3.6 Flow Visualisation Study
In the physical model experiments the flow rate of air was significantly reduced from design conditions in order to facilitate better image capture for the physical model flow visualisation tests. Preliminary experiments indicated that the overall flow dynamics appeared similar to design at this reduced flow rate. This is because the flow regime at the reduced flow is still fully turbulent (Re ~85,000). Furthermore, experiments on cyclones reported in the literature state that the aerodynamic features in a cyclone also remain the same at reduced velocities.
The existing 30, 40 and 45° vane angle slice models were run with the reduced air flow rate.
Good agreement was obtained between the physical model and CFD images. Both the videos and path lines show that as vane angle is increased, the proportion of the flow which is able to quickly bypass the inner body and move directly to the vortex finder decreases, as more flow is forced to utilise the volume available. In general, and in line with expectations, residence times increase with increasing vane angle. There was little difference between the CFD predicted flow patterns at the flow visualisation conditions and at the design conditions.
The predicted drops in total pressure from the flow visualisation models were found to be consistent in terms of magnitude relative to the original model runs. That is, given the dependence of pressure drop on velocity for fully turbulent flows (∆P ∝ u2), and knowing that velocity is directly proportional to the mass flow, then:
baselinebaseline
flowreducedflowreduced Pt
m
mPt ∆
=∆ .
2
&
&
e.g. For the baseline 40° vane angle model, the total pressure drop from inlet to outlet, was 796 Pa. Therefore,
( ) PaPt flowreduced 29796.19.0 2 ==∆

Report No: 35/03/042 Issue No.: 1
10 June 2003 Page 27 of 118 © Mitsui Babcock 2004
The predicted pressure drop from the CFD model was 31 Pa.
5.2 Particle-Laden Flow Modelling
Here the simultaneous solution of the fluid and solid (particulate) phases was considered. The predictive capability of CFD for the ‘coupled’ two-phase solution was previously studied in some detail, and the methodology developed was applied here.
The effect of varying vane angle and classifier design was studied, with predictions analysed via flow fields, collection efficiencies and product gradings. The validation exercise was conducted on the basis of predicted versus measured product and rejects gradings. Two parameters were investigated - vane angle (30, 40 and 45° in the baseline model), and classifier arrangement (at a vane angle of 40°).
The size distribution of the particles used during the physical model test work was measured by the University of Edinburgh. The total particulate flow was equivalent to the notional design air to fuel ratio in a typical E mill (defined as 100% particle loading). The density of the particles was defined as 794 kg/m3. The particles were supplied as spherical (equivalent to a shape factor of 1).
5.2.1 Results and Discussion
The performance of the classifier was judged by post-processing the predicted data, in terms of particle collection efficiencies (that fraction of particles of a particular size that are collected in the classifier) and the size distribution of particles passing to the classifier outlet (i.e. the product stream) and being collected (rejects stream). The percentage by mass of those particles passing ten different sieve sizes in the product and rejects streams was measured by University of Edinburgh. Measured and predicted particle size distributions can be presented in the form of Rosin-Rammler graphs, which plot the mass percent of particles whose size is less than the particle diameter they are plotted against.
Predicted total pressure drops were reported for inlet to vortex finder and inlet to outlet, the total gauge pressure being equal to the sum of the static and dynamic pressures.
5.2.1.1 Flow Patterns
Velocity vectors on a mid-model plane are presented for the 30, 40 and 45° MkI and 40° MkII models in Figure 40. As was evident from the air only simulations, the effect of increasing the vane angle on the flow field is to cause the air (and coal) to move further down into the classifier cone, thus reducing the extent of short-circuiting behaviour near the vortex finder. The velocity vector plots reveal very little of any possible differences between the MkI and MkII designs.
From contours of radial and tangential velocity it can be seen that increasing vane angle in the MkI model leads to a reduction in the amount of air flow passing directly to the vortex finder, corresponding to increased utilisation of the classifier inner body. The profiles suggest that the flow fields within the MkI and MkII arrangements are similar, although a slight increase in radial and lessening in tangential velocity for the MkII can be seen.
Report No: 35/03/042 Issue No.: 1
10 June 2003 Page 28 of 118 © Mitsui Babcock 2004
5.2.1.2 Collection Efficiency and Product Grading
5.2.1.2.1 Effect of Vane Angle
Predicted collection efficiencies are presented for the MkI 30, 40 and 45° vane angle models in Figure 41. There is a substantial improvement in performance with an increase in vane angle between 30 and 40°, with the top size being fully captured falling from 250-300 to 125 µm. A further slight improvement is gained with a vane angle of 45°.
Rosin-Rammler plots of measured and predicted product and rejects gradings were prepared for the three vane angle models, Figure 42 shows the results for the 40° vane angle model. Physical and mathematical model rejects data compare reasonably well, but some inconsistencies are apparent between the product stream data sets.
Predicted product grading quickly becomes very fine as vane angle increases from 30 to 45° on the MkI model. The gradings at 40° and 45° are very similar, reflecting the 100% collection efficiencies seen for medium to large sized particles.
5.2.1.2.2 Effect of Classifier Design
Predicted collection efficiencies are presented for MkI and MkII models (40° vane angle) in Figure 43. The MkI model appears to offer a slight improvement in collection efficiency.
Figure 44 presents the comparison between measured and predicted product and rejects gradings for the MkII model. As previously seen with the MkI model, the measured and predicted product gradings do not correspond well. However, the rejects gradings are comparable.
As with the vane angle cases, the rejects gradings reveal good agreement between the measured and predicted data for the MkI and MkII models.
5.2.1.3 Rejects Ratio
A further comparison of predicted and measured data can be made via the rejects ratio. Rejects ratio is defined as the ratio of rejects coal flow to product coal flow. Figure 45 shows rejects ratio versus particle loading for the measured and predicted scenarios. From this it is apparent that the prediction of the MkI rejects ratio at vane angle of 30° is very consistent with the physical model experience. However, at a vane angle of 40°, the MkI model prediction is considerably higher than practical testing would imply (approximately doubled). This magnitude of error is not evident for the MkII model (vane angle of 40°), where a lower disagreement of some 40% is seen. The predicted data point for the MkI 45° vane angle model is not shown as it is extremely high (~25), mirroring the very efficient predicted classifier performance. Although measured reject ratio increases with the change in vane angle from 40 to 45°, the relative change is lower than when the vane angle increases from 30 to 40°.
Interestingly, on transition from MkI to MkII design for a vane angle of 40°, the rejects ratio increases according to the measurements, but decreases according to modelling predictions.
Report No: 35/03/042 Issue No.: 1
10 June 2003 Page 29 of 118 © Mitsui Babcock 2004
5.2.1.4 Pressure Drops
The predicted pressure drop through the classifier (inlet to vortex finder) is 1006 Pa for a vane angle of 30°, decreasing to 718 Pa for 40°, and rising to 916 Pa for 45°. Pressure drop from inlet to outlet is greatest for the 30° case, and similar for the 40 and 45° models. Such findings are in line with work previously conducted using air only models. The distinct lack of volume utilisation occurring at a vane angle of 30°, where the majority of the flow is streaming into the vortex finder, means that there is a sizeable decrease in static pressure relative to the 40° case. A higher static pressure loss will also result from the strongly swirling flow through the 45° angled vanes, again giving rise to a higher static pressure loss (this time due to the gain in dynamic pressure through the vanes). The dynamic pressure loss through the outlet section is greatest for the 40° and 45° models, as would be expected from the swirling nature of the flows.
The pressure drops predicted for the 40° MkI and MkII models indicate that a slight pressure penalty of some 70 Pa is incurred through the redesign of the classifier. The pressure loss through the inner classifier body is substantially higher for the MkII arrangement (960 versus 718 Pa). However, by virtue of the lowered amount of swirling flow moving through the outlet section, this loss is not compounded further.
5.2.1.5 Discussion
The causes of the discrepancy seen between measurements and predictions can be grouped into two categories: mathematical modelling inputs and physical model issues.
The modelling inputs of most interest are shape factor, coefficient of restitution and equivalent inlet particle size distribution. The shape factor was set to a value of 1 (i.e. spherical), and although it is unlikely that all particles will be completely spherical in shape, both the supplier and size analysis experience provided evidence that they will not be far from this condition. Indeed, a reduction in shape factor to 0.9, say, would only give rise to a slight decrease in collection efficiency. The coefficient of restitution applied, 0.36, although representative of coal on steel, was considered applicable given that the materials used in the tests (Fillite and Perspex) were harder and softer than coal and steel, respectively. Finally, the approximation to the measured inlet particle size distribution, used as input to the CFD model, was very good. Therefore very little error is expected to have arisen from this source.
The main sources of error concerning physical model measurements are the particle sizing technique (image analysis) and the use of a cyclone to retrieve the product stream. The image analysis technique was deemed to be reliable, through multi-sample analysis and attainment of repeatable results. However, the loss of very fine material from the product stream to the vent from the cyclone is of particular concern. Typically, cyclone separators are designed to retain some 95% or more of the incoming particulate material. It is believed that the cyclone designed and installed on the test rig performs close to this standard, but the loss of fines will have resulted in the product gradings being significantly biased towards the coarser material. This is of special concern in the case of increasing vane angle, where classifier product is becoming finer (i.e. a greater proportion of product flow is lost).
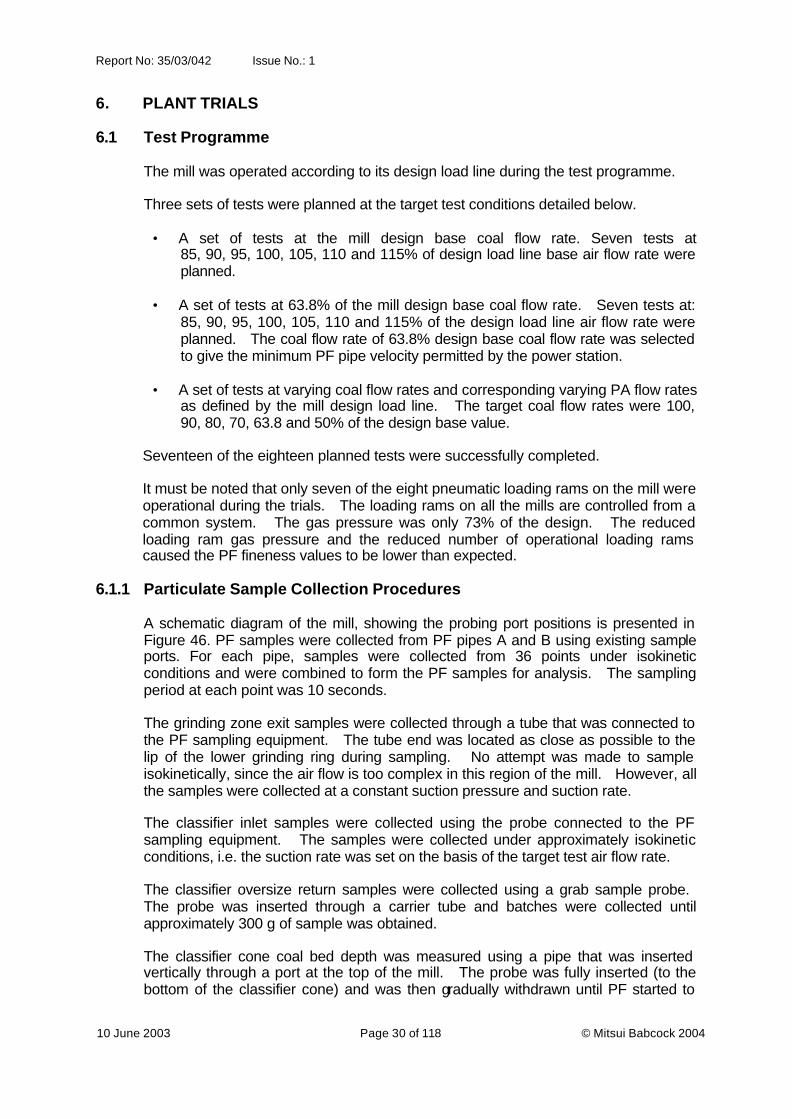
Report No: 35/03/042 Issue No.: 1
10 June 2003 Page 30 of 118 © Mitsui Babcock 2004
6. PLANT TRIALS
6.1 Test Programme
The mill was operated according to its design load line during the test programme.
Three sets of tests were planned at the target test conditions detailed below.
• A set of tests at the mill design base coal flow rate. Seven tests at 85, 90, 95, 100, 105, 110 and 115% of design load line base air flow rate were planned.
• A set of tests at 63.8% of the mill design base coal flow rate. Seven tests at: 85, 90, 95, 100, 105, 110 and 115% of the design load line air flow rate were planned. The coal flow rate of 63.8% design base coal flow rate was selected to give the minimum PF pipe velocity permitted by the power station.
• A set of tests at varying coal flow rates and corresponding varying PA flow rates as defined by the mill design load line. The target coal flow rates were 100, 90, 80, 70, 63.8 and 50% of the design base value.
Seventeen of the eighteen planned tests were successfully completed.
It must be noted that only seven of the eight pneumatic loading rams on the mill were operational during the trials. The loading rams on all the mills are controlled from a common system. The gas pressure was only 73% of the design. The reduced loading ram gas pressure and the reduced number of operational loading rams caused the PF fineness values to be lower than expected.
6.1.1 Particulate Sample Collection Procedures
A schematic diagram of the mill, showing the probing port positions is presented in Figure 46. PF samples were collected from PF pipes A and B using existing sample ports. For each pipe, samples were collected from 36 points under isokinetic conditions and were combined to form the PF samples for analysis. The sampling period at each point was 10 seconds.
The grinding zone exit samples were collected through a tube that was connected to the PF sampling equipment. The tube end was located as close as possible to the lip of the lower grinding ring during sampling. No attempt was made to sample isokinetically, since the air flow is too complex in this region of the mill. However, all the samples were collected at a constant suction pressure and suction rate.
The classifier inlet samples were collected using the probe connected to the PF sampling equipment. The samples were collected under approximately isokinetic conditions, i.e. the suction rate was set on the basis of the target test air flow rate.
The classifier oversize return samples were collected using a grab sample probe. The probe was inserted through a carrier tube and batches were collected until approximately 300 g of sample was obtained.
The classifier cone coal bed depth was measured using a pipe that was inserted vertically through a port at the top of the mill. The probe was fully inserted (to the bottom of the classifier cone) and was then gradually withdrawn until PF started to

Report No: 35/03/042 Issue No.: 1
10 June 2003 Page 31 of 118 © Mitsui Babcock 2004
flow from its open end. The level at which PF started to flow was deemed to be the top of the coal bed.
All the particulate material samples were analysed as follows:
• Moisture content.
• Dry grading.
• Wet grading.
• Laser diffraction particle size analysis (Microtrac).
Raw coal samples were collected from the feeder on a daily basis and were analysed as follows:
• Proximate analysis.
• Hardgrove Index.
6.2 Results
Seventeen of the eighteen planned tests were successfully completed. Mill operational limitations prevented the eighteenth from being completed.
6.2.1 Raw Coal Analyses
The coal proximate analysis and Hardgrove Index values showed little variation during the test programme. The average Hardgrove Index value was 57 and the variation in measured values for the different samples was within the repeatability of the Hardgrove Index test (i.e. ± 4).
6.2.2 Mill and Classifier Differential Pressures
The mill differential pressure is defined as mill inlet static pressure minus mill body static pressure, and the classifier differential pressure is defined as mill body static pressure minus mill outlet pipe static pressure.
Mill and classifier differential pressures are plotted versus % mill capacity in Figure 47. Both mill and classifier differential pressures increase with increasing % mill capacity. The classifier differential pressure increases less steeply than the mill differential pressure. Although there is some evidence of curvature in the increase of both mill and classifier differential pressures with increasing % mill capacity, the data have been fitted with straight lines.
Figure 48 presents mill and classifier differential pressures plotted against PA flow rate (% of design load line value) at 100% design base coal flow rate. The mill differential pressure increases at approximately twice the rate that the classifier differential pressure increases with increasing PA flow rate.
Similar data was obtained at 63.8% design base coal flow rate. As expected, the differential pressures are lower than those measured in the 100% design base coal flow rate tests.
The classifier differential pressure is, as expected, always less than the mill differential pressure. The main contributions to the mill differential pressure comprise

Report No: 35/03/042 Issue No.: 1
10 June 2003 Page 32 of 118 © Mitsui Babcock 2004
the throat pressure drop and the energy required to entrain the coal particles (that spill off the bottom grinding ring) into the air flow.
6.2.3 Classifier Coal Bed Depth
The classifier coal bed depth was essentially constant for most of the tests. One notable exception is the bed depth measured during Test 1-02 which was noticeably greater, this may be the result of blockage of the probe.
6.2.4 Particulate Samples
• Dry Sieve Particle Size Analyses
Figure 49 presents dry sieve particle size analyses plotted on Rosin-Rammler axes for the five particulate samples collected during Test 1-01, namely:
• A – PF Pipe A
• B – PF Pipe B
• C – Grinding Zone Exit
• D – Classifier Inlet
• E – Classifier Oversize Return
Figure 50 shows the Test 1-01 particulate sample dry sieve fineness values (% <75µm and % <300µm) plotted against sample location. The grinding zone exit samples are the coarsest and the PF samples are the finest (as expected). The classifier inlet and classifier oversize return samples have similar, intermediate, fineness values. The classifier inlet material is slightly finer than the classifier oversize return material. This result suggests that a significant quantity of the classifier inlet material is recycled as classifier oversize return material.
Similar data were obtained for the other tests undertaken.
• PF Fineness
The %<75µm and %<300µm values for the mean PF (i.e. the weighted average of the PF Pipes A and B samples) are plotted versus % mill capacity in Figure 51. Both %<75µm and %<300µm decrease with increasing % mill capacity, but the %<75µm decreases more steeply than the %<300µm. PA flow rate increases with increasing % mill capacity according to the mill design load line. The resulting higher velocities entrain larger particles, which, together with reduced grinding quality due to the increased coal flow rate, cause fineness to decrease.
• Grinding Zone Exit Material Fineness
The %<75µm and %<300µm values for the grinding zone exit material are plotted versus % mill capacity in Figure 52. Both %<75µm and %<300µm decrease with increasing % mill capacity, but the %<75µm decreases less steeply than the %<300µm. The results are consistent with grinding quality decreasing with increasing coal flow rate.
Report No: 35/03/042 Issue No.: 1
10 June 2003 Page 33 of 118 © Mitsui Babcock 2004
• Classifier Inlet Material Fineness
The %<75µm and %<300µm values for the classifier inlet material are plotted versus % mill capacity in Figure 53. Both %<75µm and %<300µm decrease with increasing % mill capacity, but the %<75µm decreases less steeply than the %<300µm. The results are consistent with coarser particles being entrained by the increasing air velocities.
• Classifier Oversize Return Material Fineness
The %<75µm and %<300µm values for the classifier oversize return material are plotted versus % mill capacity in Figure 54. Both %<75µm and %<300µm decrease with increasing % mill capacity, but the %<75µm decreases less steeply than the %<300µm. The results show that many of the coarser particles carried to the classifier by the increasing air flow rates are separated from the PF and returned to the grinding zone.
6.2.5 Particle Stream Flow Rates
Particle stream mass flow rates and recycle ratios were calculated from mass balances based on the measured particle size analyses. Two methods were used.
The particle stream mass flow rates calculated by Method 1 are plotted against % mill capacity in Figure 55. The classifier inlet and classifier oversize return stream mass flow rates generally increase with increasing % mill capacity. The grinding zone exit and primary classification return stream mass flow rates show a great deal of scatter. They would, however, be expected to increase with increasing % mill capacity. The scatter is most likely to result from unrepresentative samples having been collected from some of the particle streams. The grinding zone exit sample is the most likely to be unrepresentative owing to the complex flows in the region from which it was collected.
Similar findings were obtained using Method 2.
• Recycle Ratios
The classifier recycle ratios calculated by Methods 1 and 2 and the primary classification recycle ratio calculated by Method 1 are plotted against % mill capacity in Figure 56. The classifier recycle ratios calculated using both methods increase with increasing % mill capacity. The primary classification recycle ratio, however, appears to decrease with increasing % mill capacity. This result is contrary to expectation.
The mean classifier recycle ratio (mass flow rate classifier oversize return : mass flow rate of PF) at 100% mill capacity was calculated to be 4.8 or 6.7, depending on the calculation method used. The average value from the two calculation methods is 5.8, which compares reasonably well with the value of 4 that is commonly quoted. The calculated value may be higher than the commonly quoted value due to the reduced loading ram gas pressure and the reduced number of operational loading rams.
The scatter observed in the primary classification recycle mass flow rate is most likely to result from unrepresentative samples having been collected from the grinding zone exit due to the complex flows in that part of the mill.
Report No: 35/03/042 Issue No.: 1
10 June 2003 Page 34 of 118 © Mitsui Babcock 2004
6.3 Discussion
As stated previously, only seven of the eight pneumatic loading rams on Mill 5A were operational during the trials. The reduced loading ram gas pressure and the reduced number of operational loading rams caused the PF fineness values to be lower than expected. Nevertheless, the test data generally exhibit the expected trends with increasing % mill capacity and increasing PA flow rate at a particular % mill capacity.
The PF fineness values measured during previous trials were consistently greater than those measured during the current trials. At 100% mill capacity, the %<75µm was 67.6% compared with 64.3%, and the %<300µm was 99.1% compared with 97.5%. The differences in %<75µm are mainly due to the different Hardgrove Index values of the test coals and the loading ram issues. The Hardgrove Index of the 1999 coal was 60, whereas that of the current coal is 57. Consequently, the %<75µm values for the current test coal would be expected to be 94.5% of the values for the 1999 coal. The result quoted above agrees with that expectation.
The fineness values of the four particle streams sampled decrease with increasing % mill capacity and increasing PA flow rate at a particular % mill capacity. The decrease in grinding zone exit fineness with increasing % mill capacity is caused by the grinding quality decreasing with increasing coal flow rate. All the other decreases in particle stream fineness with increasing % mill capacity and increasing PA flow rate at a particular % mill capacity are attributable to increased air velocities carrying coarser part icles from the grinding zone exit into the classifier.
The increasing classifier recycle ratio with increasing % mill capacity and increasing PA flow rate at a particular % mill capacity contributes to the increases in mill and classifier differential pressures and mill and PA fan power consumptions.
7. CFD SIMULATION OF E MILL CLASSIFIERS
7.1 Introduction
CFD modelling techniques were tested against the plant data described in Section 6. Measured and predicted mill performance for the existing E mill classifier were compared and the different product grading that can be expected from an alternative E mill classifier design was estimated.
7.2 Model Geometry
Geometric details used to construct the CFD model of the existing classifier design were obtained directly from the manufacturing drawings. The alternative E mill classifier design was also modelled. The number of vanes was increased to 24 and the blade profile was flat rather than being wedge-shaped as in the original design.
7.3 Description of Mathematical Models
7.3.1 Model Definition
To simulate the fluid dynamic behaviour of air flowing through an entire full-size E mill classifier would require construction of a large 3-dimensional model. Fortunately, from a modelling perspective, the original design exhibits rotational repeatability every 22.5° since it has 16 equi-spaced vanes. The periodicity means that it is only necessary to simulate a single 22.5° sector. The technical validity of this approach

Report No: 35/03/042 Issue No.: 1
10 June 2003 Page 35 of 118 © Mitsui Babcock 2004
has been discussed in Section 5. In a similar fashion, a 15° sector model will suffice in the case of the alternative E mill classifier configuration, which has 24 vanes. This simplification significantly reduces the computational requirements both in terms of memory and run time. All models in this study were for a fixed vane angle of 40°. Experience gained during the CFD modelling of the physical model was used to define the computational mesh required for the full scale mill classifier.
7.3.2 Gas-Particle Interaction
Generally, the gas-particle flow is governed by two sets of equations, which are coupled through interphase exchange terms (two-way coupling). These are obtained by calculating what is lost or gained by the second phase in terms of momentum, mass and energy (as applicable) as the particles enter and leave the computational cells used in the gas flow calculations. In some cases, the interaction between the particle and the mean flow can be assumed to be one-way leaving two uncoupled equation sets to be solved. That is, the quantity of particles may be so small that the gas flow field is not affected by their presence, whereas the trajectories of the particles are determined by the motion of the supporting fluid.
The particle loading encountered in vertical spindle mill classifiers dictates that two-way coupling be employed.
7.3.3 Model Initial Conditions
The conditions modelled relate to Test 1-05 of 15 February 2002 on the test mill. This will be referred to as the baseline condition for the mill classifier models.
• Air Flow
In addition to the baseline air flow rate, two further flow conditions were examined, –15% and +15% of baseline. Both the original and alternative arrangements were simulated.
• Coal Particles
To define the initial conditions of the coal particles at inlet to the classifier, the following parameters were specified:
• Initial Position
• Initial Velocity
• Particle Diameter
• Particle Mass
• Particle Shape Factor
Initial Position and Velocity
Particles were injected evenly distributed across a horizontal plane, level with the probe position used during measurement of the classifier inlet particle size distribution during the plant tests. It was assumed that there was no slip between particles and air (i.e. the particle velocity equals the air velocity), and that the air was evenly distributed across the inlet plane.

Report No: 35/03/042 Issue No.: 1
10 June 2003 Page 36 of 118 © Mitsui Babcock 2004
Particle Diameter and Mass
The classifier inlet particle size distribution was simulated by sub-dividing the measured classifier inlet grading into representative particle diameters. The smaller particles will tend to follow the air flow and escape through the classifier outlet, whereas the larger particles are likely to be partitioned, with a fraction of their inlet mass collected within the classifier and a fraction escaping as product. Accurate modelling of the larger particles is therefore key to correctly predicting classifier performance. Each particle diameter represents a proportion of the inlet mass, and the mass fraction sub-division was deliberately chosen such that it is biased toward the smaller particle sizes, (i.e. the larger particle sizes selected represent smaller mass fractions of the total compared with the smaller ones – for example, the 1700 µm particles represent just 1% of the flow, whereas the 70 µm particles represent 20% of the flow).
The particle diameter and mass flow rate data were determined from the plant trials measured data.
Particle Shape Factor
A coal particle is not a perfect sphere and hence a number of alternative drag laws are available within the CFD program. One permits the non-spherical nature of coal particles to be represented through a shape factor (F ).
The shape factor is difficult to measure and may be different for different coals, and for different comminution methods. There are some published data available, which suggest that a value between 0.6 and 0.8 is typical.
• Wall Surface Condition
Particles can be deposited on solid walls by two main mechanisms.
Impaction
The particle has so much momentum that it cannot follow the flow through say a sharp bend. This will lead to the particle impacting onto the wall and being trapped against the wall.
The classifier model was deliberately set up such that the particles are captured (the model reports the particles as being ‘trapped’) on the sloping surfaces of the classifier only, and the particles, in effect, are assumed to move down the classifier body and return to the grinding zone through the classifier oversize return, any particles which are not ‘trapped’ escape as product through the classifier outlet. All other surfaces allow the particles to rebound with a normal and tangential coefficient of restitution.
Turbulent Dispersion
The particles are affected by the turbulent eddies and may end up on a wall surface. The effects of turbulent dispersion can be modelled by decomposing the instantaneous fluid velocity into a mean and a fluctuating component. The mean velocity field is provided by solution of the governing equations of momentum conservation. Fluctuations are randomly sampled assuming Gaussian statistics and the time during which any sampled fluctuation applies is obtained from the lifetime of the eddy that the particle is traversing. However, the downside of this approach is the large number of trajectory calculations required (typically thousands) and the
Report No: 35/03/042 Issue No.: 1
10 June 2003 Page 37 of 118 © Mitsui Babcock 2004
potential loss in accuracy if care is not taken in defining the trajectory discretisation. Sensitivity to model settings was examined, and acceptable accuracy was shown to be achieved.
7.4 Results of Simulations
It was demonstrated that the mill classifier should be treated as a two-way coupled gas-particle system. Before proceeding to examine the results of the two-way coupled approach, the results of the one-way, or ‘clean-air’ scheme in which the particles do not influence the air, was compared to the ‘clean-air’ measurements and CFD predictions for the University of Edinburgh one-third scale physical model.
7.4.1 Clean Air Predictions
• Existing (Plant) Classifier Design
Fully converged solutions were obtained for air at three different mass flow rates corresponding to baseline and ± 15 % baseline flow rates.
Figure 57 shows velocity (magnitude) vectors on the mid-model plane. It is clear that although there are subtle differences with changing flow rate, the gross flow pattern is essentially the same. The contours of axial, radial and tangential velocity components together with turbulent kinetic energy at the mid-model plane for all three cases were also examined. The axial and radial velocity shows the strength of the flow past the vortex finder, with the radial velocity also revealing differences in the local flow structure around the vanes. The tangential velocity shows differences in local flow structure both within the classifier and in the outer body region.
Measurements of velocity components and turbulent kinetic energy were obtained at a number of traverse planes on the University of Edinburgh 1/3 scale physical model, as discussed previously. Comparisons were made between measured and predicted data. Figure 58 shows a typical comparison of measured axial, radial and tangential velocities and two CFD predictions; the 1/3 scale physical model and full scale plant classifier model. These are denoted by the legends ‘Physical Model’, ‘Physical Model – CFD’ and ‘Plant – CFD’ respectively. In general, agreement between both CFD models and the measured data is encouraging with no significant deviations in overall trends. However, quantitatively there are differences between the two CFD predictions and between the CFD predictions and measured data. These tend to be exacerbated at the higher traverses towards the vortex finder.
• Alternative Classifier Design
In a similar fashion, converged solutions were obtained for the alternative classifier model at baseline and ± 15 % baseline air flow rates.
Contours of axial, radial and tangential velocity components at the mid-model plane were examined for all three cases. The plots of axial velocity again highlight the strength of the flow past the vortex finder. In this case, the contours reveal a more focused region of high velocity, biased toward the coal feed pipe. Radial and tangential velocity contours show slight differences in local flow structure both within the classifier and in the outer body region as before. An extended region of re-circulation at the outer wall of the vortex finder was found, as shown by the velocity vector plots in Figure 59. This localised feature of the flow was not as pronounced in the original design. Furthermore, the presence of such a region could impede the

Report No: 35/03/042 Issue No.: 1
10 June 2003 Page 38 of 118 © Mitsui Babcock 2004
passage of any particulate matter successful in entering the vortex finder, and prevent it from escaping.
7.4.2 Particle-Laden Flow: One-Way Coupling
Modelling of the existing classifier design using one-way coupling was investigated for completeness. The predictions showed poor agreement with plant measurements and indicated the opposite trend to that seen on plant, with the lowest air flow case having the poorest collection efficiency.
Clearly, the simpler one-way coupling is not sufficient to predict either the collection efficiency or the correct trend with air flow rate.
7.4.3 Particle-Laden Flow: Two-Way Coupling
7.4.3.1 Flow
The axial, radial and tangential velocity profiles across a horizontal line close to the vortex finder inlet are shown in Figures 60 to 62. Five sets of data are presented in each figure:
a. Measurements on the University of Edinburgh 1/3 scale physical model - air only.
b. CFD predicted data for the University of Edinburgh 1/3 scale physical model – air only.
c. CFD predicted data for the existing classifier with one-way coupling – air only.
d. CFD predicted data for the existing classifier with two-way coupling of particles.
e. CFD predicted data for the alternative classifier with two-way coupling of particles.
The data are reported along a line between the mill centreline and the inner diameter of the mill body. To allow the different model geometric scales to be compared, the axial, radial and tangential velocity components are plotted against radial distance non-dimensionalised by the maximum radius (i.e. the mill body inner diameter) for each case.
The axial flow profile for each case is shown in Figure 60. Axial flow is defined as flow along the mill axis. The shape of the profile is similar for each case, with high upward velocities near the coal feed pipe, and an area of downward flow between the vortex finder and the classifier wall. There is a difference in the magnitude of the velocities between the scaled model (University of Edinburgh 1/3 scale physical model) and the full scale existing classifier. This is due to the operating conditions - the existing mill classifier was operated at a higher velocity than the physical model.
Radial flow profiles for each case are shown in Figure 61. The shape of the profiles is again similar in each case, with the existing classifier radial velocities higher than the physical model. In each case the highest radial velocity is seen at the vortex finder radius, with the two-way coupled CFD model producing the maximum radial velocity. The one-way coupled or ‘clean air’ case maximum radial velocity lies between those for the full scale existing classifier and the 1/3 scale physical model CFD predictions.

Report No: 35/03/042 Issue No.: 1
10 June 2003 Page 39 of 118 © Mitsui Babcock 2004
Tangential velocities peak near the coal feed pipe, Figure 62, and reduce toward the classifier wall. The profiles for each case follow the same pattern. Despite the difference in mass flow rate through the scaled and full-scale models, the tangential velocity within the classifier for the two-way coupled models (which include the influence of coal loading on the air flow pattern) are lower than the other cases. The ‘clean air’ existing classifier model has the strongest tangential component, the predictions for the scaled physical model are similar to the ‘clean air’ existing classifier model. The measurements on the scaled model fall between these two sets of data.
7.4.3.2 Existing Classifier Design
The plant measurements have provided particle size distribution data at the grinding zone exit, classifier inlet, classifier oversize return, and in the two pf pipes. The predictions have used the measured classifier inlet particle size distribution to predict the fractions of particles captured in the classifier (i.e. the oversize return) and escaping from it (i.e. the pf product).
Figure 63 presents the collection efficiency for the baseline air flow case. It is clear that the predicted particle collection efficiency is in good agreement with the measured values, when a shape factor of 0.7 is used. Figure 64 presents the measured and predicted particle size distributions for the baseline air flow case. The slope of the predicted particle size distribution line is 48o and that of the measured particle size distribution line is 45o. The following table summarises the predicted and measured values for the three particle sizes commonly used to define pf product particle size grading:
Particle Size Distribution (% w/w undersize)
Particle Size Predicted Measured
75 µm 46.3 58.6
150 µm 88.5 88.9
300 µm 99.0 97.3
It is clear from the table that the measurements and predictions agree well. Examining the Rosin-Rammler graph it is evident that there are differences in the gradings for the fine and coarse particle sizes. The predictions overestimate the particle collection efficiency for the fines and slightly underestimate the particle collection efficiency for the coarser particles.
• Effect of Shape Factor
Shape factor (F ) was shown to be an important parameter which affected the particle’s path through the classifier and therefore its fate (i.e. whether it is collected within the classifier or escapes as product). The shape factor was initially assumed to be 0.7 for the two-way coupling predictions. The sensitivity to shape factor was examined, and the results are summarised in the following table:

Report No: 35/03/042 Issue No.: 1
10 June 2003 Page 40 of 118 © Mitsui Babcock 2004
Collection Efficiency
Particle Size Measured F = 0.5 F = 0.7 F = 1.0
75 µm 1.78 9.4 9.7 10.2
150 µm 43.0 15.5 33.4 65.3
300 µm 100.0 85.6 99.5 100.0
These results support the choice of F=0.7, although a small increase in shape factor may be justifiable. All the models tend to overestimate collection efficiency for 75 µm particles.
• Effect of Air : Fuel Ratio
The classifier models were run for three different air flow rates:
o Baseline air flow
o Air flow 15% greater than baseline
o Air flow 15% less than baseline
The particle collection efficiency and product grading for each air flow were calculated. The following table summarises the product grading results for each case for three particle sizes:
Predicted Particle Size Distribution (% w/w undersize)
Particle Size -15% flow baseline flow +15% flow
75 µm 53.0 46.3 43.8
150 µm 93.8 88.5 85.0
300 µm 99.3 99.0 98.0
A clear trend can be seen in the data, predicted pf product fineness and classifier collection efficiency both decrease with increasing air flow rate. The poorest grading is seen with the highest air flow rate. In a real classifier, the effect will be more pronounced, since primary classification efficiency will also reduce with increasing air flow rate (i.e. classifier inlet fineness decreases with increasing air flow rate).
7.4.3.3 Alternative Classifier Design
The alternative classifier design was examined based on the same inlet air mass flow rate and particle size distribution as the existing classifier. Flow patterns are similar to those seen in the existing classifier.
The performance predictions for the alternative and existing classifiers are summarised in the table below.
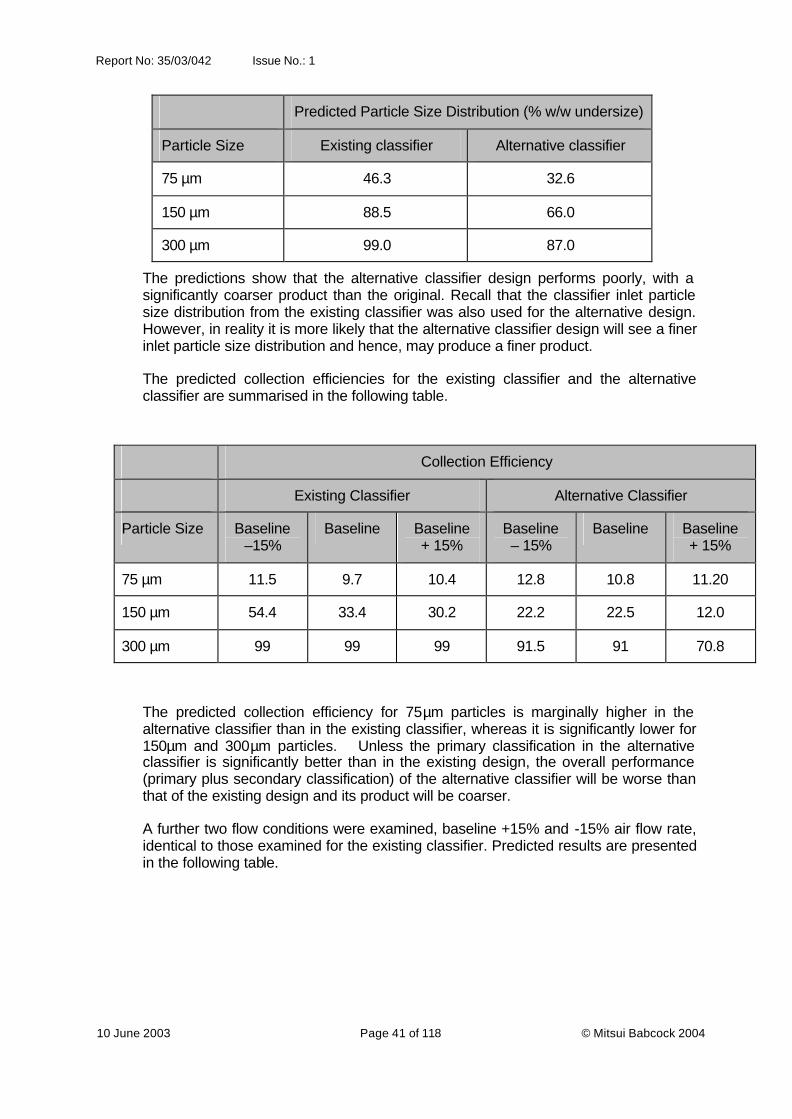
Report No: 35/03/042 Issue No.: 1
10 June 2003 Page 41 of 118 © Mitsui Babcock 2004
Predicted Particle Size Distribution (% w/w undersize)
Particle Size Existing classifier Alternative classifier
75 µm 46.3 32.6
150 µm 88.5 66.0
300 µm 99.0 87.0
The predictions show that the alternative classifier design performs poorly, with a significantly coarser product than the original. Recall that the classifier inlet particle size distribution from the existing classifier was also used for the alternative design. However, in reality it is more likely that the alternative classifier design will see a finer inlet particle size distribution and hence, may produce a finer product.
The predicted collection efficiencies for the existing classifier and the alternative classifier are summarised in the following table.
Collection Efficiency
Existing Classifier Alternative Classifier
Particle Size Baseline –15%
Baseline Baseline + 15%
Baseline – 15%
Baseline Baseline + 15%
75 µm 11.5 9.7 10.4 12.8 10.8 11.20
150 µm 54.4 33.4 30.2 22.2 22.5 12.0
300 µm 99 99 99 91.5 91 70.8
The predicted collection efficiency for 75µm particles is marginally higher in the alternative classifier than in the existing classifier, whereas it is significantly lower for 150µm and 300µm particles. Unless the primary classification in the alternative classifier is significantly better than in the existing design, the overall performance (primary plus secondary classification) of the alternative classifier will be worse than that of the existing design and its product will be coarser.
A further two flow conditions were examined, baseline +15% and -15% air flow rate, identical to those examined for the existing classifier. Predicted results are presented in the following table.
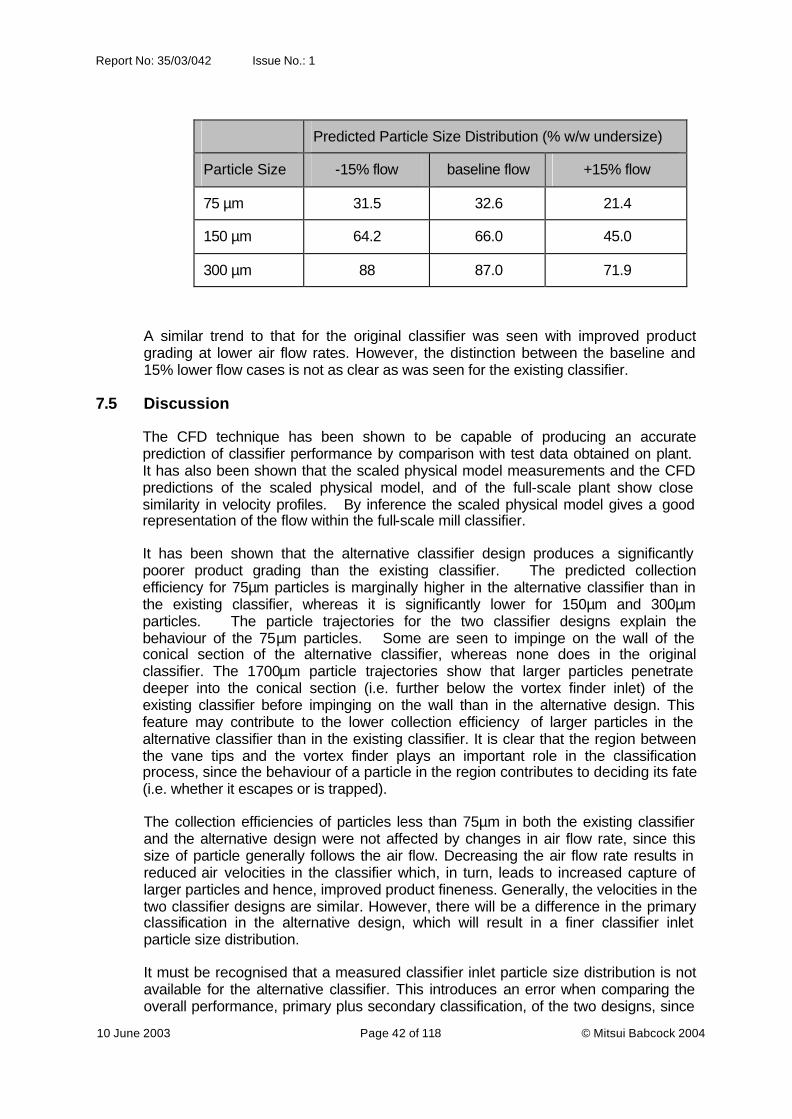
Report No: 35/03/042 Issue No.: 1
10 June 2003 Page 42 of 118 © Mitsui Babcock 2004
Predicted Particle Size Distribution (% w/w undersize)
Particle Size -15% flow baseline flow +15% flow
75 µm 31.5 32.6 21.4
150 µm 64.2 66.0 45.0
300 µm 88 87.0 71.9
A similar trend to that for the original classifier was seen with improved product grading at lower air flow rates. However, the distinction between the baseline and 15% lower flow cases is not as clear as was seen for the existing classifier.
7.5 Discussion
The CFD technique has been shown to be capable of producing an accurate prediction of classifier performance by comparison with test data obtained on plant. It has also been shown that the scaled physical model measurements and the CFD predictions of the scaled physical model, and of the full-scale plant show close similarity in velocity profiles. By inference the scaled physical model gives a good representation of the flow within the full-scale mill classifier.
It has been shown that the alternative classifier design produces a significantly poorer product grading than the existing classifier. The predicted collection efficiency for 75µm particles is marginally higher in the alternative classifier than in the existing classifier, whereas it is significantly lower for 150µm and 300µm particles. The particle trajectories for the two classifier designs explain the behaviour of the 75µm particles. Some are seen to impinge on the wall of the conical section of the alternative classifier, whereas none does in the original classifier. The 1700µm particle trajectories show that larger particles penetrate deeper into the conical section (i.e. further below the vortex finder inlet) of the existing classifier before impinging on the wall than in the alternative design. This feature may contribute to the lower collection efficiency of larger particles in the alternative classifier than in the existing classifier. It is clear that the region between the vane tips and the vortex finder plays an important role in the classification process, since the behaviour of a particle in the region contributes to deciding its fate (i.e. whether it escapes or is trapped).
The collection efficiencies of particles less than 75µm in both the existing classifier and the alternative design were not affected by changes in air flow rate, since this size of particle generally follows the air flow. Decreasing the air flow rate results in reduced air velocities in the classifier which, in turn, leads to increased capture of larger particles and hence, improved product fineness. Generally, the velocities in the two classifier designs are similar. However, there will be a difference in the primary classification in the alternative design, which will result in a finer classifier inlet particle size distribution.
It must be recognised that a measured classifier inlet particle size distribution is not available for the alternative classifier. This introduces an error when comparing the overall performance, primary plus secondary classification, of the two designs, since

Report No: 35/03/042 Issue No.: 1
10 June 2003 Page 43 of 118 © Mitsui Babcock 2004
the alternative classifier primary classification is believed to be more efficient than that of the existing classifier. By using the existing classifier inlet grading this potential improvement is not considered. The alternative classifier product grading may be better than the predictions suggest, given that they can only consider the secondary classification occurring in the classifier.
8. DEVELOPMENT OF IMPROVED DESIGN RULES
8.1 Introduction
A comparison of measured and predicted mill performance for the existing mill classifier was presented in the previous section. The methodology developed during that activity and the CFD simulation of the physical model has been applied here and the effect of the following modifications studied:
• vortex finder length
• vane design and number
• cylindrical section height
This section details the work carried out and the effect of the geometry changes on the performance of the classifier, by interrogation of predicted flow fields, collection efficiencies and product gradings.
8.2. Geometric Modifications Investigated
The geometric modifications investigated are summarised below. In all cases, classifier geometry is otherwise unchanged from the baseline classifier design.
1. Effect of Vortex Finder Length
• Vortex finder length (20% increase from baseline length).
• Vortex finder length (44% increase from baseline length).
2. Effect of Vane Design and Number
• 16 short flat plate vanes (for comparison with existing long ‘wedge’ shape vane design).
• 24 short flat plate vanes (to evaluate the effect of number of vanes).
• 24 short flat plate vanes, no leading edge.
• 24 short flat plate vanes, no trailing edge.
3. Effect of Cylindrical Section Height
• Cylindrical section height (61% increase on baseline mill classifier cylindrical section height).
• Cylindrical section height (equivalent to alternative classifier design cylindrical section height).

Report No: 35/03/042 Issue No.: 1
10 June 2003 Page 44 of 118 © Mitsui Babcock 2004
The selection of the parameters to be investigated was based on the findings of the Review of E Mill Classifier Process Data and Design Rules and the parameters changed in the alternative classifier design compared with the baseline classifier design.
The increased vortex finder length was aimed at reducing the bypassing of the classifier lower volume by the bulk flow.
The different vane designs modelled aimed to investigate the effect of the number of vanes and overhanging vanes versus fully constrained vanes on classifier performance. The need for such modelling had been identified in the Review of E Mill Classifier Process Data and Design Rules.
Sixteen short flat plate vanes had been used in a particular E mill classifier design and 24 short flat plate vanes had been specified in the alternative design.
The modelling of vanes with no leading edge was guided by an existing mill classifier vane design, which has a very short leading edge. The modelling of vanes with no trailing edge was guided by the fact that the vanes in two alternative classifier designs had relatively little overhang into the classifier volume and yet the classifiers performed well.
8.3 Results and Discussion
8.3.1 Vortex Finder Length
• Flow Patterns
Figure 65 shows velocity vectors for the variant vortex finder designs and baseline models. As vortex finder length increases, more of the flow becomes forced downwards into the inner body of the classifier. The flow pattern within the vortex finder itself suggests that the proportion of flow passing directly into the vortex finder (i.e. bypassing the lower regions of the classifier cone) may also be increasing. Contours of axial velocity provide evidence for the cause of this being the changing strength of recirculation brought about by increased radial velocity past the outer edge of the vortex finder, rather than increased mass flow. This is due to the constriction imposed on the volume available for flow by the increased vortex finder lengths.
Contour plots of tangential velocity show that the tangential velocity profile is made more uniform by an increase in vortex finder length. The strength of the swirling flow in the region below the vanes has also been reduced. It therefore appears that forcing the flow further into the classifier inner body has a dampening effect on its tangential momentum.
• Collection Efficiency and Product Grading
Collection efficiency versus particle size for the two vortex finder modifications and baseline classifier cases is presented in Figure 66. Relative to the baseline design, the collection efficiency for the 20% longer vortex finder is slightly poorer for all particle sizes, excepting those greater than 500 µm. Increasing the vortex finder length further (44% longer) improves the collection efficiency for particles between 125 and 300 µm. However, collection efficiency for the larger particles (>300µm) decreases substantially. This can be explained by consideration of the flow field. As the particles are being forced further down the inner body, the centrifugal force acting

Report No: 35/03/042 Issue No.: 1
10 June 2003 Page 45 of 118 © Mitsui Babcock 2004
on them, which has weakened, may not be sufficient to direct the particles to the cone to be captured. The enhanced capture of large particles by the 20% longer vortex finder design is most likely to be due to the imposed direction of flow to the cone. Increasing the vortex finder length by 44%, it is likely that, despite lower axial velocities in the vicinity of the mid-to-upper cone, the capture of very large particles is jeopardised by a lessened tangential force coupled with greater radial movement.
• Pressure Drops
The total pressure drop from model inlet to vortex finder is predicted to decrease as vortex finder length increases. Both increased vortex finder lengths lead to a total pressure gain of ~350Pa. An additional 100Pa is attained from vortex finder to model outlet with the extended vortex finders. These gains are considered to be a direct result of improved utilisation of the classifier volume. The reduced pressure drop of the 20% increased vortex finder length design while retaining the particle separation performance of the baseline design represents an improvement in overall classifier performance compared with the baseline design.
8.3.2 Vane Design and Number
A comparison between the geometries of the baseline classifier design and the two modified models featuring 16 and 24 flat plate vanes are presented in Figure 67. Note that the flat plate vanes are also considerably shorter than the wedge vanes. Figure 68 shows the change in vane geometry that arises when considering 24 flat plate vanes with no leading and no trailing edges. The pitch centre diameter (PCD) of the vane spindles for all cases was maintained as that of the baseline arrangement.
• Flow Patterns
The effect of changing vane design (long wedge to short flat plate) and number (16 to 24, flat plate design) on the gross flow pattern is shown in Figure 69. These plots draw attention to an increased passage of flow past the vortex finder in the upper section of the classifier inner body for the 16 flat plate vanes design. Contours of axial velocity substantiate this finding, with lower upward velocities being found within the lower conical section. The flow pattern obtained for 24 flat plate vanes is akin to that seen in the baseline design. The radial and tangential velocity profiles were alike for the three cases, although a tendency for the flow to move away from the cone and towards the centre of the classifier, with an associated lessening in tangential component, is apparent for the 16 vanes model.
Removing either the leading or trailing edge from the flat plate vane design has a considerable effect on the flow patterns within the classifier (Figure 70), with an increasing amount of flow avoiding the lower inner body. Profiles of axial, radial and tangential velocity confirm this effect, and the situation is most pronounced for the no trailing edge vane design. The significant lessening in strength of tangential velocity component is likely to have a major effect on classification performance.
• Collection Efficiency and Product Grading
The effect of changes to vane design and number on collection efficiency is shown in Figure 71. As a result of the shorter vane length, using vanes of the short flat plate design gives rise to a considerable loss in collection efficiency compared with the 16 long vanes of the original design.
Report No: 35/03/042 Issue No.: 1
10 June 2003 Page 46 of 118 © Mitsui Babcock 2004
Increasing the number of short flat plate design vanes from 16 to 24, whilst improving the collection efficiency by an appreciable extent, does not promote sufficient capture of larger particles. This serves as further evidence of the shortcoming caused by the change in vane length between the two designs.
Predicted collection efficiencies are shown for the flat plate vane design variations (i.e. no leading and no trailing edge) in Figure 72. Particle collection is very poor for the two designs, particularly where the vanes have no trailing edge.
• Pressure Drops
It can was found that the total pressure drop from model inlet to outlet is predicted to increase by 600Pa compared with the base case when an equal number of short flat plate vanes is used. This is due to an increased loss through the classifier inner body brought about by flow bypassing the classifier lower volume. Increasing the number of short flat plate vanes increases the total pressure drop still further, by 250Pa, due to further losses encountered through the vanes themselves. Total pressure drop from model inlet to outlet for the no leading or trailing edge cases is predicted to be considerably higher than baseline (additional losses of 1684 and 2007Pa, respectively). Thus, these designs are extremely inefficient.
8.3.3 Cylindrical Section Height
• Flow Patterns
From the velocity vectors shown in Figure 73, the effect of increasing cylindrical section height is to provide a greater volume for the flow to occupy within the inner body of the classifier, causing the velocity to lessen and allowing bias to the mid to upper region. Plots of axial and radial velocity substantiate this observation. As was the case with vortex finder length, there is a characteristic loss in tangential velocity within the classifier cone, corresponding to the loss in axial component.
• Collection Efficiency and Product Grading
Graphs of collection efficiency versus particle size are shown for the cylindrical section height variations and baseline classifier design cases in Figure 74. At the low particle sizes, the case featuring a cylindrical section height of 353 mm performs in a similar manner to the baseline (cylindrical section height 219 mm), with the 530 mm case showing a superior capture of particles. However, upward of 300µm, a major difficulty is evident, as the ability of the classifier to collect particles decreases with increasing particle size. The tangential velocity component of the incoming flow has been reduced to such an extent as to lead to inadequate removal of larger particles.
• Pressure Drops
The total pressure drop from model inlet to vortex finder and from model inlet to outlet is predicted to decrease when cylindrical section height increases. This is consistent with what was seen for an increase in vortex finder length. Total pressure drop is some 700-900Pa lower than for the baseline classifier design, representing a considerable pressure loss saving.

Report No: 35/03/042 Issue No.: 1
10 June 2003 Page 47 of 118 © Mitsui Babcock 2004
9. CFD SIMULATION OF PRIMARY CLASSIFICATION
9.1 Introduction
The methodologies developed during the project have been applied to the simulation of primary classification, and the effect of the following factors have been studied:
• classifier geometry
• PF loading
• particle release location
9.2 Mathematical Model
The primary zone model features the grinding rings and a grinding ball – the model does not simulate the rotary motion of the lower grinding ring nor of the grinding balls. The simulation of a 3-dimensional moving grid would exceed the technical and budgetary constraints of this project. The grinding elements are therefore modelled as static. The points of contact between the grinding ball and the top and bottom grinding rings have been simplified to decrease the necessary skewness of the computational cells in this region.
9.2.1 Model Set-up
The factors investigated under this activity are described below.
1. Effect of Classifier Geometry
• Baseline – standard design Figure 75 shows the modelled arrangement.
• Alternative design
Figure 76 illustrates the layout of the alternative geometry. In particular, the alternative design comprises an increased static classifier volume. This is achieved through the use of three different conical sections.
2. Effect of PF Loading
The plant trial results showed large variations in primary classification oversize return flow rates and hence, grinding zone exit flow rates. Consequently, three grinding zone exit particle flow rates were modelled.
• baseline
• 2 x baseline
• 3 x baseline
3. Effect of Particle Release Location
Two particle release positions were modelled to allow, in part, for the uncertainty in the particle behaviour local to the throat.
Report No: 35/03/042 Issue No.: 1
10 June 2003 Page 48 of 118 © Mitsui Babcock 2004
• Particles released in classifier throat
• Particles released at mill table level above throat.
9.3 Results and Discussion
9.3.1 Flow Patterns
Figure 77 presents contours of velocity magnitude for the baseline geometry and for the alternative classifier design. It is immediately apparent that the flow fields for the two arrangements display marked differences.
In both cases, the jet of air from the mill throat is evident. In both geometries this jet persists through the mill body and towards the upper classifier. Both geometries feature a pronounced recirculation in the region between the PA jet and the housing. However, in the case of the baseline geometry there is a significant recirculating zone between the top grinding ring and the classifier wall. It would be expected that this recirculation might discourage particles from escaping to the upper classifier. The proposed alternative geometry features no such recirculation, rather the volume of air above the top grinding ring and towards the centre of the mill body is stagnant. As a result of the increased volume of the primary classifier, the average velocity of the PA jet stream is lower in the proposed alternative geometry, which will result in larger particles not being carried to the classifier inlet.
The geometry of the lower classifier has a significant and tangible effect upon the velocity distribution in the mill body. Changes to the PF loading and injection location have no such effect upon the continuous phase.
9.3.2 Collection Efficiency and Product Grading
Baseline versus Alternative Geometry
Particle tracks were considered for each of the geometries examined at particle sizes of 36, 739 and 3327µm.
In comparing the trajectories of the 36µm particles, it is clear that both geometries allow the vast majority of the particles to travel through the primary classification zone and into the classifier proper. The particles are entrained within the jet stream and do not migrate into the regions of recirculating or stagnant gas.
The 739 µm particles behave differently in the two classifier geometries. In the baseline geometry, the particles remain entrained within the PA jet stream; however, they tend to strike the classifier outer surface before exiting the model. In the alternative geometry, the particles strike the classifier outer surface, but do not exit the model; instead they travel towards the classifier outer surface and from there – in the stagnant region of the gas – they are trapped on the grinding rings and on the mill table.
The 3327µm particles are trapped in both geometries, however, the manner in which they are trapped differs. In the baseline geometry, the particles impact upon the mill body before travelling towards the classifier wall. From here the particles travel through the recirculating region and down towards the grinding elements and mill table where they are trapped. In the alternative geometry, however, the particles strike the mill body and fall instantly out of the jet stream and are trapped upon the grinding elements.

Report No: 35/03/042 Issue No.: 1
10 June 2003 Page 49 of 118 © Mitsui Babcock 2004
Figure 78 shows the collection efficiency of each of the geometries. Little differentiation can be made between the baseline and alternative cases towards the smaller particle diameters, however the alternative geometry removes a far greater proportion of the largest particles, which would be considered beneficial as it is these particles that have the most detrimental influence on carbon burnout.
Effect of PF Loading
Particle tracks were studied for each of the PF loadings (baseline, 2 x baseline and 3 x baseline) at particle sizes of 36, 739 and 3327µm respectively in the baseline geometry. For the 36µm particles at baseline and 3 x baseline loadings, little effect of mass loading is discernible. In these cases, the particles are entrained within the PA jet and escape promptly through the model exit. However, the 2 x baseline loading shows some recirculation of the PF particles in the elutriation zone.
The 739µm particles undergo similar trajectories for each of the mass loadings. The particles are entrained within the PA jet, until they strike the mill body. The majority of the particles then escape through the model exit, however, a number strike the classifier outer surface and drop down towards the mill table and grinding elements where they are trapped.
Similarities are evident between the trajectories of the 3327µm particles. For each of the mass loadings, the particles are entrained within the PA jet before striking the mill body. The particles travel across towards the classifier outer surface, upon collision they fall towards the grinding elements and mill table.
Figure 79 shows the collection efficiencies for the cases comparing PF loading. The data for each of the mass loadings is, as expected, very similar.
Effect of Particle Release Location
The effects of the PF particle release location upon classification performance in the baseline and modified geometries were investigated. The particle release surface was, in the previous cases, set as the inlet to the model at the mill throat. A second location was examined, specifically, a horizontal plane at the same elevation as the mill table/bottom grinding ring lip.
Figure 80 shows the collection efficiencies of each of the cases. It is clear from this figure that, for both injection locations, the proposed alternative geometry offers improved particle collection efficiency. It is also evident that the particle injection location has a substantial effect upon the predicted performance of the primary classifier region. The predicted collection efficiency for mill table level particle release is greater than that for model inlet particle release for both geometries.
10. CONCLUSIONS
The following conclusions have been drawn from the work described in this report.
Review of Design Methods and Plant Data:
• Residence time and centrifugal force to drag force ratio are not the sole factors that affect the sizing of a classifier for a particular duty.
• The performance of a specific classifier plant demonstrates that coarse particles, greater than 300µm, can be eliminated from the mill product from a vertical

Report No: 35/03/042 Issue No.: 1
10 June 2003 Page 50 of 118 © Mitsui Babcock 2004
spindle mill fitted with a static classifier, albeit an abnormally tall classifier. This result offers benefits on new projects where a steep particle size distribution is required and the increased cost of installing rotary classifiers harms overall competitiveness.
Physical Model Testing
• Three different flow regimes were identified within the range of vane angles from 0º to 60º away from the radial in the Mk1 classifier design. Up to 15º the flow is predominantly axisymmetric; between 30º and 50º, a central core dominated flow regime exists; above 55º the flow is swirl dominated. The central core dominated flow regime is observed in both classifier designs and is characterised by a central core of upward moving flow around the particle inlet tube with a high proportion of flow short-circuiting the classifier volume and rapidly swirling flow throughout the entire classifier.
• The aerodynamics in both Mk 1 and Mk 2 classifier models, at angles between 30º and 50º, are characterised by two distinct regions: in the main conical volume, the flow is cyclonic, while above the flow is highly three-dimensional with significant flow passing directly from the vanes to the vortex finder.
• Between vane angles of 30º and 50º the principal effect of the vane angle is to alter the tangential velocity magnitude, but not the velocity distribution, everywhere in both classifier models. The tangential velocity magnitude is approximately proportional to the vane angle.
• The mean velocity within the classifier is axisymmetric. However, frequency analysis of the instantaneous tangential velocity measurements in the Mk 1 model suggests the presence of a precessing vortex core, which becomes more defined with increasing vane angle. This implies that caution is required in comparing the velocity data, in particular the turbulence measurements, with those from computational simulations, which do not take the presence of a low-frequency oscillation into account.
• The design changes between the Mk 1 and Mk 2 classifier models (different vane design, number of vanes, vortex finder lengths and cylindrical section lengths) do not appear to cause any significant changes in the velocity distribution and turbulent kinetic energy.
• The minimum pressure drop across the classifier model appears to occur at a vane angle of 40º. Increasing or decreasing the vane angle from this setting causes the pressure drop to increase.
• The pressure drop across the Mk2 classifier model was smaller than that measured in the Mk1 classifier model.
• At a vane angle of 40º, the reject ratio in the Mk 2 classifier is approximately 33% greater than in the Mk 1 classifier model. The reject ratio decreases slightly with increasing particle loading in both Mk 1 and Mk 2 models.
• The particle reject ratio increases with increasing vane angle in both Mk 1 and M2 classifier models.
• The particle flow rate (or loading) did not have any consistent effect on the particle size distribution of samples taken from the rejects or the cyclone.

Report No: 35/03/042 Issue No.: 1
10 June 2003 Page 51 of 118 © Mitsui Babcock 2004
• The effects of vane angle on the cyclone sample particle size distributions at constant particle loading in the Mk 1 and Mk 2 classifier models are reasonably consistent. The coarsest distribution is produced at a vane angle of 30º. The particle size distributions for 40º and 45º vane angles are reasonably similar, although in the Mk1 model it appears that a vane angle of 40º produces the finest product, while in the Mk2 model this occurs at a vane angle of 45º. In the Mk1 model, the effects of vane angle on the rejects particle size distributions are consistent with the cyclone samples. However, in the Mk2 model, a consistent trend is only observed at two out of the three particle loadings investigated.
• There does not appear to be a significant difference in the cyclone and reject sample particle size distributions between the Mk1 and Mk2 classifier model designs. However, observation of the high loading PSDs indicates that the Mk1 is generally more efficient.
CFD Simulation of the Physical Model
• It was shown that the CFD model was able to reproduce the isothermal flow field in the physical model with a reasonable degree of accuracy. As anticipated, predictions of axial and radial velocity compared most favourably to the measured data, with the greatest errors arising in the prediction of tangential velocity and kinetic energy.
• The kω turbulence model was selected for subsequent modelling work on the bases of both accuracy of prediction and computational efficiency.
• Prediction of the flow field within the classifier was, in the main, shown to be grid independent. It is, however, recommended that future classifier model meshes feature additional grid refinement around the vanes and vortex finder.
• The applicability of periodic conditions was investigated using half (180°) and full (360°) models. It was concluded that the inclusion of the outlet geometry did not cause the flow field to differ substantially from that gained via the 22.5° periodic slice model. The gains to be made in computational efficiency also advocate the continued use of such models.
• As vane angle was increased (from 30°, through 40°, to 45°) the inner classifier flow field changed considerably. The amount of flow bypassing the inner body decreases as the increasingly swirled flow occupies a greater volume. Measured and predicted data sets were shown to agree reasonably well.
• Further vane angle model analysis was carried out in the form of pressure drop comparison. The CFD models correctly predicted decreasing total pressure drop with increasing vane angle, in line with physical model measurements.
• Comparison of predicted flow fields to physical model flow visualisation images captured on video revealed good agreement. As expected, despite greatly reduced mass flows, the flow fields showed little change from design conditions.
• Predicted pressure drops for the flow visualisation study models were shown to be consistent with turbulent flow theory.
• Increasing vane angle on the MkI physical and mathematical models produced the anticipated effect of greatly improved collection efficiency and thus finer product grading.

Report No: 35/03/042 Issue No.: 1
10 June 2003 Page 52 of 118 © Mitsui Babcock 2004
• Both the measured and predicted data implied that changing from the MkI to the MkII design caused a slight shortfall in classifier performance.
• Measured and predicted rejects particle size gradings were seen to compare favourably for the cases examined. The discrepancy between the product gradings for the two scenarios (a coarser grading was found from the physical model testing) was thought to arise, in the main, from the carryover of fines from the cyclone installed downstream of the classifier outlet. This factor would also account for the anomalies between measured and predicted rejects ratios.
• CFD modelling has shown its capability to predict trends with a reasonable degree of accuracy. However, in order to attain the most quantitatively accurate predictions, be it for validation or sensitivity study purposes, particular attention must be paid to both modelling inputs and the details of physical model or plant operation.
Plant Testing
• Of the four particulate material sample types collected, the grinding zone exit samples are the coarsest and the PF samples are the finest. The classifier inlet and classifier oversize return samples have similar, intermediate, fineness values. The classifier inlet material is slightly finer than the classifier oversize return material. The results imply that there is a high recycle rate of partially ground material within the mill.
• PF fineness decreases with increasing % mill capacity and increasing PA flow rate at a particular % mill capacity. %<75µm decreases more steeply than %<300µm.
• Grinding zone exit material fineness decreases with increasing % mill capacity, but at a particular % mill capacity, is essentially constant over a range of PA flow rates. %<75µm decreases with increasing % mill capacity less steeply than %<300µm.
• Classifier inlet material fineness decreases with increasing % mill capacity and increasing PA flow rate at a particular % mill capacity. %<75µm decreases less steeply than %<300µm.
• Classifier oversize return material fineness decreases with increasing % mill capacity and increasing PA flow rate at a particular % mill capacity. %<75µm decreases less steeply than %<300µm.
• PF Rosin-Rammler slope decreases with increasing % mill capacity. There is inconclusive evidence that it decreases with increasing PA flow rate at a particular % mill capacity.
• Classifier inlet and classifier oversize return stream mass flow rates and recycle ratios tend to increase with increasing % mill capacity and increasing PA flow rate at a particular % mill capacity.
• No trend was evident in the behaviour of grinding zone exit and primary classification return stream mass flow rates with increasing % mill capacity and increasing PA flow rate at a particular % mill capacity.

Report No: 35/03/042 Issue No.: 1
10 June 2003 Page 53 of 118 © Mitsui Babcock 2004
• The mean classifier recycle ratio (mass flow rate classifier oversize return : mass flow rate PF) at 100% mill capacity (i.e. mean of values at six different PA flow rates) was calculated to be 4.8 or 6.7, depending on the calculation method used. The average value from the two calculation methods is 5.8.
CFD Simulation of Plant Tests
• The CFD technique was found to be capable of producing an accurate prediction of classifier performance by comparison with test data obtained on plant. It was also shown that the scaled physical model measurements and the CFD predictions of the scaled physical model, and of the full-scale plant show close similarity in velocity profiles. By inference, the scaled physical model gives a good representation of the flow within the full-scale mill classifier.
• Two-way coupling of the continuous and particulate phases was required to achieve good predictive performance, due primarily to particle concentration. Two-way coupling predicted the correct trend of particle collection efficiency decreasing with increasing air flow rate.
• A realistic particle shape factor (0.7) gave good agreement of particle collection efficiency in the existing classifier compared with plant data collected during the project.
• One-way coupling gave unrealistic predictions. Particle collection efficiency increased with increasing air flow rate, a result contrary to plant data. Moreover, qualitative agreement with plant data was only achieved when an unrealistic particle shape factor (0.5) was used.
• The alternative classifier particle collection efficiencies were predicted to be worse than those of the existing classifier. It must be recognised that a measured classifier inlet particle size distribution is not available for the alternative classifier. This introduces an error when comparing the overall performance, primary plus secondary classification, of the two designs, since the alternative classifier primary classification is believed to be more efficient than that of the existing classifier due to the lower air velocities above the spider.
Classifier Design
• The analysis undertaken identifies the effects on classifier performance of changes to individual classifier geometric parameters. Previous, often spurious, claimed causes of improvement in classifier performance have been clouded by several geometric parameters having been changed at the same time.
• Increasing classifier vortex finder length by 20% had a marginal effect on performance, an improved top end grading suggesting that some benefit could be gained. Although a lessening of tangential momentum arises from this modification, larger particles are captured as particulate is directed to the cone. Increasing vortex finder length by an additional 20% produced adverse performance, with poorer collection predicted for the larger size ranges as further extension significantly reduces tangential momentum, encouraging bypassing of the larger particles.
• The reduced pressure drop (approximately 350Pa reduction) of the 20% increased vortex finder length design, while retaining the particle separation

Report No: 35/03/042 Issue No.: 1
10 June 2003 Page 54 of 118 © Mitsui Babcock 2004
performance of the baseline design, represents an improvement in overall classifier performance compared with the baseline classifier design.
• Changing the design of the vanes from long wedge to short flat plate resulted in inferior classification performance. The lack of coverage by 16, and to a lesser extent 24, short flat plate vanes was found to have a detrimental influence on collection efficiency and thus product grading.
• Exclusion of the leading or trailing edges of the flat plate vanes exaggerated the issue of a lack of guidance of the flow, the omission of the trailing edges leading to particularly poor performance.
• Increasing cylindrical section height gave a collection efficiency profile similar to that of the baseline mill classifier for particles sizes less than 300µm. A further increase led to improved collection for particles in this range, due to lower velocities within the inner body of the classifier. However, reducing the controlling factor of classification, the tangential velocity component, meant inadequate removal of larger particles.
• Predicted pressure drops were consistent in showing a sizeable increase (500-2000Pa) for the vane modifications, which demonstrated a lack of classifier volume utilisation.
• The optimum classifier design was defined as being either the baseline arrangement or the arrangement featuring a vortex finder length extension of 20% relative to the baseline.
• The results of the work have dispelled several of the myths surrounding the effects of classifier geometric parameters on performance. They provide guidance regarding those geometric parameters whose variation may be used to improve classifier performance.
Primary Classification
• The predicted performance of the primary classification with the alternative classifier geometry was significantly better than that of the baseline case. Whilst the behaviour of the smaller particles was similar in both geometries, the larger particles simulated were more readily trapped in the alternative geometry.
• Varying the mass loading of PF to the primary classification zone had little or no effect on the predicted primary classification performance.
• Varying the injection location for the PF particles had a sizeable effect on the predicted performance of the primary classification process. The predicted collection efficiency for mill table level particle release is greater than that for model inlet particle release for both geometries. However, the main conclusion was the same for both injection locations considered.
11. RECOMMENDATIONS FOR FURTHER WORK
The following work is recommended to improve the understanding of the effects of classifier geometry and coal specific gravity on classifier performance and develop new design rules:

Report No: 35/03/042 Issue No.: 1
10 June 2003 Page 55 of 118 © Mitsui Babcock 2004
1. The effects of classifier inlet detail design on classifier performance should be further investigated using CFD modelling. The parameters to be investigated should include:
• Intermediate vane trailing edge lengths
• Vane trailing edge angle compared with flat vanes at increased angle.
• Vane profile
• Vane spindle pitch circle diameter (PCD)
• Classifier/vane flange width
2. The effects of low specific gravity coals on classifier performance should be assessed through CFD modelling.
3. The existing and alternative classifier designs should be modelled using the respective predicted primary classification product gradings as inlet gradings. These models would demonstrate the overall performance of the two classifier designs.
4. Optimised classifier designs and rules for their specification should be developed.
12. ACKNOWLEDGEMENTS
Mitsui Babcock and the University of Edinburgh acknowledge the financial assistance of the DTI Cleaner Coal Technology R and D Programme.
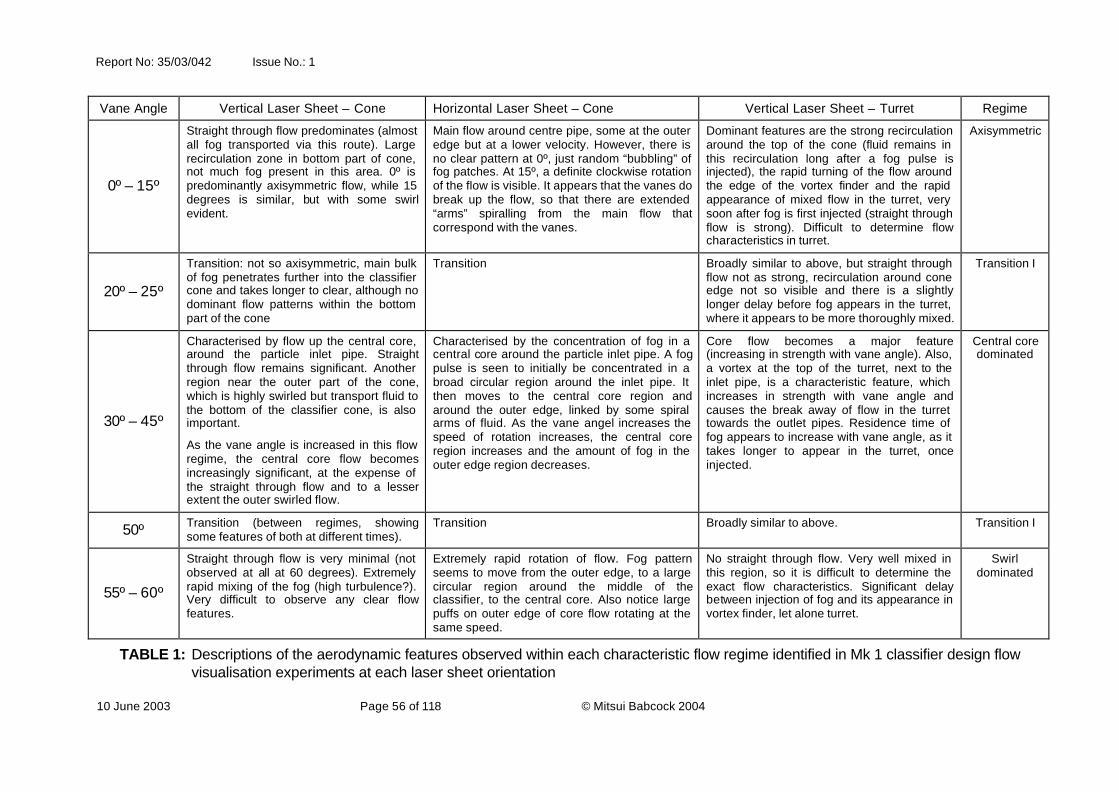
Report No: 35/03/042 Issue No.: 1
10 June 2003 Page 56 of 118 © Mitsui Babcock 2004
Vane Angle Vertical Laser Sheet – Cone Horizontal Laser Sheet – Cone Vertical Laser Sheet – Turret Regime
0º – 15º
Straight through flow predominates (almost all fog transported via this route). Large recirculation zone in bottom part of cone, not much fog present in this area. 0º is predominantly axisymmetric flow, while 15 degrees is similar, but with some swirl evident.
Main flow around centre pipe, some at the outer edge but at a lower velocity. However, there is no clear pattern at 0º, just random “bubbling” of fog patches. At 15º, a definite clockwise rotation of the flow is visible. It appears that the vanes do break up the flow, so that there are extended “arms” spiralling from the main flow that correspond with the vanes.
Dominant features are the strong recirculation around the top of the cone (fluid remains in this recirculation long after a fog pulse is injected), the rapid turning of the flow around the edge of the vortex finder and the rapid appearance of mixed flow in the turret, very soon after fog is first injected (straight through flow is strong). Difficult to determine flow characteristics in turret.
Axisymmetric
20º – 25º
Transition: not so axisymmetric, main bulk of fog penetrates further into the classifier cone and takes longer to clear, although no dominant flow patterns within the bottom part of the cone
Transition Broadly similar to above, but straight through flow not as strong, recirculation around cone edge not so visible and there is a slightly longer delay before fog appears in the turret, where it appears to be more thoroughly mixed.
Transition I
30º – 45º
Characterised by flow up the central core, around the particle inlet pipe. Straight through flow remains significant. Another region near the outer part of the cone, which is highly swirled but transport fluid to the bottom of the classifier cone, is also important.
As the vane angle is increased in this flow regime, the central core flow becomes increasingly significant, at the expense of the straight through flow and to a lesser extent the outer swirled flow.
Characterised by the concentration of fog in a central core around the particle inlet pipe. A fog pulse is seen to initially be concentrated in a broad circular region around the inlet pipe. It then moves to the central core region and around the outer edge, linked by some spiral arms of fluid. As the vane angel increases the speed of rotation increases, the central core region increases and the amount of fog in the outer edge region decreases.
Core flow becomes a major feature (increasing in strength with vane angle). Also, a vortex at the top of the turret, next to the inlet pipe, is a characteristic feature, which increases in strength with vane angle and causes the break away of flow in the turret towards the outlet pipes. Residence time of fog appears to increase with vane angle, as it takes longer to appear in the turret, once injected.
Central core dominated
50º Transition (between regimes, showing some features of both at different times).
Transition Broadly similar to above. Transition I
55º – 60º
Straight through flow is very minimal (not observed at all at 60 degrees). Extremely rapid mixing of the fog (high turbulence?). Very difficult to observe any clear flow features.
Extremely rapid rotation of flow. Fog pattern seems to move from the outer edge, to a large circular region around the middle of the classifier, to the central core. Also notice large puffs on outer edge of core flow rotating at the same speed.
No straight through flow. Very well mixed in this region, so it is difficult to determine the exact flow characteristics. Significant delay between injection of fog and its appearance in vortex finder, let alone turret.
Swirl dominated
TABLE 1: Descriptions of the aerodynamic features observed within each characteristic flow regime identified in Mk 1 classifier design flow visualisation experiments at each laser sheet orientation

Report No: 35/03/042 Issue No.: 1
10 June 2003 Page 57 of 118 © Mitsui Babcock 2004
Note: Sketch shows on the left hand side, a typical classifier as installed on the majority of E mills supplied and on the right hand side, an alternative classifier design.
FIGURE 1: Sketch of Typical E Mill Classifier compared with Alternative E Mill Classifier Design
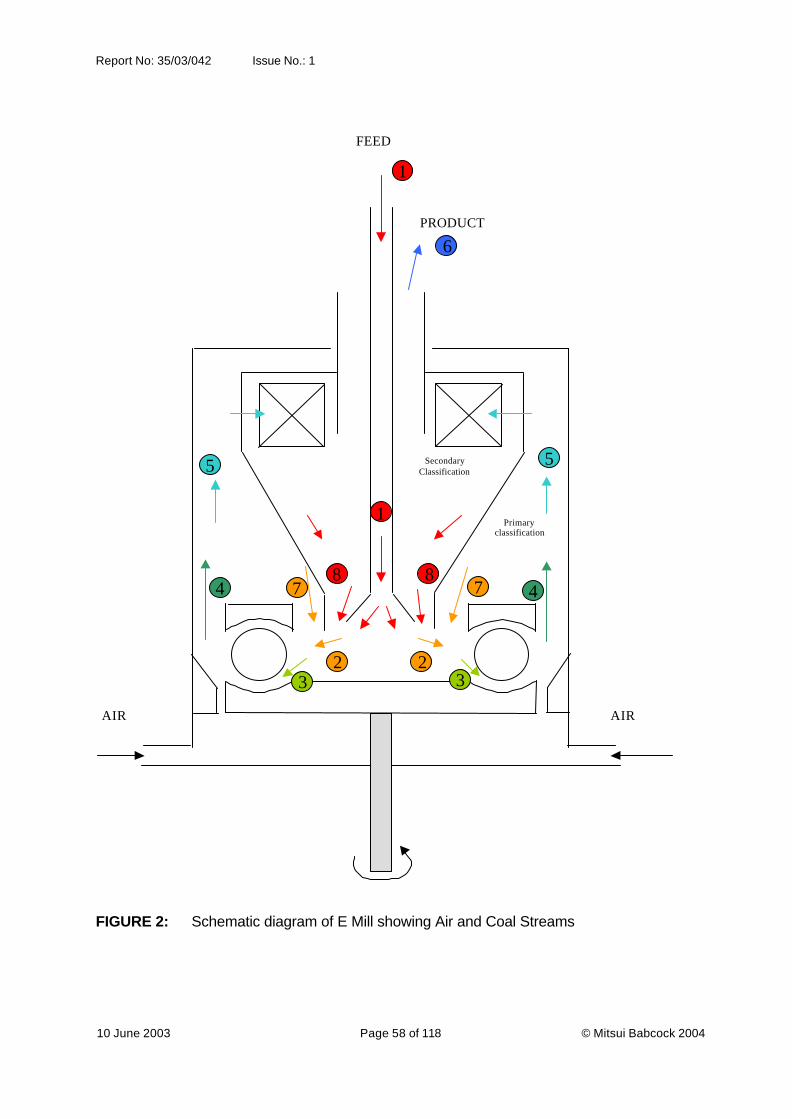
Report No: 35/03/042 Issue No.: 1
10 June 2003 Page 58 of 118 © Mitsui Babcock 2004
FIGURE 2: Schematic diagram of E Mill showing Air and Coal Streams
FEED
PRODUCT
SecondaryClassification
Primaryclassification
AIR AIR
5
7
32
5
8 8
1
1
6
47
32
4
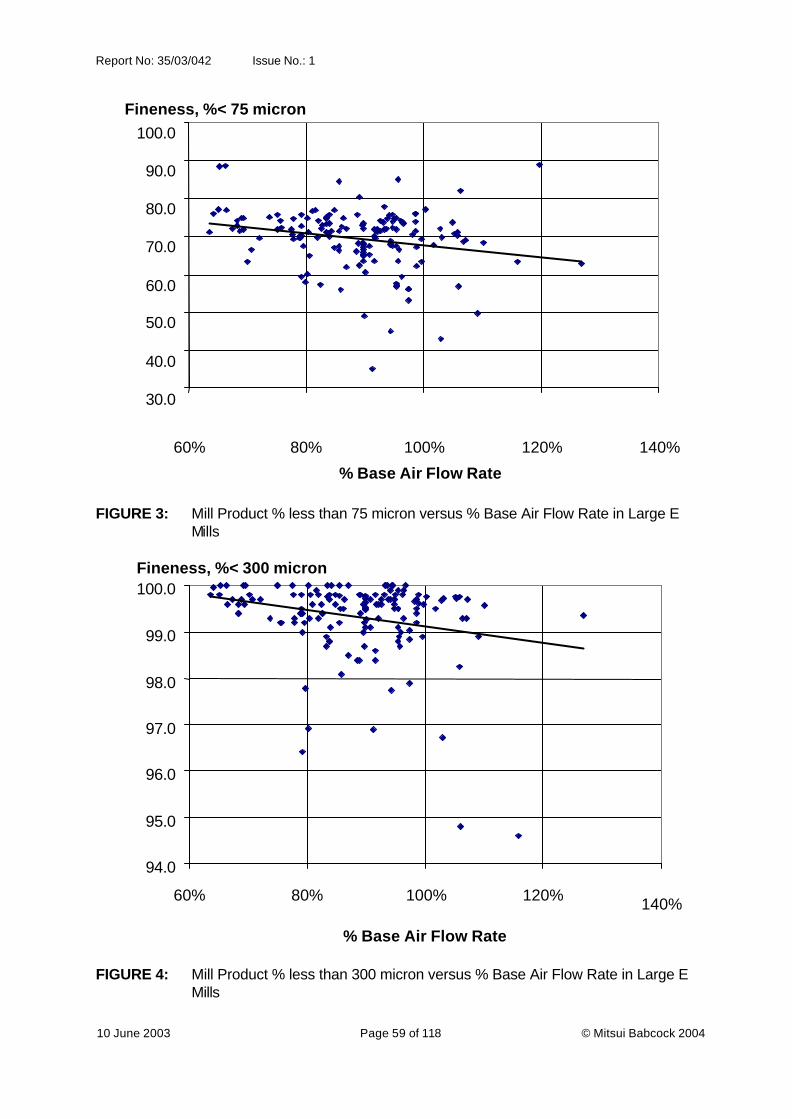
Report No: 35/03/042 Issue No.: 1
10 June 2003 Page 59 of 118 © Mitsui Babcock 2004
FIGURE 3: Mill Product % less than 75 micron versus % Base Air Flow Rate in Large E Mills
FIGURE 4: Mill Product % less than 300 micron versus % Base Air Flow Rate in Large E Mills
30.0
40.0
50.0
60.0
70.0
80.0
90.0
100.0
60% 80% 100% 120% 140%
% Base Air Flow Rate
Fineness, %< 75 micron
94.0
95.0
96.0
97.0
98.0
99.0
100.0
60% 80% 100% 120% 140%
% Base Air Flow Rate
Fineness, %< 300 micron
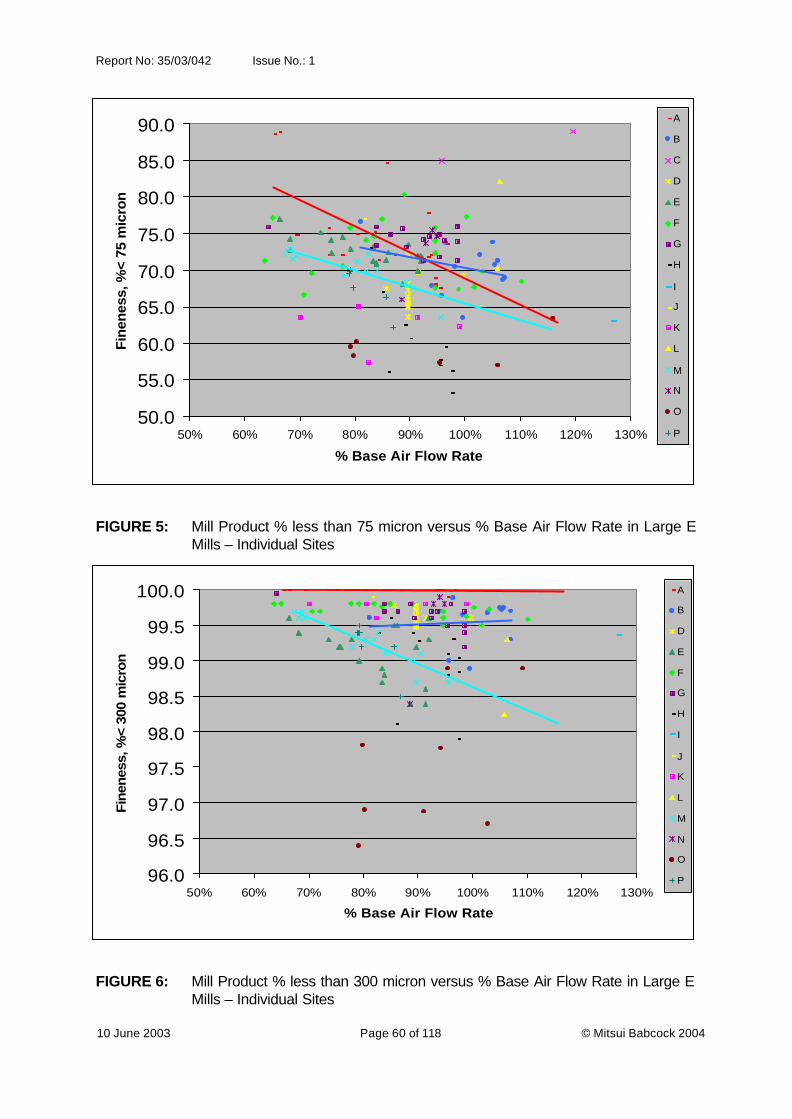
Report No: 35/03/042 Issue No.: 1
10 June 2003 Page 60 of 118 © Mitsui Babcock 2004
FIGURE 5: Mill Product % less than 75 micron versus % Base Air Flow Rate in Large E Mills – Individual Sites
FIGURE 6: Mill Product % less than 300 micron versus % Base Air Flow Rate in Large E Mills – Individual Sites
50.0
55.0
60.0
65.0
70.0
75.0
80.0
85.0
90.0
50% 60% 70% 80% 90% 100% 110% 120% 130%
% Base Air Flow Rate
Fin
enes
s, %
< 75
mic
ron
A
B
C
D
E
F
G
H
I
J
K
L
M
N
O
P
96.0
96.5
97.0
97.5
98.0
98.5
99.0
99.5
100.0
50% 60% 70% 80% 90% 100% 110% 120% 130%
% Base Air Flow Rate
Fin
enes
s, %
< 30
0 m
icro
n
A
B
D
E
F
G
H
I
J
K
L
M
N
O
P
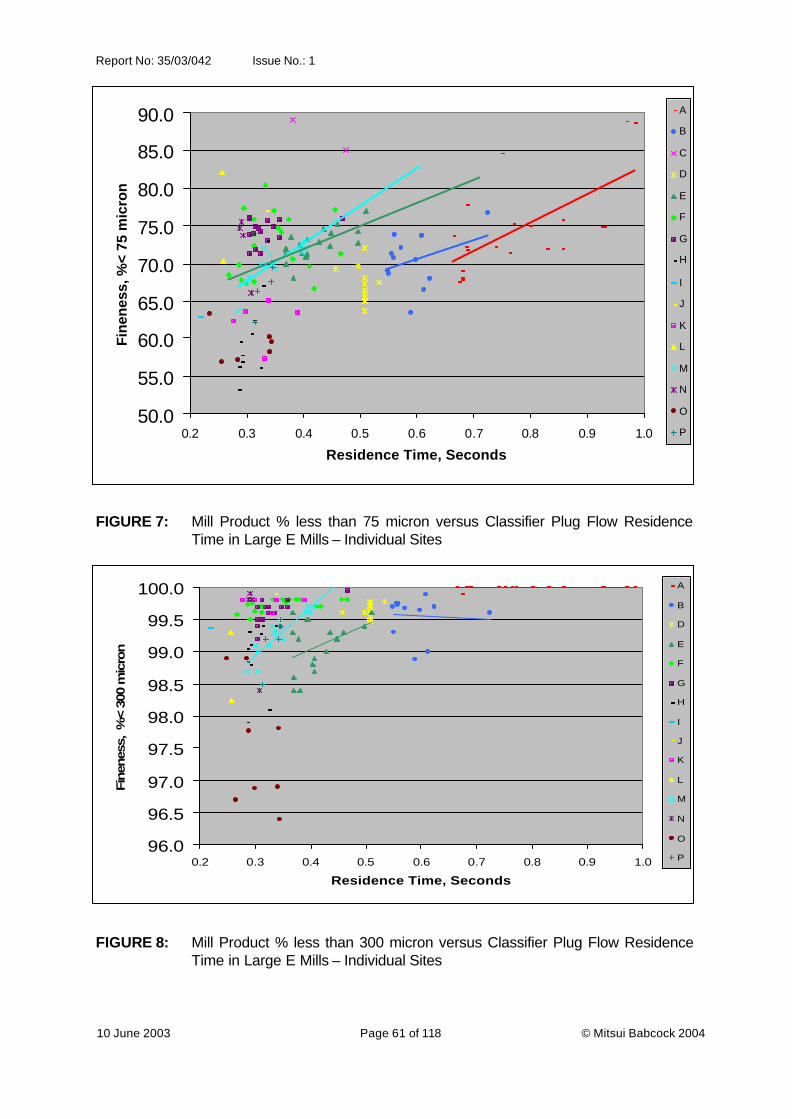
Report No: 35/03/042 Issue No.: 1
10 June 2003 Page 61 of 118 © Mitsui Babcock 2004
FIGURE 7: Mill Product % less than 75 micron versus Classifier Plug Flow Residence Time in Large E Mills – Individual Sites
FIGURE 8: Mill Product % less than 300 micron versus Classifier Plug Flow Residence Time in Large E Mills – Individual Sites
50.0
55.0
60.0
65.0
70.0
75.0
80.0
85.0
90.0
0.2 0.3 0.4 0.5 0.6 0.7 0.8 0.9 1.0
Residence Time, Seconds
Fin
enes
s, %
< 75
mic
ron
A
B
C
D
E
F
G
H
I
J
K
L
M
N
O
P
96.0
96.5
97.0
97.5
98.0
98.5
99.0
99.5
100.0
0.2 0.3 0.4 0.5 0.6 0.7 0.8 0.9 1.0
Residence Time, Seconds
Fin
enes
s, %
< 30
0 m
icro
n
A
B
D
E
F
G
H
I
J
K
L
M
N
O
P

Report No: 35/03/042 Issue No.: 1
10 June 2003 Page 62 of 118 © Mitsui Babcock 2004
FIGURE 9: Mill Product % less than 75 micron versus % Mill Capacity in Large E Mills – Individual Sites
FIGURE 10: Mill Product % less than 300 micron versus % Mill Capacity in Large E Mills – Individual Sites
50.0
55.0
60.0
65.0
70.0
75.0
80.0
85.0
90.0
20% 30% 40% 50% 60% 70% 80% 90% 100% 110% 120%
% Mill Capacity - Corrected for HGI
Fin
enes
s, %
< 75
mic
ron
A
B
C
D
E
F
G
H
I
J
K
L
M
N
O
P
96.0
96.5
97.0
97.5
98.0
98.5
99.0
99.5
100.0
50% 60% 70% 80% 90% 100% 110% 120% 130%
% Mill Capacity - Corrected for HGI
Fin
enes
s, %
< 30
0 m
icro
n
A
B
C
D
E
F
G
H
I
J
K
L
M
N
O
P
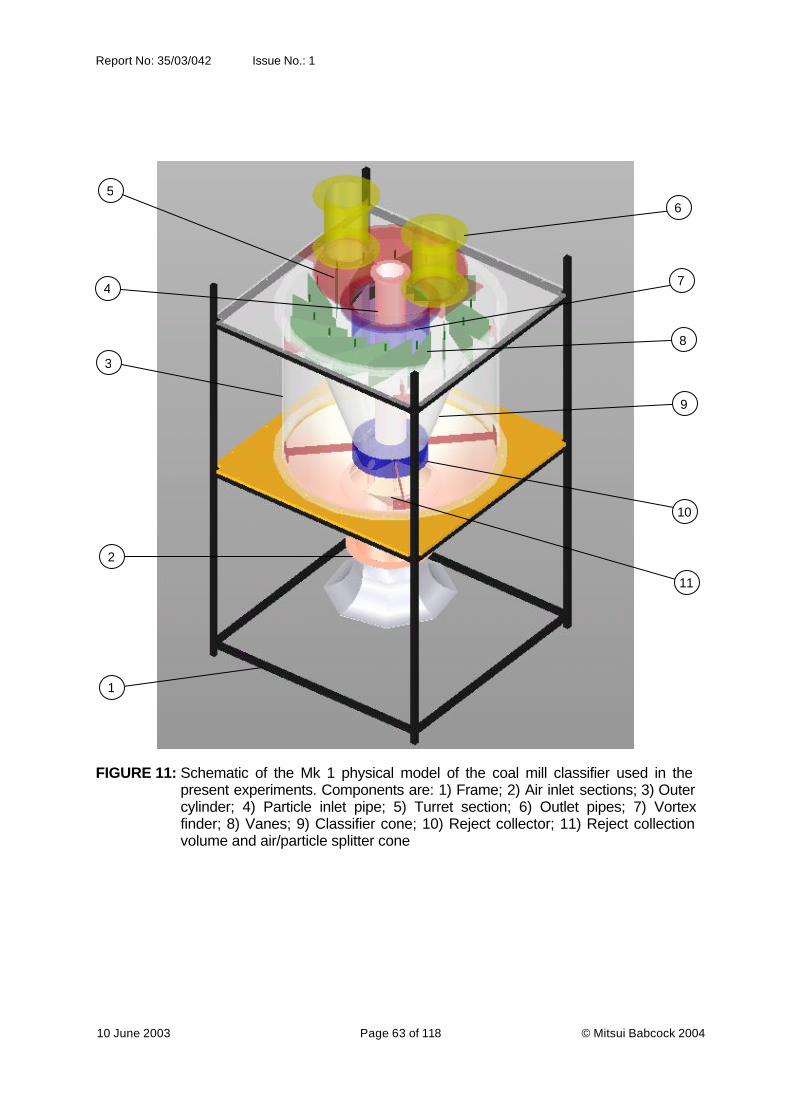
Report No: 35/03/042 Issue No.: 1
10 June 2003 Page 63 of 118 © Mitsui Babcock 2004
FIGURE 11: Schematic of the Mk 1 physical model of the coal mill classifier used in the present experiments. Components are: 1) Frame; 2) Air inlet sections; 3) Outer cylinder; 4) Particle inlet pipe; 5) Turret section; 6) Outlet pipes; 7) Vortex finder; 8) Vanes; 9) Classifier cone; 10) Reject collector; 11) Reject collection volume and air/particle splitter cone
11
10
9
8
7
6
1
2
3
4
5
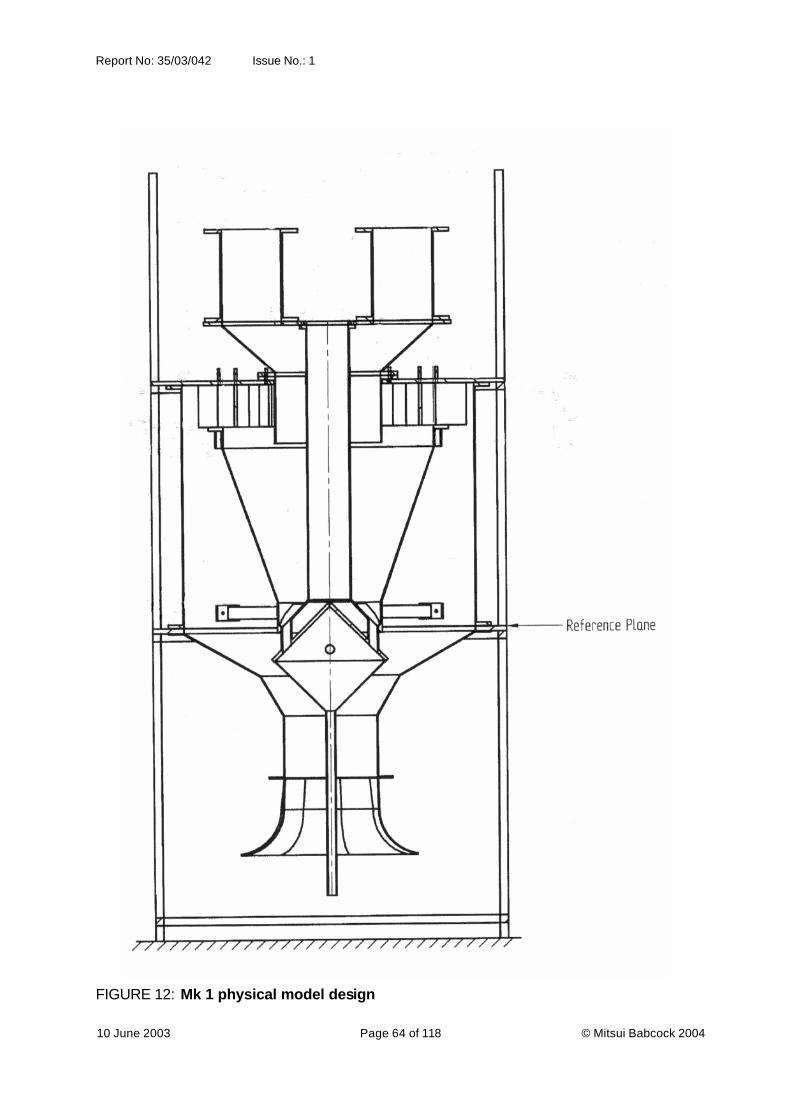
Report No: 35/03/042 Issue No.: 1
10 June 2003 Page 64 of 118 © Mitsui Babcock 2004
FIGURE 12: Mk 1 physical model design

Report No: 35/03/042 Issue No.: 1
10 June 2003 Page 65 of 118 © Mitsui Babcock 2004
FIGURE 13: Mk 2 physical model design
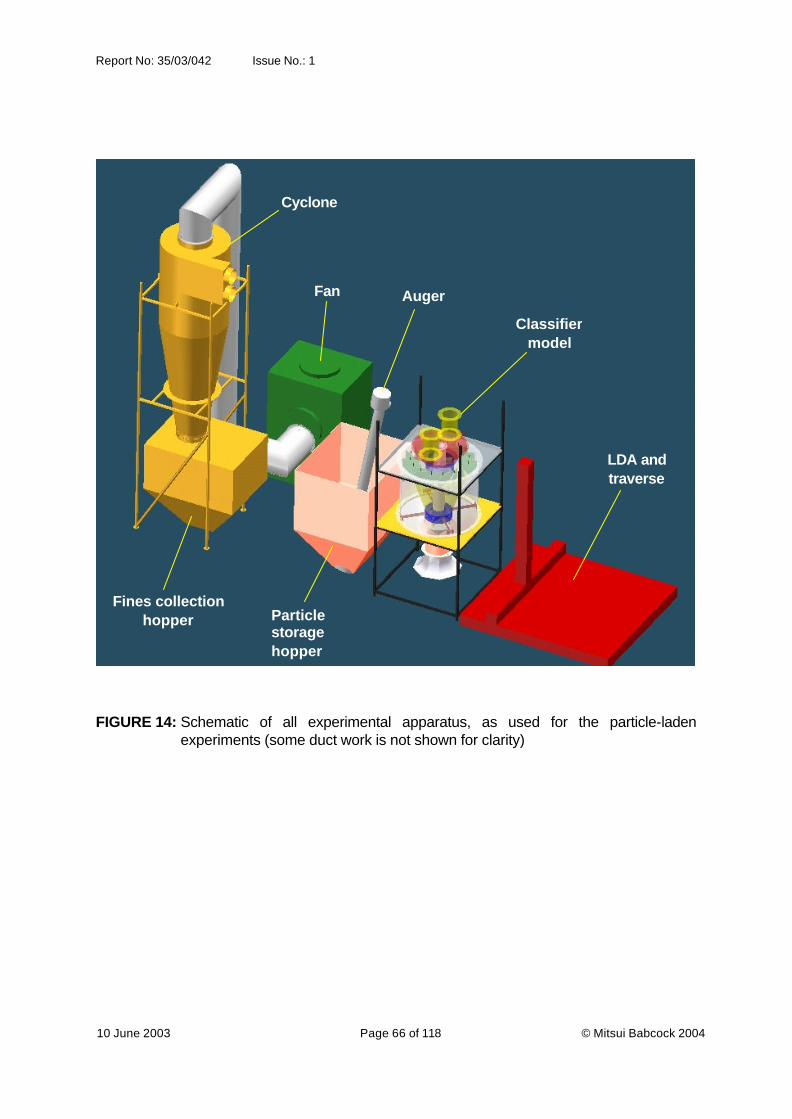
Report No: 35/03/042 Issue No.: 1
10 June 2003 Page 66 of 118 © Mitsui Babcock 2004
FIGURE 14: Schematic of all experimental apparatus, as used for the particle-laden experiments (some duct work is not shown for clarity)
LDA and traverse
Classifier model
Fan
Cyclone
Fines collection hopper Particle
storage hopper
Auger
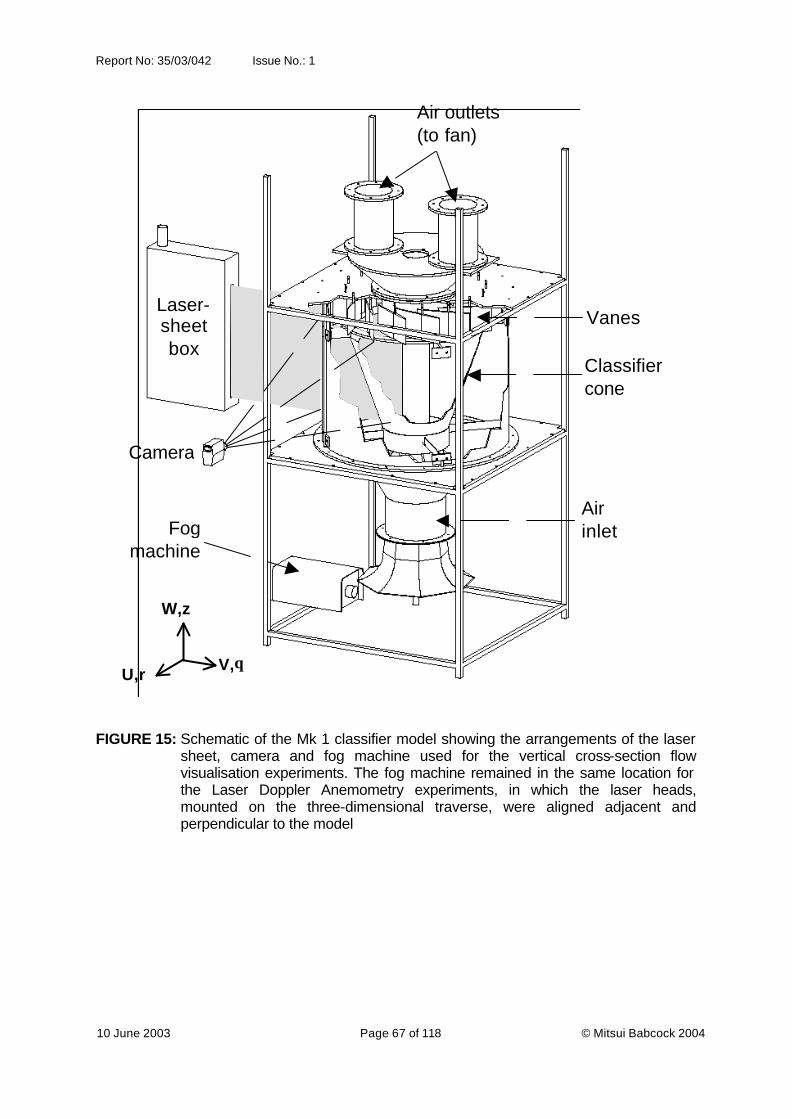
Report No: 35/03/042 Issue No.: 1
10 June 2003 Page 67 of 118 © Mitsui Babcock 2004
Laser- sheet box
Camera
Fog machine
Air inlet
Air outlets (to fan)
Vanes
Classifier cone
V,θ
W,z
U,r
FIGURE 15: Schematic of the Mk 1 classifier model showing the arrangements of the laser sheet, camera and fog machine used for the vertical cross-section flow visualisation experiments. The fog machine remained in the same location for the Laser Doppler Anemometry experiments, in which the laser heads, mounted on the three-dimensional traverse, were aligned adjacent and perpendicular to the model

Report No: 35/03/042 Issue No.: 1
10 June 2003 Page 68 of 118 © Mitsui Babcock 2004
FIGURE 16: Location of the LDA measurement profiles in relation to the vertical reference point on the top of the lower support flange in the Mk 1 physical model
A
B
C
D
E
FG
HI
J
A
B
C
D
E
FG
HI
J

Report No: 35/03/042 Issue No.: 1
10 June 2003 Page 69 of 118 © Mitsui Babcock 2004
FIGURE 17: Location of the LDA measurement profiles in relation to the vertical reference point on the top of the lower support flange in the Mk 2 physical model
A
B
C
D
E
F
GHI
A
B
C
D
E
F
GHI
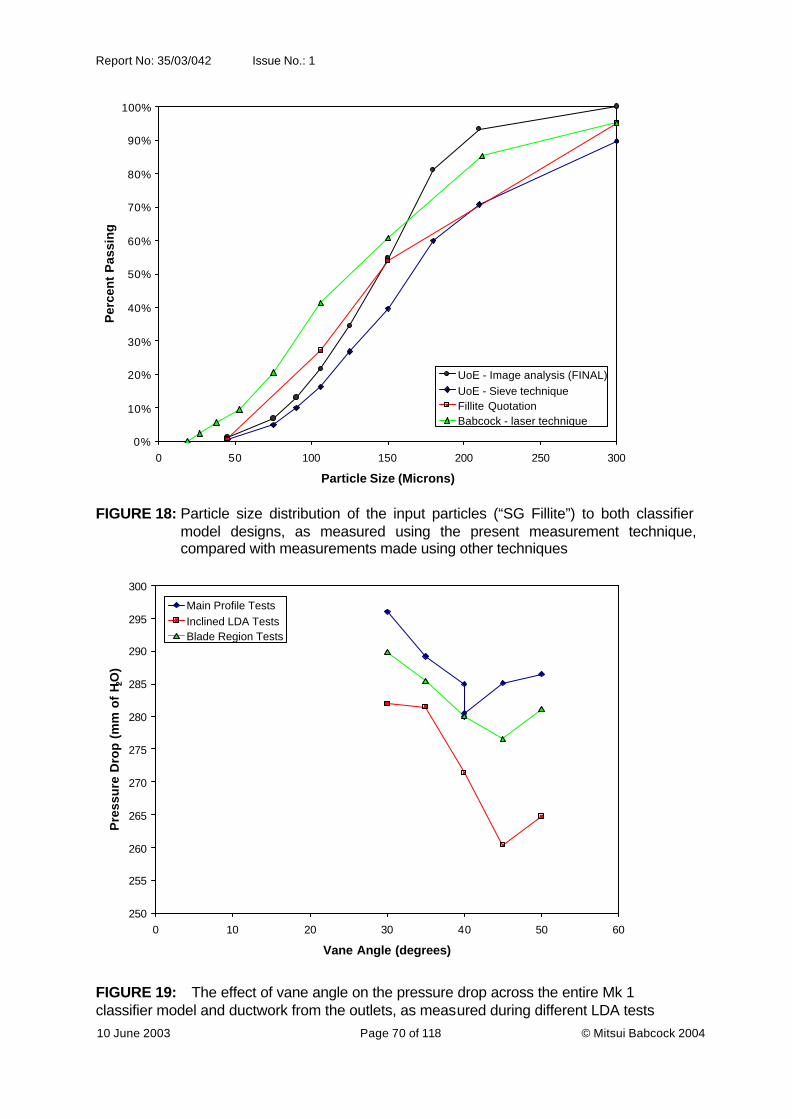
Report No: 35/03/042 Issue No.: 1
10 June 2003 Page 70 of 118 © Mitsui Babcock 2004
0%
10%
20%
30%
40%
50%
60%
70%
80%
90%
100%
0 50 100 150 200 250 300
Particle Size (Microns)
Per
cen
t P
assi
ng
UoE - Image analysis (FINAL)UoE - Sieve techniqueFillite QuotationBabcock - laser technique
FIGURE 18: Particle size distribution of the input particles (“SG Fillite”) to both classifier model designs, as measured using the present measurement technique, compared with measurements made using other techniques
250
255
260
265
270
275
280
285
290
295
300
0 10 20 30 40 50 60
Vane Angle (degrees)
Pre
ssu
re D
rop
(m
m o
f H 2
O)
Main Profile TestsInclined LDA TestsBlade Region Tests
FIGURE 19: The effect of vane angle on the pressure drop across the entire Mk 1 classifier model and ductwork from the outlets, as measured during different LDA tests

Report No: 35/03/042 Issue No.: 1
10 June 2003 Page 71 of 118 © Mitsui Babcock 2004
FIGURE 20: Vector maps (viewed isometrically and from side on) of the LDA results at a vane angle of 40º in the Mk 1 classifier model
0
100
200
300
400
-500
50
0
100
200
300
400
500
600
700
0 100 200 300 4000
100
200
300
400
500
600
700

Report No: 35/03/042 Issue No.: 1
10 June 2003 Page 72 of 118 © Mitsui Babcock 2004
-40
-30
-20
-10
0
10
0 50 100 150 200 250 300 350 400 450
Radius from centreline (mm)
Mea
n T
ang
enti
al V
elo
city
, V m
ean (
m/s
)
Vane=30Vane=35Vane=40Vane=45Vane=50
FIGURE 21: The effect of vane angle on the profile of the mean tangential velocity component, Vmean, at level E, Mk 1 classifier model design
-20
-10
0
10
20
30
0 50 100 150 200 250 300 350 400 450
Radius from centreline (mm)
Mea
n A
xial
Vel
oci
ty, W
mea
n (
m/s
)
Vane=30Vane=35Vane=40Vane=45Vane=50
FIGURE 22: The effect of vane angle on the profile of the mean axial velocity component, Wmean, at level E, Mk 1 classifier model design

Report No: 35/03/042 Issue No.: 1
10 June 2003 Page 73 of 118 © Mitsui Babcock 2004
-35
-25
-15
-5
5
15
0 50 100 150 200 250 300 350 400 450
Radius from centreline (mm)
Mea
n R
adia
l V
elo
city
, U m
ean (
m/s
)
Vane=30Vane=35Vane=40Vane=45Vane=50
FIGURE 23: The effect of vane angle on the profile of the mean radial velocity component, Umean, at level E, Mk 1 classifier model design
0
10
20
30
40
50
60
70
80
90
100
0 50 100 150 200 250 300 350 400 450
Radius from centreline (mm)
Kin
etic
En
erg
y (m
2 /s2 )
Vane=30Vane=35Vane=40Vane=45Vane=50
FIGURE 24: The effect of vane angle on the profile of the turbulent kinetic energy at level E, Mk 1 classifier model design

Report No: 35/03/042 Issue No.: 1
10 June 2003 Page 74 of 118 © Mitsui Babcock 2004
0%
10%
20%
30%
40%
50%
60%
70%
80%
90%
100%
0 50 100 150 200 250 300Particle Size (microns)
SG Input25% Load, Cyclone
50% Load, Cyclone75% Load, Cyclone
25% Load, Rejects50% Load, Rejects
75% Load, Rejects
FIGURE 25: The effect of particle loading on the particle size distribution of samples collected from the rejects and cyclone in the Mk 1 classifier model, at a vane angle of 40º
175
195
215
235
255
275
295
315
335
355
375
0 10 20 30 40 50 60
Vane Angle (degrees)
Pre
ssu
re D
rop
(m
m o
f H
2O)
Mark 2, model
Mark 2, model, cyclone & duct
Mark 1, model & duct
FIGURE 26: The effect of vane angle on the pressure drop across the Mk 2 classifier model and the model, cyclone and ductwork, compared with the Mk 1 classifier model and ductwork

Report No: 35/03/042 Issue No.: 1
10 June 2003 Page 75 of 118 © Mitsui Babcock 2004
-40
-30
-20
-10
0
10
20
0 50 100 150 200 250 300 350 400 450
Radius from Centreline (mm)
Mea
n T
ang
enti
al V
elo
city
, Vm
ean
(m/s
)
Mark 1Mark 2
FIGURE 27: Comparison of the mean tangential velocity profiles at 40º vane angle, level I in the Mk 1 and level H in the Mk 2 classifier models
-20
-10
0
10
20
30
40
0 50 100 150 200 250 300 350 400 450
Radius from Centreline (mm)
Mea
n A
xial
Vel
oci
ty, W
mea
n (m
/s)
Mark 1Mark 2
FIGURE 28: Comparison of the mean axial velocity profiles at 40º vane angle, level I in the Mk 1 and level H in the Mk 2 classifier models
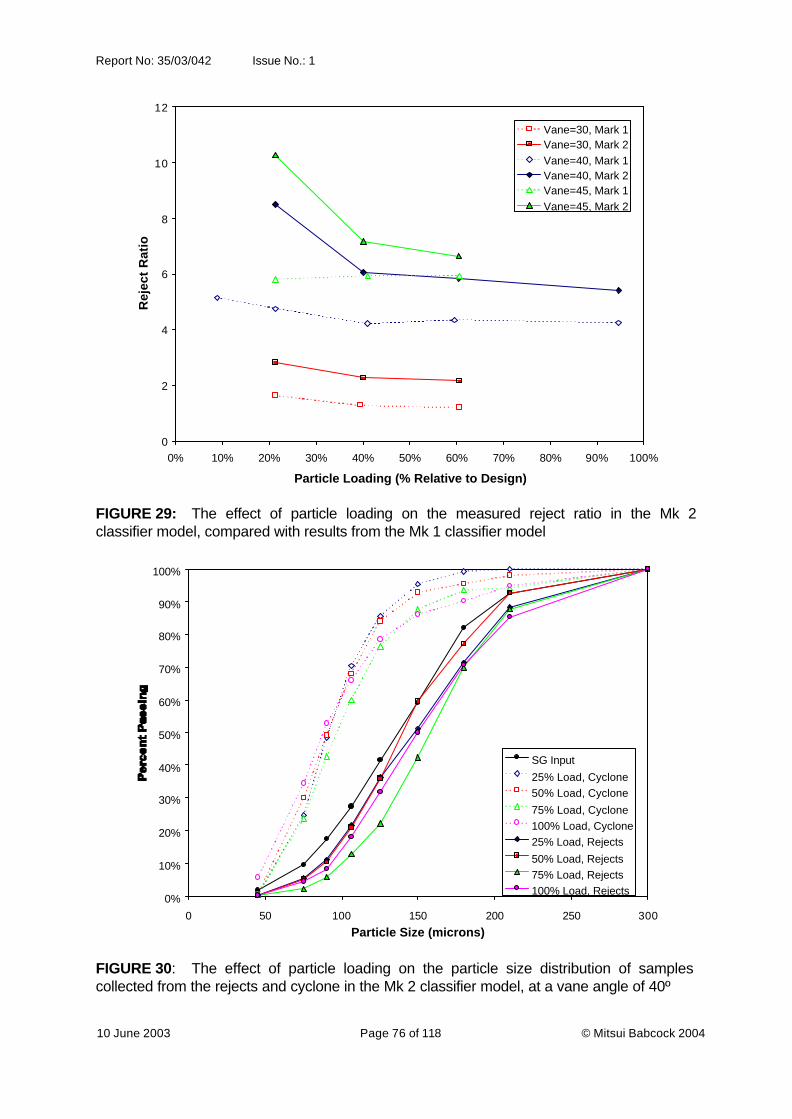
Report No: 35/03/042 Issue No.: 1
10 June 2003 Page 76 of 118 © Mitsui Babcock 2004
0
2
4
6
8
10
12
0% 10% 20% 30% 40% 50% 60% 70% 80% 90% 100%
Particle Loading (% Relative to Design)
Rej
ect
Rat
ioVane=30, Mark 1Vane=30, Mark 2Vane=40, Mark 1Vane=40, Mark 2Vane=45, Mark 1Vane=45, Mark 2
FIGURE 29: The effect of particle loading on the measured reject ratio in the Mk 2 classifier model, compared with results from the Mk 1 classifier model
0%
10%
20%
30%
40%
50%
60%
70%
80%
90%
100%
0 50 100 150 200 250 300
Particle Size (microns)
SG Input
25% Load, Cyclone50% Load, Cyclone
75% Load, Cyclone100% Load, Cyclone25% Load, Rejects
50% Load, Rejects75% Load, Rejects100% Load, Rejects
FIGURE 30: The effect of particle loading on the particle size distribution of samples collected from the rejects and cyclone in the Mk 2 classifier model, at a vane angle of 40º
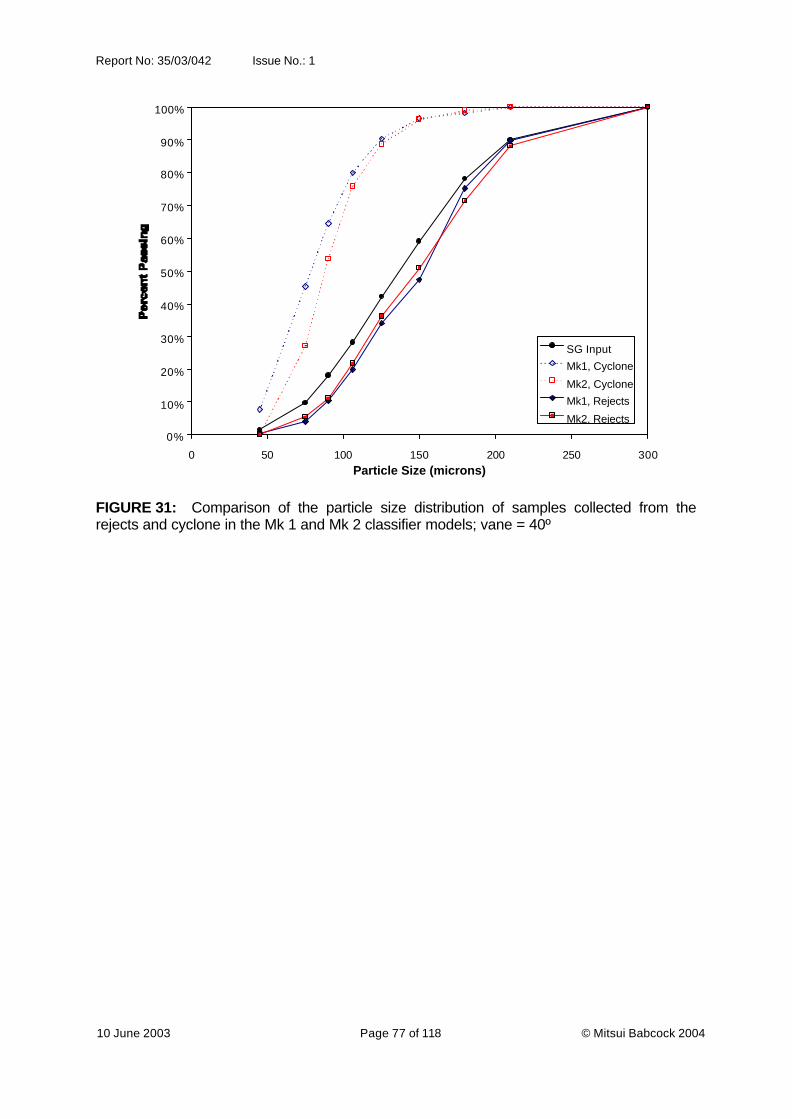
Report No: 35/03/042 Issue No.: 1
10 June 2003 Page 77 of 118 © Mitsui Babcock 2004
0%
10%
20%
30%
40%
50%
60%
70%
80%
90%
100%
0 50 100 150 200 250 300Particle Size (microns)
SG Input
Mk1, Cyclone
Mk2, Cyclone
Mk1, Rejects
Mk2, Rejects
FIGURE 31: Comparison of the particle size distribution of samples collected from the rejects and cyclone in the Mk 1 and Mk 2 classifier models; vane = 40º

Report No: 35/03/042 Issue No.: 1
10 June 2003 Page 78 of 118 © Mitsui Babcock 2004
FIGURE 32: CFD Model Geometry for Simulation of Physical Model Experiments
Side Elevation
Plan
22.5°
αVane Detail
Side Elevation
Plan
22.5°
αVane Detail

Report No: 35/03/042 Issue No.: 1
10 June 2003 Page 79 of 118 © Mitsui Babcock 2004
FIGURE 33: 22.5° Model, 40° Vane Angle: Grid and Mesh Detail
Grid Outline Grid Boundaries Mesh Detail
Vanes
VaneSeat
OuterBody
Inlet
Returns
ClassifierCone
pf Feed
VortexFinder
Outlet
Grid Outline Grid Boundaries Mesh Detail
Vanes
VaneSeat
OuterBody
Inlet
Returns
ClassifierCone
pf Feed
VortexFinder
Outlet

Report No: 35/03/042 Issue No.: 1
10 June 2003 Page 80 of 118 © Mitsui Babcock 2004
FIGURE 34: 180° Model, 40° Vane Angle: Grid and Mesh Detail
Grid Outline Grid Boundaries Mesh DetailGrid Outline Grid Boundaries Mesh Detail
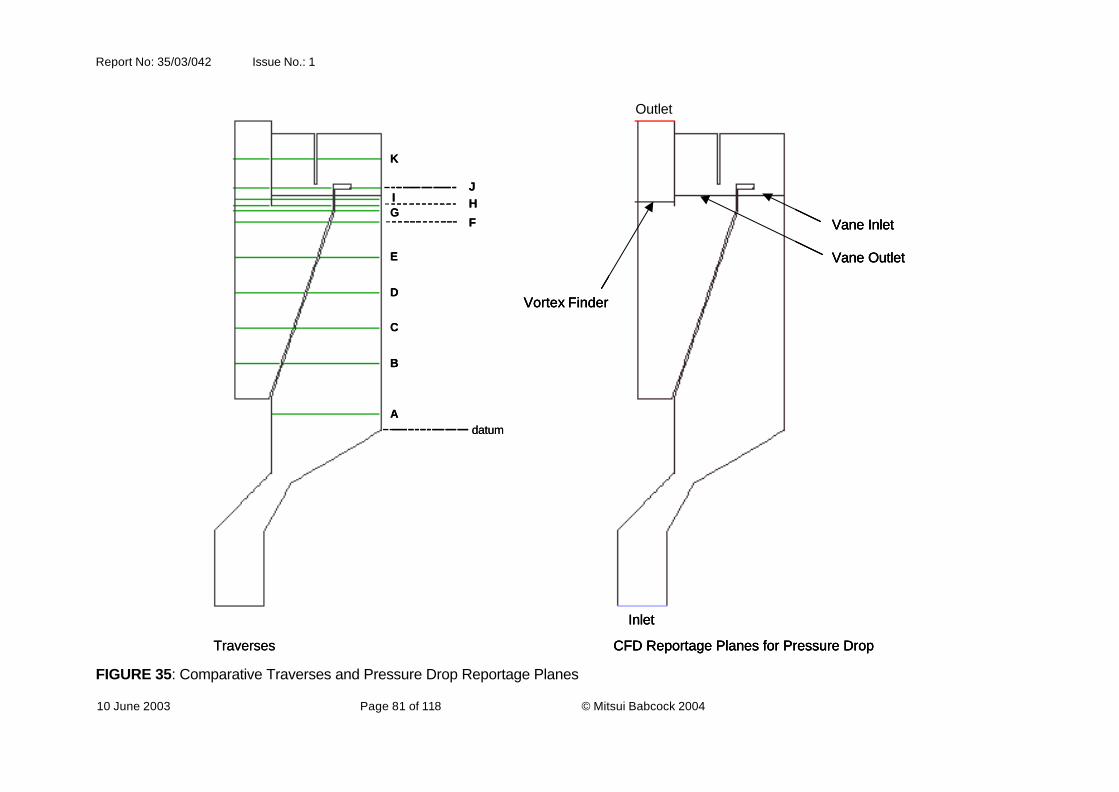
Report No: 35/03/042 Issue No.: 1
10 June 2003 Page 81 of 118 © Mitsui Babcock 2004
FIGURE 35: Comparative Traverses and Pressure Drop Reportage Planes
A
B
C
D
E
FGI
J
K
H
datum
Traverses CFD Reportage Planes for Pressure Drop
Inlet
Vane Inlet
Vane Outlet
Vortex Finder
Outlet
A
B
C
D
E
FGI
J
K
H
datum
Traverses CFD Reportage Planes for Pressure Drop
Inlet
Vane Inlet
Vane Outlet
Vortex Finder
Outlet
CFD Reportage Planes for Pressure Drop
Inlet
Vane Inlet
Vane Outlet
Vortex Finder
Outlet

Report No: 35/03/042 Issue No.: 1
10 June 2003 Page 82 of 118 © Mitsui Babcock 2004
FIGURE 36: Selection of Turbulence Model: Vectors coloured by Velocity Magnitude (m/s)
kε rkε kω RNG kε RSMModel kε rkε kω RNG kε RSMModel

Report No: 35/03/042 Issue No.: 1
10 June 2003 Page 83 of 118 © Mitsui Babcock 2004
FIGURE 37: 40°: Profiles of Velocity (m/s) vs Radial Distance at Level E
-15
-10
-5
0
5
10
15
20
0 50 100 150 200 250 300 350 400 450
r (mm)
Um
ean
(m/s
)
Physical ModelkErkEkwRNG kERSM
-25
-20
-15
-10
-5
0
5
0 50 100 150 200 250 300 350 400 450
r (mm)
Vm
ean
(m
/s) Physical Model
kErkEkwRNG kERSM
Axial
Radial
Tangential
-15
-10
-5
0
5
10
15
20
0 50 100 150 200 250 300 350 400 450
r (mm)
Wm
ean
(m
/s) Physical Model
kErkEkwRNG kERSM
-15
-10
-5
0
5
10
15
20
0 50 100 150 200 250 300 350 400 450
r (mm)
Um
ean
(m/s
)
Physical ModelkErkEkwRNG kERSM
-25
-20
-15
-10
-5
0
5
0 50 100 150 200 250 300 350 400 450
r (mm)
Vm
ean
(m
/s) Physical Model
kErkEkwRNG kERSM
Axial
Radial
Tangential
-15
-10
-5
0
5
10
15
20
0 50 100 150 200 250 300 350 400 450
r (mm)
Wm
ean
(m
/s) Physical Model
kErkEkwRNG kERSM

Report No: 35/03/042 Issue No.: 1
10 June 2003 Page 84 of 118 © Mitsui Babcock 2004
FIGURE 38: Effect of Vane Angle: Vectors coloured by Velocity Magnitude (m/s)
Model 30° 40° 45°Model 30° 40° 45°
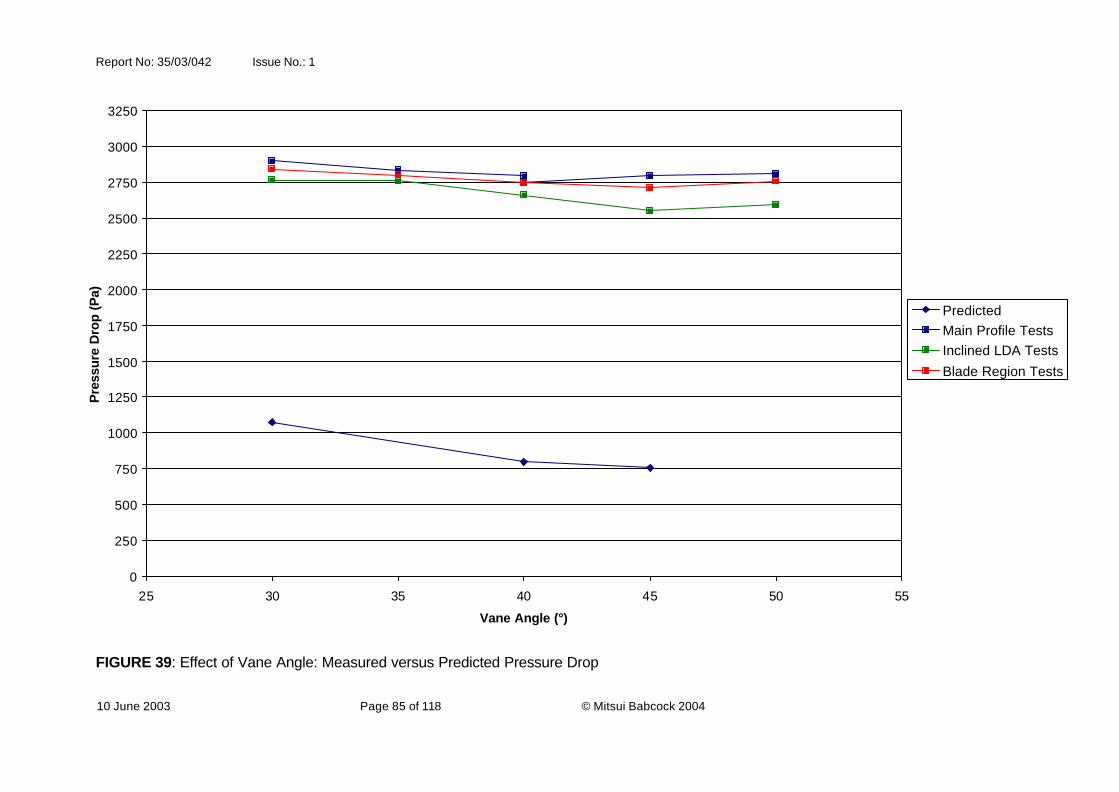
Report No: 35/03/042 Issue No.: 1
10 June 2003 Page 85 of 118 © Mitsui Babcock 2004
FIGURE 39: Effect of Vane Angle: Measured versus Predicted Pressure Drop
0
250
500
750
1000
1250
1500
1750
2000
2250
2500
2750
3000
3250
25 30 35 40 45 50 55
Vane Angle (°)
Pre
ssur
e D
rop
(Pa)
PredictedMain Profile TestsInclined LDA Tests
Blade Region Tests
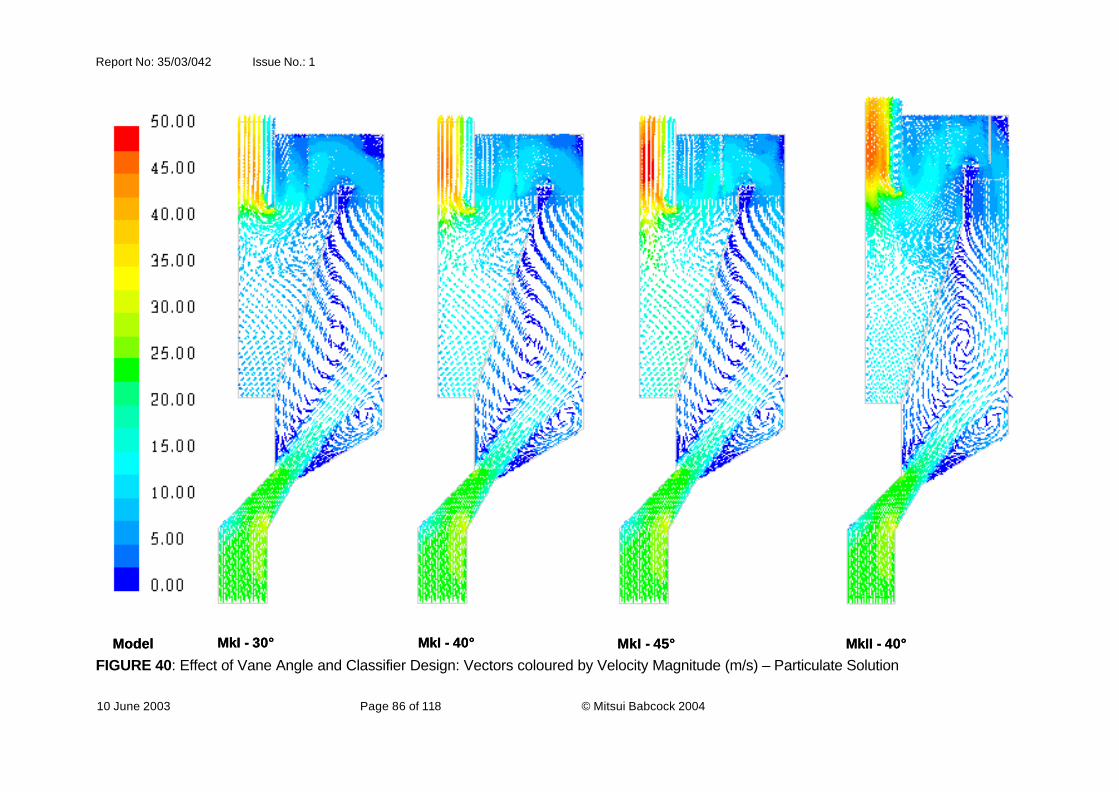
Report No: 35/03/042 Issue No.: 1
10 June 2003 Page 86 of 118 © Mitsui Babcock 2004
FIGURE 40: Effect of Vane Angle and Classifier Design: Vectors coloured by Velocity Magnitude (m/s) – Particulate Solution
MkI - 30° MkI - 40° MkI - 45° MkII - 40°Model MkI - 30° MkI - 40° MkI - 45° MkII - 40°Model
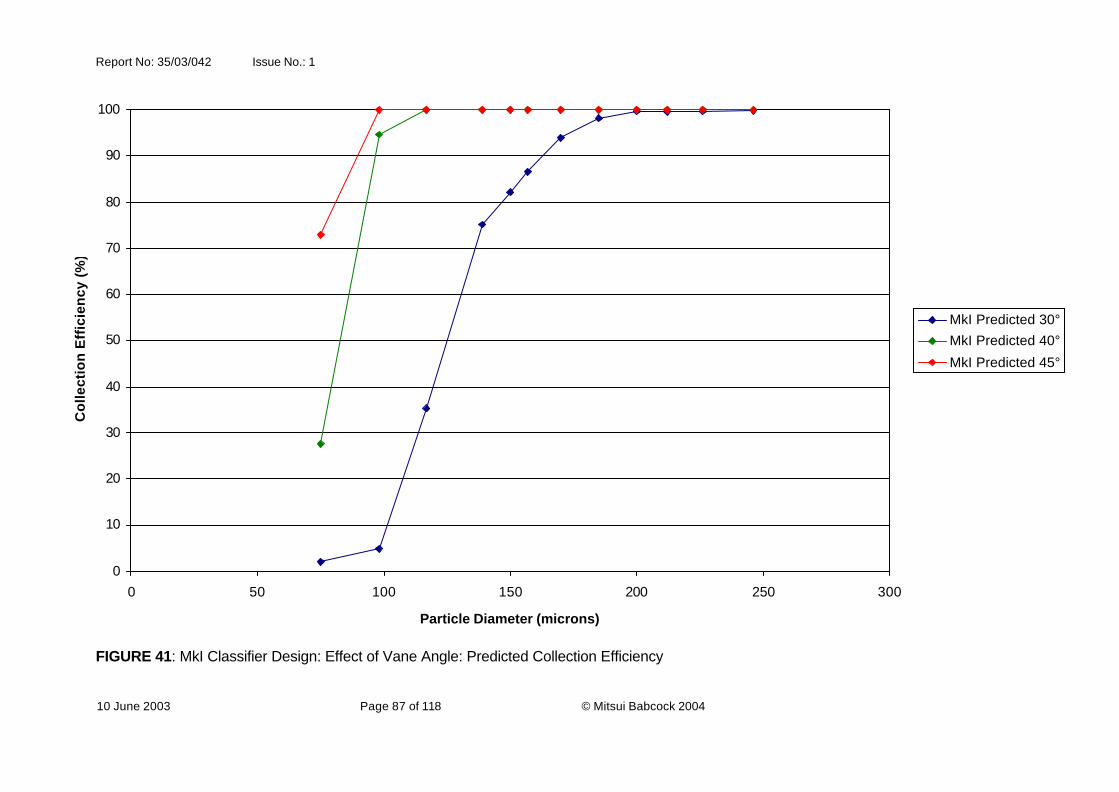
Report No: 35/03/042 Issue No.: 1
10 June 2003 Page 87 of 118 © Mitsui Babcock 2004
FIGURE 41: MkI Classifier Design: Effect of Vane Angle: Predicted Collection Efficiency
0
10
20
30
40
50
60
70
80
90
100
0 50 100 150 200 250 300
Particle Diameter (microns)
Co
llect
ion
Eff
icie
ncy
(%
)
MkI Predicted 30°MkI Predicted 40°
MkI Predicted 45°

Report No: 35/03/042 Issue No.: 1
10 June 2003 Page 88 of 118 © Mitsui Babcock 2004
FIGURE 42: MkI Classifier: 40° Vane Angle: Measured and Predicted Product and Rejects Gradings
10 10001 100
1.0
40
99.9
99
95
90
80
70
60
50
30
20
15
3.0
1.5
2.0
4.0
6.0
8.0
10
0.1
Particle Size, microns
Wt P
erce
nt U
nder
size
A Measured Inlet
B Predicted Product
C Measured Product
D Predicted Rejects
E Measured Rejects
Linear (A Measured Inlet)
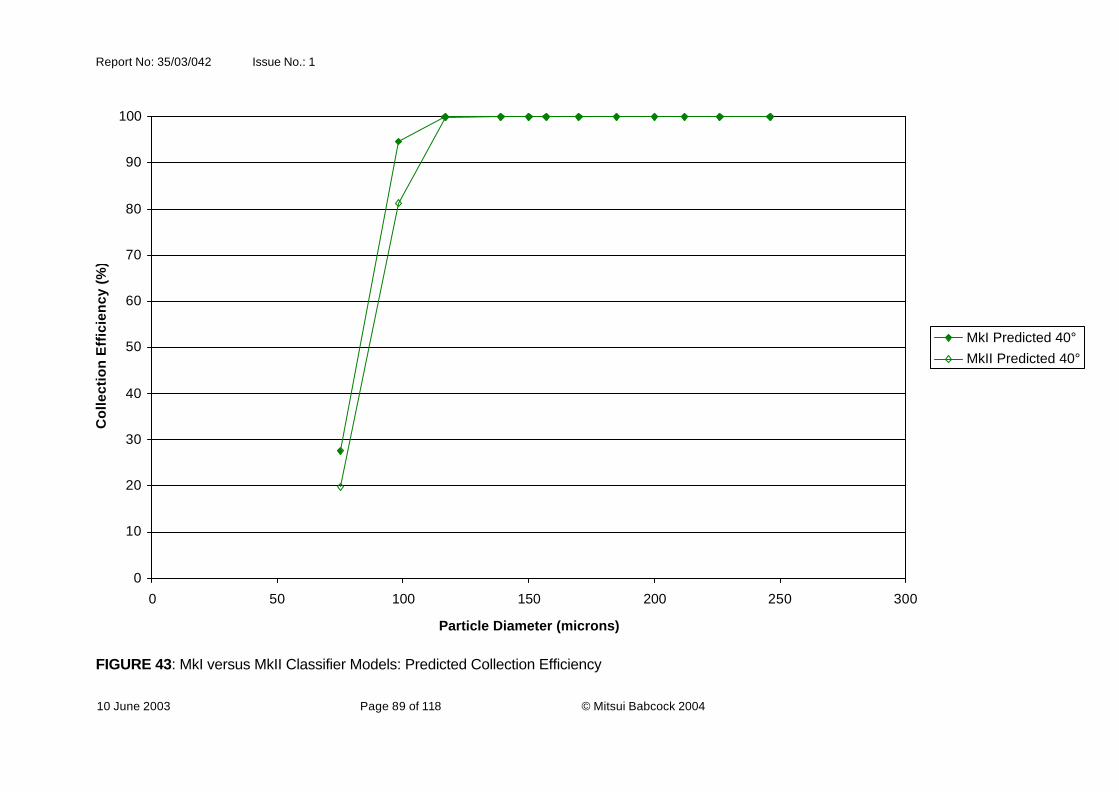
Report No: 35/03/042 Issue No.: 1
10 June 2003 Page 89 of 118 © Mitsui Babcock 2004
FIGURE 43: MkI versus MkII Classifier Models: Predicted Collection Efficiency
0
10
20
30
40
50
60
70
80
90
100
0 50 100 150 200 250 300
Particle Diameter (microns)
Co
llect
ion
Eff
icie
ncy
(%
)
MkI Predicted 40°MkII Predicted 40°
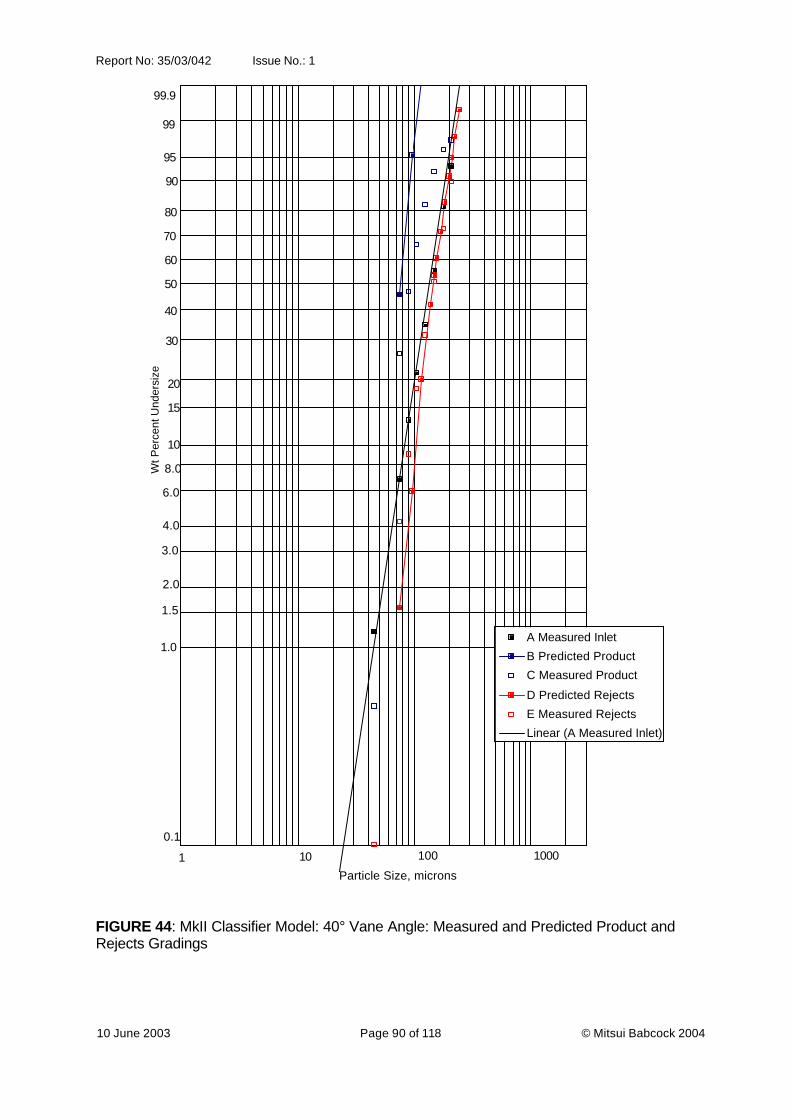
Report No: 35/03/042 Issue No.: 1
10 June 2003 Page 90 of 118 © Mitsui Babcock 2004
FIGURE 44: MkII Classifier Model: 40° Vane Angle: Measured and Predicted Product and Rejects Gradings
10 10001 100
1.0
40
99.9
99
95
90
80
70
60
50
30
20
15
3.0
1.5
2.0
4.0
6.0
8.0
10
0.1
Particle Size, microns
Wt P
erce
nt U
nder
size
A Measured Inlet
B Predicted Product
C Measured Product
D Predicted Rejects
E Measured Rejects
Linear (A Measured Inlet)
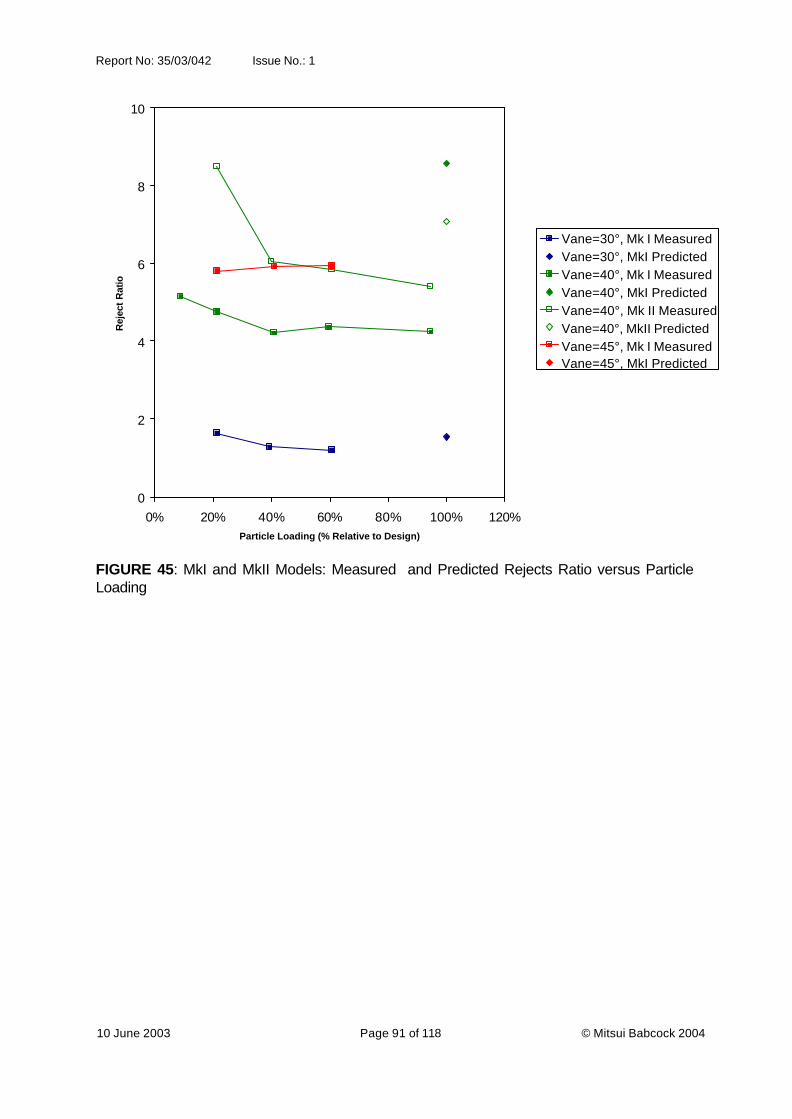
Report No: 35/03/042 Issue No.: 1
10 June 2003 Page 91 of 118 © Mitsui Babcock 2004
FIGURE 45: MkI and MkII Models: Measured and Predicted Rejects Ratio versus Particle Loading
0
2
4
6
8
10
0% 20% 40% 60% 80% 100% 120%Particle Loading (% Relative to Design)
Rej
ect
Rat
io
Vane=30°, Mk I MeasuredVane=30°, MkI PredictedVane=40°, Mk I MeasuredVane=40°, MkI PredictedVane=40°, Mk II MeasuredVane=40°, MkII PredictedVane=45°, Mk I MeasuredVane=45°, MkI Predicted
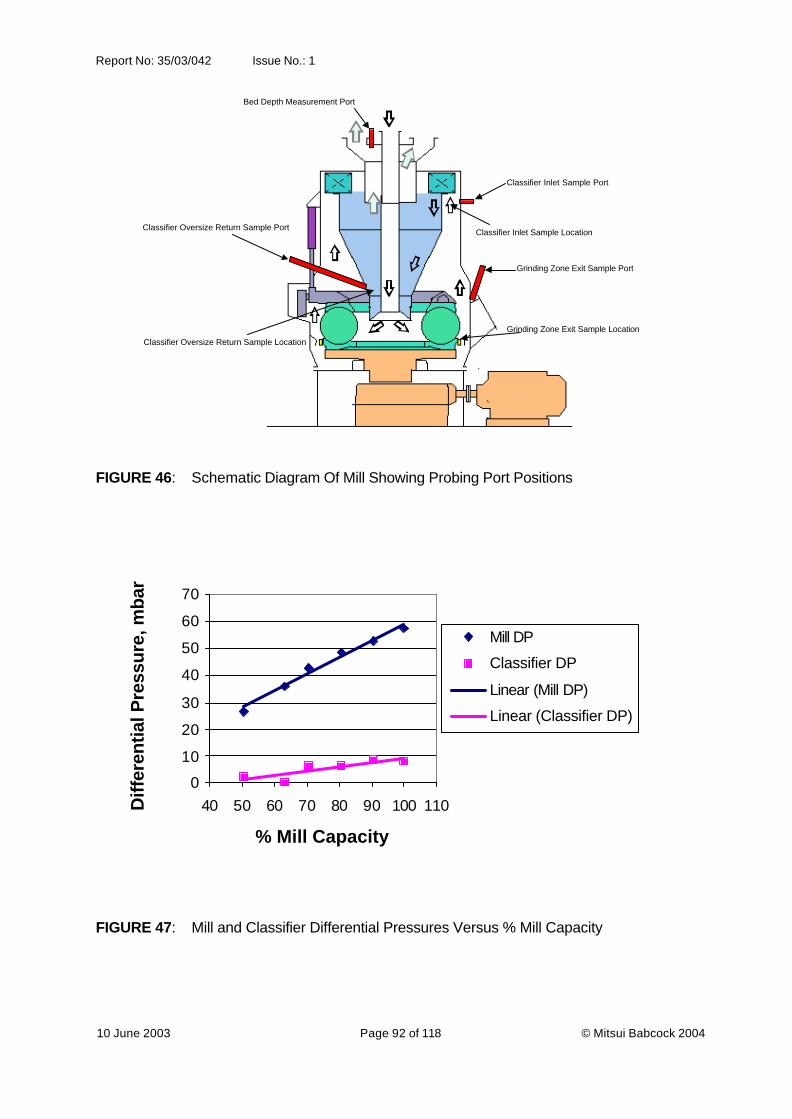
Report No: 35/03/042 Issue No.: 1
10 June 2003 Page 92 of 118 © Mitsui Babcock 2004
FIGURE 46: Schematic Diagram Of Mill Showing Probing Port Positions
FIGURE 47: Mill and Classifier Differential Pressures Versus % Mill Capacity
Classifier Inlet Sample Port
Grinding Zone Exit Sample Port
Classifier Oversize Return Sample Port
Bed Depth Measurement Port
Grinding Zone Exit Sample Location
Classifier Inlet Sample Location
Classifier Oversize Return Sample Location
0
10
20
30
40
50
60
70
40 50 60 70 80 90 100 110
% Mill Capacity
Diff
eren
tial P
ress
ure,
mba
r
Mill DP
Classifier DP
Linear (Mill DP)
Linear (Classifier DP)
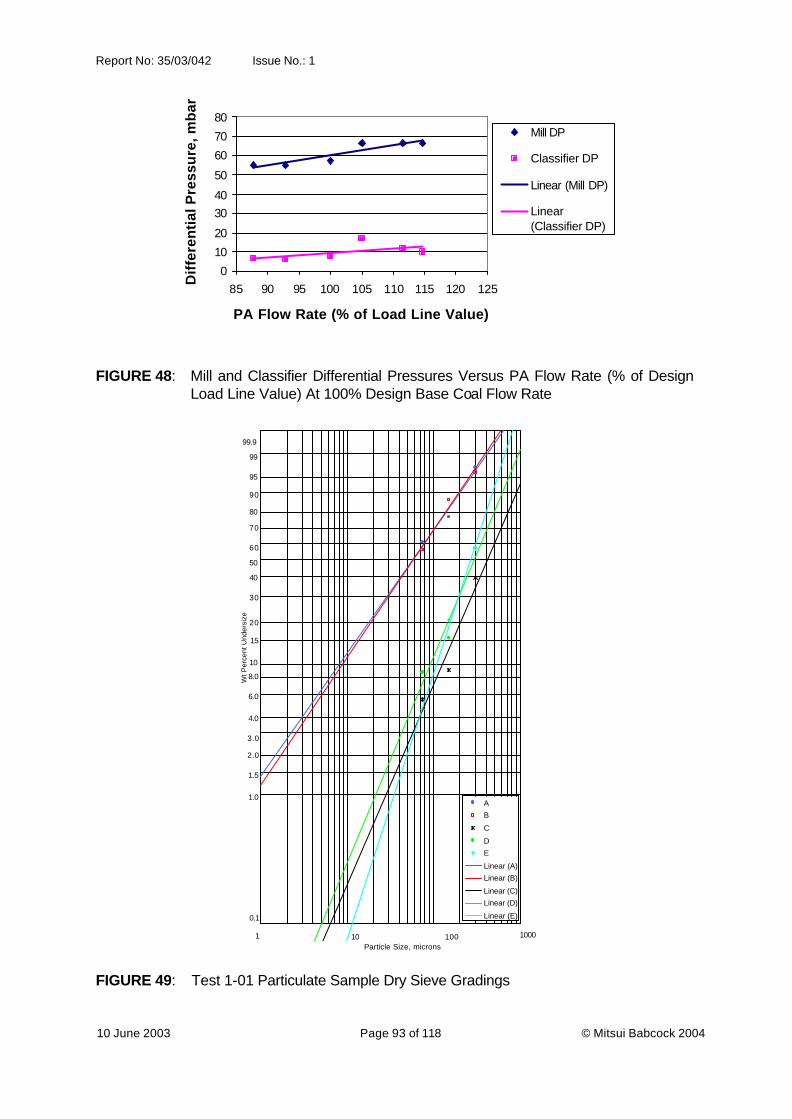
Report No: 35/03/042 Issue No.: 1
10 June 2003 Page 93 of 118 © Mitsui Babcock 2004
FIGURE 48: Mill and Classifier Differential Pressures Versus PA Flow Rate (% of Design Load Line Value) At 100% Design Base Coal Flow Rate
FIGURE 49: Test 1-01 Particulate Sample Dry Sieve Gradings
10 10001 100
1.0
40
99.9
99
95
90
80
70
60
50
30
20
15
3.0
1.5
2.0
4.0
6.0
8.0
10
0.1
Particle Size, microns
Wt P
erce
nt U
nder
size
A
B
C
D
E
Linear (A)
Linear (B)
Linear (C)
Linear (D)
Linear (E)
0
10
20
3040
50
60
70
80
85 90 95 100 105 110 115 120 125
PA Flow Rate (% of Load Line Value)
Dif
fere
nti
al P
ress
ure
, mb
ar
Mill DP
Classifier DP
Linear (Mill DP)
Linear(Classifier DP)

Report No: 35/03/042 Issue No.: 1
10 June 2003 Page 94 of 118 © Mitsui Babcock 2004
FIGURE 50: Test 1-01 Sample Fineness Versus Sample Location
FIGURE 51: Mean Pf Fineness Versus % Mill Capacity
0
20
40
60
80
100
120
GrindingZone Exit
ClassifierOversizeReturn
ClassifierInlet
PF Product
Sample Location
Wei
ght
%<7
5 m
icro
n, 3
00 m
icro
n
75 micron
300 micron
0
20
40
60
80
100
40 50 60 70 80 90 100 110
% Mill Capacity
Wei
gh
t %
<75
mic
ron
, 300
mic
ron
%<75 micron
%<300 micron
Linear (%<75 micron)
Linear (%<300 micron)

Report No: 35/03/042 Issue No.: 1
10 June 2003 Page 95 of 118 © Mitsui Babcock 2004
FIGURE 52: Grinding Zone Exit Material Fineness Versus % Mill Capacity
FIGURE 53: Classifier Inlet Material Fineness Versus % Mill Capacity
0
20
40
60
80
100
40 50 60 70 80 90 100 110
% Mill Capacity
Wei
gh
t %
<75
mic
ron
, 300
mic
ron
%<75 micron
%<300 micron
Linear (%<75 micron)
Linear (%<300 micron)
0
20
40
60
80
100
40 50 60 70 80 90 100 110
% Mill Capacity
Wei
gh
t %
<75
mic
ron
, 300
mic
ron
%<75 micron
%<300 micron
Linear (%<75 micron)
Linear (%<300 micron)
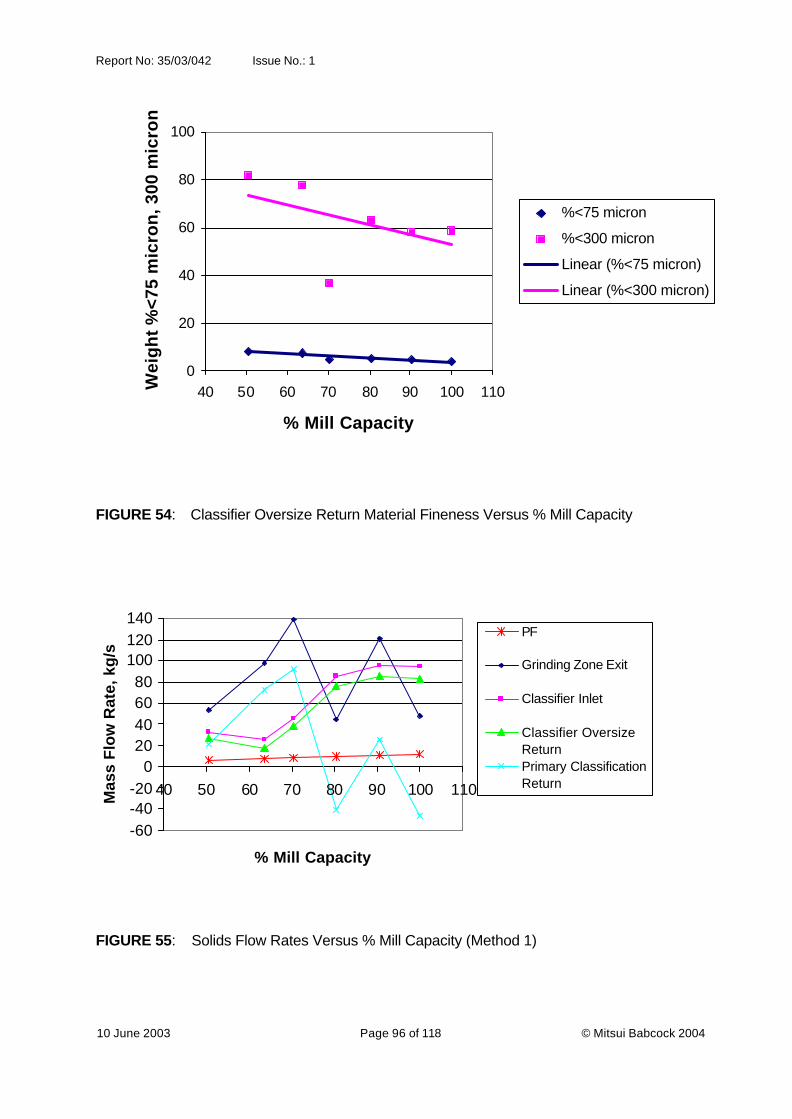
Report No: 35/03/042 Issue No.: 1
10 June 2003 Page 96 of 118 © Mitsui Babcock 2004
FIGURE 54: Classifier Oversize Return Material Fineness Versus % Mill Capacity
FIGURE 55: Solids Flow Rates Versus % Mill Capacity (Method 1)
-60-40-20
020406080
100120140
40 50 60 70 80 90 100 110
% Mill Capacity
Mas
s F
low
Rat
e, k
g/s
PF
Grinding Zone Exit
Classifier Inlet
Classifier OversizeReturnPrimary ClassificationReturn
0
20
40
60
80
100
40 50 60 70 80 90 100 110
% Mill Capacity
Wei
gh
t %
<75
mic
ron
, 300
mic
ron
%<75 micron
%<300 micron
Linear (%<75 micron)
Linear (%<300 micron)

Report No: 35/03/042 Issue No.: 1
10 June 2003 Page 97 of 118 © Mitsui Babcock 2004
FIGURE 56: Recycle Ratios Versus % Mill Capacity
-10
0
10
20
40 50 60 70 80 90 100 110
% Mill Capacity
Rec
ycle
Rat
ioPrimary Class. RecycleRatio (Method 1)
Classifier RecycleRatio (Method 1)
Classifier RecycleRatio (Method 2)
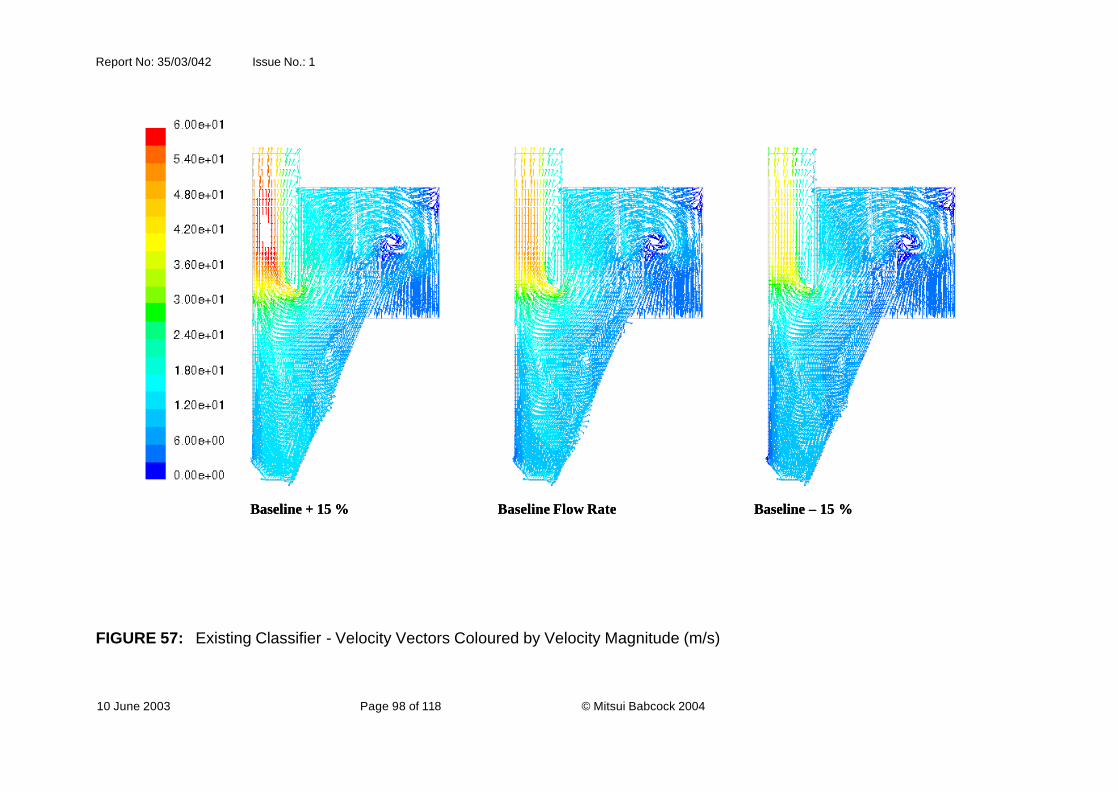
Report No: 35/03/042 Issue No.: 1
10 June 2003 Page 98 of 118 © Mitsui Babcock 2004
FIGURE 57: Existing Classifier - Velocity Vectors Coloured by Velocity Magnitude (m/s)
Baseline + 15 % Baseline Flow Rate Baseline – 15 %Baseline + 15 % Baseline Flow Rate Baseline – 15 %

Report No: 35/03/042 Issue No.: 1
10 June 2003 Page 99 of 118 © Mitsui Babcock 2004
FIGURE 58: Profiles of Velocity (m/s) versus Radial Distance
Axial
Radial
Tangential
-15
-10
-5
0
5
10
15
20
0.00 0.10 0.20 0.30 0.40 0.50 0.60 0.70 0.80 0.90 1.00
Non - Dimensionalised Radial Distance
Wm
ea
n (
m/s
)
Physical ModelPhysical Model - CFD
Plant - CFD
-15
-10
-5
0
5
10
15
20
0.00 0.10 0.20 0.30 0.40 0.50 0.60 0.70 0.80 0.90 1.00
Non - Dimensionalised Radial Distance
Um
ea
n (
m/s
)
Physical Model
Physical Model - CFDPlant - CFD
-25
-20
-15
-10
-5
0
5
0.00 0.10 0.20 0.30 0.40 0.50 0.60 0.70 0.80 0.90 1.00
Non - Dimensionalised Radial Distance
Vm
ea
n (
m/s
)
Physical Model
Physical Model - CFDPlant - CFD
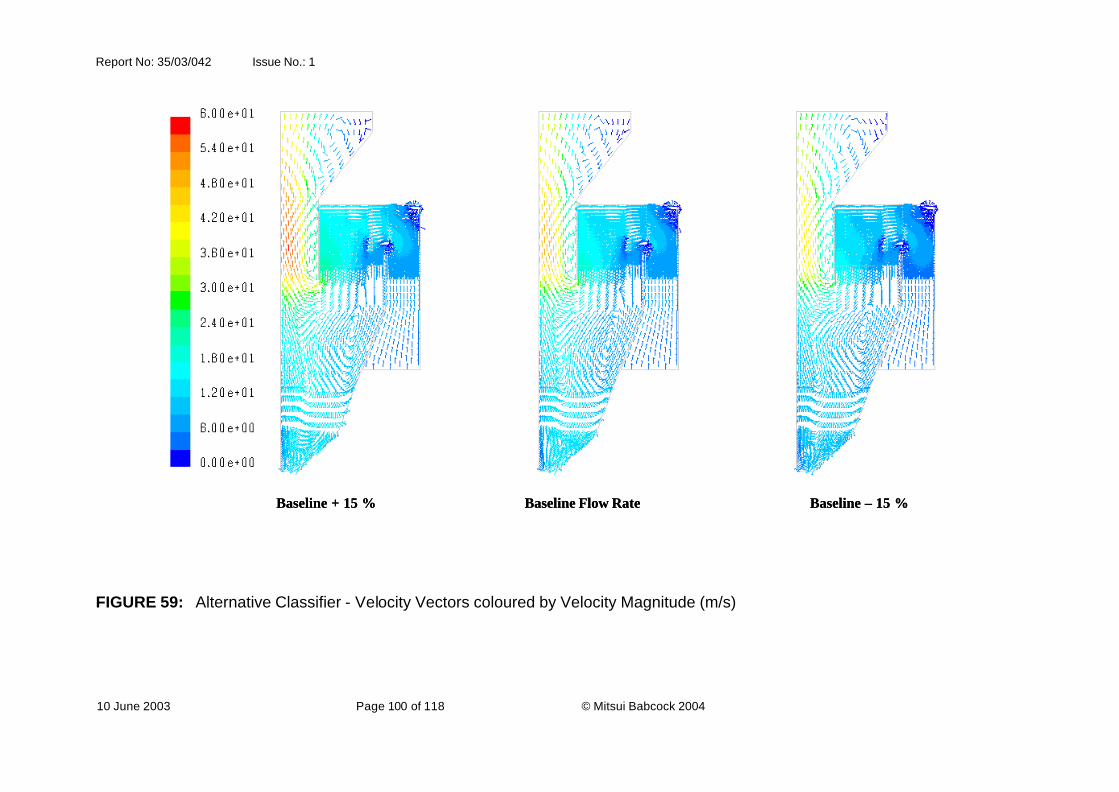
Report No: 35/03/042 Issue No.: 1
10 June 2003 Page 100 of 118 © Mitsui Babcock 2004
FIGURE 59: Alternative Classifier - Velocity Vectors coloured by Velocity Magnitude (m/s)
Baseline + 15 % Baseline Flow Rate Baseline – 15 %Baseline + 15 % Baseline Flow Rate Baseline – 15 %
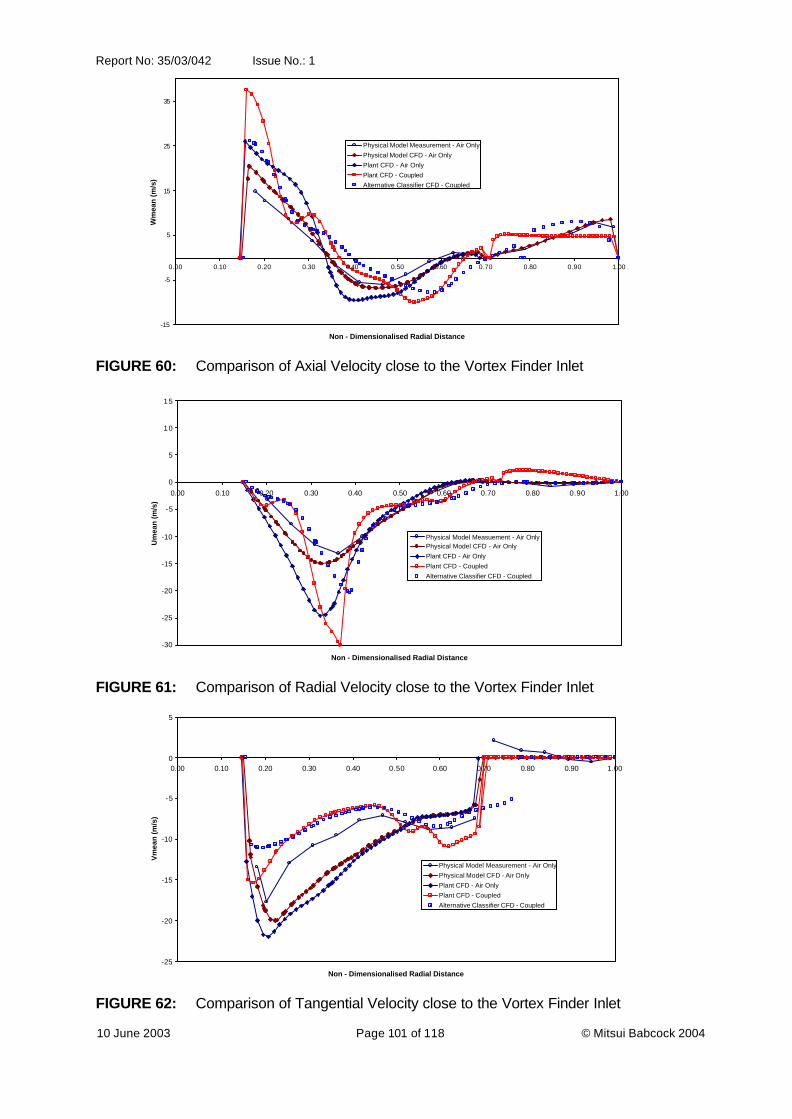
Report No: 35/03/042 Issue No.: 1
10 June 2003 Page 101 of 118 © Mitsui Babcock 2004
FIGURE 60: Comparison of Axial Velocity close to the Vortex Finder Inlet
FIGURE 61: Comparison of Radial Velocity close to the Vortex Finder Inlet
FIGURE 62: Comparison of Tangential Velocity close to the Vortex Finder Inlet
-15
-5
5
15
25
35
0.00 0.10 0.20 0.30 0.40 0.50 0.60 0.70 0.80 0.90 1.00
Non - Dimensionalised Radial Distance
Wm
ean
(m
/s)
Physical Model Measurement - Air OnlyPhysical Model CFD - Air OnlyPlant CFD - Air OnlyPlant CFD - CoupledAlternative Classifier CFD - Coupled
-30
-25
-20
-15
-10
-5
0
5
10
15
0.00 0.10 0.20 0.30 0.40 0.50 0.60 0.70 0.80 0.90 1.00
Non - Dimensionalised Radial Distance
Um
ean
(m/s
)
Physical Model Measuement - Air OnlyPhysical Model CFD - Air OnlyPlant CFD - Air OnlyPlant CFD - CoupledAlternative Classifier CFD - Coupled
-25
-20
-15
-10
-5
0
5
0.00 0.10 0.20 0.30 0.40 0.50 0.60 0.70 0.80 0.90 1.00
Non - Dimensionalised Radial Distance
Vm
ean
(m
/s)
Physical Model Measurement - Air OnlyPhysical Model CFD - Air OnlyPlant CFD - Air OnlyPlant CFD - CoupledAlternative Classifier CFD - Coupled

Report No: 35/03/042 Issue No.: 1
10 June 2003 Page 102 of 118 © Mitsui Babcock 2004
FIGURE 63: Predicted collection efficiency for the Existing Classifier
FIGURE 64: Predicted product grading for the Existing classifier at Baseline Air Flow Rate
0
10
20
30
40
50
60
70
80
90
100
0 50 100 150 200 250 300
Particle Diameter (micron)
Co
llect
ion
eff
icie
ncy
(%
)
measured
pred. - shape 0.7 (baseline flow)
0.1
108.0
6.0
4.0
2.0
1.5
3.0
1520
30
5060
708090
95
9999.9
40
1.0
1001 100010Particle Size, microns
Wt P
erce
nt U
nder
size
Baseline flow - CFD
Baseline flow - measured PF pipe A product
Linear (Baseline flow - CFD)
Linear (Baseline flow - measured PF pipe A product)

Report No: 35/03/042 Issue No.: 1
10 June 2003 Page 103 of 118 © Mitsui Babcock 2004
FIGURE 65: Effect of Vortex Finder Length: Vectors coloured by Velocity Magnitude (m/s)
Model Baseline 1.2 x Baseline 1.44 x BaselineModel Baseline 1.2 x Baseline 1.44 x Baseline
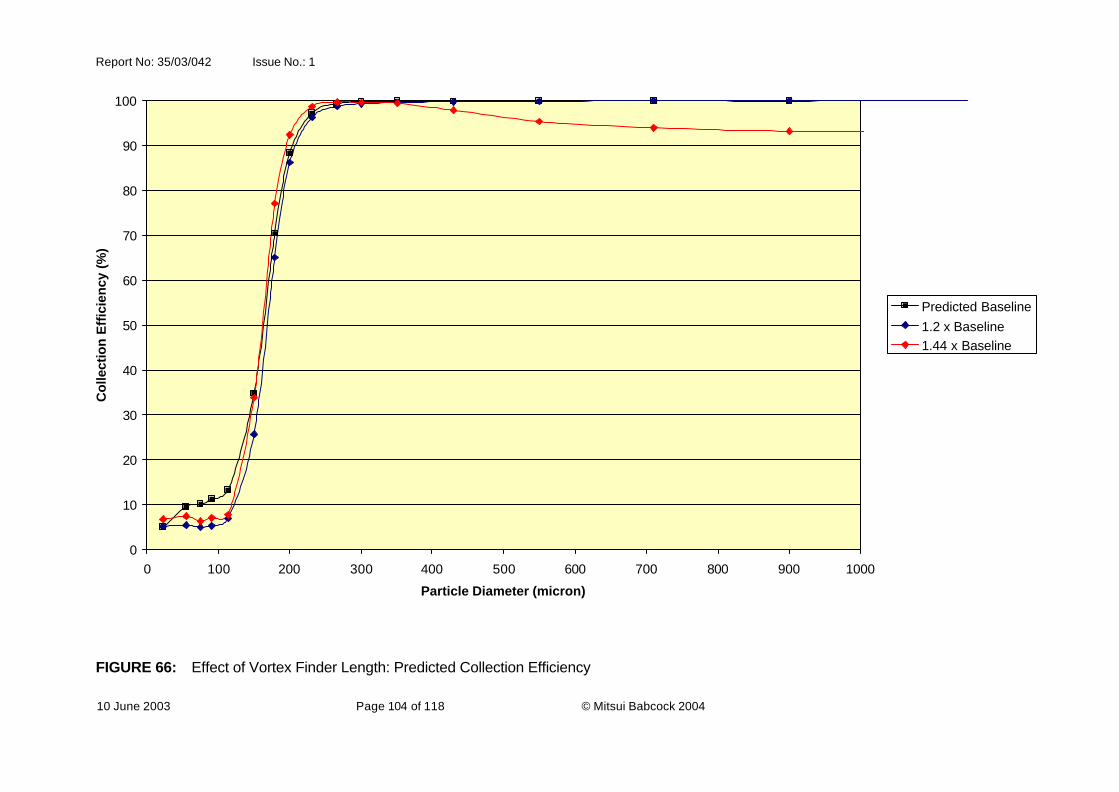
Report No: 35/03/042 Issue No.: 1
10 June 2003 Page 104 of 118 © Mitsui Babcock 2004
FIGURE 66: Effect of Vortex Finder Length: Predicted Collection Efficiency
0
10
20
30
40
50
60
70
80
90
100
0 100 200 300 400 500 600 700 800 900 1000
Particle Diameter (micron)
Co
llect
ion
Eff
icie
ncy
(%
)
Predicted Baseline1.2 x Baseline1.44 x Baseline

Report No: 35/03/042 Issue No.: 1
10 June 2003 Page 105 of 118 © Mitsui Babcock 2004
FIGURE 67: Effect of Vane Design and Number: Modelled Geometries
Baseline 16 Flat Plate Vanes 24 Flat Plate VanesBaseline 16 Flat Plate Vanes 24 Flat Plate Vanes
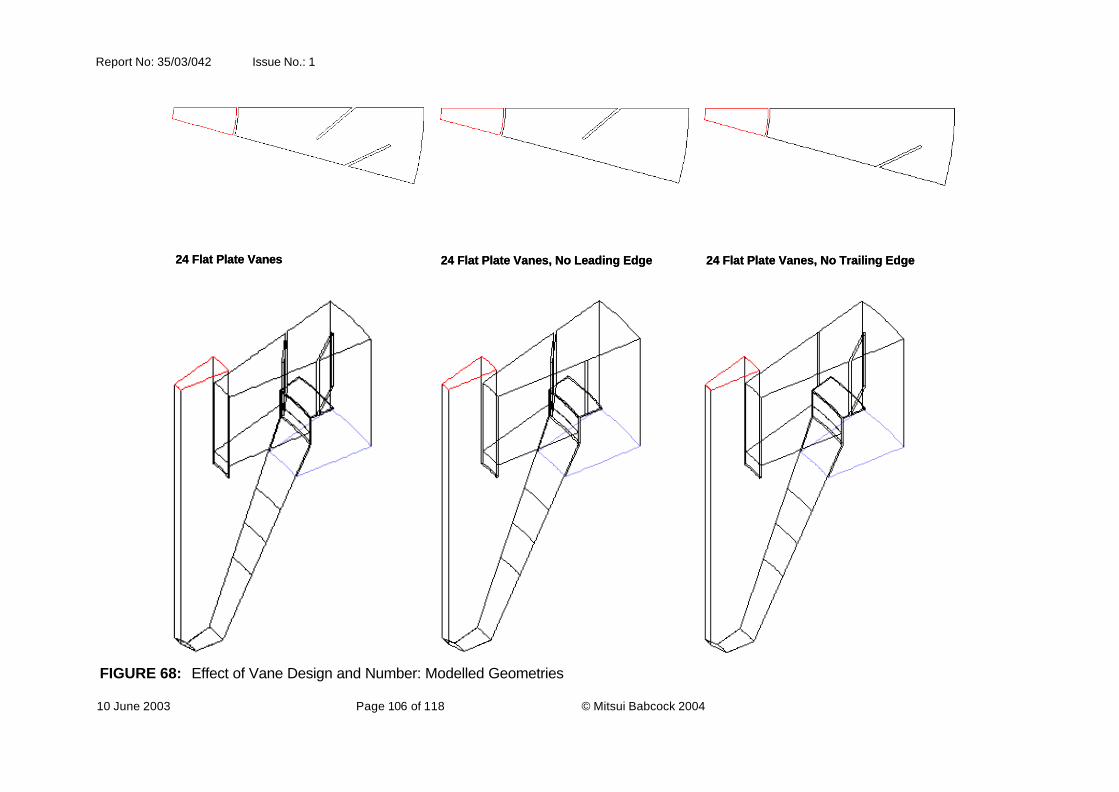
Report No: 35/03/042 Issue No.: 1
10 June 2003 Page 106 of 118 © Mitsui Babcock 2004
FIGURE 68: Effect of Vane Design and Number: Modelled Geometries
24 Flat Plate Vanes, No Leading Edge 24 Flat Plate Vanes, No Trailing Edge24 Flat Plate Vanes 24 Flat Plate Vanes, No Leading Edge 24 Flat Plate Vanes, No Trailing Edge24 Flat Plate Vanes
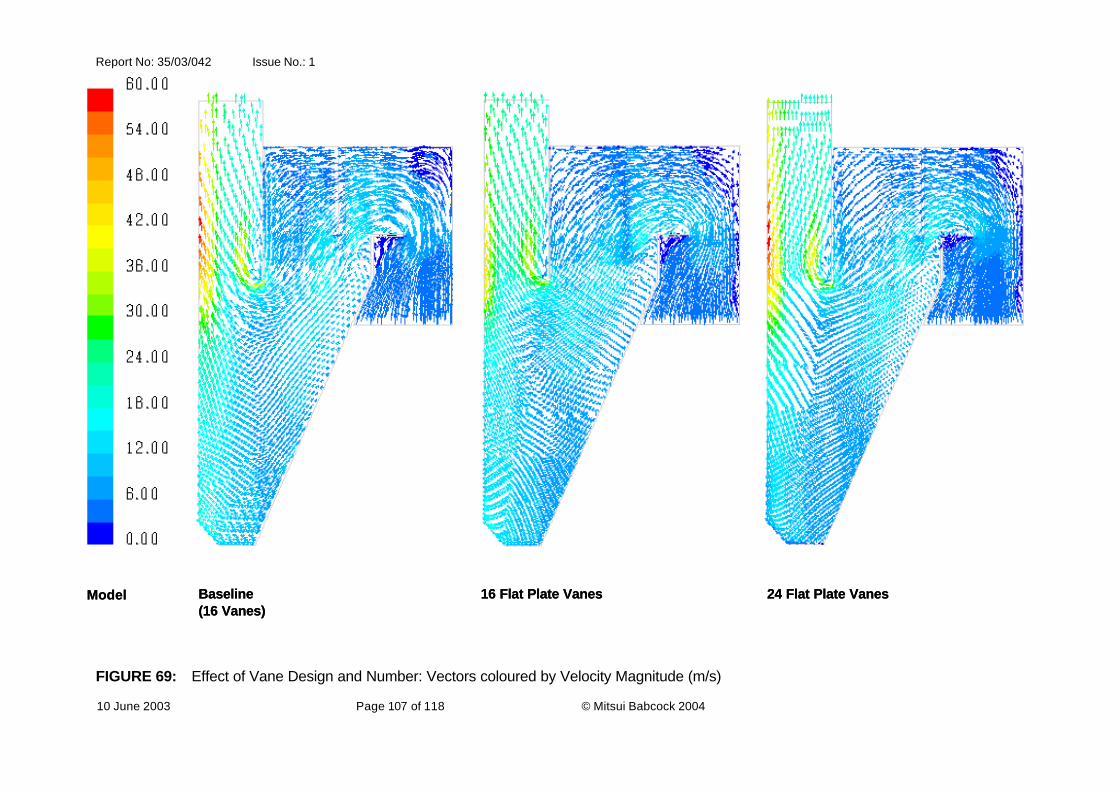
Report No: 35/03/042 Issue No.: 1
10 June 2003 Page 107 of 118 © Mitsui Babcock 2004
FIGURE 69: Effect of Vane Design and Number: Vectors coloured by Velocity Magnitude (m/s)
Model Baseline(16 Vanes)
16 Flat Plate Vanes 24 Flat Plate VanesModel Baseline(16 Vanes)
16 Flat Plate Vanes 24 Flat Plate Vanes
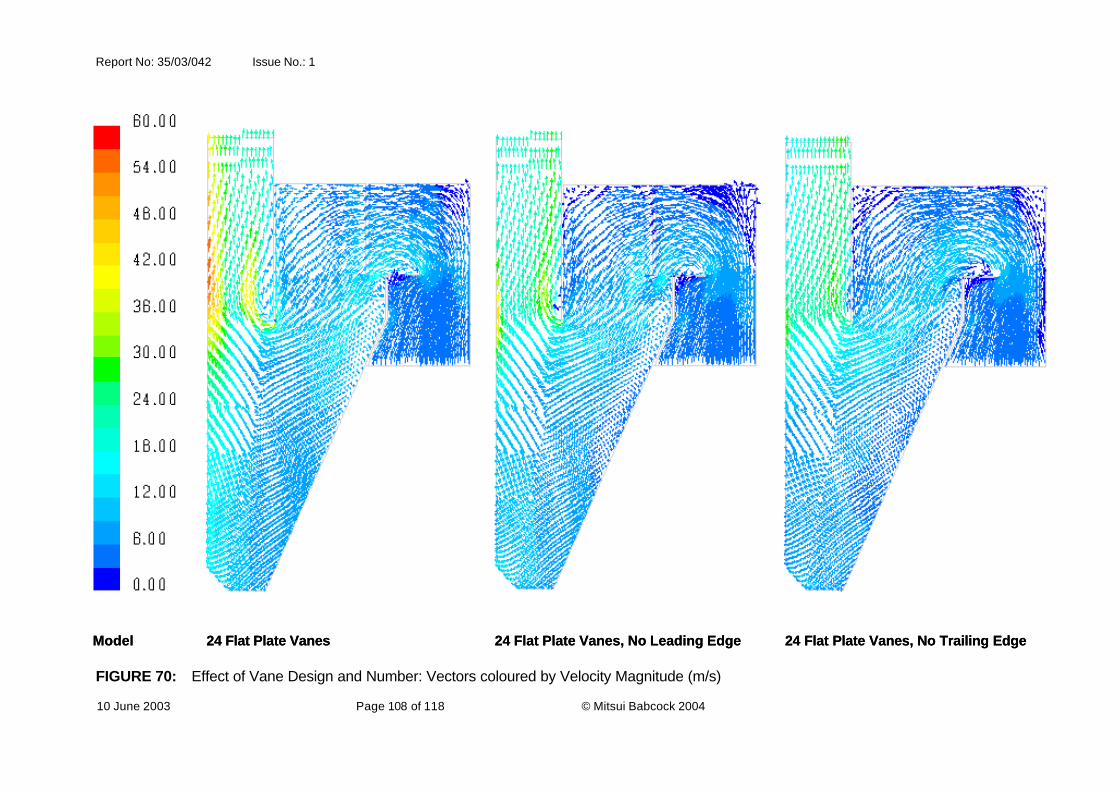
Report No: 35/03/042 Issue No.: 1
10 June 2003 Page 108 of 118 © Mitsui Babcock 2004
FIGURE 70: Effect of Vane Design and Number: Vectors coloured by Velocity Magnitude (m/s)
Model 24 Flat Plate Vanes 24 Flat Plate Vanes, No Leading Edge 24 Flat Plate Vanes, No Trailing EdgeModel 24 Flat Plate Vanes 24 Flat Plate Vanes, No Leading Edge 24 Flat Plate Vanes, No Trailing Edge

Report No: 35/03/042 Issue No.: 1
10 June 2003 Page 109 of 118 © Mitsui Babcock 2004
FIGURE 71: Effect of Vane Design and Number: Predicted Collection Efficiency
0
10
20
30
40
50
60
70
80
90
100
0 100 200 300 400 500 600 700 800 900 1000
Particle Diameter (micron)
Co
llect
ion
Eff
icie
ncy
(%
)
Predicted Baseline16 Flat Plate Vanes24 Flat Plate Vanes
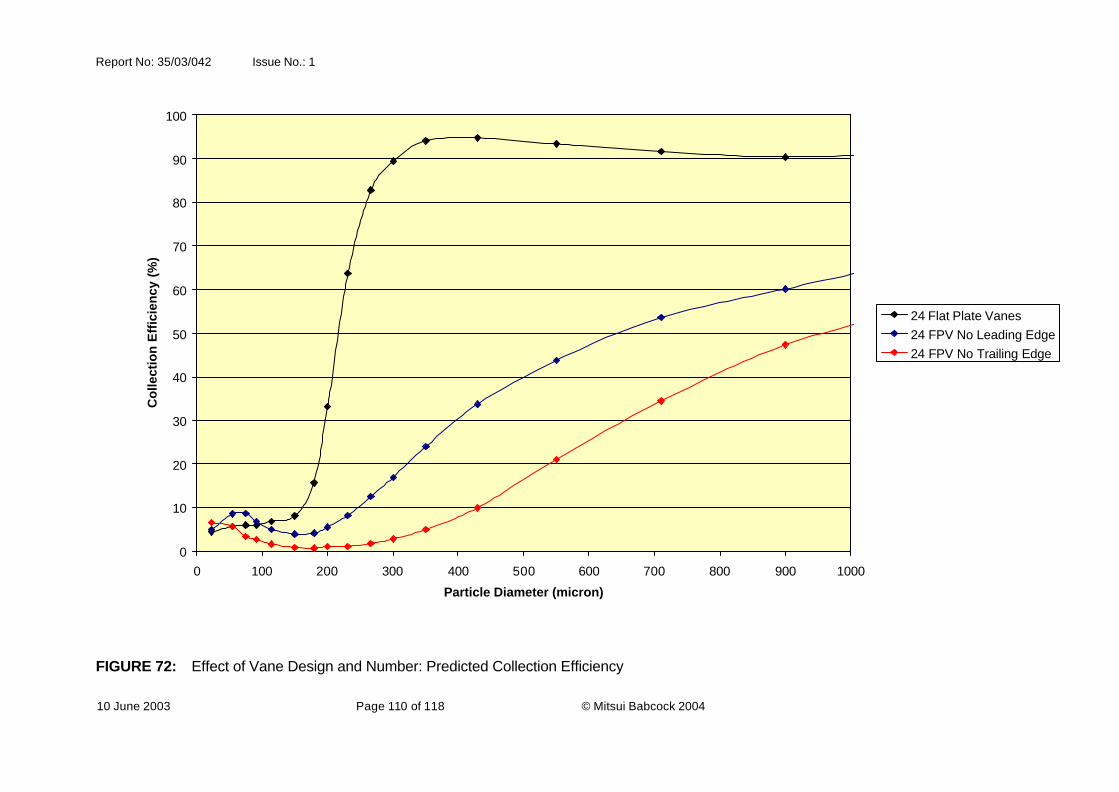
Report No: 35/03/042 Issue No.: 1
10 June 2003 Page 110 of 118 © Mitsui Babcock 2004
FIGURE 72: Effect of Vane Design and Number: Predicted Collection Efficiency
0
10
20
30
40
50
60
70
80
90
100
0 100 200 300 400 500 600 700 800 900 1000
Particle Diameter (micron)
Co
llect
ion
Eff
icie
ncy
(%
)
24 Flat Plate Vanes24 FPV No Leading Edge24 FPV No Trailing Edge

Report No: 35/03/042 Issue No.: 1
10 June 2003 Page 111 of 118 © Mitsui Babcock 2004
FIGURE 73: Effect of Cylindrical Section Height: Vectors coloured by Velocity Magnitude (m/s)
2.42 x BaselineModel Baseline 1.61 x Baseline 2.42 x BaselineModel Baseline 1.61 x Baseline

Report No: 35/03/042 Issue No.: 1
10 June 2003 Page 112 of 118 © Mitsui Babcock 2004
FIGURE 74: Effect of Cylindrical Section Height: Predicted Collection Efficiency
0
10
20
30
40
50
60
70
80
90
100
0 100 200 300 400 500 600 700 800 900 1000
Particle Diameter (micron)
Co
llect
ion
Eff
icie
ncy
(%
)
Predicted Baseline1.61 x Baseline2.42 x Baseline
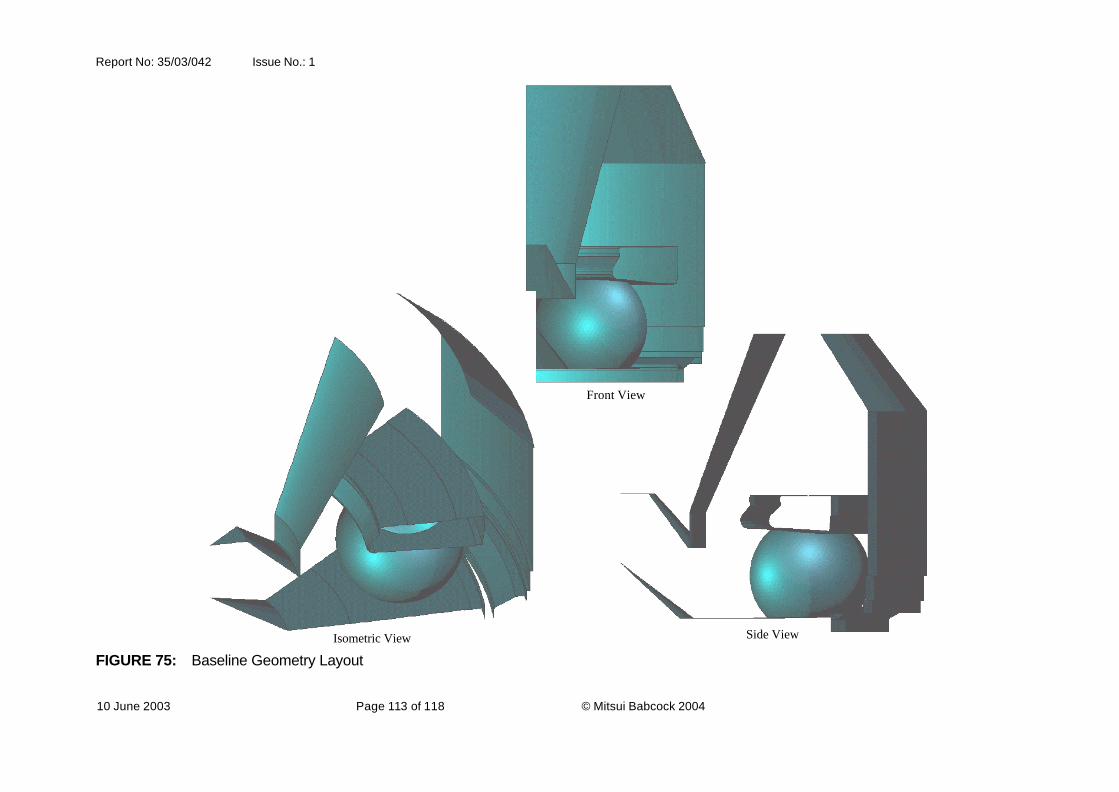
Report No: 35/03/042 Issue No.: 1
10 June 2003 Page 113 of 118 © Mitsui Babcock 2004
FIGURE 75: Baseline Geometry Layout
Isometric View Side View
Front View
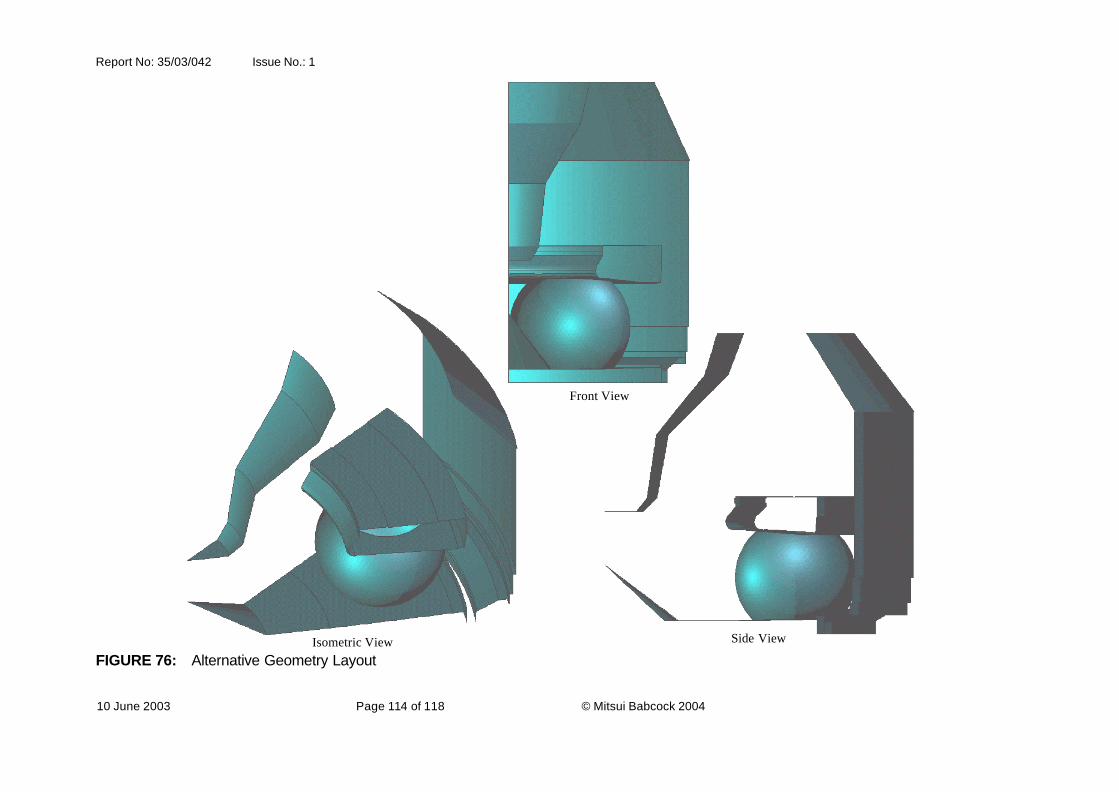
Report No: 35/03/042 Issue No.: 1
10 June 2003 Page 114 of 118 © Mitsui Babcock 2004
FIGURE 76: Alternative Geometry Layout Isometric View Side View
Front View
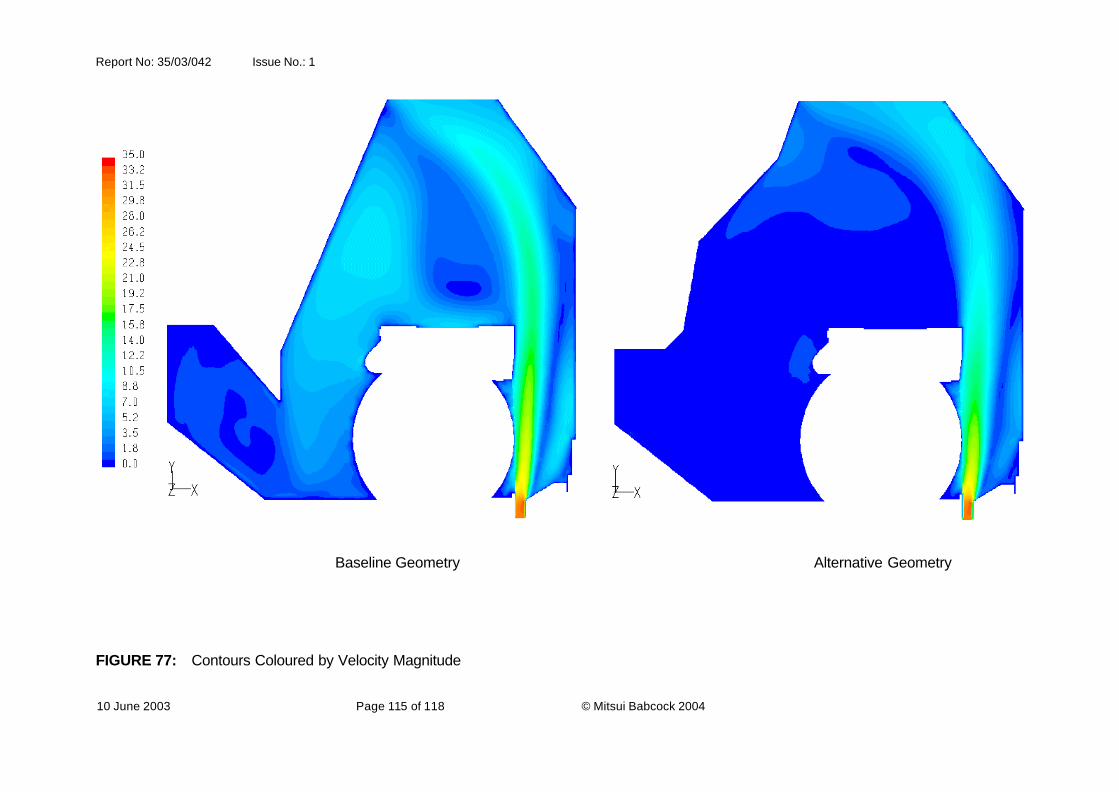
Report No: 35/03/042 Issue No.: 1
10 June 2003 Page 115 of 118 © Mitsui Babcock 2004
Baseline Geometry Alternative Geometry
FIGURE 77: Contours Coloured by Velocity Magnitude
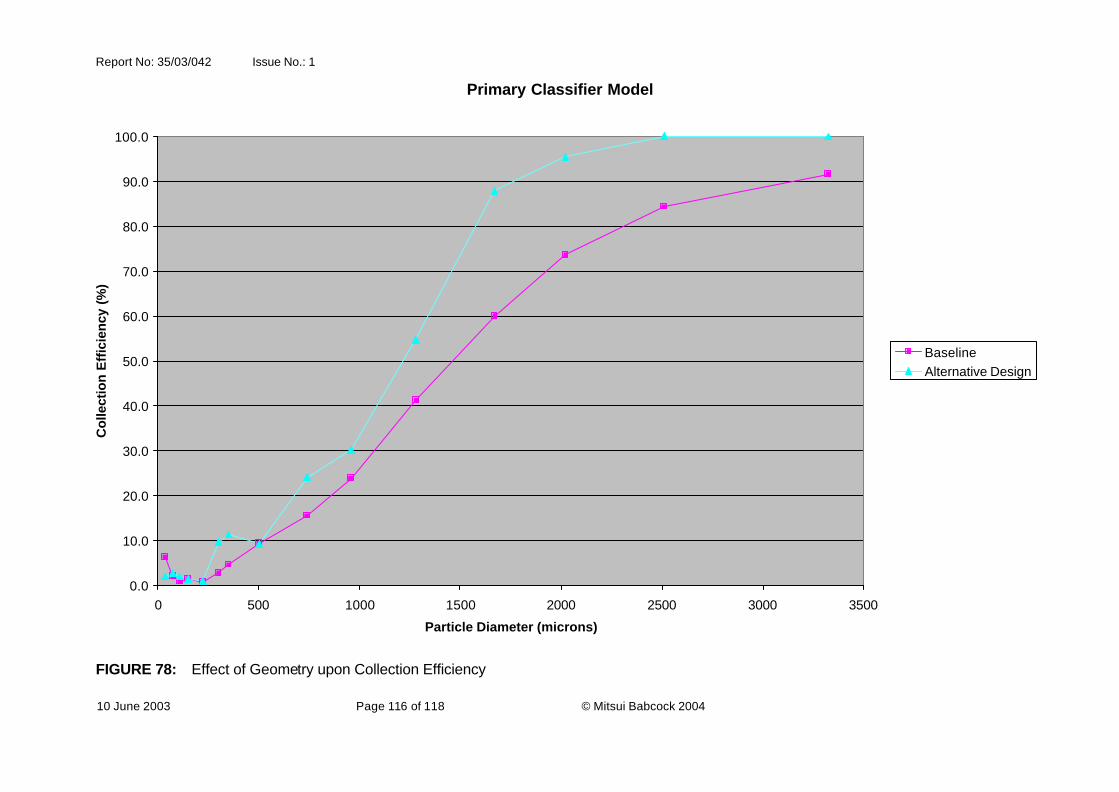
Report No: 35/03/042 Issue No.: 1
10 June 2003 Page 116 of 118 © Mitsui Babcock 2004
FIGURE 78: Effect of Geometry upon Collection Efficiency
Primary Classifier Model
0.0
10.0
20.0
30.0
40.0
50.0
60.0
70.0
80.0
90.0
100.0
0 500 1000 1500 2000 2500 3000 3500
Particle Diameter (microns)
Co
llect
ion
Eff
icie
ncy
(%
)
BaselineAlternative Design
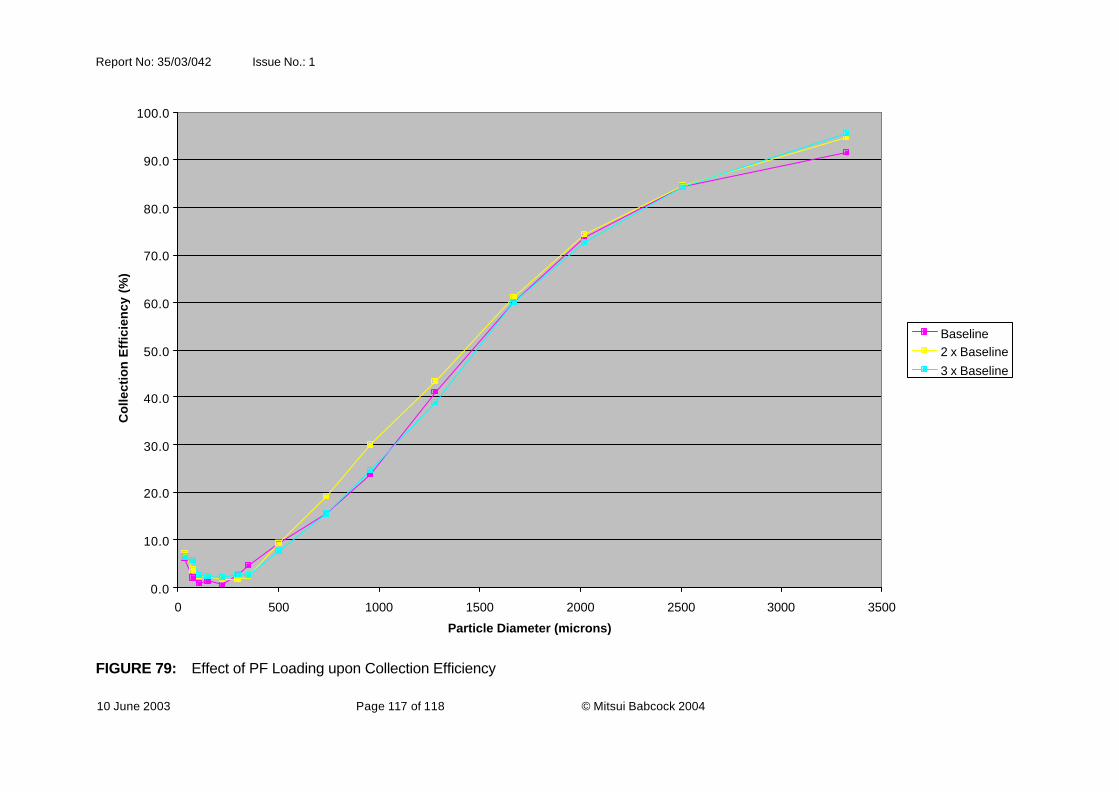
Report No: 35/03/042 Issue No.: 1
10 June 2003 Page 117 of 118 © Mitsui Babcock 2004
FIGURE 79: Effect of PF Loading upon Collection Efficiency
0.0
10.0
20.0
30.0
40.0
50.0
60.0
70.0
80.0
90.0
100.0
0 500 1000 1500 2000 2500 3000 3500
Particle Diameter (microns)
Co
llect
ion
Eff
icie
ncy
(%
)
Baseline2 x Baseline3 x Baseline

Report No: 35/03/042 Issue No.: 1
10 June 2003 Page 118 of 118 © Mitsui Babcock 2004
FIGURE 80: Effect of Injection Release Location upon Collection Efficiency
0.0
10.0
20.0
30.0
40.0
50.0
60.0
70.0
80.0
90.0
100.0
0 500 1000 1500 2000 2500 3000 3500
Particle Diameter (microns)
Co
llect
ion
Eff
icie
ncy
(%
)
Baseline - InletAlternative - Inlet Baseline - Mill Table LevelAlternative - Mill Table Level