Artificial Neural Network (ANN) loosely based on biological neuron

_____________________________________________________________________________________________________ *Corresponding author: E-mail: [email protected];
Journal of Energy Research and Reviews 5(4): 26-38, 2020; Article no.JENRR.58561 ISSN: 2581-8368
Application of Artificial Neural Network (ANN) in the Optimization of Crude Oil Refinery Process: New
Port-Harcourt Refinery
M. N. Braimah1*
1Department of Chemical Engineering, Applied Thermodynamics and Process Design Unit,
Obafemi Awolowo University, Ile-Ife, Osun State, Nigeria.
Author’s contribution
The sole author designed, analysed, interpreted and prepared the manuscript.
Article Information
DOI: 10.9734/JENRR/2020/v5i430154
Editor(s): (1) Dr. Salisu Muhammad Lawan, Kano University of Science and Technology (KUST) Wudil, Nigeria.
Reviewers: (1) Ananth S. Iyengar, Ramaiah University of Applied Sciences, India.
(2) Mônica Santos de Araújo Abreu, Federal University of Pernambuco, Brazil. (3) Seyed Ali Hosseini, Urmia University, Iran.
Complete Peer review History: http://www.sdiarticle4.com/review-history/58561
Received 26 April 2020 Accepted 02 July 2020
Published 14 July 2020
ABSTRACT Background: Optimizing the process conditions of the crude distillation unit is a main challenge for each refinery. Optimization increases profit by producing the required range of distillates at maximum yield and at minimum cost. To achieve an acceptable control of product quality an artificial neural network (ANN) can be used. ANNs are used for engineering purposes, such as pattern recognition, forecasting, and data compression. In the petroleum refinery industry, ANN has been used as controller in for the crude distillation unit. The aim of the current study was to use ANN to optimize and achieve control of product quality of crude distillation unit of an oil refinery. Materials: The research was carried out using the following materials; The design flowchart and the operating data of the crude distillation unit of the New Port Harcourt refinery, Simulation software (HYSYS 2006.5) and Matlab for the ANN. Results: The ANN predicted the optimum operating conditions at which the atmospheric distillation unit (ADU) can operate with the least irreversibility and without changing the design and compromising the products quality. The corresponding exergy efficiency after optimization with
Original Research Article
Braimah; JENRR, 5(4): 26-38, 2020; Article no.JENRR.58561
27
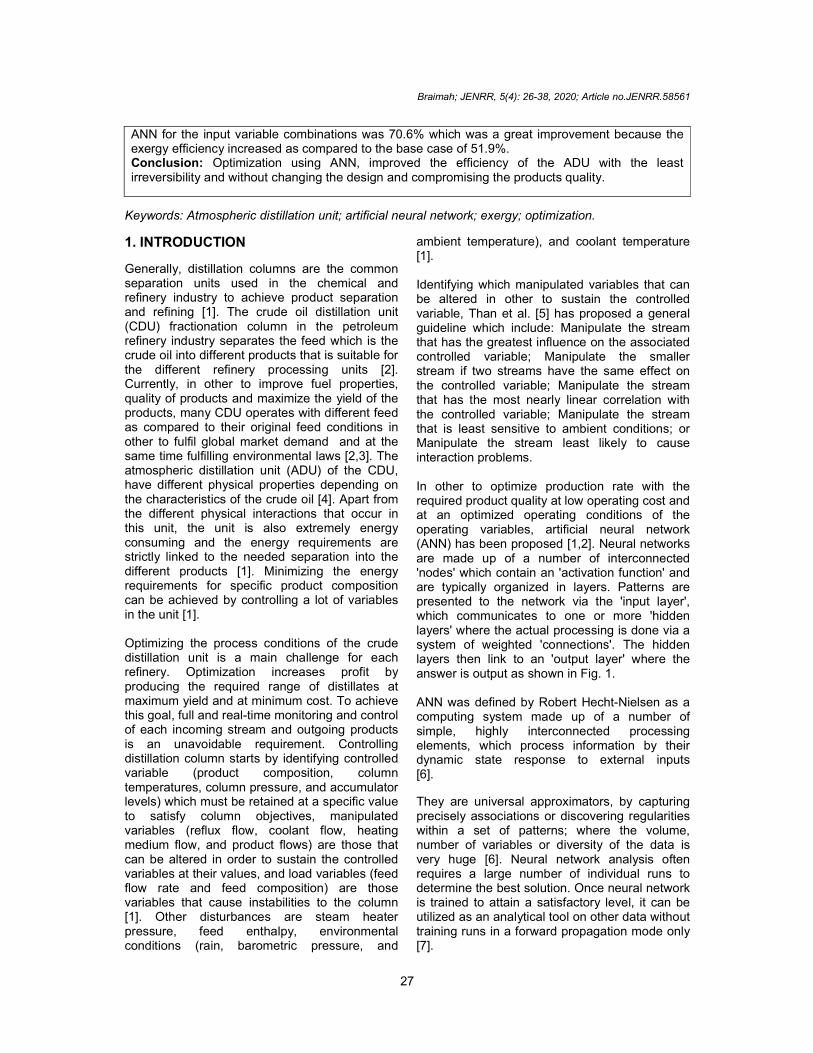
ANN for the input variable combinations was 70.6% which was a great improvement because the exergy efficiency increased as compared to the base case of 51.9%. Conclusion: Optimization using ANN, improved the efficiency of the ADU with the least irreversibility and without changing the design and compromising the products quality.
Keywords: Atmospheric distillation unit; artificial neural network; exergy; optimization.
1. INTRODUCTION
Generally, distillation columns are the common separation units used in the chemical and refinery industry to achieve product separation and refining [1]. The crude oil distillation unit (CDU) fractionation column in the petroleum refinery industry separates the feed which is the crude oil into different products that is suitable for the different refinery processing units [2]. Currently, in other to improve fuel properties, quality of products and maximize the yield of the products, many CDU operates with different feed as compared to their original feed conditions in other to fulfil global market demand and at the same time fulfilling environmental laws [2,3]. The atmospheric distillation unit (ADU) of the CDU, have different physical properties depending on the characteristics of the crude oil [4]. Apart from the different physical interactions that occur in this unit, the unit is also extremely energy consuming and the energy requirements are strictly linked to the needed separation into the different products [1]. Minimizing the energy requirements for specific product composition can be achieved by controlling a lot of variables in the unit [1]. Optimizing the process conditions of the crude distillation unit is a main challenge for each refinery. Optimization increases profit by producing the required range of distillates at maximum yield and at minimum cost. To achieve this goal, full and real-time monitoring and control of each incoming stream and outgoing products is an unavoidable requirement. Controlling distillation column starts by identifying controlled variable (product composition, column temperatures, column pressure, and accumulator levels) which must be retained at a specific value to satisfy column objectives, manipulated variables (reflux flow, coolant flow, heating medium flow, and product flows) are those that can be altered in order to sustain the controlled variables at their values, and load variables (feed flow rate and feed composition) are those variables that cause instabilities to the column [1]. Other disturbances are steam heater pressure, feed enthalpy, environmental conditions (rain, barometric pressure, and
ambient temperature), and coolant temperature [1]. Identifying which manipulated variables that can be altered in other to sustain the controlled variable, Than et al. [5] has proposed a general guideline which include: Manipulate the stream that has the greatest influence on the associated controlled variable; Manipulate the smaller stream if two streams have the same effect on the controlled variable; Manipulate the stream that has the most nearly linear correlation with the controlled variable; Manipulate the stream that is least sensitive to ambient conditions; or Manipulate the stream least likely to cause interaction problems. In other to optimize production rate with the required product quality at low operating cost and at an optimized operating conditions of the operating variables, artificial neural network (ANN) has been proposed [1,2]. Neural networks are made up of a number of interconnected 'nodes' which contain an 'activation function' and are typically organized in layers. Patterns are presented to the network via the 'input layer', which communicates to one or more 'hidden layers' where the actual processing is done via a system of weighted 'connections'. The hidden layers then link to an 'output layer' where the answer is output as shown in Fig. 1. ANN was defined by Robert Hecht-Nielsen as a computing system made up of a number of simple, highly interconnected processing elements, which process information by their dynamic state response to external inputs [6]. They are universal approximators, by capturing precisely associations or discovering regularities within a set of patterns; where the volume, number of variables or diversity of the data is very huge [6]. Neural network analysis often requires a large number of individual runs to determine the best solution. Once neural network is trained to attain a satisfactory level, it can be utilized as an analytical tool on other data without training runs in a forward propagation mode only [7].

Braimah; JENRR, 5(4): 26-38, 2020; Article no.JENRR.58561
28
New inputs are presented to the input pattern where they filter into and are processed by the middle layers as though training were taking place, however, at this point the output is retained and no back-propagation occurs. The output of a forward propagation run is the predicted model for the data which can then be used for further analysis and interpretation [7], this is illustrated in Fig. 2.
Applications of ANN in the chemical industry include; estimation of CO2 conversion in falling film reactor using artificial neural network where it was discovered that ANN model with one hidden layer and nine neurons in the hidden layer gives a very close estimation of the CO2 conversion with high potential for absorption [8]. Also, ANN models was used to estimate contaminant composition in a xylene distillation column in a refinery in Japan [9].
Several studies have used ANN in the design of CDU [3,10,11], however, ANN use has not been
very popular in the optimization of operating variables of CDU in the existing refineries. It is this void in the literature that the present study hopes to fill by studying the use of ANN in the optimization of CDU of an existing refinery. 1.1 Process Description This research focused on the atmospheric distillation unit of crude distillation unit of the New Port Harcourt Refinery. The crude distillation unit is made up of the pre-flash unit which increases the temperature of the crude oil so as to separate into different fractions mainly liquid and vapour phase after it has passed through cleaning process and desalination process. The vapour phase is sent straight to the refluxed absorber while the liquid phase is sent to heater then to a furnace before entering the refluxed absorber which then separates it into different products Fig. 3.
Fig. 1. A simple neural network showing nodes [6]

Fig
Fig. 3. Schematic diagram
Braimah; JENRR, 5(4): 26-38, 2020; Article no.JENRR.58561
29
Fig. 2. A single node example [6]
diagram of the CDU for New Port Harcourt refinery
; Article no.JENRR.58561
refinery

Braimah; JENRR, 5(4): 26-38, 2020; Article no.JENRR.58561
30
1.2 Exergy Exergy can be defined as the maximum amount of work which can be obtained as a process which is changed reversibly from the given state to a state of equilibrium with the environment, or the maximum work that can be obtained from any quantity of energy [12]. Exergy is divided into physical and chemical components [13].
1.3 Physical Exergy The physical exergy is the maximum useful work obtained by passing the unit of mass of a substance of the generic state (T, P) to the environmental (To, Po) state through purely physical processes [14-16]. The reference system is defined with a reference temperature of 298.15K and a reference pressure of 101.325 kPa. Thus, if kinetic and potential energy are not taken into consideration, the specific physical exergy can be determined with the enthalpy and entropy values of the stream (characterized by its composition), both at the generic state and the environmental state temperatures and pressure. The Equation 3 can be used to illustrate how to calculate physical exergy assuming steady-state steady flow conditions and assuming both potential and kinetic energy are not contributing to the system.
Ex�� = Ex� − Ex� = (H� − H�) − T�(S� − S�) =
∆Ex��� = ∆H − T�∆S (1)
1.4 Chemical Exergy
Chemical exergy is equal to the maximum amount of work obtainable when the substance under consideration is brought form the environmental state to the reference state by processes involving heat transfer and exchange
of substance only with the environment [17,18]. For a crude stream, the chemical exergy can be calculated from the standard molar chemical exergies of all identified components and pseudo-components as:
∆Ex�� = ∑ x� x��� + ∑ x� x� + RT� ∑ x�lnx� (2) Where,
x��� is the chemical exergy for pseudo-
components x� is the chemical exergy component i x� is the mole fraction of component i
1.5 Exergy Efficiency
The exergy efficiency for each process unit was calculated using Equation 3.
η =������ ��� �� ��������
������ �� �� ���� (3)
Irreversibility for each process unit was calculated using Equation 4.
I= ∑ Ex�� − ∑ Ex��� (4)
2. METHODOLOGY
The software (HYSYS 2006.5) was used for modeling and simulation of the crude distillation unit. The components that were chosen are from the refinery data includes water, methane, ethane, propane, i-butane, n-butane, i-pentane and n-pentane. The data from the simulation was exported to Microsoft Excel for exergy analysis. Parametric studies were performed by changing the operating variables (liquid inlet temperature, liquid inlet pressure, condenser temperature, condenser pressure, pump around flow rates 1, 2 and 3) to determine their effect on energy and
Table 1. Bulk crude data
Bulk crude properties Values API GRAVITY REID VAPOR PRESSURE 38ºCKaf/cm2 BS and W% VOL POUR POINT ºC ASH CONTENT %wt CONRANDSON CARBON RESIDUE %wt SALT CONTENT PTB KINEMATIC VISCOSITY at 38ºC WATER CONTENT %VOL NICKEL ppm LEAD ppm
34.87 0.3 0.1 < 0 0.00278 1 1.04 3.66 <0.05 0.022 0.027

Braimah; JENRR, 5(4): 26-38, 2020; Article no.JENRR.58561
31
exergy efficiencies. Data from the three most sensitive operating variables (liquid inlet temperature, liquid inlet pressure and condenser pressure) were chosen for optimization. The fluid package chosen for this process was Peng-Robison. The crude oil was characterized using experimental assay which include API gravity, bulk crude properties, light end volume percent, TBP distillation and ASTM distillation. The assay data was fed into the data bank of HYSYS, the parameters are presented in Table 1. The result of the characterization is a set of pseudo-components and a detailed chemical composition of the identified light end component and this is presented in Table 2.
Table 2. Light ends data
Component Percentage (%) Propane Isobutane n-butane Isopentane n-pentane
0.17 0.55 1.02 0.33 0.14
After the assay was calculated, the oil was cut and blended to produce hypothetical components that could be used in the simulation. This was done using the cut/blend tab on the oil manager environment. The cut was done using auto cut option which generates the hypothetical components based on the initial boiling point and the temperature ranges available. Once this was
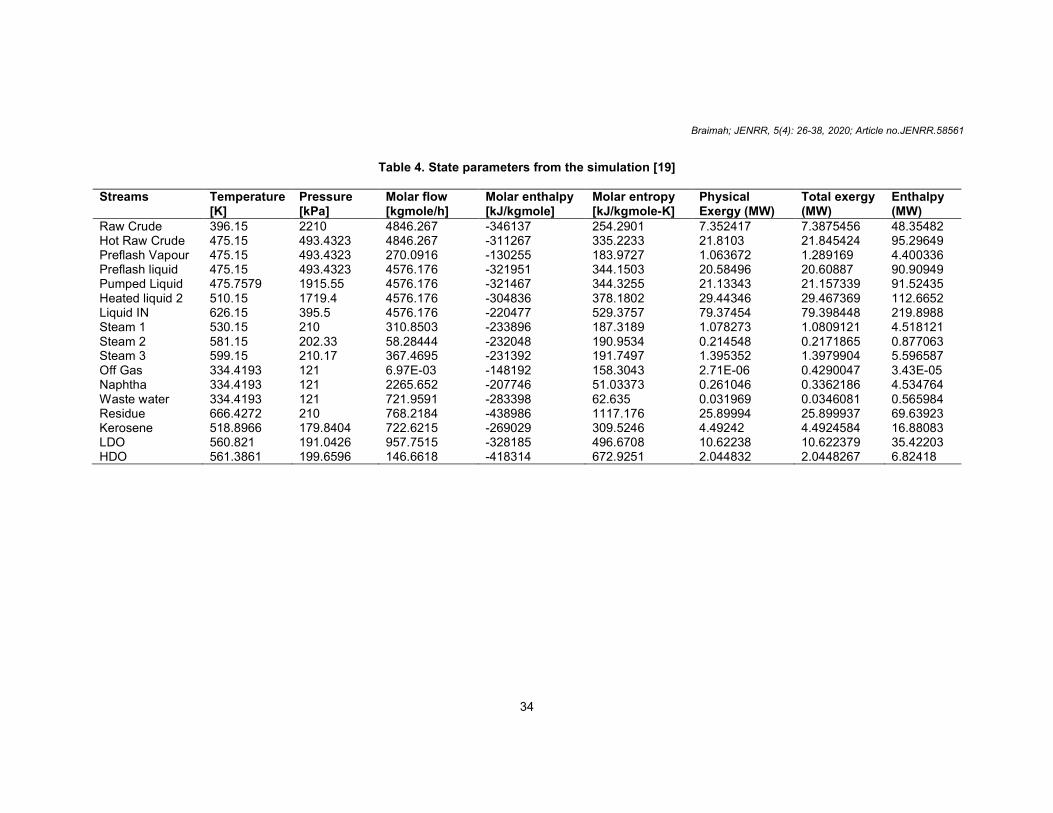
done, the oil was installed and made ready for use in simulation. The process stream parameters used in the simulation are as shown in Table 3. 3. RESULTS AND DISCUSSION The Simulation diagram of the crude distillation unit is shown in Fig. 4 and the simulation diagram of the atmospheric distillation unit is shown in Fig. 5. This is the main environment where the crude distillation unit was modeled using the operating and design data from the refinery. This was done to give a prototype of the actual refinery process. The simulation environment was entered and the raw crude temperature, pressure and mass flow rate values were imputed. After converging, the simulation flow diagram of the CDU is as shown in Fig. 4, while the simulation diagram of the ADU is as shown in Fig. 5. Table 4 shows the summarized state parameters from the simulation and the streams that were considered in the analysis. Equations 1 and 2 were used to calculate exergy analysis, equation 3 was used in calculating exergy efficiency while equation 4 was used to calculate irreversibility. The exergy efficiency result of the ADU was 51.9%. Every process has an element of irreversibility that makes it deviate from theoretical ideal performance and this is why exergy analysis of a process gives a better performance of a process than energy analysis [19,20].
Table 3. Process stream data
Streams Temperature [K] Pressure [kPa] Molar flow [kgmole/h] Raw Crude 396.15 2210 4846.267 Hot Raw Crude 475.15 493.4323 4846.267 Preflash Vapour 475.15 493.4323 270.0916 Preflash liquid 475.15 493.4323 4576.176 Pumped Liquid 475.7579 1915.55 4576.176 Heated liquid 2 510.15 1719.4 4576.176 Liquid IN 626.15 395.5 4576.176 Steam 1 530.15 210 310.8503 Steam 2 581.15 202.33 58.28444 Steam 3 599.15 210.17 367.4695 Off Gas 334.4193 121 6.97E-03 Naphtha 334.4193 121 2265.652 Waste water 334.4193 121 721.9591 Residue 666.4272 210 768.2184 Kerosene 518.8966 179.8404 722.6215 LDO 560.821 191.0426 957.7515 HDO 561.3861 199.6596 146.6618

Braimah; JENRR, 5(4): 26-38, 2020; Article no.JENRR.58561
32
Fig. 4. Simulation diagram of the CDU for New Port Harcourt refinery [19]

Braimah; JENRR, 5(4): 26-38, 2020; Article no.JENRR.58561
33
Fig. 5. Simulation diagram of the atmospheric distillation unit [19]
Braimah; JENRR, 5(4): 26-38, 2020; Article no.JENRR.58561
34
Table 4. State parameters from the simulation [19]
Streams
Temperature [K]
Pressure [kPa]
Molar flow [kgmole/h]
Molar enthalpy [kJ/kgmole]
Molar entropy [kJ/kgmole-K]
Physical Exergy (MW)
Total exergy (MW)
Enthalpy (MW)
Raw Crude 396.15 2210 4846.267 -346137 254.2901 7.352417 7.3875456 48.35482 Hot Raw Crude 475.15 493.4323 4846.267 -311267 335.2233 21.8103 21.845424 95.29649 Preflash Vapour 475.15 493.4323 270.0916 -130255 183.9727 1.063672 1.289169 4.400336 Preflash liquid 475.15 493.4323 4576.176 -321951 344.1503 20.58496 20.60887 90.90949 Pumped Liquid 475.7579 1915.55 4576.176 -321467 344.3255 21.13343 21.157339 91.52435 Heated liquid 2 510.15 1719.4 4576.176 -304836 378.1802 29.44346 29.467369 112.6652 Liquid IN 626.15 395.5 4576.176 -220477 529.3757 79.37454 79.398448 219.8988 Steam 1 530.15 210 310.8503 -233896 187.3189 1.078273 1.0809121 4.518121 Steam 2 581.15 202.33 58.28444 -232048 190.9534 0.214548 0.2171865 0.877063 Steam 3 599.15 210.17 367.4695 -231392 191.7497 1.395352 1.3979904 5.596587 Off Gas 334.4193 121 6.97E-03 -148192 158.3043 2.71E-06 0.4290047 3.43E-05 Naphtha 334.4193 121 2265.652 -207746 51.03373 0.261046 0.3362186 4.534764 Waste water 334.4193 121 721.9591 -283398 62.635 0.031969 0.0346081 0.565984 Residue 666.4272 210 768.2184 -438986 1117.176 25.89994 25.899937 69.63923 Kerosene 518.8966 179.8404 722.6215 -269029 309.5246 4.49242 4.4924584 16.88083 LDO 560.821 191.0426 957.7515 -328185 496.6708 10.62238 10.622379 35.42203 HDO 561.3861 199.6596 146.6618 -418314 672.9251 2.044832 2.0448267 6.82418

Braimah; JENRR, 5(4): 26-38, 2020; Article no.JENRR.58561
35
3.1 Artificial Neural Network (ANN) Results
The ANN was used to determine the optimum operating parameters that were obtained from the simulation results in other to get highest exergy efficiency without compromising the products qualities.
3.2 Artificial Neural Network Model The ANN was trained to represent the knowledge data base of the ADU operating system using the ADU simulated runs from HYSYS. 2840 data set as used in training the ADU. 15% of the data set was used to test the trained model. The relative error of the trained model and tested data was below 1x10
-4 which shows that the ANN model
was quite reliable in describing the input-output
relationship of the ADU. The ANN model was able to adequately represent the complex process of the ADU due to non-linear characteristics of the ANN structure. Fig. 6 illustrate the best linear regression fit of the training, testing, and validation and their combination for output and the target data of the ADU which is equals to 1. Fig. 7 presents the validation performance of the ADU which is 0.37143.
All of this showed that the trained model for the refinery predict accurately and it determines the outcome of changes in any of the input parameters. It also correlates the relationship between the input and output variables of the refinery. It also predicts and point out the effects of the operating variables on the products as well as the efficiency.
Fig. 6. Correlation between the predicted values and simulated values [19]

Braimah; JENRR, 5(4): 26-38, 2020; Article no.JENRR.58561
36
Fig. 7. Validation performance [19]
Table 5. Operating variables with minimum and maximum values before optimization Minimum operating value Maximum operating value Liquid inlet temperature 586.1 ºK 706.1 ºK Liquid inlet pressure 345.5 kPa 595.5 kPa Condenser temperature 304.4 ºK 394.4 ºK Condenser pressure 115 kPa 133 kPa Pump-around flow rate 1 520.6 m3/h 920.6 m3/h Pump-around flow rate 2 607.9 m3/h 1007.9 m3/h Pump-around flow rate 3 278.8 m
3/h 678.8 m
3/h
3.3 Optimum Operating Conditions
The optimization problem which consists of an objective function (exergy efficiency of 51.9% which was calculated with Equation 3) was maximized with constraints from design and operating conditions. The operating variables liquid inlet temperature, liquid inlet pressure, condenser temperature, condenser pressure, pump-around flow rate 1, 2 and 3 with maximum and minimum values within which the simulation of the refinery will converge on the HYSYS software were as shown in Table 5.
The knowledge database of the neural network model was used in the optimization procedures. About 96 generations were made and the output with the least error was returned as optimum.
The optimum operating variables derived after ANN optimization were liquid inlet temperature, liquid inlet pressure, condenser temperature, condenser pressure, pump-around flow rate 1, 2 and 3 were as shown in Table 6.
Table 6. Operating variables values after
optimization with ANN
Operating value Liquid inlet temperature 586.1 ºK Liquid inlet pressure 410.0 kPa Condenser temperature 332.6 ºK Condenser pressure 127.5 kPa Pump-around flow rate 1 696.3 m
3/h
Pump-around flow rate 2 799.0 m3/h
Pump-around flow rate 3 585.8 m3/h

Braimah; JENRR, 5(4): 26-38, 2020; Article no.JENRR.58561
37
The corresponding exergy efficiency for these combinations was 70.6%. This was a great improvement because the exergy efficiency increased as compared to the base case of 51.9%. The ANN predicted the optimum operating conditions at which the ADU can operate with the least irreversibility and without changing the design and compromising the products quality. This can assist the operators in the decision making of running the column efficiently and thus reduce the environmental implications of unutilized energy.
4. CONCLUSION The corresponding exergy efficiency for the combinations using ANN as optimization tool was 70.6% as compared to the base case of 51.9%. Optimization using ANN, improved the efficiency of the ADU with the least irreversibility and without changing the design and compromising the products quality.
ACKNOWLEDGEMENT
I want to acknowledge Prof A. N. Anozie and Dr O. J. Odejobi for supervising the research work. I also want to appreciate the contribution of Dr R.O Braimah in the final manuscript preparation.
COMPETING INTERESTS
Author has declared that no competing interests exist.
REFERENCES
1. Tonnang HEZ, Olatunbosun A. Neural network controller for a crude oil distillation column. ARPN Journal of Engineering and Applied Sciences. 2010;5(6):74-82.
2. Ahmed DF, Khalaf AH. Artificial neural networks controller for crude oil distillation column of Baiji refinery. J Chem Eng Process Technol. 2016;7:272-81.
3. Popoola LT, Babagana G, Susu AA. A review of an expert system design for crude oil distillation column using the neural networks model and process optimization and control using genetic algorithm framework. Advances in Chemical Engineering and Science. 2013;3:164-70.
4. Sampath Y. Framework for operability assessment of production facilities: An application to a primary unit of a crude oil
refinery. MSc Thesis, Department of Chemical Engineering. USA: Louisiana State University; 2009.
5. Than MT, Morris AJ, Wood RK. Multivariable and multivariate self-tuning control: A distillation column case study. IEEE Proceeding Symbol {126} D. Control Theory and Applications. 1991;138:9-24.
6. Maureen C. Neural network primer: Part I. AI Expert; 1989.
7. Haghi AK, Pogliani L, Torrens F, et al. Applied chemistry and chemical engineering. Interdisciplinary Approaches to Theory and Modeling with Applications. Oakville, Canada: Apple Academic Press. 2018;3:363.
8. Ahmed DW, Muayad AS, Maha IS. Eestimation of CO2 conversion in falling film reactor using artificial neural network. Diyala Journal of Engineering Sciences. 2008;1:86-100.
9. Sabharwal A, Bhat N, Wada T. Benefits of integrating empirical modelling and physical in an oil refinery application. Hydrocarbon Processing. 1997;76(10): 105.
10. Liau LCK, Yangb TCK, Tsaib MT. Expert system of a crude oil distillation unit for process optimization using neural networks. Expert Systems with Applications. 2004;26(2):247-55.
11. Torgashov A. Nonlinear process model-based self-optimizing control of complex crude distillation column. European Symposium on Computer Aided Process Engineering. 2001;9(11):793-98.
12. Kotas TJ. The exergy method of thermal plant analysis. Reprint Ed Ed. Melbourne, Florida: Krieger; 1995.
13. Kotas TJ. Concepts for thermal plant: Department of Mechanical Engineering, Queen Mary College, University of London. 1980;105-113.
14. Aspelund A. An extendend pinch analysis and design procedure utilizing pressure base exergy for subambiente cooling. App Therm Eng. 2007;27:2633–49.
15. Harvey S. Analysis of a reheat gas turbine cycle with chemical recuperation using aspen. Energy Convers Manag. 1997;38(15-17):1671–79.
16. Valero A. Exergy accounting: Capabilities and drawbacks. Energy. 2006;31:164-80.
17. Hinderink AP, Kerhof FP, Lie AB, Swean AJ, Van Der Kooi HJ. Exergy analysis with a flowsheeting simulator. Elsevier Science. 1996;4693-700.
Braimah; JENRR, 5(4): 26-38, 2020; Article no.JENRR.58561
38
18. Cengel YA, Boles MA. Thermodynamics: An engineering approach. 4
th Ed. New
York: McGraw-Hill; 2004. 19. Braimah MN. Exergy, exergoeconomic
analyses and optimization of crude distillation unit of New Port Harcourt
Refinery. PhD Thesis, Ile-Ife: Obafemi Awolowo University; 2015.
20. Osuolale FN. Ph.D. Thesis: Exergy and pinch analysis of crude oil distillation units of Warri and Kaduna Refineries. Ile-Ife: Obafemi Awolowo University; 2011.
_________________________________________________________________________________ © 2020 Braimah; This is an Open Access article distributed under the terms of the Creative Commons Attribution License (http://creativecommons.org/licenses/by/4.0), which permits unrestricted use, distribution, and reproduction in any medium, provided the original work is properly cited.
Peer-review history: The peer review history for this paper can be accessed here:
http://www.sdiarticle4.com/review-history/58561