
Application of Abundance Biomass Curve in Ecological...
10
* E-mail: [email protected] Application of Abundance Biomass Curve in Ecological Health Assessment of Khure-Mussa (Northwest of the Persian Gulf) Dehghan-Madiseh, Simin 1* ; Nabavi, Seyed Mohammad Bagher 2 ; Ghofleh-Marammazi, Jasem 1 ; Jahani, Najmeh 1 ; Koochaknejad, Emad 1 1- Department of Ecology, South of Iran Aquaculture Research Center, Ahvaz, IR Iran 2- Deputy of Marine Environment, Department of Environment, Tehran, IR Iran Received: May 2011 Accepted: December 2011 © 2012 Journal of the Persian Gulf. All rights reserved. Abstract Khuzestan coastal waters have high fisheries potential and ecological importance. Since different sources of stress exist in this area, the present study was conducted to evaluate ecological quality and to determine health status in Khuzestan coastal sediments based on benthic communities and their biological parameters. Seasonal sampling was done from 20 creeks of Khur-e-Mussa area in Khuzestan coastal waters by 0.125 m 2 Peterson grabsampler during winter 2008 to autumn 2009. Macro– invertebrates were separated, sorted and identified to the lowest possible taxon. In addition, biological parameters such as diversity, richness, biomass and abundance were calculated. The results were analyzed using univariate analysis method, ABC (Abundance–Biomass Curve). The most abundant groups were polychaets (58%), crustaceans (25%) and mollusk (9%), respectively. The ABC plots showed that majority ef creeks could be classified as moderately disturbed and polluted. The ranges of H' diversity index values in majority of stations indicated moderate ecological status. Keywords: ABC (Abundance-Biomass Curve), Benthic communities, Khur-e-Mussa area, Khuzestan coastal waters 1. Introduction Macrobenthic studies have achieved a fundamental role in estuarine and marine impact assessment and marine management. Because marine macrobenthic invertebrates usually exhibit well-defined responses to environmental change, especially those stressors which influence the sediment structure (McLusky and Elliott, 2004). Many researches have been carried out attempting to detect different stressors as result of environmental deterioration by using benthic communities in the coastal areas of the world (Gray and Wu, 2002; Borja et al., 2000; Muxika et al., 2003; Simboura, 2003; Borja et al., 2004; Borja and Muxika, 2005). In last two decades, the study of marine communities has benefited from the use of so-called graphical/distributional representations (Warwick and Clarke, 1991; Warwick, 1993), such as the Abundance–Biomass Comparison (ABC method) (Warwick 1986; Warwick et al. 1987). This method is conceptually intermediate between univariate and multivariate approaches, and in contrast with multivariate analyses It has the advantage that a value judgment can be compared with results Journal of the Persian Gulf (Marine Science)/Vol. 3/No. 7/March 2012/9/1-10
-
Upload
phungkhuong -
Category
Documents
-
view
215 -
download
0
Transcript of Application of Abundance Biomass Curve in Ecological...

* E-mail: [email protected]
Application of Abundance Biomass Curve in Ecological Health Assessment of Khure-Mussa
(Northwest of the Persian Gulf)
Dehghan-Madiseh, Simin1*; Nabavi, Seyed Mohammad Bagher2; Ghofleh-Marammazi, Jasem1; Jahani, Najmeh1; Koochaknejad, Emad1
1- Department of Ecology, South of Iran Aquaculture Research Center, Ahvaz, IR Iran 2- Deputy of Marine Environment, Department of Environment, Tehran, IR Iran
Received: May 2011 Accepted: December 2011
© 2012 Journal of the Persian Gulf. All rights reserved.
Abstract Khuzestan coastal waters have high fisheries potential and ecological importance. Since different sources of stress exist in this area, the present study was conducted to evaluate ecological quality and to determine health status in Khuzestan coastal sediments based on benthic communities and their biological parameters. Seasonal sampling was done from 20 creeks of Khur-e-Mussa area in Khuzestan coastal waters by 0.125 m2 Peterson grabsampler during winter 2008 to autumn 2009. Macro–invertebrates were separated, sorted and identified to the lowest possible taxon. In addition, biological parameters such as diversity, richness, biomass and abundance were calculated. The results were analyzed using univariate analysis method, ABC (Abundance–Biomass Curve). The most abundant groups were polychaets (58%), crustaceans (25%) and mollusk (9%), respectively. The ABC plots showed that majority ef creeks could be classified as moderately disturbed and polluted. The ranges of H' diversity index values in majority of stations indicated moderate ecological status.
Keywords: ABC (Abundance-Biomass Curve), Benthic communities, Khur-e-Mussa area, Khuzestan coastal waters
1. Introduction
Macrobenthic studies have achieved a fundamental
role in estuarine and marine impact assessment and
marine management. Because marine macrobenthic
invertebrates usually exhibit well-defined responses to
environmental change, especially those stressors which
influence the sediment structure (McLusky and
Elliott, 2004).
Many researches have been carried out attempting
to detect different stressors as result of environmental
deterioration by using benthic communities in the
coastal areas of the world (Gray and Wu, 2002;
Borja et al., 2000; Muxika et al., 2003; Simboura,
2003; Borja et al., 2004; Borja and Muxika, 2005). In last two decades, the study of marine
communities has benefited from the use of so-called
graphical/distributional representations (Warwick
and Clarke, 1991; Warwick, 1993), such as the
Abundance–Biomass Comparison (ABC method)
(Warwick 1986; Warwick et al. 1987). This method
is conceptually intermediate between univariate and
multivariate approaches, and in contrast with
multivariate analyses It has the advantage that a
value judgment can be compared with results
Journal of the Persian Gulf
(Marine Science)/Vol. 3/No. 7/March 2012/9/1-10

reg
(W
abu
dif
res
19
ass
pre
cur
lea
dis
of
ent
thr
com
and
tim
com
19
ma
(D
Do
sho
var
abi
pre
La
and
im
usi
Co
ma
Mu
20
eva
ind
qu
in
me
con
gardless of a
Warwick and
The ABC m
undance and
fferential pe
sponse to
93 and 198
sumption th
esence of la
rve lying ent
ast the first
sturbed comm
small indi
tirely above
ree species
mmunities.
d crossed fo
mes). Origin
mmunities o
86), it has
arine habitat
Dauer et al. 1
ozey et al. 1
ould be dete
rious biolog
ility to pre
eviously kn
ardicci and R
d Yamen an
mpact of fish
ing dominan
omparison (
acrobenthic
ussa creeks
00) but a
aluation in K
dices (Dehgh
The aim of
ality in twen
Khuzestan
ethod was u
ntaminant w
any compari
Clarke, 1991
method is a
d biomass d
erformance
environment
86). This m
hat in undis
arge organism
tirely above t
t three spe
munities, do
ividuals, th
the biomass
plotted i
These curve
or the first th
nally propos
on subtidal
subsequentl
ts, with var
993; Pencza
1999). The u
ermined in d
gical compo
edict change
nown (McM
Rossi 1998).
nd his collea
heries on de
nce curves
(ABC) curv
abundance
have been c
few studie
Khure-Mussa
han-Madiseh
this study w
nty tidal cree
coastal wate
used to deter
which induce
Dehghan-M
ison with co
1).
an internal c
distributions
of those di
tal conditio
method is b
sturbed com
ms results in
the abundan
ecies plotted
minated by
e abundanc
s curve for at
n moderate
es are close
hree species
sed for mac
soft substr
ly been app
rying degree
akand Kruk 1
utility of the
different hab
onents, acco
es in biotic
Manus and
Jouffre and
agues (2005)
emersal fish
and Abunda
ves. Severa
and diversi
carried out (
es were don
a by using d
h 2008; Dosts
was to evalu
eks in Khur-
ers. For this
rmine the sp
ed by prob
Madiseh et al.
ontrol locatio
comparison
based on th
istributions
ons (Warwic
based on th
mmunities, th
n the bioma
ce curve for
d; in gross
large numbe
ce curve li
t least the fir
ely disturbe
ely coincide
(one or mo
cro-zoobenth
ata (Warwic
plied to oth
es of succe
1999; Stento
e ABC mod
bitates and f
ording to i
c data seri
Pauly 199
d Inejih (200
) assessed th
h assemblag
ance Bioma
al studies o
ity in Khur
(Nabavi 199
ne on heal
different biot
shenas 2009)
uate ecologic
-e-Mussa are
reason, AB
patial sedime
able pollutio
/ Application
2
on
of
he
in
ck
he
he
ass
at
sly
ers
ies
rst
ed
ent
ore
hic
ck
her
ess
on-
del
for
its
ies
90;
05)
he
ges
ass
on
re-
97,
lth
tic
).
cal
ea,
BC
ent
on
sourc
and f
of m
2. M
Tw
North
Seas
autum
macr
organ
grab
Fig. (2008SemaShipp16-Kh19- K
FosieveorganseparusingCarpwere
A
Biom
Marg
of Abundanc
ces in this ar
fisheries activ
many types of
Materials and
wenty creek
hwest of the
onal samplin
mn 2009. T
robenthos stu
nic matter (
(0.125 m2).
1: The locatio8-09) 1-Ghanamaili 7-oil stationping station 13hure-mussa (1)
Khure-Mussa(4)
or macrobented through anisms wererated to the g: Barnes 1penter and Nie counted and
bundance (
mass (g/m2),
galef richnes
e Biomass Cu
rea such as, r
vity, several
industries.
d Methods
ks in Khu
e Persian Gu
ng was carried
Three replic
udying, grain
(TOM) were
on of studied m 2-Patil 3-Bihn 8-Odleh 9-Ja3-Ahmadi 14-P) 17- Khure-M 20- Khure-Mu
thos study, saa 0.5 mm me removedlowest anim987; Jones iem1998; Ste
d weighted.
(number of
diversity (S
ss indices w
urve in Ecolog
riverine inpu
out falls and
ure-Mussa a
ulf were stud
d out from wi
cates of ea
n size analy
e obtained
creeks in Khuhad 4-Ghazale afari 10-Zangi Petrochemy sta
Mussa(2) 18- Kussa(5)
amples were mesh screen . Macroben
mal taxonomic1986; Hutc
errer1986) an
f individual
Shannon-Wie
were calculate
gical Health…
uts, shipping
d discharging
area in the
died (Fig. 1).
inter 2008 to
ach site for
sis and total
by Peterson
ure-Mussa area5-Majidieh 6-
11-Doragh 12-ation 15-MaaviKhure-Mussa(3)
immediatelyand benthic
nthos werec groups (bychings 1984;nd all species
l per m2),
ener H') and
ed. For each
g
g
e
.
o
r
l
n
a --i )
y c e y ; s
,
d
h

station, do
biomass we
(Warwick 1
in order of
of abundan
using PRIM
the abundan
W-statistic (
and an even
for undistur
grossly dis
also were c
equation:
Where B
Ai is the rel
the number
using SPSS
3. Results
The orga
sediments
95.59%, res
Fig. 2: Variatiin Khure-Mus
The lo
KhureMuss
(10.90) and
ominance c
ere obtained
1986). In the
importance
nce or bioma
MER statistica
nce curve an
(Yemane et a
n abundance d
rbed, and the
sturbed. The
computed fo
Bi is the relati
lative abunda
r of species
14 software
anic matter
were 10.57
spectively (F
ion of total orgsa creeks
owest perc
sa 3 (10.57)
d the highes
curves for
d following t
e method, sp
based on pe
ass. The plot
al software.
nd the bioma
al., 2005). Bi
distribution g
e reverse case
e W-statistic
or each case
ive biomass
ance of the it
s. ANOVAs
e.
and silt-cla
7 to 29.75%
Fig. 2).
ganic matter and
centage va
), Patil (10.
st percentage
Journal
abundance
the ABC me
pecies are ra
ercent domin
ts were prod
The area bet
ass curve is c
iomass domin
gives a value
e a value of -
cs (Clarke 1
by applyin
of the ith spe
th species and
were calcu
ay percentag
% and 63.6
d silt-clay perc
alues were
80) and So
e values we
l of the Persia
3
and
ethod
anked
nance
duced
tween
called
nance
of +l
-1 for
1990)
ng the
ecies,
d S is
ulated
ge of
60 to
entage
e in
omaili
ere in
D
M
A
si
si
d
A
d
(P
b
id
C
N
S
ab
T
m
P
M
in
F
b
(p
Fi
in
an Gulf (Marin
Doragh (29.7
Majidie (21.5
ANOVA of
ignificant dif
ignificant d
ifferent cree
ANOVA sho
ifferent cre
P<0.05), how
etween seaso
In total, 28
dentified in
Crustacean (3
Nemertean,
eapens and
bundance an
Table 1. The p
macrobenthic fa
Taxa APolychaeta Crustacea Mollusca Seapen Others
Means of
n different s
Figures 3 and
Two way A
etween creek
p<0.05).
ig. 3: Variation
n different seaso
ne Science)/Vo
75), Ghazale
59) and Ship
f silt-clay
fference betw
differences
eks (P<0.05
wed no sign
eeks based
wever, there
ons (P<0.05)
8 faunal grou
ncluding Po
32 families)
Echinoderm
Bryozoans.
nd biomass (T
percentage of t
auna in Khure-M
Abundance (%58.06 24.82 9.35 5.24 2.53
macrobentho
seasons and
4, respective
ANOVAs sh
ks and season
n of macrobenth
ons (2008-2009
Vol .3/No. 7/Ma
eh (24.30),
pping-st. (19
percentages
ween season
were obse
5). In addit
nificant diffe
on total o
were signific
).
ups of benthi
olychaetes
), Mollusca
mata, Echiu
Each group
Table 1).
total biomass
Mussa creeks
%) Taxa Seapen
MolluscaPolychaetCrustacea
os abundanc
creeks are
ely.
howed signifi
ns based on m
hic means abun
9)
March 2012/9/1
Zangi (21.8
9.46). Two w
s showed
ns (P<0.05),
erved betw
tion, two w
erence betw
organic ma
cant differen
ic animals w
(25 famili
(23 famili
ura, Tunica
p differed in
and abundance
Biomass (%94.24
a 2.61 ta 2.08 a 1.07
ce and biom
represented
icant differen
mean abunda
ndance and biom
1-10
80),
way
no
but
een
way
een
atter
nces
were
ies),
ies),
ates,
its
e of
%)
mass
d in
nces
ance
mass
Dehghan-Madiseh et al. / Application of Abundance Biomass Curve in Ecological Health…
4
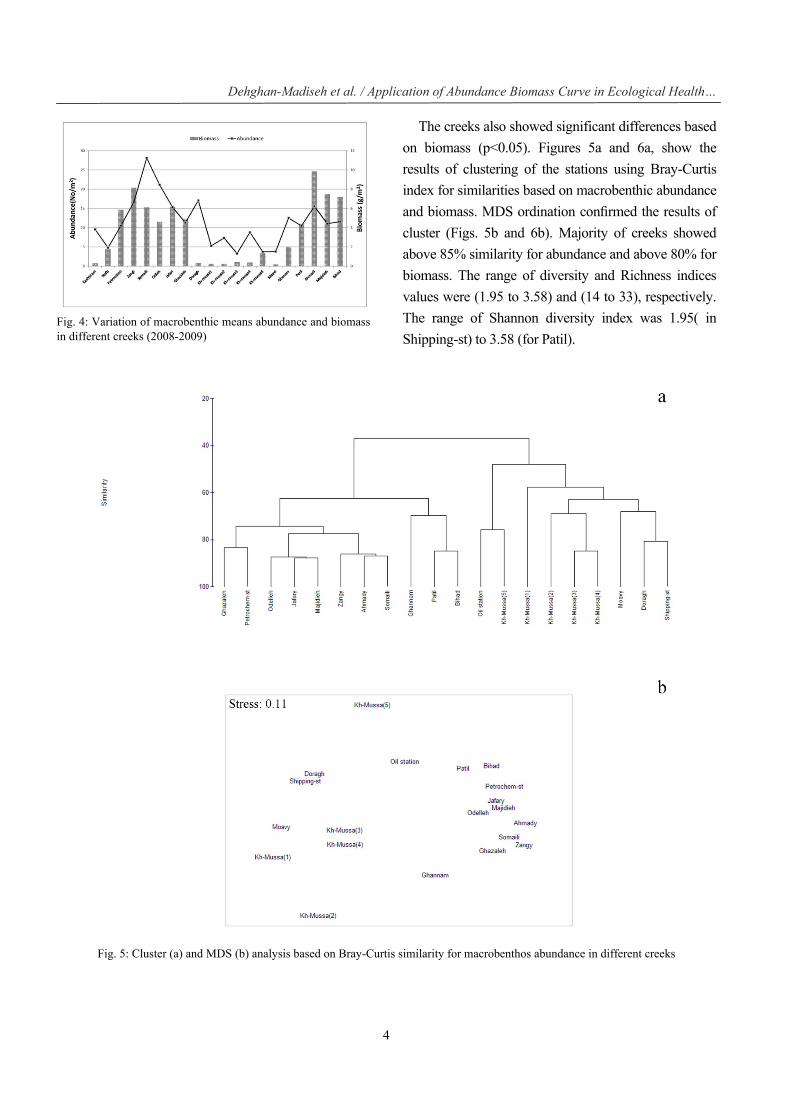
Fig. 4: Variation of macrobenthic means abundance and biomass in different creeks (2008-2009)
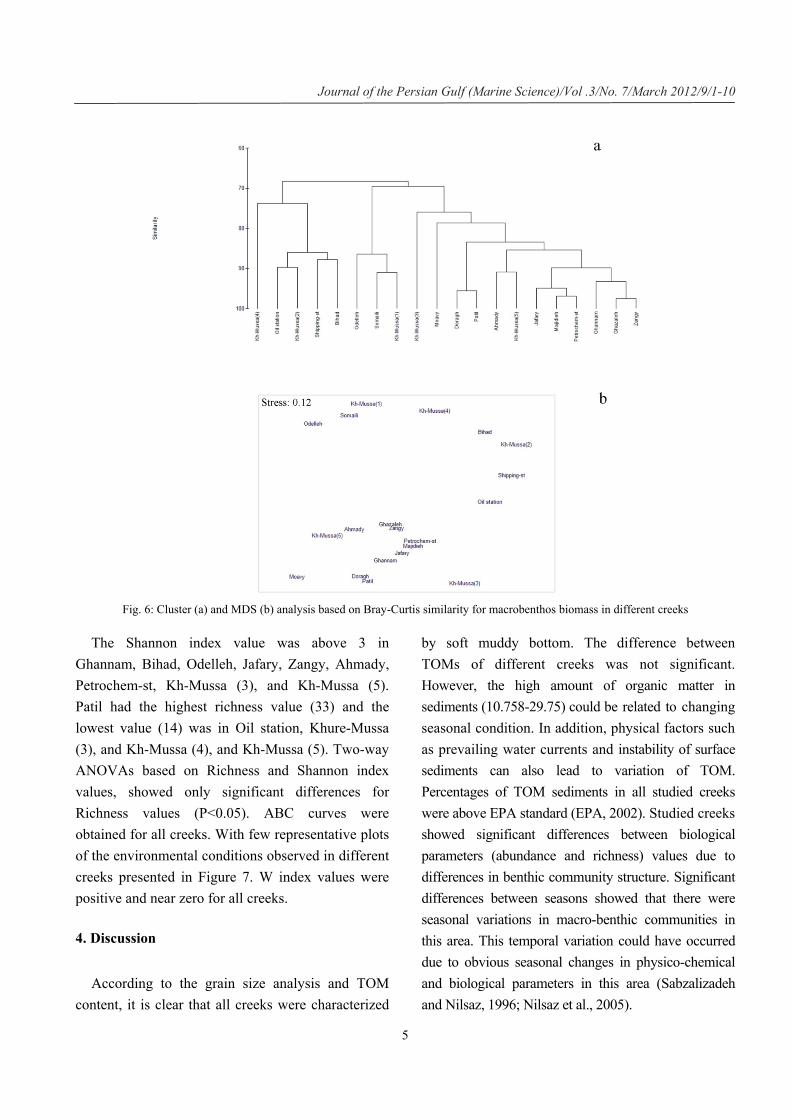
The creeks also showed significant differences based
on biomass (p<0.05). Figures 5a and 6a, show the
results of clustering of the stations using Bray-Curtis
index for similarities based on macrobenthic abundance
and biomass. MDS ordination confirmed the results of
cluster (Figs. 5b and 6b). Majority of creeks showed
above 85% similarity for abundance and above 80% for
biomass. The range of diversity and Richness indices
values were (1.95 to 3.58) and (14 to 33), respectively.
The range of Shannon diversity index was 1.95( in
Shipping-st) to 3.58 (for Patil).
Fig. 5: Cluster (a) and MDS (b) analysis based on Bray-Curtis similarity for macrobenthos abundance in different creeks
Journal of the Persian Gulf (Marine Science)/Vol .3/No. 7/March 2012/9/1-10
5
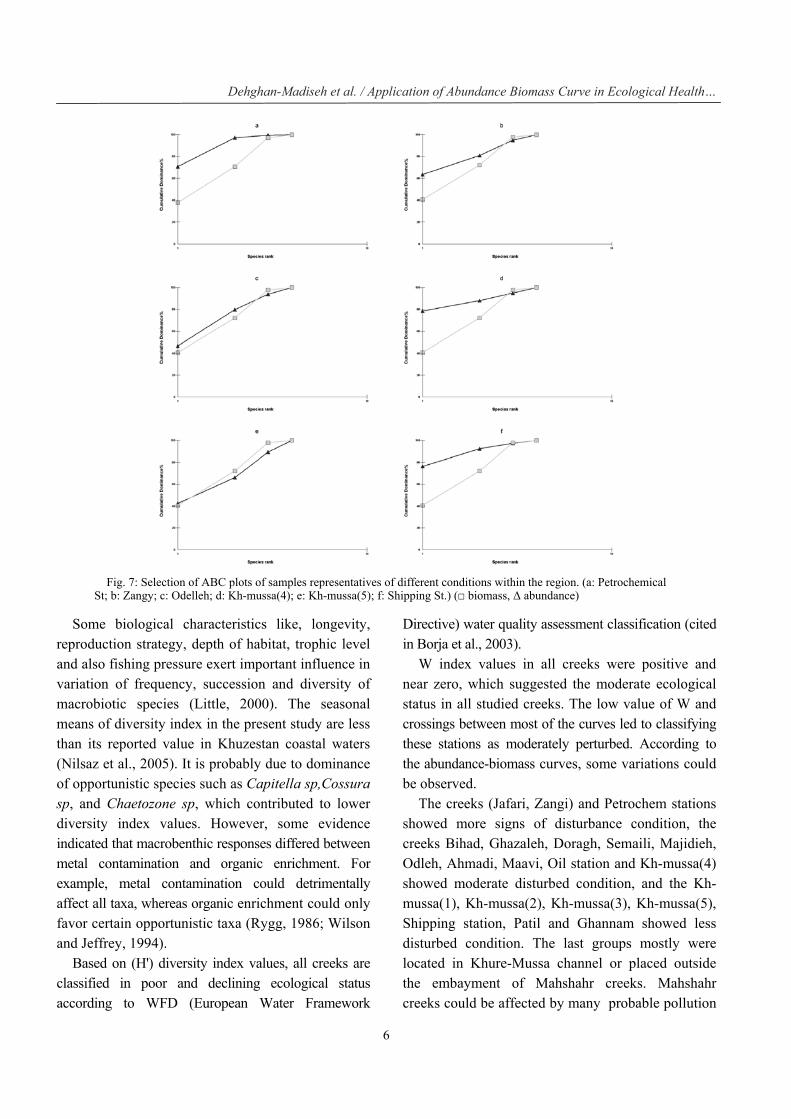
Fig. 6: Cluster (a) and MDS (b) analysis based on Bray-Curtis similarity for macrobenthos biomass in different creeks
The Shannon index value was above 3 in
Ghannam, Bihad, Odelleh, Jafary, Zangy, Ahmady,
Petrochem-st, Kh-Mussa (3), and Kh-Mussa (5).
Patil had the highest richness value (33) and the
lowest value (14) was in Oil station, Khure-Mussa
(3), and Kh-Mussa (4), and Kh-Mussa (5). Two-way
ANOVAs based on Richness and Shannon index
values, showed only significant differences for
Richness values (P<0.05). ABC curves were
obtained for all creeks. With few representative plots
of the environmental conditions observed in different
creeks presented in Figure 7. W index values were
positive and near zero for all creeks.
4. Discussion
According to the grain size analysis and TOM
content, it is clear that all creeks were characterized
by soft muddy bottom. The difference between
TOMs of different creeks was not significant.
However, the high amount of organic matter in
sediments (10.758-29.75) could be related to changing
seasonal condition. In addition, physical factors such
as prevailing water currents and instability of surface
sediments can also lead to variation of TOM.
Percentages of TOM sediments in all studied creeks
were above EPA standard (EPA, 2002). Studied creeks
showed significant differences between biological
parameters (abundance and richness) values due to
differences in benthic community structure. Significant
differences between seasons showed that there were
seasonal variations in macro-benthic communities in
this area. This temporal variation could have occurred
due to obvious seasonal changes in physico-chemical
and biological parameters in this area (Sabzalizadeh
and Nilsaz, 1996; Nilsaz et al., 2005).
Dehghan-Madiseh et al. / Application of Abundance Biomass Curve in Ecological Health…
6
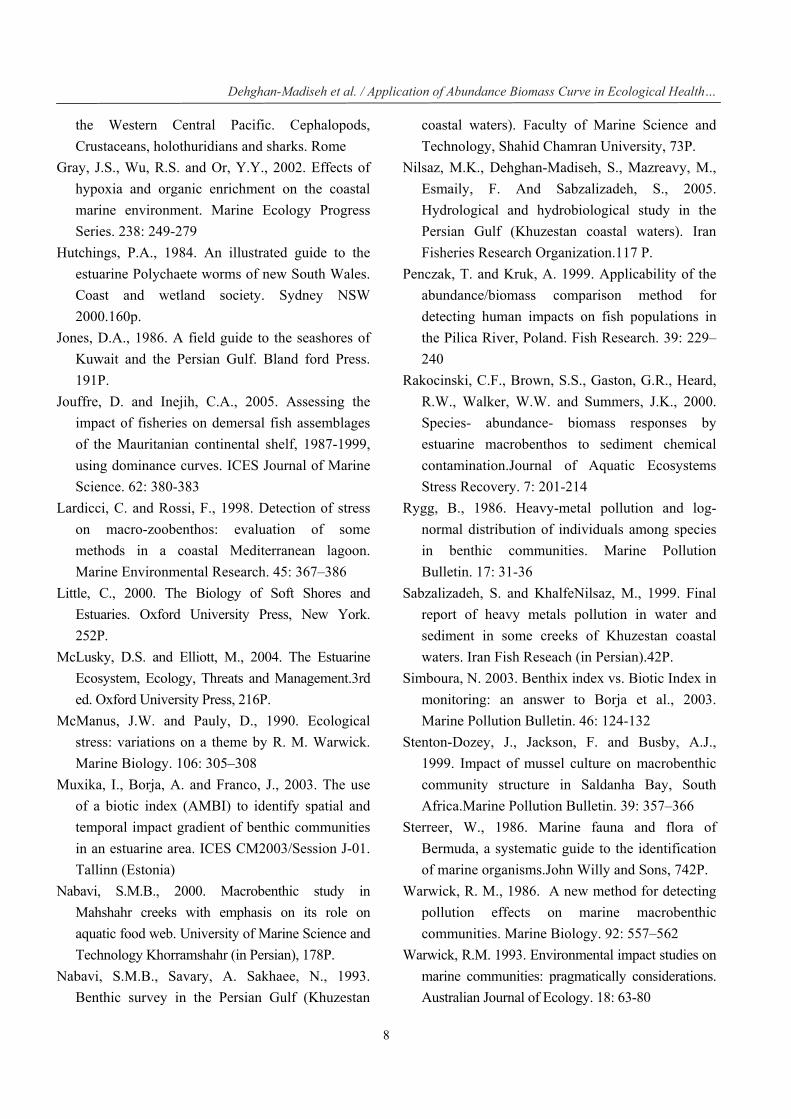
Fig. 7: Selection of ABC plots of samples representatives of different conditions within the region. (a: Petrochemical
St; b: Zangy; c: Odelleh; d: Kh-mussa(4); e: Kh-mussa(5); f: Shipping St.) (□ biomass, Δ abundance)
Some biological characteristics like, longevity, reproduction strategy, depth of habitat, trophic level and also fishing pressure exert important influence in variation of frequency, succession and diversity of macrobiotic species (Little, 2000). The seasonal means of diversity index in the present study are less than its reported value in Khuzestan coastal waters (Nilsaz et al., 2005). It is probably due to dominance of opportunistic species such as Capitella sp,Cossura sp, and Chaetozone sp, which contributed to lower diversity index values. However, some evidence indicated that macrobenthic responses differed between metal contamination and organic enrichment. For example, metal contamination could detrimentally affect all taxa, whereas organic enrichment could only favor certain opportunistic taxa (Rygg, 1986; Wilson and Jeffrey, 1994).
Based on (H') diversity index values, all creeks are classified in poor and declining ecological status according to WFD (European Water Framework
Directive) water quality assessment classification (cited in Borja et al., 2003).
W index values in all creeks were positive and near zero, which suggested the moderate ecological status in all studied creeks. The low value of W and crossings between most of the curves led to classifying these stations as moderately perturbed. According to the abundance-biomass curves, some variations could be observed.
The creeks (Jafari, Zangi) and Petrochem stations showed more signs of disturbance condition, the creeks Bihad, Ghazaleh, Doragh, Semaili, Majidieh, Odleh, Ahmadi, Maavi, Oil station and Kh-mussa(4) showed moderate disturbed condition, and the Kh-mussa(1), Kh-mussa(2), Kh-mussa(3), Kh-mussa(5), Shipping station, Patil and Ghannam showed less disturbed condition. The last groups mostly were located in Khure-Mussa channel or placed outside the embayment of Mahshahr creeks. Mahshahr creeks could be affected by many probable pollution

Journal of the Persian Gulf (Marine Science)/Vol .3/No. 7/March 2012/9/1-10
7
sources. In general, according to ABC plots, the most creeks in Khure-Mussa area showed moderate pollution status.
The ABC curve is widely used for the detection of pollution effects on macrobenthos communities (Warwick, 1986; Warwick et al., 1987; Clarke, 1990). High similarity index values could emphasize the same ecological status based on macrobenthic animals in studied areas. In unpolluted systems, with a high evenness and several large-bodied species, the biomass curve will fall well above that for abundance, the reverse being true for heavily polluted situations dominated by high numbers of small species (Adams, 2002).
As a result of different types of exploitation,
industrial and shipping activities in Khure- Mussa
area, unbalanced and moderate ecological status for
sediment quality are expected. Khure-Mussa creeks
are characterized by sever water exchanges in their
base; This and with predominantly silt-clay sediment,
high rate of sedimentation might also be a major
factor in benthic animals fluctuation. For better
evaluation, chemical and biological monitoring is
necessary.
Adjusted SAB (Species-Abundance-Biomass)
relationships varied in their details with respect to
different classes of sediment contamination, but all
types of SAB stress appear to exhibit similar basic
characteristics. Moreover, rapid decrease in the B/A
ratio with increasing contamination supported the
concept that relatively long-lived, large-bodied,
equilibrium taxa decline markedly at high
concentration of toxicants (Rakocinski et al., 2000).
Acknowledgment
The authors are grateful for funding from
Department of Environment of Iran.
References
Adams, S. M., 2002. Biological indicators of aquatic ecosystem stress. American Fisheries Society,
Bethesda, Meryland, 644P.
Barnes, R.D., 1987. Invertebrate Zoology. Saunders
College Publishing, 5th ed.
Borja, A., Franco, J. and Muxka I., 2004. The biotic
indices and the water framework directive: the
required consensus in the new benthic
monitoring tools. Marine Pollution Bulletin. 48:
405-408
Borja, A, Franco, J. and Perez V., 2000. A marine
biotic index to establish the ecological quality of
soft bottom benthos within European estuarine
and coastal environments. Marine Pollution
Bulletin. 40: 1100-1114
Borja, A., Muxika, I. and Franko, J., 2003. The
application of a Marine Biotic Index to different
impact sources affecting soft bottom benthic
communities along European coasts. Marine
Pollution Bulletin. 46: 835-845
Borja, A. and Muxka, I., 2005. Guideline for the use
of AMBI (AZTIs Marine Biotic Index) in the
assessment of the benthic ecological quality.
Marine Pollution Bulletin. 50: 787-789
Clarke, K.R., 1990. Comparisons of dominance
curves. Journal of Experimental Marine Biology
and Ecology.138: 143 -157
Dauer, D.M., Luckenbach, M.W. and Rodi, A.J.,
1993. Abundance biomass comparison (ABC
method): effects of an estuarine gradient,
anoxic/hypoxic events and contaminated
sediments. Marine Biology. 116: 507–518
Dehghan-Madiseh, S., 2008. Identification of
sensitive and impacted area in Khuzestan creeks
by using of ecological and biological indices.
University of Marine Science and Technology
Khorramshahr, Ph.D thesis, (in Persian)
Dostshenas, B., 2009. Classification of Khur-e-
Mussa coastal waters by using sediment biotope
index to evaluation of biotic health. University of
Marine Science and Technology Khorramshahr,
Ph.D thesis, (in Persian)
FAO species identification guide for fishery
purposes, 1998. The living marine resources of
Dehghan-Madiseh et al. / Application of Abundance Biomass Curve in Ecological Health…
8
the Western Central Pacific. Cephalopods,
Crustaceans, holothuridians and sharks. Rome
Gray, J.S., Wu, R.S. and Or, Y.Y., 2002. Effects of
hypoxia and organic enrichment on the coastal
marine environment. Marine Ecology Progress
Series. 238: 249-279
Hutchings, P.A., 1984. An illustrated guide to the
estuarine Polychaete worms of new South Wales.
Coast and wetland society. Sydney NSW
2000.160p.
Jones, D.A., 1986. A field guide to the seashores of
Kuwait and the Persian Gulf. Bland ford Press.
191P.
Jouffre, D. and Inejih, C.A., 2005. Assessing the
impact of fisheries on demersal fish assemblages
of the Mauritanian continental shelf, 1987-1999,
using dominance curves. ICES Journal of Marine
Science. 62: 380-383
Lardicci, C. and Rossi, F., 1998. Detection of stress
on macro-zoobenthos: evaluation of some
methods in a coastal Mediterranean lagoon.
Marine Environmental Research. 45: 367–386
Little, C., 2000. The Biology of Soft Shores and
Estuaries. Oxford University Press, New York.
252P.
McLusky, D.S. and Elliott, M., 2004. The Estuarine
Ecosystem, Ecology, Threats and Management.3rd
ed. Oxford University Press, 216P.
McManus, J.W. and Pauly, D., 1990. Ecological
stress: variations on a theme by R. M. Warwick.
Marine Biology. 106: 305–308
Muxika, I., Borja, A. and Franco, J., 2003. The use
of a biotic index (AMBI) to identify spatial and
temporal impact gradient of benthic communities
in an estuarine area. ICES CM2003/Session J-01.
Tallinn (Estonia)
Nabavi, S.M.B., 2000. Macrobenthic study in
Mahshahr creeks with emphasis on its role on
aquatic food web. University of Marine Science and
Technology Khorramshahr (in Persian), 178P. Nabavi, S.M.B., Savary, A. Sakhaee, N., 1993.
Benthic survey in the Persian Gulf (Khuzestan
coastal waters). Faculty of Marine Science and
Technology, Shahid Chamran University, 73P.
Nilsaz, M.K., Dehghan-Madiseh, S., Mazreavy, M.,
Esmaily, F. And Sabzalizadeh, S., 2005.
Hydrological and hydrobiological study in the
Persian Gulf (Khuzestan coastal waters). Iran
Fisheries Research Organization.117 P.
Penczak, T. and Kruk, A. 1999. Applicability of the
abundance/biomass comparison method for
detecting human impacts on fish populations in
the Pilica River, Poland. Fish Research. 39: 229–
240
Rakocinski, C.F., Brown, S.S., Gaston, G.R., Heard,
R.W., Walker, W.W. and Summers, J.K., 2000.
Species- abundance- biomass responses by
estuarine macrobenthos to sediment chemical
contamination.Journal of Aquatic Ecosystems
Stress Recovery. 7: 201-214
Rygg, B., 1986. Heavy-metal pollution and log-
normal distribution of individuals among species
in benthic communities. Marine Pollution
Bulletin. 17: 31-36
Sabzalizadeh, S. and KhalfeNilsaz, M., 1999. Final
report of heavy metals pollution in water and
sediment in some creeks of Khuzestan coastal
waters. Iran Fish Reseach (in Persian).42P.
Simboura, N. 2003. Benthix index vs. Biotic Index in
monitoring: an answer to Borja et al., 2003.
Marine Pollution Bulletin. 46: 124-132
Stenton-Dozey, J., Jackson, F. and Busby, A.J.,
1999. Impact of mussel culture on macrobenthic
community structure in Saldanha Bay, South
Africa.Marine Pollution Bulletin. 39: 357–366
Sterreer, W., 1986. Marine fauna and flora of
Bermuda, a systematic guide to the identification
of marine organisms.John Willy and Sons, 742P.
Warwick, R. M., 1986. A new method for detecting
pollution effects on marine macrobenthic
communities. Marine Biology. 92: 557–562
Warwick, R.M. 1993. Environmental impact studies on
marine communities: pragmatically considerations.
Australian Journal of Ecology. 18: 63-80
Journal of the Persian Gulf (Marine Science)/Vol .3/No. 7/March 2012/9/1-10
9
Warwick, R.M. and Clarke, K.R., 1991. A comparison
of some methods for analyzing changes in benthic
community structure. Marine Biological
Association of the United Kingdom. 71: 225–244
Warwick, R.M., Pearson, T.H. and Ruswahyuni.,1987.
Detection of pollution effects on marine
macrobenthos: further evaluation of the species
abundance/biomass method. Marine Biology. 95:
193 -200
Wilson, J.G. and Jeffrey, D.W., 1994. Benthic
biological pollution indices in estuaries. In: K.J.M.
Kramer (ed.), Biomonitoring of coastal waters and
estuaries. CRC Press, Boca Raton, pp. 311-327
Yemane, D., Field, J.G. and Leslie, R.W., 2005.
Exploring the effects of fishing on fish
assemblages using Abundance Biomass
Comparison (ABC) curves. ICES Journal of
Marine Science. 62: 374-379
Dehghan-Madiseh et al. / Application of Abundance Biomass Curve in Ecological Health…
Journal of the Persian Gulf (Marine Science)/Vol .3/No. 7/March 2012/9/1-10
Journal of the Persian Gulf
(Marine Science)/Vol. 3/No. 7/March 2012/9/1-10


