Application Note: Validating Pegasus™ Prime Virus Membrane ... · bioprocesses, assure drug...
7
USD3302 Application Note Validating Pegasus ™ Prime virus removal membrane filters: How do I incorporate a prefilter in my virus clearance study?
Transcript of Application Note: Validating Pegasus™ Prime Virus Membrane ... · bioprocesses, assure drug...

USD3302Application Note
Validating Pegasus™ Prime virus removal membrane filters: How do I incorporate a prefilter in my virus clearance study?

2
Pegasus Prime Virus Removal Filters
Pall Pegasus Prime virus removal membrane provides robust virus retention to protect critical manufacturing bioprocesses, assure drug quality and safeguard health. Pegasus Prime virus filters combine high LRV with high throughput and high flow in mAb solutions to deliver an economic virus filtration solution with a small footprint for easy integration into single-use and automated processes. Pegasus Prime virus filters deliver a robust, high LRV independent of process parameters, process fluid and validation spike parameters.
Pegasus Protect Virus Filters
Pall Pegasus Protect prefilter membrane is tailored to provide protection to Pegasus Prime virus removal filters and to deliver robust filter performance in more challenging process fluids. The combination of Pegasus Protect and Pegasus Prime filters increases throughput and leads to a reduction in processing costs by a reduction in virus filter sizing and processing times.
Virus Clearance Studies with Prefilters
Virus removal that may be achieved by a pre-filtration step should not be claimed for the virus filtration step if the prefilter has not been qualified as a product for virus removal. In all cases, virus reduction obtained from the qualified size-removal virus filter alone must be evaluated. The decision tree in Figure 1 demonstrates different options to successfully validate virus filtration with an adsorptive prefilter.
Decoupling Study
In some cases, the aggregates removed during adsorptive pre-filtration can re-form over time. When the pooled prefilter filtrate is spiked and challenged to the virus filter this can therefore lead to a reduction in throughput. At best, this gives a less effective model of the process scale filtration and, at worst, a failure to validate the target process volume per filter device. A decoupling study is always recommended to determine the impact of prefilter decoupling on throughput performance before committing to a virus validation study, to determine which method for validation should be employed. Figure 2 shows a) the test comparison that should be carried out and b) typical example data. Depending on the product stability, a significant impact of decoupling can also be caused by the prefilter filtrate dropping from a large height and splashing into the collection vessel. It is also important not to over challenge the prefilter in case it overloads. Once the data is available an assessment can be made as per the decision tree in Figure 1 as to whether prefilter decoupling will succeed.
Validation with a Decoupled Prefilter
Figure 3 demonstrates the most preferred approach for virus filter validation. The test solution is prefiltered and the pooled, prefiltered test solution is spiked with virus before challenging the test virus filter alone. As with the decoupling study, the flow-rate of the prefilter should match the flow rate of the coupled prefilter / virus filter combination as closely as possible.
Coupled Prefilter vs Prefilter Only
Figure 4 demonstrates how the retention due to a virus filter alone can be evaluated by comparing the coupled prefilter and virus filter compared to the prefilter alone. Again, the prefilter flow rate should match the flow rate of the coupled prefilter / virus filter combination as closely as possible. Although this test reduces accuracy by propagating the error from two separate challenges and introducing the possibility of prefilter variation, it most accurately represents the process scale set-up. This method allows test solutions which show significant decoupling effects to be tested for virus removal, but it will not work well for enveloped viruses such as murine leukaemia virus (MuLV) since too much of the spike can be removed. For minute virus of mice (MVM), virus reduction across Pegasus Protect filters has been observed up to 1.5 logs, but this will vary based on the test solution properties and specific process parameters such as overall throughput.

www.pall.com 3
In-Line Spiking
In circumstances where decoupling of the prefilter reduces throughput significantly and the prefilter removes too much of the virus spike to implement coupled prefilter v prefilter only testing then in-line spiking is the best alternative. This approach resolves both decoupling issues and excess virus removal by the prefilter. The test solution is challenged to the prefilter and filter in series, but in between the filters, a virus spike is pumped in at a small percentage of the test solution flow and mixed before being challenged to the virus filter (see Figure 5). For more details and advice on operating in-line spiking, contact your selected virus testing laboratory or your local Pall representative.
Example Virus Validation Data
A study was carried out to demonstrate decoupled and coupled virus validation procedures. A peristaltic pump driven filterability control system (Masterflex, Pendotech) was used to provide a constant pressure (2.1 bar, 30 psi) to the test filters (Figure 6). By using two pump heads on a single drive, it was possible to match the flow rate of the Pegasus Protect prefilter only test to the coupled Pegasus Protect prefilter and Pegasus Prime virus filter (Figure 7). Pump driven control systems allow the best control of the prefilter only flow rate to ensure the correct residence time, however you should contact your selected virus test laboratory to ensure that the primary data capture during viral clearance studies complies with GLP. A humanized IgG-1 monoclonal antibody (mAb) was purified by protein A and cation exchange chromatography to represent an example input stream to the virus filter operation.
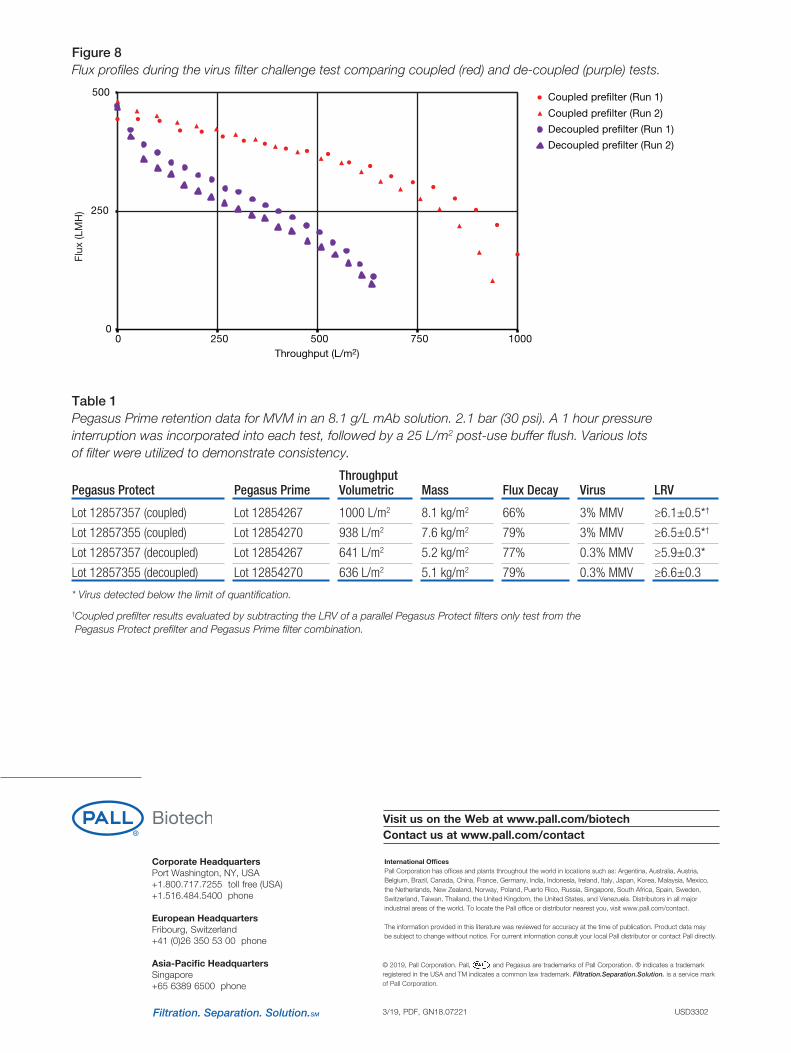
The chosen mAb test solution (8.1 g/L, 75 mM Tris, pH 7.3, 5.7 mS/cm) shows lower throughput performance when tested with the prefilter de-coupled (Figure 8). This would prove problematic if the target process throughput at full scale was 750 L/m2 or higher and demonstrates the risks of not addressing decoupling issues before the test is carried out. Many feeds solutions can also display a more dramatic impact on filter capacity upon decoupling of the prefilter. The chosen mAb also shows a significant challenge to the Pegasus Prime virus filter, causing high flux decay. In addition to this, a 25 L/m2 post- use buffer flush was carried out after a 1 h pressure interruption at 0 bar (0 psi). These are all known risk factors to the maintenance of high viral retention.
The data in Table 1 demonstrate how the different approaches to virus filter validation with a prefilter can be applied to successfully achieve high parvovirus removal with Pegasus Protect prefilters and Pegasus Prime virus filters.
Conclusion
A variety of robust methods are available to generate virus validation data for Pegasus Prime virus filters. One of the key complications for validation is the use an adsorptive prefilter which cannot be validated as part of a robust size-removal virus filtration step. The decision tree shown here provides a systematic method of choosing the most appropriate test approach to ensure that the exceptional retentive performance of Pegasus Prime virus filters can be demonstrated at its full optimum throughput.
In some cases there may not be one obvious solution which best suits your specific needs and will generate the most robust data for regulatory submission. A dialogue is always recommended with the experts from your selected virus testing laboratory and the regulatory agencies. For further questions relating to virus validation of our products, please contact your local Pall representative.

4
Figure 1Decision tree for virus filter validation using Pegasus Protect pre-filtration. This guidance may be subject to change and you should always contact your chosen virus validation laboratory and the regulatory agencies for confirmation.
Figure 2a) Decoupling study to determine if the time between prefiltration and virus filtration influences the filterability. b) Potential decoupling study data.
Decoupling study
In-line spiking
Decoupledpre�lter
validation
Coupled pre�ltervs
Pre�lter alone
Does decouplingsigni�cantly reduce
throughput?
Enveloped virus(e.g. MuLV)?
No
No
Yes
Yes
Feed
Feed
De-Coupled Pre�ltration
Coupled Pre�ltration
Throughput (L/m2)
Flux
(LM
H)
Coupled pre�ltration(representative of process)
Potential de-coupledpre�ltration
Pegasus Protectvirus pre�lter
Pegasus Protectvirus pre�lter
Pegasus Primevirus �lter
Pegasus Primevirus �lter

www.pall.com 5
Figure 3Set-up for validation with a decoupled prefilter.
Figure 4Coupled prefilter v prefilter only to determine the contribution of the prefilter alone to the total virus reduction.
Figure 5In-line mixing set-up.
Pegasus Protectvirus pre�lter
Feed
Pegasus Primevirus �lter
+ Spike
Pegasus Protectvirus pre�lter
Pegasus Primevirus �lter
Feed + spike Feed + spike
LRV Virus Filter = LRV Coupled – LRV Pre�lter
Equivalent �uxJ Coupled J = J Coupled
Feed solution
Pegasus Protectvirus pre�lter
Pegasus Primevirus �lter
In-line mixer
Virus stock
Spiked feedsample
Equal, low �ow

6
Figure 6Equipment set-up used to generate example data. Dual pump heads used to control a constant pressure inlet at P1, and deliver the same flow rate to the parallel prefilter only set-up. Separate pump used to test the alternative decoupled prefilter validation. Contact your selected virus test laboratory to ensure primary data collection during virus clearance studies is compliant with GLP if using this method.
Figure 7Flow rate of coupled Pegasus Protect / Pegasus Prime filters compared to flow rate of Pegasus Protect prefilters only, demonstrating that the prefilters used in parallel experience the same flow rate and flow decline irrespective of the presence (or not) of a subsequent virus filter. This provides additional justification that the virus reduction of the coupled prefilter can be estimated from the prefilter only retention data and therefore the retention performance of the Pegasus Prime virus filters can be evaluated.
Pegasus Protectvirus pre�lter
Pegasus Primevirus �lter
Balance 1 Balance 2
Pump 1
Spiked feed solution
ControllerP1
P2
Balance 3
Protect pre�lteredspiked feed solution
Pump 3
P3
Pegasus Protectvirus pre�lter
0
1
2
3
0 1 2 3
Flow
rat
e (m
L/m
in)
Time (h)
Pre�lter Virus �lter (Run 1)
Pre�lter only (Run 1)
Pre�lter Virus �lter (Run 2)
Pre�lter only (Run 2)
www.pall.com 7
Figure 8Flux profiles during the virus filter challenge test comparing coupled (red) and de-coupled (purple) tests.
Table 1Pegasus Prime retention data for MVM in an 8.1 g/L mAb solution. 2.1 bar (30 psi). A 1 hour pressure interruption was incorporated into each test, followed by a 25 L/m2 post-use buffer flush. Various lots of filter were utilized to demonstrate consistency.
Throughput Pegasus Protect Pegasus Prime Volumetric Mass Flux Decay Virus LRV
Lot 12857357 (coupled) Lot 12854267 1000 L/m2 8.1 kg/m2 66% 3% MMV ≥6.1±0.5*†
Lot 12857355 (coupled) Lot 12854270 938 L/m2 7.6 kg/m2 79% 3% MMV ≥6.5±0.5*†
Lot 12857357 (decoupled) Lot 12854267 641 L/m2 5.2 kg/m2 77% 0.3% MMV ≥5.9±0.3*
Lot 12857355 (decoupled) Lot 12854270 636 L/m2 5.1 kg/m2 79% 0.3% MMV ≥6.6±0.3
* Virus detected below the limit of quantification.
† Coupled prefilter results evaluated by subtracting the LRV of a parallel Pegasus Protect filters only test from the Pegasus Protect prefilter and Pegasus Prime filter combination.
Corporate HeadquartersPort Washington, NY, USA+1.800.717.7255 toll free (USA)+1.516.484.5400 phone
European HeadquartersFribourg, Switzerland+41 (0)26 350 53 00 phone
Asia-Pacific HeadquartersSingapore+65 6389 6500 phone
International OfficesPall Corporation has offices and plants throughout the world in locations such as: Argentina, Australia, Austria, Belgium, Brazil, Canada, China, France, Germany, India, Indonesia, Ireland, Italy, Japan, Korea, Malaysia, Mexico, the Netherlands, New Zealand, Norway, Poland, Puerto Rico, Russia, Singapore, South Africa, Spain, Sweden, Switzerland, Taiwan, Thailand, the United Kingdom, the United States, and Venezuela. Distributors in all major industrial areas of the world. To locate the Pall office or distributor nearest you, visit www.pall.com/contact.
The information provided in this literature was reviewed for accuracy at the time of publication. Product data may be subject to change without notice. For current information consult your local Pall distributor or contact Pall directly.
© 2019, Pall Corporation. Pall, , and Pegasus are trademarks of Pall Corporation. ® indicates a trademark registered in the USA and TM indicates a common law trademark. Filtration.Separation.Solution. is a service mark of Pall Corporation.
3/19, PDF, GN18.07221 USD3302
Visit us on the Web at www.pall.com/biotechContact us at www.pall.com/contact
Flux
(LM
H)
0
250
500
0 250 500 750 1000Throughput (L/m2)
Coupled pre�lter (Run 1)
Coupled pre�lter (Run 2)
Decoupled pre�lter (Run 1)
Decoupled pre�lter (Run 2)