Application Note RNA-Seq analysis using de novo...
4
Sample to Insight RNA-Seq analysis using de novo assembled transcriptome as reference Application Note
Transcript of Application Note RNA-Seq analysis using de novo...
Sample to Insight
RNA-Seq analysis using de novo assembled transcriptome as reference
Application Note
2 RNA-Seq analysis using de novo assembled transcriptome as reference
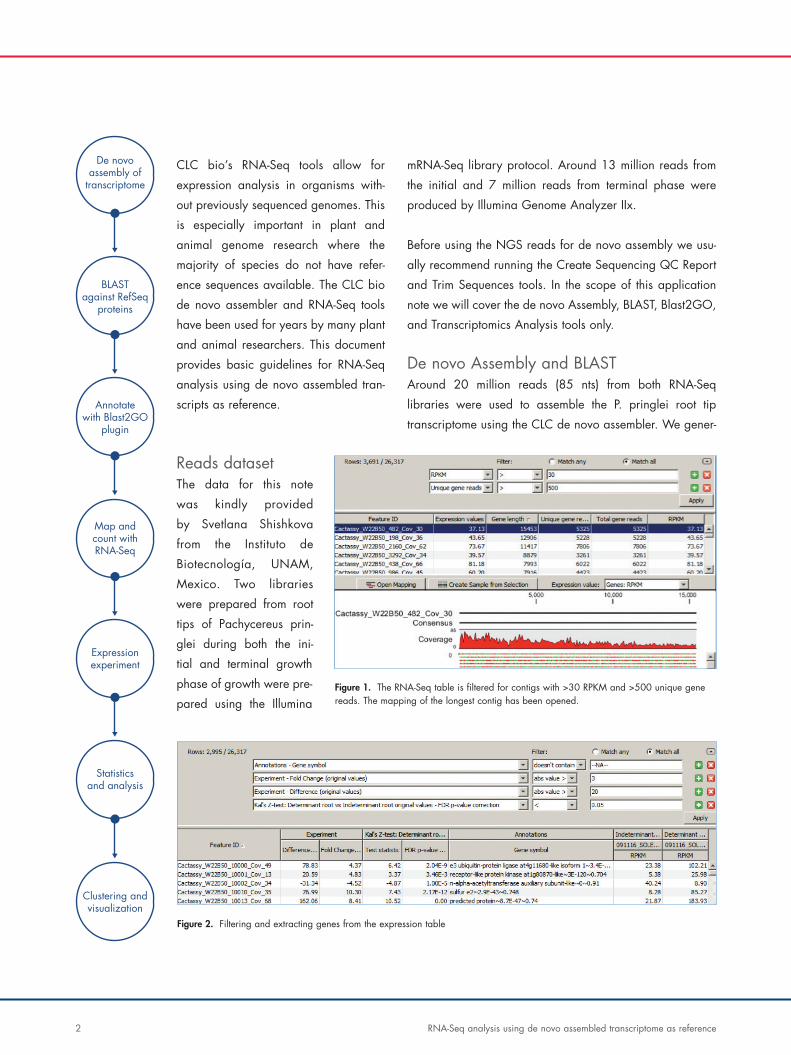
CLC bio’s RNA-Seq tools allow for
expression analysis in organisms with-
out previously sequenced genomes. This
is especially important in plant and
animal genome research where the
majority of species do not have refer-
ence sequences available. The CLC bio
de novo assembler and RNA-Seq tools
have been used for years by many plant
and animal researchers. This document
provides basic guidelines for RNA-Seq
analysis using de novo assembled tran-
scripts as reference.
Reads datasetThe data for this note
was kindly provided
by Svetlana Shishkova
from the Instituto de
Biotecnología, UNAM,
Mexico. Two libraries
were prepared from root
tips of Pachycereus prin-
glei during both the ini-
tial and terminal growth
phase of growth were pre-
pared using the Illumina
mRNA-Seq library protocol. Around 13 million reads from
the initial and 7 million reads from terminal phase were
produced by Illumina Genome Analyzer IIx.
Before using the NGS reads for de novo assembly we usu-
ally recommend running the Create Sequencing QC Report
and Trim Sequences tools. In the scope of this application
note we will cover the de novo Assembly, BLAST, Blast2GO,
and Transcriptomics Analysis tools only.
De novo Assembly and BLASTAround 20 million reads (85 nts) from both RNA-Seq
libraries were used to assemble the P. pringlei root tip
transcriptome using the CLC de novo assembler. We gener-
Figure 1. The RNA-Seq table is filtered for contigs with >30 RPKM and >500 unique gene reads. The mapping of the longest contig has been opened.
Figure 2. Filtering and extracting genes from the expression table
De novo assembly of
transcriptome
BLAST against RefSeq
proteins
Annotate with Blast2GO
plugin
Map and count with RNA-Seq
Expression experiment
Statistics and analysis
Clustering andvisualization
RNA-Seq analysis using de novo assembled transcriptome as reference 3
ated 26,317 contigs with an average length
of 1,035 nt. The contigs were extracted and
used as the queries in BLASTx against the
Ref-Seq protein database (plant division). The
majority of contigs (almost 20K) produced
significant hits with expectation values under
1.0E-10.
RNA-Seq mappingSubsequently, we produced RNA-Seq map-
pings for 13.2 million reads from the initial
phase and for 6.8 million reads from the
terminal phase libraries. Both sets of reads
were mapped to the 26,317 contigs from the
de novo assembly. In the RNA-Seq mapping
pipeline we set the minimum read length fraction to 0.9,
minimum similarity to 0.95, allowed for up to 10 unspecific
matches, and selected RPKM as expression value.
The resulting RNA-Seq expression table can be searched,
sorted, and exported. Every individual mapping can be
opened and explored in the alignment view (Figure 1).
Annotation with Blast2GOAnnotations of contigs were generated using Blast2GO.
This set of tools is available as a plugin for CLC Genomics
Workbench. Blast2GO creates functional annotations in
three steps: extract homologus sequence descriptions from
BLAST, map to retrieve GO terms, and annotate to select
reliable functions. The tool Convert Data to Blast2GO proj-
ect converts CLC Multi BLAST files to a Blast2GO project.
Expression experimentThe root apical meristems of the primary roots of P.
pringlei seedlings differentiate at very early stages of
development. The aim of the experiment was to iden-
tify and characterize the genes involved in root meristem
maintenance and root growth in P. pringlei. Using the Set
Up Experiment tool, we combined the RNA-Seq data from
two samples into one expres-
sion analysis table. The contig
descriptions were added using
the Add Annotations tool, as
they were previously extracted
by the Blast2GO plugin.
Statistics and analysisFor the statistical analysis, we
ran the Kal’s Z-test available in
the Statistical Analysis folder.
We filtered the table to select
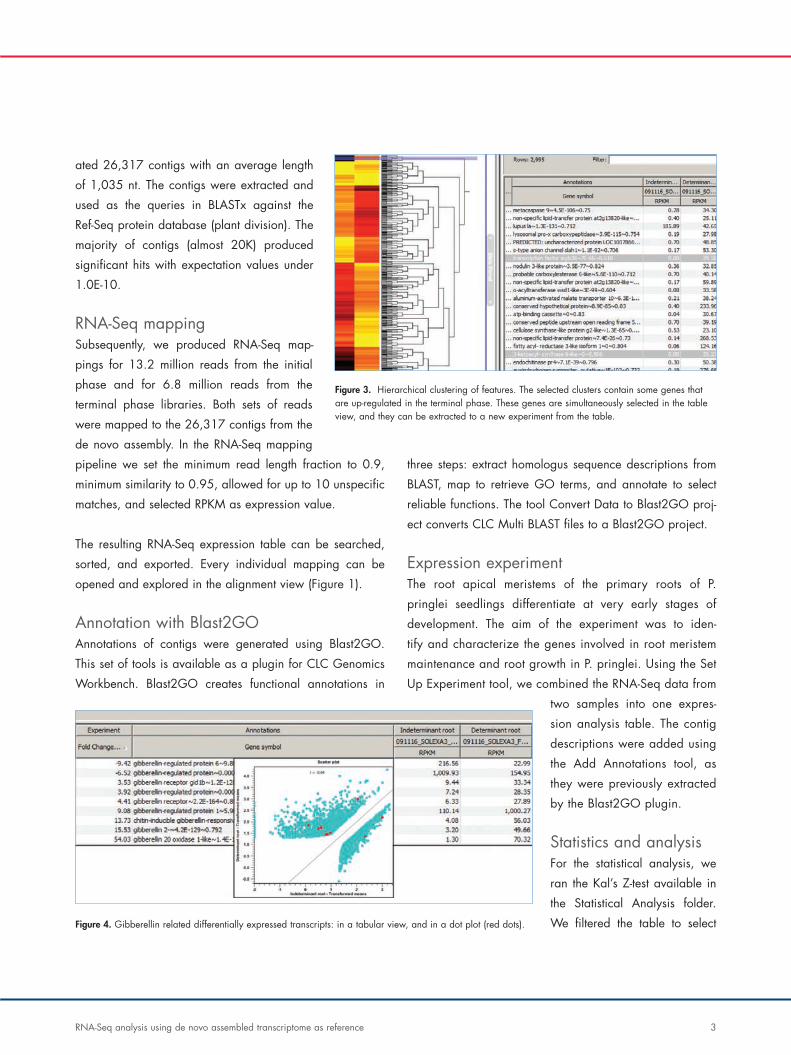
Figure 3. Hierarchical clustering of features. The selected clusters contain some genes that are up-regulated in the terminal phase. These genes are simultaneously selected in the table view, and they can be extracted to a new experiment from the table.
Figure 4. Gibberellin related differentially expressed transcripts: in a tabular view, and in a dot plot (red dots).
Data navigation and extractionIt is known that expression of many phytohormone-related
genes are affected during the transition of root tip develop-
ment from the initial phase to the terminal phase. With a
simple keyword search through annotations, we extracted
the genes of interest in this study. Figure 4 shows the gib-
berellin-related differentially regulated genes. Most of them
are up-regulated in the terminal phase of root development.
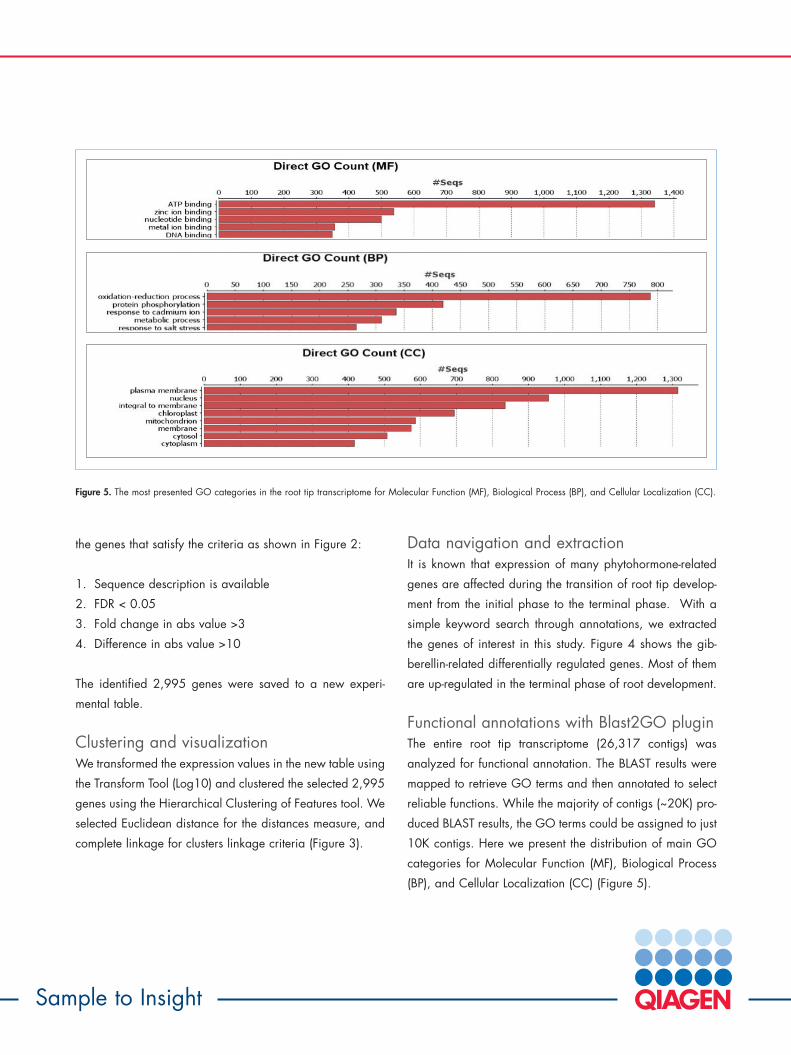
Functional annotations with Blast2GO pluginThe entire root tip transcriptome (26,317 contigs) was
analyzed for functional annotation. The BLAST results were
mapped to retrieve GO terms and then annotated to select
reliable functions. While the majority of contigs (~20K) pro-
duced BLAST results, the GO terms could be assigned to just
10K contigs. Here we present the distribution of main GO
categories for Molecular Function (MF), Biological Process
(BP), and Cellular Localization (CC) (Figure 5).
the genes that satisfy the criteria as shown in Figure 2:
1. Sequence description is available
2. FDR < 0.05
3. Fold change in abs value >3
4. Difference in abs value >10
The identified 2,995 genes were saved to a new experi-
mental table.
Clustering and visualizationWe transformed the expression values in the new table using
the Transform Tool (Log10) and clustered the selected 2,995
genes using the Hierarchical Clustering of Features tool. We
selected Euclidean distance for the distances measure, and
complete linkage for clusters linkage criteria (Figure 3).
Sample to Insight
Figure 5. The most presented GO categories in the root tip transcriptome for Molecular Function (MF), Biological Process (BP), and Cellular Localization (CC).