TOTAL TEMPERATURE MEASUREMENT AT PULSE DETONATION ENGINE ...
Gamal H.Shehata/et al/ Engineering Research Journal 160 (December 8102) M1 – M25
M1
Application and Performance Measurement of
Total Productive Maintenance: Case study of a
Food Industries Company in Egypt
Ragab Eid. Ragab
Al awel for food Company
Helwan University
Sabreen A. Abdelwahab
Production Technology Dep.,
Helwan University
Gamal H.Shehata
Mechanical Engineering Dep.,
Helwan University
NaglaaAbd El Samed
Curricula Dep.,
Helwan University
Saleh Kaytbay Mechanical Engineering Dep., Benha
University Higher Institute of Engineering Technology
Mahalla Al – Kubra
Walid Mahmoud Elnahas Production Technology Dep
Helwan University
Abstract
The maintenance activity is as important as the production activity. In order to
reduce production cost and increase production efficiency, Total Productive
Maintenance (TPM) is employed. TPM has several key principles; 5S, self-
maintenance, continuous improvement, planned maintenance, education and
training, quality maintenance, occupational safety and health, senior
management support and participation of all departments. By implementing
these principles, productivity can be improved by reducing downtime,
improving quality, adhering to specified delivery times, improving working
conditions, and increasing employee morale. This research focuses on the
effective role of the TPM principles in achieving the objectives of the industrial
companies, enhancing the cooperation and coordination between different
departments of the company, especially the participation of all workers in the
production and maintenance process, 6th October City has been selected for

Gamal H.Shehata/et al/ Engineering Research Journal 160 (December 8102) M1 – M25
M2
application and measurement. A program has been designed and implemented
in the form of checklists to measure TPM performance within industrial plants.
The aims of research are: first, to reduce the gap between production and
maintenance which is usually found in the standard independent maintenance.
Second, to put a clear plan for predictive maintenance and provide adequate
training for the company staff to apply TPM principles. Improvement in the
Mean and Standard Deviation of applying the TPM which are 6% and 5.29%
respectively have been achieved by applying TPM program.
Keywords: Total Productive Maintenance; TPM principles; TPM
Implementation; Overall Equipment Effectiveness; Autonomous maintenance ;
Kaizen; MTBF ; MTTR.
1. Introduction Total Productive Maintenance (TPM) is a productivity improvement practice
analogous to the use of total quality management (TQM). It is a Japanese
concept of equipment management that allows a facility to improve decisively
the equipment performance in the manufacturing area with the help and
involvement of all employees. Nakajima concludes that TPM activities focus
on eliminating the six major losses; equipment failure, set-up and adjustment
time, idling and minor stoppages, reduced speed, defects in process, and
reduced yield. According to the objectives of TPM, which are continuously
improving the availability and prevent the degradation of equipment to achieve
maximum effectiveness [1], these objectives require strong management
support as well as continuous use of work teams and small group activities to
achieve incremental improvements.
TPM has several principles; the first is Autonomous Maintenance (AM): In
this system, the operator is responsible for performing minor maintenance
tasks, such as re-connecting screws, lubricating and cleaning the equipment, or
other maintenance tasks that do not require specialized technician. The second
principle is 5S: This is an abbreviation for five Japanese words "Seiri- Seiton-
Seiso- Seiketsu- Shitsuke", these mean (Sorting - Set in Order- Shining –
Standardize - Sustain) respectively. Organized and clean work environment
make problems easily observed, resulting in high efficiency, productivity and
improved product quality. The third principle is Continuous Improvement (CI):
It means to make small improvements that are carried out on an ongoing basis
with the participation of all employees of the facility in order to reduce costs
and time spent in workplace that impact efficiency. The fourth principle is
Planned Maintenance (PM): Scheduling maintenance based on the historical
failure rate of the equipment taking into account that maintenance done during
Gamal H.Shehata/et al/ Engineering Research Journal 160 (December 8102) M1 – M25
M3
the low production periods in order to reduce maintenance during the
production peaks. The fifth principle is Quality Maintenance (QM): It is
intended to determine the conditions of equipment that cause the reduction of
product quality in order to achieve customer satisfaction by achieving the
highest quality rates through the manufacturing of defect-free products. The
sixth principle is Education & Training (ET): Improve employees' knowledge
and techniques and create a self-learning work environment with multi-skilled
workers to enable them to solve problems within the company. The seventh
principle is Health, Safety & Environment (HSE): Focuses on creating a safe
working environment and to create awareness among employees regarding
safety, health and environment. Finally, the eighth principle is TPM in the
Office: It is intended to establish an administrative structure to maintain the
overall productivity within the company to distribute jobs and roles to the
employees and to follow up the implementation of TPM.
A TPM is a fundamental component of world-class manufacturing which
has been recognized as one of the significant operation strategy to regain the
production losses resulting from equipment inefficiency; this is illustrated by
the following research studies. In a study conducted in the food industry in
South India, implementation and performance factors are compared to those in
the industry that have been applied TPM and an important relationship has
been found. The results helped the management team to focus on areas of
improvement to the production process [2]. In another study in Malaysia, they
evaluated the TPM through the study of the relationship between TPM
practices and manufacturing performance. It investigated the moderating effect
of the level of technical complexity in the production process in the TPM
practices and manufacturing performance relationships as well. Significant
relationships were found between TPM practices and cost. The moderating
effect of technical complexity in the production process on the relationship
between TPM practices and manufacturing performance was found [3]. One of
the challenges in the implementation of TPM in manufacturing industry is the
slow managerial decision-making to respond to the condition in the factory.
Investigates the answers of these challenges by analyzing and modeling the
equipment condition and the response of actions required in a wooden door
manufacturing industry TPM implementation in this company has deployed the
Overall Equipment Effectiveness (OEE) measurement as an indicator [4]of the
equipment utilization and condition. Through analysis and modeling of the
OEE value obtained from the factory, the formulation of Association Rule
Mining (ARM) aims to find a rule that shows the well computed relationship
between measurable indicators of OEE with the response of action required to
take in certain condition of machine utilization. Results obtained from ARM

Gamal H.Shehata/et al/ Engineering Research Journal 160 (December 8102) M1 – M25
M4
accelerate the decision to establish an appropriate TPM management strategy
based on the rules. The generated dynamic rules form and facilitate the process
of decision-making by related stakeholders. The development of an effective
TPM model to improve the maintenance system at a chemical manufacturing
company in Zambia was the main focus of TPM [5]. The researchers set
objectives to assess the current maintenance system, to determine the overall
equipment effectiveness and to identify key performance indicators and success
factors of TPM. Data relevant to the research was collected using designed
questionnaires, structured interviews, direct observations and company records
the researchers then designed a TPM model which would result in effective
implementation of TPM for higher competitiveness in the dynamic business
environment. To improve the accessibility of the existing equipment and in
consequence curtail the further capital investment using TPM, a case study [6]
has been carried out at cotton spinning plant to identify the extensive
deficiency associated with equipment effectiveness. The paper intents on
analyzing the practical problems accomplishing TPM program and improved
the effectiveness for critical machine by significant value. Another paper
studied the implementation of TPM which is done by performing machine wise
breakdown analysis. TPM is a medical science of machine which improves the
performance of maintenance activity, product and process quality, employee
morale and job satisfaction. The study establishes that focused on section wise
breakdown analysis, breakdown types wise and equipment wise breakdown
analysis to avoid delay in manufacturing process [7]. TPM was also
implemented in a machine shop area in a manufacturing industry (Yamuna m/c
works ltd.) and to evaluate OEE of individual machines placed in machine shop
area. The study is conducted in a food industry in South India which is engaged
in the manufacturing of egg related products. The implementation factors and
performance are compared with that in TPM awarded industry and the
correlation is found significant. The aim of the study was to help improve the
system through training, awareness and improving the performance of
employees by comparing performance and implementation factors [8].
In the case study under consideration; (Al Awael Food Industries Co., 6th of
October City, Egypt) many problems were detected as a great loss in
maintenance time operations, lack of proper training for workers in the
maintenance management, shortage of spare parts, lack of coordination planned
maintenance, lack of AM and increase of maintenance costs. Therefore, many
objectives were set for this study such as designing a program to measure the
performance of TPM within the industrial facilities, apply the principles of
TPM in the required manner, and reduce the maintenance management costs
through the application of the principles of TPM.
Gamal H.Shehata/et al/ Engineering Research Journal 160 (December 8102) M1 – M25
M5
This paper contains five sections; the first is the introduction section, the
second is the experimental work, the third is results and discussions, the fourth
is the conclusion section, the last section is the References section.
2. Experimental work
In this work a TPM evaluation program will be designed to detect the current
TPM implementation in the factory, and then the eight principals of TPM will
be implemented on the factory, after that the TPM will be evaluated again and
be compared to the first value, this is done by the following steps;
A. TPM Evaluation Program Design
A Questionnaire preparation: A questionnaire consisting of a set of checklists
for the principles of TPM has been prepared. Each list contains a set of
questions for the main items of each principle. The items are measured before
and after the application.
Data entry stage: this program was implemented on the basis of the
experienced staff within the factory to obtain the data. The data for the
evaluation program shall be entered in the form of answers to the questions
prepared for each main principle of TPM, with the possibility of modification
or deletion of each question.
B. Evaluation of the current TPM situation
An evaluation of the workers within the Alawael for Food Industries is
carried out through inspection lists for TPM. The answers values are chosen
from 1 to 5, where 1 is the lowest rating and 5 is the highest rating according to
Table 1:
Table 1: Evaluation values
Evaluation values
1 2 3 4 5
(0 to 20)% (21 to 40)% (41 to 60)% (61 to 80) % (81 to 100)%
The program will calculate the TPM principles by equation NO. 1:
(#)% = ……………………. (1)

Gamal H.Shehata/et al/ Engineering Research Journal 160 (December 8102) M1 – M25
M6
Where
# : is the measured TPM principle,
N : is the number of questions,
N1, N2, N3, N4, and N5: are the evaluation values of each answer per
principle.
C. TPM implementation
Training sessions will be conducted at the company's training department in
order to improve the awareness of the principles of TPM. Then, second
evaluation is carried out after applying the principles of TPM.
3. Results and discussions
Table 2 shows the questions checklist and the results of the 5S principle
evaluation before and after the application of the TPM principles. The 5S
principle evaluation were 74.12% before applying the TPM principles, while
the evaluation results after evaluating the TPM application were 80.11%. This
is due to: Not all unnecessary items were removed but some of them were
needed. Non-essential objects were not kept in a particular place but are placed
randomly. There were no fixed rules to ensure cleanliness and order of work,
but this is done as needed. The equipment is placed randomly, which takes
considerable time to reach. After applying the principles of TPM, the
Performance has been improved as shown in Table 2. The first assessment
appears before and after application of the principles TPM of Figure 1.
Note: Bar charts from Figure 1 to Figure 8 show the evaluation value of the
answer of each question (from 1 to 5) on the horizontal axis, and the number
of repeating each evaluation value on the vertical axis. For example, the
evaluation value of '5' is repeated 3 times before TPM implementation, and 5
times after TPM implementation as shown in Figure 1 and Table 2, which
means an increase in TPM tasks done by the staff leading to an enhancement in
the TPM performance evaluation for the 5S plan.
From Figure 1 it was found that the number of repeating of evaluation values 1
and 2 decreased while the number of repeating of the evaluation values 4 and 5
increased after the application of TPM 5S principle which indicates an
improvement in performance.
Table 2: Evaluation of Principle of 5S (SSSSS)
NO Questions
Results
Before After
1 2 3 4 5 1 2 3 4 5

Gamal H.Shehata/et al/ Engineering Research Journal 160 (December 8102) M1 – M25
M7
1 Is there a prior knowledge of the program of the 5S?
√ √
2 Does the 5s program apply as required?
√ √
3 Are unnecessary items removed and only necessary items kept?
√ √
4 Are unnecessary tools and objects kept in a designated space?
√ √
5 Are employees trained on 5S principles?
√ √
6 Is your workplace regularly cleaned?
√ √
7 Are there rules and procedures to ensure the order and cleanliness of
the place of work?
√ √
8 Are employees committed to applying new workplace rules and
standards and workplace procedures?
√ √
9 Do you see that applying the 5S program is appropriate for your
company?
√ √
10 Is there a company plan for applying 5S principles? √ √
11 Do employees have acceptance of the 5S program? √ √
12 Can You train principals and leaders on 5S principles? √ √
13 Are equipment classified within the facility? √ √
14 Do you provide all the necessary tools by the management to
implement the 5S principles?
√ √
15 Is there participation and cooperation among the staff when applying
5S principles?
√ √
16 Are there operating instructions for equipment and machinery? √ √
17 Are unnecessary items arranged in easily accessible places? √ √
Total 1 2 3 6 5 0 1 3 7 6
Figure 1: Measure of the principle of 5S before and after applying TPM
Table 3 shows the questions checklist and the results of the PM principle
evaluation before and after the application of the TPM principles. The PM
principle evaluation was 68.24% before applying the TPM principles, while the
evaluation results after the TPM application were 76.47%. This is due to: There

Gamal H.Shehata/et al/ Engineering Research Journal 160 (December 8102) M1 – M25
M8
is no system that analyzes the results obtained from maintenance operations,
there is no predictive maintenance system, maintenance is not evaluated and
maintenance plan is not implemented properly. After applying the principles of
TPM, Table 2 shows the questions checklist and the results of the 5S principle
evaluation before and after the application of the TPM principles. The 5S
principle evaluation were 74.12% before applying the TPM principles, while
the evaluation results after evaluating the TPM application were 80.11%. This
is due to: Not all unnecessary items were removed but some of them were
needed. Non-essential objects were not kept in a particular place but are placed
randomly. There were no fixed rules to ensure cleanliness and order of work,
but this is done as needed. The equipment is placed randomly, which takes
considerable time to reach. After applying the principles of TPM, From Figure
2 the number of repeating of evaluation values 1 and 2 decreased while the
number of repeating of the evaluation values 3, 4 and 5 increased after the
application of TPM PM Principle which indicates an improvement in
performance.
Table 3: Evaluation of Principle of PM
NO Questions
Results
Before After
1 2 3 4 5 1 2 3 4 5
1 There an inventory of all machines and equipment?
√
√
2 Is there a maintenance information system that analyzes all data?
√
√
3 Is there a plan for the in-house maintenance program?
√
√
4 Is the plan implemented according to schedule?
√
√
5 Is there a plan for lubrication and greases of equipment and
machinery? √
√
6 Is the Lubrication and Lubrication Plan for Equipment and
Machinery implemented at specified times? √
√
7 Is a system for predictive maintenance installed?
√
√
8 Is all planned maintenance activities assessed?
√
√
9 Are there procedures for early detection of malfunctions?
√
√
10 Is there a specific approach to reducing repair times?
√
√
11 Are All faults recorded for all equipment and machinery?
√
√
12 Is there a plan to maintain the infrastructure of the facility?
√
√
13 Is there an inventory of all equipment catalogs within the facility? √ √
14 Are You coding equipment? √ √
15 Is there an inventory of all spare parts required for each stomach?
√
√
16 Are there schedules to be implemented through preventive
maintenance? √ √
17 Are There instructions on and off for all equipment?
√
√
Gamal H.Shehata/et al/ Engineering Research Journal 160 (December 8102) M1 – M25
M9
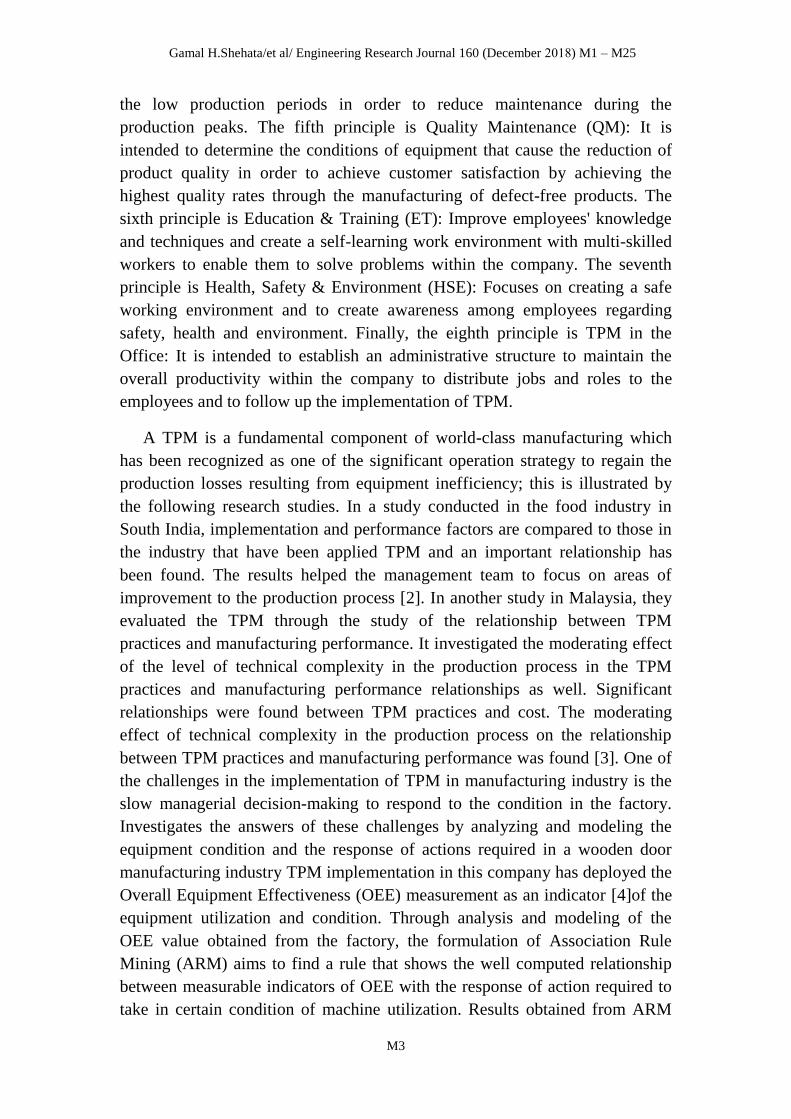
Total 4 1 2 4 6 0 1 6 5 5
4
1
2
4
6
0
1
6
5 5
0
1
2
3
4
5
6
7
Number of repeating of
evaluation value
Evaluation value
PM Befor TPM
PM After TPM
Figure 2: Measure of the principle of PM before and after applying TPM
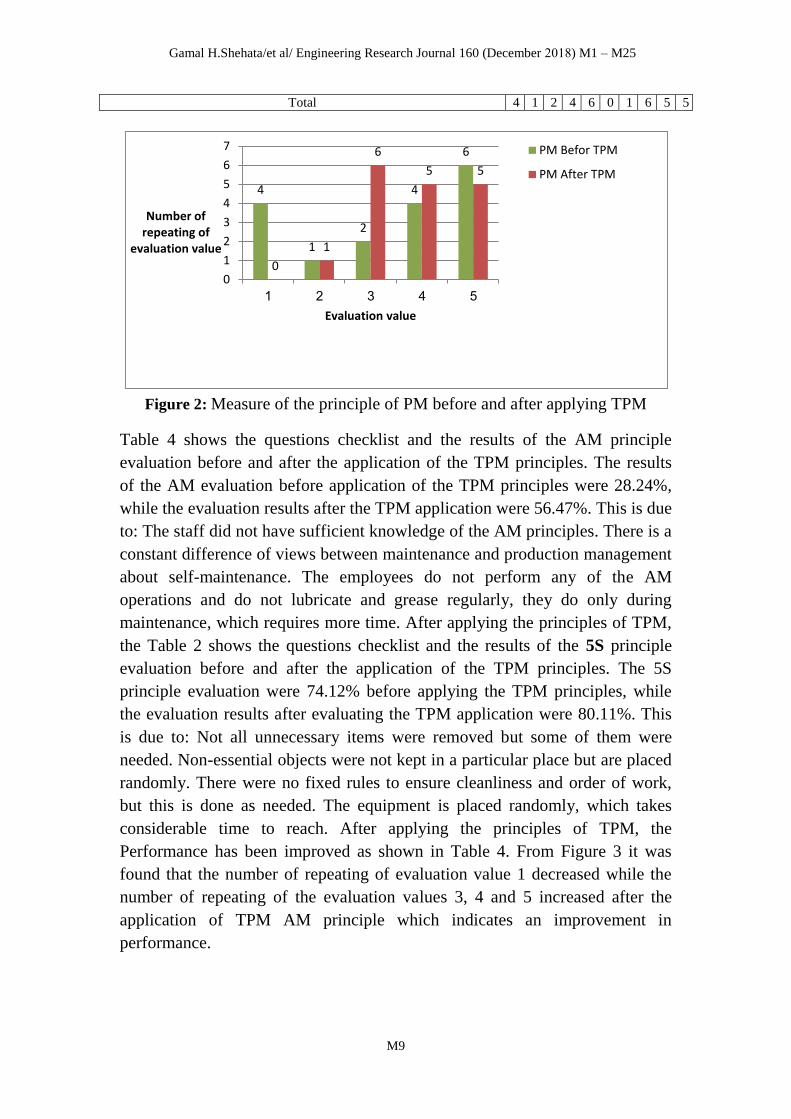
Table 4 shows the questions checklist and the results of the AM principle
evaluation before and after the application of the TPM principles. The results
of the AM evaluation before application of the TPM principles were 28.24%,
while the evaluation results after the TPM application were 56.47%. This is due
to: The staff did not have sufficient knowledge of the AM principles. There is a
constant difference of views between maintenance and production management
about self-maintenance. The employees do not perform any of the AM
operations and do not lubricate and grease regularly, they do only during
maintenance, which requires more time. After applying the principles of TPM,
the Table 2 shows the questions checklist and the results of the 5S principle
evaluation before and after the application of the TPM principles. The 5S
principle evaluation were 74.12% before applying the TPM principles, while
the evaluation results after evaluating the TPM application were 80.11%. This
is due to: Not all unnecessary items were removed but some of them were
needed. Non-essential objects were not kept in a particular place but are placed
randomly. There were no fixed rules to ensure cleanliness and order of work,
but this is done as needed. The equipment is placed randomly, which takes
considerable time to reach. After applying the principles of TPM, the
Performance has been improved as shown in Table 4. From Figure 3 it was
found that the number of repeating of evaluation value 1 decreased while the
number of repeating of the evaluation values 3, 4 and 5 increased after the
application of TPM AM principle which indicates an improvement in
performance.

Gamal H.Shehata/et al/ Engineering Research Journal 160 (December 8102) M1 – M25
M10
Table 4: Evaluation of Principle of AM
NO Questions
Results
Before After
1 2 3 4 5 1 2 3 4 5
1 Do you arrange all the equipment and tools you deal with?
√ √
2 Are employees being taught the benefits of TPM through training?
√ √
3 Do operators continuously improve the performance of the equipment
and reduce the time required for cleaning operations?
√ √
4 Has the importance of applying the self-maintenance system been
clarified? √
√
5 Is it scheduled to clean the equipment thoroughly by the operators?
√ √
6 Have You sufficient knowledge of how to lubricate and grease the
stomach? √
√
7 Do you remove excess stains and grease from machinery and
equipment?
√ √
8 Have steps been taken to facilitate cleaning of equipment?
√ √
9 Is the machine cleaned in a way that prevents the formation of dust
and dirt on it?
√
√
10 Are Autonomous Maintenance schedules scheduled and executed
accurately?
√
√
11 Does the AM schedule include inspection, cleaning, lubrication and
other details (such as when, why, and how to schedule)?
√
√
12 Where Do you training on the general operator of equipment such as
inspection, lubrication, electrical inspection, safety and others?
√
√
13 Are The technical skills of operators improved on how to use the
screening tools correctly?
√
√
14 Are the technical know-how acquired by operators among them?
√
√
15 Do the cleaning and lubrication methods used are updated? √ √
16 Is the operator cooperating with the supervisor to prepare self-
examination of the machine scheduling?
√
√
17 Does the operator delete the parts that do not need continuous
checking from the list of parts when performing the general √
√
Total
12
3
2
0
0
1
6
6
3
1
Figure 3: Measure of the principle of AM before and after applying TPM

Gamal H.Shehata/et al/ Engineering Research Journal 160 (December 8102) M1 – M25
M11
Table 5 shows the questions checklist and the results of the ET principle
evaluation before and after the application of the TPM principles. The results
of the ET evaluation before application of the TPM principles were 56.47%,
while the evaluation results after the TPM application were 77.65%. This is due
to: The situation of the current technicians and operators was not determined
before training to determine the training needs. The plan was not implemented
as planned and specific mechanisms were not developed to define the training
plan. Training on how to develop technicians and operators’ skills were not
adopted. After applying the principles of TPM, the Performance has been
improved as shown in Table 5. The first assessment appears before and after
application of the principles TPM in Figure 4.
Table 5: Evaluation of Principle of ET
NO Questions
Results
Before After
1 2 3 4 5 1 2 3 4 5
1 Is there an ET plan? √ √
2 Is the current status of ET verified for operators and technicians
working in the maintenance department?
√ √
3 Are specific timetables for the training plan established? √ √
4 Is the ET plan implemented as expected? √ √
5 Is there training to upgrade the training skills and maintenance plan? √ √
6 Are priorities for the implementation of training programs set for
maintenance (mechanical, electrical, educating new operators, etc.)?
√ √
7 Can engineers and managers be trained in the maintenance department
to suit their responsibilities?
√ √
8 Is the course program implemented at the work site by the company's
engineers and technicians? √
√
9 Are all workers trained with equipment from operators, on concepts,
objectives, and principles of TPM? √
√
10 Is the training required for all new people assigned to the maintenance
department?
√
√
11 Is there a way to evaluate and assess trainees? √
√
12 Is there a possibility of training outside the facility if necessary? √
√
13 Is there continuous improvement under the training plan? √
√
14 Are Trainers very skilled and efficient? √
√
15 Is there a possibility of exchanging information among trainees? √
√
16 Is there a processing of the work environment for ET? √
√
17 Can You staff training facility staff on how to acquire skills in their
fields? √
√
Total 6 2 1 5 3 0 0 6 7 4

Gamal H.Shehata/et al/ Engineering Research Journal 160 (December 8102) M1 – M25
M12
Figure 4: Measure of the principle of ET before and after applying TPM
Table 6 shows the questions checklist and the results of the SHE principle
evaluation before and after the application of the TPM principles. The results
of the SHE evaluation before application of the TPM principles were 71.76%,
while the evaluation results after the TPM application were 80%. This is due
to: From the previous results, it was noted that the performance of SHE is good
to some extent and there are some shortcomings need to be improved to reach
the optimum results. Procedures are not reviewed after emergency operations
as required. No recommendations or proposals for improvement are made, they
are done only by the Safety Committee without the participation of staff, and
monitoring and measurement are not done as required. After applying the
principles of TPM, the Performance has been improved as shown in Table 6.
The first assessment appears before and after application of the principles TPM
in Figure 5.
Table 6: Evaluation of Principle of SHE
NO Questions
Results
Before After
1 2 3 4 5 1 2 3 4 5
1 Are all roles, responsibilities and authorities of all parties involved are
documented?
√ √
2 Are process control documented?
√ √
3 Are documents approved before being issued by the Occupational
Safety and Health Committee?
√ √
4 Are Operations and activities are identified for significant risks and
damage?
√ √
5 Is there a procedure to prevent and respond to the risks and harms of
occupational safety and health systems?
√ √
6 Are the procedures reviewed and checked especially after the
emergency?
√ √
7 Do you monitor and measure the performance of occupational safety
and health?
√ √
Gamal H.Shehata/et al/ Engineering Research Journal 160 (December 8102) M1 – M25
M13
8 Is there a corrective and preventive system for occupational health and
safety procedures?
√ √
9 Do monitoring and measurements are compatible with the goals and
objectives?
√
√
10 Do monitoring and measurements are compatible with legal
requirements?
√
√
11 Is there a periodic assessment of occupational safety and health to
ensure that the system complies with occupational safety and health
requirements?
√
√
12 Are there internal management reviews in which compliance with
legislative requirements is assessed?
√
√
13 Are accident investigations saved?
√
√
14 Is there continuous improvement to prevent or reduce accidents? √
√
15 Are Records easy to reference and protected from damage? √
√
16 Are documents approved before they are issued? √ √
17 Are procedures reviewed and verified after an emergency? √
√
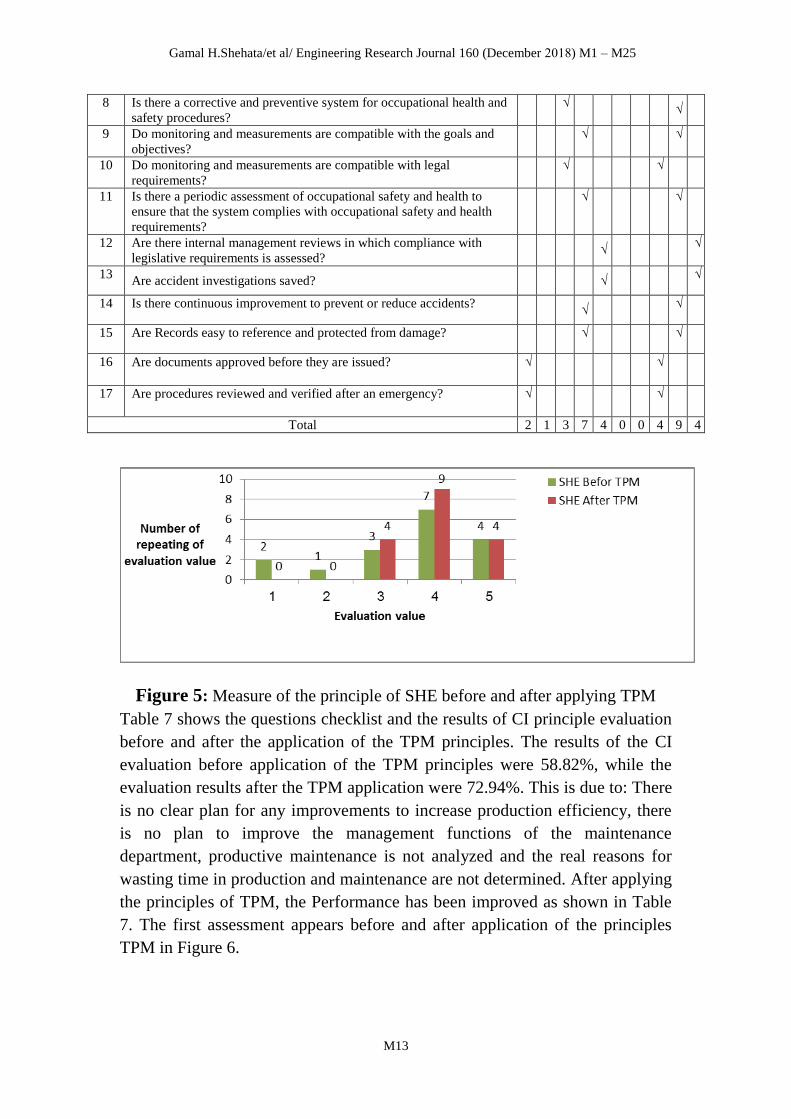
Total 2 1 3 7 4 0 0 4 9 4
Figure 5: Measure of the principle of SHE before and after applying TPM
Table 7 shows the questions checklist and the results of CI principle evaluation
before and after the application of the TPM principles. The results of the CI
evaluation before application of the TPM principles were 58.82%, while the
evaluation results after the TPM application were 72.94%. This is due to: There
is no clear plan for any improvements to increase production efficiency, there
is no plan to improve the management functions of the maintenance
department, productive maintenance is not analyzed and the real reasons for
wasting time in production and maintenance are not determined. After applying
the principles of TPM, the Performance has been improved as shown in Table
7. The first assessment appears before and after application of the principles
TPM in Figure 6.

Gamal H.Shehata/et al/ Engineering Research Journal 160 (December 8102) M1 – M25
M14
Table 8 shows the questions checklist and the results of QM principle
evaluation before and after the application of the TPM principles. The results
of the QM evaluation before application of the TPM principles were 57.65%,
while the evaluation results after the TPM application were 75.29%. This is due
to: There are many factors that affect maintenance quality, including the use of
raw materials that do not correspond to harmful substances, Specifications in
machine mold, and The existence of old machines that require constant repair,
and affect the quality of the product, special attention is paid to old machines
and equipment, and the knowledge of independent maintenance activities by
operators leads to frequent machine failures. After applying the principles of
TPM, the Performance has been improved as shown in Table 8. The first
assessment appears before and after application of the principles TPM in
Figure 7.
Table 7: Evaluation of Principle of QM
NO Questions
Results
Before After
1 2 3 4 5 1 2 3 4 5
1 Is there a plan to implement quality maintenance in equipment to
increase productivity efficiency?
√ √
2 Do you use maintenance quality in all maintenance areas?
√ √
3 Do you analyze why there is a lost time -, etc.)?
√ √
4 Is there a plan to get rid of damaged and defective parts that cause
wasting time when looking for parts?
√ √
5 Is there a plan to raise the efficiency of the workers' maintenance
department?
√ √
6 Is there a continuous assessment of maintenance personnel to see how
well the maintenance quality of the equipment is applied?
√ √
7 Is there a plan to eliminate all the surrounding conditions that
accelerate the deterioration
√ √
8 Is there a plan to try to achieve and maintain zero losses for minor
stations?
√ √
9 Is there a plan to try to apply the zero principle in all activities? √
√
10 Is there a plan for a constant effort to reduce the cost in all the
resources of the company?
√
√
11 Is there a plan for an ongoing effort to reduce the cost? √ √
12 Is there a plan to achieve a permanent effort to increase the total plant
efficiency of the refinery?
√
√
13 Is there a plan to try to reduce the resulting output from the
maintenance process through quality maintenance?
√
√
14 Does the organization have a role in applying the quality of
maintenance?
√
√
15 All the staff of the establishment can participate in quality maintenance
currency
√
√
16 Can all employees of the facility participate in the currency of
continuous improvement?
√
√
17 Does the quality of maintenance help in the process of improvement? √
√
Gamal H.Shehata/et al/ Engineering Research Journal 160 (December 8102) M1 – M25
M15
Total 5 2 2 5 3 0 1 5 8 3
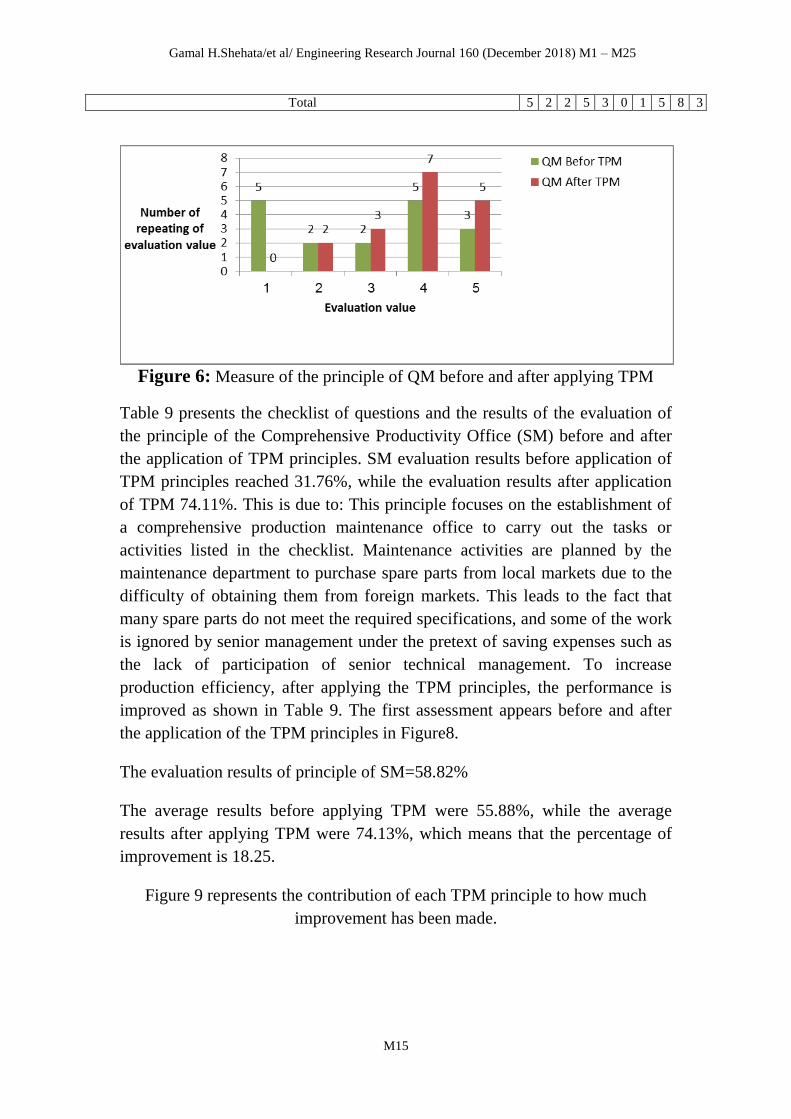
Figure 6: Measure of the principle of QM before and after applying TPM
Table 9 presents the checklist of questions and the results of the evaluation of
the principle of the Comprehensive Productivity Office (SM) before and after
the application of TPM principles. SM evaluation results before application of
TPM principles reached 31.76%, while the evaluation results after application
of TPM 74.11%. This is due to: This principle focuses on the establishment of
a comprehensive production maintenance office to carry out the tasks or
activities listed in the checklist. Maintenance activities are planned by the
maintenance department to purchase spare parts from local markets due to the
difficulty of obtaining them from foreign markets. This leads to the fact that
many spare parts do not meet the required specifications, and some of the work
is ignored by senior management under the pretext of saving expenses such as
the lack of participation of senior technical management. To increase
production efficiency, after applying the TPM principles, the performance is
improved as shown in Table 9. The first assessment appears before and after
the application of the TPM principles in Figure8.
The evaluation results of principle of SM=58.82%
The average results before applying TPM were 55.88%, while the average
results after applying TPM were 74.13%, which means that the percentage of
improvement is 18.25.
Figure 9 represents the contribution of each TPM principle to how much
improvement has been made.

Gamal H.Shehata/et al/ Engineering Research Journal 160 (December 8102) M1 – M25
M16
Figure 7: The contribution of each TPM principle in total improvement
of TPM
Figure 9 represents the contribution of each TPM principle to the overall
amount of improvement achieved, the overall improvement of total product
maintenance performance is 18.25%. Each principle shared in this
improvement as in Figure 9, for example contribution of 5S was 4.1% of the
overall value (18.25%). The SM principle has the highest improvement share
value (29.01%), and all of AM, ET, QM, and CI have a high share in the
overall improvement value, these are 19.34, 14.51, 12.08 and 9.67
respectively. On the contrary, both of PM and SHE have a small share in the
overall improvement value, these are 5.64 and 4.1 respectively.
The measures of dispersion calculation such as mean and standard deviation
are presented in Table 10 for the TPM principles elements before and after
TPM application.
Table 8: Mean and standard deviation
The principles Mean before
Std.
Deviation
before
Mean after
Std. Deviation
after
SSSSS 3.71 1.213 3.89 1.088
PM 3.41 1.622 3.59 1.549
AM 2.82 1.629 2.29 .470
ET 1.41 .712 4.00 .466
SHE 3.41 1.228 3.59 1.278
CI 2.94 1.560 3.76 1.348

Gamal H.Shehata/et al/ Engineering Research Journal 160 (December 8102) M1 – M25
M17
QM 2.94 1.560 3.06 1.298
SM 3.72 1.328 2.41 1.238
The application of the TPM principles had a positive impact on the factory as
follows: The mean of the principles of TPM before application was between
(1.41: 3.71) which means that the performance was between (10%: 70%), while
the arithmetic mean after applying the principles of TPM was between (2.29:
4.06) which means that the performance was between (23%: 81%), which
shows an improvement in performance about 60.9%. Further, when the
standard deviation measure was applied, the results before the application were
between (0.712 : 1.629) while standard drift values after application (0.470 :
1.549) indicating that the standard deviation values before applying the TPM
are higher than the values after applying it, which confirms an improvement in
performance because the deviation from natural values decreased.
Performance indicators were selected for each principle to measure
performance improvement as follows:
Figures from Figure 10 to Figure 15 show both TPM implementation stage and
performance evaluation values on the vertical axis where the values from 1 to 5
represent the TPM implementation stage (1: Preliminary stage, 2: Awareness
primary stage, 3: Planning stage, 4: stage of implementation, 5: Full
implementation), or represent the performance evaluation percentage (20%,
40%, 60%, 80%, and 100%). The horizontal axis represents the selected
performance indicators which differ according to each principle.
Figure 10 shows the performance indicators selected to measure performance
improvement in the 5S plan on the horizontal axis; these are the (extent of
implementation, the extent of staff participation and cooperation, the extent to
which managers accept the implementation of the 5S principles and the extent
of participation in improvement and development the performance of the 5S).
For example, with respect to the first performance indicator which is 'the extent
of implementation' the implementation stage was 3.2 meaning it goes over the
third stage of TPM implementation “Planning stage”, with performance
evaluation of 3 from 5 which means it equals about 41% to 60%, and the
average improvement in the performance of 5S in full is 6%, which is the same
proportion of 5S performance before and after application as in Figure 1.
Gamal H.Shehata/et al/ Engineering Research Journal 160 (December 8102) M1 – M25
M18
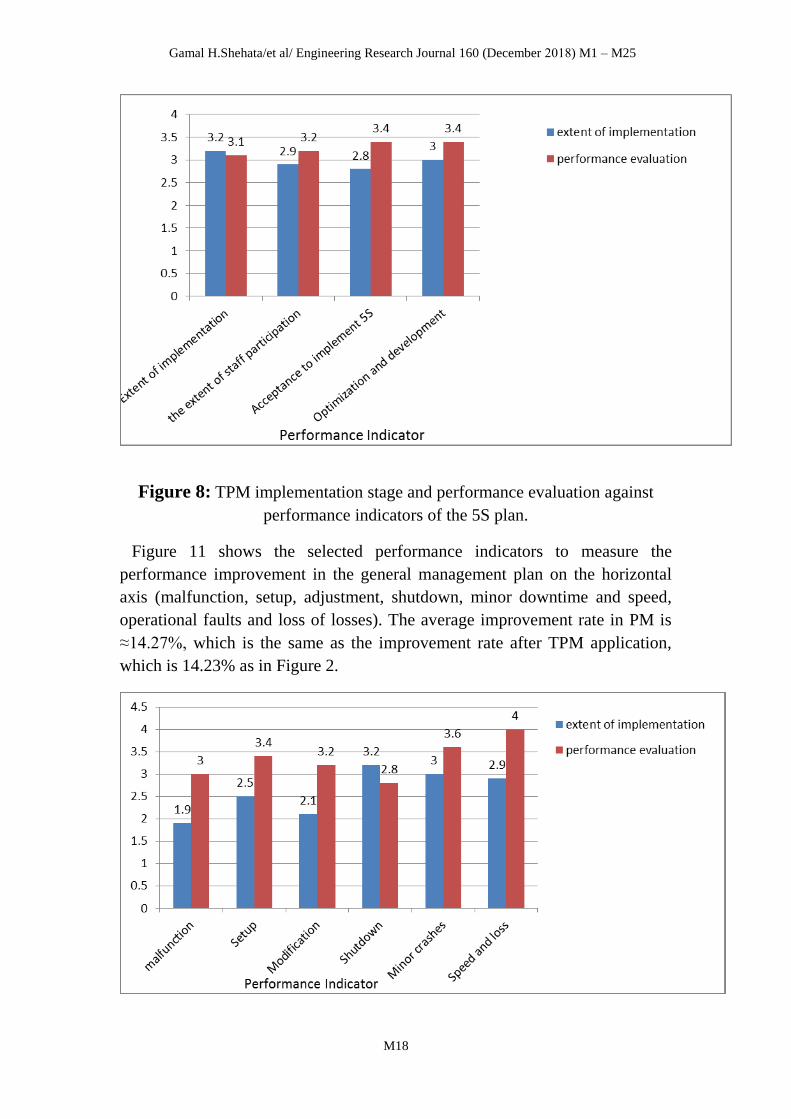
Figure 8: TPM implementation stage and performance evaluation against
performance indicators of the 5S plan.
Figure 11 shows the selected performance indicators to measure the
performance improvement in the general management plan on the horizontal
axis (malfunction, setup, adjustment, shutdown, minor downtime and speed,
operational faults and loss of losses). The average improvement rate in PM is
≈14.27%, which is the same as the improvement rate after TPM application,
which is 14.23% as in Figure 2.

Gamal H.Shehata/et al/ Engineering Research Journal 160 (December 8102) M1 – M25
M19
Figure 9: TPM implementation stage and performance evaluation against
performance indicators of the PM plan.
Figure 12 shows the relation between both TPM implementation stage and
performance evaluation values on the vertical axis and the selected
performance indicators on the horizontal axis of AM plan and performance
indicators (MTBF, MTTR, time reduction, unlimited time reduction, product
reduction and maintenance machine) The average improvement rate in AM is
≈28.33%, which is the same as the improvement rate after TPM application,
which is 28.23% as in Figure 3.
Figure 10: TPM implementation stage and performance evaluation against
performance indicators of the AM plan.
Figure 13 shows the relation between both TPM implementation stage and
performance evaluation values on the vertical axis and the selected
performance indicators on the horizontal axis of ET plan and performance
indicators (The extent to which the training plan has been implemented, The
extent of staff response to the training plan, Improved performance of
employees as a result of training and Effect of training on the production
process). The average improvement rate in ET is ≈22%, which is the same as
the improvement rate after TPM application, which is 21.18% as in Figure 4.

Gamal H.Shehata/et al/ Engineering Research Journal 160 (December 8102) M1 – M25
M20
Figure 11: TPM implementation stage and performance evaluation against
performance indicators of the ET plan.
Figure 14 shows the relation between both TPM implementation stage and
performance evaluation values on the vertical axis and the selected
performance indicators on the horizontal axis of SHE plan and performance
indicators (Number of audit failures per total findings, Reduction in accidents,
Monitoring and measurement compatibility with objectives and targets The
effectiveness of improvements to the system and Effectiveness of safety, health
and environment reports). The average improvement rate in SHE is ≈8.2%,
which is the same as the improvement rate after TPM application, which is
8.24% as in Figure 5.

Gamal H.Shehata/et al/ Engineering Research Journal 160 (December 8102) M1 – M25
M21
Figure 12: TPM implementation stage and performance evaluation against
performance indicators of the SHE plan.
Figure 15 shows the relation between both TPM implementation stage and
performance evaluation values on the vertical axis and the selected
performance indicators on the horizontal axis of CI plan and performance
indicators (Extent of implementation of the improvement plan developed,
Reduced costs, Impact of improvements on spare parts reduction, Effective
participation of employees in the improvement process, the impact of the
optimization plan, and reduction in overtime work). The average improvement
rate in CI is ≈14.67%, which is the same as the improvement rate after TPM
application, which is 14.12% as in Figure 6.

Gamal H.Shehata/et al/ Engineering Research Journal 160 (December 8102) M1 – M25
M22
Figure 13: TPM implementation stage and performance evaluation against
performance indicators of the CI plan.
Figure 16 shows the relation between both TPM implementation stage and
performance evaluation values on the vertical axis and the selected
performance indicators on the horizontal axis of QM plan and performance
indicators (Quality level, zero defect area and zero customer complaint area).
The average improvement rate in QM is ≈18%, which is the same as the
improvement rate after TPM application, which is 17.64% as in Figure 7.
Figure 14: TPM implementation stage and performance evaluation against
performance indicators of the QM plan.
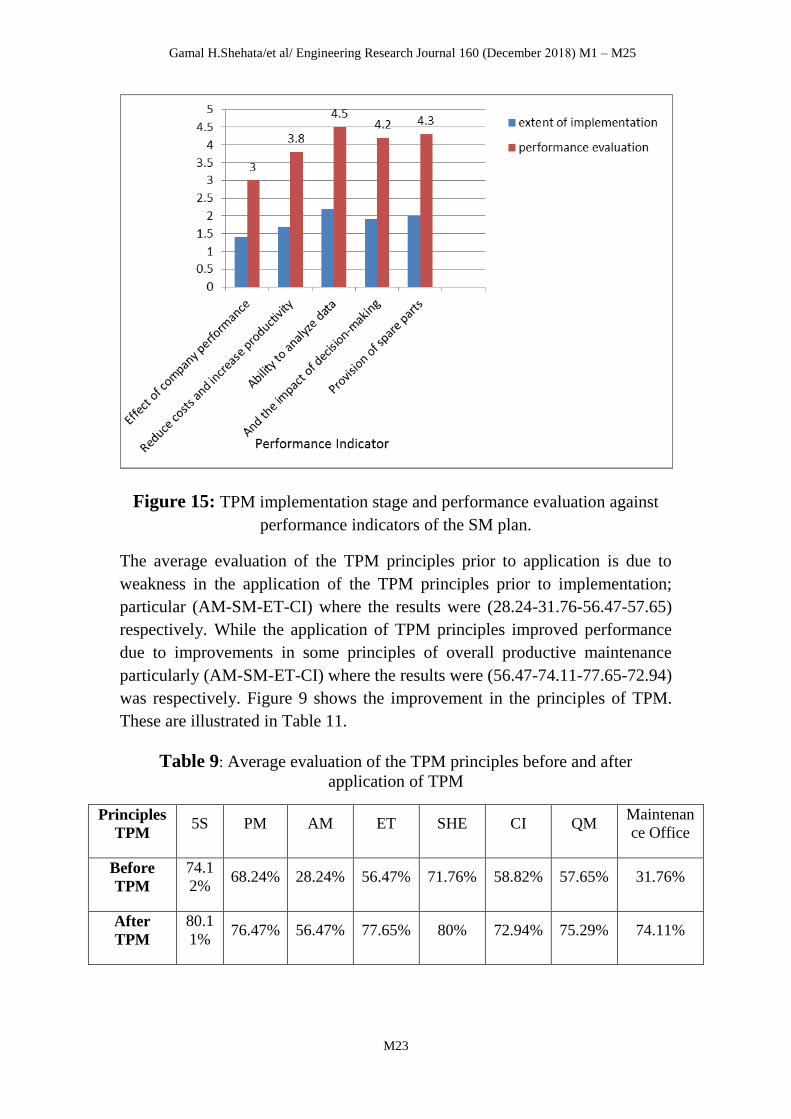
Figure 15 shows the relation between both TPM implementation stage and
performance evaluation values on the vertical axis and the selected
performance indicators on the horizontal axis of Maintenance Office plan and
performance indicators (SM impact of company performance, Reduced costs
and increased productivity, Ability to analyze data, The extent of influence in
decision-making and Provide spare parts in partnership with senior
management). The average improvement rate in Maintenance Office is ≈43%,
which is the same as the improvement rate after TPM application, which is
42.35% as in Figure 8.
Gamal H.Shehata/et al/ Engineering Research Journal 160 (December 8102) M1 – M25
M23
Figure 15: TPM implementation stage and performance evaluation against
performance indicators of the SM plan.
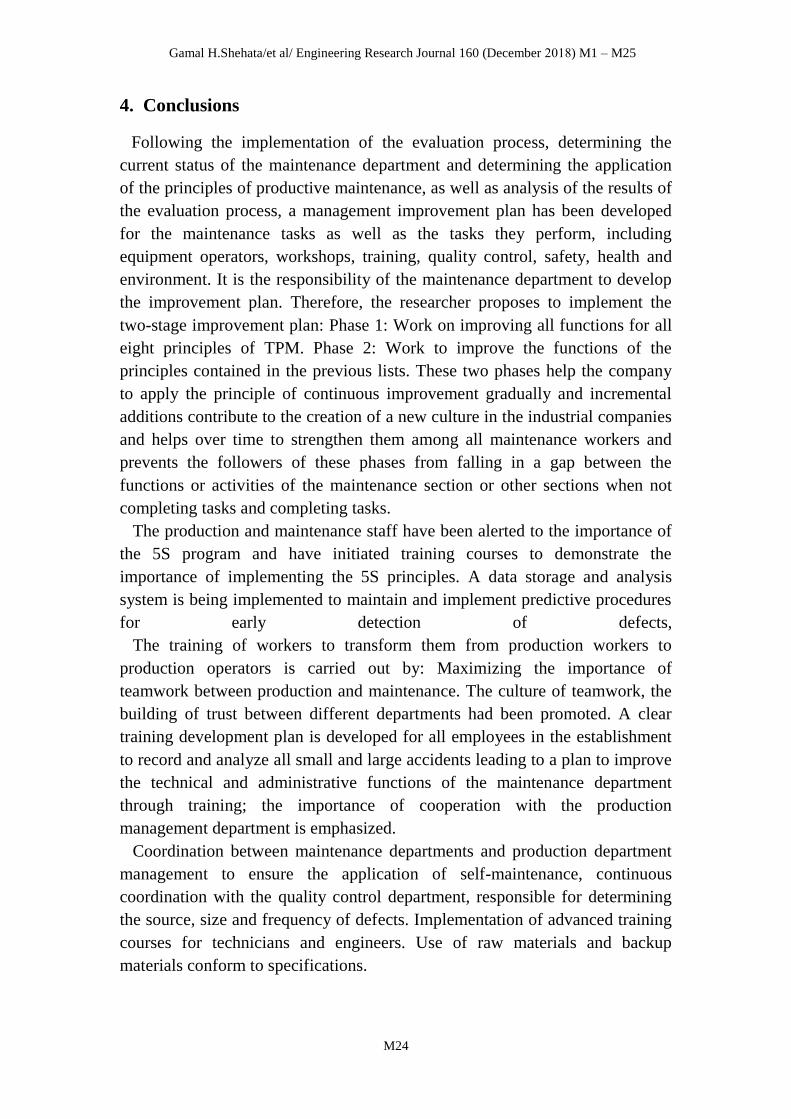
The average evaluation of the TPM principles prior to application is due to
weakness in the application of the TPM principles prior to implementation;
particular (AM-SM-ET-CI) where the results were (28.24-31.76-56.47-57.65)
respectively. While the application of TPM principles improved performance
due to improvements in some principles of overall productive maintenance
particularly (AM-SM-ET-CI) where the results were (56.47-74.11-77.65-72.94)
was respectively. Figure 9 shows the improvement in the principles of TPM.
These are illustrated in Table 11.
Table 9: Average evaluation of the TPM principles before and after
application of TPM
Principles
TPM 5S PM AM ET SHE CI QM
Maintenan
ce Office
Before
TPM
74.1
2% 68.24% 28.24% 56.47% 71.76% 58.82% 57.65% 31.76%
After
TPM
80.1
1% 76.47% 56.47% 77.65% 80% 72.94% 75.29% 74.11%
Gamal H.Shehata/et al/ Engineering Research Journal 160 (December 8102) M1 – M25
M24
4. Conclusions
Following the implementation of the evaluation process, determining the
current status of the maintenance department and determining the application
of the principles of productive maintenance, as well as analysis of the results of
the evaluation process, a management improvement plan has been developed
for the maintenance tasks as well as the tasks they perform, including
equipment operators, workshops, training, quality control, safety, health and
environment. It is the responsibility of the maintenance department to develop
the improvement plan. Therefore, the researcher proposes to implement the
two-stage improvement plan: Phase 1: Work on improving all functions for all
eight principles of TPM. Phase 2: Work to improve the functions of the
principles contained in the previous lists. These two phases help the company
to apply the principle of continuous improvement gradually and incremental
additions contribute to the creation of a new culture in the industrial companies
and helps over time to strengthen them among all maintenance workers and
prevents the followers of these phases from falling in a gap between the
functions or activities of the maintenance section or other sections when not
completing tasks and completing tasks.
The production and maintenance staff have been alerted to the importance of
the 5S program and have initiated training courses to demonstrate the
importance of implementing the 5S principles. A data storage and analysis
system is being implemented to maintain and implement predictive procedures
for early detection of defects,
The training of workers to transform them from production workers to
production operators is carried out by: Maximizing the importance of
teamwork between production and maintenance. The culture of teamwork, the
building of trust between different departments had been promoted. A clear
training development plan is developed for all employees in the establishment
to record and analyze all small and large accidents leading to a plan to improve
the technical and administrative functions of the maintenance department
through training; the importance of cooperation with the production
management department is emphasized.
Coordination between maintenance departments and production department
management to ensure the application of self-maintenance, continuous
coordination with the quality control department, responsible for determining
the source, size and frequency of defects. Implementation of advanced training
courses for technicians and engineers. Use of raw materials and backup
materials conform to specifications.
Gamal H.Shehata/et al/ Engineering Research Journal 160 (December 8102) M1 – M25
M25
AReferences
[1] Seiichi Nakajima.,"Introduction to TPM ," press, Cambridge, MA, USA
[2] Kochi and Dr Mary Joseph., "TPM Implementation in a Food Industry-A
PDCA Approach.," IJSER, vol.2, issue 11, nov-2012.
[3] Halim Mad Lazim, Mohamed Najib Salleh, Chandrakantan Subramaniam, and
Siti Norezam Othman ., "Total Productive Maintenance and Manufacturing.,"
IJTEF, Vol. 4, IJTEF.6,DEC-2013
[4] Taufik Djatnaa and Imam Muharram Alitub.," An analysis and modelling in
wooden door manufacturing industry.," IESS, apr-2015.
[5] Bupe. G. Mwanzaa and Charles Mbohwaa, "Case study of a chemical
manufacturing company.," IESS, apr-2015.
[6] Nofri Eka Candra, Anita Susilawati, Herisiswanto, and Wahyu Setiady
"implementation of total productive maintenance (TPM) to Improve Sheeter
Machine Performance.," MATEC Web of Conferences 135, 00028 (2017).
[7] Saureng Kumar, Raj Bhushan and Shubham Swaroop "Study of total
productive maintenance.,"IJSRE,vol.1, march-2017.
[8] Saurengkumar,RajBhushan and ShubhamSwaroop,"Study of total productive
maintenance & it’s implementation approach.,"IRJET, vol. 4, issue 8, aug-
2017.