
Apple, inc still our top pick but removing from best ideas list after outperformance
15
December 13, 2010 Apple, Inc. Still Our Top Pick But Removing from Best Ideas List After Outperformance Investment conclusion: Apple is being removed from Morgan Stanley’s best ideas list in light of the fact that the stock outperformed over the past six months (up 28% vs. S&P +14%) and the gap between our estimates and consensus has narrowed. We continue to see four key long-term growth drivers including: 1) Smartphone market growth and expanded iPhone distribution, 2) the tablet market opportunity, 3) rising enterprise adoption, and 4) the Chinese consumer. At 16x our CY11 base case EPS estimate (13x ex cash) and a 7% FCF yield, we believe that Apple shares are attractively valued in light of our strong double-digit earnings growth outlook. Increasing confidence in our bull case of $25+ EPS in CY11: The combination of new distribution (Verizon iPhone, Apple stores in China), new products (lower priced iPad in April 2011), and higher product gross margins as iPad/iPhone manufacturing yields improve are key catalysts for upward earnings revisions over the next six months. The consensus CY11 gross margin forecast of flat Y/Y is too conservative, in our view: Despite investor concerns that margins may have peaked, we believe Apple will limit major iterations to its product line in CY11 in order to flow component cost and manufacturing yield/volume benefits through to the bottom line. As a result, we see upside to both C4Q10 and CY2011 gross margin expectations. Apple product pipeline remains robust: We expect: 1) iPhone on Verizon in early 2011, 2) new, lower priced iPad in April 2011, 3) iPhone 5 in June 2011, 4) Smart TV, redesigned iPad, LTE iPhone in 2012. Morgan Stanley does and seeks to do business with companies covered in Morgan Stanley Research. As a result, investors should be aware that the firm may have a conflict of interest that could affect the objectivity of Morgan Stanley Research. Investors should consider Morgan Stanley Research as only a single factor in making their investment decision. For analyst certification and other important disclosures, refer to the Disclosure Section, located at the end of this report. Morgan Stanley & Co. Incorporated Katy L. Huberty, CFA [email protected] +1 212 761 6249 Mathew Schneider, CFA [email protected] +1 212 761 3483 MORGAN STANLEY RESEARCH NORTH AMERICA Stock Rating Overweight Industry View In-Line Key Ratios and Statistics Reuters: AAPL.O Bloomberg: AAPL US Systems and PC Hardware / United States of America Price target $375.00 Shr price, close (Dec 13, 2010) $321.67 Mkt cap, curr (mm) $300,222 52-Week Range $323.99-190.25 Fiscal Year ending 09/09 09/10e 09/11e 09/12e ModelWare EPS ($) 9.08 15.15 19.89 22.55 Prior ModelWare EPS ($) - - - - Consensus EPS ($)§ 6.29 15.15 19.16 22.40 P/E 20.4 18.7 16.2 14.3 EV/rev 3.2 3.3 2.5 2.0 P/FCFfY 18.6 15.8 15.7 11.9 Div yld (%) - - - - Unless otherwise noted, all metrics are based on Morgan Stanley ModelWare framework (please see explanation later in this note). § = Consensus data is provided by FactSet Estimates. e = Morgan Stanley Research estimates Quarterly ModelWare EPS 2010e 2010e 2011e 2011e Quarter 2009 Prior Current Prior Current Q1 2.50 - 3.67a - 5.25 Q2 1.79 - 3.33a - 4.96 Q3 2.01 - 3.51a - 4.49 Q4 2.77 - 4.64a - 5.19 e = Morgan Stanley Research estimates, a = Actual company reported data
-
Upload
stockanalyst -
Category
Documents
-
view
1.197 -
download
9
description
Transcript of Apple, inc still our top pick but removing from best ideas list after outperformance

December 13, 2010
Apple, Inc. Still Our Top Pick But Removing from Best Ideas List After Outperformance
Investment conclusion: Apple is being removed from Morgan Stanley’s best ideas list in light of the fact that the stock outperformed over the past six months (up 28% vs. S&P +14%) and the gap between our estimates and consensus has narrowed. We continue to see four key long-term growth drivers including: 1) Smartphone market growth and expanded iPhone distribution, 2) the tablet market opportunity, 3) rising enterprise adoption, and 4) the Chinese consumer. At 16x our CY11 base case EPS estimate (13x ex cash) and a 7% FCF yield, we believe that Apple shares are attractively valued in light of our strong double-digit earnings growth outlook.
Increasing confidence in our bull case of $25+ EPS in CY11: The combination of new distribution (Verizon iPhone, Apple stores in China), new products (lower priced iPad in April 2011), and higher product gross margins as iPad/iPhone manufacturing yields improve are key catalysts for upward earnings revisions over the next six months.
The consensus CY11 gross margin forecast of flat Y/Y is too conservative, in our view: Despite investor concerns that margins may have peaked, we believe Apple will limit major iterations to its product line in CY11 in order to flow component cost and manufacturing yield/volume benefits through to the bottom line. As a result, we see upside to both C4Q10 and CY2011 gross margin expectations.
Apple product pipeline remains robust: We expect: 1) iPhone on Verizon in early 2011, 2) new, lower priced iPad in April 2011, 3) iPhone 5 in June 2011, 4) Smart TV, redesigned iPad, LTE iPhone in 2012.
Morgan Stanley does and seeks to do business with companies covered in Morgan Stanley Research. As a result, investors should be aware that the firm may have a conflict of interest that could affect the objectivity of Morgan Stanley Research. Investors should consider Morgan Stanley Research as only a single factor in making their investment decision. For analyst certification and other important disclosures, refer to the Disclosure Section, located at the end of this report.
Morgan Stanley & Co. Incorporated Katy L. Huberty, CFA
[email protected] +1 212 761 6249
Mathew Schneider, CFA [email protected] +1 212 761 3483
M O R G A N S T A N L E Y R E S E A R C H N O R T H A M E R I C A
Stock Rating Overweight
Industry View In-Line Key Ratios and Statistics
Reuters: AAPL.O Bloomberg: AAPL US Systems and PC Hardware / United States of America
Price target $375.00Shr price, close (Dec 13, 2010) $321.67Mkt cap, curr (mm) $300,22252-Week Range $323.99-190.25 Fiscal Year ending 09/09 09/10e 09/11e 09/12e
ModelWare EPS ($) 9.08 15.15 19.89 22.55Prior ModelWare EPS ($) - - - -Consensus EPS ($)§ 6.29 15.15 19.16 22.40P/E 20.4 18.7 16.2 14.3EV/rev 3.2 3.3 2.5 2.0P/FCFfY 18.6 15.8 15.7 11.9Div yld (%) - - - -Unless otherwise noted, all metrics are based on Morgan Stanley ModelWare framework (please see explanation later in this note). § = Consensus data is provided by FactSet Estimates. e = Morgan Stanley Research estimates
Quarterly ModelWare EPS
2010e 2010e 2011e 2011eQuarter 2009 Prior Current Prior Current
Q1 2.50 - 3.67a - 5.25Q2 1.79 - 3.33a - 4.96Q3 2.01 - 3.51a - 4.49Q4 2.77 - 4.64a - 5.19e = Morgan Stanley Research estimates, a = Actual company reported data

2
M O R G A N S T A N L E Y R E S E A R C H
December 13, 2010 Apple, Inc.
Risk-Reward Snapshot: Apple (AAPL, $321.67, OW, PT $375)
Attractive Risk-Reward: Increasing Confidence in Our Bull Case
WARNINGDONOTEDIT_RRS4RL~AAPL.O~
$375.00 (+17%)$ 321.67
$250 (-22%)
$500 (+55%)
0
100
200
300
400
500
600
Nov-08 May-09 Nov-09 May-10 Nov-10 May-11 Nov-11
$
Price Target (Nov-11) Historical Stock Performance Current Stock Price Price Target $375 Derived from our base-case scenario.
Bull Case Case $500
20x CY11 Bull Case EPS
of $25
Expanded distribution drives unit upside. Apple ships 80M iPhones and 40M iPads in CY11 on the back of broadening distribution, strong upgrade rates and price declines that stimulate demand. Gross margins remain near 39%. EPS of $25 and a 20x multiple (low-end of 5-year historical range) = $500.
Base Case $375
18.3x CY11 Base Case
EPS of $20.46 (15x ex cash)
iPhone / iPad momentum continues. iPhone shipments reach 72M units in C11. iPad shipments reach 30M units in C11 as Apple maintains ~60% tablet market share. Mac units rise 17% in C11 about 2x the market. Gross margins of 38.6%. EPS of $20.46 in C11. Multiple of 18.3x (below 5-year historical range and in-line with recent range) assumes investor concerns on slowing growth and/or margin compression continue to constrain the valuation.
Bear Case $250
13.5x CY11 Bear Case
EPS of $18.50
iPhone and iPad shipments only hit consensus expectations and gross margin remain under pressure. iPhone/iPad units of 55M/25M in C11. Gross margins remain near 37% for the year due to lower than expected iPhone and iPad profitability. EPS of $18.50 and a depressed 13.5x multiple on growth / profitability concerns.
Source: FactSet, company data, Morgan Stanley Research estimates
Investment Thesis We continue to see four key growth drivers for Apple: 1) Smartphone market growth and expanded iPhone distribution, 2) the iPad market opportunity, 3) rising enterprise adoption, and 4) the Chinese consumer.
We have rising confidence in our Bull Case EPS forecast which is 25% above consensus driven by iPad and expanded iPhone distribution in several countries including China.
Potential Catalysts iPhone exclusivity expiration announcements in the US, Japan, China
iPad shipment ramp as distribution expands in US and internationally
Potential new content revenue streams, including books, magazines, video
Investment Risks Pricing and gross margin pressure if carriers push back on high iPhone subsidies in the face of exclusivity expirations, rising smartphone competition (Android, Blackberry, WP7, etc), and network congestion.
Shipment, gross margin and earnings volatility related to the launch of new products.
Regulatory and legal risk as Apple gains profit share momentum in mobile devices

3
M O R G A N S T A N L E Y R E S E A R C H
December 13, 2010 Apple, Inc.
Investment Case 1) Smartphone market growth and expanded distribution iPhone now represents over 40% of Apple’s revenue and approximately 60% of operating profit. We expect strong iPhone growth over the next 2 years primarily driven by growth in the core smartphone market. Morgan Stanley’s Global Handset team expects smartphones to grow at a 32% CAGR over the next two years vs. ‘08-’10 CAGR of 40%. Exhibit 1 30%+ Smartphone Unit CAGR Over Next 2 Years
122 153 183
297
423
518
674
0
100
200
300
400
500
600
700
800
2007 2008 2009 2010e 2011e 2012e 2013e0%
10%
20%
30%
40%
50%
60%
70%
Shipments (millions) YoY Growth
Source: Morgan Stanley Research, Gartner
We don’t expect the same magnitude of share gains that we’ve seen over the last few years due to Android competition but we do expect Apple to gain about 125 bps of share annually over the next two years which drives our above consensus CY11 iPhone forecast of 72M (vs. Street of 55-60M). While Apple is on track to gain over 200 bps of share in 2010, Apple’s share was flat to down over the last few quarters before bouncing back in 3Q10 with the launch of iPhone 4. We expect expanded distribution (Verizon, etc.) to drive share gains in 2011. According to our March ’10 Alphawise survey, approximately 17% of Verizon subscribers at the time were extremely interested in purchasing an iPhone when available in the Verizon network. This equates to over 15M potential subscribers and we expect this to be realized over a two year period. We expect 8M Verizon iPhone shipments in 2011 to be a catalyst for share gains.
Exhibit 2 Verizon iPhone Pent Up Demand
iPhone Extreme Interest
16.8%
7.5%
0% 5% 10% 15% 20%
Verizon
Total ExtremeInterest
Source: Morgan Stanley Research
Exhibit 3 Share Gains Ahead, but Smaller in Magnitude
414
25
47
72
95
18.3%17.0%15.9%
13.7%
9.0%
3.0%
0
20
40
60
80
100
120
2007 2008 2009 2010e 2011e 2012e0%2%4%6%8%10%12%14%16%18%20%
Apple Shipments (millions) Market Share
Source: Morgan Stanley Research, Gartner
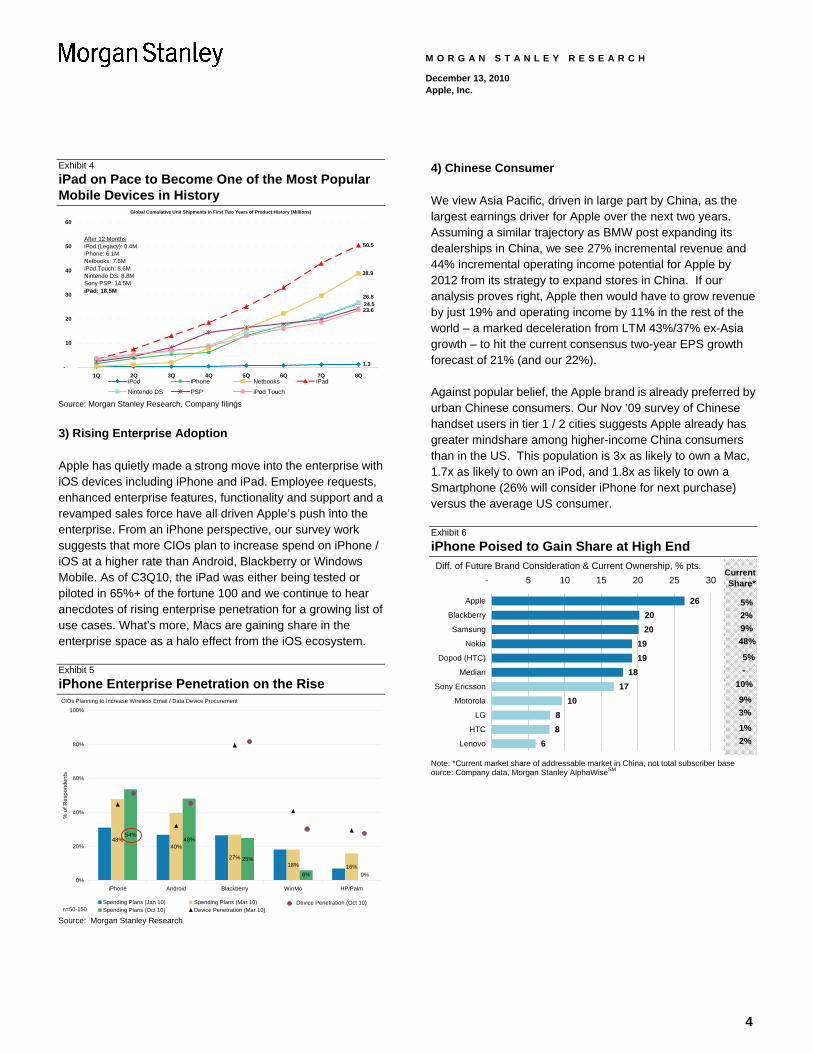
2) Tablet Market Opportunity We think the tablet market will be more than just the iPad and we expect the tablet TAM to surpass market expectations in the coming years. Apple was first to market with the iPad defining a new breed of mobile computing devices and the iPad is on track to become one of the most popular mobile devices in history (defined as cumulative shipments over the first 2 years). We believe that Apple has a sustainable competitive advantage and source of differentiation vs. other vendors due to platform vertical integration (iOS, App Store, iTunes, iBooks). We expect the avalanche of new tablet offerings in the first half of 2011 to validate the market opportunity and expand the market. We expect 30M iPad shipments in 2011 and 40M in 2012, above consensus expectations by 5M+ in both years.
4
M O R G A N S T A N L E Y R E S E A R C H
December 13, 2010 Apple, Inc.
Exhibit 4 iPad on Pace to Become One of the Most Popular Mobile Devices in History
Global Cumulative Unit Shipments in First Two Years of Product History (Millions)
1.3
38.9
50.5
26.824.523.6
-
10
20
30
40
50
60
1Q 2Q 3Q 4Q 5Q 6Q 7Q 8QiPod iPhone Netbooks iPad
Nintendo DS PSP iPod Touch
After 12 MonthsiPod (Legacy): 0.4MiPhone: 6.1MNetbooks: 7.6MiPod Touch: 8.6MNintendo DS: 8.8MSony PSP: 14.5MiPad: 18.5M
Source: Morgan Stanley Research, Company filings
3) Rising Enterprise Adoption Apple has quietly made a strong move into the enterprise with iOS devices including iPhone and iPad. Employee requests, enhanced enterprise features, functionality and support and a revamped sales force have all driven Apple’s push into the enterprise. From an iPhone perspective, our survey work suggests that more CIOs plan to increase spend on iPhone / iOS at a higher rate than Android, Blackberry or Windows Mobile. As of C3Q10, the iPad was either being tested or piloted in 65%+ of the fortune 100 and we continue to hear anecdotes of rising enterprise penetration for a growing list of use cases. What’s more, Macs are gaining share in the enterprise space as a halo effect from the iOS ecosystem. Exhibit 5 iPhone Enterprise Penetration on the Rise CIOs Planning to Increase Wireless Email / Data Device Procurement
48%40%
27%18% 16%
54%48%
25%
6% 0%0%
20%
40%
60%
80%
100%
iPhone Android Blackberry WinMo HP/Palm
% o
f Res
pond
ents
Spending Plans (Jan 10) Spending Plans (Mar 10)Spending Plans (Oct 10) Device Penetration (Mar 10)n=50-150
Device Penetration (Oct 10)
Source: Morgan Stanley Research
4) Chinese Consumer We view Asia Pacific, driven in large part by China, as the largest earnings driver for Apple over the next two years. Assuming a similar trajectory as BMW post expanding its dealerships in China, we see 27% incremental revenue and 44% incremental operating income potential for Apple by 2012 from its strategy to expand stores in China. If our analysis proves right, Apple then would have to grow revenue by just 19% and operating income by 11% in the rest of the world – a marked deceleration from LTM 43%/37% ex-Asia growth – to hit the current consensus two-year EPS growth forecast of 21% (and our 22%). Against popular belief, the Apple brand is already preferred by urban Chinese consumers. Our Nov ’09 survey of Chinese handset users in tier 1 / 2 cities suggests Apple already has greater mindshare among higher-income China consumers than in the US. This population is 3x as likely to own a Mac, 1.7x as likely to own an iPod, and 1.8x as likely to own a Smartphone (26% will consider iPhone for next purchase) versus the average US consumer. Exhibit 6 iPhone Poised to Gain Share at High End
262020
1919
1817
1088
6
- 5 10 15 20 25 30
Apple
Blackberry
Samsung
Nokia
Dopod (HTC)
Median
Sony Ericsson
Motorola
LG
HTC
Lenovo
Diff. of Future Brand Consideration & Current Ownership, % pts.
5%2%9%48%
5%
10%
9%3%
1%2%
CurrentShare*
-
Note: *Current market share of addressable market in China, not total subscriber base ource: Company data, Morgan Stanley AlphaWiseSM

5
M O R G A N S T A N L E Y R E S E A R C H
December 13, 2010 Apple, Inc.
Exhibit 7 Apple Income Statement
2010A 2011E Fiscal Year($ in millions) Dec-09 Mar-10 Jun-10 Sep-10 Dec-10 Mar-11 Jun-11 Sep-11 2009A 2010A 2011E 2012E
Revenues 15,683 13,499 15,700 20,343 23,888 21,906 21,406 23,977 42,906 65,225 91,177 103,808 Consumer Revenue 3,704 2,959 3,331 3,624 3,821 3,446 3,772 4,088 10,143 13,617 15,128 16,789 Professional Revenue 746 801 1,068 1,246 1,162 978 1,112 1,243 3,716 3,862 4,495 5,014 iPod, iPhone, iPad and Related Revenue 10,602 9,105 10,655 14,811 18,211 16,784 15,843 17,951 26,636 45,173 68,790 79,103
Other Hardware and iTunes 1,633 1,799 1,610 1,720 1,893 2,135 1,912 2,040 5,511 6,762 7,981 9,196 iPod 3,391 1,861 1,545 1,477 2,729 1,425 1,308 1,275 8,092 8,274 6,738 6,067 iPhone 5,578 5,445 5,334 8,822 9,959 9,957 8,748 9,836 13,033 25,179 38,499 43,660 iPad 2,166 2,792 3,630 3,267 3,875 4,800 4,958 15,572 20,180
Software, Service & Other Revenue 631 634 646 662 694 697 678 695 2,411 2,573 2,765 2,903
Cost of Sales 9,269 7,878 9,563 12,831 15,049 13,361 13,236 14,679 25,684 39,541 56,325 63,614
Gross Profit 6,414 5,622 6,136 7,512 8,839 8,545 8,170 9,299 17,223 25,684 34,853 40,194 Gross Margin 40.9% 41.6% 39.1% 36.9% 37.0% 39.0% 38.2% 38.8% 40.1% 39.4% 38.2% 38.7%
Operating Expenses 1,686 1,646 1,902 2,065 2,341 2,377 2,569 2,805 5,482 7,299 10,092 11,937 Research and Development 398 426 464 494 526 581 642 671 1,333 1,782 2,420 3,330 Selling, General and Administrative 1,288 1,220 1,438 1,571 1,816 1,796 1,927 2,134 4,149 5,517 7,672 8,607
Operating Income 4,728 3,976 4,234 5,447 6,498 6,168 5,602 6,493 11,741 18,385 24,761 28,258 PTOP Margin 30.1% 29.5% 27.0% 26.8% 27.2% 28.2% 26.2% 27.1% 27.4% 28.2% 27.2% 27.2%
Total Interest & Other Income 33 50 58 14 64 57 60 64 326 155 245 448
Pretax Income 4,761 4,026 4,292 5,461 6,562 6,226 5,661 6,557 12,067 18,540 25,006 28,705 GAAP Income Tax Provision 1,380 955 1,039 1,153 1,673 1,588 1,444 1,672 3,831 4,527 6,377 7,320 Operating Tax Provision (excl one time tax eff 1,381 954 1,039 1,153 1,673 1,588 1,444 1,672 3,831 4,527 6,377 7,320
Effective Tax Rate 29.0% 23.7% 24.2% 21.1% 25.5% 25.5% 25.5% 25.5% 31.8% 24.4% 25.5% 25.5%
Operating Net Income 3,380 3,071 3,253 4,308 4,888 4,638 4,218 4,885 8,235 14,013 18,629 21,385 Operating Net Income Margin 21.6% 22.8% 20.7% 21.2% 20.5% 21.2% 19.7% 20.4% 19.2% 21.5% 20.4% 20.6%
Total Non-recurring Charges - - - - - - - - - - - -
GAAP Net Income 3,380 3,071 3,253 4,308 4,888 4,638 4,218 4,885 8,235 14,013 18,629 21,385
Fully-diluted EPSEPS - ModelWare $3.67 $3.33 $3.51 $4.64 $5.25 $4.96 $4.49 $5.19 $9.08 $15.15 $19.89 $22.55EPS - Reported $3.67 $3.33 $3.51 $4.64 $5.25 $4.96 $4.49 $5.19 $9.08 $15.15 $19.89 $22.55EPS - ModelWare excl. Stock Option Expe $3.90 $3.58 $3.74 $4.88 $5.51 $5.19 $4.72 $5.45 $9.59 $16.10 $20.87 $23.64
Period Ending Outstanding Shares 906.8 909.6 913.6 919.0 926.5 930.6 934.4 937.9 900.7 919.0 937.9 950.7 Avg Shares (Basic) 903.5 907.5 912.2 914.6 922.7 928.6 932.5 936.2 893.0 909.5 930.0 944.5 Avg Shares (Fully Diluted) 919.8 922.9 927.4 928.8 930.8 935.5 938.4 941.2 907.0 924.7 936.5 948.4
Source: Morgan Stanley Research, Company Filings

6
M O R G A N S T A N L E Y R E S E A R C H
December 13, 2010 Apple, Inc.
Exhibit 8 Apple Income Statement Analysis
2010A 2011E Fiscal Year($ in millions) Dec-09 Mar-10 Jun-10 Sep-10 Dec-10 Mar-11 Jun-11 Sep-11 2009A 2010A 2011E 2012E
Margin AnalysisGross Margin 40.9% 41.6% 39.1% 36.9% 37.0% 39.0% 38.2% 38.8% 40.1% 39.4% 38.2% 38.7%
Consumer Revenue 28.0% 27.0% 27.2% 27.2% 27.2% 27.0% 27.0% 27.0% 29.0% 27.4% 27.1% 28.0%Professional Revenue 27.8% 26.0% 26.0% 26.0% 26.0% 27.0% 27.0% 27.0% 28.9% 26.3% 26.7% 28.6%iPod, iPhone, and Related Revenue 45.8% 47.2% 43.5% 39.6% 39.3% 41.8% 41.2% 41.9% 45.0% 43.5% 41.0% 41.3%Software, Service & Other Revenue 50.0% 50.0% 50.0% 50.0% 50.0% 48.0% 48.0% 48.0% 50.0% 50.0% 48.5% 48.0%
R&D 2.5% 3.2% 3.0% 2.4% 2.2% 2.7% 3.0% 2.8% 3.1% 2.7% 2.7% 3.2%SG&A 8.2% 9.0% 9.2% 7.7% 7.6% 8.2% 9.0% 8.9% 9.7% 8.5% 8.4% 8.3%Operating Expenses 10.8% 12.2% 12.1% 10.2% 9.8% 10.9% 12.0% 11.7% 12.8% 11.2% 11.1% 11.5%EBITDA Margin 31.5% 31.1% 28.7% 28.4% 28.8% 30.0% 28.2% 29.1% 29.1% 29.8% 29.0% 29.4%PTOP Margin 30.1% 29.5% 27.0% 26.8% 27.2% 28.2% 26.2% 27.1% 27.4% 28.2% 27.2% 27.2%Pretax Margin 30.4% 29.8% 27.3% 26.8% 27.5% 28.4% 26.4% 27.3% 28.1% 28.4% 27.4% 27.7%Net Income 21.6% 22.8% 20.7% 21.2% 20.5% 21.2% 19.7% 20.4% 19.2% 21.5% 20.4% 20.6%
Year-Over-Year Growth (%)Revenue 32% 49% 61% 67% 52% 62% 36% 18% 14% 52% 40% 14%
Consumer Revenue 40% 33% 42% 24% 3% 16% 13% 13% 5% 34% 11% 11%Professional Revenue -19% 8% 7% 19% 56% 22% 4% 0% -20% 4% 16% 12%iPod, iPhone, and Related Revenue 38% 66% 82% 95% 72% 84% 49% 21% 27% 70% 52% 15%Software, Service & Other Revenue 4% 1% 22% 2% 10% 10% 5% 5% 9% 7% 7% 5%
Gross Margin 42% 55% 54% 47% 38% 52% 33% 24% 30% 49% 36% 15%Consumer Revenue 40% 20% 28% 18% 0% 16% 12% 12% 1% 27% 10% 15%Professional Revenue -20% -6% -8% 11% 46% 27% 8% 4% -23% -5% 18% 19%iPod, iPhone, and Related Revenue 51% 77% 71% 61% 47% 63% 41% 28% 56% 64% 44% 16%Software, Service & Other Revenue 4% 1% 22% 2% 10% 6% 1% 1% 0% 7% 4% 4%
R&D 26% 34% 36% 38% 32% 36% 38% 36% 20% 34% 36% 38%SG&A 18% 24% 42% 48% 41% 47% 34% 36% 10% 33% 39% 12%Operating Expenses 20% 26% 41% 45% 39% 44% 35% 36% 13% 33% 38% 18%PTOP Margin 52% 71% 61% 48% 37% 55% 32% 19% 41% 57% 35% 14%Pretax Margin 46% 69% 59% 46% 38% 55% 32% 20% 35% 54% 35% 15%Net Income 50% 90% 78% 70% 45% 51% 30% 13% 35% 70% 33% 15%ModelWare EPS 47% 85% 74% 67% 43% 49% 28% 12% 34% 67% 31% 13%
Sequential Growth (%)Revenue 28% -14% 16% 30% 17% -8% -2% 12%
Consumer Revenue 26% -20% 13% 9% 5% -10% 9% 8%Professional Revenue -29% 7% 33% 17% -7% -16% 14% 12%iPod, iPhone, and Related Revenue 40% -14% 17% 39% 23% -8% -6% 13%Software, Service & Other Revenue -3% 0% 2% 2% 5% 0% -3% 2%
Gross Margin 26% -12% 9% 22% 18% -3% -4% 14%Consumer Revenue 25% -23% 13% 9% 5% -10% 9% 8%Professional Revenue -29% 0% 33% 17% -7% -13% 14% 12%iPod, iPhone, and Related Revenue 33% -11% 8% 27% 22% -2% -7% 15%Software, Service & Other Revenue -3% 0% 2% 2% 5% -4% -3% 2%
R&D 11% 7% 9% 6% 6% 10% 11% 5%SG&A 21% -5% 18% 9% 16% -1% 7% 11%Operating Expenses 19% -2% 16% 9% 13% 2% 8% 9%PTOP Margin 28% -16% 7% 29% 19% -5% -9% 16%Pretax Margin 28% -15% 7% 27% 20% -5% -9% 16%Net Income 33% -9% 6% 32% 13% -5% -9% 16%ModelWare EPS 33% -9% 5% 32% 13% -6% -9% 15%
Revenue MixConsumer Revenue 24% 22% 21% 18% 16% 16% 18% 17% 24% 21% 17% 16%Professional Revenue 5% 6% 7% 6% 5% 4% 5% 5% 9% 6% 5% 5%iPod, iPhone, and Related Revenue 68% 67% 68% 73% 76% 77% 74% 75% 62% 69% 75% 76%Software, Service & Other Revenue 4% 5% 4% 3% 3% 3% 3% 3% 6% 4% 3% 3%
Source: Morgan Stanley Research, Company Filings

7
M O R G A N S T A N L E Y R E S E A R C H
December 13, 2010 Apple, Inc.
Exhibit 9 Apple Balance Sheet ($ in millions) 2010A 2011E Fiscal Year
Dec-09 Mar-10 Jun-10 Sep-10 Dec-10 Mar-11 Jun-11 Sep-11 2009A 2010A 2011E 2012E
AssetsCurrent Assets:
Cash and cash equivalents 7,609 10,018 9,705 11,261 17,537 20,025 24,535 30,926 5,263 11,261 30,926 56,738 Short-term investments 32,211 31,686 36,134 39,750 39,750 39,750 39,750 39,750 28,729 39,750 39,750 39,750 Accounts receivable 3,090 2,886 3,447 5,510 6,614 5,998 5,798 6,494 3,361 5,510 6,494 7,578 Inventories 576 638 942 1,051 1,260 1,106 1,084 1,202 455 1,051 1,202 1,405 Deferred tax assets 1,180 1,142 1,216 1,636 1,636 1,636 1,636 1,636 1,135 1,636 1,636 1,636 Other current assets 3,690 4,515 6,140 7,861 7,861 7,861 7,861 7,861 3,140 7,861 7,861 7,861
Total Current Assets 48,356 50,885 57,584 67,069 74,658 76,377 80,664 87,870 42,083 67,069 87,870 114,967 Property, Plant & Equipment, ne 3,115 3,504 3,990 4,768 5,145 5,487 5,780 6,098 2,954 4,768 6,098 7,221 Acquired Intangible Assets 494 743 1,032 1,083 1,066 1,050 1,034 1,020 453 1,083 1,020 968 Other assets 1,961 1,925 2,119 2,263 2,263 2,263 2,263 2,263 2,011 2,263 2,263 2,263 Non-current debt and equity inve - - - - - - - - - - - - Total Fixed Assets 5,570 6,172 7,141 8,114 8,474 8,800 9,077 9,381 5,418 8,114 9,381 10,452
Total Assets 53,926 57,057 64,725 75,183 83,132 85,177 89,741 97,251 47,501 75,183 97,251 125,419 Liabilities
Current Liabilities:Accounts payable 6,511 5,666 8,469 12,015 14,405 12,648 12,393 13,745 5,601 12,015 13,745 16,065 Accrued expenses 6,586 6,563 7,143 8,707 8,975 7,779 8,048 8,980 5,905 8,707 8,980 12,219 Current Debt - - - - - - - - - - - - Other current liabilities - - - - - - - - - - - -
Total Current Liabilities 13,097 12,229 15,612 20,722 23,380 20,428 20,441 22,725 11,506 20,722 22,725 28,284 Non-Current Liabilities
Long-term debt - - - - - - - - - - - - Deferred revenue - non-curren 922 941 1,021 1,139 1,139 1,139 1,139 1,139 853 1,139 1,139 1,139 Deferred tax liabilities 3,289 3,689 4,131 4,681 4,681 4,681 4,681 4,681 2,652 4,681 4,681 4,681 Other non-current liabilities 850 850 850 850 850 850 850 850 850 850 850 850
Total Non-Current Liabilities 5,061 5,480 6,002 6,670 6,670 6,670 6,670 6,670 4,355 6,670 6,670 6,670
Total Liabilities 18,158 17,709 21,614 27,392 30,050 27,098 27,111 29,395 15,861 27,392 29,395 34,954 Series A preferred stock - - - -
Total Shareholder's Equity 35,768 39,348 43,111 47,791 53,082 58,079 62,630 67,856 31,640 47,791 67,856 90,465
Total Liabilities and Shareholder 53,926 57,057 64,725 75,183 83,132 85,177 89,741 97,251 47,501 75,183 97,251 125,419 Source: Morgan Stanley Research, Company Filings
8
M O R G A N S T A N L E Y R E S E A R C H
December 13, 2010 Apple, Inc.
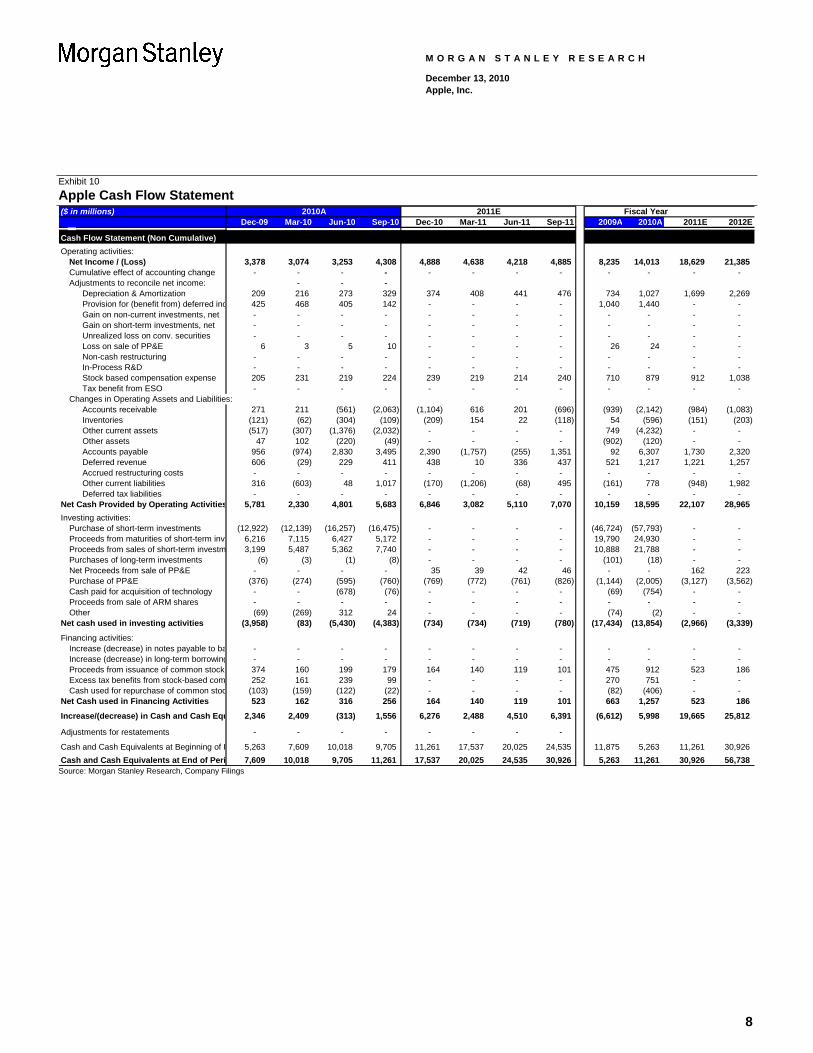
Exhibit 10 Apple Cash Flow Statement ($ in millions) 2010A 2011E Fiscal Year
Dec-09 Mar-10 Jun-10 Sep-10 Dec-10 Mar-11 Jun-11 Sep-11 2009A 2010A 2011E 2012E
Cash Flow Statement (Non Cumulative)Operating activities:
Net Income / (Loss) 3,378 3,074 3,253 4,308 4,888 4,638 4,218 4,885 8,235 14,013 18,629 21,385 Cumulative effect of accounting change - - - - - - - - - - - - Adjustments to reconcile net income: - - -
Depreciation & Amortization 209 216 273 329 374 408 441 476 734 1,027 1,699 2,269 Provision for (benefit from) deferred inc 425 468 405 142 - - - - 1,040 1,440 - - Gain on non-current investments, net - - - - - - - - - - - - Gain on short-term investments, net - - - - - - - - - - - - Unrealized loss on conv. securities - - - - - - - - - - - - Loss on sale of PP&E 6 3 5 10 - - - - 26 24 - - Non-cash restructuring - - - - - - - - - - - - In-Process R&D - - - - - - - - - - - - Stock based compensation expense 205 231 219 224 239 219 214 240 710 879 912 1,038 Tax benefit from ESO - - - - - - - - - - - -
Changes in Operating Assets and Liabilities: Accounts receivable 271 211 (561) (2,063) (1,104) 616 201 (696) (939) (2,142) (984) (1,083) Inventories (121) (62) (304) (109) (209) 154 22 (118) 54 (596) (151) (203) Other current assets (517) (307) (1,376) (2,032) - - - - 749 (4,232) - - Other assets 47 102 (220) (49) - - - - (902) (120) - -
Accounts payable 956 (974) 2,830 3,495 2,390 (1,757) (255) 1,351 92 6,307 1,730 2,320 Deferred revenue 606 (29) 229 411 438 10 336 437 521 1,217 1,221 1,257 Accrued restructuring costs - - - - - - - - - - - - Other current liabilities 316 (603) 48 1,017 (170) (1,206) (68) 495 (161) 778 (948) 1,982 Deferred tax liabilities - - - - - - - - - - - -
Net Cash Provided by Operating Activities 5,781 2,330 4,801 5,683 6,846 3,082 5,110 7,070 10,159 18,595 22,107 28,965 Investing activities:
Purchase of short-term investments (12,922) (12,139) (16,257) (16,475) - - - - (46,724) (57,793) - - Proceeds from maturities of short-term inve 6,216 7,115 6,427 5,172 - - - - 19,790 24,930 - - Proceeds from sales of short-term investm 3,199 5,487 5,362 7,740 - - - - 10,888 21,788 - - Purchases of long-term investments (6) (3) (1) (8) - - - - (101) (18) - - Net Proceeds from sale of PP&E - - - - 35 39 42 46 - - 162 223 Purchase of PP&E (376) (274) (595) (760) (769) (772) (761) (826) (1,144) (2,005) (3,127) (3,562) Cash paid for acquisition of technology - - (678) (76) - - - - (69) (754) - - Proceeds from sale of ARM shares - - - - - - - - - - - - Other (69) (269) 312 24 - - - - (74) (2) - -
Net cash used in investing activities (3,958) (83) (5,430) (4,383) (734) (734) (719) (780) (17,434) (13,854) (2,966) (3,339)
Financing activities:Increase (decrease) in notes payable to ba - - - - - - - - - - - - Increase (decrease) in long-term borrowing - - - - - - - - - - - - Proceeds from issuance of common stock 374 160 199 179 164 140 119 101 475 912 523 186 Excess tax benefits from stock-based com 252 161 239 99 - - - - 270 751 - - Cash used for repurchase of common stoc (103) (159) (122) (22) - - - - (82) (406) - -
Net Cash used in Financing Activities 523 162 316 256 164 140 119 101 663 1,257 523 186
Increase/(decrease) in Cash and Cash Equ 2,346 2,409 (313) 1,556 6,276 2,488 4,510 6,391 (6,612) 5,998 19,665 25,812
Adjustments for restatements - - - - - - - -
Cash and Cash Equivalents at Beginning of P 5,263 7,609 10,018 9,705 11,261 17,537 20,025 24,535 11,875 5,263 11,261 30,926 Cash and Cash Equivalents at End of Peri 7,609 10,018 9,705 11,261 17,537 20,025 24,535 30,926 5,263 11,261 30,926 56,738
Source: Morgan Stanley Research, Company Filings

9
M O R G A N S T A N L E Y R E S E A R C H
December 13, 2010 Apple, Inc.

10
M O R G A N S T A N L E Y R E S E A R C H
December 13, 2010 Apple, Inc.

11
M O R G A N S T A N L E Y R E S E A R C H
December 13, 2010 Apple, Inc.
Morgan Stanley ModelWare is a proprietary analytic framework that helps clients uncover value, adjusting for distortions and ambiguities created by local accounting regulations. For example, ModelWare EPS adjusts for one-time events, capitalizes operating leases (where their use is significant), and converts inventory from LIFO costing to a FIFO basis. ModelWare also emphasizes the separation of operating performance of a company from its financing for a more complete view of how a company generates earnings.
Disclosure Section The information and opinions in Morgan Stanley Research were prepared by Morgan Stanley & Co. Incorporated, and/or Morgan Stanley C.T.V.M. S.A. As used in this disclosure section, "Morgan Stanley" includes Morgan Stanley & Co. Incorporated, Morgan Stanley C.T.V.M. S.A. and their affiliates as necessary. For important disclosures, stock price charts and equity rating histories regarding companies that are the subject of this report, please see the Morgan Stanley Research Disclosure Website at www.morganstanley.com/researchdisclosures, or contact your investment representative or Morgan Stanley Research at 1585 Broadway, (Attention: Research Management), New York, NY, 10036 USA. Analyst Certification The following analysts hereby certify that their views about the companies and their securities discussed in this report are accurately expressed and that they have not received and will not receive direct or indirect compensation in exchange for expressing specific recommendations or views in this report: Katy Huberty. Unless otherwise stated, the individuals listed on the cover page of this report are research analysts. Global Research Conflict Management Policy Morgan Stanley Research has been published in accordance with our conflict management policy, which is available at www.morganstanley.com/institutional/research/conflictpolicies. Important US Regulatory Disclosures on Subject Companies The following analyst or strategist (or a household member) owns securities (or related derivatives) in a company that he or she covers or recommends in Morgan Stanley Research: Mathew Schneider - Hewlett-Packard (common or preferred stock). Morgan Stanley policy prohibits research analysts, strategists and research associates from investing in securities in their sub industry as defined by the Global Industry Classification Standard ("GICS," which was developed by and is the exclusive property of MSCI and S&P). Analysts may nevertheless own such securities to the extent acquired under a prior policy or in a merger, fund distribution or other involuntary acquisition. As of November 30, 2010, Morgan Stanley beneficially owned 1% or more of a class of common equity securities of the following companies covered in Morgan Stanley Research: Apple, Inc., Compellent Technologies, Inc., EMC Corp., Seagate Technology, Teradata, Western Digital. Within the last 12 months, Morgan Stanley managed or co-managed a public offering (or 144A offering) of securities of DELL, IBM, Seagate Technology, SMART Technologies. Within the last 12 months, Morgan Stanley has received compensation for investment banking services from Brocade Communications Systems, Compellent Technologies, Inc., DELL, EMC Corp., Hewlett-Packard, IBM, Isilon Systems, Inc., NetApp Inc, Seagate Technology, SMART Technologies. In the next 3 months, Morgan Stanley expects to receive or intends to seek compensation for investment banking services from Apple, Inc., Brocade Communications Systems, Compellent Technologies, Inc., DELL, EMC Corp., Hewlett-Packard, IBM, Isilon Systems, Inc., Lexmark International, NCR Corp., NetApp Inc, QLogic Corporation, Seagate Technology, SMART Technologies, Teradata, Western Digital. Within the last 12 months, Morgan Stanley has received compensation for products and services other than investment banking services from Apple, Inc., DELL, EMC Corp., Hewlett-Packard, IBM, Seagate Technology. Within the last 12 months, Morgan Stanley has provided or is providing investment banking services to, or has an investment banking client relationship with, the following company: Apple, Inc., Brocade Communications Systems, Compellent Technologies, Inc., DELL, EMC Corp., Hewlett-Packard, IBM, Isilon Systems, Inc., Lexmark International, NCR Corp., NetApp Inc, QLogic Corporation, Seagate Technology, SMART Technologies, Teradata, Western Digital. Within the last 12 months, Morgan Stanley has either provided or is providing non-investment banking, securities-related services to and/or in the past has entered into an agreement to provide services or has a client relationship with the following company: Apple, Inc., Brocade Communications Systems, DELL, EMC Corp., Hewlett-Packard, IBM, Lexmark International, NCR Corp., NetApp Inc, QLogic Corporation, Seagate Technology. Morgan Stanley & Co. Incorporated makes a market in the securities of Apple, Inc., Brocade Communications Systems, Compellent Technologies, Inc., DELL, EMC Corp., Hewlett-Packard, IBM, Lexmark International, NCR Corp., NetApp Inc, QLogic Corporation, Seagate Technology, SMART Technologies, Teradata, Western Digital. The equity research analysts or strategists principally responsible for the preparation of Morgan Stanley Research have received compensation based upon various factors, including quality of research, investor client feedback, stock picking, competitive factors, firm revenues and overall investment banking revenues. Morgan Stanley and its affiliates do business that relates to companies/instruments covered in Morgan Stanley Research, including market making, providing liquidity and specialized trading, risk arbitrage and other proprietary trading, fund management, commercial banking, extension of credit, investment services and investment banking. Morgan Stanley sells to and buys from customers the securities/instruments of companies covered in Morgan Stanley Research on a principal basis. Morgan Stanley may have a position in the debt of the Company or instruments discussed in this report. Certain disclosures listed above are also for compliance with applicable regulations in non-US jurisdictions. STOCK RATINGS Morgan Stanley uses a relative rating system using terms such as Overweight, Equal-weight, Not-Rated or Underweight (see definitions below). Morgan Stanley does not assign ratings of Buy, Hold or Sell to the stocks we cover. Overweight, Equal-weight, Not-Rated and Underweight are not the equivalent of buy, hold and sell. Investors should carefully read the definitions of all ratings used in Morgan Stanley Research. In addition, since Morgan Stanley Research contains more complete information concerning the analyst's views, investors should carefully read Morgan Stanley Research, in its entirety, and not infer the contents from the rating alone. In any case, ratings (or research) should not be used or relied upon as investment advice. An investor's decision to buy or sell a stock should depend on individual circumstances (such as the investor's existing holdings) and other considerations. Global Stock Ratings Distribution (as of November 30, 2010) For disclosure purposes only (in accordance with NASD and NYSE requirements), we include the category headings of Buy, Hold, and Sell alongside our ratings of Overweight, Equal-weight, Not-Rated and Underweight. Morgan Stanley does not assign ratings of Buy, Hold or Sell to the stocks we cover. Overweight, Equal-weight, Not-Rated and Underweight are not the equivalent of buy, hold, and sell but represent recommended relative

12
M O R G A N S T A N L E Y R E S E A R C H
December 13, 2010 Apple, Inc.
weightings (see definitions below). To satisfy regulatory requirements, we correspond Overweight, our most positive stock rating, with a buy recommendation; we correspond Equal-weight and Not-Rated to hold and Underweight to sell recommendations, respectively. Coverage Universe Investment Banking Clients (IBC)
Stock Rating Category Count % of Total Count
% of Total IBC
% of Rating Category
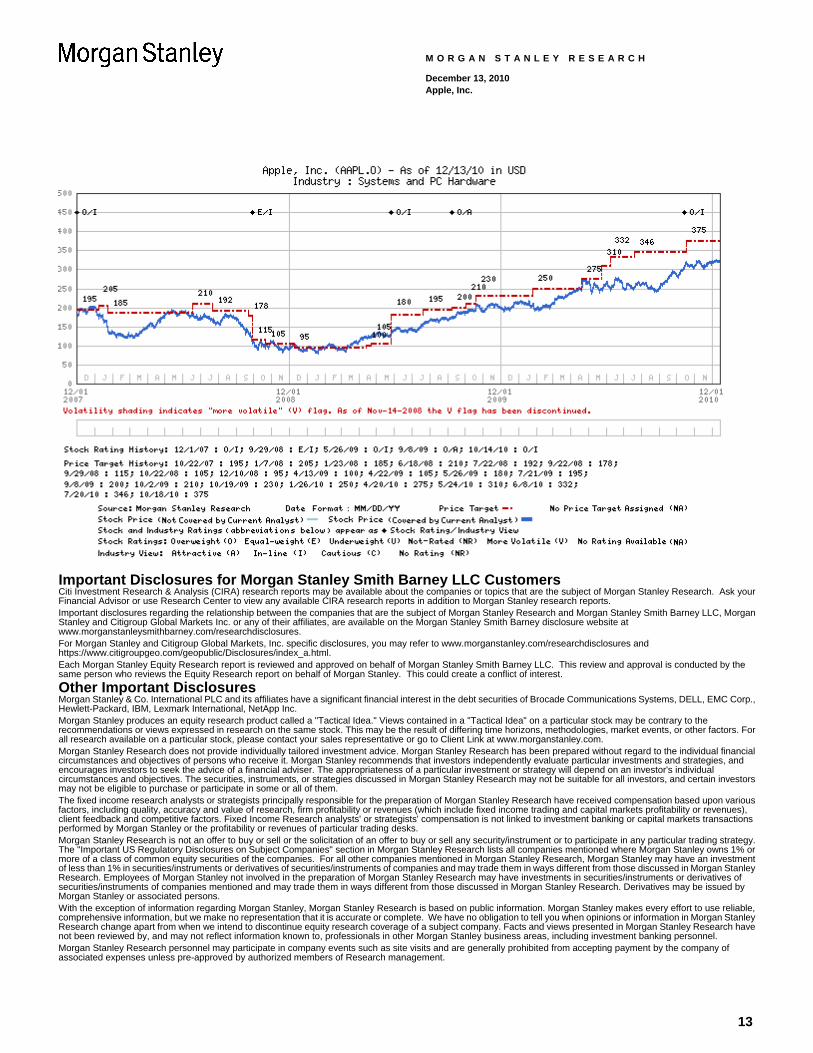
Overweight/Buy 1121 40% 417 44% 37%Equal-weight/Hold 1175 42% 410 43% 35%Not-Rated/Hold 119 4% 26 3% 22%Underweight/Sell 392 14% 105 11% 27%Total 2,807 958 Data include common stock and ADRs currently assigned ratings. An investor's decision to buy or sell a stock should depend on individual circumstances (such as the investor's existing holdings) and other considerations. Investment Banking Clients are companies from whom Morgan Stanley received investment banking compensation in the last 12 months. Analyst Stock Ratings Overweight (O). The stock's total return is expected to exceed the average total return of the analyst's industry (or industry team's) coverage universe, on a risk-adjusted basis, over the next 12-18 months. Equal-weight (E). The stock's total return is expected to be in line with the average total return of the analyst's industry (or industry team's) coverage universe, on a risk-adjusted basis, over the next 12-18 months. Not-Rated (NR). Currently the analyst does not have adequate conviction about the stock's total return relative to the average total return of the analyst's industry (or industry team's) coverage universe, on a risk-adjusted basis, over the next 12-18 months. Underweight (U). The stock's total return is expected to be below the average total return of the analyst's industry (or industry team's) coverage universe, on a risk-adjusted basis, over the next 12-18 months. Unless otherwise specified, the time frame for price targets included in Morgan Stanley Research is 12 to 18 months. Analyst Industry Views Attractive (A): The analyst expects the performance of his or her industry coverage universe over the next 12-18 months to be attractive vs. the relevant broad market benchmark, as indicated below. In-Line (I): The analyst expects the performance of his or her industry coverage universe over the next 12-18 months to be in line with the relevant broad market benchmark, as indicated below. Cautious (C): The analyst views the performance of his or her industry coverage universe over the next 12-18 months with caution vs. the relevant broad market benchmark, as indicated below. Benchmarks for each region are as follows: North America - S&P 500; Latin America - relevant MSCI country index or MSCI Latin America Index; Europe - MSCI Europe; Japan - TOPIX; Asia - relevant MSCI country index. . Stock Price, Price Target and Rating History (See Rating Definitions)
13
M O R G A N S T A N L E Y R E S E A R C H
December 13, 2010 Apple, Inc.
Important Disclosures for Morgan Stanley Smith Barney LLC Customers Citi Investment Research & Analysis (CIRA) research reports may be available about the companies or topics that are the subject of Morgan Stanley Research. Ask your Financial Advisor or use Research Center to view any available CIRA research reports in addition to Morgan Stanley research reports. Important disclosures regarding the relationship between the companies that are the subject of Morgan Stanley Research and Morgan Stanley Smith Barney LLC, Morgan Stanley and Citigroup Global Markets Inc. or any of their affiliates, are available on the Morgan Stanley Smith Barney disclosure website at www.morganstanleysmithbarney.com/researchdisclosures. For Morgan Stanley and Citigroup Global Markets, Inc. specific disclosures, you may refer to www.morganstanley.com/researchdisclosures and https://www.citigroupgeo.com/geopublic/Disclosures/index_a.html. Each Morgan Stanley Equity Research report is reviewed and approved on behalf of Morgan Stanley Smith Barney LLC. This review and approval is conducted by the same person who reviews the Equity Research report on behalf of Morgan Stanley. This could create a conflict of interest. Other Important Disclosures Morgan Stanley & Co. International PLC and its affiliates have a significant financial interest in the debt securities of Brocade Communications Systems, DELL, EMC Corp., Hewlett-Packard, IBM, Lexmark International, NetApp Inc. Morgan Stanley produces an equity research product called a "Tactical Idea." Views contained in a "Tactical Idea" on a particular stock may be contrary to the recommendations or views expressed in research on the same stock. This may be the result of differing time horizons, methodologies, market events, or other factors. For all research available on a particular stock, please contact your sales representative or go to Client Link at www.morganstanley.com. Morgan Stanley Research does not provide individually tailored investment advice. Morgan Stanley Research has been prepared without regard to the individual financial circumstances and objectives of persons who receive it. Morgan Stanley recommends that investors independently evaluate particular investments and strategies, and encourages investors to seek the advice of a financial adviser. The appropriateness of a particular investment or strategy will depend on an investor's individual circumstances and objectives. The securities, instruments, or strategies discussed in Morgan Stanley Research may not be suitable for all investors, and certain investors may not be eligible to purchase or participate in some or all of them. The fixed income research analysts or strategists principally responsible for the preparation of Morgan Stanley Research have received compensation based upon various factors, including quality, accuracy and value of research, firm profitability or revenues (which include fixed income trading and capital markets profitability or revenues), client feedback and competitive factors. Fixed Income Research analysts' or strategists' compensation is not linked to investment banking or capital markets transactions performed by Morgan Stanley or the profitability or revenues of particular trading desks. Morgan Stanley Research is not an offer to buy or sell or the solicitation of an offer to buy or sell any security/instrument or to participate in any particular trading strategy. The "Important US Regulatory Disclosures on Subject Companies" section in Morgan Stanley Research lists all companies mentioned where Morgan Stanley owns 1% or more of a class of common equity securities of the companies. For all other companies mentioned in Morgan Stanley Research, Morgan Stanley may have an investment of less than 1% in securities/instruments or derivatives of securities/instruments of companies and may trade them in ways different from those discussed in Morgan Stanley Research. Employees of Morgan Stanley not involved in the preparation of Morgan Stanley Research may have investments in securities/instruments or derivatives of securities/instruments of companies mentioned and may trade them in ways different from those discussed in Morgan Stanley Research. Derivatives may be issued by Morgan Stanley or associated persons. With the exception of information regarding Morgan Stanley, Morgan Stanley Research is based on public information. Morgan Stanley makes every effort to use reliable, comprehensive information, but we make no representation that it is accurate or complete. We have no obligation to tell you when opinions or information in Morgan Stanley Research change apart from when we intend to discontinue equity research coverage of a subject company. Facts and views presented in Morgan Stanley Research have not been reviewed by, and may not reflect information known to, professionals in other Morgan Stanley business areas, including investment banking personnel. Morgan Stanley Research personnel may participate in company events such as site visits and are generally prohibited from accepting payment by the company of associated expenses unless pre-approved by authorized members of Research management.
14
M O R G A N S T A N L E Y R E S E A R C H
December 13, 2010 Apple, Inc.
The value of and income from your investments may vary because of changes in interest rates, foreign exchange rates, default rates, prepayment rates, securities/instruments prices, market indexes, operational or financial conditions of companies or other factors. There may be time limitations on the exercise of options or other rights in securities/instruments transactions. Past performance is not necessarily a guide to future performance. Estimates of future performance are based on assumptions that may not be realized. If provided, and unless otherwise stated, the closing price on the cover page is that of the primary exchange for the subject company's securities/instruments. Morgan Stanley may make investment decisions or take proprietary positions that are inconsistent with the recommendations or views in this report. To our readers in Taiwan: Information on securities/instruments that trade in Taiwan is distributed by Morgan Stanley Taiwan Limited ("MSTL"). Such information is for your reference only. Information on any securities/instruments issued by a company owned by the government of or incorporated in the PRC and listed in on the Stock Exchange of Hong Kong ("SEHK"), namely the H-shares, including the component company stocks of the Stock Exchange of Hong Kong ("SEHK")'s Hang Seng China Enterprise Index; or any securities/instruments issued by a company that is 30% or more directly- or indirectly-owned by the government of or a company incorporated in the PRC and traded on an exchange in Hong Kong or Macau, namely SEHK's Red Chip shares, including the component company of the SEHK's China-affiliated Corp Index is distributed only to Taiwan Securities Investment Trust Enterprises ("SITE"). The reader should independently evaluate the investment risks and is solely responsible for their investment decisions. Morgan Stanley Research may not be distributed to the public media or quoted or used by the public media without the express written consent of Morgan Stanley. Information on securities/instruments that do not trade in Taiwan is for informational purposes only and is not to be construed as a recommendation or a solicitation to trade in such securities/instruments. MSTL may not execute transactions for clients in these securities/instruments. To our readers in Hong Kong: Information is distributed in Hong Kong by and on behalf of, and is attributable to, Morgan Stanley Asia Limited as part of its regulated activities in Hong Kong. If you have any queries concerning Morgan Stanley Research, please contact our Hong Kong sales representatives. Morgan Stanley Research is disseminated in Japan by Morgan Stanley MUFG Securities Co., Ltd.; in Hong Kong by Morgan Stanley Asia Limited (which accepts responsibility for its contents); in Singapore by Morgan Stanley Asia (Singapore) Pte. (Registration number 199206298Z) and/or Morgan Stanley Asia (Singapore) Securities Pte Ltd (Registration number 200008434H), regulated by the Monetary Authority of Singapore, which accepts responsibility for its contents; in Australia to "wholesale clients" within the meaning of the Australian Corporations Act by Morgan Stanley Australia Limited A.B.N. 67 003 734 576, holder of Australian financial services license No. 233742, which accepts responsibility for its contents; in Australia to "wholesale clients" and "retail clients" within the meaning of the Australian Corporations Act by Morgan Stanley Smith Barney Australia Pty Ltd (A.B.N. 19 009 145 555, holder of Australian financial services license No. 240813, which accepts responsibility for its contents; in Korea by Morgan Stanley & Co International plc, Seoul Branch; in India by Morgan Stanley India Company Private Limited; in Canada by Morgan Stanley Canada Limited, which has approved of, and has agreed to take responsibility for, the contents of Morgan Stanley Research in Canada; in Germany by Morgan Stanley Bank AG, Frankfurt am Main and Morgan Stanley Private Wealth Management Limited, Niederlassung Deutschland, regulated by Bundesanstalt fuer Finanzdienstleistungsaufsicht (BaFin); in Spain by Morgan Stanley, S.V., S.A., a Morgan Stanley group company, which is supervised by the Spanish Securities Markets Commission (CNMV) and states that Morgan Stanley Research has been written and distributed in accordance with the rules of conduct applicable to financial research as established under Spanish regulations; in the United States by Morgan Stanley & Co. Incorporated, which accepts responsibility for its contents. Morgan Stanley & Co. International plc, authorized and regulated by the Financial Services Authority, disseminates in the UK research that it has prepared, and approves solely for the purposes of section 21 of the Financial Services and Markets Act 2000, research which has been prepared by any of its affiliates. Morgan Stanley Private Wealth Management Limited, authorized and regulated by the Financial Services Authority, also disseminates Morgan Stanley Research in the UK. Private U.K. investors should obtain the advice of their Morgan Stanley & Co. International plc or Morgan Stanley Private Wealth Management representative about the investments concerned. RMB Morgan Stanley (Proprietary) Limited is a member of the JSE Limited and regulated by the Financial Services Board in South Africa. RMB Morgan Stanley (Proprietary) Limited is a joint venture owned equally by Morgan Stanley International Holdings Inc. and RMB Investment Advisory (Proprietary) Limited, which is wholly owned by FirstRand Limited. The information in Morgan Stanley Research is being communicated by Morgan Stanley & Co. International plc (DIFC Branch), regulated by the Dubai Financial Services Authority (the DFSA), and is directed at Professional Clients only, as defined by the DFSA. The financial products or financial services to which this research relates will only be made available to a customer who we are satisfied meets the regulatory criteria to be a Professional Client. The information in Morgan Stanley Research is being communicated by Morgan Stanley & Co. International plc (QFC Branch), regulated by the Qatar Financial Centre Regulatory Authority (the QFCRA), and is directed at business customers and market counterparties only and is not intended for Retail Customers as defined by the QFCRA. As required by the Capital Markets Board of Turkey, investment information, comments and recommendations stated here, are not within the scope of investment advisory activity. Investment advisory service is provided in accordance with a contract of engagement on investment advisory concluded between brokerage houses, portfolio management companies, non-deposit banks and clients. Comments and recommendations stated here rely on the individual opinions of the ones providing these comments and recommendations. These opinions may not fit to your financial status, risk and return preferences. For this reason, to make an investment decision by relying solely to this information stated here may not bring about outcomes that fit your expectations. The trademarks and service marks contained in Morgan Stanley Research are the property of their respective owners. Third-party data providers make no warranties or representations of any kind relating to the accuracy, completeness, or timeliness of the data they provide and shall not have liability for any damages of any kind relating to such data. The Global Industry Classification Standard ("GICS") was developed by and is the exclusive property of MSCI and S&P. Morgan Stanley Research, or any portion thereof may not be reprinted, sold or redistributed without the written consent of Morgan Stanley. Morgan Stanley Research is disseminated and available primarily electronically, and, in some cases, in printed form. Additional information on recommended securities/instruments is available on request.
© 2010 Morgan Stanley
M O R G A N S T A N L E Y R E S E A R C H
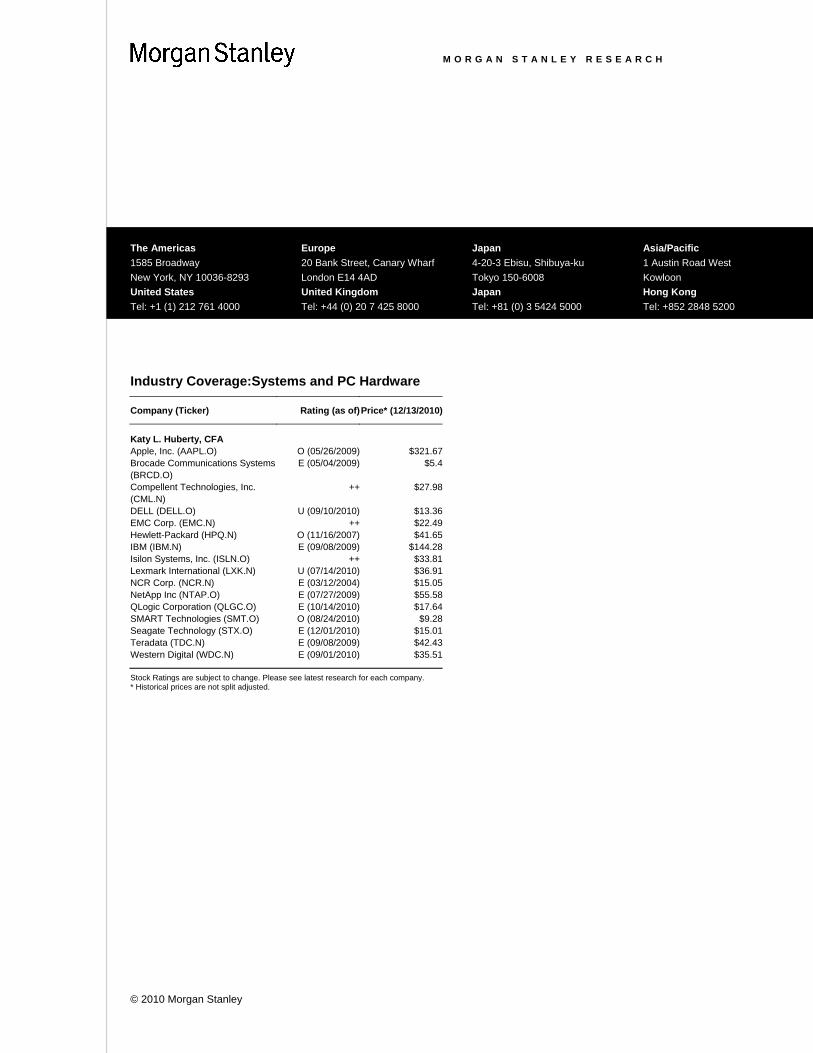
Industry Coverage:Systems and PC Hardware
Company (Ticker) Rating (as of)Price* (12/13/2010)
Katy L. Huberty, CFA Apple, Inc. (AAPL.O) O (05/26/2009) $321.67Brocade Communications Systems (BRCD.O)
E (05/04/2009) $5.4
Compellent Technologies, Inc. (CML.N)
++ $27.98
DELL (DELL.O) U (09/10/2010) $13.36EMC Corp. (EMC.N) ++ $22.49Hewlett-Packard (HPQ.N) O (11/16/2007) $41.65IBM (IBM.N) E (09/08/2009) $144.28Isilon Systems, Inc. (ISLN.O) ++ $33.81Lexmark International (LXK.N) U (07/14/2010) $36.91NCR Corp. (NCR.N) E (03/12/2004) $15.05NetApp Inc (NTAP.O) E (07/27/2009) $55.58QLogic Corporation (QLGC.O) E (10/14/2010) $17.64SMART Technologies (SMT.O) O (08/24/2010) $9.28Seagate Technology (STX.O) E (12/01/2010) $15.01Teradata (TDC.N) E (09/08/2009) $42.43Western Digital (WDC.N) E (09/01/2010) $35.51
Stock Ratings are subject to change. Please see latest research for each company. * Historical prices are not split adjusted.
The Americas 1585 Broadway New York, NY 10036-8293 United States Tel: +1 (1) 212 761 4000
Europe 20 Bank Street, Canary Wharf London E14 4AD United Kingdom Tel: +44 (0) 20 7 425 8000
Japan 4-20-3 Ebisu, Shibuya-ku Tokyo 150-6008 Japan Tel: +81 (0) 3 5424 5000
Asia/Pacific 1 Austin Road West Kowloon Hong Kong Tel: +852 2848 5200