APPENDIX H TRAFFIC IMPACTS TO ADJACENT CITY …
80
APPENDIX H TRAFFIC IMPACTS TO ADJACENT CITY JURISDICTION REPORT
Transcript of APPENDIX H TRAFFIC IMPACTS TO ADJACENT CITY …

APPENDIX H TRAFFIC IMPACTS TO
ADJACENT CITY JURISDICTION REPORT


Prepared for: PBS&J 9275 Sky Park Court Suite 200 San Diego, CA 92123-4386 Prepared by: 701 B Street Suite 1220 San Diego, CA 92101
Traffic Impacts to Adjacent City Jurisdictions
County of San Diego General Plan Update (Project Number: 08-100-601-00, Phase 4.2.7)
Final Technical Report Revised: February 23, 2009


Page i County of San Diego General Plan Update
Traffic Impacts to Adjacent City Jurisdictions
Table of Contents Section Page 1.0 Introduction......................................................................................................................................... 1 1.1 Study Background and Purpose................................................................................................... 1 1.2 Project Study Area and Scenarios ............................................................................................... 1 1.3 Report Organization .................................................................................................................... 2 2.0 Approach and Methodology .............................................................................................................. 3 2.1 Analysis Methodology................................................................................................................. 3
2.1.1 Level of Service Definitions ............................................................................................... 3 2.1.2 Roadway Segment Level of Service Standards and Thresholds......................................... 3
2.2 Impact Significance Criteria ........................................................................................................ 7 3.0 Existing Conditions............................................................................................................................. 9 3.1 Roadway Network and Volumes................................................................................................. 9 3.2 Roadway Performance................................................................................................................. 9 4.0 Future Traffic Conditions ................................................................................................................ 18 4.1 Existing County of San Diego General Plan ............................................................................. 18
4.1.1 Roadway Network and Volumes ...................................................................................... 18 4.1.2 Roadway Performance ...................................................................................................... 18
4.2 Proposed Project (General Plan Update - Referral Map) .......................................................... 26 4.2.1 Roadway Network and Volumes ...................................................................................... 26 4.2.2 Roadway Performance ...................................................................................................... 26
5.0 Identification of Significant Impacts............................................................................................... 35 5.1 Comparison of Existing County of San Diego General Plan to Existing Conditions................ 35 5.2 Comparison of Proposed County of San Diego General Plan to Existing Conditions .............. 45 5.3 Comparison of Proposed County of San Diego General Plan to Existing General Plan........... 55 5.4 Mitigation of Significant Impacts.............................................................................................. 66 6.0 Summary of Findings ....................................................................................................................... 67 6.1 Roadway Segment Performance................................................................................................ 67 6.2 Significant Traffic Impacts ........................................................................................................ 67
Page ii County of San Diego General Plan Update
Traffic Impacts to Adjacent City Jurisdictions
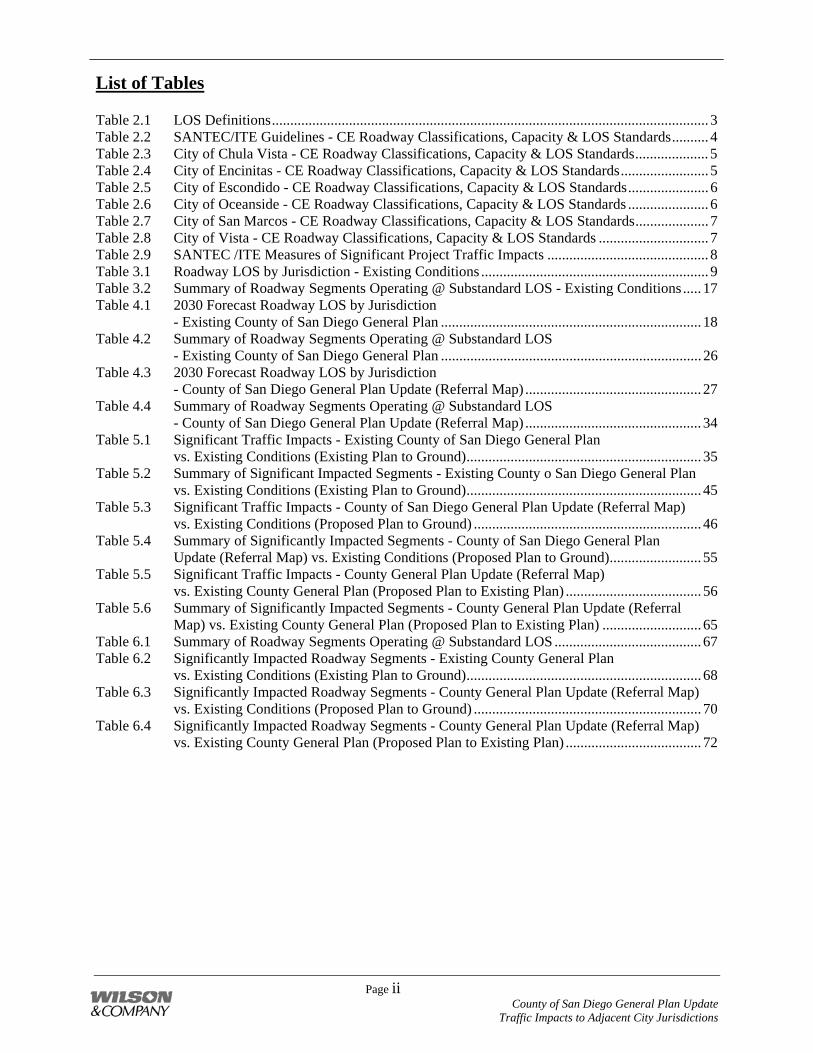
List of Tables Table 2.1 LOS Definitions....................................................................................................................... 3 Table 2.2 SANTEC/ITE Guidelines - CE Roadway Classifications, Capacity & LOS Standards.......... 4 Table 2.3 City of Chula Vista - CE Roadway Classifications, Capacity & LOS Standards.................... 5 Table 2.4 City of Encinitas - CE Roadway Classifications, Capacity & LOS Standards........................ 5 Table 2.5 City of Escondido - CE Roadway Classifications, Capacity & LOS Standards...................... 6 Table 2.6 City of Oceanside - CE Roadway Classifications, Capacity & LOS Standards ...................... 6 Table 2.7 City of San Marcos - CE Roadway Classifications, Capacity & LOS Standards.................... 7 Table 2.8 City of Vista - CE Roadway Classifications, Capacity & LOS Standards .............................. 7 Table 2.9 SANTEC /ITE Measures of Significant Project Traffic Impacts ............................................ 8 Table 3.1 Roadway LOS by Jurisdiction - Existing Conditions .............................................................. 9 Table 3.2 Summary of Roadway Segments Operating @ Substandard LOS - Existing Conditions ..... 17 Table 4.1 2030 Forecast Roadway LOS by Jurisdiction - Existing County of San Diego General Plan ....................................................................... 18 Table 4.2 Summary of Roadway Segments Operating @ Substandard LOS - Existing County of San Diego General Plan ....................................................................... 26 Table 4.3 2030 Forecast Roadway LOS by Jurisdiction - County of San Diego General Plan Update (Referral Map) ................................................ 27 Table 4.4 Summary of Roadway Segments Operating @ Substandard LOS - County of San Diego General Plan Update (Referral Map) ................................................ 34 Table 5.1 Significant Traffic Impacts - Existing County of San Diego General Plan vs. Existing Conditions (Existing Plan to Ground)................................................................ 35 Table 5.2 Summary of Significant Impacted Segments - Existing County o San Diego General Plan vs. Existing Conditions (Existing Plan to Ground)................................................................ 45 Table 5.3 Significant Traffic Impacts - County of San Diego General Plan Update (Referral Map) vs. Existing Conditions (Proposed Plan to Ground) .............................................................. 46 Table 5.4 Summary of Significantly Impacted Segments - County of San Diego General Plan Update (Referral Map) vs. Existing Conditions (Proposed Plan to Ground)......................... 55 Table 5.5 Significant Traffic Impacts - County General Plan Update (Referral Map) vs. Existing County General Plan (Proposed Plan to Existing Plan) ..................................... 56 Table 5.6 Summary of Significantly Impacted Segments - County General Plan Update (Referral Map) vs. Existing County General Plan (Proposed Plan to Existing Plan) ........................... 65 Table 6.1 Summary of Roadway Segments Operating @ Substandard LOS ........................................ 67 Table 6.2 Significantly Impacted Roadway Segments - Existing County General Plan vs. Existing Conditions (Existing Plan to Ground)................................................................ 68 Table 6.3 Significantly Impacted Roadway Segments - County General Plan Update (Referral Map) vs. Existing Conditions (Proposed Plan to Ground) .............................................................. 70 Table 6.4 Significantly Impacted Roadway Segments - County General Plan Update (Referral Map) vs. Existing County General Plan (Proposed Plan to Existing Plan) ..................................... 72

Page 1 County of San Diego General Plan Update
Traffic Impacts to Adjacent City Jurisdictions
1.0 Introduction
1.1 Study Background and Purpose
The purpose of this technical report is to document significant traffic impacts on regional arterials located in adjacent incorporated city jurisdictions, as a result of the County of San Diego General Plan Update. The County of San Diego General Plan Update is a multi-year project which began in August 1998 (referred to as General Plan 2020). The current General Plan for the unincorporated County has not been comprehensively updated since 1979 and has been the subject of substantial modifications over the years. During this period, considerable growth and change has taken place, leading to the incorporation of a number of cities and to annexation of lands on the periphery of the unincorporated area. County staff has met with community groups and residents numerous times in preparation of the land use and roadway network alternatives which have been the focus of evaluation under the County of San Diego General Plan Update. 1.2 Project Study Area and Scenarios
In response to the County of San Diego Notice of Preparation (NOP) for the Draft EIR of the County of San Diego General Plan Update and the letter (dated July 25, 2008) requesting input from each city jurisdiction, the following incorporated jurisdictions identified roadway segments of concern for possible traffic impacts related to the County of San Diego General Plan Update:
• Carlsbad • Chula Vista • El Cajon • Encinitas • Escondido • La Mesa
• Lemon Grove • Poway • San Marcos • Santee • Solana Beach • Vista
In addition to the roadway segments identified by the above jurisdictions, a number of additional regional arterial facilities, located in the incorporated jurisdictions of Del Mar, National City, Oceanside, and San Diego, were selected for analysis in this study to ensure a comprehensive county-wide assessment. The list of regional arterials was compiled from the 2007 Regional Transportation Plan (RTP), and then refined based upon location and connectivity to the roadway network within the unincorporated County. Forecast traffic and resulting Level of Service (LOS) on the identified key roadway segments were analyzed and compared under each of the following three (3) alternative conditions:
• Existing Conditions - Base Year 2007 – This alternative includes existing traffic volumes on
the respective roadway segments in the various jurisdictions as currently constructed.

Page 2 County of San Diego General Plan Update
Traffic Impacts to Adjacent City Jurisdictions
• County of San Diego General Plan Update (Referral Map - Proposed Project) - The Referral Map was endorsed as the proposed project by the Board of Supervisors during the land use mapping phase of the County of San Diego General Plan Update process. This scenario includes land uses and roadway network consistent with the Referral Map from the County of San Diego General Plan Update.
• County of San Diego Existing General Plan (No Project) - This scenario includes land uses
and roadway network consistent with the buildout of the current County of San Diego General Plan.
1.3 Report Organization
Following this Introduction chapter, this report is organized into the following sections: 2.0 Approach and Methodology - This chapter describes the methodologies and standards
utilized to analyze roadway traffic conditions in the various jurisdictions. 3.0 Existing Conditions – This chapter provides results of the analysis of existing traffic
conditions for the identified key roadway segments in the incorporated jurisdictions. 4.0 Future Traffic Conditions - This chapter describes future year buildout traffic conditions
on the identified key roadway segments under both the County of San Diego Existing General Plan and the County of San Diego General Plan Update (Proposed Project).
5.0 Comparison Assessments – This chapter provides a comparison of traffic operations
under the three analysis scenarios and identifies significant impacts on the key roadway segments within the adjacent incorporated jurisdictions that may be affected by the proposed County of San Diego General Plan Update.
6.0 Summary of Findings - This chapter summarizes the identified traffic impacts on
roadway segments within the adjacent incorporated jurisdictions associated with the County of San Diego General Plan Update.

Page 3 County of San Diego General Plan Update
Traffic Impacts to Adjacent City Jurisdictions
2.0 Approach and Methodology
2.1 Analysis Methodology
Detailed information on the roadway segment analysis methodologies, standards, and thresholds are discussed in the following section. 2.1.1 Level of Service Definitions
The concept of LOS is defined as a qualitative measure describing operational conditions within a traffic stream, and the motorist’s and/or passengers’ perception of operations. A LOS definition generally describes these conditions in terms of such factors as speed, travel time, freedom to maneuver, comfort, convenience, and safety. Table 2.1 describes generalized definitions of LOS in transportation systems.
TABLE 2.1 LEVEL OF SERVICE DEFINITIONS
LOS Category Definition of Operation
A This LOS represents a completely free-flow condition, where the operation of vehicles is virtually unaffected by the presence of other vehicles and only constrained by the geometric features of the highway and by driver preferences.
B This LOS represents a relatively free-flow condition, although the presence of other vehicles becomes noticeable. Average travel speeds are the same as in LOS A, but drivers have slightly less freedom to maneuver.
C At this LOS the influence of traffic density on operations becomes marked. The ability to maneuver within the traffic stream is clearly affected by other vehicles.
D At this LOS, the ability to maneuver is notably restricted due to traffic congestion, and only minor disruptions can be absorbed without extensive queues forming and the service deteriorating.
E This LOS represents operations at or near capacity. LOS E is an unstable level, with vehicles operating with minimum spacing for maintaining uniform flow. At LOS E, disruptions can not be dissipated readily thus causing deterioration down to LOS F.
F At this LOS, forced or breakdown of traffic flow occurs, although operations appear to be at capacity, queues form behind these breakdowns. Operations within queues are highly unstable, with vehicles experiencing brief periods of movement followed by stoppages.
Source: Highway Capacity Manual 2000 2.1.2 Roadway Segment Level of Service Standards and Thresholds
Roadway segment LOS standards and thresholds provide the basis for analysis of arterial roadway segment performance. The analysis of roadway segment LOS was based on the functional classification of the roadway, the maximum capacity, roadway geometrics, and existing or forecast Average Daily Traffic (ADT) volumes. Methodologies for ascertaining roadway LOS vary amongst the jurisdictions. The cities of Carlsbad, Del Mar, El Cajon, La Mesa, Lemon Grove, National City, Poway, San Diego, Santee, and Solana Beach utilize the roadway segment LOS standards and thresholds from the

Page 4 County of San Diego General Plan Update
Traffic Impacts to Adjacent City Jurisdictions
SANTEC/ITE guidelines, as displayed in Table 2.2, for classification of Circulation Element roadways and determination of roadway LOS.
TABLE 2.2 SANTEC/ITE GUIDELINES
CIRCULATION ELEMENT ROADWAY CLASSIFICATIONS CAPACITY AND LEVEL OF SERVICE STANDARDS
LOS (in ADT) Roadway Functional Classification
A B C D E
Expressway (6-lane) < 30,000 < 42,000 < 60,000 < 70,000 < 80,000
Prime Arterial (6-lane) < 25,000 < 35,000 < 50,000 < 55,000 < 60,000
Major Arterial (6-lane, divided) < 20,000 < 28,000 < 40,000 < 45,000 < 50,000
Major Arterial (4-lane, divided) < 15,000 < 21,000 < 30,000 < 35,000 < 40,000
Secondary Arterial / Collector (4-lane w/ center lane) < 10,000 < 14,000 < 20,000 < 25,000 < 30,000
Collector (4-lane w/o center lane)
Collector (2-lane w/ continuous left-turn lane)
< 5,000 < 7,000 < 10,000 < 13,000 < 15,000
Collector (2-lane no fronting property) < 4,000 < 5,500 < 7,500 < 9,000 < 10,000
Collector (2-lane w/ commercial fronting)
Collector (2-lane multi-family) < 2,500 < 3,500 < 5,000 < 6,500 < 8,000
Sub-Collector (2-lane single-family) - - < 2,200 - - Source: SANTEC/ITE Guidelines for Traffic Impact Studies (TIS)
Note: Bold numbers indicate the ADT thresholds for acceptable LOS. Tables 2.3 through 2.8 display the roadway segment LOS standards and thresholds for the remaining jurisdictions including Chula Vista, Encinitas, Escondido, Oceanside, San Marcos, and Vista, as defined by each of the respective cities.

Page 5 County of San Diego General Plan Update
Traffic Impacts to Adjacent City Jurisdictions
TABLE 2.3
CITY OF CHULA VISTA CIRCULATION ELEMENT ROADWAY CLASSIFICATIONS
CAPACITY AND LEVEL OF SERVICE STANDARDS
LOS (in ADT) Roadway Functional Classification A B C D E
Expressway (7 or 8-lane) < 52,500 < 61,300 < 70,000 < 78,800 < 87,500
Prime Arterial (6-lane) < 37,500 < 43,800 < 50,000 < 56,300 < 62,500
Major Street (6-lane) < 30,000 < 35,000 < 40,000 < 45,000 < 50,000
Major Street (4-lane) < 22,500 < 26,300 < 30,000 < 33,800 < 37,500
Town Center Arterial < 37,500 < 43,800 < 50,000 < 56,300 < 62,500
Class I Collector (4-lane) < 16,500 < 19,300 < 22,000 < 24,800 < 27,500
Class II Collector (3-lane) < 9,000 < 10,500 < 12,000 < 13,500 < 15,000
Class III Collector (2-lane) < 5,600 < 6,600 < 7,500 < 8,400 < 9,400 Source: City of Chula Vista
Note: Bold numbers indicate the ADT thresholds for acceptable LOS.
TABLE 2.4 CITY OF ENCINITAS
CIRCULATION ELEMENT ROADWAY CLASSIFICATIONS CAPACITY AND LEVEL OF SERVICE STANDARDS
LOS (in ADT) Roadway Functional Classification
A - C D E
Prime Arterial (6-lane) < 46,000 < 51,200 < 57,000
Prime Arterial (6-lane) - Augmented < 53,000 < 60,000 < 66,000
Major Roadway (4-lane) < 28,200 < 31,600 < 35,200
Major Roadway (4-lane) - Augmented < 36,300 < 41,000 < 45,400
Collector Roadway (4-lane) < 26,000 < 29,200 < 32,400
Local Roadway (2-lane) < 11,200 < 12,600 < 14,000
Local Roadway (2-lane) - Augmented < 16,000 < 18,000 < 20,000 Source: City of Encinitas
Note: Bold numbers indicate the ADT thresholds for acceptable LOS.

Page 6 County of San Diego General Plan Update
Traffic Impacts to Adjacent City Jurisdictions
TABLE 2.5
CITY OF ESCONDIDO CIRCULATION ELEMENT ROADWAY CLASSIFICATIONS
CAPACITY AND LEVEL OF SERVICE STANDARDS
LOS (in ADT) Roadway Functional Classification
A B C Mid D D- E
Prime Arterial (6-Lane, no parking) < 15,000 < 30,000 < 42,000 < 46,500 < 51,000 < 60,000
Prime Arterial (8-Lane, no parking) < 17,500 < 35,000 < 49,000 < 54,250 < 59,500 < 70,000
Major Road (4-Lane, no parking) < 14,800 < 24,700 < 29,600 < 31,500 < 33,400 < 37,000
Major Road (6-Lane, no parking) < 12,500 < 25,000 < 35,000 < 38,750 < 42,500 < 50,000
Collector (4-Lane, no parking) < 13,700 < 22,800 < 27,400 < 29,100 < 30,800 < 34,200
Collector (4-Lane, w/ parking) < 5,500 < 10,000 < 14,000 < 15,500 < 17,000 < 20,000
Local Collector (2 Lane, no parking) < 4,000 < 7,500 < 10,000 < 11,250 < 12,500 < 15,000
Rural Collector (2-Lane, w/ parking) < 2,500 < 5,000 < 7,000 < 7,750 < 8,500 < 10,000 Source: City of Escondido
Note: Bold numbers indicate the ADT thresholds for acceptable LOS.
TABLE 2.6 CITY OF OCEANSIDE
CIRCULATION ELEMENT ROADWAY CLASSIFICATIONS CAPACITY AND LEVEL OF SERVICE STANDARDS
LOS (in ADT) Functional Classification
A B C D E
Prime Arterial (6-lane) < 36,000 < 42,000 < 48,000 < 54,000 < 60,000
Major Arterial (6-lane, divided) < 30,000 < 35,000 < 40,000 < 45,000 < 50,000
Major Arterial (5-lane, divided) < 27,000 < 31,500 < 36,000 < 40,500 < 45,000
Major Arterial (4-lane, divided) < 24,000 < 28,000 < 32,000 < 36,000 < 40,000
Secondary Arterial (4-lane, undivided) < 13,700 < 22,800 < 27,400 < 30,800 < 34,200
Collector Industrial (2-lane) < 6,000 < 7,000 < 8,000 < 9,000 < 10,000
Collector (2-lane) < 5,250 < 6,125 < 7,000 < 7,875 < 8,750 Source: City of Oceanside
Note: Bold numbers indicate the ADT thresholds for acceptable LOS.

Page 7 County of San Diego General Plan Update
Traffic Impacts to Adjacent City Jurisdictions
TABLE 2.7 CITY OF SAN MARCOS
CIRCULATION ELEMENT ROADWAY CLASSIFICATIONS CAPACITY AND LEVEL OF SERVICE STANDARDS
LOS (in ADT) Roadway Functional Classification
A B C D E
Prime Arterial (6-lane) <25,000 <35,000 <42,000 <51,000 <60,000
Major Arterial (6-lane, divided) <20,000 <28,000 <35,000 <41,000 <50,000
Major Arterial (4-lane, divided) < 15,000 < 21,000 <28,000 <35,000 <40,000
Secondary Arterial (4-lane, undivided) < 10,000 < 14,000 <21,000 <24,500 <30,000
Collector (2-lane) <5,000 <7,000 <10,000 <12,500 <15,000 Source: City of San Marcos
Note: Bold numbers indicate the ADT thresholds for acceptable LOS.
TABLE 2.8 CITY OF VISTA
CIRCULATION ELEMENT ROADWAY CLASSIFICATIONS CAPACITY AND LEVEL OF SERVICE STANDARDS
LOS (in ADT) Roadway Functional Classification
A B C D E
Prime Arterial (6-lane) < 36,000 < 42,000 < 48,000 < 54,000 < 60,000
Major Arterial (4-lane, divided) < 24,000 < 28,000 < 32,000 < 36,000 < 40,000
Secondary Arterial (4-lane, undivided) < 15,000 <17,500 < 20,000 < 22,500 < 25,000
Minor Arterial (2-lane, undivided) < 9,000 < 10,500 < 12,500 < 15,000 < 17,000
Collector (4-lane w/no center lane) < 5,500 < 7,000 < 10,000 < 13,000 < 15,000
Collector (2-lane w/ continuous left-turn lane) < 5,500 < 7,000 < 10,000 < 13,000 < 15,000
Light Collector (2-lane) < 5,300 < 6,200 < 7,000 < 7,900 < 8,800 Source: City of Vista
Note: Bold numbers indicate the ADT thresholds for acceptable LOS. 2.2 Impact Significance Criteria
The cities of Carlsbad, Del Mar, El Cajon, Encinitas, La Mesa, Lemon Grove, National City, Oceanside, Poway, San Diego, San Marcos, Santee, Solana Beach, and Vista utilize the SANTEC/ITE Guidelines for Traffic Impact Studies (TIS) in the San Diego Region as the basis for defining project impacts. In general, a significant impact would be identified when the addition of project traffic results in a Level of Service dropping from LOS D or better to substandard LOS E or F. In addition, Table 2.9 summarizes the impact significance thresholds for facilities operating at substandard LOS with and without the project. These thresholds as applied to roadway segments are based upon an acceptable increase in the Volume / Capacity (V/C) ratio.

Page 8 County of San Diego General Plan Update
Traffic Impacts to Adjacent City Jurisdictions
TABLE 2.9 SANTEC / ITE
MEASURES OF SIGNIFICANT PROJECT TRAFFIC IMPACTS
LOS with Project Allowable Change Due to Impact
Freeways Roadway Segments Intersections Ramp Metering
V/C Speed (mph) V/C Speed (mph) Delay (sec) Delay (min.)
E & F (or ramp meter delays
above 15 min.) 0.01 1 0.02 1 2 2
Source: SANTEC/CMP Guidelines for Traffic Impact Studies (TIS) in the San Diego Region The following two jurisdictions have modified requirements from those stated above: City of Chula Vista The City of Chula Vista considers LOS C to be the acceptable standard for Circulation Element roadway segments. Significant impacts are those impacts for which the addition of project trips results in an identifiable degradation in LOS on freeway segments, roadway segments, or intersections, triggering the need for improvement strategies. Criteria for determining whether a project results in significant impacts on roadway segments are as follows:
i. LOS is LOS D, LOS E, or LOS F. ii. Project trips comprise 5% or more of total segment volume. iii. Project adds greater than 800 ADT to the segment.
City of Escondido The City of Escondido considers LOS Mid D as the acceptable standard for Circulation Element roadway segments. In addition to the SANTEC Guidelines, the City of Escondido considers an increase in the V/C ratio by more than 0.02 on a roadway segment or that operates at a LOS D-, E or F to be a significant impact. A proposed project is considered to have a significant impact on a facility if the additional project traffic causes the LOS to degrade from acceptable LOS Mid D or better to substandard LOS D-, E, or F.

Page 9 County of San Diego General Plan Update
Traffic Impacts to Adjacent City Jurisdictions
3.0 Existing Conditions
This section describes the key roadway segments and provides an assessment of roadway performance in terms of operating conditions and LOS under Existing Conditions. Analysis results are summarized by jurisdiction. 3.1 Roadway Network and Volumes
The existing roadway cross-sections are consistent with current roadway lane configurations. The average daily traffic (ADTs) volumes were derived from the SANDAG Series 10 Base Year 2007 traffic model, specially built for the County of San Diego General Plan Update. 3.2 Roadway Performance
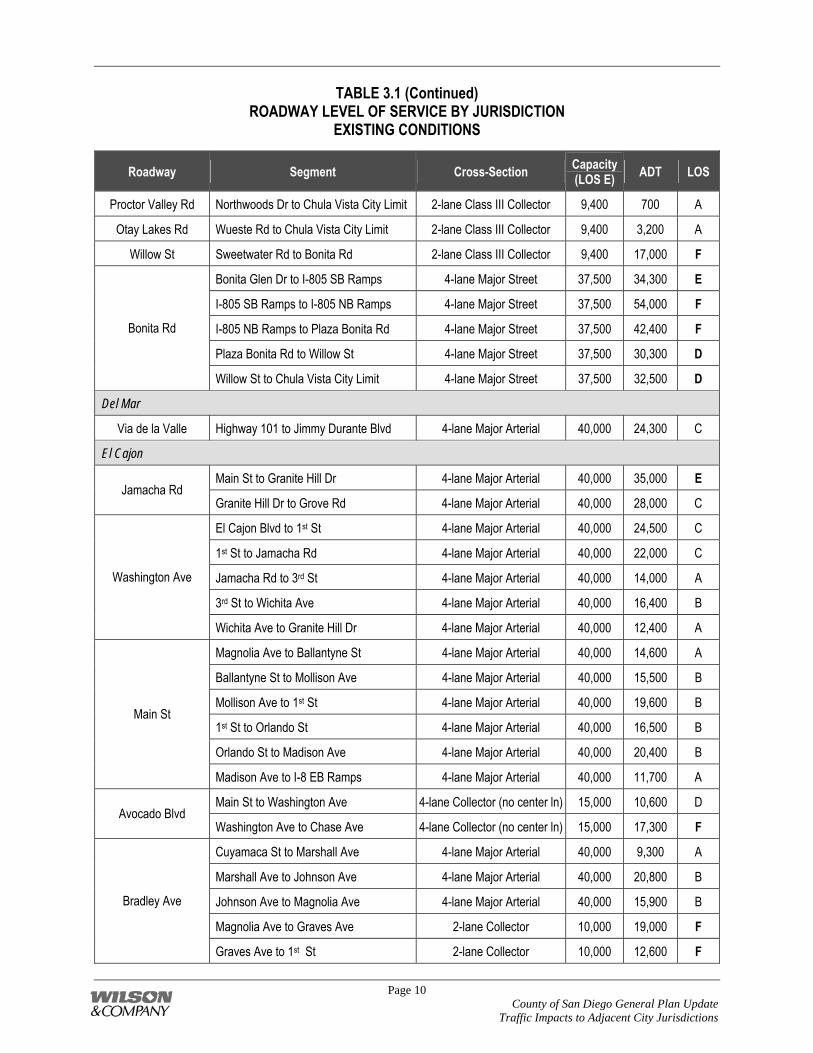
Table 3.1 displays existing roadway cross-sections, daily roadway capacity (LOS E) based upon the respective jurisdictional standard, the existing average daily traffic volume (ADT), and the corresponding LOS for the identified key roadway segments by jurisdiction.
TABLE 3.1 ROADWAY LEVEL OF SERVICE BY JURISDICTION
EXISTING CONDITIONS
Roadway Segment Cross-Section Capacity (LOS E) ADT LOS
Carlsbad
I-5 NB Ramps to Paseo Del Norte 4-lane Major Arterial 40,000 22,200 C
Paseo Del Norte to Car Country Dr 4-lane Major Arterial 40,000 8,100 A
Car Country Dr to Faraday Ave 4-lane Major Arterial 40,000 14,200 A
Faraday Ave to El Camino Real 4-lane Major Arterial 40,000 9,100 A
El Camino Real to College Blvd 2-lane Collector w/ CLTL 15,000 9,100 C
Leisure Village Dr to Shadowridge Dr 4-lane Major Arterial 40,000 4,100 A
Shadowridge Dr to Lake Blvd 4-lane Major Arterial 40,000 9,700 A
Lake Blvd to Melrose Dr 4-lane Major Arterial 40,000 15,700 B
Cannon Rd
Melrose Dr to Mar Vista Dr 4-lane Major Arterial 40,000 400 A
Chula Vista
Heritage Rd Main Street to Chula Vista City Limit 6-lane Prime Arterial 62,500 14,800 A
Telegraph Canyon Rd to Palomar St 6-lane Prime Arterial 62,500 19,200 A
Palomar St to Olympic Pkwy 6-lane Prime Arterial 62,500 3,900 A
Olympic Pkwy to Santa Venetia St 6-lane Prime Arterial 62,500 1,200 A La Media Rd
Santa Venetia St to Birch Rd 6-lane Prime Arterial 62,500 1,900 A
Page 10 County of San Diego General Plan Update
Traffic Impacts to Adjacent City Jurisdictions
TABLE 3.1 (Continued) ROADWAY LEVEL OF SERVICE BY JURISDICTION
EXISTING CONDITIONS
Roadway Segment Cross-Section Capacity (LOS E) ADT LOS
Proctor Valley Rd Northwoods Dr to Chula Vista City Limit 2-lane Class III Collector 9,400 700 A
Otay Lakes Rd Wueste Rd to Chula Vista City Limit 2-lane Class III Collector 9,400 3,200 A
Willow St Sweetwater Rd to Bonita Rd 2-lane Class III Collector 9,400 17,000 F
Bonita Glen Dr to I-805 SB Ramps 4-lane Major Street 37,500 34,300 E
I-805 SB Ramps to I-805 NB Ramps 4-lane Major Street 37,500 54,000 F
I-805 NB Ramps to Plaza Bonita Rd 4-lane Major Street 37,500 42,400 F
Plaza Bonita Rd to Willow St 4-lane Major Street 37,500 30,300 D
Bonita Rd
Willow St to Chula Vista City Limit 4-lane Major Street 37,500 32,500 D
Del Mar
Via de la Valle Highway 101 to Jimmy Durante Blvd 4-lane Major Arterial 40,000 24,300 C
El Cajon
Main St to Granite Hill Dr 4-lane Major Arterial 40,000 35,000 E Jamacha Rd
Granite Hill Dr to Grove Rd 4-lane Major Arterial 40,000 28,000 C
El Cajon Blvd to 1st St 4-lane Major Arterial 40,000 24,500 C
1st St to Jamacha Rd 4-lane Major Arterial 40,000 22,000 C
Jamacha Rd to 3rd St 4-lane Major Arterial 40,000 14,000 A
3rd St to Wichita Ave 4-lane Major Arterial 40,000 16,400 B
Washington Ave
Wichita Ave to Granite Hill Dr 4-lane Major Arterial 40,000 12,400 A
Magnolia Ave to Ballantyne St 4-lane Major Arterial 40,000 14,600 A
Ballantyne St to Mollison Ave 4-lane Major Arterial 40,000 15,500 B
Mollison Ave to 1st St 4-lane Major Arterial 40,000 19,600 B
1st St to Orlando St 4-lane Major Arterial 40,000 16,500 B
Orlando St to Madison Ave 4-lane Major Arterial 40,000 20,400 B
Main St
Madison Ave to I-8 EB Ramps 4-lane Major Arterial 40,000 11,700 A
Main St to Washington Ave 4-lane Collector (no center ln) 15,000 10,600 D Avocado Blvd
Washington Ave to Chase Ave 4-lane Collector (no center ln) 15,000 17,300 F
Cuyamaca St to Marshall Ave 4-lane Major Arterial 40,000 9,300 A
Marshall Ave to Johnson Ave 4-lane Major Arterial 40,000 20,800 B
Johnson Ave to Magnolia Ave 4-lane Major Arterial 40,000 15,900 B
Magnolia Ave to Graves Ave 2-lane Collector 10,000 19,000 F
Bradley Ave
Graves Ave to 1st St 2-lane Collector 10,000 12,600 F

Page 11 County of San Diego General Plan Update
Traffic Impacts to Adjacent City Jurisdictions
TABLE 3.1 (Continued) ROADWAY LEVEL OF SERVICE BY JURISDICTION
EXISTING CONDITIONS
Roadway Segment Cross-Section Capacity (LOS E) ADT LOS
Pepper Dr to Persimmon Ave 4-lane Major Arterial 40,000 24,300 C
Persimmon Ave to Broadway 4-lane Major Arterial 40,000 32,000 D
Broadway to I-8 WB Ramps 4-lane Major Arterial 40,000 33,500 D 2nd St
I-8 WB Ramps to Main St 6-lane Major Arterial 50,000 40,500 D
El Cajon Blvd to Mollison Ave 4-lane Major Arterial 40,000 24,400 C Chase Ave
Mollison Ave to Rancho Valle Ct 4-lane Major Arterial 40,000 18,400 B
I-8 EB Ramps to Bermuda Ln 2-lane Collector 10,000 24,500 F
Bermuda Ln to La Cresta Rd 2-lane Collector 10,000 21,000 F
La Cresta Rd to Madison Ave 2-lane Collector 10,000 10,400 F
Madison Ave to Vista Del Escuela 2-lane Collector w/ CLTL 15,000 2,600 A
Greenfield Dr
Vista Del Escuela to Orchard Ave 2-lane Collector w/ CLTL 15,000 500 A
Encinitas
Encinitas Blvd to Santa Fe Dr 6-lane Prime Arterial 57,000 37,100 A - C El Camino Real
Santa Fe Dr to Manchester Ave 4-lane Major Arterial - Augmented 45,400 26,500 A - C
El Camino Del Norte Rancho Santa Fe Rd to Eastern City Limit 2-lane Local Roadway 14,000 7,300 A - C
Encinitas Blvd El Camino Real to Manchester Ave 4-lane Major Roadway 35,200 36,200 F
I-5 NB Ramps to El Camino Real 4-lane Major Roadway - Augmented 45,400 31,600 A - C
Manchester Ave El Camino Real to Encinitas Blvd 2-lane Local Roadway 14,000 8,300 A - C
Rancho Santa Fe Rd Manchester Ave to Eastern City Limit 2-lane Local Roadway - Augmented 20,000 22,700 F
Escondido
Country Club Ln to El Norte Pkwy 4-lane Major Road 37,000 15,400 B
El Norte Pkwy to SR-78 WB Ramps 4-lane Major Road 37,000 29,200 C
SR-78 WB Ramps to Mission Ave 4-lane Major Road 37,000 34,500 E
Mission Ave to Washington Ave 4-lane Major Road 37,000 24,900 C
Washington Ave to 5th Ave 4-lane Major Road 37,000 23,800 B
5th Ave to 13th Ave 4-lane Major Road 37,000 26,100 C
13th Ave to Felicita Ave 4-lane Major Road 37,000 23,900 B
Centre City Pkwy
Felicita Ave to Centre City Rd 4-lane Major Road 37,000 30,000 Mid D

Page 12 County of San Diego General Plan Update
Traffic Impacts to Adjacent City Jurisdictions
TABLE 3.1 (Continued) ROADWAY LEVEL OF SERVICE BY JURISDICTION
EXISTING CONDITIONS
Roadway Segment Cross-Section Capacity (LOS E) ADT LOS
Centre City Rd to Brotherton Rd 4-lane Major Road 37,000 39,400 F Centre City Pkwy
Brotherton Rd to Citracado Pkwy 4-lane Major Road 37,000 32,600 D-
San Pasqual Valley Rd to Juniper St 2-lane Local Collector 15,000 13,900 E
Juniper St to Escondido Blvd 2-lane Local Collector 15,000 18,200 F
Escondido Blvd to Centre City Pkwy 4-lane Collector 34,200 27,000 C
Centre City Pkwy to Quince St 2-lane Local Collector 15,000 23,600 F
Felicita Ave/17th Ave
Quince St to Citracado Pkwy 2-lane Local Collector 15,000 14,500 E
Felicita Ave to Quiet Hills Dr 4-lane Major Road 37,000 15,900 B
Quiet Hills Dr to I-15 SB Ramps 6-lane Major Road 50,000 16,800 B
I-15 SB Ramps to I-15 NB Ramps 6-lane Prime Arterial 60,000 34,100 C Via Rancho Pkwy
I-15 NB Ramps to San Pasqual Rd 6-lane Prime Arterial 60,000 32,800 C
San Pasqual Rd to Mary Ln 4-lane Major Road 37,000 27,900 C
Mary Ln to Las Palmas Ave 4-lane Major Road 37,000 23,000 B
Las Palmas Ave to Sunset Dr 2-lane Local Collector 15,000 23,200 F
Sunset Dr to El Dorado Dr 2-lane Local Collector 15,000 18,800 F
El Dorado Dr to San Pasqual Valley Rd 2-lane Local Collector 15,000 27,300 F
San Pasqual Valley Rd to Boyle Ave 2-lane Local Collector 15,000 22,600 F
Boyle Ave to Hayden Dr 4-lane Major Road 37,000 18,000 B
Bear Valley Pkwy
Hayden Dr to Valley Pkwy 2-lane Local Collector 15,000 17,300 F
Bear Valley Pkwy to Wanek Rd 4-lane Major Road 37,000 29,800 Mid D
Wanek Rd to Washington Ave 4-lane Major Road 37,000 26,000 C Valley Pkwy
Washington Ave to Lake Wohlford Rd 2-lane Local Collector 15,000 34,200 F
San Pasqual Valley Rd Washington Ave to Birch Ave 2-lane Local Collector 15,000 21,200 F
San Pasqual Rd Bear Valley Pkwy to Ryan Dr 4-lane Major Road 37,000 11,300 A
North Ave to Country Club Ln 4-lane Collector 34,200 6,100 A
Country Club Ln to Bahia Ln 2-lane Local Collector 15,000 9,000 C Broadway
Bahia Ln to El Norte Pkwy 4-lane Collector 34,200 15,900 B
La Mesa
Grossmont Blvd to Campo Rd 2-lane Collector 10,000 7,800 D Bancroft Dr
Campo Rd to SR-94 WB Ramps 2-lane Collector 10,000 11,600 F
Lemon Ave La Mesa Blvd to Jackson Dr 2-lane Collector 10,000 1,700 A

Page 13 County of San Diego General Plan Update
Traffic Impacts to Adjacent City Jurisdictions
TABLE 3.1 (Continued) ROADWAY LEVEL OF SERVICE BY JURISDICTION
EXISTING CONDITIONS
Roadway Segment Cross-Section Capacity (LOS E) ADT LOS
Jackson Dr to Marguerita Ln 2-lane Collector 10,000 12,400 F
Marguerita Ln to Alto Dr 2-lane Collector 10,000 7,700 D
Alto Dr to Lake Helix Dr 2-lane Collector 10,000 4,500 B Lemon Ave
Lake Helix Dr to Fuerte Dr 2-lane Collector 10,000 1,500 A
Fuerte Dr Grossmont Dr to Avocado Blvd 2-lane Collector 10,000 15,700 F
SR-125 to Bancroft Dr 2-lane Collector 10,000 10,000 F
Bancroft Dr to Camino Paz 2-lane Collector 10,000 17,000 F
Camino Paz to Kenwood Rd 2-lane Collector 10,000 12,000 F
Kenwood Rd to Conrad Dr 4-lane Collector (no center ln) 15,000 42,500 F
Conrad Dr to Granada Ave 4-lane Collector (no center ln) 15,000 20,300 F
Campo Rd
Granada Ave to Sweetwater Spring Blvd 4-lane Collector (no center ln) 15,000 13,100 E
Lemon Grove
Troy St Palm St to Sweetwater Rd 4-lane Collector 30,000 9,000 A
Broadway to Tyler St 4-lane Collector (no center ln) 15,000 18,000 F Sweetwater Rd
Tyler St to Jamacha Rd 4-lane Collector 30,000 17,000 C
National City
National City Blvd to Highland Ave 4-lane Major Arterial 40,000 7,000 A
30th St Highland Ave to N 2nd Ave 4-lane Major Arterial 40,000 29,000 C
Euclid Ave Plaza Blvd to Sweetwater Rd 4-lane Collector (no center ln) 15,000 8,500 C
National City Blvd to Highland Ave 4-lane Collector (no center ln) 15,000 11,300 D Plaza Blvd
Highland Ave to Euclid Ave 4-lane Major Arterial 40,000 23,600 C
Oceanside
SR-76 to Old Ranch Rd 6-lane Major Arterial 50,000 9,500 A
Old Ranch Rd to Spur Ave 4-lane Major Arterial 40,000 2,300 A
Santa Fe Ave to Sagewood Rd 4-lane Major Arterial 40,000 11,700 A Melrose Dr
Sagewood Rd to Oceanside Blvd 4-lane Major Arterial 40,000 13,300 A
North Santa Fe Ave SR-76 to Melrose Dr 4-lane Major Arterial 40,000 23,100 A
Poway
Spring Hurst Dr to Iola Way 6-lane Major Arterial 50,000 36,900 C
Iola Way to Oak Knoll Rd 4-lane Major Arterial 40,000 27,300 C Poway Rd
Oak Knoll Rd to Pomerado Rd 4-lane Major Arterial 40,000 36,000 E

Page 14 County of San Diego General Plan Update
Traffic Impacts to Adjacent City Jurisdictions
TABLE 3.1 (Continued) ROADWAY LEVEL OF SERVICE BY JURISDICTION
EXISTING CONDITIONS
Roadway Segment Cross-Section Capacity (LOS E) ADT LOS
Pomerado Rd to Carriage Rd 4-lane Major Arterial 40,000 33,500 D
Carriage Rd to Community Rd 4-lane Major Arterial 40,000 36,500 E
Community Rd to Midland Rd 5-lane Major Arterial 45,000 35,400 D
Midland Rd to Ann O Reno Ln 4-lane Major Arterial 40,000 24,500 C
Ann O Reno Ln to Garden Rd 4-lane Major Arterial 40,000 12,500 A
Garden Rd to Silver Ridge Rd 2-lane Collector w/ CLTL 15,000 17,000 F
Silver Ridge Rd to Espola Rd 2-lane Collector w/ CLTL 15,000 12,900 D
Poway Rd
Espola Rd to SR-67 2-lane Collector 10,000 18,800 F
Springbrook Dr to Community Rd 6-lane Prime Arterial 60,000 49,400 C
Community Rd to Danielson St 6-lane Prime Arterial 60,000 19,600 A Scripps Poway Pkwy
Danielson St to SR-67 4-lane Major Arterial 40,000 19,200 B
Pomerado Rd to Ted William Pkwy 4-lane Major Arterial 40,000 37,700 E
Ted William Pkwy to Community Rd 4-lane Major Arterial 40,000 44,000 F
Community Rd to Tierra Bonita Rd 4-lane Major Arterial 40,000 29,000 C Twin Peaks Rd
Tierra Bonita Rd to Espola Rd 4-lane Major Arterial 40,000 24,200 C
Espola Rd Twin Peaks to Poway Rd 2-lane Collector 10,000 18,000 F
Highland Ranch Rd to Pomerado Rd 6-lane Prime Arterial 60,000 31,200 B Ted Williams Pkwy
Pomerado Rd to Twin Peaks Rd 4-lane Major Arterial 40,000 18,800 B
San Diego
Camino del Norte Camino San Bernardo to I-15 6-lane Prime Arterial 60,000 35,900 C
Via Del Campo to W. Bernardo Dr 4-lane Major Arterial 40,000 23,700 C Rancho Bernardo Rd
W. Bernardo Dr to I-15 4-lane Major Arterial 40,000 47,400 F
I-15 to Spring Canyon Rd 6-lane Prime Arterial 60,000 52,900 D Scripps Poway Pkwy
Spring Canyon Rd to Springbrook Dr 4-lane Major Arterial 40,000 25,900 C
Jimmy Durante Blvd to I-15 NB Ramps 4-lane Major Arterial 40,000 31,200 D
I-15 NB Ramps to San Andres Dr 4-lane Major Arterial 40,000 37,700 E Via de la Valle
San Andres Dr to El Camino Real 2-lane Collector 10,000 22,500 F
Airway Rd Michael Faraday Dr to SR-905 2-lane Collector 10,000 6,600 C
La Media Rd to SR-125 6-lane Major Arterial 50,000 10,900 A Siempre Viva Rd
SR-125 to Enrico Fermi Dr 6-lane Major Arterial 50,000 19,400 A

Page 15 County of San Diego General Plan Update
Traffic Impacts to Adjacent City Jurisdictions
TABLE 3.1 (Continued) ROADWAY LEVEL OF SERVICE BY JURISDICTION
EXISTING CONDITIONS
Roadway Segment Cross-Section Capacity (LOS E) ADT LOS
San Marcos
Borden Rd to Avenida Azul 4-lane Major Arterial 40,000 6,300 A
Avenida Azul to Mission Rd 6-lane Major Arterial 50,000 8,900 A
Mission Rd to SR-78 WB Ramps 6-lane Major Arterial 50,000 24,300 B
SR-78 WB Ramps to Grand Ave 6-lane Major Arterial 50,000 37,700 D
Grand Ave to Vista Dr 4-lane Secondary Arterial 30,000 15,900 C
Vista Dr to Stone Dr 4-lane Secondary Arterial 30,000 12,100 B
Las Posas Rd
Stone Dr to San Marcos Blvd 4-lane Secondary Arterial 30,000 9,900 A
Deer Springs Rd to Buena Creek Rd 2-lane Collector 15,000 16,800 F Twin Oaks Valley Rd
Buena Creek Rd to Olive St 2-lane Collector 15,000 11,800 D
La Cieniega Rd Twin Oak Valley Rd to Mulberry Dr 2-lane Collector 15,000 5,100 B
Mulberry Dr Olive St to La Cieniega Rd 2-lane Collector 15,000 1,800 A
Santee
Medina Dr to Halberns Blvd 4-lane Major Arterial 40,000 21,000 C
Halberns Blvd to Shirley Garden 4-lane Major Arterial 40,000 22,000 C
Shirley Garden to Magnolia Ave 4-lane Secondary Arterial 30,000 21,700 D
Magnolia Ave to Los Ranchitos Rd 2-lane Collector 10,000 7,300 C
west of Pine Grove 4-lane Major Arterial 40,000 5,000 A
Mast Blvd
Pine Grove to Riverford Rd 4-lane Major Arterial 40,000 7,000 A
Cuyamaca St to Magnolia Ave 2-lane Collector 10,000 4,500 B El Nopal
Magnolia Ave to Aquila Dr 2-lane Collector w/ CLTL 15,000 8,900 C
Magnolia Ave to SR-67 4-lane Major Arterial 40,000 32,000 D
SR-67 to Shadow Hill Rd 2-lane Collector w/ CLTL 15,000 16,000 F
Shadow Hill Rd to Northcode Rd 2-lane Collector w/ CLTL 15,000 7,000 C
Northcode Rd to Security Way 2-lane Collector 10,000 5,000 B
Security Way to SR-67 2-lane Collector 10,000 10,000 F
Woodside Ave
SR-67 to Riverford Rd 2-lane Collector 10,000 21,800 F
Solana Beach
Ocean St to Lomas Santa Fe Dr 4-lane Major Arterial 40,000 29,900 C Highway 101
Lomas Santa Fe Dr to Via De la Valle 4-lane Major Arterial 40,000 19,900 B
Lomas Santa Fe Dr Highway 101 to Stevens Ave 4-lane Major Arterial 40,000 11,900 A

Page 16 County of San Diego General Plan Update
Traffic Impacts to Adjacent City Jurisdictions
TABLE 3.1 (Continued) ROADWAY LEVEL OF SERVICE BY JURISDICTION
EXISTING CONDITIONS
Roadway Segment Cross-Section Capacity (LOS E) ADT LOS
Stevens Ave to Solana Hills Dr 4-lane Major Arterial 40,000 17,800 B
Solana Hills Dr to I-5 SB Ramps 4-lane Major Arterial 40,000 31,700 D
I-5 SB Ramps to Via Mil Cumbres 4-lane Major Arterial 40,000 28,300 C Lomas Santa Fe Dr
Via Mil Cumbres to Highland Dr 4-lane Major Arterial 40,000 8,900 A
Lomas Santa Fe Dr to Academy Dr 4-lane Collector 30,000 13,000 B
Academy Dr to La Colonia Park 2-lane Collector 10,000 11,900 F
La Colonia Park to Nardo Ave 4-lane Collector 30,000 11,900 B Steven Ave
Nardo Ave to Valley Ave 4-lane Collector 30,000 11,000 B
Valley Ave Stevens Ave to Via De la Valle 4-lane Collector (no center ln) 15,000 13,000 F
Highland Dr El Camino Real to San Andres Dr 2-lane Collector 10,000 5,000 B
Vista
Sycamore Ave SR-78 EB Ramps to Hibiscus Way 6-Lane Prime Arterial 60,000 48,900 D
South Santa Fe Ave to Cypress Ave 2-lane Light Collector 8,800 8,700 E Monte Vista Dr
Cypress Ave to Foothill Dr 2-lane Light Collector 8,800 4,800 A Source: Wilson & Company; January 2009
Notes: Bold letters indicate substandard LOS. CLTL = Continuous left-turn lane. Table 3.2 summarizes the results shown in Table 3.1 by identifying the total number of key roadway segments that are currently operating at substandard LOS E or F (Chula Vista includes LOS D & Escondido includes LOS D-) under Existing conditions. As shown in the table, a total of 56 out of 196 analyzed roadway segments in the adjacent incorporated jurisdictions are currently operating at substandard LOS.

Page 17 County of San Diego General Plan Update
Traffic Impacts to Adjacent City Jurisdictions
TABLE 3.2
SUMMARY OF ROADWAY SEGMENTS OPERATING AT SUBSTANDARD LOS EXISTING CONDITIONS
Jurisdiction Total Number Analyzed Number of Deficient Roadway Segments
Carlsbad 9 0
Chula Vista 13 6
Del Mar 1 0
El Cajon 31 7
Encinitas 7 2
Escondido 35 14
La Mesa 14 9
Lemon Grove 3 1
National City 5 0
Oceanside 5 0
Poway 21 7
San Diego 11 3
San Marcos 11 1
Santee 14 3
Solana Beach 13 2
Vista 3 1
Total 196 56 Source: Wilson & Company; January 2009

Page 18 County of San Diego General Plan Update
Traffic Impacts to Adjacent City Jurisdictions
4.0 Future Traffic Conditions
This section describes the future year classifications for the key roadway segments within the adjacent incorporated jurisdictions, along with an assessment of roadway performance in terms of operating conditions and LOS under buildout of the existing County of San Diego General Plan and proposed General Plan Update (Referral Map). Analysis results are summarized by jurisdiction. 4.1 Existing County of San Diego General Plan
The existing County of San Diego General Plan represents the no-project condition, and includes land uses and roadway network characteristics within the unincorporated County consistent with the currently adopted County Circulation Element. 4.1.1 Roadway Network and Volumes
The future year roadway classifications within the adjacent incorporated jurisdictions were derived from the circulation elements of the respective jurisdictions. The average daily traffic volumes were derived from the SANDAG Series 10 County of San Diego General Plan Update “Existing General Plan” traffic forecast. 4.1.2 Roadway Performance
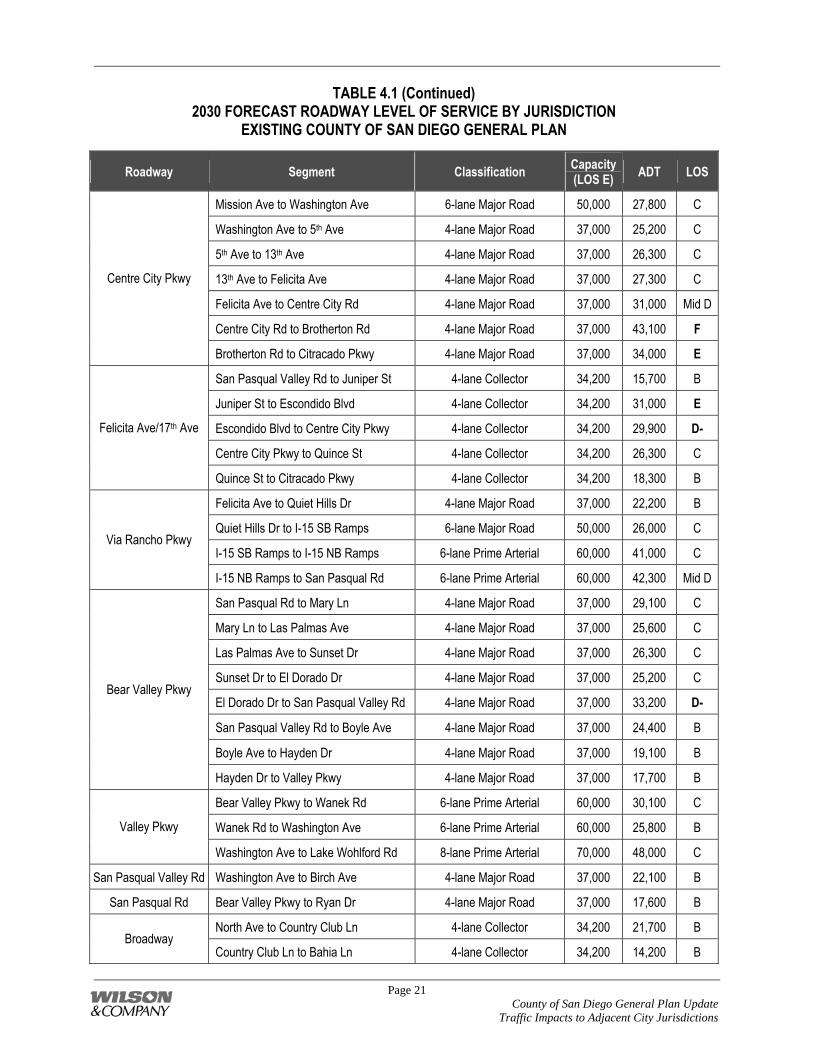
Table 4.1 displays the future year roadway classifications within the adjacent incorporated jurisdictions, the roadway capacity (LOS E) based upon the respective jurisdictional standard, the 2030 forecast average daily traffic volume, and the corresponding LOS assuming buildout of the Existing County of San Diego General Plan.
TABLE 4.1 2030 FORECAST ROADWAY LEVEL OF SERVICE BY JURISDICTION
EXISTING COUNTY OF SAN DIEGO GENERAL PLAN
Roadway Segment Classification Capacity (LOS E) ADT LOS
Carlsbad
I-5 NB Ramps to Paseo Del Norte 4-lane Major Arterial 40,000 27,300 C
Paseo Del Norte to Car Country Dr 4-lane Major Arterial 40,000 14,400 A
Car Country Dr to Faraday Ave 4-lane Major Arterial 40,000 28,100 C
Faraday Ave to El Camino Real 4-lane Major Arterial 40,000 22,200 C
El Camino Real to College Blvd 4-lane Major Arterial 40,000 17,800 B
Leisure Village Dr to Shadowridge Dr 4-lane Major Arterial 40,000 22,800 C
Shadowridge Dr to Lake Blvd 4-lane Major Arterial 40,000 19,900 B
Lake Blvd to Melrose Dr 4-lane Major Arterial 40,000 23,900 C
Cannon Rd
Melrose Dr to Mar Vista Dr 4-lane Major Arterial 40,000 7,900 A

Page 19 County of San Diego General Plan Update
Traffic Impacts to Adjacent City Jurisdictions
TABLE 4.1 (Continued) 2030 FORECAST ROADWAY LEVEL OF SERVICE BY JURISDICTION
EXISTING COUNTY OF SAN DIEGO GENERAL PLAN
Roadway Segment Classification Capacity (LOS E) ADT LOS
Chula Vista
Heritage Rd Main Street to Chula Vista City Limit 6-lane Prime Arterial 62,500 23,700 A
Telegraph Canyon Rd to Palomar St 6-lane Prime Arterial 62,500 26,700 A
Palomar St to Olympic Pkwy 6-lane Prime Arterial 62,500 12,500 A
Olympic Pkwy to Santa Venetia St 6-lane Prime Arterial 62,500 18,100 A La Media Rd
Santa Venetia St to Birch Rd 6-lane Prime Arterial 62,500 22,200 A
Proctor Valley Rd Northwoods Dr to Chula Vista City Limit 4-lane Major Street 37,500 8,400 A
Otay Lakes Rd Wueste Rd to Chula Vista City Limit 6-lane Prime Arterial 62,500 27,200 A
Willow St Sweetwater Rd to Bonita Rd 4-lane Major Street 37,500 17,800 A
Bonita Glen Dr to I-805 SB Ramps 4-lane Major Street 37,500 37,700 F
I-805 SB Ramps to I-805 NB Ramps 4-lane Major Street 37,500 55,300 F
I-805 NB Ramps to Plaza Bonita Rd 4-lane Major Street 37,500 43,200 F
Plaza Bonita Rd to Willow St 4-lane Major Street 37,500 34,100 E
Bonita Rd
Willow St to Chula Vista City Limit 4-lane Major Street 37,500 34,100 E
Del Mar
Via de la Valle Highway 101 to Jimmy Durante Blvd 4-lane Major Arterial 40,000 25,300 C
El Cajon
Main St to Granite Hill Dr 4-lane Major Arterial 40,000 38,000 E Jamacha Rd
Granite Hill Dr to Grove Rd 4-lane Major Arterial 40,000 30,000 D
El Cajon Blvd to 1st St 4-lane Major Arterial 40,000 25,800 C
1st St to Jamacha Rd 4-lane Major Arterial 40,000 23,000 C
Jamacha Rd to 3rd St 4-lane Major Arterial 40,000 19,900 B
3rd St to Wichita Ave 4-lane Major Arterial 40,000 19,800 B
Washington Ave
Wichita Ave to Granite Hill Dr 4-lane Major Arterial 40,000 15,600 B
Magnolia Ave to Ballantyne St 4-lane Major Arterial 40,000 14,800 A
Ballantyne St to Mollison Ave 4-lane Major Arterial 40,000 18,300 B
Mollison Ave to 1st St 4-lane Major Arterial 40,000 23,500 C
1st St to Orlando St 4-lane Major Arterial 40,000 17,600 B
Orlando St to Madison Ave 4-lane Major Arterial 40,000 22,800 C
Main St
Madison Ave to I-8 EB Ramps 4-lane Major Arterial 40,000 13,300 A
Avocado Blvd Main St to Washington Ave 4-lane Major Arterial 40,000 17,900 B

Page 20 County of San Diego General Plan Update
Traffic Impacts to Adjacent City Jurisdictions
TABLE 4.1 (Continued) 2030 FORECAST ROADWAY LEVEL OF SERVICE BY JURISDICTION
EXISTING COUNTY OF SAN DIEGO GENERAL PLAN
Roadway Segment Classification Capacity (LOS E) ADT LOS
Avocado Blvd Washington Ave to Chase Ave 4-lane Major Arterial 40,000 18,600 B
Cuyamaca St to Marshall Ave 4-lane Major Arterial 40,000 11,600 A
Marshall Ave to Johnson Ave 4-lane Major Arterial 40,000 22,200 C
Johnson Ave to Magnolia Ave 4-lane Major Arterial 40,000 18,000 B
Magnolia Ave to Graves Ave 4-lane Major Arterial 40,000 25,100 C
Bradley Ave
Graves Ave to 1st St 4-lane Major Arterial 40,000 30,100 D
Pepper Dr to Persimmon Ave 4-lane Major Arterial 40,000 26,400 C
Persimmon Ave to Broadway 4-lane Major Arterial 40,000 39,000 E
Broadway to I-8 WB Ramps 4-lane Major Arterial 40,000 34,700 D 2nd St
I-8 WB Ramps to Main St 6-lane Major Arterial 50,000 41,400 D
El Cajon Blvd to Mollison Ave 4-lane Major Arterial 40,000 26,800 C Chase Ave
Mollison Ave to Rancho Valle Ct 4-lane Major Arterial 40,000 21,000 C
I-8 EB Ramps to Bermuda Ln 4-lane Collector 30,000 27,500 E
Bermuda Ln to La Cresta Rd 4-lane Collector 30,000 25,000 E
La Cresta Rd to Madison Ave 4-lane Collector 30,000 10,500 B
Madison Ave to Vista Del Escuela 4-lane Collector 30,000 2,800 A
Greenfield Dr
Vista Del Escuela to Orchard Ave 4-lane Collector 30,000 500 A
Encinitas
Encinitas Blvd to Santa Fe Dr 6-lane Prime Arterial 57,000 38,000 A-C El Camino Real
Santa Fe Dr to Manchester Ave 6-lane Prime Arterial 57,000 27,700 A-C
El Camino Del Norte Rancho Santa Fe Rd to Eastern City Limit
2-lane Local Roadway - Augmented 20,000 10,000 A-C
Encinitas Blvd El Camino Real to Manchester Ave 4-lane Major Roadway 35,200 36,700 F
I-5 NB Ramps to El Camino Real 6-lane Prime Arterial 57,000 33,800 A-C Manchester Ave
El Camino Real to Encinitas Blvd 2-lane Local Roadway - Augmented 20,000 11,800 A-C
Rancho Santa Fe Rd Manchester Ave to Eastern City Limit 2-lane Local Roadway - Augmented 20,000 23,000 F
Escondido
Country Club Ln to El Norte Pkwy 4-lane Major Road 37,000 24,100 B
El Norte Pkwy to SR-78 WB Ramps 4-lane Major Road 37,000 30,700 Mid D Centre City Pkwy
SR-78 WB Ramps to Mission Ave 6-lane Major Road 50,000 46,700 E
Page 21 County of San Diego General Plan Update
Traffic Impacts to Adjacent City Jurisdictions
TABLE 4.1 (Continued) 2030 FORECAST ROADWAY LEVEL OF SERVICE BY JURISDICTION
EXISTING COUNTY OF SAN DIEGO GENERAL PLAN
Roadway Segment Classification Capacity (LOS E) ADT LOS
Mission Ave to Washington Ave 6-lane Major Road 50,000 27,800 C
Washington Ave to 5th Ave 4-lane Major Road 37,000 25,200 C
5th Ave to 13th Ave 4-lane Major Road 37,000 26,300 C
13th Ave to Felicita Ave 4-lane Major Road 37,000 27,300 C
Felicita Ave to Centre City Rd 4-lane Major Road 37,000 31,000 Mid D
Centre City Rd to Brotherton Rd 4-lane Major Road 37,000 43,100 F
Centre City Pkwy
Brotherton Rd to Citracado Pkwy 4-lane Major Road 37,000 34,000 E
San Pasqual Valley Rd to Juniper St 4-lane Collector 34,200 15,700 B
Juniper St to Escondido Blvd 4-lane Collector 34,200 31,000 E
Escondido Blvd to Centre City Pkwy 4-lane Collector 34,200 29,900 D-
Centre City Pkwy to Quince St 4-lane Collector 34,200 26,300 C
Felicita Ave/17th Ave
Quince St to Citracado Pkwy 4-lane Collector 34,200 18,300 B
Felicita Ave to Quiet Hills Dr 4-lane Major Road 37,000 22,200 B
Quiet Hills Dr to I-15 SB Ramps 6-lane Major Road 50,000 26,000 C
I-15 SB Ramps to I-15 NB Ramps 6-lane Prime Arterial 60,000 41,000 C Via Rancho Pkwy
I-15 NB Ramps to San Pasqual Rd 6-lane Prime Arterial 60,000 42,300 Mid D
San Pasqual Rd to Mary Ln 4-lane Major Road 37,000 29,100 C
Mary Ln to Las Palmas Ave 4-lane Major Road 37,000 25,600 C
Las Palmas Ave to Sunset Dr 4-lane Major Road 37,000 26,300 C
Sunset Dr to El Dorado Dr 4-lane Major Road 37,000 25,200 C
El Dorado Dr to San Pasqual Valley Rd 4-lane Major Road 37,000 33,200 D-
San Pasqual Valley Rd to Boyle Ave 4-lane Major Road 37,000 24,400 B
Boyle Ave to Hayden Dr 4-lane Major Road 37,000 19,100 B
Bear Valley Pkwy
Hayden Dr to Valley Pkwy 4-lane Major Road 37,000 17,700 B
Bear Valley Pkwy to Wanek Rd 6-lane Prime Arterial 60,000 30,100 C
Wanek Rd to Washington Ave 6-lane Prime Arterial 60,000 25,800 B Valley Pkwy
Washington Ave to Lake Wohlford Rd 8-lane Prime Arterial 70,000 48,000 C
San Pasqual Valley Rd Washington Ave to Birch Ave 4-lane Major Road 37,000 22,100 B
San Pasqual Rd Bear Valley Pkwy to Ryan Dr 4-lane Major Road 37,000 17,600 B
North Ave to Country Club Ln 4-lane Collector 34,200 21,700 B Broadway
Country Club Ln to Bahia Ln 4-lane Collector 34,200 14,200 B

Page 22 County of San Diego General Plan Update
Traffic Impacts to Adjacent City Jurisdictions
TABLE 4.1 (Continued) 2030 FORECAST ROADWAY LEVEL OF SERVICE BY JURISDICTION
EXISTING COUNTY OF SAN DIEGO GENERAL PLAN
Roadway Segment Classification Capacity (LOS E) ADT LOS
Broadway Bahia Ln to El Norte Pkwy 4-lane Collector 34,200 22,600 B
La Mesa
Grossmont Blvd to Campo Rd 2-lane Collector 10,000 8,000 D Bancroft Dr
Campo Rd to SR-94 WB Ramps 4-lane Collector 30,000 12,300 B
La Mesa Blvd to Jackson Dr 2-lane Collector 10,000 2,300 A
Jackson Dr to Marguerita Ln 4-lane Collector 30,000 15,300 C
Marguerita Ln to Alto Dr 4-lane Collector 30,000 10,900 B
Alto Dr to Lake Helix Dr 4-lane Collector 30,000 6,800 A
Lemon Ave
Lake Helix Dr to Fuerte Dr 4-lane Collector 30,000 3,600 A
Fuerte Dr Grossmont Dr to Avocado Blvd 2-lane Collector 10,000 15,800 F
SR-125 to Bancroft Dr 4-lane Collector (no center ln) 15,000 10,100 D
Bancroft Dr to Camino Paz 4-lane Collector 30,000 17,200 C
Camino Paz to Kenwood Rd 4-lane Collector 30,000 12,300 B
Kenwood Rd to Conrad Dr 4-lane Collector 30,000 47,900 F
Conrad Dr to Granada Ave 4-lane Collector 30,000 22,300 D
Campo Rd
Granada Ave to Sweetwater Spring Blvd 4-lane Collector 30,000 18,800 C
Lemon Grove
Troy St Palm St to Sweetwater Rd 4-lane Collector 30,000 10,300 B
Broadway to Tyler St 4-lane Collector 30,000 18,000 C Sweetwater Rd
Tyler St to Jamacha Rd 4-lane Collector 30,000 18,300 C
National City
National City Blvd to Highland Ave 4-lane Major Arterial 40,000 8,100 A 30th St
Highland Ave to N 2nd Ave 4-lane Major Arterial 40,000 32,500 D
Euclid Ave Plaza Blvd to Sweetwater Rd 4-lane Major Arterial 40,000 10,100 A
National City Blvd to Highland Ave 4-lane Major Arterial 40,000 15,500 B Plaza Blvd
Highland Ave to Euclid Ave 4-lane Major Arterial 40,000 26,800 C
Oceanside
SR-76 to Old Ranch Rd 6-lane Major Arterial 50,000 32,000 B
Old Ranch Rd to Spur Ave 6-lane Major Arterial 50,000 33,800 B
Spur Ave to Santa Fe Ave 6-lane Major Arterial 50,000 36,400 C Melrose Dr
Santa Fe Ave to Sagewood Rd 6-lane Prime Arterial 60,000 35,600 A

Page 23 County of San Diego General Plan Update
Traffic Impacts to Adjacent City Jurisdictions
TABLE 4.1 (Continued) 2030 FORECAST ROADWAY LEVEL OF SERVICE BY JURISDICTION
EXISTING COUNTY OF SAN DIEGO GENERAL PLAN
Roadway Segment Classification Capacity (LOS E) ADT LOS
Melrose Dr Sagewood Rd to Oceanside Blvd 6-lane Prime Arterial 60,000 34,800 A
North Santa Fe Ave SR-76 to Melrose Dr 4-lane Major Arterial 40,000 23,800 A
Poway
Spring Hurst Dr to Iola Way 6-lane Major Arterial 50,000 43,300 D
Iola Way to Oak Knoll Rd 4-lane Major Arterial 40,000 40,300 F
Oak Knoll Rd to Pomerado Rd 4-lane Major Arterial 40,000 39,900 E
Pomerado Rd to Carriage Rd 4-lane Major Arterial 40,000 37,800 E
Carriage Rd to Community Rd 4-lane Major Arterial 40,000 40,300 F
Community Rd to Midland Rd 5-lane Major Arterial 45,000 39,000 D
Midland Rd to Ann O Reno Ln 4-lane Major Arterial 40,000 28,200 C
Ann O Reno Ln to Garden Rd 4-lane Major Arterial 40,000 18,600 B
Garden Rd to Silver Ridge Rd 2-lane Collector w/ CLTL 15,000 14,000 E
Silver Ridge Rd to Espola Rd 2-lane Collector w/ CLTL 15,000 13,700 E
Poway Rd
Espola Rd to SR-67 2-lane Collector 10,000 21,200 F
Springbrook Dr to Community Rd 6-lane Prime Arterial 60,000 58,000 E
Community Rd to Danielson St 6-lane Prime Arterial 60,000 36,000 C Scripps Poway Pkwy
Danielson St to SR-67 6-lane Prime Arterial 60,000 36,500 C
Pomerado Rd to Ted William Pkwy 6-lane Prime Arterial 60,000 41,500 C
Ted William Pkwy to Community Rd 6-lane Prime Arterial 60,000 51,500 D
Community Rd to Tierra Bonita Rd 4-lane Major Arterial 40,000 34,300 D Twin Peaks Rd
Tierra Bonita Rd to Espola Rd 4-lane Major Arterial 40,000 29,400 C
Espola Rd Twin Peaks to Poway Rd 4-lane Secondary Arterial 30,000 24,600 D
Highland Ranch Rd to Pomerado Rd 6-lane Prime Arterial 60,000 42,500 C Ted Williams Pkwy
Pomerado Rd to Twin Peaks Rd 6-lane Prime Arterial 60,000 20,100 A
San Diego
Camino del Norte Camino San Bernardo to I-15 6-lane Prime Arterial 60,000 54,000 D
Via Del Campo to W. Bernardo Dr 4-lane Major Arterial 40,000 36,700 E Rancho Bernardo Rd
W. Bernardo Dr to I-15 4-lane Major Arterial 40,000 56,900 F
I-15 to Spring Canyon Rd 6-lane Prime Arterial 60,000 61,300 F Scripps Poway Pkwy
Spring Canyon Rd to Springbrook Dr 4-lane Major Arterial 40,000 29,600 C
Via de la Valle Jimmy Durante Blvd to I-15 NB Ramps 4-lane Major Arterial 40,000 37,900 E

Page 24 County of San Diego General Plan Update
Traffic Impacts to Adjacent City Jurisdictions
TABLE 4.1 (Continued) 2030 FORECAST ROADWAY LEVEL OF SERVICE BY JURISDICTION
EXISTING COUNTY OF SAN DIEGO GENERAL PLAN
Roadway Segment Classification Capacity (LOS E) ADT LOS
I-15 NB Ramps to San Andres Dr 4-lane Major Arterial 40,000 40,200 F Via de la Valle
San Andres Dr to El Camino Real 2-lane Collector 10,000 27,100 F
Airway Rd Michael Faraday Dr to SR-905 2-lane Collector 10,000 16,100 F
La Media Rd to SR-125 6-lane Major Arterial 50,000 18,000 A Siempre Viva Rd
SR-125 to Enrico Fermi Dr 6-lane Major Arterial 50,000 50,700 F
San Marcos
Borden Rd to Avenida Azul 4-lane Major Arterial 40,000 21,400 C
Avenida Azul to Mission Rd 6-lane Major Arterial 50,000 28,100 C
Mission Rd to SR-78 WB Ramps 6-lane Major Arterial 50,000 35,400 D
SR-78 WB Ramps to Grand Ave 6-lane Major Arterial 50,000 55,500 F
Grand Ave to Vista Dr 4-lane Secondary Arterial 30,000 31,000 F
Vista Dr to Stone Dr 4-lane Secondary Arterial 30,000 25,100 E
Las Posas Rd
Stone Dr to San Marcos Blvd 4-lane Secondary Arterial 30,000 21,100 D
Deer Springs Rd to Buena Creek Rd 4-lane Secondary Arterial 30,000 22,000 D Twin Oaks Valley Rd
Buena Creek Rd to Olive St 4-lane Major Arterial 40,000 20,900 B
La Cieniega Rd Twin Oak Valley Rd to Mulberry Dr 4-lane Secondary Arterial 30,000 6,300 A
Mulberry Dr Olive St to La Cieniega Rd 4-lane Secondary Arterial 30,000 6,200 A
Santee
Medina Dr to Halberns Blvd 4-lane Major Arterial 40,000 22,400 C
Halberns Blvd to Shirley Garden 4-lane Major Arterial 40,000 23,200 C
Shirley Garden to Magnolia Ave 4-lane Secondary Arterial 30,000 25,900 E
Magnolia Ave to Los Ranchitos Rd 4-lane Major Arterial 40,000 18,800 B
west of Pine Grove 4-lane Major Arterial 40,000 24,500 C
Mast Blvd
Pine Grove to Riverford Rd 4-lane Major Arterial 40,000 11,300 A
Cuyamaca St to Magnolia Ave 2-lane Collector 10,000 5,500 C El Nopal
Magnolia Ave to Aquila Dr 2-lane Collector w/ CLTL 15,000 10,400 D
Magnolia Ave to SR-67 4-lane Major Arterial 40,000 37,700 E
SR-67 to Shadow Hill Rd 4-lane Major Arterial 40,000 23,600 C
Shadow Hill Rd to Northcode Rd 2-lane Collector w/ CLTL 15,000 8,400 C
Northcode Rd to Security Way 4-lane Major Arterial 40,000 7,000 A
Woodside Ave
Security Way to SR-67 4-lane Major Arterial 40,000 18,600 B

Page 25 County of San Diego General Plan Update
Traffic Impacts to Adjacent City Jurisdictions
TABLE 4.1 (Continued) 2030 FORECAST ROADWAY LEVEL OF SERVICE BY JURISDICTION
EXISTING COUNTY OF SAN DIEGO GENERAL PLAN
Roadway Segment Classification Capacity (LOS E) ADT LOS
Woodside Ave SR-67 to Riverford Rd 4-lane Major Arterial 40,000 31,400 D
Solana Beach
Ocean St to Lomas Santa Fe Dr 4-lane Major Arterial 40,000 34,100 D Highway 101
Lomas Santa Fe Dr to Via De la Valle 4-lane Major Arterial 40,000 25,500 C
Highway 101 to Stevens Ave 4-lane Major Arterial 40,000 16,500 B
Stevens Ave to Solana Hills Dr 4-lane Major Arterial 40,000 22,100 C
Solana Hills Dr to I-5 SB Ramps 4-lane Major Arterial 40,000 37,600 E
I-5 SB Ramps to Via Mil Cumbres 4-lane Major Arterial 40,000 36,100 E
Lomas Santa Fe Dr
Via Mil Cumbres to Highland Dr 4-lane Major Arterial 40,000 16,100 B
Lomas Santa Fe Dr to Academy Dr 4-lane Collector 30,000 19,300 C
Academy Dr to La Colonia Park 4-lane Collector 30,000 13,200 B
La Colonia Park to Nardo Ave 4-lane Collector 30,000 13,200 B Steven Ave
Nardo Ave to Valley Ave 4-lane Collector 30,000 16,100 C
Valley Ave Stevens Ave to Via De la Valle 4-lane Collector 30,000 21,300 D
Highland Dr El Camino Real to San Andres Dr 2-lane Collector 10,000 5,500 C
Vista
Sycamore Ave SR-78 EB Ramps to Hibiscus Way 6-lane Prime Arterial 60,000 57,300 E
South Santa Fe Ave to Cypress Ave 4-lane Major Arterial 40,000 15,600 A Monte Vista Dr
Cypress Ave to Foothill Dr 4-lane Major Arterial 40,000 11,100 A Source: Wilson & Company; January 2009
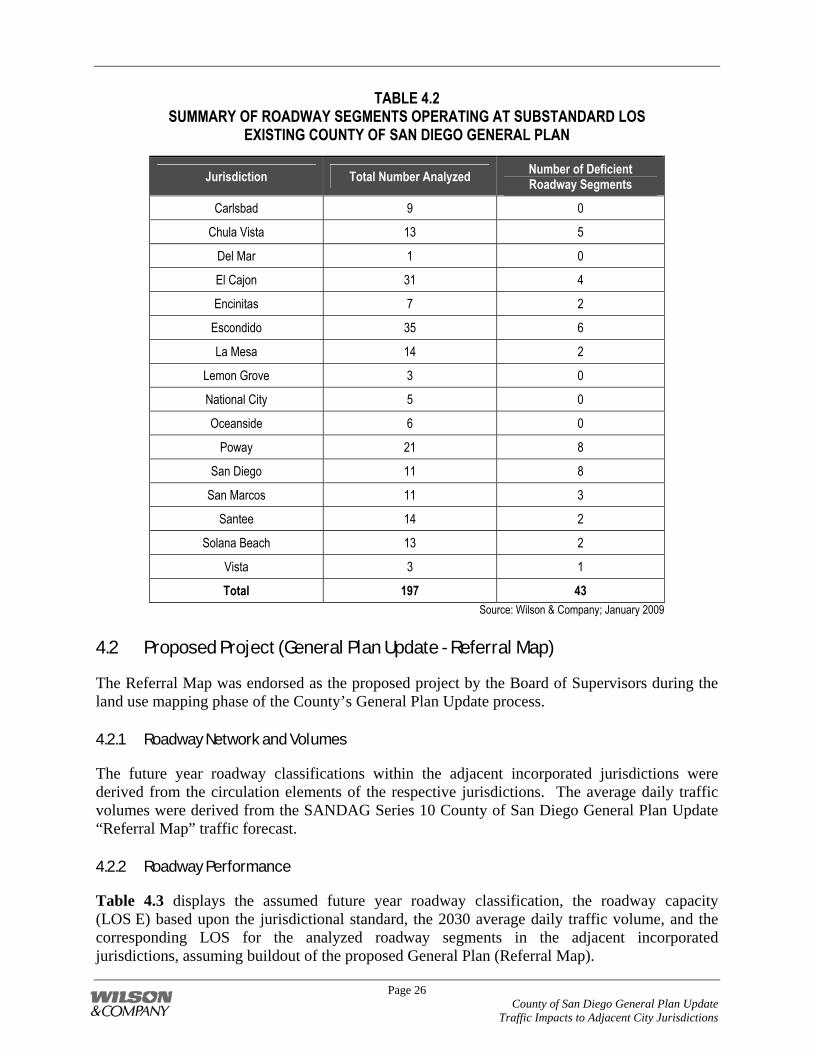
Notes: Bold letters indicate substandard LOS. CLTL = Continuous left-turn lane. Table 4.2 summarizes the results shown in Table 4.1 by identifying the projected total number of key roadway segments which would operate at substandard LOS E or F (Chula Vista includes LOS D & Escondido includes LOS D-) under future year buildout of the Existing County of San Diego General Plan. As shown in the table, a total of 43 out of 197 analyzed roadway segments in the adjacent incorporated jurisdictions would operate at substandard LOS under future year buildout of the existing County of San Diego General Plan.
Page 26 County of San Diego General Plan Update
Traffic Impacts to Adjacent City Jurisdictions
TABLE 4.2 SUMMARY OF ROADWAY SEGMENTS OPERATING AT SUBSTANDARD LOS
EXISTING COUNTY OF SAN DIEGO GENERAL PLAN
Jurisdiction Total Number Analyzed Number of Deficient Roadway Segments
Carlsbad 9 0
Chula Vista 13 5
Del Mar 1 0
El Cajon 31 4
Encinitas 7 2
Escondido 35 6
La Mesa 14 2
Lemon Grove 3 0
National City 5 0
Oceanside 6 0
Poway 21 8
San Diego 11 8
San Marcos 11 3
Santee 14 2
Solana Beach 13 2
Vista 3 1
Total 197 43 Source: Wilson & Company; January 2009
4.2 Proposed Project (General Plan Update - Referral Map)
The Referral Map was endorsed as the proposed project by the Board of Supervisors during the land use mapping phase of the County’s General Plan Update process. 4.2.1 Roadway Network and Volumes
The future year roadway classifications within the adjacent incorporated jurisdictions were derived from the circulation elements of the respective jurisdictions. The average daily traffic volumes were derived from the SANDAG Series 10 County of San Diego General Plan Update “Referral Map” traffic forecast. 4.2.2 Roadway Performance
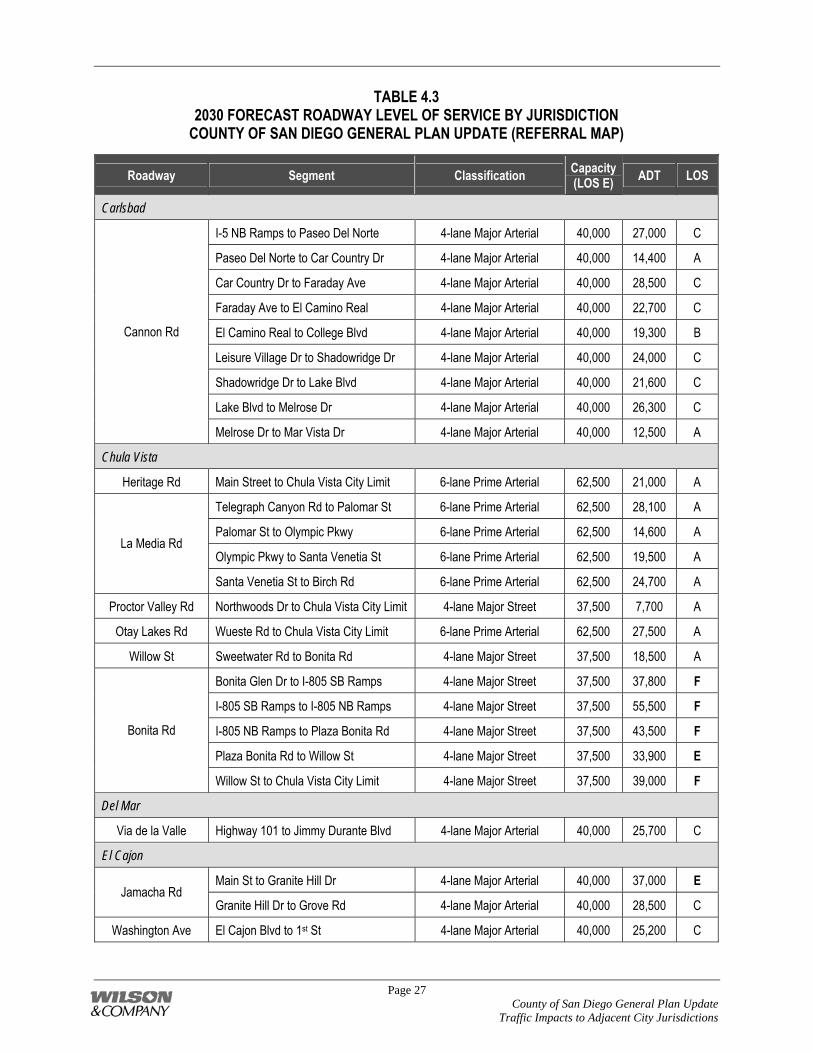
Table 4.3 displays the assumed future year roadway classification, the roadway capacity (LOS E) based upon the jurisdictional standard, the 2030 average daily traffic volume, and the corresponding LOS for the analyzed roadway segments in the adjacent incorporated jurisdictions, assuming buildout of the proposed General Plan (Referral Map).
Page 27 County of San Diego General Plan Update
Traffic Impacts to Adjacent City Jurisdictions
TABLE 4.3 2030 FORECAST ROADWAY LEVEL OF SERVICE BY JURISDICTION
COUNTY OF SAN DIEGO GENERAL PLAN UPDATE (REFERRAL MAP)
Roadway Segment Classification Capacity (LOS E) ADT LOS
Carlsbad
I-5 NB Ramps to Paseo Del Norte 4-lane Major Arterial 40,000 27,000 C
Paseo Del Norte to Car Country Dr 4-lane Major Arterial 40,000 14,400 A
Car Country Dr to Faraday Ave 4-lane Major Arterial 40,000 28,500 C
Faraday Ave to El Camino Real 4-lane Major Arterial 40,000 22,700 C
El Camino Real to College Blvd 4-lane Major Arterial 40,000 19,300 B
Leisure Village Dr to Shadowridge Dr 4-lane Major Arterial 40,000 24,000 C
Shadowridge Dr to Lake Blvd 4-lane Major Arterial 40,000 21,600 C
Lake Blvd to Melrose Dr 4-lane Major Arterial 40,000 26,300 C
Cannon Rd
Melrose Dr to Mar Vista Dr 4-lane Major Arterial 40,000 12,500 A
Chula Vista
Heritage Rd Main Street to Chula Vista City Limit 6-lane Prime Arterial 62,500 21,000 A
Telegraph Canyon Rd to Palomar St 6-lane Prime Arterial 62,500 28,100 A
Palomar St to Olympic Pkwy 6-lane Prime Arterial 62,500 14,600 A
Olympic Pkwy to Santa Venetia St 6-lane Prime Arterial 62,500 19,500 A La Media Rd
Santa Venetia St to Birch Rd 6-lane Prime Arterial 62,500 24,700 A
Proctor Valley Rd Northwoods Dr to Chula Vista City Limit 4-lane Major Street 37,500 7,700 A
Otay Lakes Rd Wueste Rd to Chula Vista City Limit 6-lane Prime Arterial 62,500 27,500 A
Willow St Sweetwater Rd to Bonita Rd 4-lane Major Street 37,500 18,500 A
Bonita Glen Dr to I-805 SB Ramps 4-lane Major Street 37,500 37,800 F
I-805 SB Ramps to I-805 NB Ramps 4-lane Major Street 37,500 55,500 F
I-805 NB Ramps to Plaza Bonita Rd 4-lane Major Street 37,500 43,500 F
Plaza Bonita Rd to Willow St 4-lane Major Street 37,500 33,900 E
Bonita Rd
Willow St to Chula Vista City Limit 4-lane Major Street 37,500 39,000 F
Del Mar
Via de la Valle Highway 101 to Jimmy Durante Blvd 4-lane Major Arterial 40,000 25,700 C
El Cajon
Main St to Granite Hill Dr 4-lane Major Arterial 40,000 37,000 E Jamacha Rd
Granite Hill Dr to Grove Rd 4-lane Major Arterial 40,000 28,500 C
Washington Ave El Cajon Blvd to 1st St 4-lane Major Arterial 40,000 25,200 C

Page 28 County of San Diego General Plan Update
Traffic Impacts to Adjacent City Jurisdictions
TABLE 4.3 (Continued) 2030 FORECAST ROADWAY LEVEL OF SERVICE BY JURISDICTION
COUNTY OF SAN DIEGO GENERAL PLAN UPDATE (REFERRAL MAP)
Roadway Segment Classification Capacity (LOS E) ADT LOS
1st St to Jamacha Rd 4-lane Major Arterial 40,000 22,500 C
Jamacha Rd to 3rd St 4-lane Major Arterial 40,000 16,600 B
3rd St to Wichita Ave 4-lane Major Arterial 40,000 18,100 B Washington Ave
Wichita Ave to Granite Hill Dr 4-lane Major Arterial 40,000 13,700 A
Magnolia Ave to Ballantyne St 4-lane Major Arterial 40,000 14,900 A
Ballantyne St to Mollison Ave 4-lane Major Arterial 40,000 18,000 B
Mollison Ave to 1st St 4-lane Major Arterial 40,000 23,800 C
1st St to Orlando St 4-lane Major Arterial 40,000 17,900 B
Orlando St to Madison Ave 4-lane Major Arterial 40,000 23,400 C
Main St
Madison Ave to I-8 EB Ramps 4-lane Major Arterial 40,000 12,500 A
Main St to Washington Ave 4-lane Major Arterial 40,000 17,500 B Avocado Blvd
Washington Ave to Chase Ave 4-lane Major Arterial 40,000 18,100 B
Cuyamaca St to Marshall Ave 4-lane Major Arterial 40,000 10,900 A
Marshall Ave to Johnson Ave 4-lane Major Arterial 40,000 21,200 C
Johnson Ave to Magnolia Ave 4-lane Major Arterial 40,000 16,700 B
Magnolia Ave to Graves Ave 4-lane Major Arterial 40,000 26,400 C
Bradley Ave
Graves Ave to 1st St 4-lane Major Arterial 40,000 29,900 C
Pepper Dr to Persimmon Ave 4-lane Major Arterial 40,000 25,900 C
Persimmon Ave to Broadway 4-lane Major Arterial 40,000 36,100 E
Broadway to I-8 WB Ramps 4-lane Major Arterial 40,000 38,900 E 2nd St
I-8 WB Ramps to Main St 6-lane Major Arterial 50,000 42,900 D
El Cajon Blvd to Mollison Ave 4-lane Major Arterial 40,000 25,600 C Chase Ave
Mollison Ave to Rancho Valle Ct 4-lane Major Arterial 40,000 19,600 B
I-8 EB Ramps to Bermuda Ln 4-lane Collector 30,000 26,000 E
Bermuda Ln to La Cresta Rd 4-lane Collector 30,000 24,800 D
La Cresta Rd to Madison Ave 4-lane Collector 30,000 10,600 B
Madison Ave to Vista Del Escuela 4-lane Collector 30,000 2,800 A
Greenfield Dr
Vista Del Escuela to Orchard Ave 4-lane Collector 30,000 500 A
Encinitas
Encinitas Blvd to Santa Fe Dr 6-lane Prime Arterial 57,000 37,600 A-C El Camino Real
Santa Fe Dr to Manchester Ave 6-lane Prime Arterial 57,000 27,200 A-C

Page 29 County of San Diego General Plan Update
Traffic Impacts to Adjacent City Jurisdictions
TABLE 4.3 (Continued) 2030 FORECAST ROADWAY LEVEL OF SERVICE BY JURISDICTION
COUNTY OF SAN DIEGO GENERAL PLAN UPDATE (REFERRAL MAP)
Roadway Segment Classification Capacity (LOS E) ADT LOS
El Camino Del Norte Rancho Santa Fe Rd to Eastern City Limit
2-lane Local Roadway - Augmented 20,000 10,100 A-C
Encinitas Blvd El Camino Real to Manchester Ave 4-lane Major Roadway 35,200 36,900 F
I-5 NB Ramps to El Camino Real 6-lane Prime Arterial 57,000 33,000 A-C Manchester Ave
El Camino Real to Encinitas Blvd 2-lane Local Roadway - Augmented 20,000 11,900 A-C
Rancho Santa Fe Rd Manchester Ave to Eastern City Limit 2-lane Local Roadway - Augmented 20,000 24,500 F
Escondido
Country Club Ln to El Norte Pkwy 4-lane Major Road 37,000 23,100 B
El Norte Pkwy to SR-78 WB Ramps 4-lane Major Road 37,000 28,600 C
SR-78 WB Ramps to Mission Ave 6-lane Major Road 50,000 43,500 E
Mission Ave to Washington Ave 6-lane Major Road 50,000 26,500 C
Washington Ave to 5th Ave 4-lane Major Road 37,000 23,800 B
5th Ave to 13th Ave 4-lane Major Road 37,000 25,500 C
13th Ave to Felicita Ave 4-lane Major Road 37,000 26,400 C
Felicita Ave to Centre City Rd 4-lane Major Road 37,000 31,100 Mid D
Centre City Rd to Brotherton Rd 4-lane Major Road 37,000 43,400 F
Centre City Pkwy
Brotherton Rd to Citracado Pkwy 4-lane Major Road 37,000 34,200 E
San Pasqual Valley Rd to Juniper St 4-lane Collector 34,200 23,600 C
Juniper St to Escondido Blvd 4-lane Collector 34,200 33,500 E
Escondido Blvd to Centre City Pkwy 4-lane Collector 34,200 29,700 D-
Centre City Pkwy to Quince St 4-lane Collector 34,200 25,800 C
Felicita Ave/17th Ave
Quince St to Citracado Pkwy 4-lane Collector 34,200 17,700 B
Felicita Ave to Quiet Hills Dr 4-lane Major Road 37,000 23,100 B
Quiet Hills Dr to I-15 SB Ramps 6-lane Major Road 50,000 27,500 C
I-15 SB Ramps to I-15 NB Ramps 6-lane Prime Arterial 60,000 43,000 Mid D Via Rancho Pkwy
I-15 NB Ramps to San Pasqual Rd 6-lane Prime Arterial 60,000 42,100 Mid D
San Pasqual Rd to Mary Ln 4-lane Major Road 37,000 35,300 E
Mary Ln to Las Palmas Ave 4-lane Major Road 37,000 30,400 Mid D
Las Palmas Ave to Sunset Dr 4-lane Major Road 37,000 30,800 Mid D Bear Valley Pkwy
Sunset Dr to El Dorado Dr 4-lane Major Road 37,000 28,600 C

Page 30 County of San Diego General Plan Update
Traffic Impacts to Adjacent City Jurisdictions
TABLE 4.3 (Continued) 2030 FORECAST ROADWAY LEVEL OF SERVICE BY JURISDICTION
COUNTY OF SAN DIEGO GENERAL PLAN UPDATE (REFERRAL MAP)
Roadway Segment Classification Capacity (LOS E) ADT LOS
El Dorado Dr to San Pasqual Valley Rd 4-lane Major Road 37,000 36,000 E
San Pasqual Valley Rd to Boyle Ave 4-lane Major Road 37,000 28,100 C
Boyle Ave to Hayden Dr 4-lane Major Road 37,000 23,800 B Bear Valley Pkwy
Hayden Dr to Valley Pkwy 4-lane Major Road 37,000 24,000 B
Bear Valley Pkwy to Wanek Rd 6-lane Prime Arterial 60,000 33,700 C
Wanek Rd to Washington Ave 6-lane Prime Arterial 60,000 29,200 B Valley Pkwy
Washington Ave to Lake Wohlford Rd 8-lane Prime Arterial 70,000 53,400 Mid D
San Pasqual Valley Rd Washington Ave to Birch Ave 4-lane Major Road 37,000 24,100 B
San Pasqual Rd Bear Valley Pkwy to Ryan Dr 4-lane Major Road 37,000 12,300 A
North Ave to Country Club Ln 4-lane Collector 34,200 15,400 B
Country Club Ln to Bahia Ln 4-lane Collector 34,200 16,000 B Broadway
Bahia Ln to El Norte Pkwy 4-lane Collector 34,200 20,100 B
La Mesa
Grossmont Blvd to Campo Rd 2-lane Collector 10,000 8,000 D Bancroft Dr
Campo Rd to SR-94 WB Ramps 4-lane Collector 30,000 12,700 B
La Mesa Blvd to Jackson Dr 2-lane Collector 10,000 2,100 A
Jackson Dr to Marguerita Ln 4-lane Collector 30,000 14,000 C
Marguerita Ln to Alto Dr 4-lane Collector 30,000 9,500 A
Alto Dr to Lake Helix Dr 4-lane Collector 30,000 5,800 A
Lemon Ave
Lake Helix Dr to Fuerte Dr 4-lane Collector 30,000 2,700 A
Fuerte Dr Grossmont Dr to Avocado Blvd 2-lane Collector 10,000 18,500 F
SR-125 to Bancroft Dr 4-lane Collector (no center ln) 15,000 10,700 D
Bancroft Dr to Camino Paz 4-lane Collector 30,000 17,600 C
Camino Paz to Kenwood Rd 4-lane Collector 30,000 12,400 B
Kenwood Rd to Conrad Dr 4-lane Collector 30,000 47,500 F
Conrad Dr to Granada Ave 4-lane Collector 30,000 20,300 D
Campo Rd
Granada Ave to Sweetwater Spring Blvd 4-lane Collector 30,000 17,800 C
Lemon Grove
Troy St Palm St to Sweetwater Rd 4-lane Collector 30,000 9,700 A
Broadway to Tyler St 4-lane Collector 30,000 19,200 C Sweetwater Rd
Tyler St to Jamacha Rd 4-lane Collector 30,000 21,100 D

Page 31 County of San Diego General Plan Update
Traffic Impacts to Adjacent City Jurisdictions
TABLE 4.3 (Continued) 2030 FORECAST ROADWAY LEVEL OF SERVICE BY JURISDICTION
COUNTY OF SAN DIEGO GENERAL PLAN UPDATE (REFERRAL MAP)
Roadway Segment Classification Capacity (LOS E) ADT LOS
National City
National City Blvd to Highland Ave 4-lane Major Arterial 40,000 8,000 A 30th St
Highland Ave to N 2nd Ave 4-lane Major Arterial 40,000 33,200 D
Euclid Ave Plaza Blvd to Sweetwater Rd 4-lane Major Arterial 40,000 10,100 A
National City Blvd to Highland Ave 4-lane Major Arterial 40,000 16,000 B Plaza Blvd
Highland Ave to Euclid Ave 4-lane Major Arterial 40,000 26,600 C
Oceanside
SR-76 to Old Ranch Rd 6-lane Major Arterial 50,000 24,700 A
Old Ranch Rd to Spur Ave 6-lane Major Arterial 50,000 26,800 A
Spur Ave to Santa Fe Ave 6-lane Major Arterial 50,000 30,300 B
Santa Fe Ave to Sagewood Rd 6-lane Prime Arterial 60,000 27,100 A
Melrose Dr
Sagewood Rd to Oceanside Blvd 6-lane Prime Arterial 60,000 27,600 A
North Santa Fe Ave SR-76 to Melrose Dr 4-lane Major Arterial 40,000 23,200 A
Poway
Spring Hurst Dr to Iola Way 6-lane Major Arterial 50,000 42,800 D
Iola Way to Oak Knoll Rd 4-lane Major Arterial 40,000 40,000 F
Oak Knoll Rd to Pomerado Rd 4-lane Major Arterial 40,000 39,600 E
Pomerado Rd to Carriage Rd 4-lane Major Arterial 40,000 37,500 E
Carriage Rd to Community Rd 4-lane Major Arterial 40,000 40,000 F
Community Rd to Midland Rd 5-lane Major Arterial 45,000 38,700 D
Midland Rd to Ann O Reno Ln 4-lane Major Arterial 40,000 27,600 C
Ann O Reno Ln to Garden Rd 4-lane Major Arterial 40,000 18,000 B
Garden Rd to Silver Ridge Rd 2-lane Collector w/ CLTL 15,000 13,200 E
Silver Ridge Rd to Espola Rd 2-lane Collector w/ CLTL 15,000 12,600 D
Poway Rd
Espola Rd to SR-67 2-lane Collector 10,000 20,100 F
Springbrook Dr to Community Rd 6-lane Prime Arterial 60,000 56,600 E
Community Rd to Danielson St 6-lane Prime Arterial 60,000 35,400 C Scripps Poway Pkwy
Danielson St to SR-67 6-lane Prime Arterial 60,000 36,000 C
Pomerado Rd to Ted William Pkwy 6-lane Prime Arterial 60,000 40,000 C
Ted William Pkwy to Community Rd 6-lane Prime Arterial 60,000 50,000 D Twin Peaks Rd
Community Rd to Tierra Bonita Rd 4-lane Major Arterial 40,000 32,800 D

Page 32 County of San Diego General Plan Update
Traffic Impacts to Adjacent City Jurisdictions
TABLE 4.3 (Continued) 2030 FORECAST ROADWAY LEVEL OF SERVICE BY JURISDICTION
COUNTY OF SAN DIEGO GENERAL PLAN UPDATE (REFERRAL MAP)
Roadway Segment Classification Capacity (LOS E) ADT LOS
Twin Peaks Rd Tierra Bonita Rd to Espola Rd 4-lane Major Arterial 40,000 27,900 C
Espola Rd Twin Peaks to Poway Rd 4-lane Secondary Arterial 30,000 23,100 D
Highland Ranch Rd to Pomerado Rd 6-lane Prime Arterial 60,000 43,000 C Ted Williams Pkwy
Pomerado Rd to Twin Peaks Rd 6-lane Prime Arterial 60,000 20,500 A
San Diego
Camino del Norte Camino San Bernardo to I-15 6-lane Prime Arterial 60,000 36,200 C
Via Del Campo to W. Bernardo Dr 4-lane Major Arterial 40,000 35,800 E Rancho Bernardo Rd
W. Bernardo Dr to I-15 4-lane Major Arterial 40,000 56,100 F
I-15 to Spring Canyon Rd 6-lane Prime Arterial 60,000 61,600 F Scripps Poway Pkwy
Spring Canyon Rd to Springbrook Dr 4-lane Major Arterial 40,000 30,800 D
Jimmy Durante Blvd to I-15 NB Ramps 4-lane Major Arterial 40,000 31,700 D
I-15 NB Ramps to San Andres Dr 4-lane Major Arterial 40,000 43,100 F Via de la Valle
San Andres Dr to El Camino Real 2-lane Collector 10,000 26,500 F
Airway Rd Michael Faraday Dr to SR-905 2-lane Collector 10,000 17,500 F
La Media Rd to SR-125 6-lane Major Arterial 50,000 19,500 A Siempre Viva Rd
SR-125 to Enrico Fermi Dr 6-lane Major Arterial 50,000 59,300 F
San Marcos
Borden Rd to Avenida Azul 4-lane Major Arterial 40,000 20,300 B
Avenida Azul to Mission Rd 6-lane Major Arterial 50,000 27,300 B
Mission Rd to SR-78 WB Ramps 6-lane Major Arterial 50,000 37,300 D
SR-78 WB Ramps to Grand Ave 6-lane Major Arterial 50,000 56,500 F
Grand Ave to Vista Dr 4-lane Secondary Arterial 30,000 31,500 F
Vista Dr to Stone Dr 4-lane Secondary Arterial 30,000 25,600 E
Las Posas Rd
Stone Dr to San Marcos Blvd 4-lane Secondary Arterial 30,000 21,400 D
Deer Springs Rd to Buena Creek Rd 4-lane Secondary Arterial 30,000 25,000 E Twin Oaks Valley Rd
Buena Creek Rd to Olive St 4-lane Major Arterial 40,000 20,100 B
La Cieniega Rd Twin Oak Valley Rd to Mulberry Dr 4-lane Secondary Arterial 30,000 5,600 A
Mulberry Dr Olive St to La Cieniega Rd 4-lane Secondary Arterial 30,000 3,700 A
Santee
Medina Dr to Halberns Blvd 4-lane Major Arterial 40,000 22,000 C Mast Blvd
Halberns Blvd to Shirley Garden 4-lane Major Arterial 40,000 25,300 C

Page 33 County of San Diego General Plan Update
Traffic Impacts to Adjacent City Jurisdictions
TABLE 4.3 (Continued) 2030 FORECAST ROADWAY LEVEL OF SERVICE BY JURISDICTION
COUNTY OF SAN DIEGO GENERAL PLAN UPDATE (REFERRAL MAP)
Roadway Segment Classification Capacity (LOS E) ADT LOS
Shirley Garden to Magnolia Ave 4-lane Secondary Arterial 30,000 27,400 E
Magnolia Ave to Los Ranchitos Rd 4-lane Major Arterial 40,000 20,000 B
west of Pine Grove 4-lane Major Arterial 40,000 24,800 C Mast Blvd
Pine Grove to Riverford Rd 4-lane Major Arterial 40,000 11,400 D
Cuyamaca St to Magnolia Ave 2-lane Collector 10,000 5,700 C El Nopal
Magnolia Ave to Aquila Dr 2-lane Collector w/ CLTL 15,000 10,800 D
Magnolia Ave to SR-67 4-lane Major Arterial 40,000 37,400 E SR-67 to Shadow Hill Rd 4-lane Major Arterial 40,000 22,500 C
Shadow Hill Rd to Northcode Rd 2-lane Collector w/ CLTL 15,000 7,300 C
Northcode Rd to Security Way 4-lane Major Arterial 40,000 6,000 A
Security Way to SR-67 4-lane Major Arterial 40,000 16,800 B
Woodside Ave
SR-67 to Riverford Rd 4-lane Major Arterial 40,000 29,700 C
Solana Beach
Ocean St to Lomas Santa Fe Dr 4-lane Major Arterial 40,000 34,600 D Highway 101
Lomas Santa Fe Dr to Via De la Valle 4-lane Major Arterial 40,000 24,000 C
Highway 101 to Stevens Ave 4-lane Major Arterial 40,000 16,700 B
Stevens Ave to Solana Hills Dr 4-lane Major Arterial 40,000 21,600 C
Solana Hills Dr to I-5 SB Ramps 4-lane Major Arterial 40,000 37,000 E
I-5 SB Ramps to Via Mil Cumbres 4-lane Major Arterial 40,000 33,400 D
Lomas Santa Fe Dr
Via Mil Cumbres to Highland Dr 4-lane Major Arterial 40,000 13,200 A
Lomas Santa Fe Dr to Academy Dr 4-lane Collector 30,000 19,100 C
Academy Dr to La Colonia Park 4-lane Collector 30,000 13,000 B
La Colonia Park to Nardo Ave 4-lane Collector 30,000 13,000 B Steven Ave
Nardo Ave to Valley Ave 4-lane Collector 30,000 15,900 C
Valley Ave Stevens Ave to Via De la Valle 4-lane Collector 30,000 21,000 D
Highland Dr El Camino Real to San Andres Dr 2-lane Collector 10,000 6,100 C
Vista
Sycamore Ave SR-78 EB Ramps to Hibiscus Way 6-lane Prime Arterial 60,000 54,600 E South Santa Fe Ave to Cypress Ave 4-lane Major Arterial 40,000 11,900 A
Monte Vista Dr Cypress Ave to Foothill Dr 4-lane Major Arterial 40,000 7,500 A
Source: Wilson & Company; January 2009 Notes: Bold letters indicate substandard LOS. CLTL = Continuous left-turn lane.

Page 34 County of San Diego General Plan Update
Traffic Impacts to Adjacent City Jurisdictions
Table 4.4 summarizes the results shown in Table 4.3 by identifying the projected total number of key roadway segments operating at substandard LOS E or F (Chula Vista includes LOS D & Escondido includes LOS D-) under future year buildout of the proposed County of San Diego General Plan Update (Referral Map). As shown, a total of 42 out of 197 analyzed roadway segments in the adjacent incorporated jurisdictions are projected to operate at substandard LOS.
TABLE 4.4 SUMMARY OF ROADWAY SEGMENTS OPERATING AT SUBSTANDARD LOS
COUNTY OF SAN DIEGO GENERAL PLAN UPDATE (REFERRAL MAP)
Jurisdiction Total Number Analyzed Number of Deficient Roadway Segments
Carlsbad 9 0
Chula Vista 13 5
Del Mar 1 0
El Cajon 31 4
Encinitas 7 2
Escondido 35 7
La Mesa 14 2
Lemon Grove 3 0
National City 5 0
Oceanside 6 0
Poway 21 7
San Diego 11 7
San Marcos 11 4
Santee 14 2
Solana Beach 13 1
Vista 3 1
Total 197 42 Source: Wilson & Company; January 2009

Page 35 County of San Diego General Plan Update
Traffic Impacts to Adjacent City Jurisdictions
5.0 Identification of Significant Impacts
This section documents significant impacts on the key roadway segments within the adjacent incorporated jurisdictions that would result from buildout of the proposed County of San Diego General Plan Update. Utilizing the methodologies outlined in Section 2.3, the following comparisons were made for purposes of determining significant traffic impacts: Existing County of San Diego General Plan to Existing Conditions (Existing Plan to Ground) – this comparison provides a baseline scenario indicating impacts on the adjacent incorporated jurisdictions under buildout of the existing County of San Diego General Plan. Proposed County of San Diego General Plan Update (Referral Map) to Existing Conditions (Proposed Plan to Ground) – this comparison provides the basis for identifying significant impacts associated with future year buildout of the proposed County of San Diego General Plan Update (Referral Map). Proposed County of San Diego General Plan (Referral Map) to Existing General Plan (Proposed Plan to Existing Plan) – this comparison provides the basis for identifying new significant impacts that would result with the proposed County of San Diego General Plan. 5.1 Comparison of Existing County of San Diego General Plan to Existing
Conditions
Table 5.1 compares projected roadway performance under the buildout of the existing County of San Diego General Plan to Existing conditions, and displays the resulting significant impacts.
TABLE 5.1 SIGNIFICANT TRAFFIC IMPACTS
EXISTING COUNTY OF SAN DIEGO GENERAL PLAN VS. EXISTING CONDITIONS (Existing Plan to Ground)
Existing Existing GP Roadway Segment
ADT V/C LOS ADT V/C LOS ∆ in V/C
Significant Impact?
Carlsbad
I-5 NB Ramps to Paseo Del Norte 22,200 0.56 C 27,300 0.68 C 0.12 No
Paseo Del Norte to Car Country Dr 8,100 0.20 A 14,400 0.36 A 0.16 No
Car Country Dr to Faraday Ave 14,200 0.36 A 28,100 0.70 C 0.34 No
Faraday Ave to El Camino Real 9,100 0.23 A 22,200 0.56 C 0.33 No
El Camino Real to College Blvd 9,100 0.61 C 17,800 0.45 B -0.16 No
Cannon Rd
Leisure Village Dr to Shadowridge Dr 4,100 0.10 A 22,800 0.57 C 0.47 No

Page 36 County of San Diego General Plan Update
Traffic Impacts to Adjacent City Jurisdictions
TABLE 5.1 (Continued) SIGNIFICANT TRAFFIC IMPACTS
EXISTING COUNTY OF SAN DIEGO GENERAL PLAN VS. EXISTING CONDITIONS (Existing Plan to Ground)
Existing Existing GP Roadway Segment
ADT V/C LOS ADT V/C LOS ∆ in V/C
Significant Impact?
Shadowridge Dr to Lake Blvd 9,700 0.24 A 19,900 0.50 B 0.26 No
Lake Blvd to Melrose Dr 15,700 0.39 B 23,900 0.60 C 0.21 No Cannon Rd
Melrose Dr to Mar Vista Dr 400 0.01 A 7,900 0.20 A 0.19 No
Chula Vista
Heritage Rd Main Street to Chula Vista City Limit 14,800 0.24 A 23,700 0.38 A 0.14 No
Telegraph Canyon Rd to Palomar St 19,200 0.31 A 26,700 0.43 A 0.12 No
Palomar St to Olympic Pkwy 3,900 0.06 A 12,500 0.20 A 0.14 No
Olympic Pkwy to Santa Venetia St 1,200 0.02 A 18,100 0.29 A 0.27 No
La Media Rd
Santa Venetia St to Birch Rd 1,900 0.03 A 22,200 0.36 A 0.33 No
Proctor Valley Rd
Northwoods Dr to Chula Vista City Limit 700 0.07 A 8,400 0.22 A 0.15 No
Otay Lakes Rd
Wueste Rd to Chula Vista City Limit 3,200 0.34 A 27,200 0.44 A 0.10 No
Willow St Sweetwater Rd to Bonita Rd 17,000 1.81 F 17,800 0.47 A -1.34 No
Bonita Glen Dr to I-805 SB Ramps 34,300 0.91 E 37,700 1.01 F 0.10 Yes
I-805 SB Ramps to I-805 NB Ramps 54,000 1.44 F 55,300 1.47 F 0.03 Yes
I-805 NB Ramps to Plaza Bonita Rd 42,400 1.13 F 43,200 1.15 F 0.02 Yes
Plaza Bonita Rd to Willow St 30,300 0.81 D 34,100 0.91 E 0.10 Yes
Bonita Rd
Willow St to Chula Vista City Limit 32,500 0.87 D 34,100 0.91 E 0.04 Yes
Del Mar
Via de la Valle
Highway 101 to Jimmy Durante Blvd 24,300 0.61 C 25,300 0.63 C 0.02 No
El Cajon
Main St to Granite Hill Dr 35,000 0.88 E 38,000 0.95 E 0.07 Yes Jamacha Rd
Granite Hill Dr to Grove Rd 28,000 0.70 C 30,000 0.75 D 0.05 No
El Cajon Blvd to 1st St 24,500 0.61 C 25,800 0.65 C 0.04 No
1st St to Jamacha Rd 22,000 0.55 C 23,000 0.58 C 0.03 No Washington Ave
Jamacha Rd to 3rd St 14,000 0.35 A 19,900 0.50 B 0.15 No

Page 37 County of San Diego General Plan Update
Traffic Impacts to Adjacent City Jurisdictions
TABLE 5.1 (Continued) SIGNIFICANT TRAFFIC IMPACTS
EXISTING COUNTY OF SAN DIEGO GENERAL PLAN VS. EXISTING CONDITIONS (Existing Plan to Ground)
Existing Existing GP Roadway Segment
ADT V/C LOS ADT V/C LOS ∆ in V/C
Significant Impact?
3rd St to Wichita Ave 16,400 0.41 B 19,800 0.50 B 0.09 No Washington Ave Wichita Ave to Granite Hill Dr 12,400 0.31 A 15,600 0.39 B 0.08 No
Magnolia Ave to Ballantyne St 14,600 0.37 A 14,800 0.37 A 0.00 No
Ballantyne St to Mollison Ave 15,500 0.39 B 18,300 0.46 B 0.07 No
Mollison Ave to 1st St 19,600 0.49 B 23,500 0.59 C 0.10 No
1st St to Orlando St 16,500 0.41 B 17,600 0.44 B 0.03 No
Orlando St to Madison Ave 20,400 0.51 B 22,800 0.57 C 0.06 No
Main St
Madison Ave to I-8 EB Ramps 11,700 0.29 A 13,300 0.33 A 0.04 No
Main St to Washington Ave 10,600 0.71 D 17,900 0.45 B -0.26 No Avocado
Blvd Washington Ave to Chase Ave 17,300 1.15 F 18,600 0.47 B -0.68 No
Cuyamaca St to Marshall Ave 9,300 0.23 A 11,600 0.29 A 0.06 No
Marshall Ave to Johnson Ave 20,800 0.52 B 22,200 0.56 C 0.04 No
Johnson Ave to Magnolia Ave 15,900 0.40 B 18,000 0.45 B 0.05 No
Magnolia Ave to Graves Ave 19,000 1.90 F 25,100 0.63 C -1.27 No
Bradley Ave
Graves Ave to 1st St 12,600 1.26 F 30,100 0.75 D -0.51 No
Pepper Dr to Persimmon Ave 24,300 0.61 C 26,400 0.66 C 0.05 No
Persimmon Ave to Broadway 32,000 0.80 D 39,000 0.98 E 0.18 Yes
Broadway to I-8 WB Ramps 33,500 0.84 D 34,700 0.87 D 0.03 No 2nd St
I-8 WB Ramps to Main St 40,500 0.81 D 41,400 0.83 D 0.02 No
El Cajon Blvd to Mollison Ave 24,400 0.61 C 26,800 0.67 C 0.06 No Chase Ave Mollison Ave to Rancho Valle
Ct 18,400 0.46 B 21,000 0.53 C 0.07 No
I-8 EB Ramps to Bermuda Ln 24,500 2.45 F 27,500 0.92 E -1.53 No
Bermuda Ln to La Cresta Rd 21,000 2.10 F 25,000 0.83 E -1.27 No
La Cresta Rd to Madison Ave 10,400 1.04 F 10,500 0.35 B -0.69 No
Madison Ave to Vista Del Escuela 2,600 0.17 A 2,800 0.09 A -0.08 No
Greenfield Dr
Vista Del Escuela to Orchard Ave 500 0.03 A 500 0.02 A -0.01 No
Encinitas
El Camino Real Encinitas Blvd to Santa Fe Dr 37,100 0.65 A - C 38,000 0.67 A-C 0.02 No

Page 38 County of San Diego General Plan Update
Traffic Impacts to Adjacent City Jurisdictions
TABLE 5.1 (Continued) SIGNIFICANT TRAFFIC IMPACTS
EXISTING COUNTY OF SAN DIEGO GENERAL PLAN VS. EXISTING CONDITIONS (Existing Plan to Ground)
Existing Existing GP Roadway Segment
ADT V/C LOS ADT V/C LOS ∆ in V/C
Significant Impact?
El Camino Real
Santa Fe Dr to Manchester Ave 26,500 0.58 A - C 27,700 0.49 A-C -0.09 No
El Camino Del Norte
Rancho Santa Fe Rd to Eastern City Limit 7,300 0.52 A - C 10,000 0.50 A-C -0.02 No
Encinitas Blvd
El Camino Real to Manchester Ave 36,200 1.03 F 36,700 1.04 F 0.01 No
I-5 NB Ramps to El Camino Real 31,600 0.70 A - C 33,800 0.59 A-C -0.11 No
Manchester Ave El Camino Real to Encinitas
Blvd 8,300 0.59 A - C 11,800 0.59 A-C 0.00 No
Rancho Santa Fe Rd
Manchester Ave to Eastern City Limit 22,700 1.14 F 23,000 1.15 F 0.01 No
Escondido
Country Club Ln to El Norte Pkwy 15,400 0.42 B 24,100 0.65 B 0.23 No
El Norte Pkwy to SR-78 WB Ramps 29,200 0.79 C 30,700 0.83 Mid
D 0.04 No
SR-78 WB Ramps to Mission Ave 34,500 0.93 E 46,700 0.93 E 0.00 No
Mission Ave to Washington Ave 24,900 0.67 C 27,800 0.56 C -0.11 No
Washington Ave to 5th Ave 23,800 0.64 B 25,200 0.68 C 0.04 No
5th Ave to 13th Ave 26,100 0.71 C 26,300 0.71 C 0.00 No
13th Ave to Felicita Ave 23,900 0.65 B 27,300 0.74 C 0.09 No
Felicita Ave to Centre City Rd 30,000 0.81 Mid D 31,000 0.84 Mid
D 0.03 No
Centre City Rd to Brotherton Rd 39,400 1.06 F 43,100 1.16 F 0.10 Yes
Centre City Pkwy
Brotherton Rd to Citracado Pkwy 32,600 0.88 D- 34,000 0.92 E 0.04 Yes
San Pasqual Valley Rd to Juniper St 13,900 0.93 E 15,700 0.46 B -0.47 No
Juniper St to Escondido Blvd 18,200 1.21 F 31,000 0.91 E -0.30 No
Escondido Blvd to Centre City Pkwy 27,000 0.79 C 29,900 0.87 D- 0.08 Yes
Felicita Ave/17th Ave
Centre City Pkwy to Quince St 23,600 1.57 F 26,300 0.77 C -0.80 No

Page 39 County of San Diego General Plan Update
Traffic Impacts to Adjacent City Jurisdictions
TABLE 5.1 (Continued) SIGNIFICANT TRAFFIC IMPACTS
EXISTING COUNTY OF SAN DIEGO GENERAL PLAN VS. EXISTING CONDITIONS (Existing Plan to Ground)
Existing Existing GP Roadway Segment
ADT V/C LOS ADT V/C LOS ∆ in V/C
Significant Impact?
Felicita Ave/17th Ave Quince St to Citracado Pkwy 14,500 0.97 E 18,300 0.54 B -0.43 No
Felicita Ave to Quiet Hills Dr 15,900 0.43 B 22,200 0.60 B 0.17 No
Quiet Hills Dr to I-15 SB Ramps 16,800 0.34 B 26,000 0.52 C 0.18 No
I-15 SB Ramps to I-15 NB Ramps 34,100 0.57 C 41,000 0.68 C 0.11 No
Via Rancho Pkwy
I-15 NB Ramps to San Pasqual Rd 32,800 0.55 C 42,300 0.71 Mid
D 0.16 No
San Pasqual Rd to Mary Ln 27,900 0.75 C 29,100 0.79 C 0.04 No
Mary Ln to Las Palmas Ave 23,000 0.62 B 25,600 0.69 C 0.07 No
Las Palmas Ave to Sunset Dr 23,200 1.55 F 26,300 0.71 C -0.84 No
Sunset Dr to El Dorado Dr 18,800 1.25 F 25,200 0.68 C -0.57 No
El Dorado Dr to San Pasqual Valley Rd 27,300 1.82 F 33,200 0.90 D- -0.92 No
San Pasqual Valley Rd to Boyle Ave 22,600 1.51 F 24,400 0.66 B -0.85 No
Boyle Ave to Hayden Dr 18,000 0.49 B 19,100 0.52 B 0.03 No
Bear Valley Pkwy
Hayden Dr to Valley Pkwy 17,300 1.15 F 17,700 0.48 B -0.67 No
Bear Valley Pkwy to Wanek Rd 29,800 0.81 Mid
D 30,100 0.50 C -0.31 No
Wanek Rd to Washington Ave 26,000 0.70 C 25,800 0.43 B -0.27 No Valley Pkwy
Washington Ave to Lake Wohlford Rd 34,200 2.28 F 48,000 0.69 C -1.59 No
San Pasqual Valley Rd Washington Ave to Birch Ave 21,200 1.41 F 22,100 0.60 B -0.81 No
San Pasqual Rd Bear Valley Pkwy to Ryan Dr 11,300 0.31 A 17,600 0.48 B 0.17 No
North Ave to Country Club Ln 6,100 0.18 A 21,700 0.63 B 0.45 No
Country Club Ln to Bahia Ln 9,000 0.60 C 14,200 0.42 B -0.18 No Broadway
Bahia Ln to El Norte Pkwy 15,900 0.46 B 22,600 0.66 B 0.20 No
La Mesa
Grossmont Blvd to Campo Rd 7,800 0.78 D 8,000 0.80 D 0.02 No Bancroft Dr Campo Rd to SR-94 WB
Ramps 11,600 1.16 F 12,300 0.41 B -0.75 No

Page 40 County of San Diego General Plan Update
Traffic Impacts to Adjacent City Jurisdictions
TABLE 5.1 (Continued) SIGNIFICANT TRAFFIC IMPACTS
EXISTING COUNTY OF SAN DIEGO GENERAL PLAN VS. EXISTING CONDITIONS (Existing Plan to Ground)
Existing Existing GP Roadway Segment
ADT V/C LOS ADT V/C LOS ∆ in V/C
Significant Impact?
La Mesa Blvd to Jackson Dr 1,700 0.17 A 2,300 0.23 A 0.06 No
Jackson Dr to Marguerita Ln 12,400 1.24 F 15,300 0.51 C -0.73 No
Marguerita Ln to Alto Dr 7,700 0.77 D 10,900 0.36 B -0.41 No
Alto Dr to Lake Helix Dr 4,500 0.45 B 6,800 0.23 A -0.22 No
Lemon Ave
Lake Helix Dr to Fuerte Dr 1,500 0.15 A 3,600 0.12 A -0.03 No
Fuerte Dr Grossmont Dr to Avocado Blvd 15,700 1.57 F 15,800 1.58 F 0.01 No
SR-125 to Bancroft Dr 10,000 1.00 F 10,100 0.67 D -0.33 No
Bancroft Dr to Camino Paz 17,000 1.70 F 17,200 0.57 C -1.13 No
Camino Paz to Kenwood Rd 12,000 1.20 F 12,300 0.41 B -0.79 No
Kenwood Rd to Conrad Dr 42,500 2.83 F 47,900 1.60 F -1.23 No
Conrad Dr to Granada Ave 20,300 1.35 F 22,300 0.74 D -0.61 No
Campo Rd
Granada Ave to Sweetwater Spring Blvd 13,100 0.87 E 18,800 0.63 C -0.24 No
Lemon Grove
Troy St Palm St to Sweetwater Rd 9,000 0.30 A 10,300 0.34 B 0.04 No
Broadway to Tyler St 18,000 1.20 F 18,000 0.60 C -0.60 No Sweetwater Rd Tyler St to Jamacha Rd 17,000 0.57 C 18,300 0.61 C 0.04 No
National City
National City Blvd to Highland Ave 7,000 0.18 A 8,100 0.20 A 0.02 No
30th St Highland Ave to N 2nd Ave 29,000 0.73 C 32,500 0.81 D 0.08 No
Euclid Ave Plaza Blvd to Sweetwater Rd 8,500 0.57 C 10,100 0.25 A -0.32 No
National City Blvd to Highland Ave 11,300 0.75 D 15,500 0.39 B -0.36 No
Plaza Blvd Highland Ave to Euclid Ave 23,600 0.59 C 26,800 0.67 C 0.08 No
Oceanside
SR-76 to Old Ranch Rd 9,500 0.19 A 32,000 0.64 B 0.45 No
Old Ranch Rd to Spur Ave 2,300 0.06 A 33,800 0.68 B 0.62 No
Spur Ave to Santa Fe Ave N/A N/A N/A 36,400 0.73 C N/A No Melrose Dr
Santa Fe Ave to Sagewood Rd 11,700 0.29 A 35,600 0.59 A 0.30 No

Page 41 County of San Diego General Plan Update
Traffic Impacts to Adjacent City Jurisdictions
TABLE 5.1 (Continued) SIGNIFICANT TRAFFIC IMPACTS
EXISTING COUNTY OF SAN DIEGO GENERAL PLAN VS. EXISTING CONDITIONS (Existing Plan to Ground)
Existing Existing GP Roadway Segment
ADT V/C LOS ADT V/C LOS ∆ in V/C
Significant Impact?
Melrose Dr Sagewood Rd to Oceanside Blvd 13,300 0.33 A 34,800 0.58 A 0.25 No
North Santa Fe Ave SR-76 to Melrose Dr 23,100 0.58 A 23,800 0.60 A 0.02 No
Poway
Spring Hurst Dr to Iola Way 36,900 0.74 C 43,300 0.87 D 0.13 No
Iola Way to Oak Knoll Rd 27,300 0.68 C 40,300 1.01 F 0.33 Yes
Oak Knoll Rd to Pomerado Rd 36,000 0.90 E 39,900 1.00 E 0.10 Yes
Pomerado Rd to Carriage Rd 33,500 0.84 D 37,800 0.95 E 0.11 Yes
Carriage Rd to Community Rd 36,500 0.91 E 40,300 1.01 F 0.10 Yes
Community Rd to Midland Rd 35,400 0.79 D 39,000 0.87 D 0.08 No
Midland Rd to Ann O Reno Ln 24,500 0.61 C 28,200 0.71 C 0.10 No
Ann O Reno Ln to Garden Rd 12,500 0.31 A 18,600 0.47 B 0.16 No
Garden Rd to Silver Ridge Rd 17,000 1.13 F 14,000 0.93 E -0.20 No
Silver Ridge Rd to Espola Rd 12,900 0.86 D 13,700 0.91 E 0.05 Yes
Poway Rd
Espola Rd to SR-67 18,800 1.88 F 21,200 2.12 F 0.24 Yes
Springbrook Dr to Community Rd 49,400 0.82 C 58,000 0.97 E 0.15 Yes
Community Rd to Danielson St 19,600 0.33 A 36,000 0.60 C 0.27 No
Scripps Poway Pkwy
Danielson St to SR-67 19,200 0.48 B 36,500 0.61 C 0.13 No
Pomerado Rd to Ted William Pkwy 37,700 0.94 E 41,500 0.69 C -0.25 No
Ted William Pkwy to Community Rd 44,000 1.10 F 51,500 0.86 D -0.24 No
Community Rd to Tierra Bonita Rd 29,000 0.73 C 34,300 0.86 D 0.13 No
Twin Peaks Rd
Tierra Bonita Rd to Espola Rd 24,200 0.61 C 29,400 0.74 C 0.13 No
Espola Rd Twin Peaks to Poway Rd 18,000 1.80 F 24,600 0.82 D -0.98 No
Highland Ranch Rd to Pomerado Rd 31,200 0.52 B 42,500 0.71 C 0.19 No
Ted Williams Pkwy Pomerado Rd to Twin Peaks
Rd 18,800 0.47 B 20,100 0.34 A -0.13 No

Page 42 County of San Diego General Plan Update
Traffic Impacts to Adjacent City Jurisdictions
TABLE 5.1 (Continued) SIGNIFICANT TRAFFIC IMPACTS
EXISTING COUNTY OF SAN DIEGO GENERAL PLAN VS. EXISTING CONDITIONS (Existing Plan to Ground)
Existing Existing GP Roadway Segment
ADT V/C LOS ADT V/C LOS ∆ in V/C
Significant Impact?
San Diego
Camino del Norte Camino San Bernardo to I-15 35,900 0.60 C 54,000 0.90 D 0.30 No
Via Del Campo to W. Bernardo Dr 23,700 0.59 C 36,700 0.92 E 0.33 Yes Rancho
Bernardo Rd W. Bernardo Dr to I-15 47,400 1.19 F 56,900 1.42 F 0.23 Yes
I-15 to Spring Canyon Rd 52,900 0.88 D 61,300 1.02 F 0.14 Yes Scripps
Poway Pkwy Spring Canyon Rd to Springbrook Dr 25,900 0.65 C 29,600 0.74 C 0.09 No
Jimmy Durante Blvd to I-15 NB Ramps 31,200 0.78 D 37,900 0.95 E 0.17 Yes
I-15 NB Ramps to San Andres Dr 37,700 0.94 E 40,200 1.01 F 0.07 Yes Via de la
Valle
San Andres Dr to El Camino Real 22,500 2.25 F 27,100 2.71 F 0.46 Yes
Airway Rd Michael Faraday Dr to SR-905 6,600 0.66 C 16,100 1.61 F 0.95 Yes
La Media Rd to SR-125 10,900 0.22 A 18,000 0.36 A 0.14 No Siempre Viva Rd SR-125 to Enrico Fermi Dr 19,400 0.39 A 50,700 1.01 F 0.62 Yes
San Marcos
Borden Rd to Avenida Azul 6,300 0.16 A 21,400 0.54 C 0.38 No
Avenida Azul to Mission Rd 8,900 0.18 A 28,100 0.56 C 0.38 No
Mission Rd to SR-78 WB Ramps 24,300 0.49 B 35,400 0.71 D 0.22 No
SR-78 WB Ramps to Grand Ave 37,700 0.75 D 55,500 1.11 F 0.36 Yes
Grand Ave to Vista Dr 15,900 0.53 C 31,000 1.03 F 0.50 Yes
Vista Dr to Stone Dr 12,100 0.40 B 25,100 0.84 E 0.44 Yes
Las Posas Rd
Stone Dr to San Marcos Blvd 9,900 0.33 A 21,100 0.70 D 0.37 No
Deer Springs Rd to Buena Creek Rd 16,800 1.12 F 22,000 0.73 D -0.39 No Twin Oaks
Valley Rd Buena Creek Rd to Olive St 11,800 0.79 D 20,900 0.52 B -0.27 No
La Cieniega Rd
Twin Oak Valley Rd to Mulberry Dr 5,100 0.34 B 6,300 0.21 A -0.13 No
Mulberry Dr Olive St to La Cieniega Rd 1,800 0.12 A 6,200 0.21 A 0.09 No

Page 43 County of San Diego General Plan Update
Traffic Impacts to Adjacent City Jurisdictions
TABLE 5.1 (Continued) SIGNIFICANT TRAFFIC IMPACTS
EXISTING COUNTY OF SAN DIEGO GENERAL PLAN VS. EXISTING CONDITIONS (Existing Plan to Ground)
Existing Existing GP Roadway Segment
ADT V/C LOS ADT V/C LOS ∆ in V/C
Significant Impact?
Santee
Medina Dr to Halberns Blvd 21,000 0.53 C 22,400 0.56 C 0.03 No
Halberns Blvd to Shirley Garden 22,000 0.55 C 23,200 0.58 C 0.03 No
Shirley Garden to Magnolia Ave 21,700 0.72 D 25,900 0.86 E 0.14 Yes
Magnolia Ave to Los Ranchitos Rd 7,300 0.73 C 18,800 0.47 B -0.26 No
west of Pine Grove 5,000 0.13 A 24,500 0.61 C 0.48 No
Mast Blvd
Pine Grove to Riverford Rd 7,000 0.18 A 11,300 0.28 A 0.10 No
Cuyamaca St to Magnolia Ave 4,500 0.45 B 5,500 0.55 C 0.10 No El Nopal
Magnolia Ave to Aquila Dr 8,900 0.59 C 10,400 0.69 D 0.10 No
Magnolia Ave to SR-67 32,000 0.80 D 37,700 0.94 E 0.14 Yes
SR-67 to Shadow Hill Rd 16,000 1.07 F 23,600 0.59 C -0.48 No
Shadow Hill Rd to Northcode Rd 7,000 0.47 C 8,400 0.56 C 0.09 No
Northcode Rd to Security Way 5,000 0.50 B 7,000 0.18 A -0.32 No
Security Way to SR-67 10,000 1.00 F 18,600 0.47 B -0.53 No
Woodside Ave
SR-67 to Riverford Rd 21,800 2.18 F 31,400 0.79 D -1.39 No
Solana Beach
Ocean St to Lomas Santa Fe Dr 29,900 0.75 C 34,100 0.85 D 0.10 No
Highway 101 Lomas Santa Fe Dr to Via De la Valle 19,900 0.50 B 25,500 0.64 C 0.14 No
Highway 101 to Stevens Ave 11,900 0.30 A 16,500 0.41 B 0.11 No
Stevens Ave to Solana Hills Dr 17,800 0.45 B 22,100 0.55 C 0.10 No
Solana Hills Dr to I-5 SB Ramps 31,700 0.79 D 37,600 0.94 E 0.15 Yes
I-5 SB Ramps to Via Mil Cumbres 28,300 0.71 C 36,100 0.90 E 0.19 Yes
Lomas Santa Fe Dr
Via Mil Cumbres to Highland Dr 8,900 0.22 A 16,100 0.40 B 0.18 No
Steven Ave Lomas Santa Fe Dr to Academy Dr 13,000 0.43 B 19,300 0.64 C 0.21 No

Page 44 County of San Diego General Plan Update
Traffic Impacts to Adjacent City Jurisdictions
TABLE 5.1 (Continued) SIGNIFICANT TRAFFIC IMPACTS
EXISTING COUNTY OF SAN DIEGO GENERAL PLAN VS. EXISTING CONDITIONS (Existing Plan to Ground)
Existing Existing GP Roadway Segment
ADT V/C LOS ADT V/C LOS ∆ in V/C
Significant Impact?
Academy Dr to La Colonia Park 11,900 1.19 F 13,200 0.44 B -0.75 No
La Colonia Park to Nardo Ave 11,900 0.40 B 13,200 0.44 B 0.04 No Steven Ave
Nardo Ave to Valley Ave 11,000 0.37 B 16,100 0.54 C 0.17 No
Valley Ave Stevens Ave to Via De la Valle 13,000 0.87 F 21,300 0.71 D -0.16 No
Highland Dr El Camino Real to San Andres Dr 5,000 0.50 B 5,500 0.55 C 0.05 No
Vista
Sycamore Ave
SR-78 EB Ramps to Hibiscus Way 48,900 0.82 D 57,300 0.96 E 0.14 Yes
South Santa Fe Ave to Cypress Ave 8,700 0.99 E 15,600 0.39 A -0.60 No Monte Vista
Dr Cypress Ave to Foothill Dr 4,800 0.55 A 11,100 0.28 A -0.27 No
Source: Wilson & Company; January 2009 Notes: Bold letters indicate substandard LOS. ∆ in V/C = The change in the volume to capacity ratio between the two scenarios. N/A = This segment does not currently exist. Table 5.2 summarizes the results of Table 5.1 by identifying the number of significantly impacted roadway segments in the adjacent incorporated jurisdictions based upon the comparison of the future year buildout of the existing County of San Diego General Plan to Existing Conditions. As shown, a total of 33 roadway segments are identified as being significantly impacted under this scenario.

Page 45 County of San Diego General Plan Update
Traffic Impacts to Adjacent City Jurisdictions
TABLE 5.2 SUMMARY OF SIGNIFICANT IMPACTED SEGMENTS
EXISTING COUNTY OF SAN DIEGO GENERAL PLAN VS. EXISTING CONDITIONS (Existing Plan to Ground)
Jurisdiction Total Number Analyzed Number of Significantly Impacted Segments
Carlsbad 9 0
Chula Vista 13 5
Del Mar 1 0
El Cajon 31 2
Encinitas 7 0
Escondido 35 3
La Mesa 14 0
Lemon Grove 3 0
National City 5 0
Oceanside 6 (5 under Existing) 0
Poway 21 7
San Diego 11 8
San Marcos 11 3
Santee 14 2
Solana Beach 13 2
Vista 3 1
Total 197 (196 under Existing) 33 Source: Wilson & Company; January 2009
5.2 Comparison of Proposed County of San Diego General Plan Update (Referral
Map) to Existing Conditions
Table 5.3 compares projected roadway performance on the key roadway segments within the adjacent incorporated jurisdictions under the proposed County of San Diego General Plan Update (Referral Map) to Existing conditions, and displays the resulting significant impacts.

Page 46 County of San Diego General Plan Update
Traffic Impacts to Adjacent City Jurisdictions
TABLE 5.3 SIGNIFICANT TRAFFIC IMPACTS
COUNTY OF SAN DIEGO GENERAL PLAN UPDATE (REFERRAL MAP) VS. EXISTING CONDITIONS (Proposed Plan to Ground)
Existing GP Update
Roadway Segment ADT V/C LOS ADT V/C LOS
∆ in V/C
Significant Impact?
Carlsbad
I-5 NB Ramps to Paseo Del Norte 22,200 0.56 C 27,000 0.68 C 0.12 No
Paseo Del Norte to Car Country Dr 8,100 0.20 A 14,400 0.36 A 0.16 No
Car Country Dr to Faraday Ave 14,200 0.36 A 28,500 0.71 C 0.35 No
Faraday Ave to El Camino Real 9,100 0.23 A 22,700 0.57 C 0.34 No
El Camino Real to College Blvd 9,100 0.61 C 19,300 0.48 B -0.13 No
Leisure Village Dr to Shadowridge Dr 4,100 0.10 A 24,000 0.60 C 0.50 No
Shadowridge Dr to Lake Blvd 9,700 0.24 A 21,600 0.54 C 0.30 No
Lake Blvd to Melrose Dr 15,700 0.39 B 26,300 0.66 C 0.27 No
Cannon Rd
Melrose Dr to Mar Vista Dr 400 0.01 A 12,500 0.31 A 0.30 No
Chula Vista
Heritage Rd Main Street to Chula Vista City Limit 14,800 0.24 A 21,000 0.34 A 0.10 No
Telegraph Canyon Rd to Palomar St 19,200 0.31 A 28,100 0.45 A 0.14 No
Palomar St to Olympic Pkwy 3,900 0.06 A 14,600 0.23 A 0.17 No
Olympic Pkwy to Santa Venetia St 1,200 0.02 A 19,500 0.31 A 0.29 No
La Media Rd
Santa Venetia St to Birch Rd 1,900 0.03 A 24,700 0.40 A 0.37 No
Proctor Valley Rd
Northwoods Dr to Chula Vista City Limit 700 0.07 A 7,700 0.21 A 0.14 No
Otay Lakes Rd
Wueste Rd to Chula Vista City Limit 3,200 0.34 A 27,500 0.44 A 0.10 No
Willow St Sweetwater Rd to Bonita Rd 17,000 1.81 F 18,500 0.49 A -1.32 No
Bonita Glen Dr to I-805 SB Ramps 34,300 0.91 E 37,800 1.01 F 0.10 Yes
I-805 SB Ramps to I-805 NB Ramps 54,000 1.44 F 55,500 1.48 F 0.04 Yes Bonita Rd
I-805 NB Ramps to Plaza Bonita Rd 42,400 1.13 F 43,500 1.16 F 0.03 Yes

Page 47 County of San Diego General Plan Update
Traffic Impacts to Adjacent City Jurisdictions
TABLE 5.3 (Continued) SIGNIFICANT TRAFFIC IMPACTS
COUNTY OF SAN DIEGO GENERAL PLAN UPDATE (REFERRAL MAP) VS. EXISTING CONDITIONS (Proposed Plan to Ground)
Existing GP Update Roadway Segment
ADT V/C LOS ADT V/C LOS ∆ in V/C
Significant Impact?
Plaza Bonita Rd to Willow St 30,300 0.81 D 33,900 0.90 E 0.09 Yes Bonita Rd Willow St to Chula Vista City
Limit 32,500 0.87 D 39,000 1.04 F 0.17 Yes
Del Mar
Via de la Valle
Highway 101 to Jimmy Durante Blvd 40,000 0.61 C 25700 0.64 C 0.03 No
El Cajon
Main St to Granite Hill Dr 35,000 0.88 E 37,000 0.93 E 0.05 Yes Jamacha Rd
Granite Hill Dr to Grove Rd 28,000 0.70 C 28,500 0.71 C 0.01 No
El Cajon Blvd to 1st St 24,500 0.61 C 25,200 0.63 C 0.02 No
1st St to Jamacha Rd 22,000 0.55 C 22,500 0.56 C 0.01 No
Jamacha Rd to 3rd St 14,000 0.35 A 16,600 0.42 B 0.07 No
3rd St to Wichita Ave 16,400 0.41 B 18,100 0.45 B 0.04 No
Washington Ave
Wichita Ave to Granite Hill Dr 12,400 0.31 A 13,700 0.34 A 0.03 No
Magnolia Ave to Ballantyne St 14,600 0.37 A 14,900 0.37 A 0.00 No
Ballantyne St to Mollison Ave 15,500 0.39 B 18,000 0.45 B 0.06 No
Mollison Ave to 1st St 19,600 0.49 B 23,800 0.60 C 0.11 No
1st St to Orlando St 16,500 0.41 B 17,900 0.45 B 0.04 No
Orlando St to Madison Ave 20,400 0.51 B 23,400 0.59 C 0.08 No
Main St
Madison Ave to I-8 EB Ramps 11,700 0.29 A 12,500 0.31 A 0.02 No
Main St to Washington Ave 10,600 0.71 D 17,500 0.44 B -0.27 No Avocado
Blvd Washington Ave to Chase Ave 17,300 1.15 F 18,100 0.45 B -0.70 No
Cuyamaca St to Marshall Ave 9,300 0.23 A 10,900 0.27 A 0.04 No
Marshall Ave to Johnson Ave 20,800 0.52 B 21,200 0.53 C 0.01 No
Johnson Ave to Magnolia Ave 15,900 0.40 B 16,700 0.42 B 0.02 No
Magnolia Ave to Graves Ave 19,000 1.90 F 26,400 0.66 C -1.24 No
Bradley Ave
Graves Ave to 1st St 12,600 1.26 F 29,900 0.75 C -0.51 No
Pepper Dr to Persimmon Ave 24,300 0.61 C 25,900 0.65 C 0.04 No
Persimmon Ave to Broadway 32,000 0.80 D 36,100 0.90 E 0.10 Yes
Broadway to I-8 WB Ramps 33,500 0.84 D 38,900 0.97 E 0.13 Yes 2nd St
I-8 WB Ramps to Main St 40,500 0.81 D 42,900 0.86 D 0.05 No

Page 48 County of San Diego General Plan Update
Traffic Impacts to Adjacent City Jurisdictions
TABLE 5.3 (Continued) SIGNIFICANT TRAFFIC IMPACTS
COUNTY OF SAN DIEGO GENERAL PLAN UPDATE (REFERRAL MAP) VS. EXISTING CONDITIONS (Proposed Plan to Ground)
Existing GP Update Roadway Segment
ADT V/C LOS ADT V/C LOS ∆ in V/C
Significant Impact?
El Cajon Blvd to Mollison Ave 24,400 0.61 C 25,600 0.64 C 0.03 No Chase Ave Mollison Ave to Rancho Valle
Ct 18,400 0.46 B 19,600 0.49 B 0.03 No
I-8 EB Ramps to Bermuda Ln 24,500 2.45 F 26,000 0.87 E -1.58 No
Bermuda Ln to La Cresta Rd 21,000 2.10 F 24,800 0.83 D -1.27 No
La Cresta Rd to Madison Ave 10,400 1.04 F 10,600 0.35 B -0.69 No
Madison Ave to Vista Del Escuela 2,600 0.17 A 2,800 0.09 A -0.08 No
Greenfield Dr
Vista Del Escuela to Orchard Ave 500 0.03 A 500 0.02 A -0.01 No
Encinitas
Encinitas Blvd to Santa Fe Dr 37,100 0.67 A - C 37,600 0.66 A-C -0.01 No El Camino
Real Santa Fe Dr to Manchester Ave 26,500 0.49 A - C 27,200 0.48 A-C -0.01 No
El Camino Del Norte
Rancho Santa Fe Rd to Eastern City Limit 7,300 0.50 A - C 10,100 0.51 A-C 0.01 No
Encinitas Blvd
El Camino Real to Manchester Ave 36,200 1.04 F 36,900 1.05 F 0.01 No
I-5 NB Ramps to El Camino Real 31,600 0.59 A - C 33,000 0.58 A-C -0.01 No
Manchester Ave El Camino Real to Encinitas
Blvd 8,300 0.59 A - C 11,900 0.60 A-C 0.01 No
Rancho Santa Fe Rd
Manchester Ave to Eastern City Limit 22,700 1.15 F 24,500 1.23 F 0.08 Yes
Escondido
Country Club Ln to El Norte Pkwy 15,400 0.42 B 23,100 0.62 B 0.20 No
El Norte Pkwy to SR-78 WB Ramps 29,200 0.79 C 28,600 0.77 C -0.02 No
SR-78 WB Ramps to Mission Ave 34,500 0.93 E 43,500 0.87 E -0.06 No
Mission Ave to Washington Ave 24,900 0.67 C 26,500 0.53 C -0.14 No
Washington Ave to 5th Ave 23,800 0.64 B 23,800 0.64 B 0.00 No
5th Ave to 13th Ave 26,100 0.71 C 25,500 0.69 C -0.02 No
Centre City Pkwy
13th Ave to Felicita Ave 23,900 0.65 B 26,400 0.71 C 0.06 No

Page 49 County of San Diego General Plan Update
Traffic Impacts to Adjacent City Jurisdictions
TABLE 5.3 (Continued) SIGNIFICANT TRAFFIC IMPACTS
COUNTY OF SAN DIEGO GENERAL PLAN UPDATE (REFERRAL MAP) VS. EXISTING CONDITIONS (Proposed Plan to Ground)
Existing GP Update Roadway Segment
ADT V/C LOS ADT V/C LOS ∆ in V/C
Significant Impact?
Felicita Ave to Centre City Rd 30,000 0.81 Mid D 31,100 0.84 Mid
D 0.03 No
Centre City Rd to Brotherton Rd 39,400 1.06 F 43,400 1.17 F 0.11 Yes Centre City
Pkwy
Brotherton Rd to Citracado Pkwy 32,600 0.88 D- 34,200 0.92 E 0.04 Yes
San Pasqual Valley Rd to Juniper St 13,900 0.93 E 23,600 0.69 C -0.24 No
Juniper St to Escondido Blvd 18,200 1.21 F 33,500 0.98 E -0.23 No
Escondido Blvd to Centre City Pkwy 27,000 0.79 C 29,700 0.87 D- 0.08 Yes
Centre City Pkwy to Quince St 23,600 1.57 F 25,800 0.75 C -0.82 No
Felicita Ave/17th Ave
Quince St to Citracado Pkwy 14,500 0.97 E 17,700 0.52 B -0.45 No
Felicita Ave to Quiet Hills Dr 15,900 0.43 B 23,100 0.62 B 0.19 No
Quiet Hills Dr to I-15 SB Ramps 16,800 0.34 B 27,500 0.55 C 0.21 No
I-15 SB Ramps to I-15 NB Ramps 34,100 0.57 C 43,000 0.72 Mid
D 0.15 No Via Rancho
Pkwy
I-15 NB Ramps to San Pasqual Rd 32,800 0.55 C 42,100 0.70 Mid
D 0.15 No
San Pasqual Rd to Mary Ln 27,900 0.75 C 35,300 0.95 E 0.20 Yes
Mary Ln to Las Palmas Ave 23,000 0.62 B 30,400 0.82 Mid D 0.20 No
Las Palmas Ave to Sunset Dr 23,200 1.55 F 30,800 0.83 Mid D -0.72 No
Sunset Dr to El Dorado Dr 18,800 1.25 F 28,600 0.77 C -0.48 No
El Dorado Dr to San Pasqual Valley Rd 27,300 1.82 F 36,000 0.97 E -0.85 No
San Pasqual Valley Rd to Boyle Ave 22,600 1.51 F 28,100 0.76 C -0.75 No
Boyle Ave to Hayden Dr 18,000 0.49 B 23,800 0.64 B 0.15 No
Bear Valley Pkwy
Hayden Dr to Valley Pkwy 17,300 1.15 F 24,000 0.65 B -0.50 No
Bear Valley Pkwy to Wanek Rd 29,800 0.81 Mid
D 33,700 0.56 C -0.25 No Valley Pkwy
Wanek Rd to Washington Ave 26,000 0.70 C 29,200 0.49 B -0.21 No

Page 50 County of San Diego General Plan Update
Traffic Impacts to Adjacent City Jurisdictions
TABLE 5.3 (Continued) SIGNIFICANT TRAFFIC IMPACTS
COUNTY OF SAN DIEGO GENERAL PLAN UPDATE (REFERRAL MAP) VS. EXISTING CONDITIONS (Proposed Plan to Ground)
Existing GP Update Roadway Segment
ADT V/C LOS ADT V/C LOS ∆ in V/C
Significant Impact?
Valley Pkwy Washington Ave to Lake Wohlford Rd 34,200 2.28 F 53,400 0.76 Mid
D -1.52 No
San Pasqual Valley Rd Washington Ave to Birch Ave 21,200 1.41 F 24,100 0.65 B -0.76 No
San Pasqual Rd Bear Valley Pkwy to Ryan Dr 11,300 0.31 A 12,300 0.33 A 0.02 No
North Ave to Country Club Ln 6,100 0.18 A 15,400 0.45 B 0.27 No
Country Club Ln to Bahia Ln 9,000 0.60 C 16,000 0.47 B -0.13 No Broadway
Bahia Ln to El Norte Pkwy 15,900 0.46 B 20,100 0.59 B 0.13 No
La Mesa
Grossmont Blvd to Campo Rd 7,800 0.78 D 8,000 0.80 D 0.02 No Bancroft Dr Campo Rd to SR-94 WB
Ramps 11,600 1.16 F 12,700 0.42 B -0.74 No
La Mesa Blvd to Jackson Dr 1,700 0.17 A 2,100 0.21 A 0.04 No
Jackson Dr to Marguerita Ln 12,400 1.24 F 14,000 0.47 C -0.77 No
Marguerita Ln to Alto Dr 7,700 0.77 D 9,500 0.32 A -0.45 No
Alto Dr to Lake Helix Dr 4,500 0.45 B 5,800 0.19 A -0.26 No
Lemon Ave
Lake Helix Dr to Fuerte Dr 1,500 0.15 A 2,700 0.09 A -0.06 No
Fuerte Dr Grossmont Dr to Avocado Blvd 15,700 1.57 F 18,500 1.85 F 0.28 Yes
SR-125 to Bancroft Dr 10,000 1.00 F 10,700 0.71 D -0.29 No
Bancroft Dr to Camino Paz 17,000 1.70 F 17,600 0.59 C -1.11 No
Camino Paz to Kenwood Rd 12,000 1.20 F 12,400 0.41 B -0.79 No
Kenwood Rd to Conrad Dr 42,500 2.83 F 47,500 1.58 F -1.25 No
Conrad Dr to Granada Ave 20,300 1.35 F 20,300 0.68 D -0.67 No
Campo Rd
Granada Ave to Sweetwater Spring Blvd 13,100 0.87 E 17,800 0.59 C -0.28 No
Lemon Grove
Troy St Palm St to Sweetwater Rd 9,000 0.30 A 9,700 0.32 A 0.02 No
Broadway to Tyler St 18,000 1.20 F 19,200 0.64 C -0.56 No Sweetwater Rd Tyler St to Jamacha Rd 17,000 0.57 C 21,100 0.70 D 0.13 No
National City
30th St National City Blvd to Highland Ave 7,000 0.18 A 8,000 0.20 A 0.02 No

Page 51 County of San Diego General Plan Update
Traffic Impacts to Adjacent City Jurisdictions
TABLE 5.3 (Continued) SIGNIFICANT TRAFFIC IMPACTS
COUNTY OF SAN DIEGO GENERAL PLAN UPDATE (REFERRAL MAP) VS. EXISTING CONDITIONS (Proposed Plan to Ground)
Existing GP Update Roadway Segment
ADT V/C LOS ADT V/C LOS ∆ in V/C
Significant Impact?
30th St Highland Ave to N 2nd Ave 29,000 0.73 C 33,200 0.83 D 0.10 No
Euclid Ave Plaza Blvd to Sweetwater Rd 8,500 0.57 C 10,100 0.25 A -0.32 No
National City Blvd to Highland Ave 11,300 0.75 D 16,000 0.40 B -0.35 No
Plaza Blvd Highland Ave to Euclid Ave 23,600 0.59 C 26,600 0.67 C 0.08 No
Oceanside
SR-76 to Old Ranch Rd 9,500 0.19 A 24,700 0.49 A 0.30 No
Old Ranch Rd to Spur Ave 2,300 0.06 A 26,800 0.54 A 0.48 No
Spur Ave to Santa Fe Ave N/A N/A N/A 30,300 0.61 B N/A No
Santa Fe Ave to Sagewood Rd 11,700 0.29 A 27,100 0.45 A 0.16 No
Melrose Dr
Sagewood Rd to Oceanside Blvd 13,300 0.33 A 27,600 0.46 A 0.13 No
North Santa Fe Ave SR-76 to Melrose Dr 23,100 0.58 A 23,200 0.58 A 0.00 No
Poway
Spring Hurst Dr to Iola Way 36,900 0.74 C 42,800 0.86 D 0.12 No
Iola Way to Oak Knoll Rd 27,300 0.68 C 40,000 1.00 F 0.32 Yes
Oak Knoll Rd to Pomerado Rd 36,000 0.90 E 39,600 0.99 E 0.09 Yes
Pomerado Rd to Carriage Rd 33,500 0.84 D 37,500 0.94 E 0.10 Yes
Carriage Rd to Community Rd 36,500 0.91 E 40,000 1.00 F 0.09 Yes
Community Rd to Midland Rd 35,400 0.79 D 38,700 0.86 D 0.07 No
Midland Rd to Ann O Reno Ln 24,500 0.61 C 27,600 0.69 C 0.08 No
Ann O Reno Ln to Garden Rd 12,500 0.31 A 18,000 0.45 B 0.14 No
Garden Rd to Silver Ridge Rd 17,000 1.13 F 13,200 0.88 E -0.25 No
Silver Ridge Rd to Espola Rd 12,900 0.86 D 12,600 0.84 D -0.02 No
Poway Rd
Espola Rd to SR-67 18,800 1.88 F 20,100 2.01 F 0.13 Yes
Springbrook Dr to Community Rd 49,400 0.82 C 56,600 0.94 E 0.12 Yes
Community Rd to Danielson St 19,600 0.33 A 35,400 0.59 C 0.26 No
Scripps Poway Pkwy
Danielson St to SR-67 19,200 0.48 B 36,000 0.60 C 0.12 No
Twin Peaks Rd
Pomerado Rd to Ted William Pkwy 37,700 0.94 E 40,000 0.67 C -0.27 No

Page 52 County of San Diego General Plan Update
Traffic Impacts to Adjacent City Jurisdictions
TABLE 5.3 (Continued) SIGNIFICANT TRAFFIC IMPACTS
COUNTY OF SAN DIEGO GENERAL PLAN UPDATE (REFERRAL MAP) VS. EXISTING CONDITIONS (Proposed Plan to Ground)
Existing GP Update Roadway Segment
ADT V/C LOS ADT V/C LOS ∆ in V/C
Significant Impact?
Ted William Pkwy to Community Rd 44,000 1.10 F 50,000 0.83 D -0.27 No
Community Rd to Tierra Bonita Rd 29,000 0.73 C 32,800 0.82 D 0.09 No
Twin Peaks Rd
Tierra Bonita Rd to Espola Rd 24,200 0.61 C 27,900 0.70 C 0.09 No
Espola Rd Twin Peaks to Poway Rd 18,000 1.80 F 23,100 0.77 D -1.03 No
Highland Ranch Rd to Pomerado Rd 31,200 0.52 B 43,000 0.72 C 0.20 No
Ted Williams Pkwy Pomerado Rd to Twin Peaks
Rd 18,800 0.47 B 20,500 0.34 A -0.13 No
San Diego
Camino del Norte Camino San Bernardo to I-15 35,900 0.60 C 36,200 0.60 C 0.00 No
Via Del Campo to W. Bernardo Dr 23,700 0.59 C 35,800 0.90 E 0.31 Yes Rancho
Bernardo Rd W. Bernardo Dr to I-15 47,400 1.19 F 56,100 1.40 F 0.21 Yes
I-15 to Spring Canyon Rd 52,900 0.88 D 61,600 1.03 F 0.15 Yes Scripps
Poway Pkwy Spring Canyon Rd to Springbrook Dr 25,900 0.65 C 30,800 0.77 D 0.12 No
Jimmy Durante Blvd to I-15 NB Ramps 31,200 0.78 D 31,700 0.79 D 0.01 No
I-15 NB Ramps to San Andres Dr 37,700 0.94 E 43,100 1.08 F 0.14 Yes Via de la
Valle
San Andres Dr to El Camino Real 22,500 2.25 F 26,500 2.65 F 0.40 Yes
Airway Rd Michael Faraday Dr to SR-905 6,600 0.66 C 17,500 1.75 F 1.09 Yes
La Media Rd to SR-125 10,900 0.22 A 19,500 0.39 A 0.17 No Siempre Viva Rd SR-125 to Enrico Fermi Dr 19,400 0.39 A 59,300 1.19 F 0.80 Yes
San Marcos
Borden Rd to Avenida Azul 6,300 0.16 A 20,300 0.51 B 0.35 No
Avenida Azul to Mission Rd 8,900 0.18 A 27,300 0.55 B 0.37 No
Mission Rd to SR-78 WB Ramps 24,300 0.49 B 37,300 0.75 D 0.26 No
Las Posas Rd
SR-78 WB Ramps to Grand Ave 37,700 0.75 D 56,500 1.13 F 0.38 Yes

Page 53 County of San Diego General Plan Update
Traffic Impacts to Adjacent City Jurisdictions
TABLE 5.3 (Continued) SIGNIFICANT TRAFFIC IMPACTS
COUNTY OF SAN DIEGO GENERAL PLAN UPDATE (REFERRAL MAP) VS. EXISTING CONDITIONS (Proposed Plan to Ground)
Existing GP Update Roadway Segment
ADT V/C LOS ADT V/C LOS ∆ in V/C
Significant Impact?
Grand Ave to Vista Dr 15,900 0.53 C 31,500 1.05 F 0.52 Yes
Vista Dr to Stone Dr 12,100 0.40 B 25,600 0.85 E 0.45 Yes Las Posas Rd
Stone Dr to San Marcos Blvd 9,900 0.33 A 21,400 0.71 D 0.38 No
Deer Springs Rd to Buena Creek Rd 16,800 1.12 F 25,000 0.83 E -0.29 No Twin Oaks
Valley Rd Buena Creek Rd to Olive St 11,800 0.79 D 20,100 0.50 B -0.29 No
La Cieniega Rd
Twin Oak Valley Rd to Mulberry Dr 5,100 0.34 B 5,600 0.19 A -0.15 No
Mulberry Dr Olive St to La Cieniega Rd 1,800 0.12 A 3,700 0.12 A 0.00 No
Santee
Medina Dr to Halberns Blvd 21,000 0.53 C 22,000 0.55 C 0.02 No
Halberns Blvd to Shirley Garden 22,000 0.55 C 25,300 0.63 C 0.08 No
Shirley Garden to Magnolia Ave 21,700 0.72 D 27,400 0.91 E 0.19 Yes
Magnolia Ave to Los Ranchitos Rd 7,300 0.73 C 20,000 0.50 B -0.23 No
west of Pine Grove 5,000 0.13 A 24,800 0.62 C 0.49 No
Mast Blvd
Pine Grove to Riverford Rd 7,000 0.18 A 11,400 0.29 D 0.11 No
Cuyamaca St to Magnolia Ave 4,500 0.45 B 5,700 0.57 C 0.12 No El Nopal
Magnolia Ave to Aquila Dr 8,900 0.59 C 10,800 0.72 D 0.13 No
Magnolia Ave to SR-67 32,000 0.80 D 37,400 0.94 E 0.14 Yes
SR-67 to Shadow Hill Rd 16,000 1.07 F 22,500 0.56 C -0.51 No
Shadow Hill Rd to Northcode Rd 7,000 0.47 C 7,300 0.49 C 0.02 No
Northcode Rd to Security Way 5,000 0.50 B 6,000 0.15 A -0.35 No
Security Way to SR-67 10,000 1.00 F 16,800 0.42 B -0.58 No
Woodside Ave
SR-67 to Riverford Rd 21,800 2.18 F 29,700 0.74 C -1.44 No
Solana Beach
Ocean St to Lomas Santa Fe Dr 29,900 0.75 C 34,600 0.87 D 0.12 No
Highway 101 Lomas Santa Fe Dr to Via De la Valle 19,900 0.50 B 24,000 0.60 C 0.10 No
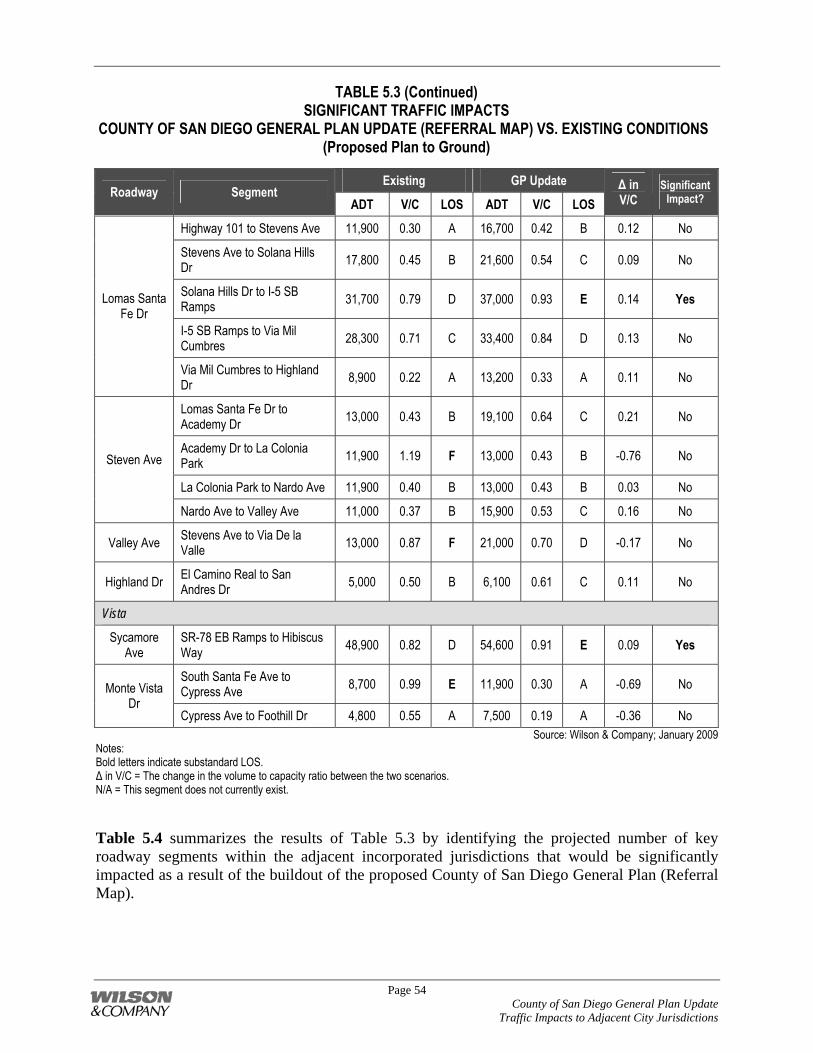
Page 54 County of San Diego General Plan Update
Traffic Impacts to Adjacent City Jurisdictions
TABLE 5.3 (Continued) SIGNIFICANT TRAFFIC IMPACTS
COUNTY OF SAN DIEGO GENERAL PLAN UPDATE (REFERRAL MAP) VS. EXISTING CONDITIONS (Proposed Plan to Ground)
Existing GP Update Roadway Segment
ADT V/C LOS ADT V/C LOS ∆ in V/C
Significant Impact?
Highway 101 to Stevens Ave 11,900 0.30 A 16,700 0.42 B 0.12 No
Stevens Ave to Solana Hills Dr 17,800 0.45 B 21,600 0.54 C 0.09 No
Solana Hills Dr to I-5 SB Ramps 31,700 0.79 D 37,000 0.93 E 0.14 Yes
I-5 SB Ramps to Via Mil Cumbres 28,300 0.71 C 33,400 0.84 D 0.13 No
Lomas Santa Fe Dr
Via Mil Cumbres to Highland Dr 8,900 0.22 A 13,200 0.33 A 0.11 No
Lomas Santa Fe Dr to Academy Dr 13,000 0.43 B 19,100 0.64 C 0.21 No
Academy Dr to La Colonia Park 11,900 1.19 F 13,000 0.43 B -0.76 No
La Colonia Park to Nardo Ave 11,900 0.40 B 13,000 0.43 B 0.03 No
Steven Ave
Nardo Ave to Valley Ave 11,000 0.37 B 15,900 0.53 C 0.16 No
Valley Ave Stevens Ave to Via De la Valle 13,000 0.87 F 21,000 0.70 D -0.17 No
Highland Dr El Camino Real to San Andres Dr 5,000 0.50 B 6,100 0.61 C 0.11 No
Vista
Sycamore Ave
SR-78 EB Ramps to Hibiscus Way 48,900 0.82 D 54,600 0.91 E 0.09 Yes
South Santa Fe Ave to Cypress Ave 8,700 0.99 E 11,900 0.30 A -0.69 No Monte Vista
Dr Cypress Ave to Foothill Dr 4,800 0.55 A 7,500 0.19 A -0.36 No
Source: Wilson & Company; January 2009 Notes: Bold letters indicate substandard LOS. ∆ in V/C = The change in the volume to capacity ratio between the two scenarios. N/A = This segment does not currently exist. Table 5.4 summarizes the results of Table 5.3 by identifying the projected number of key roadway segments within the adjacent incorporated jurisdictions that would be significantly impacted as a result of the buildout of the proposed County of San Diego General Plan (Referral Map).

Page 55 County of San Diego General Plan Update
Traffic Impacts to Adjacent City Jurisdictions
TABLE 5.4 SUMMARY OF SIGNIFICANTLY IMPACTED SEGMENTS
COUNTY OF SAN DIEGO GENERAL PLAN UPDATE (REFERRAL MAP) VS. EXISTING CONDITIONS (Proposed Plan to Ground)
Jurisdiction Total Number Analyzed Number of Significantly Impacted Segments
Carlsbad 9 0
Chula Vista 13 5
Del Mar 1 0
El Cajon 31 3
Encinitas 7 1
Escondido 35 4
La Mesa 14 1
Lemon Grove 3 0
National City 5 0
Oceanside 6 (5 under Existing) 0
Poway 21 6
San Diego 11 7
San Marcos 11 3
Santee 14 2
Solana Beach 13 1
Vista 3 1
Total 197 (196 under Existing) 34 Source: Wilson & Company; January 2009
As shown, a total of 34 roadway segments in the adjacent incorporated jurisdictions would be significantly impacted when comparing the buildout of the proposed County of San Diego General Plan (Referral Map) to Existing conditions. 5.3 Comparison of Proposed County of San Diego General Plan to Existing
County of San Diego General Plan
Table 5.5 compares projected roadway performance on the key roadway segments within the adjacent incorporated jurisdictions under the proposed County of San Diego General Plan (Referral Map) to the roadway performance under the Existing County of San Diego General Plan, and displays the resulting significant impacts.
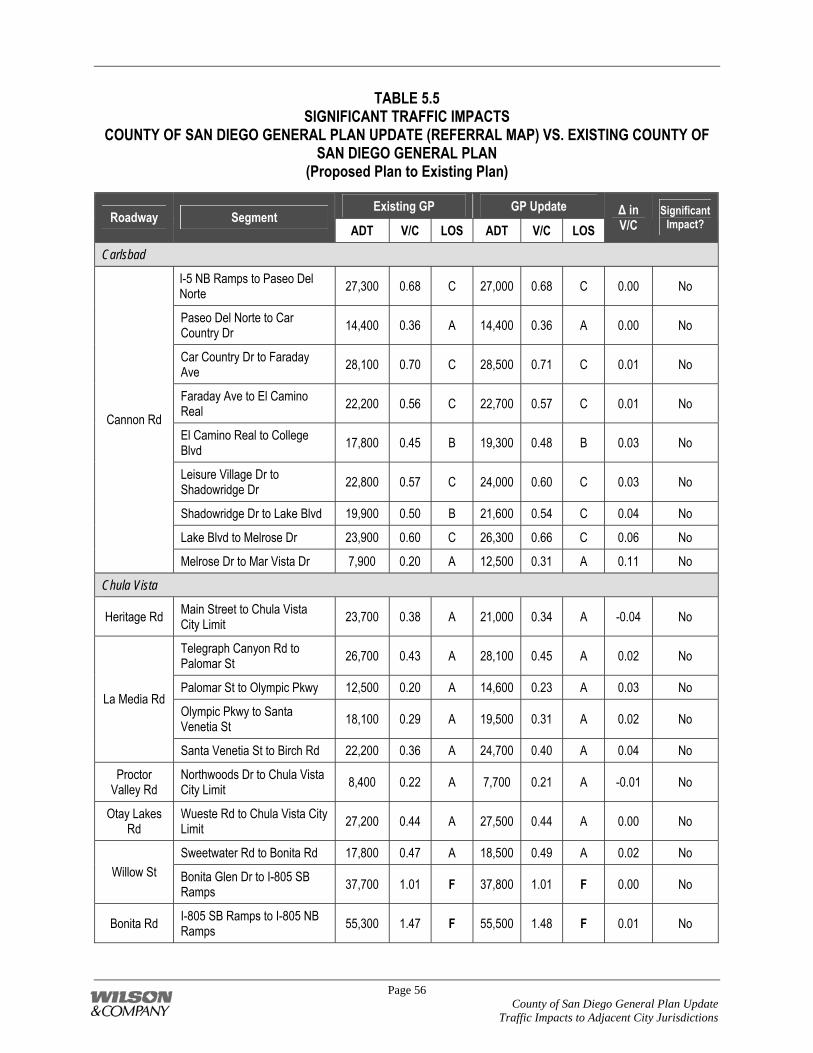
Page 56 County of San Diego General Plan Update
Traffic Impacts to Adjacent City Jurisdictions
TABLE 5.5 SIGNIFICANT TRAFFIC IMPACTS
COUNTY OF SAN DIEGO GENERAL PLAN UPDATE (REFERRAL MAP) VS. EXISTING COUNTY OF SAN DIEGO GENERAL PLAN
(Proposed Plan to Existing Plan)
Existing GP GP Update Roadway Segment
ADT V/C LOS ADT V/C LOS ∆ in V/C
Significant Impact?
Carlsbad
I-5 NB Ramps to Paseo Del Norte 27,300 0.68 C 27,000 0.68 C 0.00 No
Paseo Del Norte to Car Country Dr 14,400 0.36 A 14,400 0.36 A 0.00 No
Car Country Dr to Faraday Ave 28,100 0.70 C 28,500 0.71 C 0.01 No
Faraday Ave to El Camino Real 22,200 0.56 C 22,700 0.57 C 0.01 No
El Camino Real to College Blvd 17,800 0.45 B 19,300 0.48 B 0.03 No
Leisure Village Dr to Shadowridge Dr 22,800 0.57 C 24,000 0.60 C 0.03 No
Shadowridge Dr to Lake Blvd 19,900 0.50 B 21,600 0.54 C 0.04 No
Lake Blvd to Melrose Dr 23,900 0.60 C 26,300 0.66 C 0.06 No
Cannon Rd
Melrose Dr to Mar Vista Dr 7,900 0.20 A 12,500 0.31 A 0.11 No
Chula Vista
Heritage Rd Main Street to Chula Vista City Limit 23,700 0.38 A 21,000 0.34 A -0.04 No
Telegraph Canyon Rd to Palomar St 26,700 0.43 A 28,100 0.45 A 0.02 No
Palomar St to Olympic Pkwy 12,500 0.20 A 14,600 0.23 A 0.03 No
Olympic Pkwy to Santa Venetia St 18,100 0.29 A 19,500 0.31 A 0.02 No
La Media Rd
Santa Venetia St to Birch Rd 22,200 0.36 A 24,700 0.40 A 0.04 No
Proctor Valley Rd
Northwoods Dr to Chula Vista City Limit 8,400 0.22 A 7,700 0.21 A -0.01 No
Otay Lakes Rd
Wueste Rd to Chula Vista City Limit 27,200 0.44 A 27,500 0.44 A 0.00 No
Sweetwater Rd to Bonita Rd 17,800 0.47 A 18,500 0.49 A 0.02 No Willow St Bonita Glen Dr to I-805 SB
Ramps 37,700 1.01 F 37,800 1.01 F 0.00 No
Bonita Rd I-805 SB Ramps to I-805 NB Ramps 55,300 1.47 F 55,500 1.48 F 0.01 No

Page 57 County of San Diego General Plan Update
Traffic Impacts to Adjacent City Jurisdictions
TABLE 5.5 (Continued) SIGNIFICANT TRAFFIC IMPACTS
COUNTY OF SAN DIEGO GENERAL PLAN UPDATE (REFERRAL MAP) VS. EXISTING COUNTY OF SAN DIEGO GENERAL PLAN
(Proposed Plan to Existing Plan)
Existing GP GP Update Roadway Segment ADT V/C LOS ADT V/C LOS
∆ in V/C
Significant Impact?
I-805 NB Ramps to Plaza Bonita Rd 43,200 1.15 F 43,500 1.16 F 0.01 No
Plaza Bonita Rd to Willow St 34,100 0.91 E 33,900 0.90 E -0.01 No Bonita Rd
Willow St to Chula Vista City Limit 34,100 0.91 E 39,000 1.04 F 0.13 Yes
Del Mar
Via de la Valle
Highway 101 to Jimmy Durante Blvd 25,300 0.63 C 25,700 0.64 C 0.01 No
El Cajon
Main St to Granite Hill Dr 38,000 0.95 E 37,000 0.93 E -0.02 No Jamacha Rd
Granite Hill Dr to Grove Rd 30,000 0.75 D 28,500 0.71 C -0.04 No
El Cajon Blvd to 1st St 25,800 0.65 C 25,200 0.63 C -0.02 No
1st St to Jamacha Rd 23,000 0.58 C 22,500 0.56 C -0.02 No
Jamacha Rd to 3rd St 19,900 0.50 B 16,600 0.42 B -0.08 No
3rd St to Wichita Ave 19,800 0.50 B 18,100 0.45 B -0.05 No
Washington Ave
Wichita Ave to Granite Hill Dr 15,600 0.39 B 13,700 0.34 A -0.05 No
Magnolia Ave to Ballantyne St 14,800 0.37 A 14,900 0.37 A 0.00 No
Ballantyne St to Mollison Ave 18,300 0.46 B 18,000 0.45 B -0.01 No
Mollison Ave to 1st St 23,500 0.59 C 23,800 0.60 C 0.01 No
1st St to Orlando St 17,600 0.44 B 17,900 0.45 B 0.01 No
Orlando St to Madison Ave 22,800 0.57 C 23,400 0.59 C 0.02 No
Main St
Madison Ave to I-8 EB Ramps 13,300 0.33 A 12,500 0.31 A -0.02 No
Main St to Washington Ave 17,900 0.45 B 17,500 0.44 B -0.01 No Avocado
Blvd Washington Ave to Chase Ave 18,600 0.47 B 18,100 0.45 B -0.02 No
Cuyamaca St to Marshall Ave 11,600 0.29 A 10,900 0.27 A -0.02 No
Marshall Ave to Johnson Ave 22,200 0.56 C 21,200 0.53 C -0.03 No
Johnson Ave to Magnolia Ave 18,000 0.45 B 16,700 0.42 B -0.03 No
Magnolia Ave to Graves Ave 25,100 0.63 C 26,400 0.66 C 0.03 No
Bradley Ave
Graves Ave to 1st St 30,100 0.75 D 29,900 0.75 C 0.00 No
Pepper Dr to Persimmon Ave 26,400 0.66 C 25,900 0.65 C -0.01 No 2nd St
Persimmon Ave to Broadway 39,000 0.98 E 36,100 0.90 E -0.08 No

Page 58 County of San Diego General Plan Update
Traffic Impacts to Adjacent City Jurisdictions
TABLE 5.5 (Continued) SIGNIFICANT TRAFFIC IMPACTS
COUNTY OF SAN DIEGO GENERAL PLAN UPDATE (REFERRAL MAP) VS. EXISTING COUNTY OF SAN DIEGO GENERAL PLAN
(Proposed Plan to Existing Plan)
Existing GP GP Update Roadway Segment ADT V/C LOS ADT V/C LOS
∆ in V/C
Significant Impact?
Broadway to I-8 WB Ramps 34,700 0.87 D 38,900 0.97 E 0.10 Yes 2nd St
I-8 WB Ramps to Main St 41,400 0.83 D 42,900 0.86 D 0.03 No
El Cajon Blvd to Mollison Ave 26,800 0.67 C 25,600 0.64 C -0.03 No Chase Ave Mollison Ave to Rancho Valle
Ct 21,000 0.53 C 19,600 0.49 B -0.04 No
I-8 EB Ramps to Bermuda Ln 27,500 0.92 E 26,000 0.87 E -0.05 No
Bermuda Ln to La Cresta Rd 25,000 0.83 E 24,800 0.83 D 0.00 No
La Cresta Rd to Madison Ave 10,500 0.35 B 10,600 0.35 B 0.00 No
Madison Ave to Vista Del Escuela 2,800 0.09 A 2,800 0.09 A 0.00 No
Greenfield Dr
Vista Del Escuela to Orchard Ave 500 0.02 A 500 0.02 A 0.00 No
Encinitas
Encinitas Blvd to Santa Fe Dr 38,000 0.67 A-C 37,600 0.66 A-C -0.01 No El Camino
Real Santa Fe Dr to Manchester Ave 27,700 0.49 A-C 27,200 0.48 A-C -0.01 No
El Camino Del Norte
Rancho Santa Fe Rd to Eastern City Limit 10,000 0.50 A-C 10,100 0.51 A-C 0.01 No
Encinitas Blvd
El Camino Real to Manchester Ave 36,700 1.04 F 36,900 1.05 F 0.01 No
I-5 NB Ramps to El Camino Real 33,800 0.59 A-C 33,000 0.58 A-C -0.01 No
Manchester Ave El Camino Real to Encinitas
Blvd 11,800 0.59 A-C 11,900 0.60 A-C 0.01 No
Rancho Santa Fe Rd
Manchester Ave to Eastern City Limit 23,000 1.15 F 24,500 1.23 F 0.08 Yes
Escondido
Country Club Ln to El Norte Pkwy 24,100 0.65 B 23,100 0.62 B -0.03 No
El Norte Pkwy to SR-78 WB Ramps 30,700 0.83 Mid
D 28,600 0.77 C -0.06 No
SR-78 WB Ramps to Mission Ave 46,700 0.93 E 43,500 0.87 E -0.06 No
Centre City Pkwy
Mission Ave to Washington Ave 27,800 0.56 C 26,500 0.53 C -0.03 No

Page 59 County of San Diego General Plan Update
Traffic Impacts to Adjacent City Jurisdictions
TABLE 5.5 (Continued) SIGNIFICANT TRAFFIC IMPACTS
COUNTY OF SAN DIEGO GENERAL PLAN UPDATE (REFERRAL MAP) VS. EXISTING COUNTY OF SAN DIEGO GENERAL PLAN
(Proposed Plan to Existing Plan)
Existing GP GP Update Roadway Segment ADT V/C LOS ADT V/C LOS
∆ in V/C
Significant Impact?
Washington Ave to 5th Ave 25,200 0.68 C 23,800 0.64 B -0.04 No
5th Ave to 13th Ave 26,300 0.71 C 25,500 0.69 C -0.02 No
13th Ave to Felicita Ave 27,300 0.74 C 26,400 0.71 C -0.03 No
Felicita Ave to Centre City Rd 31,000 0.84 Mid D 31,100 0.84 Mid
D 0.00 No
Centre City Rd to Brotherton Rd 43,100 1.16 F 43,400 1.17 F 0.01 No
Centre City Pkwy
Brotherton Rd to Citracado Pkwy 34,000 0.92 E 34,200 0.92 E 0.00 No
San Pasqual Valley Rd to Juniper St 15,700 0.46 B 23,600 0.69 C 0.23 No
Juniper St to Escondido Blvd 31,000 0.91 E 33,500 0.98 E 0.07 Yes
Escondido Blvd to Centre City Pkwy 29,900 0.87 D- 29,700 0.87 D- 0.00 No
Centre City Pkwy to Quince St 26,300 0.77 C 25,800 0.75 C -0.02 No
Felicita Ave/17th Ave
Quince St to Citracado Pkwy 18,300 0.54 B 17,700 0.52 B -0.02 No
Felicita Ave to Quiet Hills Dr 22,200 0.60 B 23,100 0.62 B 0.02 No
Quiet Hills Dr to I-15 SB Ramps 26,000 0.52 C 27,500 0.55 C 0.03 No
I-15 SB Ramps to I-15 NB Ramps 41,000 0.68 C 43,000 0.72 Mid
D 0.04 No Via Rancho
Pkwy
I-15 NB Ramps to San Pasqual Rd 42,300 0.71 Mid
D 42,100 0.70 Mid D -0.01 No
San Pasqual Rd to Mary Ln 29,100 0.79 C 35,300 0.95 E 0.16 Yes
Mary Ln to Las Palmas Ave 25,600 0.69 C 30,400 0.82 Mid D 0.13 No
Las Palmas Ave to Sunset Dr 26,300 0.71 C 30,800 0.83 Mid D 0.12 No
Sunset Dr to El Dorado Dr 25,200 0.68 C 28,600 0.77 C 0.09 No
El Dorado Dr to San Pasqual Valley Rd 33,200 0.90 D- 36,000 0.97 E 0.07 Yes
San Pasqual Valley Rd to Boyle Ave 24,400 0.66 B 28,100 0.76 C 0.10 No
Boyle Ave to Hayden Dr 19,100 0.52 B 23,800 0.64 B 0.12 No
Bear Valley Pkwy
Hayden Dr to Valley Pkwy 17,700 0.48 B 24,000 0.65 B 0.17 No

Page 60 County of San Diego General Plan Update
Traffic Impacts to Adjacent City Jurisdictions
TABLE 5.5 (Continued) SIGNIFICANT TRAFFIC IMPACTS
COUNTY OF SAN DIEGO GENERAL PLAN UPDATE (REFERRAL MAP) VS. EXISTING COUNTY OF SAN DIEGO GENERAL PLAN
(Proposed Plan to Existing Plan)
Existing GP GP Update Roadway Segment ADT V/C LOS ADT V/C LOS
∆ in V/C
Significant Impact?
Bear Valley Pkwy to Wanek Rd 30,100 0.50 C 33,700 0.56 C 0.06 No
Wanek Rd to Washington Ave 25,800 0.43 B 29,200 0.49 B 0.06 No Valley Pkwy
Washington Ave to Lake Wohlford Rd 48,000 0.69 C 53,400 0.76 Mid
D 0.07 No
San Pasqual Valley Rd Washington Ave to Birch Ave 22,100 0.60 B 24,100 0.65 B 0.05 No
San Pasqual Rd Bear Valley Pkwy to Ryan Dr 17,600 0.48 B 12,300 0.33 A -0.15 No
North Ave to Country Club Ln 21,700 0.63 B 15,400 0.45 B -0.18 No
Country Club Ln to Bahia Ln 14,200 0.42 B 16,000 0.47 B 0.05 No Broadway
Bahia Ln to El Norte Pkwy 22,600 0.66 B 20,100 0.59 B -0.07 No
La Mesa
Grossmont Blvd to Campo Rd 8,000 0.80 D 8,000 0.80 D 0.00 No Bancroft Dr Campo Rd to SR-94 WB
Ramps 12,300 0.41 B 12,700 0.42 B 0.01 No
La Mesa Blvd to Jackson Dr 2,300 0.23 A 2,100 0.21 A -0.02 No
Jackson Dr to Marguerita Ln 15,300 0.51 C 14,000 0.47 C -0.04 No
Marguerita Ln to Alto Dr 10,900 0.36 B 9,500 0.32 A -0.04 No
Alto Dr to Lake Helix Dr 6,800 0.23 A 5,800 0.19 A -0.04 No
Lemon Ave
Lake Helix Dr to Fuerte Dr 3,600 0.12 A 2,700 0.09 A -0.03 No
Fuerte Dr Grossmont Dr to Avocado Blvd 15,800 1.58 F 18,500 1.85 F 0.27 Yes
SR-125 to Bancroft Dr 10,100 0.67 D 10,700 0.71 D 0.04 No
Bancroft Dr to Camino Paz 17,200 0.57 C 17,600 0.59 C 0.02 No
Camino Paz to Kenwood Rd 12,300 0.41 B 12,400 0.41 B 0.00 No
Kenwood Rd to Conrad Dr 47,900 1.60 F 47,500 1.58 F -0.02 No
Conrad Dr to Granada Ave 22,300 0.74 D 20,300 0.68 D -0.06 No
Campo Rd
Granada Ave to Sweetwater Spring Blvd 18,800 0.63 C 17,800 0.59 C -0.04 No
Lemon Grove
Troy St Palm St to Sweetwater Rd 10,300 0.34 B 9,700 0.32 A -0.02 No

Page 61 County of San Diego General Plan Update
Traffic Impacts to Adjacent City Jurisdictions
TABLE 5.5 (Continued) SIGNIFICANT TRAFFIC IMPACTS
COUNTY OF SAN DIEGO GENERAL PLAN UPDATE (REFERRAL MAP) VS. EXISTING COUNTY OF SAN DIEGO GENERAL PLAN
(Proposed Plan to Existing Plan)
Existing GP GP Update Roadway Segment ADT V/C LOS ADT V/C LOS
∆ in V/C
Significant Impact?
Broadway to Tyler St 18,000 0.60 C 19,200 0.64 C 0.04 No Sweetwater Rd Tyler St to Jamacha Rd 18,300 0.61 C 21,100 0.70 D 0.09 No
National City
National City Blvd to Highland Ave 8,100 0.20 A 8,000 0.20 A 0.00 No
30th St Highland Ave to N 2nd Ave 32,500 0.81 D 33,200 0.83 D 0.02 No
Euclid Ave Plaza Blvd to Sweetwater Rd 10,100 0.25 A 10,100 0.25 A 0.00 No
National City Blvd to Highland Ave 15,500 0.39 B 16,000 0.40 B 0.01 No
Plaza Blvd Highland Ave to Euclid Ave 26,800 0.67 C 26,600 0.67 C 0.00 No
Oceanside
SR-76 to Old Ranch Rd 32,000 0.64 B 24,700 0.49 A -0.15 No
Old Ranch Rd to Spur Ave 33,800 0.68 B 26,800 0.54 A -0.14 No
Spur Ave to Santa Fe Ave 36,400 0.73 C 30,300 0.61 B -0.12 No
Santa Fe Ave to Sagewood Rd 35,600 0.59 A 27,100 0.45 A -0.14 No
Melrose Dr
Sagewood Rd to Oceanside Blvd 34,800 0.58 A 27,600 0.46 A -0.12 No
North Santa Fe Ave SR-76 to Melrose Dr 23,800 0.60 A 23,200 0.58 A -0.02 No
Poway
Spring Hurst Dr to Iola Way 43,300 0.87 D 42,800 0.86 D -0.01 No
Iola Way to Oak Knoll Rd 40,300 1.01 F 40,000 1.00 F -0.01 No
Oak Knoll Rd to Pomerado Rd 39,900 1.00 E 39,600 0.99 E -0.01 No
Pomerado Rd to Carriage Rd 37,800 0.95 E 37,500 0.94 E -0.01 No
Carriage Rd to Community Rd 40,300 1.01 F 40,000 1.00 F -0.01 No
Community Rd to Midland Rd 39,000 0.87 D 38,700 0.86 D -0.01 No
Midland Rd to Ann O Reno Ln 28,200 0.71 C 27,600 0.69 C -0.02 No
Ann O Reno Ln to Garden Rd 18,600 0.47 B 18,000 0.45 B -0.02 No
Garden Rd to Silver Ridge Rd 14,000 0.93 E 13,200 0.88 E -0.05 No
Silver Ridge Rd to Espola Rd 13,700 0.91 E 12,600 0.84 D -0.07 No
Poway Rd
Espola Rd to SR-67 21,200 2.12 F 20,100 2.01 F -0.11 No

Page 62 County of San Diego General Plan Update
Traffic Impacts to Adjacent City Jurisdictions
TABLE 5.5 (Continued) SIGNIFICANT TRAFFIC IMPACTS
COUNTY OF SAN DIEGO GENERAL PLAN UPDATE (REFERRAL MAP) VS. EXISTING COUNTY OF SAN DIEGO GENERAL PLAN
(Proposed Plan to Existing Plan)
Existing GP GP Update Roadway Segment ADT V/C LOS ADT V/C LOS
∆ in V/C
Significant Impact?
Springbrook Dr to Community Rd 58,000 0.97 E 56,600 0.94 E -0.03 No
Community Rd to Danielson St 36,000 0.60 C 35,400 0.59 C -0.01 No
Scripps Poway Pkwy
Danielson St to SR-67 36,500 0.61 C 36,000 0.60 C -0.01 No
Pomerado Rd to Ted William Pkwy 41,500 0.69 C 40,000 0.67 C -0.02 No
Ted William Pkwy to Community Rd 51,500 0.86 D 50,000 0.83 D -0.03 No
Community Rd to Tierra Bonita Rd 34,300 0.86 D 32,800 0.82 D -0.04 No
Twin Peaks Rd
Tierra Bonita Rd to Espola Rd 29,400 0.74 C 27,900 0.70 C -0.04 No
Espola Rd Twin Peaks to Poway Rd 24,600 0.82 D 23,100 0.77 D -0.05 No
Highland Ranch Rd to Pomerado Rd 42,500 0.71 C 43,000 0.72 C 0.01 No
Ted Williams Pkwy Pomerado Rd to Twin Peaks
Rd 20,100 0.34 A 20,500 0.34 A 0.00 No
San Diego
Camino del Norte Camino San Bernardo to I-15 54,000 0.90 D 36,200 0.60 C -0.30 No
Via Del Campo to W. Bernardo Dr 36,700 0.92 E 35,800 0.90 E -0.02 No Rancho
Bernardo Rd W. Bernardo Dr to I-15 56,900 1.42 F 56,100 1.40 F -0.02 No
I-15 to Spring Canyon Rd 61,300 1.02 F 61,600 1.03 F 0.01 No Scripps
Poway Pkwy Spring Canyon Rd to Springbrook Dr 29,600 0.74 C 30,800 0.77 D 0.03 No
Jimmy Durante Blvd to I-15 NB Ramps 37,900 0.95 E 31,700 0.79 D -0.16 No
I-15 NB Ramps to San Andres Dr 40,200 1.01 F 43,100 1.08 F 0.07 Yes Via de la
Valle
San Andres Dr to El Camino Real 27,100 2.71 F 26,500 2.65 F -0.06 No
Airway Rd Michael Faraday Dr to SR-905 16,100 1.61 F 17,500 1.75 F 0.14 Yes
La Media Rd to SR-125 18,000 0.36 A 19,500 0.39 A 0.03 No Siempre Viva Rd SR-125 to Enrico Fermi Dr 50,700 1.01 F 59,300 1.19 F 0.18 Yes

Page 63 County of San Diego General Plan Update
Traffic Impacts to Adjacent City Jurisdictions
TABLE 5.5 (Continued) SIGNIFICANT TRAFFIC IMPACTS
COUNTY OF SAN DIEGO GENERAL PLAN UPDATE (REFERRAL MAP) VS. EXISTING COUNTY OF SAN DIEGO GENERAL PLAN
(Proposed Plan to Existing Plan)
Existing GP GP Update Roadway Segment ADT V/C LOS ADT V/C LOS
∆ in V/C
Significant Impact?
San Marcos
Borden Rd to Avenida Azul 21,400 0.54 C 20,300 0.51 B -0.03 No
Avenida Azul to Mission Rd 28,100 0.56 C 27,300 0.55 B -0.01 No
Mission Rd to SR-78 WB Ramps 35,400 0.71 D 37,300 0.75 D 0.04 No
SR-78 WB Ramps to Grand Ave 55,500 1.11 F 56,500 1.13 F 0.02 Yes
Grand Ave to Vista Dr 31,000 1.03 F 31,500 1.05 F 0.02 Yes
Vista Dr to Stone Dr 25,100 0.84 E 25,600 0.85 E 0.01 No
Las Posas Rd
Stone Dr to San Marcos Blvd 21,100 0.70 D 21,400 0.71 D 0.01 No
Deer Springs Rd to Buena Creek Rd 22,000 0.73 D 25,000 0.83 E 0.10 Yes Twin Oaks
Valley Rd Buena Creek Rd to Olive St 20,900 0.52 B 20,100 0.50 B -0.02 No
La Cieniega Rd
Twin Oak Valley Rd to Mulberry Dr 6,300 0.21 A 5,600 0.19 A -0.02 No
Mulberry Dr Olive St to La Cieniega Rd 6,200 0.21 A 3,700 0.12 A -0.09 No
Santee
Medina Dr to Halberns Blvd 22,400 0.56 C 22,000 0.55 C -0.01 No
Halberns Blvd to Shirley Garden 23,200 0.58 C 25,300 0.63 C 0.05 No
Shirley Garden to Magnolia Ave 25,900 0.86 E 27,400 0.91 E 0.05 Yes
Magnolia Ave to Los Ranchitos Rd 18,800 0.47 B 20,000 0.50 B 0.03 No
west of Pine Grove 24,500 0.61 C 24,800 0.62 C 0.01 No
Mast Blvd
Pine Grove to Riverford Rd 11,300 0.28 A 11,400 0.29 D 0.01 No
Cuyamaca St to Magnolia Ave 5,500 0.55 C 5,700 0.57 C 0.02 No El Nopal
Magnolia Ave to Aquila Dr 10,400 0.69 D 10,800 0.72 D 0.03 No
Magnolia Ave to SR-67 37,700 0.94 E 37,400 0.94 E 0.00 No
SR-67 to Shadow Hill Rd 23,600 0.59 C 22,500 0.56 C -0.03 No
Shadow Hill Rd to Northcode Rd 8,400 0.56 C 7,300 0.49 C -0.07 No
Woodside Ave
Northcode Rd to Security Way 7,000 0.18 A 6,000 0.15 A -0.03 No

Page 64 County of San Diego General Plan Update
Traffic Impacts to Adjacent City Jurisdictions
TABLE 5.5 (Continued) SIGNIFICANT TRAFFIC IMPACTS
COUNTY OF SAN DIEGO GENERAL PLAN UPDATE (REFERRAL MAP) VS. EXISTING COUNTY OF SAN DIEGO GENERAL PLAN
(Proposed Plan to Existing Plan)
Existing GP GP Update Roadway Segment ADT V/C LOS ADT V/C LOS
∆ in V/C
Significant Impact?
Security Way to SR-67 18,600 0.47 B 16,800 0.42 B -0.05 No Woodside Ave SR-67 to Riverford Rd 31,400 0.79 D 29,700 0.74 C -0.05 No
Solana Beach
Ocean St to Lomas Santa Fe Dr 34,100 0.85 D 34,600 0.87 D 0.02 No
Highway 101 Lomas Santa Fe Dr to Via De la Valle 25,500 0.64 C 24,000 0.60 C -0.04 No
Highway 101 to Stevens Ave 16,500 0.41 B 16,700 0.42 B 0.01 No
Stevens Ave to Solana Hills Dr 22,100 0.55 C 21,600 0.54 C -0.01 No
Solana Hills Dr to I-5 SB Ramps 37,600 0.94 E 37,000 0.93 E -0.01 No
I-5 SB Ramps to Via Mil Cumbres 36,100 0.90 E 33,400 0.84 D -0.06 No
Lomas Santa Fe Dr
Via Mil Cumbres to Highland Dr 16,100 0.40 B 13,200 0.33 A -0.07 No
Lomas Santa Fe Dr to Academy Dr 19,300 0.64 C 19,100 0.64 C 0.00 No
Academy Dr to La Colonia Park 13,200 0.44 B 13,000 0.43 B -0.01 No
La Colonia Park to Nardo Ave 13,200 0.44 B 13,000 0.43 B -0.01 No
Steven Ave
Nardo Ave to Valley Ave 16,100 0.54 C 15,900 0.53 C -0.01 No
Valley Ave Stevens Ave to Via De la Valle 21,300 0.71 D 21,000 0.70 D -0.01 No
Highland Dr El Camino Real to San Andres Dr 5,500 0.55 C 6,100 0.61 C 0.06 No
Vista
Sycamore Ave
SR-78 EB Ramps to Hibiscus Way 57,300 0.96 E 54,600 0.91 E -0.05 No
South Santa Fe Ave to Cypress Ave 15,600 0.39 A 11,900 0.30 A -0.09 No Monte Vista
Dr Cypress Ave to Foothill Dr 11,100 0.28 A 7,500 0.19 A -0.09 No
Source: Wilson & Company; January 2009 Notes: Bold letters indicate substandard LOS. ∆ in V/C = The change in the volume to capacity ratio between the two scenarios.

Page 65 County of San Diego General Plan Update
Traffic Impacts to Adjacent City Jurisdictions
Table 5.6 summarizes the results of Table 5.5 by identifying the projected number of key roadway segments within the adjacent incorporated jurisdictions that would be significantly impacted based upon the comparison of the future year buildout of the proposed County of San Diego General Plan (Referral Map) to the Existing General Plan.
TABLE 5.6 SUMMARY OF SIGNIFICANTLY IMPACTED SEGMENTS
COUNTY OF SAN DIEGO GENERAL PLAN UPDATE (REFERRAL MAP) VS. EXISTING COUNTY OF SAN DIEGO GENERAL PLAN
(Proposed Plan to Existing Plan)
Jurisdiction Total Number Analyzed Number of Significantly Impacted Segments
Carlsbad 9 0
Chula Vista 13 1
Del Mar 1 0
El Cajon 31 1
Encinitas 7 1
Escondido 35 3
La Mesa 14 1
Lemon Grove 3 0
National City 5 0
Oceanside 6 0
Poway 21 0
San Diego 11 3
San Marcos 11 3
Santee 14 1
Solana Beach 13 0
Vista 3 0
Total 197 14 Source: Wilson & Company; January 2009
As shown, a total of 14 roadway segments within the adjacent incorporated jurisdictions would be significantly impacted based upon the comparison of the County’s proposed General Plan (Referral Map) to the Existing General Plan. It can be further noted that under the proposed County General Plan (Referral Map), roadway segment performance (as measured by V/C) would remain the same or improve along 121 out of the 197 analyzed roadway segments within the adjacent incorporated jurisdictions, when compared with the Existing General Plan.

Page 66 County of San Diego General Plan Update
Traffic Impacts to Adjacent City Jurisdictions
5.4 Mitigation of Significant Impacts
Mitigation of the identified significant traffic impacts could include a variety of options from roadway segment widenings to specific intersection improvements. Requirements could vary by jurisdiction, including further review of intersection operations as a determination of overall roadway segment performance. The feasibility of modifying the roadway classifications as shown in the circulation elements of the individual incorporated jurisdictions would be a consideration as well.

Page 67 County of San Diego General Plan Update
Traffic Impacts to Adjacent City Jurisdictions
6.0 Summary of Findings
This section summarizes the performance of the key roadway segments within the adjacent incorporated jurisdictions under Existing Conditions, the Existing County of San Diego General Plan, and the proposed County of San Diego General Plan (Referral Map). 6.1 Roadway Segment Performance
Table 6.1 summarizes the projected number of key roadway segments within the adjacent incorporated jurisdictions (out of a total of 197 analyzed) operating at substandard LOS E or F (Chula Vista includes LOS D & Escondido includes LOS D-) under the three analyzed scenarios.
TABLE 6.1 SUMMARY OF ROADWAY SEGMENTS OPERATING AT SUBSTANDARD LOS
Jurisdiction Existing Conditions Existing General Plan General Plan Update
Carlsbad 0 0 0
Chula Vista 6 5 5
Del Mar 0 0 0
El Cajon 7 4 4
Encinitas 2 2 2
Escondido 14 6 7
La Mesa 9 2 2
Lemon Grove 1 0 0
National City 0 0 0
Oceanside 0 0 0
Poway 7 8 7
San Diego 3 8 7
San Marcos 1 3 4
Santee 3 2 2
Solana Beach 2 2 1
Vista 1 1 1
Total 56 43 42 Source: Wilson & Company; January 2009
6.2 Significant Traffic Impacts
Tables 6.2 through 6.4 provide a summary list of the identified significantly impacted roadway segments based upon “Plan to Ground” and “Plan to Plan” comparisons. Significant impacts are identified based upon a comparison of roadway segment V/C under the various scenarios.
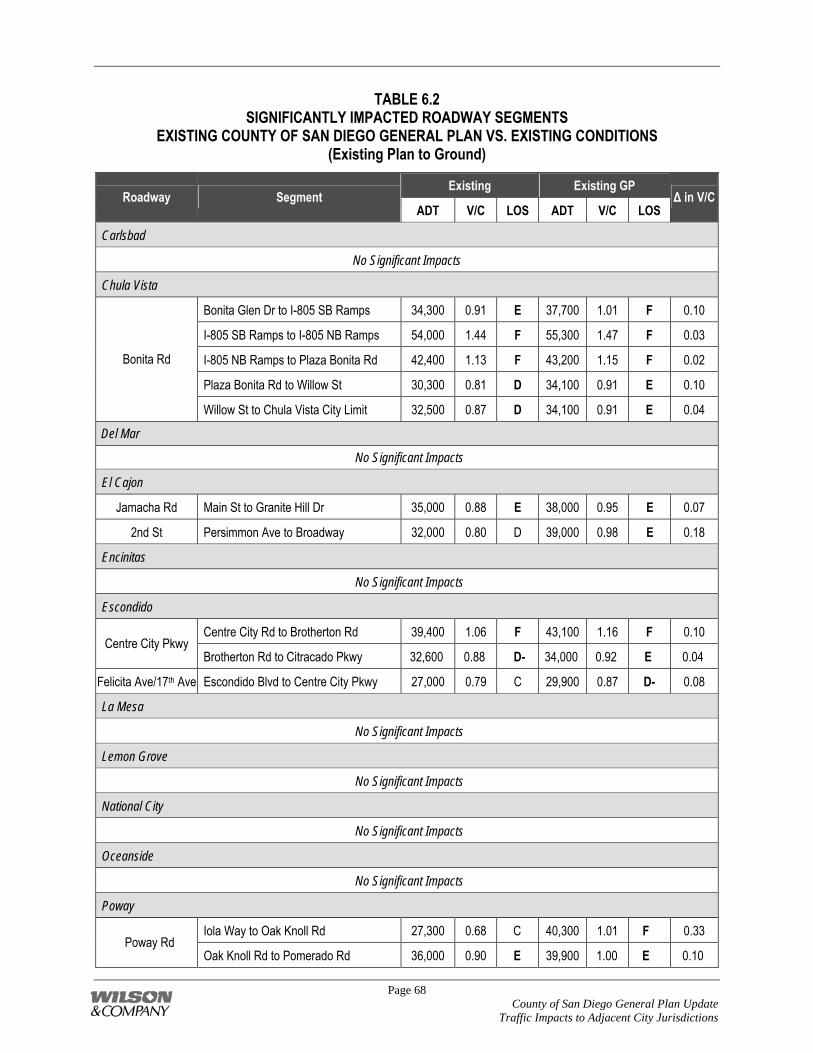
Page 68 County of San Diego General Plan Update
Traffic Impacts to Adjacent City Jurisdictions
TABLE 6.2 SIGNIFICANTLY IMPACTED ROADWAY SEGMENTS
EXISTING COUNTY OF SAN DIEGO GENERAL PLAN VS. EXISTING CONDITIONS (Existing Plan to Ground)
Existing Existing GP Roadway Segment
ADT V/C LOS ADT V/C LOS ∆ in V/C
Carlsbad
No Significant Impacts
Chula Vista
Bonita Glen Dr to I-805 SB Ramps 34,300 0.91 E 37,700 1.01 F 0.10
I-805 SB Ramps to I-805 NB Ramps 54,000 1.44 F 55,300 1.47 F 0.03
I-805 NB Ramps to Plaza Bonita Rd 42,400 1.13 F 43,200 1.15 F 0.02
Plaza Bonita Rd to Willow St 30,300 0.81 D 34,100 0.91 E 0.10
Bonita Rd
Willow St to Chula Vista City Limit 32,500 0.87 D 34,100 0.91 E 0.04
Del Mar
No Significant Impacts
El Cajon
Jamacha Rd Main St to Granite Hill Dr 35,000 0.88 E 38,000 0.95 E 0.07
2nd St Persimmon Ave to Broadway 32,000 0.80 D 39,000 0.98 E 0.18
Encinitas
No Significant Impacts
Escondido
Centre City Rd to Brotherton Rd 39,400 1.06 F 43,100 1.16 F 0.10 Centre City Pkwy
Brotherton Rd to Citracado Pkwy 32,600 0.88 D- 34,000 0.92 E 0.04
Felicita Ave/17th Ave Escondido Blvd to Centre City Pkwy 27,000 0.79 C 29,900 0.87 D- 0.08
La Mesa
No Significant Impacts
Lemon Grove
No Significant Impacts
National City
No Significant Impacts
Oceanside
No Significant Impacts
Poway
Iola Way to Oak Knoll Rd 27,300 0.68 C 40,300 1.01 F 0.33 Poway Rd
Oak Knoll Rd to Pomerado Rd 36,000 0.90 E 39,900 1.00 E 0.10

Page 69 County of San Diego General Plan Update
Traffic Impacts to Adjacent City Jurisdictions
TABLE 6.2 (Continued) SIGNIFICANTLY IMPACTED ROADWAY SEGMENTS
EXISTING COUNTY OF SAN DIEGO GENERAL PLAN VS. EXISTING CONDITIONS (Existing Plan to Ground)
Existing Existing GP Roadway Segment
ADT V/C LOS ADT V/C LOS ∆ in V/C
Pomerado Rd to Carriage Rd 33,500 0.84 D 37,800 0.95 E 0.11
Carriage Rd to Community Rd 36,500 0.91 E 40,300 1.01 F 0.10
Silver Ridge Rd to Espola Rd 12,900 0.86 D 13,700 0.91 E 0.05 Poway Rd
Espola Rd to SR-67 18,800 1.88 F 21,200 2.12 F 0.24
Scripps Poway Pkwy Springbrook Dr to Community Rd 49,400 0.82 C 58,000 0.97 E 0.15
San Diego
Via Del Campo to W. Bernardo Dr 23,700 0.59 C 36,700 0.92 E 0.33 Rancho Bernardo Rd W. Bernardo Dr to I-15 47,400 1.19 F 56,900 1.42 F 0.23
Scripps Poway Pkwy I-15 to Spring Canyon Rd 52,900 0.88 D 61,300 1.02 F 0.14
Jimmy Durante Blvd to I-15 NB Ramps 31,200 0.78 D 37,900 0.95 E 0.17
I-15 NB Ramps to San Andres Dr 37,700 0.94 E 40,200 1.01 F 0.07 Via de la Valle
San Andres Dr to El Camino Real 22,500 2.25 F 27,100 2.71 F 0.46
Airway Rd Michael Faraday Dr to SR-905 6,600 0.66 C 16,100 1.61 F 0.95
Siempre Viva Rd SR-125 to Enrico Fermi Dr 19,400 0.39 A 50,700 1.01 F 0.62
San Marcos
SR-78 WB Ramps to Grand Ave 37,700 0.75 D 55,500 1.11 F 0.36
Grand Ave to Vista Dr 15,900 0.53 C 31,000 1.03 F 0.50 Las Posas Rd
Vista Dr to Stone Dr 12,100 0.40 B 25,100 0.84 E 0.44
Santee
Mast Blvd Shirley Garden to Magnolia Ave 21,700 0.72 D 25,900 0.86 E 0.14
Woodside Ave Magnolia Ave to SR-67 32,000 0.80 D 37,700 0.94 E 0.14
Solana Beach
Solana Hills Dr to I-5 SB Ramps 31,700 0.79 D 37,600 0.94 E 0.15 Lomas Santa Fe Dr
I-5 SB Ramps to Via Mil Cumbres 28,300 0.71 C 36,100 0.90 E 0.19
Vista
Sycamore Ave SR-78 EB Ramps to Hibiscus Way 48,900 0.82 D 57,300 0.96 E 0.14
Source: Wilson & Company; January 2009 Notes: Bold letters indicate substandard LOS. ∆ in V/C = the change in the volume to capacity ratio between the two scenarios.

Page 70 County of San Diego General Plan Update
Traffic Impacts to Adjacent City Jurisdictions
TABLE 6.3 SIGNIFICANTLY IMPACTED ROADWAY SEGMENTS
COUNTY OF SAN DIEGO GENERAL PLAN UPDATE (REFERRAL MAP) VS. EXISTING CONDITIONS (Proposed Plan to Ground)
Existing GP Update Roadway Segment
ADT V/C LOS ADT V/C LOS ∆ in V/C
Carlsbad
No Significant Impacts
Chula Vista
Bonita Glen Dr to I-805 SB Ramps 34,300 0.91 E 37,800 1.01 F 0.10
I-805 SB Ramps to I-805 NB Ramps 54,000 1.44 F 55,500 1.48 F 0.04
I-805 NB Ramps to Plaza Bonita Rd 42,400 1.13 F 43,500 1.16 F 0.03
Plaza Bonita Rd to Willow St 30,300 0.81 D 33,900 0.90 E 0.09
Bonita Rd
Willow St to Chula Vista City Limit 32,500 0.87 D 39,000 1.04 F 0.17
Del Mar
No Significant Impacts
El Cajon
Jamacha Rd Main St to Granite Hill Dr 35,000 0.88 E 37,000 0.93 E 0.05
2nd St Persimmon Ave to Broadway 32,000 0.80 D 36,100 0.90 E 0.10
Broadway to I-8 WB Ramps 33,500 0.84 D 38,900 0.97 E 0.13
Encinitas
Rancho Santa Fe Rd Manchester Ave to Eastern City Limit 22,700 1.15 F 24,500 1.23 F 0.08
Escondido
Centre City Pkwy Centre City Rd to Brotherton Rd 39,400 1.06 F 43,400 1.17 F 0.11
Brotherton Rd to Citracado Pkwy 32,600 0.88 D- 34,200 0.92 E 0.04
Felicita Ave/17th Ave Escondido Blvd to Centre City Pkwy 27,000 0.79 C 29,700 0.87 D- 0.08
Bear Valley Pkwy San Pasqual Rd to Mary Ln 27,900 0.75 C 35,300 0.95 E 0.20
La Mesa
Fuerte Dr Grossmont Dr to Avocado Blvd 15,700 1.57 F 18,500 1.85 F 0.28
Lemon Grove
No Significant Impacts
National City
No Significant Impacts
Oceanside
No Significant Impacts

Page 71 County of San Diego General Plan Update
Traffic Impacts to Adjacent City Jurisdictions
TABLE 6.3 (Continued) SIGNIFICANTLY IMPACTED ROADWAY SEGMENTS
COUNTY OF SAN DIEGO GENERAL PLAN UPDATE (REFERRAL MAP) VS. EXISTING CONDITIONS (Proposed Plan to Ground)
Existing GP Update Roadway Segment
ADT V/C LOS ADT V/C LOS ∆ in V/C
Poway
Iola Way to Oak Knoll Rd 27,300 0.68 C 40,000 1.00 F 0.32
Oak Knoll Rd to Pomerado Rd 36,000 0.90 E 39,600 0.99 E 0.09
Pomerado Rd to Carriage Rd 33,500 0.84 D 37,500 0.94 E 0.10
Carriage Rd to Community Rd 36,500 0.91 E 40,000 1.00 F 0.09
Poway Rd
Espola Rd to SR-67 18,800 1.88 F 20,100 2.01 F 0.13
Scripps Poway Pkwy Springbrook Dr to Community Rd 49,400 0.82 C 56,600 0.94 E 0.12
San Diego
Via Del Campo to W. Bernardo Dr 23,700 0.59 C 35,800 0.90 E 0.31 Rancho Bernardo Rd W. Bernardo Dr to I-15 47,400 1.19 F 56,100 1.40 F 0.21
Scripps Poway Pkwy I-15 to Spring Canyon Rd 52,900 0.88 D 61,600 1.03 F 0.15
Via de la Valle I-15 NB Ramps to San Andres Dr 37,700 0.94 E 43,100 1.08 F 0.14
San Andres Dr to El Camino Real 22,500 2.25 F 26,500 2.65 F 0.40
Airway Rd Michael Faraday Dr to SR-905 6,600 0.66 C 17,500 1.75 F 1.09
Siempre Viva Rd SR-125 to Enrico Fermi Dr 19,400 0.39 A 59,300 1.19 F 0.80
San Marcos
SR-78 WB Ramps to Grand Ave 37,700 0.75 D 56,500 1.13 F 0.38
Grand Ave to Vista Dr 15,900 0.53 C 31,500 1.05 F 0.52 Las Posas Rd
Vista Dr to Stone Dr 12,100 0.40 B 25,600 0.85 E 0.45
Santee
Mast Blvd Shirley Garden to Magnolia Ave 21,700 0.72 D 27,400 0.91 E 0.19
Woodside Ave Magnolia Ave to SR-67 32,000 0.80 D 37,400 0.94 E 0.14
Solana Beach
Lomas Santa Fe Dr Solana Hills Dr to I-5 SB Ramps 31,700 0.79 D 37,000 0.93 E 0.14
Vista
Sycamore Ave SR-78 EB Ramps to Hibiscus Way 48,900 0.82 D 54,600 0.91 E 0.09 Source: Wilson & Company; January 2009
Notes: Bold letters indicate substandard LOS. ∆ in V/C = the change in the volume to capacity ratio between the two scenarios
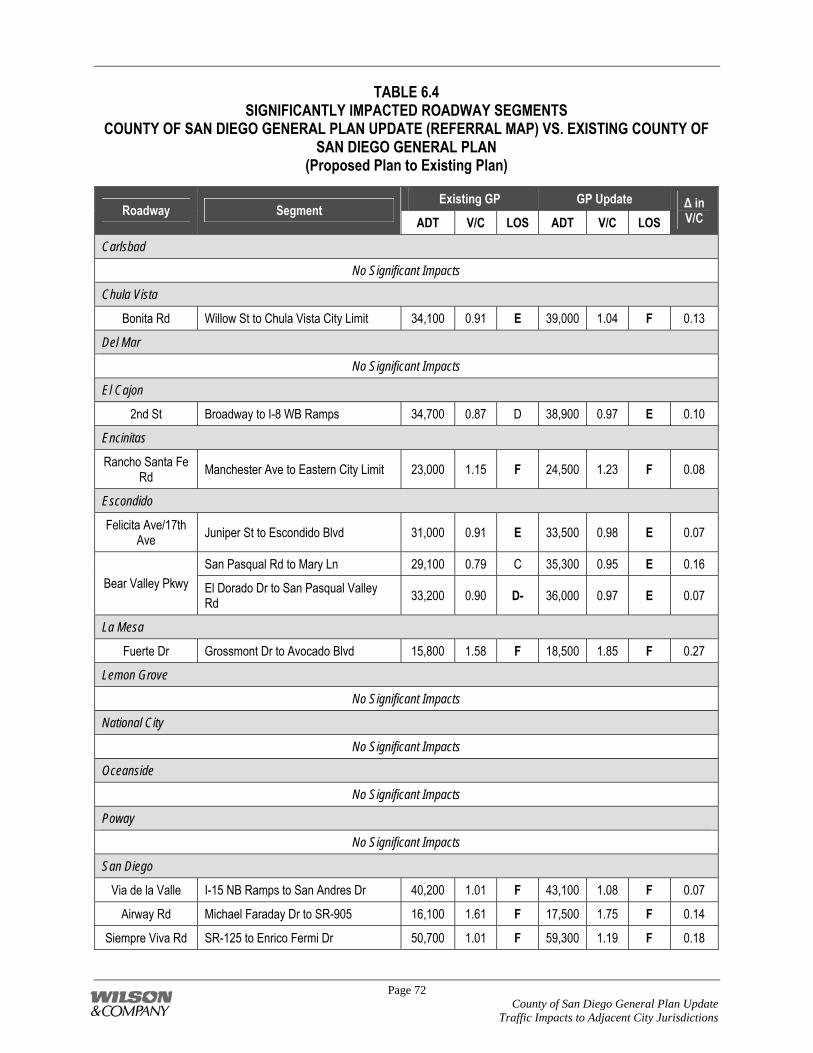
Page 72 County of San Diego General Plan Update
Traffic Impacts to Adjacent City Jurisdictions
TABLE 6.4 SIGNIFICANTLY IMPACTED ROADWAY SEGMENTS
COUNTY OF SAN DIEGO GENERAL PLAN UPDATE (REFERRAL MAP) VS. EXISTING COUNTY OF SAN DIEGO GENERAL PLAN
(Proposed Plan to Existing Plan)
Existing GP GP Update Roadway Segment
ADT V/C LOS ADT V/C LOS ∆ in V/C
Carlsbad
No Significant Impacts
Chula Vista
Bonita Rd Willow St to Chula Vista City Limit 34,100 0.91 E 39,000 1.04 F 0.13
Del Mar
No Significant Impacts
El Cajon
2nd St Broadway to I-8 WB Ramps 34,700 0.87 D 38,900 0.97 E 0.10
Encinitas
Rancho Santa Fe Rd Manchester Ave to Eastern City Limit 23,000 1.15 F 24,500 1.23 F 0.08
Escondido
Felicita Ave/17th Ave Juniper St to Escondido Blvd 31,000 0.91 E 33,500 0.98 E 0.07
San Pasqual Rd to Mary Ln 29,100 0.79 C 35,300 0.95 E 0.16 Bear Valley Pkwy El Dorado Dr to San Pasqual Valley
Rd 33,200 0.90 D- 36,000 0.97 E 0.07
La Mesa
Fuerte Dr Grossmont Dr to Avocado Blvd 15,800 1.58 F 18,500 1.85 F 0.27
Lemon Grove
No Significant Impacts
National City
No Significant Impacts
Oceanside
No Significant Impacts
Poway
No Significant Impacts
San Diego
Via de la Valle I-15 NB Ramps to San Andres Dr 40,200 1.01 F 43,100 1.08 F 0.07
Airway Rd Michael Faraday Dr to SR-905 16,100 1.61 F 17,500 1.75 F 0.14
Siempre Viva Rd SR-125 to Enrico Fermi Dr 50,700 1.01 F 59,300 1.19 F 0.18

Page 73 County of San Diego General Plan Update
Traffic Impacts to Adjacent City Jurisdictions
TABLE 6.4 (Continued) SIGNIFICANTLY IMPACTED ROADWAY SEGMENTS
COUNTY OF SAN DIEGO GENERAL PLAN UPDATE (REFERRAL MAP) VS. EXISTING COUNTY OF SAN DIEGO GENERAL PLAN
(Proposed Plan to Existing Plan)
Existing GP GP Update Roadway Segment
ADT V/C LOS ADT V/C LOS ∆ in V/C
San Marcos
SR-78 WB Ramps to Grand Ave 55,500 1.11 F 56,500 1.13 F 0.02 Los Posas Rd
Grand Ave to Vista Dr 31,000 1.03 F 31,500 1.05 F 0.02
Twin Oaks Valley Rd Deer Springs Rd to Buena Creek Rd 22,000 0.73 D 25,000 0.83 E 0.10
Santee
Mast Blvd Shirley Garden to Magnolia Ave 25,900 0.86 E 27,400 0.91 E 0.05
Solana Beach
No Significant Impacts
Vista
No Significant Impacts Source: Wilson & Company; January 2009
Notes: Bold letters indicate substandard LOS. ∆ in V/C = the change in the volume to capacity ratio between the two scenarios.