Appendix Energy Flow, Energy Demand and CO2 Emissions of ...
60
Appendix Energy Flow, Energy Demand and CO 2 Emissions of the World’s-Regions and of the G-20 Countries in 2011 Description of Diagrams The energy consumption of the world, for the individual regions of the world and for all G-20 countries is illustrated by 6 diagrams A1 ··· A6, described below (data based on: Energy Statistics from the IEA, International Energy Agency [5]). Figure A1: Energy Flow in the Energy Sector Figure A1 describes the flow of energy in the energy sector from primary energy to gross energy (or gross inland consumption) and to final energy. Primary energy and gross energy are illustrated by the energy carriers used. Energy is expressed in Mtoe. The primary energy is the sum of local production and, for regions, net imports minus net exports of energy carriers (for countries, effective imports/exports instead of net imports/net exports per energy carrier). The gross energy follows from the primary energy after subtracting the non- energy use demand (e.g. for the chemical industry) and any stock changes. For the regions of the world, the amounts of energy for the international marine and aviation bunkers are also subtracted, since the corresponding CO 2 emissions are recorded only worldwide. It is the task of the energy sector to provide consumers with energy in the form of final energy. In this diagram we distinguish 4 forms of final energy: electricity, district heating, motor fuels and “heat”. The latter consists mainly of non-electric heating and process heat (from fossil and renewable energies) and without district heating. Stationary work, of non-electrical origin, can also be included (e.g. stationary gas, petrol or diesel engines and pumps); at least in developed countries, this share is minimal. With the conversion of gross energy into final energy, losses occur, which we refer to as losses of the energy sector. These losses consist of thermal losses in power stations (thermodynamic reasons) as well as in combined heat and power plants and heating plants, and Valentin Crastan © Springer International Publishing Switzerland 2014 V. Crastan, Global Energy Demand and 2-degree Target, Report 2014, DOI 10.1007/978-3-319-12310-3 203
Transcript of Appendix Energy Flow, Energy Demand and CO2 Emissions of ...
AppendixEnergy Flow, Energy Demand and CO2Emissions of the World’s-Regionsand of the G-20 Countries in 2011
Description of Diagrams
The energy consumption of the world, for the individual regions of the world andfor all G-20 countries is illustrated by 6 diagrams A1 ··· A6, described below (databased on: Energy Statistics from the IEA, International Energy Agency [5]).
Figure A1: Energy Flow in the Energy Sector
Figure A1 describes the flow of energy in the energy sector from primary energy togross energy (or gross inland consumption) and to final energy. Primary energy andgross energy are illustrated by the energy carriers used. Energy is expressed inMtoe.
The primary energy is the sum of local production and, for regions, net importsminus net exports of energy carriers (for countries, effective imports/exports insteadof net imports/net exports per energy carrier).
The gross energy follows from the primary energy after subtracting the non-energy use demand (e.g. for the chemical industry) and any stock changes. For theregions of the world, the amounts of energy for the international marine andaviation bunkers are also subtracted, since the corresponding CO2 emissions arerecorded only worldwide.
It is the task of the energy sector to provide consumers with energy in the formof final energy. In this diagram we distinguish 4 forms of final energy: electricity,district heating, motor fuels and “heat”. The latter consists mainly of non-electricheating and process heat (from fossil and renewable energies) and without districtheating. Stationary work, of non-electrical origin, can also be included (e.g.stationary gas, petrol or diesel engines and pumps); at least in developed countries,this share is minimal. With the conversion of gross energy into final energy, lossesoccur, which we refer to as losses of the energy sector.
These losses consist of thermal losses in power stations (thermodynamicreasons) as well as in combined heat and power plants and heating plants, and
Valentin Crastan
© Springer International Publishing Switzerland 2014V. Crastan, Global Energy Demand and 2-degree Target, Report 2014,DOI 10.1007/978-3-319-12310-3
203

additionally electrical losses in the transmission and distribution network,including the energy sector’s own energy requirement and, finally, of theremaining losses in the energy sector (refining, liquefaction and gasificationplants, heat transfer losses, in-house use of heat, etc.).
The diagram also shows the CO2 emissions in Mt associated with the finalenergy consumption and the losses of the energy sector (together correspondingto the gross inland consumption). Most of the losses of the energy sector arenormally associated with the electricity and district heat production, which is whythe CO2 emissions of these three factors are combined. Separation can be doneusing Figure A4.
Figure A2: Shares of Energy Carriers
Figure A2 shows the shares of energy carriers, in percentage of total final energydemand, required for obtaining the 4 final energy types, and for covering the lossesof the energy sector.
This diagram thus complements diagram A1, with respect to the energy carrierdistribution in the final energy area. The energy-carriers-colors are shown in thelegend, and also apply to the energy flow diagram A1.
Figure A3: Losses of the Energy Sector
The losses of the energy sector represent a significant part of gross energy demand.Worldwide, in 2011, they were about 54 % and in some countries they even exceed100 % of final energy demand. For the CO2 emissions they are therefore of primaryimportance.
Figure A3 shows the percentage composition of these losses and the resulting CO2
emissions. A characteristic parameter and index of the CO2-efficiency of the energysector in the world region or country is the ratio Mt CO2 relative to Mtoe losses.
Figure A4: Energy Flow of Final Energyto the Final Users
The chart shows the breakdown of the 4 types of final energy over the three end-usercategories. Similarly, the CO2 emissions are allocated to these consumer groups.
The end users are (according to IEA statistics)
• industry,• residential, services, agriculture, etc.,• transport.
204 Appendix: Energy Flow, Energy Demand and CO2 Emissions …

To obtain the total emissions, the CO2 emissions of the energy sector (i.e. of thecorresponding losses) have to be added to this.
Figure A5: CO2 Emissions and OriginatingEnd-Energy Carriers
The figure gives the total CO2 emissions in Mt, the emissions per capita and itsdistribution over the consumer groups, detailed per end-energy carrier.
In addition, the indicator of CO2 sustainability of the country or region is stated.The causes of the CO2 emissions of the end energy carriers electricity and
district heat can be taken from the diagrams A2 and A6.
Figure A6: Electricity Production and Consumption
The large, often decisive importance of electricity consumption and of itsgeneration for the amount of CO2 emissions is clear from the flow charts A1 andA4, and also from A5. The share of the losses of the energy sector (mostly coupledwith the electricity production) is also to be taken into account.
Diagram A6 shows in detail the percentage composition of the energy sourcesused for the production of electricity.
Similarly, imports and exports are given in percentage of final consumption.The final consumption follows after deduction of losses (network losses and the
energy sector’s own use).
Appendix: Energy Flow, Energy Demand and CO2 Emissions … 205

Regions of the World
A1. World: Energy flow in the energy sector from primary to final energy and total CO2 emissions. Color of the energy carriers as in A2 and A5 (petroleum dark brown, oil products light brown)
A2. World: : Shares of energy carriers for obtaining the final energies ("heat", motor fuels, electricity, district heating) and to cover the losses of the energy sector
A3. World: Percentage distribution of losses in the energy sector; contributors to CO2 emissions include ther-mal losses of fossil-fuel plants, the electrical losses and the residual losses
0
10
20
30
40
50
60
100%
= 8
098
Mto
e
"heat" motor fuels electricity district heating energy-sector losses
coal and peat oil gas biomass and waste
other renewables nuclear hydroelectricity
World 2011, % of final energyfinal energies, energy-sector losses
therm. losses renewable (3,13%)therm. losses nuclear (10,75%)
remaining losses (26,88%)
therm. losses coal (34,43%)electrical losses (7,80%)
therm. losses gas (12,84%)therm. losses oil (4,16%)
Losses of the energy sector, 4196 Mtoecorresponding emissions: 11761 Mt CO2
World 2011--> 2.8 Mt/Mtoe
World
206 Appendix: Energy Flow, Energy Demand and CO2 Emissions …

World
A4. World: Flow of final energy to the final users and CO2 emissions of the economy sectors
A5. World: Energy carriers responsible for the CO2 emissions of sectors of the economy ; (for electricity see also A2 or A6 and for district heating also A2)
A6. World: Generation of electrical energy, final consumption = production - losses
0
0,5
1
1,5
2
2,5
3
t/a,c
apita
industry transport resid., services, agr. energy-sector losses
coal and peat oil gas electricity district heating
World 2011, CO2 emissions 31342 Mt4.5 t/capita, 429 g/$ (PPP)
coal (41,19%)biomass (1,49%)waste, renewable (0,41%)
hydro (16,06%)geothermal (0,31%)
solar PV (0,28%)solar thermal (0,01%)
wind (1,96%)tidal (0,00%)
oil (4,76%)
nuclear (11,64%)
waste, not renewable (0,04%)
gas (21,86%)
Electricity production, World2011, total 22201 TWh network losses + own use
3804 TWh final consumption 18397 TWh
Appendix: Energy Flow, Energy Demand and CO2 Emissions … 207

OECD-34
A1. OECD-34: Energy flow in the energy sector from primary to final energy and total CO2 emissions. Color of the energy carriers as in A2 and A5 (petroleum dark brown, oil products light brown)
A2. OECD-34: Shares of energy carriers for obtaining the final energies ("heat", motor fuels, electricity, district heating) and to cover the losses of the energy sector
A3. OECD-34: Percentage distribution of losses in the energy sector; contributors to CO2 emissions include thermal losses of fossil-fuel plants, the electrical losses and the residual losses
0
10
20
30
40
50
60
100%
= 3
291
Mto
e
"heat" motor fuels electricity district heating energy-sector losses
coal and peat oil gas biomass and waste
other renewables nuclear hydroelectricity
OECD-34 2011, % of final energyfinal energies, energy-sector losses
therm. losses renewable (4,24%)
therm. losses nuclear (22,04%)
electrical losses (7,95%)
remaining losses (18,01%)
therm. losses coal (31,54%)
therm. losses gas (13,56%)therm. losses oil (2,66%)
Losses of the energy sector, 1653 Mtoecorresponding emissions: 4035 Mt CO2
OECD-34 2011--> 2.4 Mt/Mtoe
208 Appendix: Energy Flow, Energy Demand and CO2 Emissions …

OECD-34
A4. OECD-34: Flow of final energy to the final users and CO2 emissions of the economy sectors
A5. OECD-34: Energy carriers responsible for the CO2 emissions of sectors of the economy ; (for electricity see also A2 or A6 and for district heating also A2)
A6. OECD-34: Generation of electrical energy, final consumption = production + imports - exports - losses
0
1
2
3
4
5
t/a,c
apita
industry transport resid., services, agr. energy-sector losses
coal and peat oil gas electricity district heating
OECD-34 2011, CO2 emissions 12341 Mt9.9 t/capita, 313 g/$ (PPP)
coal (33,29%)biomass (2,01%)
waste, renewable (0,29%)hydro (13,37%)
geothermal (0,41%)solar PV (0,53%)
solar thermal (0,02%)wind (3,02%)
tidal (0,01%)
oil (3,18%)
gas (24,21%)
nuclear (19,20%)
waste, not renewable (0,46%)
Electricity production, OECD-342011, total 10867 TWh import surplus
2 TWh network losses + own use 1529 TWh final consumption 9340 TWh
-6
-4
-2
0
2
4
6
% o
f fin
al e
lect
ricity
con
sum
ptio
n
imp-exp import export
OECD-34 2011, electricityimport / export in %
Appendix: Energy Flow, Energy Demand and CO2 Emissions … 209

EU-27
A1. EU-27: Energy flow in the energy sector from primary to final energy and total CO2 emissions. Color of the energy carriers as in A2 and A5 (petroleum dark brown, oil products light brown)
A2. EU-27: Shares of energy carriers for obtaining the final energies ("heat", motor fuels, electricity, district heating) and to cover the losses of the energy sector
A3. EU-27: Percentage distribution of losses in the energy sector; contributors to CO2 emissions include ther-mal losses of fossil-fuel plants, the electrical losses and the residual losses
0
10
20
30
40
50
60
100%
= 1
039
Mto
e
"heat" motor fuels electricity district heating energy-sector losses
coal and peat oil gas biomass and waste
other renewables nuclear hydroelectricity
EU-27 2011, % of final energyfinal energies, energy-sector losses
therm. losses nuclear (31,02%)
electrical losses (8,62%)
remaining losses (18,46%)
therm. losses renewable (5,62%)
therm. losses coal (24,32%)
therm. losses gas (9,83%)therm. losses oil (2,13%)
Losses of the energy sector, 510 Mtoecorresponding emissions: 1060 Mt CO2
EU-27 2011--> 2.1 Mt/Mtoe
210 Appendix: Energy Flow, Energy Demand and CO2 Emissions …

EU-27
A4. EU-27: Flow of final energy to the final users and CO2 emissions of the economy sectors
A5. EU-27: Energy carriers responsible for the CO2 emissions of sectors of the economy ; (for electricity see also A2 or A6 and for district heating also A2)
A6. EU-27: Generation of electrical energy, final consumption = production + imports - exports - losses
0
0,5
1
1,5
2
2,5
3
t/a,c
apita
industry transport resid., services, agr. energy-sector losses
coal and peat oil gas electricity district heating
EU-27 2011, CO2 emissions3543 Mt, 7.0 t/capita, 242 g/$ (PPP)
coal (26,89%)
biomass (3,49%)waste, renewable (1,17%)
hydro (10,22%)geothermal (0,18%)
solar PV (1,37%)solar thermal (0,04%)
wind (5,46%)tidal (0,02%)
oil (2,23%)
gas (21,14%)nuclear (27,65%)
waste, not renewable (0,15%)
Electricity production, EU-272011, total 3279 TWh import surplus
0 TWh network losses + own use 512 TWh final consumption 2768 TWh
-15
-10
-5
0
5
10
15
% o
f fin
al e
lect
ricity
con
sum
ptio
n
imp-exp import export
EU-27 2011, electricityimport / export in %
Appendix: Energy Flow, Energy Demand and CO2 Emissions … 211

Middle East
A1. Middle East: Energy flow in the energy sector from primary to final energy and total CO2 emissions. Color of the energy carriers as in A2 and A5 (petroleum dark brown, oil products light brown)
A2. Middle East: Shares of energy carriers for obtaining the final energies ("heat", motor fuels, electricity, district heating) and to cover the losses of the energy sector
A3. Middle East: Percentage distribution of losses in the energy sector; contributors to CO2 emissions include thermal losses of fossil-fuel plants, the electrical losses and the residual losses
0
10
20
30
40
50
60
70
100%
= 3
57 M
toe
"heat" motor fuels electricity district heating energy-sector losses
coal and peat oil gas biomass and waste
other renewables nuclear hydroelectricity
Middle East 2011, % of final energyfinal energies, energy-sector losses
therm. losses oil (30,87%)
therm. losses coal (0,05%)therm. losses renewable (0,00%)therm. losses nuclear (0,03%)
remaining losses (27,86%)
therm. losses gas (34,89%)
electrical losses (6,29%)
Losses of the energy sector = 215 Mtoecorresponding emissions: 590 Mt CO2
Middle East 2011--> 2.7 Mt/Mtoe
212 Appendix: Energy Flow, Energy Demand and CO2 Emissions …

Middle East
A4. Middle East: Flow of final energy to the final users and CO2 emissions of the economy sectors
A5. Middle East: Energy carriers responsible for the CO2 emissions of sectors of the economy ; (for electricity see also A2 or A6 and for district heating also A2)
A6. Middle East: Generation of electrical energy, final consumption = production + imports - exports - losses
0
0,5
1
1,5
2
2,5
3
t/a,c
apita
industry transport resid., services, agr. energy-sector losses
coal and peat oil gas electricity district heating
Middle East 2011, CO2-Emissionen1607 Mt, 7.7 t/capita, 603 g/$ (PPP)
oil (37,06%)
coal (0,05%)nuclear (0,04%)biomass (0,00%)
hydro (2,41%)wind (0,03%)
gas (60,41%)
Electricity production, Middle East2011, total 845 TWh export surplus
3 TWh network losses + own use 158 TWh final consumption 684 TWh
-3
-2
-1
0
1
2
3
% o
f fin
al e
lect
ricity
con
sum
ptio
n
imp-exp import export
Middle East 2011, electricityimport / export in %
Appendix: Energy Flow, Energy Demand and CO2 Emissions … 213

Eurasia+
A1. Eurasia+: Energy flow in the energy sector from primary to final energy and total CO2 emissions. Color of the energy carriers as in A2 and A5 (petroleum dark brown, oil products light brown)
A2. Eurasia+: Shares of energy carriers for obtaining the final energies ("heat", motor fuels, electricity, district heating) and to cover the losses of the energy sector
A3. Eurasia+: Percentage distribution of losses in the energy sector; contributors to CO2 emissions include thermal losses of fossil-fuel plants, the electrical losses and the residual losses
-10
0
10
20
30
40
50
60
70
100%
= 6
55 M
toe
"heat" motor fuels electricity district heating energy-sector losses
coal and peat oil gas biomass and waste
other renewables nuclear hydroelectricity
Eurasia+ 2011, % of final energyfinal energies, energy-sector losses
therm. losses coal (15,16%)
therm. losses renewable (0,55%)therm. losses nuclear (11,82%)
remaining losses (34,55%)
therm. losses oil (1,79%)
therm. losses gas (26,81%)electrical losses (9,32%)
Losses of the energy sector, 434 Mtoecorresponding emissions: 1097 Mt CO2
Eurasia+, 2011--> 2.5 Mt/Mtoe
214 Appendix: Energy Flow, Energy Demand and CO2 Emissions …

Eurasia+
A4. Eurasia+: Flow of final energy to the final users and CO2 emissions of the economy sectors
A5. Eurasia+: Energy carriers responsible for the CO2 emissions of sectors of the economy ; (for electricity see also A2 or A6 and for district heating also A2)
A6. Eurasia+: Generation of electrical energy, final consumption = production + imports - exports - losses
0
0,5
1
1,5
2
2,5
3
3,5
t/a,c
apita
industry transport resid., services, agr. energy-sector losses
coal and peat oil gas electricity district heating
Eurasia+ 2011, CO2 emissions2743 Mt, 8.1 t/capita, 720 g/$ (PPP)
coal (24,22%)biomass (0,05%)
waste, renewable (0,00%)hydro (16,66%)
geothermal (0,03%)solar PV (0,01%)
wind (0,19%)
oil (2,25%)
gas (39,42%)
nuclear (17,00%)
waste, not renewable (0,18%)
Electricity production, Eurasia+2011, total 1729 TWh export surplus
21 TWh network losses + own use 470 TWh final consumption 1238 TWh
-8
-6
-4
-2
0
2
4
6
8
% o
f fin
al e
lect
ricity
con
sum
ptio
n
imp-exp import export
Eurasia+ 2011, electricityimport / export in %
Appendix: Energy Flow, Energy Demand and CO2 Emissions … 215

Rest-Asia/Oceania
A1. Rest-Asia/Oceania: Energy flow in the energy sector from primary to final energy and total CO2 emissions. Color of the energy carriers as in A2 and A5 (petroleum dark brown, oil products light brown)
A2. Rest-Asia/Oceania: Shares of energy carriers for obtaining the final energies ("heat", motor fuels, electrici-ty, district heating) and to cover the losses of the energy sector
A3. Rest-Asia/Oceania: Percentage distribution of losses in the energy sector; contributors to CO2 emissions include thermal losses of fossil-fuel plants, the electrical losses and the residual losses
0
10
20
30
40
50
60
70
100%
= 5
42 M
toe
"heat" motor fuels electricity district heating energy-sector losses
coal and peat oil gas biomass and waste
other renewables nuclear hydroelectricity
Rest-Asia/Oceania 2011, % of finalenergyfinal energies, energy-sector losses
therm. losses renewable (12,28%)therm. losses nuclear (3,70%)
electrical losses (6,25%)
remaining losses (21,05%)
therm. losses coal (25,37%)
therm. losses oil (9,08%)therm. losses gas (22,28%)
Losses of the energy sector, 223 Mtoecorresponding emissions: 554 Mt CO2
Rest-Asia/Oceania2011 --> 2.5 Mt/Mtoe
216 Appendix: Energy Flow, Energy Demand and CO2 Emissions …

Rest-Asia/Oceania
A4. Rest-Asia/Oceania: Flow of final energy to the final users and CO2 emissions of the economy sectors
A5. Rest-Asia/Oceania: Energy carriers responsible for the CO2 emissions of sectors of the economy ; (for electricity see also A2 or A6 and for district heating also A2)
A6. Rest-Asia/Oceania: Generation of electrical energy, final consumption = production + imp. – exp. - losses
0
0,2
0,4
0,6
0,8
1
t/a,c
apita
industry transport resid., services, agr. energy-sector losses
coal and peat oil gas electricity district heating
Rest-Asia/Oceania 2011, CO2 emissions1739 Mt, 1.6 t/capita, 366 g/$ (PPP)
coal (31,07%)waste, not renewable (0,31%)
nuclear (4,12%)biomass (0,59%)
waste, renewable (0,08%)hydro (12,57%)
geothermal (1,68%)solar PV (0,03%)
wind (0,15%)
oil (11,35%)gas (38,05%)
Electricity production 2011.Rest-Asia/Oceania, total 1150 TWh
import surplus 15 TWh network losses +own use 162 TWh final consumption 1003 TWh
-2
-1
0
1
2
3
% o
f fin
al e
lect
ricity
con
sum
ptio
n
imp-exp import export
Rest-Asia/Oceania 2011, electricityimport / export in %
Appendix: Energy Flow, Energy Demand and CO2 Emissions … 217
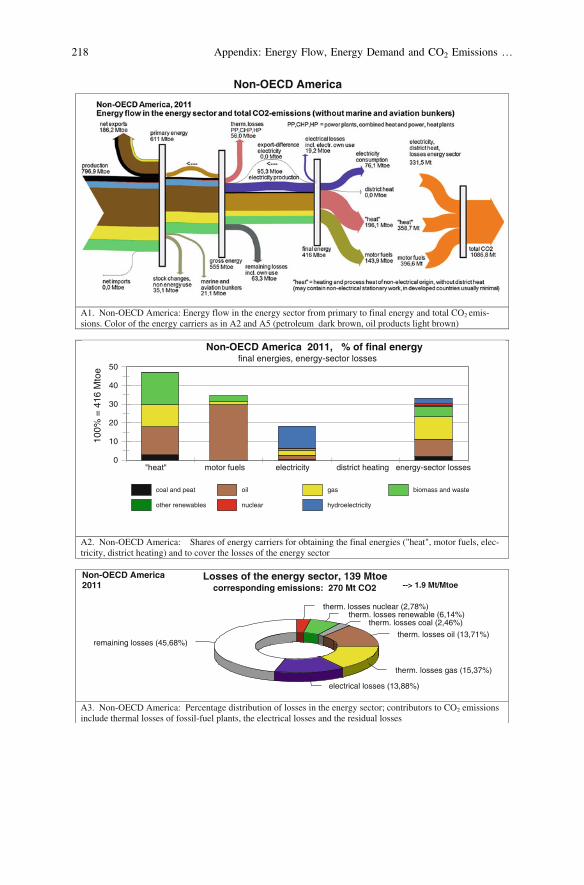
Non-OECD America
A1. Non-OECD America: Energy flow in the energy sector from primary to final energy and total CO2 emis-sions. Color of the energy carriers as in A2 and A5 (petroleum dark brown, oil products light brown)
A2. Non-OECD America: Shares of energy carriers for obtaining the final energies ("heat", motor fuels, elec-tricity, district heating) and to cover the losses of the energy sector
A3. Non-OECD America: Percentage distribution of losses in the energy sector; contributors to CO2 emissions include thermal losses of fossil-fuel plants, the electrical losses and the residual losses
0
10
20
30
40
50
100%
= 4
16 M
toe
"heat" motor fuels electricity district heating energy-sector losses
coal and peat oil gas biomass and waste
other renewables nuclear hydroelectricity
Non-OECD America 2011, % of final energyfinal energies, energy-sector losses
therm. losses oil (13,71%)
therm. losses coal (2,46%)therm. losses renewable (6,14%)
therm. losses nuclear (2,78%)
remaining losses (45,68%)
therm. losses gas (15,37%)
electrical losses (13,88%)
Losses of the energy sector, 139 Mtoecorresponding emissions: 270 Mt CO2
Non-OECD America2011 --> 1.9 Mt/Mtoe
218 Appendix: Energy Flow, Energy Demand and CO2 Emissions …

Non-OECD America
A4. Non-OECD America: Flow of final energy to the final users and CO2 emissions of the economy sectors
A5. Non-OECD America: Energy carriers responsible for the CO2 emissions of sectors of the economy ; (for electricity see also A2 or A6 and for district heating also A2)
A6. Non-OECD America: Generation of electrical energy, final consumption = production + imp. – exp. - losses
0
0,5
1
1,5
t/a,c
apita
industry transport resid., services, agr. energy-sector losses
coal and peat oil gas electricity district heating
Non-OECD America 2011, CO2 emiss.1087 Mt, 2.4 t/capita, 239 g/$ (PPP)
gas (14,32%)
oil (12,56%)coal (2,00%)geothermal (0,29%)
solar PV (0,01%)wind (0,35%)
waste, not renewable (0,05%)nuclear (1,99%)
biomass (3,85%)
hydro (64,57%)
Electricity product., Non-OECD America2011, total 1108 TWh export surplus
0 TWh network losses + own use 224 TWh final consumption 884 TWh
-8
-6
-4
-2
0
2
4
6
8
% o
f fin
al e
lect
ricity
con
sum
ptio
n
imp-exp import export
Non-OECD America 2011, electricityimport / export in %
Appendix: Energy Flow, Energy Demand and CO2 Emissions … 219

Africa
A1. Africa: Energy flow in the energy sector from primary to final energy and total CO2 emissions. Color of the energy carriers as in A2 and A5 (petroleum dark brown, oil products light brown)
A2. Africa: Shares of energy carriers for obtaining the final energies ("heat", motor fuels, electricity, district heating) and to cover the losses of the energy sector
A3. Africa: Percentage distribution of losses in the energy sector; contributors to CO2 emissions include ther-mal losses of fossil-fuel plants, the electrical losses and the residual losses
0
20
40
60
80
100%
= 5
09 M
toe
"heat" motor fuels electricity district heating energy-sector losses
coal and peat oil gas biomass and waste
other renewables nuclear hydroelectricity
Africa 2011, % of final energyfinal energies, energy-sector losses
therm. losses coal (23,21%)therm. losses renewable (0,86%)
therm. losses nuclear (1,35%)
remaining losses (45,23%)
therm. losses oil (5,88%)
therm. losses gas (17,03%)electrical losses (6,45%)
Losses of the energy sector, 175 Mtoecorresponding emissions: 398 Mt CO2
Africa 2011--> 2.3 Mt/Mtoe
220 Appendix: Energy Flow, Energy Demand and CO2 Emissions …
Africa
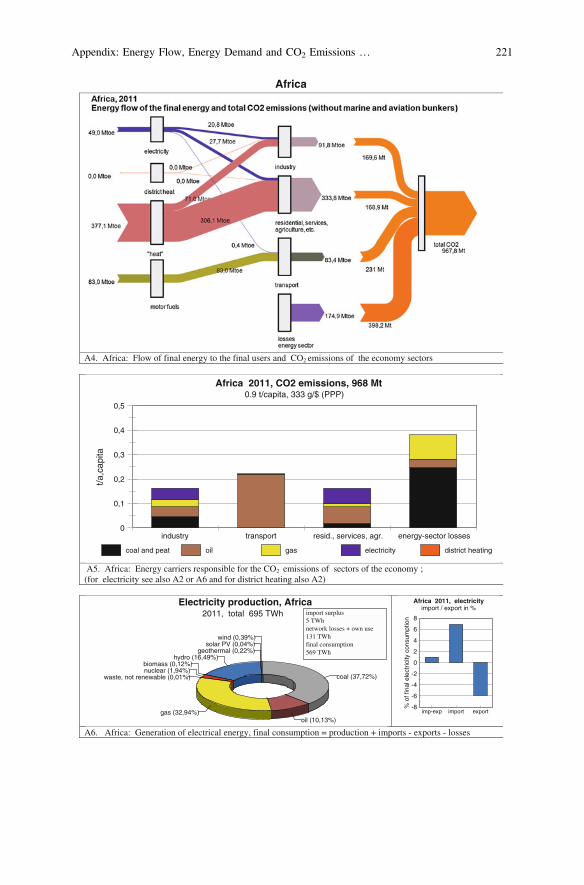
A4. Africa: Flow of final energy to the final users and CO2 emissions of the economy sectors
A5. Africa: Energy carriers responsible for the CO2 emissions of sectors of the economy ; (for electricity see also A2 or A6 and for district heating also A2)
A6. Africa: Generation of electrical energy, final consumption = production + imports - exports - losses
0
0,1
0,2
0,3
0,4
0,5
t/a,c
apita
industry transport resid., services, agr. energy-sector losses
coal and peat oil gas electricity district heating
Africa 2011, CO2 emissions, 968 Mt0.9 t/capita, 333 g/$ (PPP)
coal (37,72%)waste, not renewable (0,01%)nuclear (1,94%)biomass (0,12%)
hydro (16,49%)geothermal (0,22%)
solar PV (0,04%)wind (0,39%)
oil (10,13%)gas (32,94%)
Electricity production, Africa2011, total 695 TWh import surplus
5 TWh network losses + own use 131 TWh final consumption 569 TWh
-8
-6
-4
-2
0
2
4
6
8
% o
f fin
al e
lect
ricity
con
sum
ptio
n
imp-exp import export
Africa 2011, electricityimport / export in %
Appendix: Energy Flow, Energy Demand and CO2 Emissions … 221

G-20 Countries
G-20
A1. G-20: Energy flow in the energy sector from primary to final energy and total CO2 emissions. Color of the energy carriers as in A2 and A5 (petroleum dark brown, oil products light brown)
A2. G-20: Shares of energy carriers for obtaining the final energies ("heat", motor fuels, electricity, district heating) and to cover the losses of the energy sector
A3. G-20: Percentage distribution of losses in the energy sector; contributors to CO2 emissions include thermal losses of fossil-fuel plants, the electrical losses and the residual losses
0
10
20
30
40
50
60
100%
= 6
147
Mto
e
"heat" motor fuels electricity district heating energy-sector losses
coal and peat oil gas biomass and waste
other renewables nuclear hydroelectricity
G-20 2011, % of final energyfinal energies, energy-sector losses
therm. losses renewable (3,21%)therm. losses nuclear (12,16%)
remaining losses (22,24%)
therm. losses coal (42,57%)
electrical losses (6,81%)
therm. losses gas (10,53%)therm. losses oil (2,48%)
Losses of the energy sector, 3531 Mtoecorresponding emissions: 10580 Mt CO2
G-20 2011--> 3.0 Mt/Mtoe
222 Appendix: Energy Flow, Energy Demand and CO2 Emissions …

G-20
A4. G-20: Flow of final energy to the final users and CO2 emissions of the economy sectors
A5. G-20: Energy carriers responsible for the CO2 emissions of sectors of the economy ; (for electricity see also A2 or A6 and for district heating also A2)
A6. G-20: Generation of electrical energy, final consumption = production + imports - exports - losses
0,5
1
1,5
2
2,5
3
t/a,c
apita
industry transport resid., services, agr. energy-sector losses
coal and peat oil gas electricity district heating
G-20 2011, CO2 emissions: 25,489 Mt 5.6 t/capita, 419 g/$ (PPP)
coal (44,94%)nuclear (13,50%)
biomass (1,67%)waste, renewable (0,58%)
hydro (11,80%)geothermal (0,25%)
solar PV (0,33%)solar thermal (0,01%)
wind (2,05%)tidal (0,00%)
oil (4,19%)
waste, not renewable (0,05%)
gas (20,61%)
Electricity production, G-202011, total 17,256 TWh import surplus
27 TWh network losses + own use 2797 TWh final consumption 14486 TWh
-3
-2
-1
0
1
2
3
4
% o
f fin
al e
lect
ricity
con
sum
ptio
n
imp-exp import export
G-20 2011, electricityimport / export in %
Appendix: Energy Flow, Energy Demand and CO2 Emissions … 223

Argentina
A1. Argentina: Energy flow in the energy sector from primary to final energy and total CO2 emissions. Color of the energy carriers as in A2 and A5 (petroleum dark brown, oil products light brown)
A2. Argentina: Shares of energy carriers for obtaining the final energies ("heat", motor fuels, electricity, district heating) and to cover the losses of the energy sector
A3. Argentina: Percentage distribution of losses in the energy sector; contributors to CO2 emissions include thermal losses of fossil-fuel plants, the electrical losses and the residual losses
-10
0
10
20
30
40
50
100%
= 5
3 M
toe
"heat" motor fuels electricity district heating energy-sector losses
coal and peat oil gas biomass and waste
other renewables nuclear hydroelectricity
Argentina 2011, % of final energyfinal energies, energy-sector losses
therm. losses oil (12,90%)therm. losses coal (2,44%)
therm. losses renewable (2,37%)therm. losses nuclear (5,05%)
remaining losses (31,20%)
therm. losses gas (36,84%)electrical losses (9,20%)
Losses of the energy sector, 22 Mtoecorresponding emissions: 50 Mt CO2
Argentina 2011--> 2.3 Mt/Mtoe
224 Appendix: Energy Flow, Energy Demand and CO2 Emissions …

Argentina
A4. Argentina: Flow of final energy to the final users and CO2 emissions of the economy sectors
A5. Argentina: Energy carriers responsible for the CO2 emissions of sectors of the economy ; (for electricity see also A2 or A6 and for district heating also A2)
A6. Argentina: Generation of electrical energy, final consumption = production + imports - exports - losses
0
0,5
1
1,5
2
t/a,c
apita
industry transport resid., services, agr. energy-sector losses
coal and peat oil gas electricity district heating
Argentina 2011, CO2 emissions184 Mt, 4.5 t/capita, 278 g/$ (PPP)
oil (15,08%)coal (2,49%)
waste, renewable (0,00%)
hydro (24,56%)solar PV (0,00%)
solar thermal (0,00%)wind (0,02%)
gas (51,30%)
biomass (1,64%)nuclear (4,90%)
waste, not renewable (0,00%)
Electricity production, Argentina2011, total 130 TWh import surplus
10 TWh network losses and own use 24 TWh final consumption 116 TWh
-2
0
2
4
6
8
10
% o
f fin
al e
lect
ricity
con
sum
ptio
n
imp-exp import export
Argentina 2011, electricityimport / export in %
Appendix: Energy Flow, Energy Demand and CO2 Emissions … 225

Australia
A1. Australia: Energy flow in the energy sector from primary to final energy and total CO2 emissions. Color of the energy carriers as in A2 and A5 (petroleum dark brown, oil products light brown)
A2. Australia: Shares of energy carriers for obtaining the final energies ("heat", motor fuels, electricity, dis-trict heating) and to cover the losses of the energy sector
A3. Australia: Percentage distribution of losses in the energy sector; contributors to CO2 emissions include thermal losses of fossil-fuel plants, the electrical losses and the residual losses
0
10
20
30
40
50
60
70
100%
= 7
3 M
toe
"heat" motor fuels electricity district heating energy-sector losses
coal and peat oil gas biomass and waste
other renewables nuclear hydroelectricity
Australia 2011, % of the final energyfinal energies, energy-sector losses
therm. losses renewable (0,93%)therm. losses nuclear (0,00%)
therm. losses gas (14,48%)
electrical losses (7,96%)remaining losses (9,35%)
therm. losses coal (66,31%)therm. losses oil (0,96%)
Losses of the energy sector, 45 Mtoecorresponding emissions: 172 Mt CO2
Australia, 2011--> 3.8 Mt/Mtoe
226 Appendix: Energy Flow, Energy Demand and CO2 Emissions …

Australia
A4. Australia: Flow of final energy to the final users and CO2 emissions of the economy sectors
A5. Australia: Energy carriers responsible for the CO2 emissions of sectors of the economy ; (for electricity see also A2 or A6 and for district heating also A2)
A6. Australia: Generation of electrical energy, final consumption = production + imports - exports - losses
0
2
4
6
8
10
t/a,c
apita
industry transport resid., services, agr. energy-sector losses
coal and peat oil gas electricity district heating
Australia 2011, CO2 emissions397 Mt, 17.4 t/capita, 467 g/$ (PPP)
gas (19,66%)
biomass (0,83%)hydro (6,65%)geothermal (0,00%)
solar PV (0,34%)solar thermal (0,00%)
wind (2,30%)
coal (68,60%)oil (1,62%)
Electricity production, Australia2011, total 253 TWh export/import
0 TWh network losses + own use 42 TWh final consumption 211 TWh
Appendix: Energy Flow, Energy Demand and CO2 Emissions … 227

Brazil
A1. Brazil: Energy flow in the energy sector from primary to final energy and total CO2 emissions. Color of the energy carriers as in A2 and A5 (petroleum dark brown, oil products light brown)
A2. Brazil: Shares of energy carriers for obtaining the final energies ("heat", motor fuels, electricity, district heating) and to cover the losses of the energy sector
A3. Brazil: Percentage distribution of losses in the energy sector; contributors to CO2 emissions include thermal losses of fossil-fuel plants, the electrical losses and the residual losses
0
10
20
30
40
50
100%
= 2
02 M
toe
"heat" motor fuels electricity district heating energy-sector losses
coal and peat oil gas biomass and waste
other renewables nuclear hydroelectricity
Brazil 2011, % of the final energyfinal energies, energy-sector losses
therm. losses gas (5,35%)therm. losses oil (3,87%)
therm. losses coal (3,20%)therm. losses renewable (5,84%)
therm. losses nuclear (5,24%)
electrical losses (18,29%)remaining losses (58,20%)
Losses of the energy sector, 52 Mtoecorresponding emissions: 70 Mt CO2
Brazil 2011--> 1.3 Mt/Mtoe
228 Appendix: Energy Flow, Energy Demand and CO2 Emissions …

Brazil
A4. Brazil: Flow of final energy to the final users and CO2 emissions of the economy sectors
A5. Brazil: Energy carriers responsible for the CO2 emissions of sectors of the economy ; (for electricity see also A2 or A6 and for district heating also A2)
6. Brazil: Generation of electrical energy, final consumption = production + imports - exports - losses
0,2
0,4
0,6
0,8
1
t/a,c
apita
industry transport resid., services, agr. energy-sector losses
coal and peat oil gas electricity district heating
Brazil 2011, CO2 emissions, 408 Mt2.1 t/a,capita, 193 g/$ (PPP)
biomass (6,06%)nuclear (2,94%)
waste, not renewable (0,10%)gas (4,72%)
oil (2,78%)coal (2,33%)
solar PV (0,00%)wind (0,51%)
hydro (80,55%)
Electricity production, Brazil2011, total 532 TWh import surplus
36 TWh network losses and own use 111 TWh final consumption 457 TWh
-2
0
2
4
6
8
10
% o
f fin
al e
lect
ricity
con
sum
ptio
n
imp-exp import export
Brazil 2011, electricityimport / export in %
Appendix: Energy Flow, Energy Demand and CO2 Emissions … 229

Canada
A1. Canada: Energy flow in the energy sector from primary to final energy and total CO2 emissions. Color of the energy carriers as in A2 and A5 (petroleum dark brown, oil products light brown)
A2. Canada: Shares of energy carriers for obtaining the final energies ("heat", motor fuels, electricity, district heating) and to cover the losses of the energy sector
A3. Canada: Percentage distribution of losses in the energy sector; contributors to CO2 emissions include ther-mal losses of fossil-fuel plants, the electrical losses and the residual losses
0
10
20
30
40
50
100%
= 1
79 M
toe
"heat" motor fuels electricity district heating energy-sector losses
coal and peat oil gas biomass and waste
other renewables nuclear hydroelectricity
Canada 2011, in % of final energyfinal energies, energy-sector losses
therm. losses nuclear (34,14%)electrical losses (14,65%)
remaining losses (6,89%)
therm. losses renewable (2,99%)
therm. losses coal (23,11%)
therm. losses gas (15,56%)
therm. losses oil (2,66%)
Losses of the energy sector, 48 Mtoecorresponding emissions: 84 Mt CO2
Canada 2011--> 1.75 Mt/Mtoe
230 Appendix: Energy Flow, Energy Demand and CO2 Emissions …

Canada
A4. Canada: Flow of final energy to the final users and CO2 emissions of the economy sectors
A5. Canada: Energy carriers responsible for the CO2 emissions of sectors of the economy ; (for electricity see also A2 or A6 and for district heating also A2)
A6. Canada: Generation of electrical energy, final consumption = production + imports - exports - losses
0
1
2
3
4
5
6
7
t/a,c
apita
industry transport resid., services, agr. energy-sector losses
coal and peat oil gas electricity district heating
Canada 2011, CO2 emissions530 Mt, 15.4 t/capita, 400 g/$ (PPP)
waste, not renewable (0,21%)gas (9,75%)
oil (1,03%)coal (11,99%)solar PV (0,04%)
wind (1,60%)tidal (0,00%)
nuclear (14,69%)
biomass (1,67%)waste, renewable (0,03%)
hydro (59,00%)
Electricity production, Canada2011, total 637 TWh export surplus
37 TWh network losses and own use 82 TWh final consumption 519 TWh
-10
-8
-6
-4
-2
0
2
4
% o
f fin
al e
lect
ricity
con
sum
ptio
n
imp-exp import export
Canada 2011, electricityimport / export in %
Appendix: Energy Flow, Energy Demand and CO2 Emissions … 231

China (with Hongkong)
A1. China: Energy flow in the energy sector from primary to final energy and total CO2 emissions. Color of the energy carriers as in A2 and A5 (petroleum dark brown, oil products light brown)
A2. China: Shares of energy carriers for obtaining the final energies ("heat", motor fuels, electricity, district heating) and to cover the losses of the energy sector
A3. China: Percentage distribution of losses in the energy sector; contributors to CO2 emissions include thermal losses of fossil-fuel plants, the electrical losses and the residual losses
0
20
40
60
80
100%
= 1
516
Mto
e
"heat" motor fuels electricity district heating energy-sector losses
coal and peat oil gas biomass and waste
other renewables nuclear hydroelectricity
China 2011, % of final energyfinal energies, energy-sector losses
therm. losses renewable (1,03%)therm. losses nuclear (1,37%)
remaining losses (34,91%)
therm. losses coal (54,74%)
electrical losses (6,62%)therm. losses gas (1,16%)
therm. losses oil (0,16%)
Losses of the energy sector, 1099 Mtoecorresponding emissions: 3837 Mt CO2
China 2011--> 3.5 Mt/Mtoe
232 Appendix: Energy Flow, Energy Demand and CO2 Emissions …

China (with Hongkong)
A4. China: Flow of final energy to the final users and CO2 emissions of the economy sectors
A5. China: Energy carriers responsible for the CO2 emissions of sectors of the economy ; (for electricity see also A2 or A6 and for district heating also A2)
A6. China: Generation of electrical energy, final consumption = production + imports - exports - losses
0
0,5
1
1,5
2
2,5
3
t/a,c
apita
industry transport resid., services, agr. energy-sector losses
coal and peat oil gas electricity district heating
China 2011, CO2 emissions8000 Mt, 5.9 t/capita, 744 g/$ (PPP)
oil (0,17%)gas (2,00%)
nuclear (1,82%)biomass (0,66%)
waste, renewable (0,23%)hydro (14,70%)
geothermal (0,00%)solar PV (0,05%)
wind (1,48%)
coal (78,89%)
Electricity production, China2011, total 4755 TWh export surplus
5 TWh network losses + own use 846 TWh final consumption 3905 TWh
-0,6
-0,4
-0,2
0
0,2
0,4
0,6
% o
f fin
al e
lect
ricity
con
sum
ptio
n
imp-exp import export
China 2011, electricityimport / export in %
Appendix: Energy Flow, Energy Demand and CO2 Emissions … 233

France
A1. France: Energy flow in the energy sector from primary to final energy and total CO2 emissions. Color of the energy carriers as in A2 and A5 (petroleum dark brown, oil products light brown)
A2. France: Shares of energy carriers for obtaining the final energies ("heat", motor fuels, electricity, district heating) and to cover the losses of the energy sector
3. France: Percentage distribution of losses in the energy sector; contributors to CO2 emissions include thermal losses of fossil-fuel plants, the electrical losses and the residual losses
0
20
40
60
80
100%
= 1
40 M
toe
"heat" motor fuels electricity district heating energy-sector losses
coal and peat oil gas biomass and waste
other renewables nuclear hydroelectricity
France 2011, % of final energyfinal energies, energy-sector losses
therm. losses renewable (1,39%)therm. losses coal (2,03%)
therm. losses oil (0,66%)therm. losses gas (3,33%)
electrical losses (7,34%)remaining losses (8,48%)
therm. losses nuclear (76,76%)
Losses of the energy sector, 101 Mtoecorresponding emissions: 52 Mt CO2
France, 2011--> 0.51 Mt/Mtoe
234 Appendix: Energy Flow, Energy Demand and CO2 Emissions …

France
A4. France: Flow of final energy to the final users and CO2 emissions of the economy sectors
A5. France: Energy carriers responsible for the CO2 emissions of sectors of the economy ; (for electricity see also A2 or A6 and for district heating also A2)
A6. France: Generation of electrical energy, final consumption = production + imports - exports - losses
0
0,5
1
1,5
2
t/a,c
apita
industry transport resid., services, agr. energy-sector losses
coal and peat oil gas electricity district heating
France 2011, CO2 emissions 328 Mt, 5.0 t/capita, 161 g/$ (PPP)
waste, not renewable (0,40%)gas (4,76%)
oil (0,61%)coal (3,08%)
biomass (0,52%)waste, renewable (0,39%)
hydro (8,88%)geothermal (0,00%)
solar PV (0,36%)wind (2,18%)
tidal (0,10%)
nuclear (78,72%)
Electricity production, France2011, total 562 TWh
export surplus 57 TWh network losses + own use 86 TWh final consumption 420 TWh
-20
-15
-10
-5
0
5
% o
f fin
al e
lect
ricity
con
sum
ptio
n
imp-exp import export
France 2011, electricityimport / export in %
Appendix: Energy Flow, Energy Demand and CO2 Emissions … 235

Germany
A1. Germany: Energy flow in the energy sector from primary to final energy and total CO2 emissions. Color of the energy carriers as in A2 and A5 (petroleum dark brown, oil products light brown)
A2. Germany: Shares of energy carriers for obtaining the final energies ("heat", motor fuels, electricity, dis-trict heating) and to cover the losses of the energy sector
A3. Germany: Percentage distribution of losses in the energy sector; contributors to CO2 emissions include thermal losses of fossil-fuel plants, the electrical losses and the residual losses
0
10
20
30
40
50
100%
= 1
97 M
toe
"heat" motor fuels electricity district heating energy-sector losses
coal and peat oil gas biomass and waste
other renewables nuclear hydroelectricity
Germany 2011, in % of final energyfinal energies, energy-sector losses
therm. losses renewable (7,70%)
therm. losses nuclear (20,77%)
electrical losses (7,90%)
remaining losses (16,40%)
therm. losses coal (39,89%)
therm. losses gas (6,48%)therm. losses oil (0,85%)
Losses of the energy sector, 91 Mtoecorresponding emissions: 243 Mt CO2
Germany 2011--> 2.7 Mt/Mtoe
236 Appendix: Energy Flow, Energy Demand and CO2 Emissions …
Germany
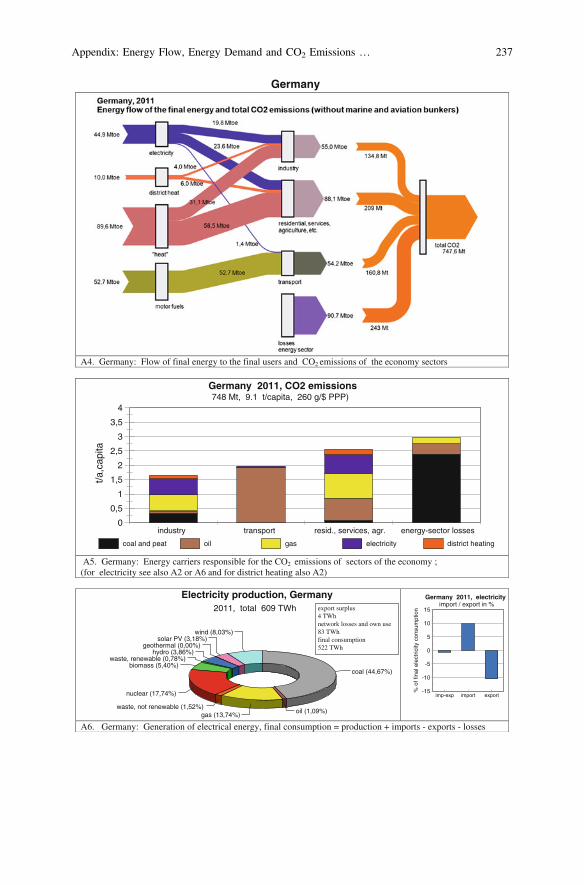
A4. Germany: Flow of final energy to the final users and CO2 emissions of the economy sectors
A5. Germany: Energy carriers responsible for the CO2 emissions of sectors of the economy ; (for electricity see also A2 or A6 and for district heating also A2)
A6. Germany: Generation of electrical energy, final consumption = production + imports - exports - losses
0
0,5
1
1,5
2
2,5
3
3,5
4
t/a,c
apita
industry transport resid., services, agr. energy-sector losses
coal and peat oil gas electricity district heating
Germany 2011, CO2 emissions748 Mt, 9.1 t/capita, 260 g/$ PPP)
coal (44,67%)biomass (5,40%)
waste, renewable (0,78%)hydro (3,86%)
geothermal (0,00%)solar PV (3,18%)
wind (8,03%)
oil (1,09%)
nuclear (17,74%)
waste, not renewable (1,52%)gas (13,74%)
Electricity production, Germany2011, total 609 TWh export surplus
4 TWh network losses and own use 83 TWh final consumption 522 TWh
-15
-10
-5
0
5
10
15
% o
f fin
al e
lect
ricity
con
sum
ptio
n
imp-exp import export
Germany 2011, electricityimport / export in %
Appendix: Energy Flow, Energy Demand and CO2 Emissions … 237

India
A1. India: Energy flow in the energy sector from primary to final energy and total CO2 emissions. Color of the energy carriers as in A2 and A5 (petroleum dark brown, oil products light brown)
A2. India: Shares of energy carriers for obtaining the final energies ("heat", motor fuels, electricity, district heating) and to cover the losses of the energy sector
A3. India: Percentage distribution of losses in the energy sector; contributors to CO2 emissions include thermal losses of fossil-fuel plants, the electrical losses and the residual losses
0
20
40
60
80
100%
= 4
52 M
toe
"heat" motor fuels electricity district heating energy-sector losses
coal and peat oil gas biomass and waste
other renewables nuclear hydroelectricity
India 2011, % of final energyfinal energies, energy-sector losses
therm. losses renewable (3,96%)therm. losses nuclear (2,26%)
electrical losses (9,51%)
remaining losses (18,28%)
therm. losses coal (60,29%)
therm. losses gas (3,68%)therm. losses oil (2,01%)
Losses of the energy sector, 257 Mtoecorresponding emissions: 862 Mt CO2
India 2011--> 3.4 Mt/Mtoe
238 Appendix: Energy Flow, Energy Demand and CO2 Emissions …
India
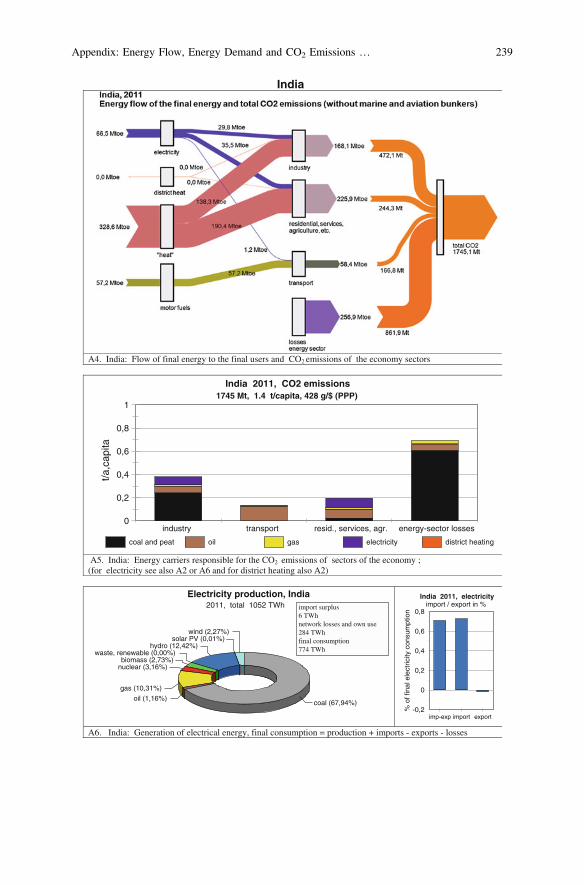
A4. India: Flow of final energy to the final users and CO2 emissions of the economy sectors
A5. India: Energy carriers responsible for the CO2 emissions of sectors of the economy ; (for electricity see also A2 or A6 and for district heating also A2)
A6. India: Generation of electrical energy, final consumption = production + imports - exports - losses
0
0,2
0,4
0,6
0,8
1
t/a,c
apita
industry transport resid., services, agr. energy-sector losses
coal and peat oil gas electricity district heating
India 2011, CO2 emissions1745 Mt, 1.4 t/capita, 428 g/$ (PPP)
nuclear (3,16%)biomass (2,73%)
waste, renewable (0,00%)hydro (12,42%)
solar PV (0,01%)wind (2,27%)
coal (67,94%)
gas (10,31%)
oil (1,16%)
Electricity production, India2011, total 1052 TWh import surplus
6 TWh network losses and own use 284 TWh final consumption 774 TWh
-0,2
0
0,2
0,4
0,6
0,8
% o
f fin
al e
lect
ricity
con
sum
ptio
n
imp-exp import export
India 2011, electricityimport / export in %
Appendix: Energy Flow, Energy Demand and CO2 Emissions … 239

Indonesia
A1. Indonesia: Energy flow in the energy sector from primary to final energy and total CO2 emissions. Color of the energy carriers as in A2 and A5 (petroleum dark brown, oil products light brown)
A2. Indonesia: Shares of energy carriers for obtaining the final energies ("heat", motor fuels, electricity, district heating) and to cover the losses of the energy sector
A3. Indonesia: Percentage distribution of losses in the energy sector; contributors to CO2 emissions include thermal losses of fossil-fuel plants, the electrical losses and the residual losses
0
10
20
30
40
50
60
70
100%
= 1
49 M
toe
"heat" motor fuels electricity district heating energy-sector losses
coal and peat oil gas biomass and waste
other renewables nuclear hydroelectricity
Indonesia 2011, % of final energyfinal energies, energy-sector losses
therm. losses renewable (30,32%)
therm. losses nuclear (0,00%)
therm. losses gas (9,98%)
electrical losses (3,82%)remaining losses (13,23%)
therm. losses coal (29,42%)
therm. losses oil (13,24%)
Losses of the energy sector, 51 Mtoecorresponding emissions: 115 Mt CO2
Indonesia, 2011--> 2.3 Mt/Mtoe
240 Appendix: Energy Flow, Energy Demand and CO2 Emissions …

Indonesia
A4. Indonesia: Flow of final energy to the final users and CO2 emissions of the economy sectors
A5. Indonesia: Energy carriers responsible for the CO2 emissions of sectors of the economy ; (for electricity see also A2 or A6 and for district heating also A2)
A6. Indonesia: Generation of electrical energy, final consumption = production + imports - exports - losses
0
0,2
0,4
0,6
0,8
1
t/a,c
apita
industry transport resid., services, agr. energy-sector lossescoal and peat oil gas electricity district heating
Indonesia 2011, CO2 emissions426 Mt, 1.8 t/capita, 415 g/$ (PPP)
coal (44,41%)gas (20,34%)
waste, not renewable (0,00%)biomass (0,11%)
waste, renewable (0,00%)hydro (6,81%)
geothermal (5,14%)solar PV (0,00%)wind (0,00%)
oil (23,20%)
Electricity production, Indonesia2011, total 182 TWh export/import
0 TWh network losses and own use 23 TWh final consumption 160 TWh
Appendix: Energy Flow, Energy Demand and CO2 Emissions … 241

Italy
A1. Italy: Energy flow in the energy sector from primary to final energy and total CO2 emissions. Color of the energy carriers as in A2 and A5 (petroleum dark brown, oil products light brown)
A2. Italy: Shares of energy carriers for obtaining the final energies ("heat", motor fuels, electricity, district heating) and to cover the losses of the energy sector
A3. Italy: Percentage distribution of losses in the energy sector; contributors to CO2 emissions include thermal losses of fossil-fuel plants, the electrical losses and the residual losses
0
10
20
30
40
50
100%
= 1
18 M
toe
"heat" motor fuels electricity district heating energy-sector losses
coal and peat oil gas biomass and waste
other renewables nuclear hydroelectricity
Italy 2011, % of final energyfinal energies, energy-sector losses
therm. losses renewable (17,70%)therm. losses nuclear (0,00%)
remaining losses (20,13%)
therm. losses coal (17,02%)
therm. losses oil (8,50%)
electrical losses (9,83%)
therm. losses gas (26,81%)
Losses of the energy sector, 41 Mtoecorresponding emissions: 93 Mt CO2
Italy 2011--> 2.3 Mt/Mtoe
242 Appendix: Energy Flow, Energy Demand and CO2 Emissions …

Italy
A4. Italy: Flow of final energy to the final users and CO2 emissions of the economy sectors
A5. Italy: Energy carriers responsible for the CO2 emissions of sectors of the economy ; (for electricity see also A2 or A6 and for district heating also A2)
A6. Italy: Generation of electrical energy, final consumption = production + imports - exports - losses
0
0,5
1
1,5
2
2,5
3
t/a,c
apita
industry transport resid., services, agr. energy-sector losses
coal and peat oil gas electricity district heating
Italy 2011, CO2 emissions393 Mt, 6.5 t/capita, 231 g/$ (PPP)
oil (6,57%)
coal (16,57%)
waste, renewable (0,73%)
hydro (15,78%)
geothermal (1,87%)solar PV (3,57%)
solar thermal (0,00%)wind (3,26%)
gas (47,77%)
biomass (2,85%)nuclear (0,00%)
waste, not renewable (1,03%)
Electricity production, Italy2011, total 303 TWh
import surplus 45 TWh network losses and own use 46 TWh final consumption 302 TWh
-5
0
5
10
15
20
% o
f fin
al e
lect
ricity
con
sum
ptio
n
imp-exp import export
Italy 2011, electricityimport / export in %
Appendix: Energy Flow, Energy Demand and CO2 Emissions … 243

Japan
A1. Japan: Energy flow in the energy sector from primary to final energy and total CO2 emissions. Color of the energy carriers as in A2 and A5 (petroleum dark brown, oil products light brown)
A2. Japan: Shares of energy carriers for obtaining the final energies ("heat", motor fuels, electricity, district heating) and to cover the losses of the energy sector
A3. Japan: Percentage distribution of losses in the energy sector; contributors to CO2 emissions include thermal losses of fossil-fuel plants, the electrical losses and the residual losses
0
10
20
30
40
50
60
100%
= 2
77 M
toe
"heat" motor fuels electricity district heating energy-sector losses
coal and peat oil gas biomass and waste
other renewables nuclear hydroelectricity
Japan 2011, % of final energyfinal energies, energy-sector losses
therm. losses renewable (4,20%)therm. losses nuclear (12,09%)
electrical losses (6,54%)
remaining losses (18,06%)
therm. losses coal (23,32%)
therm. losses oil (11,71%)therm. losses gas (24,08%)
Losses of the energy sector, 147 Mtoecorresponding emissions: 407 Mt CO2
Japan 2011--> 2.8 Mt/Mtoe
244 Appendix: Energy Flow, Energy Demand and CO2 Emissions …

Japan
A4. Japan: Flow of final energy to the final users and CO2 emissions of the economy sectors
A5. Japan: Energy carriers responsible for the CO2 emissions of sectors of the economy ; (for electricity see also A2 or A6 and for district heating also A2)
A6. Japan: Generation of electrical energy, final consumption = production + imports - exports - losses
0
1
2
3
4
5
t/a,c
apita
industry transport resid., services, agr. energy-sector lossescoal and peat oil gas electricity district heating
Japan 2011, CO2 emissions1186 Mt, 9.3 t/capita, 289 g/$ (PPP)
coal (26,74%)
waste, not renewable (0,49%)nuclear (9,68%)
biomass (2,74%)waste, renewable (0,28%)
hydro (8,72%)geothermal (0,25%)
solar PV (0,49%)wind (0,43%)
oil (14,59%)gas (35,57%)
Electricity production, Japan2011, total 1051 TWh import/export
0 TWh network losses and own use 112 TWh final consumption 939 TWh
Appendix: Energy Flow, Energy Demand and CO2 Emissions … 245
Mexico
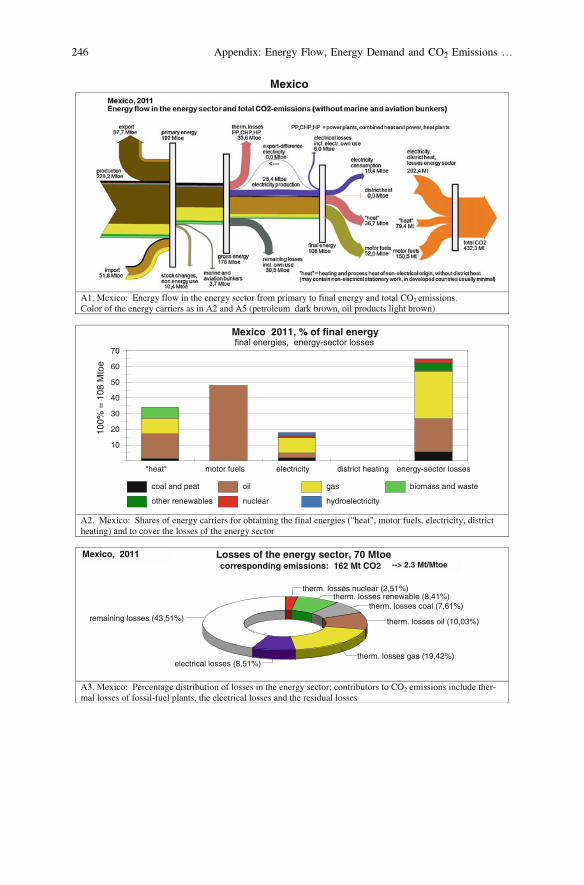
A1. Mexico: Energy flow in the energy sector from primary to final energy and total CO2 emissions. Color of the energy carriers as in A2 and A5 (petroleum dark brown, oil products light brown)
A2. Mexico: Shares of energy carriers for obtaining the final energies ("heat", motor fuels, electricity, district heating) and to cover the losses of the energy sector
A3. Mexico: Percentage distribution of losses in the energy sector; contributors to CO2 emissions include ther-mal losses of fossil-fuel plants, the electrical losses and the residual losses
10
20
30
40
50
60
70
100%
= 1
08 M
toe
"heat" motor fuels electricity district heating energy-sector losses
coal and peat oil gas biomass and waste
other renewables nuclear hydroelectricity
Mexico 2011, % of final energyfinal energies, energy-sector losses
therm. losses oil (10,03%)
therm. losses coal (7,61%)therm. losses renewable (8,41%)
therm. losses nuclear (2,51%)
remaining losses (43,51%)
therm. losses gas (19,42%)electrical losses (8,51%)
Losses of the energy sector, 70 Mtoecorresponding emissions: 162 Mt CO2
Mexico, 2011--> 2.3 Mt/Mtoe
246 Appendix: Energy Flow, Energy Demand and CO2 Emissions …
Mexico
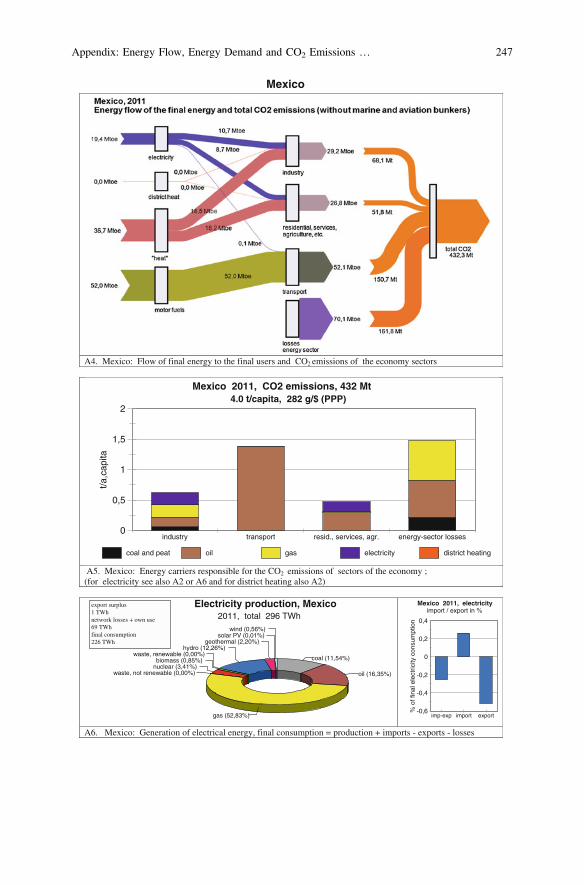
A4. Mexico: Flow of final energy to the final users and CO2 emissions of the economy sectors
A5. Mexico: Energy carriers responsible for the CO2 emissions of sectors of the economy ; (for electricity see also A2 or A6 and for district heating also A2)
A6. Mexico: Generation of electrical energy, final consumption = production + imports - exports - losses
0
0,5
1
1,5
2
t/a,c
apita
industry transport resid., services, agr. energy-sector losses
coal and peat oil gas electricity district heating
Mexico 2011, CO2 emissions, 432 Mt4.0 t/capita, 282 g/$ (PPP)
oil (16,35%)
coal (11,54%)
waste, not renewable (0,00%)nuclear (3,41%)biomass (0,85%)
waste, renewable (0,00%)hydro (12,26%)
geothermal (2,20%)solar PV (0,01%)
wind (0,56%)
gas (52,83%)
Electricity production, Mexico2011, total 296 TWh
export surplus 1 TWh network losses + own use 69 TWh final consumption 226 TWh
-0,6
-0,4
-0,2
0
0,2
0,4
% o
f fin
al e
lect
ricity
con
sum
ptio
n
imp-exp import export
Mexico 2011, electricityimport / export in %
Appendix: Energy Flow, Energy Demand and CO2 Emissions … 247

Russia
A1. Russia: Energy flow in the energy sector from primary to final energy and total CO2 emissions. Color of the energy carriers as in A2 and A5 (petroleum dark brown, oil products light brown)
A2. Russia: Shares of energy carriers for obtaining the final energies ("heat", motor fuels, electricity, district heating) and to cover the losses of the energy sector
A3. Russia: Percentage distribution of losses in the energy sector; contributors to CO2 emissions include thermal losses of fossil-fuel plants, the electrical losses and the residual losses
-20
0
20
40
60
80
100%
= 3
92 M
toe
"heat" motor fuels electricity district heating energy-sector losses
coal and peat oil gas biomass and waste
other renewables nuclear hydroelectricity
Russia 2011, % of final energyfinal energies, energy-sector losses
therm. losses oil (2,13%)therm. losses coal (10,50%)
therm. losses renewable (0,67%)therm. losses nuclear (11,09%)
remaining losses (33,12%)
therm. losses gas (32,91%)electrical losses (9,58%)
Losses of the energy sector, 272 Mtoecorresponding emissions: 682 Mt CO2
Russia 2011--> 2.5 Mt/Mtoe
248 Appendix: Energy Flow, Energy Demand and CO2 Emissions …

Russia
A4. Russia: Flow of final energy to the final users and CO2 emissions of the economy sectors
A5. Russia: Energy carriers responsible for the CO2 emissions of sectors of the economy ; (for electricity see also A2 or A6 and for district heating also A2)
6. Russia: Generation of electrical energy, final consumption = production + imports - exports - losses
0
1
2
3
4
5
t/a,c
apita
industry transport resid., services, agr. energy-sector losses
coal and peat oil gas electricity district heating
Russia 2011, CO2 emissions1653 Mt, 11.6 t/capita, 751 g/$ (PPP)
oil (2,59%)
coal (15,58%)
nuclear (16,40%)
biomass (0,00%)waste, renewable (0,26%)
hydro (15,89%)geothermal (0,05%)
wind (0,00%)
gas (49,22%)
waste, not renewable (0,00%)
Electricity production, Russia2011, total 1055 TWh export surplus
23 TWh network losses end own use 303 TWh final consumption 729 TWh
-4
-3
-2
-1
0
1
% o
f fin
al e
lect
ricity
con
sum
ptio
n
imp-exp import export
Russia 2011, electricityimport / export in %
Appendix: Energy Flow, Energy Demand and CO2 Emissions … 249

Saudi Arabia
A1. Saudi Arabia: Energy flow in the energy sector from primary to final energy and total CO2 emissions. Color of the energy carriers as in A2 and A5 (petroleum dark brown, oil products light brown)
A2. Saudi Arabia: Shares of energy carriers for obtaining the final energies ("heat", motor fuels, electricity, district heating) and to cover the losses of the energy sector
A3. Saudi Arabia: Percentage distribution of losses in the energy sector; contributors to CO2 emissions include thermal losses of fossil-fuel plants, the electrical losses and the residual losses
0
20
40
60
80
100
100%
= 7
4 M
toe
"heat" motor fuels electricity district heating energy-sector losses
coal and peat oil gas biomass and waste
other renewables nuclear hydroelectricity
Saudi Arabia 2011, % of final energyfinal energies, energy-sector losses
therm. losses oil (38,83%)
therm. losses coal (0,00%)therm. losses renewable (0,00%)therm. losses nuclear (0,00%)
remaining losses (26,68%)
electrical losses (4,95%)
therm. losses gas (29,53%)
Losses of the energy sector, 69 Mtoecorresponding emissions: 209 Mt CO2
Saudi Arabia 2011--> 3.0 Mt/Mtoe
250 Appendix: Energy Flow, Energy Demand and CO2 Emissions …

Saudi Arabia
A4. Saudi Arabia: Flow of final energy to the final users and CO2 emissions of the economy sectors
A5. Saudi Arabia: Energy carriers responsible for the CO2 emissions of sectors of the economy ; (for electricity see also A2 or A6 and for district heating also A2)
A6. Saudi Arabia: Generation of electrical energy, final consumption = production + imports - exports - losses
0123456789
10
t/a,c
apita
industry transport resid., services, agr. energy-sector losses
coal and peat oil gas electricity district heating
Saudi Arabia 2011, CO2 emissions457 Mt, 16,3 t/capita, 595 g/$ (PPP)
gas (43,34%)
oil (56,66%)
Electricity production, Saudi Arabia2011, total 250 TWh import/export
0 TWh network losses + own use 40 TWh final consumption 210 TWh
Appendix: Energy Flow, Energy Demand and CO2 Emissions … 251

South Africa
A1. South Africa: Energy flow in the energy sector from primary to final energy and total CO2 emissions. Color of the energy carriers as in A2 and A5 (petroleum dark brown, oil products light brown)
A2. South Africa: Shares of energy carriers for obtaining the final energies ("heat", motor fuels, electricity, district heating) and to cover the losses of the energy sector
A3. South Africa: Percentage distribution of losses in the energy sector; contributors to CO2 emissions include thermal losses of fossil-fuel plants, the electrical losses and the residual losses
0
20
40
60
80
100
120
100%
= 6
6 M
toe
"heat" motor fuels electricity district heating energy-sector losses
coal and peat oil gas biomass and waste
other renewables nuclear hydroelectricity
South Africa 2011, % of final energyfinal energies, energy-sector losses
therm. losses renewable (0,11%)therm. losses nuclear (3,36%)
remaining losses (37,13%)
therm. losses coal (52,92%)
electrical losses (6,44%)therm. losses gas (0,00%)
therm. losses oil (0,04%)
Losses of the energy sector, 70 Mtoecorresponding emissions: 209 Mt CO2
South Africa 2011--> 3.0 Mt/Mtoe
252 Appendix: Energy Flow, Energy Demand and CO2 Emissions …

South Africa
A4. South Africa: Flow of final energy to the final users and CO2 emissions of the economy sectors
A5. South Africa: Energy carriers responsible for the CO2 emissions of sectors of the economy ; (for electricity see also A2 or A6 and for district heating also A2)
A6. South Africa: Generation of electrical energy, final consumption = production + imports - exports - losses
0
1
2
3
4
5
t/a,c
apita
industry transport resid., services, agr. energy-sector losses
coal and peat oil gas electricity district heating
South Africa 2011, CO2 emissions368 Mt, 7.3 t/capita, 715 g/$ (PPP)
oil (0,08%)nuclear (5,14%)
biomass (0,11%)hydro (1,91%)
solar PV (0,01%)wind (0,04%)
coal (92,71%)
Electricity production, South Africa2011, total 263 TWh
export surplus 4 TWh network losses and own use 53 TWh final consumption 207 TWh
-8
-6
-4
-2
0
2
4
6
% o
f fin
al e
lect
ricity
con
sum
ptio
n
imp-exp import export
South Africa 2011, electricityimport / export in %
Appendix: Energy Flow, Energy Demand and CO2 Emissions … 253

South Korea
A1. South Korea: Energy flow in the energy sector from primary to final energy and total CO2 emissions. Color of the energy carriers as in A2 and A5 (petroleum dark brown, oil products light brown)
A2. South Korea: Shares of energy carriers for obtaining the final energies ("heat", motor fuels, electricity, district heating) and to cover the losses of the energy sector
A3. South Korea: Percentage distribution of losses in the energy sector; contributors to CO2 emissions include thermal losses of fossil-fuel plants, the electrical losses and the residual losses
0
20
40
60
80
100
100%
= 1
21 M
toe
"heat" motor fuels electricity district heating energy-sector losses
coal and peat oil gas biomass and waste
other renewables nuclear hydroelectricity
South Korea 2011, % of final energyfinal energies, energy-sector losses
therm. losses nuclear (27,18%)
electrical losses (4,56%)
remaining losses (22,53%)
therm. losses renewable (0,42%)
therm. losses coal (35,08%)
therm. losses gas (8,50%)therm. losses oil (1,74%)
Losses of the energy sector, 99 Mtoecorresponding emissions: 263 Mt CO2
South Korea 2011--> 2.6 Mt/Mtoe
254 Appendix: Energy Flow, Energy Demand and CO2 Emissions …

South Korea
A4. South Korea: Flow of final energy to the final users and CO2 emissions of the economy sectors
A5. South Korea: Energy carriers responsible for the CO2 emissions of sectors of the economy ; (for electricity see also A2 or A6 and for district heating also A2)
A6. South Korea: Generation of electrical energy, final consumption = production + imports - exports - losses
0
1
2
3
4
5
6
7
t/a,c
apita
industry transport resid., services, agr. energy-sector losses
coal and peat oil gas electricity district heating
South Korea 2011, CO2 emissions 588 Mt, 11.8 t/capita, 410 g/$ (PPP)
coal (42,91%)nuclear (29,57%)
biomass (0,19%)waste, renewable (0,02%)
hydro (1,50%)solar PV (0,18%)
wind (0,16%)
oil (3,18%)
waste, not renewable (0,19%)
gas (22,11%)
Electricity production, South Korea2011, total 523 TWh import/export
0 TWh network losses and own use 53 TWh final consumption 471 TWh
Appendix: Energy Flow, Energy Demand and CO2 Emissions … 255

Turkey
A1. Turkey: Energy flow in the energy sector from primary to final energy and total CO2 emissions. Color of the energy carriers as in A2 and A5 (petroleum dark brown, oil products light brown)
A2. Turkey: Shares of energy carriers for obtaining the final energies ("heat", motor fuels, electricity, district heating) and to cover the losses of the energy sector
A3. Turkey: Percentage distribution of losses in the energy sector; contributors to CO2 emissions include ther-mal losses of fossil-fuel plants, the electrical losses and the residual losses
0
10
20
30
40
50
60
100%
= 7
5 M
toe
"heat" motor fuels electricity district heating energy-sector losses
coal and peat oil gas biomass and waste
other renewables nuclear hydroelectricity
Turkey 2011, % of final energyfinal energies, energy-sector losses
therm. losses coal (34,65%)
therm. losses renewable (1,94%)therm. losses nuclear (0,00%)
remaining losses (25,39%)
therm. losses oil (0,45%)therm. losses gas (24,66%)
electrical losses (12,91%)
Losses of the energy sector, 31 Mtoecorresponding emissions: 94 Mt CO2
Turkey 2011--> 3.0 Mt/Mtoe
256 Appendix: Energy Flow, Energy Demand and CO2 Emissions …

Turkey
A4. Turkey: Flow of final energy to the final users and CO2 emissions of the economy sectors
A5. Turkey: Energy carriers responsible for the CO2 emissions of sectors of the economy ; (for electricity see also A2 or A6 and for district heating also A2)
A6. Turkey: Generation of electrical energy, final consumption = production + imports - exports - losses
0
0,5
1
1,5
2
t/a,c
apita
industry transport resid., services, agr. energy-sector losses
coal and peat oil gas electricity district heating
Turkey 2011, CO2 emissions286 Mt, 3.9 t/capita, 288 g/$ (PPP)
coal (28,87%)hydro (22,82%)geothermal (0,30%)
solar PV (0,00%)wind (2,06%)
oil (0,39%)biomass (0,15%)
waste, not renewable (0,05%)
gas (45,36%)
Electricity production, Turkey2011, total 229 TWh import surplus
1 TWh network losses and own use 47 TWh final consumption 184 TWh
-2
-1
0
1
2
3
% o
f fin
al e
lect
ricity
con
sum
ptio
n
imp-exp import export
Turkey 2011, electricityimport / export in %
Appendix: Energy Flow, Energy Demand and CO2 Emissions … 257
United Kingdom
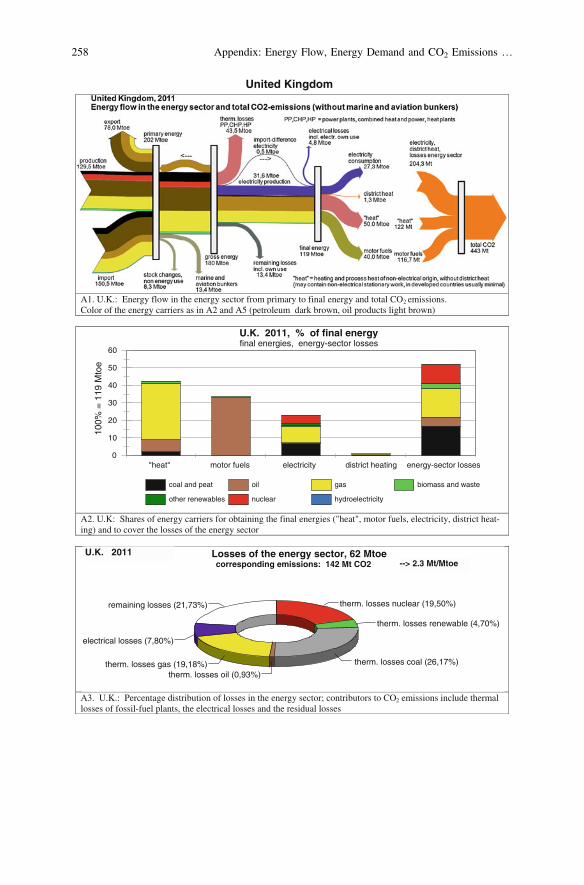
A1. U.K.: Energy flow in the energy sector from primary to final energy and total CO2 emissions. Color of the energy carriers as in A2 and A5 (petroleum dark brown, oil products light brown)
A2. U.K: Shares of energy carriers for obtaining the final energies ("heat", motor fuels, electricity, district heat-ing) and to cover the losses of the energy sector
A3. U.K.: Percentage distribution of losses in the energy sector; contributors to CO2 emissions include thermal losses of fossil-fuel plants, the electrical losses and the residual losses
0
10
20
30
40
50
60
100%
= 1
19 M
toe
"heat" motor fuels electricity district heating energy-sector losses
coal and peat oil gas biomass and waste
other renewables nuclear hydroelectricity
U.K. 2011, % of final energyfinal energies, energy-sector losses
therm. losses renewable (4,70%)
therm. losses nuclear (19,50%)remaining losses (21,73%)
therm. losses coal (26,17%)
electrical losses (7,80%)
therm. losses gas (19,18%)therm. losses oil (0,93%)
Losses of the energy sector, 62 Mtoecorresponding emissions: 142 Mt CO2
U.K. 2011--> 2.3 Mt/Mtoe
258 Appendix: Energy Flow, Energy Demand and CO2 Emissions …
United Kingdom
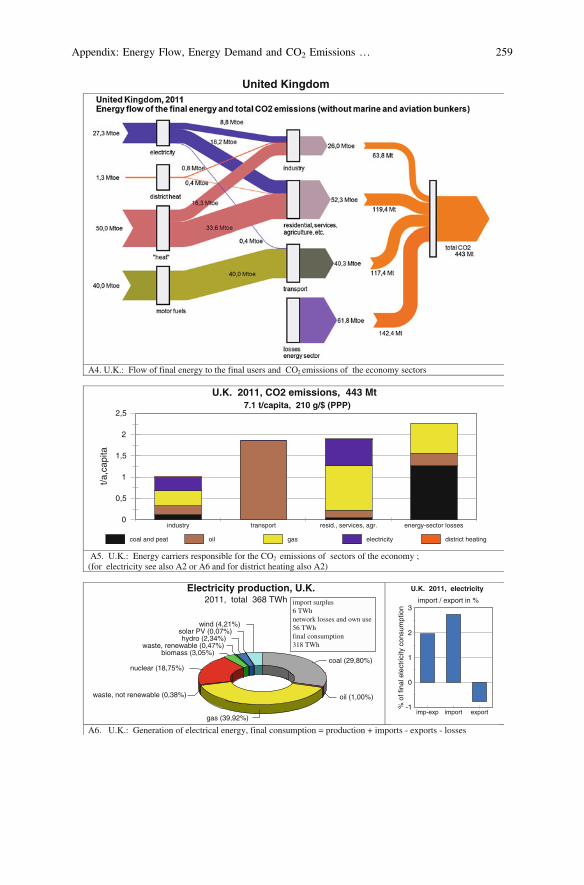
A4. U.K.: Flow of final energy to the final users and CO2 emissions of the economy sectors
A5. U.K.: Energy carriers responsible for the CO2 emissions of sectors of the economy ; (for electricity see also A2 or A6 and for district heating also A2)
A6. U.K.: Generation of electrical energy, final consumption = production + imports - exports - losses
0
0,5
1
1,5
2
2,5
t/a,c
apita
industry transport resid., services, agr. energy-sector losses
coal and peat oil gas electricity district heating
U.K. 2011, CO2 emissions, 443 Mt7.1 t/capita, 210 g/$ (PPP)
coal (29,80%)nuclear (18,75%)
biomass (3,05%)waste, renewable (0,47%)
hydro (2,34%)solar PV (0,07%)
wind (4,21%)
oil (1,00%)waste, not renewable (0,38%)
gas (39,92%)
Electricity production, U.K.2011, total 368 TWh import surplus
6 TWh network losses and own use 56 TWh final consumption 318 TWh
-1
0
1
2
3
% o
f fin
al e
lect
ricity
con
sum
ptio
n
imp-exp import export
U.K. 2011, electricity
import / export in %
Appendix: Energy Flow, Energy Demand and CO2 Emissions … 259
United States of America
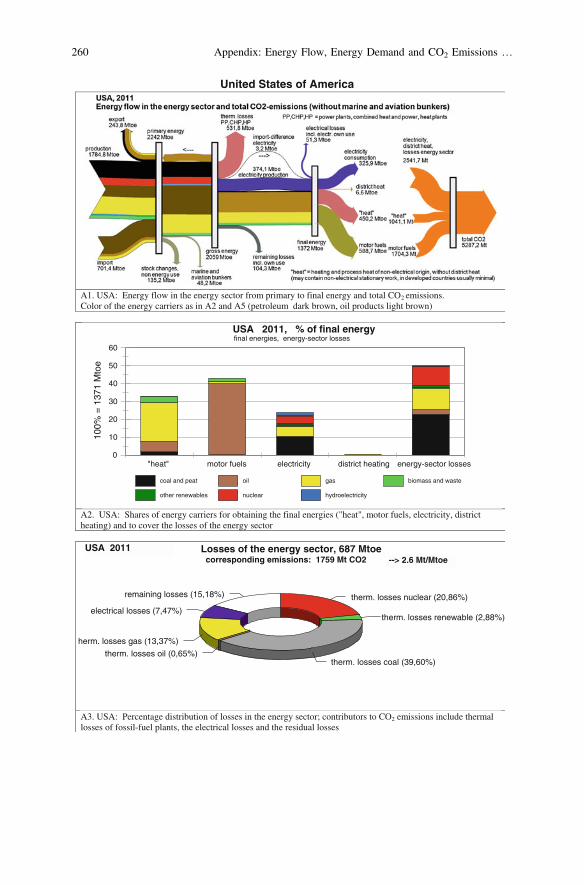
A1. USA: Energy flow in the energy sector from primary to final energy and total CO2 emissions. Color of the energy carriers as in A2 and A5 (petroleum dark brown, oil products light brown)
A2. USA: Shares of energy carriers for obtaining the final energies ("heat", motor fuels, electricity, district heating) and to cover the losses of the energy sector
A3. USA: Percentage distribution of losses in the energy sector; contributors to CO2 emissions include thermal losses of fossil-fuel plants, the electrical losses and the residual losses
0
10
20
30
40
50
60
100%
= 1
371
Mto
e
"heat" motor fuels electricity district heating energy-sector losses
coal and peat oil gas biomass and waste
other renewables nuclear hydroelectricity
USA 2011, % of final energyfinal energies, energy-sector losses
therm. losses renewable (2,88%)
therm. losses nuclear (20,86%)
electrical losses (7,47%)
remaining losses (15,18%)
therm. losses coal (39,60%)
herm. losses gas (13,37%)
therm. losses oil (0,65%)
Losses of the energy sector, 687 Mtoecorresponding emissions: 1759 Mt CO2
USA 2011--> 2.6 Mt/Mtoe
260 Appendix: Energy Flow, Energy Demand and CO2 Emissions …

United States of America
A4. USA: Flow of final energy to the final users and CO2 emissions of the economy sectors
A5. USA: Energy carriers responsible for the CO2 emissions of sectors of the economy ; (for electricity see also A2 or A6 and for district heating also A2)
A6. USA: Generation of electrical energy, final consumption = production + imports - exports – losses
0
1
2
3
4
5
6
t/a,c
apita
industry transport resid., services, agr. energy-sector losses
coal and peat oil gas electricity district heating
USA 2011, CO2 emissions, 5287 Mt16.9 t/capita, 380 g/$ (PPP)
coal (43,12%)nuclear (18,88%)
biomass (1,23%)waste, renewable (0,20%)
hydro (7,92%)geothermal (0,41%)
solar PV (0,12%)solar thermal (0,02%)
wind (2,78%)
oil (0,91%)
waste, not renewable (0,37%)
gas (24,03%)
Electricity production, USA2011, total 4350 TWh import surplus
37 TWh network losses and own use 597 TWh final consumption 3790 TWh
-0,5
0
0,5
1
1,5
% o
f fin
al e
lect
ricity
con
sum
ptio
n
imp-exp import export
USA 2011, electricityimport / export in %
Appendix: Energy Flow, Energy Demand and CO2 Emissions … 261

Bibliography
1. IPCC (Intergovernmental Panels on Climate Change) (2013) 5th report, WG I. Sept 20132. IPCC (2014) 5th report Working Group II. Mar 20143. IPCC (2014) 5th report Working Group III. Apr 20144. Steinacher M, Joos F, Stocker TF (2013) Allowable carbon emissions lowered by multiple
climate targets. Nature 499:197–2015. IEA (International Energy Agency) (2014) Statistics & Balances. www.iea.org6. IEA (2013) World Energy Outlook. www.iea.org7. Oliver Geden (2012) SWP-Studie, Die Modifikation des 2-Grad-Ziels, Berlin8. IMF (International Monetary Fund) (2013) World Economic Databases. Oct 20139. IEA (2004–2012) World Energy Outlooks.10. Crastan V (2012) Elektrische Energieversorgung 2, 3rd edn. Springer, Berlin11. IEA (2011) CO2-Emissions from Fuel Combustion. Highlights 201112. IEA (2006–2013) Key World Energy Statistics.13. IMF (International Monetary Fund) (2014) World Economic Databases. Apr 2014
© Springer International Publishing Switzerland 2014V. Crastan, Global Energy Demand and 2-degree Target, Report 2014,DOI 10.1007/978-3-319-12310-3
263