APPENDIX E. MEDICARE REIMBURSEMENT TO PHYSICIANS - GPO · APPENDIX E. MEDICARE REIMBURSEMENT TO...
38
(1195) APPENDIX E. MEDICARE REIMBURSEMENT TO PHYSICIANS CONTENTS Physician Payment Reform Medicare Fee Schedule Medicare Volume Performance Standards; Sustainable Growth Rate and Conversion Factor Updates Medicare Volume Performance Standards Sustainable Growth Rate Conversion Factor Updates Limits on Beneficiary Liability Medical Care Outcomes and Effectiveness Research Impact of Medicare Fee Schedule Historical Data Assignment Rate Experience Participating Physician Program Data Distribution of Physician Services References PHYSICIAN PAYMENT REFORM The Omnibus Budget Reconciliation Act of 1989 (OBRA 1989) provided for the implementation, beginning January 1, 1992, of a new payment system for physicians’ services paid for by Medicare. This fee schedule payment system replaced the previous reasonable charge payment system. The new system was enacted in response to two principal concerns. The first was the rapid escalation in pro- gram payments. The second was that the use of the reasonable charge payment had led, in many cases, to payments which were not directly related to the resources used. The Balanced Budget Act of 1997 (BBA 1997) made several modifications to the fee schedule payment system. Medicare payments for physicians’ services are made under a fee schedule which is based on a resource-based relative value scale (RBRVS). Annual updates to the payment amounts are based, in part, on a comparison of actual physician spending in a base period compared to an expenditure goal. The expenditure goal in place prior to fiscal year 1998 was known as the Medicare volume per- formance standard (MVPS). Beginning in fiscal year 1998 the MVPS is replaced by the sustainable growth rate (SGR). Use of an expenditure goal was intended to moderate the rate of growth in physician expenditures. The law also places limits on amounts that physicians can bill in excess of Medicare’s approved payment amount.
Transcript of APPENDIX E. MEDICARE REIMBURSEMENT TO PHYSICIANS - GPO · APPENDIX E. MEDICARE REIMBURSEMENT TO...

(1195)
APPENDIX E. MEDICARE REIMBURSEMENT TOPHYSICIANS
CONTENTS
Physician Payment ReformMedicare Fee ScheduleMedicare Volume Performance Standards; Sustainable
Growth Rate and Conversion Factor UpdatesMedicare Volume Performance StandardsSustainable Growth RateConversion Factor Updates
Limits on Beneficiary LiabilityMedical Care Outcomes and Effectiveness ResearchImpact of Medicare Fee ScheduleHistorical Data
Assignment Rate ExperienceParticipating Physician Program DataDistribution of Physician Services
References
PHYSICIAN PAYMENT REFORM
The Omnibus Budget Reconciliation Act of 1989 (OBRA 1989)provided for the implementation, beginning January 1, 1992, of anew payment system for physicians’ services paid for by Medicare.This fee schedule payment system replaced the previous reasonablecharge payment system. The new system was enacted in responseto two principal concerns. The first was the rapid escalation in pro-gram payments. The second was that the use of the reasonablecharge payment had led, in many cases, to payments which werenot directly related to the resources used. The Balanced Budget Actof 1997 (BBA 1997) made several modifications to the fee schedulepayment system.
Medicare payments for physicians’ services are made under a feeschedule which is based on a resource-based relative value scale(RBRVS). Annual updates to the payment amounts are based, inpart, on a comparison of actual physician spending in a base periodcompared to an expenditure goal. The expenditure goal in placeprior to fiscal year 1998 was known as the Medicare volume per-formance standard (MVPS). Beginning in fiscal year 1998 theMVPS is replaced by the sustainable growth rate (SGR). Use of anexpenditure goal was intended to moderate the rate of growth inphysician expenditures. The law also places limits on amounts thatphysicians can bill in excess of Medicare’s approved paymentamount.

1196
MEDICARE FEE SCHEDULE
The Secretary of the Department of Health and Human Services(DHHS) is required to establish a fee schedule before January 1 ofeach year that sets payment amounts for all physicians’ servicesfurnished in all fee schedule areas for the year. The fee scheduleamount for a service is equal to the product of:
—The relative value for the service;—The geographic adjustment factor (GAF) for the service for the
fee schedule area; and—The national dollar conversion factor for the year.
Relative value unitThe relative value unit (RVU) for each service, the first factor
used to calculate the fee schedule, has three components:—The physician work component reflects physician time and in-
tensity, including activities before and after patient contact;—The practice expense or overhead component includes all cat-
egories of practice expenses (exclusive of malpractice liabilityinsurance costs). Included are office rents, employee wages,physician compensation, and physician fringe benefits; and
—The malpractice expense component reflects costs of obtainingmalpractice insurance.
The proportion that each component represents of the total RVUvaries by service.
The work relative value units incorporated in the initial feeschedule were based on resource costs. They were developed afterextensive input from the physician community. Refinements in ex-isting values and establishment of values for new services havebeen included in the annual fee schedule update. In addition,HCFA is required to conduct a review of all values at least every5 years. The results of the first review were incorporated in thevalues used in 1997.
The practice expense and malpractice expense relative valueunits included in the initial fee schedule were based on historicalcharges. An analysis by the Physician Payment Review Commis-sion (PPRC) suggested that practice expense relative value unitsfor a service were most likely to be overvalued when they exceededthe work relative value units by a substantial amount. OBRA 1993provided for reductions in 1994, 1995, and 1996 in cases where thenumber of practice expense relative value units was substantiallymore than the number of work relative value units for the service.The Social Security Act Amendments of 1994 required the Sec-retary to develop a methodology for a resource-based system to beimplemented in 1998.
BBA 1997 provides for a phase-in of the resource-based meth-odology for practice expenses. In 1998, there will be a reallocationof no more than $390 million in practice expense relative valueunits from services whose number of practice expense relativevalue units exceed 110 percent of the number of work relativevalue units. Not included are services provided 75 percent of thetime in an office setting or services which would receive an in-crease under HCFA’s proposed regulations issued June 18, 1997.The amount reduced would be added to the practice expense rel-

1197
ative value units of physician office procedure codes. A new prac-tice expense methodology will be phased in over the 1999–2002 pe-riod. In 1999, 25 percent of the practice payment will be based onthe new methodology. This percentage will increase to 50 percentin 2000, 75 percent in 2001, and 100 percent in 2002. The Sec-retary is also required to develop new resource-based methodologyfor practice expenses. In developing the units, the Secretary is re-quired, to the maximum extent practicable, to utilize generally ac-cepted accounting principles. The Secretary is also required to useactual data on equipment and other key factors. Proposed rule-making is to be published by May 1, 1998.
BBA 1997 directs HCFA to develop and implement a resource-based methodology for malpractice expenses to be implemented byJanuary 2000.
Geographic adjustment factorThe second factor used in calculation of the fee schedule is the
geographic adjustment factor (GAF) for the fee schedule area.There are currently 89 fee schedule areas nationwide. A com-prehensive revision of fee schedule payment areas occurred in1997, reducing the number of locations from 210 to 89.
The GAF is designed to account for geographic variations in thecosts of practicing medicine and obtaining malpractice insurance aswell as a portion of the difference in physicians’ incomes that is notattributable to these factors.
The GAF is the sum of three indices. Separate geographic prac-tice cost indices (GPCIs) have been developed for each of the threecomponents of the RVU, namely a work GPCI, a practice expenseor overhead GPCI, and a malpractice GPCI. In effect, a separategeographic adjustment is made for each component. However, asrequired by law, only one-quarter of the geographic variation inphysician work resource costs is taken into account in the formula.(Table E–21 at the end of this chapter shows the GAF values foreach of the 89 fee schedule areas nationwide.)
The three GPCI-adjusted RVU values are summed to produce anindexed RVU for each locality.
Conversion factorThe conversion factor, which is the third fee schedule factor, is
a dollar multiplier which converts the geographically adjusted rel-ative value for a service to an actual payment amount for the serv-ice. The law initially required the establishment of a single conver-sion factor. Beginning in 1993, two conversion factors applied—onefor surgical services and one for nonsurgical services. Beginning in1994, there were three conversion factors—one for surgical, one forprimary care, and one for nonsurgical services. The 1997 conver-sion factors are $40.96 for surgical services, $35.77 for primarycare services, and $33.85 for other nonsurgical services. Thus, thepayment for a surgical service with an adjusted relative value oftwo is $81.92; the payment for a primary care service with an ad-justed relative value of two is $71.54; the payment for a nonsur-gical service with an adjusted relative value of two is $67.70. Anes-thesiologists are paid under a separate fee schedule which uses

1198
base and time units. A separate conversion factor ($16.68 in 1997)applies.
BBA 1997 establishes a single conversion factor beginning in1998. In 1998, the amount will be the 1997 primary care conver-sion factor, updated to 1998 by the average of the three separateupdates that would have occurred in the absence of the legislation.
Payment formulaThe payment for each service is calculated as follows:
Payment = CF × [(RVUwork × GPCIwork)+ (RVUpractice expense × GPCIpractice expense)+ (RVUmalpractice × GPCImalpractice)]
Where:CF = conversion factor;RVUwork = physician work relative value units for the service;GPCIwork = geographic practice cost index value for physician
work in the locality (the value reflects only one-quarter of the vari-ation in physician work as required by law);
RVUpractice expense = practice expense or overhead relative valueunits for the service;
GPCIpractice expense = geographic practice cost index value for prac-tice expense or overhead applicable in the locality;
RVUmalpractice = malpractice relative value units for the service;and
GPCImalpractice = geographic practice cost index value for mal-practice applicable in the locality.
MEDICARE VOLUME PERFORMANCE STANDARDS; SUS-TAINABLE GROWTH RATE AND CONVERSION FACTORUPDATES
A key element of the fee schedule is the conversion factor. Oneconsideration in establishing the annual update in the conversionfactor is whether efforts to stem the annual rate of growth in phy-sician payments have succeeded. This growth has been measuredby the Medicare volume performance standards (MVPSs). Begin-ning in fiscal year 1998, the MVPS is replaced by the sustainablegrowth rate (SGR).
MEDICARE VOLUME PERFORMANCE STANDARDS
The law has required the calculation of annual MVPSs, whichare standards for the rate of expenditure growth. The purpose ofthese standards has been to provide an incentive for physicians toget involved in efforts to stem expenditure increases. The relation-ship of actual expenditures to the MVPS has been one factor usedin determining the annual update in the conversion factor.
Implementation of the MVPS provision began in fiscal year 1990.As modified by subsequent legislation, there have been three sepa-rate MVPS rates of increase—one for surgical care, one for primarycare, and one for nonsurgical services.
The law contains a formula for calculating the annual update inthe MVPS. However, Congress may modify the update that wouldotherwise apply. The Secretary of DHHS has been required to
1199
make a recommendation to the Congress by April 15 each year. Inmaking the recommendation, the Secretary is to consider inflation,changes in the number of part B enrollees, changes in technology,appropriateness of care, and access to care. The Physician PaymentReview Commission (PPRC), a Congressional advisory body, hasbeen required to review the Secretary’s recommendation and sub-mit its own recommendation by May 15.
The Congress may establish the standard rates of increase. If theCongress does not specify the MVPS, however, the rates of increaseare determined based on the default formula. The default standardis the product of four factors reduced by a performance standardfactor of four percentage points. The four factors are:
—The Secretary’s estimate of the weighted average percentageincrease in physicians’ fees for services for the portions of thecalendar years included in the fiscal year involved;
—The Secretary’s estimate of the percentage change from theprevious year in the number of part B enrollees (other thanHMO enrollees);
—The Secretary’s estimate of the average annual percentagegrowth in volume and intensity of physicians’ services for thepreceding 5 fiscal years; and
—The Secretary’s estimate of the percentage change in physicianexpenditures in the fiscal year (not taken into account above)which will result from changes in law or regulations.
The MVPS for fiscal year 1997 is a decrease of 3.7 percent forsurgical services and 0.5 percent for other nonsurgical services.There is an increase of 4.5 percent for primary care services (seetable E–1).
TABLE E–1.—MEDICARE VOLUME PERFORMANCE STANDARDS, 1990–97
Fiscal year Surgical Nonsurgical Primarycare All
1990 ....................................................... (1) (1) (2) 9.11991 ....................................................... 3.3 8.6 (2) 7.31992 ....................................................... 6.5 11.2 (2) 10.01993 ....................................................... 8.4 10.8 (2) 10.01994 ....................................................... 9.1 9.2 10.5 9.41995 ....................................................... 9.2 4.4 13.8 7.51996 ....................................................... ¥0.5 0.6 9.3 1.81997 ....................................................... ¥3.7 ¥0.5 4.5 ¥0.3
1 Separate performance standards for surgical and nonsurgical services not required for fiscal year1990.
2 Separate performance standards for primary care services not required for fiscal years 1990–93.
Source: Federal Register 1996a.
SUSTAINABLE GROWTH RATE
Beginning in fiscal year 1998, the MVPS is replaced by a cumu-lative sustainable growth rate. The calculation of the sustainablegrowth rate uses the same factors used in the calculation of theMVPS, except that actual annual growth in gross domestic productreplaces the volume and intensity factor. Further, there is no per-formance factor reduction. The sustainable growth rate will begin

1200
affecting conversion factor updates in 1999. The sustainable growthrate must be published by August 1 of each year, except that therate for fiscal year 1998 must be published by November 1, 1997.
CONVERSION FACTOR UPDATES
Annual updates in payments under the fee schedule are made byupdating the dollar conversion factor. The law contains a formulafor calculating the annual updates. However, the Congress maymodify the updates that would otherwise apply.
In April of each year (1991–97), the Secretary of DHHS has beenrequired to recommend to the Congress the updates in the conver-sion factors for the following year. In making the update rec-ommendations, the Secretary has been required to consider a num-ber of factors including the percentage change in actual expendi-tures in the preceding fiscal year compared to the MVPS for thatyear, changes in volume and intensity of services, beneficiary ac-cess to care, and the increase in the Medicare economic index(MEI). The MEI is a percentage figure which is revised annually;it has been used in the program to limit annual increases in recog-nized fees. The MEI is generally intended to reflect annual in-creases in the costs of operating a medical practice; however, forseveral years the MEI percentage was set by the Congress. ThePPRC has been required to review the Secretary’s update rec-ommendation and submit its own recommendation to Congress byMay 15 of each year.
The Congress has either specified the updates to the conversionfactor or a default formula, specified in law, has applied. The de-fault fee update is equal to the Secretary’s estimate of the MEI in-creased or decreased by the percentage difference between the in-crease in actual expenditures and the MVPS for the second preced-ing fiscal year. (Thus, the 1997 updates reflect actual fiscal year1995 experience.) However, the law specifies a lower limit on thedefault update. The maximum downward adjustment in the updatehas been 5.0 percentage points. There has been no restriction onupward adjustments to the MEI.
Table E–2 shows the 1992–97 fee schedule updates. This tableshows what the MEI was for each year, the impact of the MVPScalculation (i.e., the ‘‘performance adjustment’’), legislative modi-fication (if any), and the resulting update percentage. The tablealso shows the conversion factors for each year.
BBA 1997 provides for a single conversion factor beginning in1998 and specifies rules for the calculation of the update in 1998and subsequent years. In 1998, the amount will be the 1997 pri-mary care conversion factor, updated to 1998 by the average of thethree separate updates that would have occurred in the absence ofthe legislation.
Beginning in 1999, the update will effectively be limited by theincrease in the gross domestic product. Specifically, the update willequal the product of the MEI and the update adjustment factor.The update adjustment factor will match spending on physiciansservices to the cumulative sustainable growth rate (which is linkedto the growth in the gross domestic product.) By November 1 ofeach year (beginning in 1998), the Secretary will calculate an up-date adjustment factor for the succeeding year. The calculation will
1201
be made on the basis of a comparison of cumulative target spend-ing (based on cumulative sustainable growth rate calculations) andcumulative actual spending from the base year (April 1997–March1998). Regardless of the result of this calculation, the update canbe no greater than 3 percentage points above nor no less than 7percentage points below the MEI.
TABLE E–2.—CONVERSION FACTORS: CALCULATION OF UPDATES AND ANNUALFACTORS, CALENDAR YEARS 1992–97
Calendar year
Calculation of update (in percent)
ConversionfactorMedicare
economicindex
Performanceadjustment
Legislativeadjustment Update
1992:All services ................... 3.2 ¥0.9 ¥0.4 1.9 $31.00
1993:Surgical ........................ 2.7 0.4 ................ 3.1 31.96Nonsurgical .................. 2.7 ¥1.9 ................ 0.8 31.25
1994:Surgical ........................ 2.3 11.3 ¥3.6 10.0 35.16Primary care ................. 2.3 5.6 0.0 7.9 33.72Other nonsurgical ......... 2.3 5.6 ¥2.6 5.3 32.90
1995:Surgical ........................ 2.1 12.8 ¥2.7 12.2 39.45Primary care ................. 2.1 5.8 0.0 7.9 36.38Other nonsurgical ......... 2.1 5.8 ¥2.7 5.2 34.62
1996:Surgical ........................ 2.0 1.8 ................ 3.8 40.80Primary care ................. 2.0 ¥4.3 ................ ¥2.3 35.42Other nonsurgical ......... 2.0 ¥1.6 ................ 0.4 34.63
1997:Surgical ........................ 2.0 ¥0.1 ................ 1.9 40.96Primary care ................. 2.0 0.5 ................ 2.5 35.77Other nonsurgical ......... 2.0 ¥2.8 ................ ¥0.8 33.85
Source: Federal Register 1996a.
LIMITS ON BENEFICIARY LIABILITY
Medicare pays 80 percent of the fee schedule amount after thebeneficiary has met the $100 deductible for the year. The bene-ficiary is responsible for the remaining 20 percent, known as coin-surance. If a physician does not accept assignment on a claim, thebeneficiary may be liable for additional charges known as balancebilling charges. However, the law places certain limits on these bal-ance billing charges.
Assignment/participationA physician is able to choose whether to accept assignment on a
claim paid under the fee schedule. In the case of an assigned claim,the physician bills the program directly and is paid an amountequal to 80 percent of the fee schedule amount (less any unmet de-ductible). The physician may not charge the beneficiary more than

1202
the applicable deductible and coinsurance amounts. In the case ofnonassigned claims, the physician still bills the program directly;however, Medicare payment is made to the beneficiary. In additionto the deductible and coinsurance amounts, the beneficiary is liablefor the difference between the fee schedule amount and the physi-cian’s actual charge, subject to certain limits. This is known as thebalance billed amount.
A physician may become a ‘‘participating physician’’ by volun-tarily entering into an agreement with the Secretary of DHHS toaccept assignment on all claims for the forthcoming year. Medicarepatients of these physicians never face balance billing charges.
The law includes a number of incentives for physicians to becomeparticipating physicians, chief of which is higher recognized feeschedule amounts. The fee schedule amount for a nonparticipatingphysician is only 95 percent of the recognized amount for a partici-pating physician.
The law specifies that physicians are required to accept assign-ment on all claims for persons who are dually eligible for Medicareand Medicaid. This includes ‘‘qualified Medicare beneficiaries’’(QMBs); these are persons with incomes below poverty for whomMedicaid is required to pay Medicare premiums and cost-sharingcharges.
Balance billing limitsNonparticipating physicians may charge beneficiaries more than
the fee schedule amount on nonassigned claims; these balance bill-ing charges are subject to certain limits. The limit is 115 percentof the fee schedule amount for nonparticipating physicians. Thenonparticipating physicians fee schedule payment level is 95 per-cent of the participating physicians level. Thus, the balance billinglimit is only 9.25 percent higher than the level recognized for par-ticipating physicians (95 percent × 115 percent).
MEDICAL CARE OUTCOMES AND EFFECTIVENESSRESEARCH
OBRA 1989 created a new agency, the Agency for Health CarePolicy and Research, which replaced the then-existing NationalCenter for Health Services Research in the Public Health Service.The mission of the new agency was to enhance the quality, appro-priateness and effectiveness of health care services and access tosuch services. These goals were to be accomplished by establishinga broad base of scientific research and promoting improvements inthe clinical practice of medicine and the organization, financing,and delivery of health care services.
Specifically, the agency was directed to conduct and support re-search, demonstration projects, evaluations, training, guideline de-velopment, and the dissemination of information on health careservices and delivery systems, including activities on: (1) the effec-tiveness, efficiency, and quality of health care services; (2) the out-comes of health care services and procedures; (3) clinical practice,including primary care and practice-oriented research; (4) healthcare technologies, facilities, and equipment; (5) health care costs,productivity, and market forces; (6) health promotion and disease

1203
prevention; (7) health statistics and epidemiology; and (8) medicalliability.
IMPACT OF MEDICARE FEE SCHEDULE
The Medicare fee schedule was designed to remove many of theinequities of the previous payment system by shifting paymentaway from tests and procedures toward evaluation and manage-ment services. Because the fee schedule was intended to be imple-mented in a budget-neutral fashion, total outlays under the newsystem were expected to match the outlays that would have oc-curred under the previous payment system. In general, under thenew payment system, primary care physicians were expected to re-ceive higher payments per service, and specialty physicians wereexpected to receive lower payments per service. Payment levels inrural areas were also expected to increase relative to metropolitanareas.
The overall payment level under the Medicare fee schedule is es-tablished through the conversion factor. In effect, the conversionfactor translates the relative value units for individual services intoactual dollar payments. Increases or decreases in the overall levelof payments are accomplished by adjusting the level of the conver-sion factor.
Using data from 1991, 1992, and 1993, PPRC examined the ini-tial impact of the Medicare fee schedule on physicians. From 1991to 1993, physicians’ payments per service declined by 4 percent.Surgical specialties had about an 8-percent reduction in paymentper service compared with the 2-percent increase for medical spe-cialties. Specialties that predominantly provide evaluation andmanagement services fared better. Payments to general and familypractitioners increased by 17 percent over the 2-year period, whilethose to internists rose by 2 percent. Pathologists and thoracic sur-geons had the largest reduction of 16 percent, followed by gastro-enterologists, radiologists, and cardiologists with reductions rang-ing from 10 to 12 percent.
The total Medicare payment a physician receives depends notonly on the payment per service but also on changes in the numberand intensity of services billed. Although physicians had about a 4-percent reduction in payment overall from 1991 to 1993, a 6-percent increase in the number and intensity of services per physi-cian led to about a 4-percent increase in total Medicare paymentper physician over the 2-year period.
PPRC analyzed Medicare claims data from the first 6 months of1995 and 1996 to measure changes in physician payment policy. In1996, Medicare’s physician payment rates decreased, on average,about 2 percent from 1995 levels (table E–3). Payment rates wereinfluenced the most by the low conversion factor updates for 1996and the completion of the transition to Medicare fee schedule pay-ments. Changes in relative value units (RVUs) had a lesser effect,and changes in the geographic adjustment factors had a negligibleeffect.

1204
TABLE E–3.—EFFECT OF POLICY CHANGES ON FEE SCHEDULE PAYMENTS, 1995–96
Type of service, location, and specialty
Totalchange inMedicarepayment
per service
Percentage change due to
Conversionfactor up-
dates
Relativevalue unitchanges
Geo-graphicadjust-
ment fac-tor
changes
Transitionto fee
schedule
Type of service:Evaluation and man-
agementPrimary care .......... 0.6 ¥2.3 1.8 0.0 1.1Other ...................... 2.0 0.4 0.1 0.0 1.5
Surgical .......................... ¥4.9 3.8 ¥1.6 0.0 ¥7.1Other nonsurgical ........... ¥3.4 0.4 1.0 0.1 ¥4.9
Location:Metropolitan areas
Greater than 1million ............... ¥2.0 0.6 0.5 0.2 ¥3.3
Less than 1 million ¥2.2 0.7 0.2 0.0 ¥3.1Rural counties
Greater than25,000 ............... ¥1.9 0.6 0.1 ¥0.3 ¥2.3
Less than 25,000 .. ¥0.5 0.0 0.2 ¥0.6 ¥0.1Specialty:
Primary careFamily/general
practice ............. 0.2 ¥1.2 0.3 ¥0.1 1.2Internal medicine .. ¥0.4 ¥0.8 0.5 0.1 ¥0.2
Other medicalCardiology ............ ¥6.5 0.1 ¥1.0 0.0 ¥5.6Gastroenterology .... ¥4.1 0.2 0.0 0.1 ¥4.4Other medical ........ 2.7 ¥0.1 3.9 0.1 ¥1.2
SurgicalDermatology ......... ¥0.2 2.3 0.0 0.1 ¥2.6General surgery ..... ¥1.5 2.5 ¥0.1 0.0 ¥3.9Ophthalmology ....... ¥9.6 2.3 ¥3.4 0.0 ¥8.5Orthopedic surgery ¥2.6 2.5 ¥0.5 0.0 ¥4.6Thoracic surgery .. ¥2.6 3.3 ¥0.2 0.0 ¥5.7Urology ................... 0.7 2.0 0.4 0.0 ¥1.7Other surgical ....... ¥2.4 1.9 ¥0.6 0.0 ¥3.7
OtherPathology ............. ¥6.2 0.4 ¥0.1 0.1 ¥6.6Radiology ............... ¥3.8 0.4 0.0 0.0 ¥4.2Other .................... ¥0.2 0.6 2.9 0.0 ¥3.7
All services ... ¥2.1 0.6 0.3 0.1 ¥3.1
Note.—Changes due to the transition to fee schedule based payments are calculated as the differencebetween total payment changes and the sum of changes attributable to relative value changes, geo-graphic adjustment factor changes, and conversion factor updates.
Source: Physician Payment Review Commission analysis of 1995–96 Medicare claims, 5 percent sampleof beneficiaries.
1205
In accordance with the volume performance standard system,conversion factor updates varied by type of service. For 1996, theupdates were ¥2.3 percent for primary care services, 3.8 percentfor surgical services, and 0.4 percent for other services. The aver-age conversion factor update for all services, weighted by total pay-ments in each service category, was 0.6 percent.
The variation in conversion factor updates led to differences inaverage updates among specialties and geographic areas, reflectingdifferences in the mix of services provided. The average updateranged from ¥1.2 percent for family/general practice to 3.3 percentfor thoracic surgery. For metropolitan areas and rural countieswith populations of more than 25,000, the average updates werenear the national average, 0.6–0.7 percent. For rural counties withpopulations less than 25,000, the average conversion factor was es-sentially unchanged from 1995 to 1996 because of the greater shareof primary care services provided in those counties.
Relative value unit changes implemented in 1996 included reduc-tions in practice expense RVUs for some procedures, as required bythe Omnibus Budget Reconciliation Act of 1993, and refinement ofwork RVUs for some procedures. The changes ranged, on average,from ¥1.6 percent for surgical services to 1.8 percent for primarycare.
Geographic adjustment factor (GAF) changes reflected the use ofmore current price data and technical improvements in calculatingthe payment adjustments. The GAF changes, which were intendedto be budget neutral, averaged less than 0.1 percent.
Effects of the final transition to the fee schedule varied by typeof service. Payment for primary care evaluation and management(EM) services increased 1.1 percent, while payment for other EMservices rose 1.5 percent. The transition caused payment reductionsfor all other types of services, including ¥7.1 percent for surgicalservices and ¥4.9 percent for nonsurgical services.
HISTORICAL DATA
ASSIGNMENT RATE EXPERIENCE
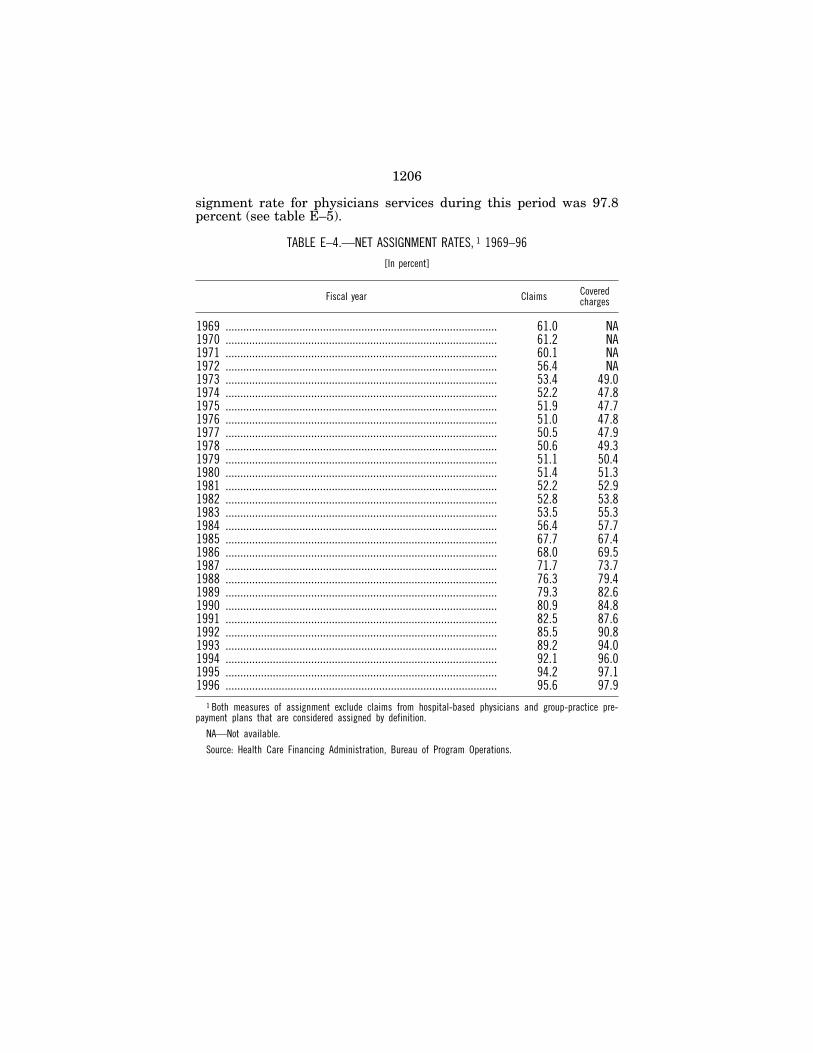
The total number of assigned claims as a percentage of totalclaims received by Medicare carriers for physicians and other medi-cal services is known as the total assignment rate. Initially, the netassignment rate was computed in the same manner except that itomitted hospital-based physicians and group-practice prepaymentplans which were considered assigned by definition (this distinctionis no longer made). The net assignment rate declined until the mid-1970s when the rate leveled off at about 50 percent. Since 1985,the rate has increased significantly, rising to 95.6 percent in 1996.This increase reflects both the impact of the participating physicianprogram as well as the requirement that laboratory services mustbe paid on an assigned basis. Table E–4 shows the net assignmentrates for fiscal years 1969–96.
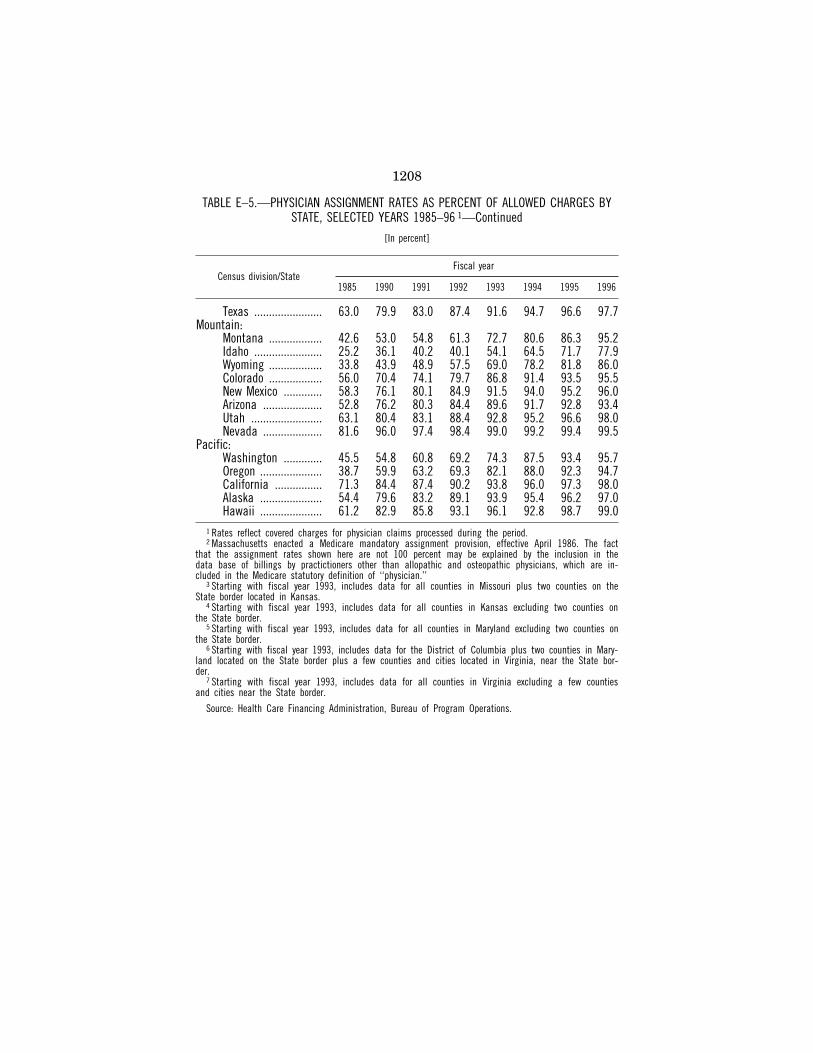
The statistics included in table E–4 are programwide data. As-signment rates vary geographically. For example, the assignmentrate (taken as a percent of dollars) for physician services in fiscalyear 1996 ranged from a low of 73.5 percent in South Dakota toa high of 99.9 percent in Rhode Island. The national average as-
1206
signment rate for physicians services during this period was 97.8percent (see table E–5).
TABLE E–4.—NET ASSIGNMENT RATES, 1 1969–96
[In percent]
Fiscal year Claims Coveredcharges
1969 ............................................................................................ 61.0 NA1970 ............................................................................................ 61.2 NA1971 ............................................................................................ 60.1 NA1972 ............................................................................................ 56.4 NA1973 ............................................................................................ 53.4 49.01974 ............................................................................................ 52.2 47.81975 ............................................................................................ 51.9 47.71976 ............................................................................................ 51.0 47.81977 ............................................................................................ 50.5 47.91978 ............................................................................................ 50.6 49.31979 ............................................................................................ 51.1 50.41980 ............................................................................................ 51.4 51.31981 ............................................................................................ 52.2 52.91982 ............................................................................................ 52.8 53.81983 ............................................................................................ 53.5 55.31984 ............................................................................................ 56.4 57.71985 ............................................................................................ 67.7 67.41986 ............................................................................................ 68.0 69.51987 ............................................................................................ 71.7 73.71988 ............................................................................................ 76.3 79.41989 ............................................................................................ 79.3 82.61990 ............................................................................................ 80.9 84.81991 ............................................................................................ 82.5 87.61992 ............................................................................................ 85.5 90.81993 ............................................................................................ 89.2 94.01994 ............................................................................................ 92.1 96.01995 ............................................................................................ 94.2 97.11996 ............................................................................................ 95.6 97.9
1 Both measures of assignment exclude claims from hospital-based physicians and group-practice pre-payment plans that are considered assigned by definition.
NA—Not available.
Source: Health Care Financing Administration, Bureau of Program Operations.
1207
TABLE E–5.—PHYSICIAN ASSIGNMENT RATES AS PERCENT OF ALLOWED CHARGES BYSTATE, SELECTED YEARS 1985–96 1
[In percent]
Census division/StateFiscal year
1985 1990 1991 1992 1993 1994 1995 1996
National ........................... 65.5 83.0 86.1 89.4 93.2 95.6 96.8 97.8New England:
Maine ...................... 81.5 92.4 94.4 96.7 98.0 98.6 99.1 99.4New Hampshire ....... 56.5 69.9 80.8 89.4 93.9 95.6 96.9 97.9Vermont ................... 64.3 94.7 95.9 97.8 98.6 99.0 99.1 99.3Massachusetts 2 ...... 93.7 99.5 99.5 99.6 99.7 99.7 99.8 99.8Rhode Island ........... 94.0 98.7 99.7 99.7 99.8 99.8 99.9 99.9Connecticut ............. 57.6 84.7 87.7 91.7 94.7 96.6 97.6 98.1
Middle Atlantic:New York ................. 70.3 81.9 84.4 87.7 90.7 93.2 95.6 97.0New Jersey .............. 62.3 73.0 76.3 80.5 85.4 89.7 92.6 94.9Pennsylvania ........... 88.1 95.7 98.5 99.1 99.4 99.6 99.6 99.7
East North Central:Ohio ......................... 50.8 82.6 87.3 92.5 97.7 99.5 99.7 99.8Indiana .................... 49.6 77.2 81.5 85.7 92.9 95.4 96.5 97.6Illinois ..................... 51.7 75.9 78.8 83.2 89.2 93.6 98.6 96.9Michigan ................. 88.2 94.5 94.4 95.9 97.8 98.6 99.0 99.2Wisconsin ................ 51.7 68.2 71.7 78.2 86.8 91.2 94.2 96.3
West North Central:Minnesota ............... 30.6 47.6 52.3 57.1 67.1 77.4 86.2 91.7Iowa ........................ 46.9 69.8 73.4 78.8 85.6 89.9 99.2 96.3Missouri 3 ................ 50.1 74.9 78.5 83.7 91.6 95.1 96.7 97.7North Dakota ........... 30.5 55.0 67.1 72.1 74.9 87.6 92.9 96.7South Dakota .......... 18.7 39.2 40.2 43.3 50.2 57.3 67.0 73.5Nebraska ................. 47.3 64.9 70.3 76.8 83.8 87.7 89.6 91.6Kansas 4 .................. 72.7 88.8 91.9 94.5 96.2 96.8 97.1 98.5
South Atlantic:Delaware ................. 81.8 90.5 92.9 95.2 96.8 97.5 97.8 98.6Maryland 5 ............... 81.6 91.4 92.8 94.3 96.7 97.5 98.1 98.6District of Colum-
bia 6 .................... 78.1 87.5 89.4 92.1 94.1 95.7 96.6 97.3Virginia 7 ................. 66.4 87.3 89.6 92.5 95.7 97.4 98.4 98.9West Virginia .......... 66.7 93.2 95.5 97.2 98.4 98.8 99.1 99.4North Carolina ........ 60.3 80.8 83.9 88.8 93.7 95.5 96.7 97.6South Carolina ........ 64.9 87.1 88.9 91.6 94.4 95.9 97.0 98.0Georgia .................... 63.9 83.5 96.6 90.3 94.0 96.3 97.4 98.3Florida ..................... 62.2 84.1 87.6 91.0 95.0 97.3 98.4 98.8
East South Central:Kentucky .................. 50.3 84.8 88.8 91.9 95.5 97.1 97.9 98.6Tennessee ............... 55.6 84.0 89.5 93.1 96.3 97.5 98.3 98.8Alabama .................. 74.6 92.3 94.9 96.6 98.0 98.6 98.9 99.2Mississippi .............. 63.5 88.1 90.6 93.1 95.6 97.1 97.8 98.5
West South Central:Arkansas ................. 72.6 92.0 93.7 95.4 96.6 97.9 98.7 99.0Louisiana ................ 51.0 88.0 91.0 93.8 95.2 96.9 98.1 98.8Oklahoma ................ 39.0 68.2 72.8 77.8 85.0 90.6 94.2 96.7
1208
TABLE E–5.—PHYSICIAN ASSIGNMENT RATES AS PERCENT OF ALLOWED CHARGES BYSTATE, SELECTED YEARS 1985–96 1—Continued
[In percent]
Census division/StateFiscal year
1985 1990 1991 1992 1993 1994 1995 1996
Texas ....................... 63.0 79.9 83.0 87.4 91.6 94.7 96.6 97.7Mountain:
Montana .................. 42.6 53.0 54.8 61.3 72.7 80.6 86.3 95.2Idaho ....................... 25.2 36.1 40.2 40.1 54.1 64.5 71.7 77.9Wyoming .................. 33.8 43.9 48.9 57.5 69.0 78.2 81.8 86.0Colorado .................. 56.0 70.4 74.1 79.7 86.8 91.4 93.5 95.5New Mexico ............. 58.3 76.1 80.1 84.9 91.5 94.0 95.2 96.0Arizona .................... 52.8 76.2 80.3 84.4 89.6 91.7 92.8 93.4Utah ........................ 63.1 80.4 83.1 88.4 92.8 95.2 96.6 98.0Nevada .................... 81.6 96.0 97.4 98.4 99.0 99.2 99.4 99.5
Pacific:Washington ............. 45.5 54.8 60.8 69.2 74.3 87.5 93.4 95.7Oregon ..................... 38.7 59.9 63.2 69.3 82.1 88.0 92.3 94.7California ................ 71.3 84.4 87.4 90.2 93.8 96.0 97.3 98.0Alaska ..................... 54.4 79.6 83.2 89.1 93.9 95.4 96.2 97.0Hawaii ..................... 61.2 82.9 85.8 93.1 96.1 92.8 98.7 99.0
1 Rates reflect covered charges for physician claims processed during the period.2 Massachusetts enacted a Medicare mandatory assignment provision, effective April 1986. The fact
that the assignment rates shown here are not 100 percent may be explained by the inclusion in thedata base of billings by practictioners other than allopathic and osteopathic physicians, which are in-cluded in the Medicare statutory definition of ‘‘physician.’’
3 Starting with fiscal year 1993, includes data for all counties in Missouri plus two counties on theState border located in Kansas.
4 Starting with fiscal year 1993, includes data for all counties in Kansas excluding two counties onthe State border.
5 Starting with fiscal year 1993, includes data for all counties in Maryland excluding two counties onthe State border.
6 Starting with fiscal year 1993, includes data for the District of Columbia plus two counties in Mary-land located on the State border plus a few counties and cities located in Virginia, near the State bor-der.
7 Starting with fiscal year 1993, includes data for all counties in Virginia excluding a few countiesand cities near the State border.
Source: Health Care Financing Administration, Bureau of Program Operations.
1209
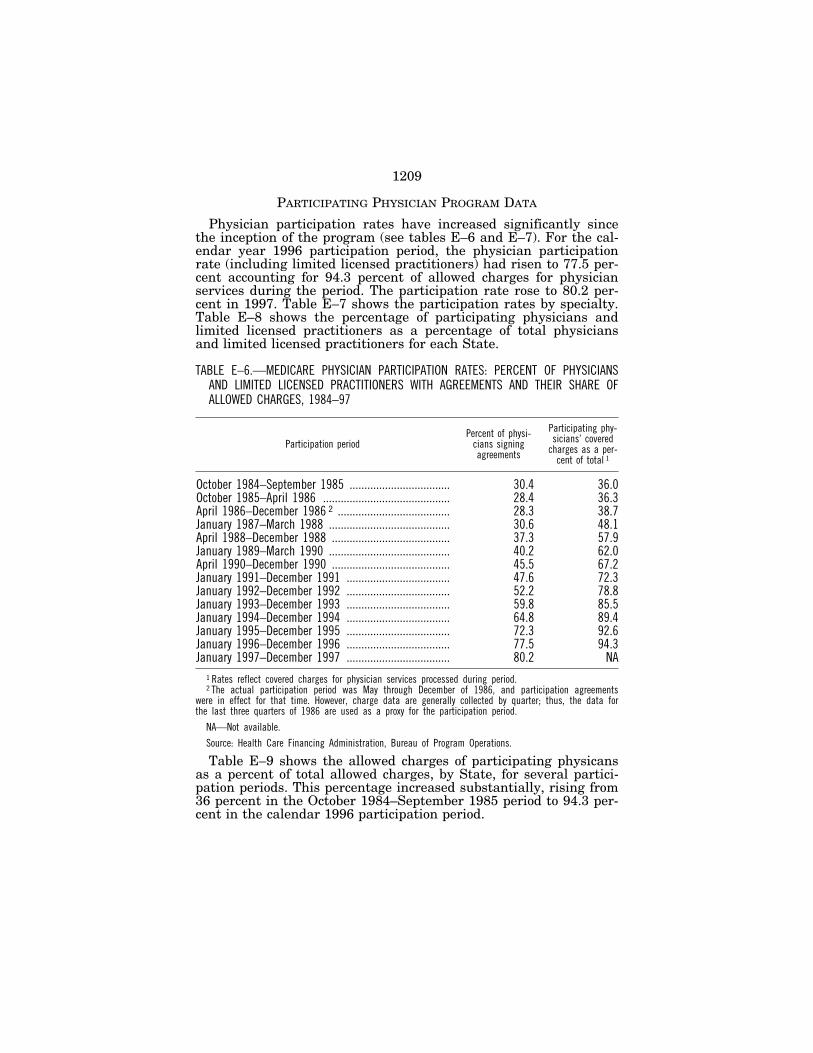
PARTICIPATING PHYSICIAN PROGRAM DATA
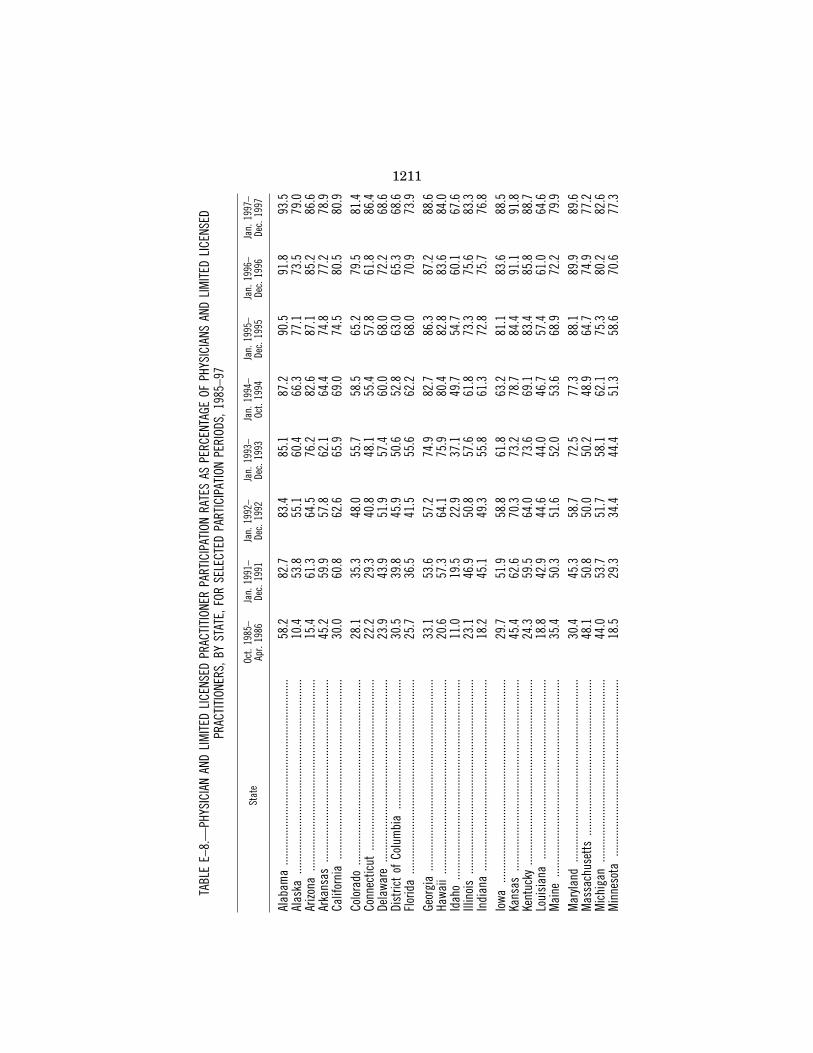
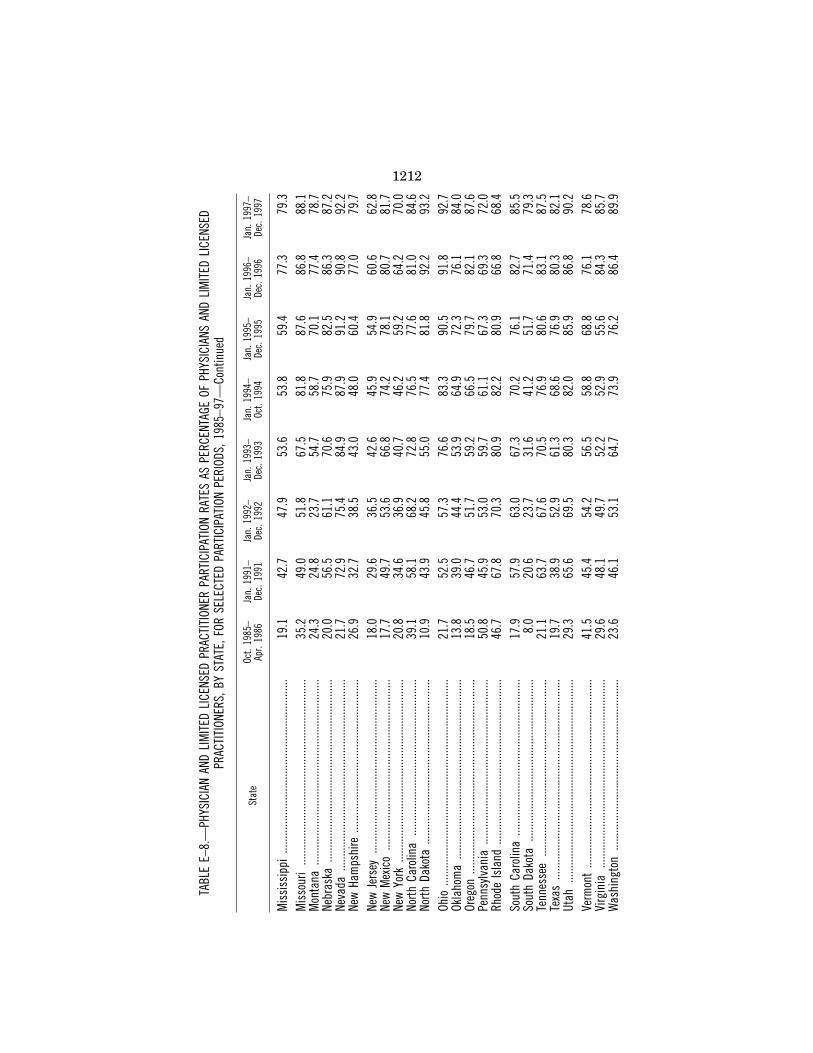
Physician participation rates have increased significantly sincethe inception of the program (see tables E–6 and E–7). For the cal-endar year 1996 participation period, the physician participationrate (including limited licensed practitioners) had risen to 77.5 per-cent accounting for 94.3 percent of allowed charges for physicianservices during the period. The participation rate rose to 80.2 per-cent in 1997. Table E–7 shows the participation rates by specialty.Table E–8 shows the percentage of participating physicians andlimited licensed practitioners as a percentage of total physiciansand limited licensed practitioners for each State.
TABLE E–6.—MEDICARE PHYSICIAN PARTICIPATION RATES: PERCENT OF PHYSICIANSAND LIMITED LICENSED PRACTITIONERS WITH AGREEMENTS AND THEIR SHARE OFALLOWED CHARGES, 1984–97
Participation periodPercent of physi-
cians signingagreements
Participating phy-sicians’ covered
charges as a per-cent of total 1
October 1984–September 1985 .................................. 30.4 36.0October 1985–April 1986 ........................................... 28.4 36.3April 1986–December 1986 2 ...................................... 28.3 38.7January 1987–March 1988 ......................................... 30.6 48.1April 1988–December 1988 ........................................ 37.3 57.9January 1989–March 1990 ......................................... 40.2 62.0April 1990–December 1990 ........................................ 45.5 67.2January 1991–December 1991 ................................... 47.6 72.3January 1992–December 1992 ................................... 52.2 78.8January 1993–December 1993 ................................... 59.8 85.5January 1994–December 1994 ................................... 64.8 89.4January 1995–December 1995 ................................... 72.3 92.6January 1996–December 1996 ................................... 77.5 94.3January 1997–December 1997 ................................... 80.2 NA
1 Rates reflect covered charges for physician services processed during period.2 The actual participation period was May through December of 1986, and participation agreements
were in effect for that time. However, charge data are generally collected by quarter; thus, the data forthe last three quarters of 1986 are used as a proxy for the participation period.
NA—Not available.
Source: Health Care Financing Administration, Bureau of Program Operations.
Table E–9 shows the allowed charges of participating physicansas a percent of total allowed charges, by State, for several partici-pation periods. This percentage increased substantially, rising from36 percent in the October 1984–September 1985 period to 94.3 per-cent in the calendar 1996 participation period.

1210
TABL
E E–
7.—
PART
ICIP
ATIO
N RA
TES
AS P
ERCE
NTAG
E OF
PHY
SICI
ANS
BY S
PECI
ALTY
, FOR
SEL
ECTE
D PA
RTIC
IPAT
ION
PERI
ODS,
198
5–97
Spec
ialty
Oct.
1985
–Ap
r. 19
86Ja
n. 1
991–
Dec.
199
1Ja
n. 1
992–
Dec.
199
2Ja
n. 1
993–
Dec.
199
3Ja
n. 1
994–
Dec.
199
4Ja
n. 1
995–
Dec.
199
5Ja
n. 1
996–
Dec.
199
6Ja
n. 1
997–
Dec.
199
7
Phys
icia
ns (
M.D
.s a
nd D
.O.s
):Ge
nera
l pra
ctic
e...
......
......
......
......
......
......
......
......
.27
.344
.048
.055
.159
.159
.966
.369
.2Ge
nera
l sur
gery
......
......
......
......
......
......
......
......
......
33.9
60.5
66.3
73.8
77.6
80.2
85.8
87.8
Otol
ogy,
lary
ngol
ogy,
rhin
olog
y...
......
......
......
......
...24
.649
.657
.066
.272
.277
.182
.685
.8An
esth
esio
logy
......
......
......
......
......
......
......
......
......
.21
.136
.549
.364
.671
.573
.981
.083
.5Ca
rdio
vasc
ular
dis
ease
......
......
......
......
......
......
.....
35.6
65.4
72.0
78.7
82.5
81.9
88.3
90.2
Derm
atol
ogy
......
......
......
......
......
......
......
......
......
.....
34.0
57.0
61.6
69.8
75.8
79.3
83.6
85.4
Fam
ily p
ract
ice
......
......
......
......
......
......
......
......
......
25.5
50.8
57.7
66.1
71.3
74.5
81.4
84.0
Inte
rnal
med
icin
e...
......
......
......
......
......
......
......
......
32.5
52.6
57.8
66.2
71.0
73.8
79.8
82.2
Neur
olog
y...
......
......
......
......
......
......
......
......
......
......
34.8
56.1
63.8
71.8
76.4
78.9
84.1
85.8
Obst
etric
s-gy
neco
logy
......
......
......
......
......
......
......
..29
.152
.658
.065
.769
.972
.577
.379
.5Op
htha
lmol
ogy
......
......
......
......
......
......
......
......
......
.27
.360
.066
.173
.278
.381
.286
.287
.9Or
thop
edic
sur
gery
......
......
......
......
......
......
......
......
.29
.058
.465
.574
.979
.282
.686
.888
.7Pa
thol
ogy
......
......
......
......
......
......
......
......
......
......
...39
.659
.265
.873
.376
.878
.983
.185
.0Ps
ychi
atry
......
......
......
......
......
......
......
......
......
......
...30
.044
.148
.853
.557
.858
.764
.667
.6Ra
diol
ogy
......
......
......
......
......
......
......
......
......
......
...41
.362
.068
.274
.778
.682
.884
.987
.0Ur
olog
y...
......
......
......
......
......
......
......
......
......
......
....
27.8
53.6
61.7
71.8
78.6
83.0
87.3
89.3
Neph
rolo
gy...
......
......
......
......
......
......
......
......
......
....
50.8
71.7
76.3
82.4
84.3
87.0
90.0
90.6
Clin
ic o
r ot
her
grou
p pr
actic
e—no
t GP
PP...
......
...33
.873
.977
.075
.580
.579
.484
.587
.8Li
mite
d lic
ense
pra
ctiti
oner
s (L
LP):
Chiro
prac
tor
......
......
......
......
......
......
......
......
......
.....
25.4
28.6
31.4
35.6
39.8
42.6
47.3
51.0
Podi
atry
-sur
gica
l chi
ropo
dy...
......
......
......
......
......
..38
.259
.664
.270
.975
.379
.283
.386
.0Op
tom
etris
t...
......
......
......
......
......
......
......
......
......
...44
.056
.959
.062
.765
.666
.970
.372
.2
Sour
ce:
Heal
th C
are
Fina
ncin
g Ad
min
istra
tion.
1211
TABL
E E–
8.—
PHYS
ICIA
N AN
D LI
MIT
ED L
ICEN
SED
PRAC
TITI
ONER
PAR
TICI
PATI
ON R
ATES
AS
PERC
ENTA
GE O
F PH
YSIC
IANS
AND
LIM
ITED
LIC
ENSE
DPR
ACTI
TION
ERS,
BY
STAT
E, F
OR S
ELEC
TED
PART
ICIP
ATIO
N PE
RIOD
S, 1
985–
97
Stat
eOc
t. 19
85–
Apr.
1986
Jan.
199
1–De
c. 1
991
Jan.
199
2–De
c. 1
992
Jan.
199
3–De
c. 1
993
Jan.
199
4–Oc
t. 19
94Ja
n. 1
995–
Dec.
199
5Ja
n. 1
996–
Dec.
199
6Ja
n. 1
997–
Dec.
199
7
Alab
ama
......
......
......
......
......
......
......
......
......
......
...58
.282
.783
.485
.187
.290
.591
.893
.5Al
aska
......
......
......
......
......
......
......
......
......
......
......
10.4
53.8
55.1
60.4
66.3
77.1
73.5
79.0
Arizo
na...
......
......
......
......
......
......
......
......
......
......
..15
.461
.364
.576
.282
.687
.185
.286
.6Ar
kans
as...
......
......
......
......
......
......
......
......
......
.....
45.2
59.9
57.8
62.1
64.4
74.8
77.2
78.9
Calif
orni
a...
......
......
......
......
......
......
......
......
......
....
30.0
60.8
62.6
65.9
69.0
74.5
80.5
80.9
Colo
rado
......
......
......
......
......
......
......
......
......
......
...28
.135
.348
.055
.758
.565
.279
.581
.4Co
nnec
ticut
......
......
......
......
......
......
......
......
......
....
22.2
29.3
40.8
48.1
55.4
57.8
61.8
86.4
Dela
ware
......
......
......
......
......
......
......
......
......
......
..23
.943
.951
.957
.460
.068
.072
.268
.6Di
stric
t of
Col
umbi
a...
......
......
......
......
......
......
.....
30.5
39.8
45.9
50.6
52.8
63.0
65.3
68.6
Flor
ida
......
......
......
......
......
......
......
......
......
......
......
25.7
36.5
41.5
55.6
62.2
68.0
70.9
73.9
Geor
gia
......
......
......
......
......
......
......
......
......
......
.....
33.1
53.6
57.2
74.9
82.7
86.3
87.2
88.6
Hawa
ii...
......
......
......
......
......
......
......
......
......
......
...20
.657
.364
.175
.980
.482
.883
.684
.0Id
aho
......
......
......
......
......
......
......
......
......
......
......
..11
.019
.522
.937
.149
.754
.760
.167
.6Ill
inoi
s...
......
......
......
......
......
......
......
......
......
......
...23
.146
.950
.857
.661
.873
.375
.683
.3In
dian
a...
......
......
......
......
......
......
......
......
......
......
..18
.245
.149
.355
.861
.372
.875
.776
.8Io
wa...
......
......
......
......
......
......
......
......
......
......
......
29.7
51.9
58.8
61.8
63.2
81.1
83.6
88.5
Kans
as...
......
......
......
......
......
......
......
......
......
......
..45
.462
.670
.373
.278
.784
.491
.191
.8Ke
ntuc
ky...
......
......
......
......
......
......
......
......
......
......
24.3
59.5
64.0
73.6
69.1
83.4
85.8
88.7
Loui
sian
a...
......
......
......
......
......
......
......
......
......
....
18.8
42.9
44.6
44.0
46.7
57.4
61.0
64.6
Mai
ne...
......
......
......
......
......
......
......
......
......
......
....
35.4
50.3
51.6
52.0
53.6
68.9
72.2
79.9
Mar
yland
......
......
......
......
......
......
......
......
......
......
..30
.445
.358
.772
.577
.388
.189
.989
.6M
assa
chus
etts
......
......
......
......
......
......
......
......
.....
48.1
50.8
50.0
50.2
48.9
64.7
74.9
77.2
Mic
higa
n...
......
......
......
......
......
......
......
......
......
.....
44.0
53.7
51.7
58.1
62.1
75.3
80.2
82.6
Min
neso
ta...
......
......
......
......
......
......
......
......
......
...18
.529
.334
.444
.451
.358
.670
.677
.3
1212
TABL
E E–
8.—
PHYS
ICIA
N AN
D LI
MIT
ED L
ICEN
SED
PRAC
TITI
ONER
PAR
TICI
PATI
ON R
ATES
AS
PERC
ENTA
GE O
F PH
YSIC
IANS
AND
LIM
ITED
LIC
ENSE
DPR
ACTI
TION
ERS,
BY
STAT
E, F
OR S
ELEC
TED
PART
ICIP
ATIO
N PE
RIOD
S, 1
985–
97—
Cont
inue
d
Stat
eOc
t. 19
85–
Apr.
1986
Jan.
199
1–De
c. 1
991
Jan.
199
2–De
c. 1
992
Jan.
199
3–De
c. 1
993
Jan.
199
4–Oc
t. 19
94Ja
n. 1
995–
Dec.
199
5Ja
n. 1
996–
Dec.
199
6Ja
n. 1
997–
Dec.
199
7
Mis
siss
ippi
......
......
......
......
......
......
......
......
......
.....
19.1
42.7
47.9
53.6
53.8
59.4
77.3
79.3
Mis
sour
i...
......
......
......
......
......
......
......
......
......
......
35.2
49.0
51.8
67.5
81.8
87.6
86.8
88.1
Mon
tana
......
......
......
......
......
......
......
......
......
......
...24
.324
.823
.754
.758
.770
.177
.478
.7Ne
bras
ka...
......
......
......
......
......
......
......
......
......
.....
20.0
56.5
61.1
70.6
75.9
82.5
86.3
87.2
Neva
da...
......
......
......
......
......
......
......
......
......
......
..21
.772
.975
.484
.987
.991
.290
.892
.2Ne
w Ha
mps
hire
......
......
......
......
......
......
......
......
....
26.9
32.7
38.5
43.0
48.0
60.4
77.0
79.7
New
Jers
ey...
......
......
......
......
......
......
......
......
......
..18
.029
.636
.542
.645
.954
.960
.662
.8Ne
w M
exic
o...
......
......
......
......
......
......
......
......
......
.17
.749
.753
.666
.874
.278
.180
.781
.7Ne
w Yo
rk...
......
......
......
......
......
......
......
......
......
.....
20.8
34.6
36.9
40.7
46.2
59.2
64.2
70.0
North
Car
olin
a...
......
......
......
......
......
......
......
......
..39
.158
.168
.272
.876
.577
.681
.084
.6No
rth D
akot
a...
......
......
......
......
......
......
......
......
.....
10.9
43.9
45.8
55.0
77.4
81.8
92.2
93.2
Ohio
......
......
......
......
......
......
......
......
......
......
......
....
21.7
52.5
57.3
76.6
83.3
90.5
91.8
92.7
Okla
hom
a...
......
......
......
......
......
......
......
......
......
....
13.8
39.0
44.4
53.9
64.9
72.3
76.1
84.0
Oreg
on...
......
......
......
......
......
......
......
......
......
......
...18
.546
.751
.759
.266
.579
.782
.187
.6Pe
nnsy
lvan
ia...
......
......
......
......
......
......
......
......
.....
50.8
45.9
53.0
59.7
61.1
67.3
69.3
72.0
Rhod
e Is
land
......
......
......
......
......
......
......
......
......
..46
.767
.870
.380
.982
.280
.966
.868
.4So
uth
Caro
lina
......
......
......
......
......
......
......
......
.....
17.9
57.9
63.0
67.3
70.2
76.1
82.7
85.5
Sout
h Da
kota
......
......
......
......
......
......
......
......
......
.8.
020
.623
.731
.641
.251
.771
.479
.3Te
nnes
see
......
......
......
......
......
......
......
......
......
......
21.1
63.7
67.6
70.5
76.9
80.6
83.1
87.5
Texa
s...
......
......
......
......
......
......
......
......
......
......
.....
19.7
38.9
52.9
61.3
68.6
76.9
80.3
82.1
Utah
......
......
......
......
......
......
......
......
......
......
......
...29
.365
.669
.580
.382
.085
.986
.890
.2Ve
rmon
t...
......
......
......
......
......
......
......
......
......
......
.41
.545
.454
.256
.558
.868
.876
.178
.6Vi
rgin
ia...
......
......
......
......
......
......
......
......
......
......
.29
.648
.149
.752
.252
.955
.684
.385
.7W
ashi
ngto
n...
......
......
......
......
......
......
......
......
......
.23
.646
.153
.164
.773
.976
.286
.489
.9

1213
Wes
t Vi
rgin
ia...
......
......
......
......
......
......
......
......
....
22.9
66.3
68.4
75.9
81.9
87.2
89.3
90.8
Wis
cons
in...
......
......
......
......
......
......
......
......
......
....
31.0
46.8
55.5
66.8
73.7
81.2
83.9
85.2
Wyo
min
g...
......
......
......
......
......
......
......
......
......
......
18.3
39.1
50.2
53.3
63.0
66.4
81.2
83.3
Natio
nal
......
......
......
......
......
......
......
......
..28
.447
.652
.259
.864
.872
.377
.580
.2
Sour
ce:
Heal
th C
are
Fina
ncin
g Ad
min
istra
tion,
Bur
eau
of P
rogr
am O
pera
tions
.

1214
TABL
E E–
9.—
ALLO
WED
CHA
RGES
OF
PART
ICIP
ATIN
G PH
YSIC
IANS
AS
A PE
RCEN
T OF
TOT
AL A
LLOW
ED C
HARG
ES B
Y ST
ATE,
FOR
SEL
ECTE
DPA
RTIC
IPAT
ION
PERI
ODS,
198
4–96
1
[In p
erce
nt]
Cens
us d
ivis
ion/
Stat
eOc
t.19
84–
Sept
. 198
5
Jan.
1989
–Mar
.19
90
Apr.
1990
–Dec
.19
90
Jan.
1991
–Dec
.19
91
Jan
1992
–De
c. 1
992
Jan.
1993
–Dec
.19
93
Jan.
1994
–Dec
.19
94
Jan.
1995
–Dec
.19
95
Jan.
1996
–Dec
.19
96
Natio
nal
......
......
......
......
......
......
......
......
......
......
.36
.062
.067
.272
.378
.885
.589
.492
.694
.3Ne
w En
glan
d:M
aine
......
......
......
......
......
......
......
......
......
..50
.979
.480
.584
.289
.992
.493
.696
.297
.4Ne
w Ha
mps
hire
......
......
......
......
......
......
...40
.142
.846
.268
.380
.788
.190
.893
.294
.8Ve
rmon
t...
......
......
......
......
......
......
......
......
37.3
81.4
85.9
90.2
93.4
94.8
95.6
96.9
97.9
Mas
sach
uset
ts...
......
......
......
......
......
......
.70
.795
.495
.096
.796
.395
.996
.497
.497
.9Rh
ode
Isla
nd...
......
......
......
......
......
......
....
68.7
88.8
95.2
97.6
98.5
98.9
99.1
99.4
99.5
Conn
ectic
ut...
......
......
......
......
......
......
......
30.7
65.9
67.9
76.2
82.4
87.9
92.2
94.1
95.1
Mid
dle
Atla
ntic
:Ne
w Yo
rk...
......
......
......
......
......
......
......
....
31.5
51.7
58.0
63.7
72.2
77.7
82.5
87.5
89.9
New
Jers
ey...
......
......
......
......
......
......
......
.21
.542
.349
.655
.261
.872
.680
.184
.689
.8Pe
nnsy
lvan
ia...
......
......
......
......
......
......
....
71.4
81.6
87.9
92.3
95.4
98.0
98.6
98.7
99.0
East
Nor
th C
entra
l:Oh
io...
......
......
......
......
......
......
......
......
......
.41
.561
.970
.979
.186
.394
.697
.097
.897
.8In
dian
a...
......
......
......
......
......
......
......
......
.18
.960
.665
.270
.280
.989
.192
.494
.095
.5Ill
inoi
s...
......
......
......
......
......
......
......
......
..29
.458
.161
.866
.172
.282
.287
.990
.793
.0M
ichi
gan
......
......
......
......
......
......
......
......
.55
.485
.686
.086
.592
.095
.196
.597
.697
.9W
isco
nsin
......
......
......
......
......
......
......
......
31.3
42.7
48.9
45.6
61.5
76.9
84.0
91.1
93.4
Wes
t No
rth C
entra
l:M
inne
sota
......
......
......
......
......
......
......
.....
9.9
20.2
25.4
28.6
35.5
49.5
68.3
80.5
81.9
Iowa
......
......
......
......
......
......
......
......
......
..28
.554
.257
.861
.971
.080
.885
.290
.495
.0M
isso
uri2
......
......
......
......
......
......
......
......
26.7
41.8
40.1
40.4
45.3
67.7
86.9
93.4
94.5
North
Dak
ota
......
......
......
......
......
......
......
.6.
932
.345
.553
.261
.265
.868
.189
.396
.3So
uth
Dako
ta...
......
......
......
......
......
......
...3.
219
.521
.221
.124
.636
.042
.659
.266
.4

1215
Nebr
aska
......
......
......
......
......
......
......
......
.30
.551
.754
.860
.369
.779
.883
.886
.288
.8Ka
nsas
3...
......
......
......
......
......
......
......
.....
48.0
82.5
82.3
86.8
91.3
94.6
94.8
95.3
98.0
Sout
h At
lant
ic:
Dela
ware
......
......
......
......
......
......
......
......
.57
.070
.876
.681
.787
.293
.594
.695
.396
.7M
aryla
nd4
......
......
......
......
......
......
......
.....
57.8
80.4
83.3
85.6
86.4
87.1
87.4
92.9
94.3
Dist
rict
of C
olum
bia
5...
......
......
......
......
..60
.373
.976
.880
.885
.490
.192
.493
.894
.9Vi
rgin
ia6
......
......
......
......
......
......
......
......
.31
.069
.571
.278
.484
.190
.994
.196
.397
.4W
est
Virg
inia
......
......
......
......
......
......
......
34.5
77.5
80.6
85.2
90.0
93.4
95.3
96.3
96.0
North
Car
olin
a...
......
......
......
......
......
......
.34
.455
.263
.968
.382
.487
.190
.792
.794
.7So
uth
Caro
lina
......
......
......
......
......
......
....
29.9
68.5
67.6
71.6
79.3
86.6
90.4
62.7
95.5
Geor
gia
......
......
......
......
......
......
......
......
....
29.3
50.7
65.9
74.9
82.8
81.6
90.9
94.8
95.8
Flor
ida
......
......
......
......
......
......
......
......
.....
30.0
61.6
68.8
74.9
81.8
89.0
90.1
94.7
95.8
East
Sou
th C
entra
l:Ke
ntuc
ky...
......
......
......
......
......
......
......
.....
22.3
64.3
72.6
76.9
84.3
90.7
93.4
94.6
95.5
Tenn
esse
e...
......
......
......
......
......
......
......
..25
.157
.468
.576
.886
.891
.894
.395
.696
.6Al
abam
a...
......
......
......
......
......
......
......
.....
42.5
81.3
84.9
88.5
91.7
94.9
96.2
97.0
97.7
Mis
siss
ippi
......
......
......
......
......
......
......
....
14.3
65.3
68.3
73.9
82.1
88.6
91.2
92.8
94.3
Wes
t So
uth
Cent
ral:
Arka
nsas
......
......
......
......
......
......
......
......
.47
.981
.084
.586
.590
.093
.495
.296
.497
.4Lo
uisi
ana
......
......
......
......
......
......
......
......
16.2
71.0
76.7
81.2
86.6
89.4
91.3
92.2
93.6
Okla
hom
a...
......
......
......
......
......
......
......
...16
.639
.150
.057
.762
.874
.083
.891
.493
.8Te
xas
......
......
......
......
......
......
......
......
......
.26
.252
.556
.963
.672
.681
.585
.990
.692
.5M
ount
ain:
Mon
tana
......
......
......
......
......
......
......
......
..25
.629
.929
.734
.142
.758
.967
.483
.191
.8Id
aho
......
......
......
......
......
......
......
......
......
.8.
613
.217
.521
.123
.541
.254
.061
.669
.7W
yom
ing
......
......
......
......
......
......
......
......
..15
.719
.725
.831
.944
.161
.072
.175
.681
.0Co
lora
do...
......
......
......
......
......
......
......
.....
23.5
47.7
50.5
55.9
63.5
76.4
82.6
86.1
90.3
New
Mex
ico
......
......
......
......
......
......
......
...34
.139
.551
.157
.864
.978
.285
.089
.690
.8Ar
izona
......
......
......
......
......
......
......
......
....
32.7
49.8
60.2
67.8
75.2
83.7
88.9
90.6
91.5
Utah
......
......
......
......
......
......
......
......
......
..43
.868
.965
.175
.181
.883
.191
.394
.796
.2Ne
vada
......
......
......
......
......
......
......
......
....
41.5
69.9
82.1
87.5
92.3
96.0
97.9
98.4
98.8

1216
TABL
E E–
9.—
ALLO
WED
CHA
RGES
OF
PART
ICIP
ATIN
G PH
YSIC
IANS
AS
A PE
RCEN
T OF
TOT
AL A
LLOW
ED C
HARG
ES B
Y ST
ATE,
FOR
SEL
ECTE
DPA
RTIC
IPAT
ION
PERI
ODS,
198
4–96
1 —Co
ntin
ued
[In p
erce
nt]
Cens
us d
ivis
ion/
Stat
eOc
t.19
84–
Sept
. 198
5
Jan.
1989
–Mar
.19
90
Apr.
1990
–Dec
.19
90
Jan.
1991
–Dec
.19
91
Jan
1992
–De
c. 1
992
Jan.
1993
–Dec
.19
93
Jan.
1994
–Dec
.19
94
Jan.
1995
–Dec
.19
95
Jan.
1996
–Dec
.19
96
Paci
fic: Was
hing
ton
......
......
......
......
......
......
......
...17
.526
.931
.837
.945
.250
.782
.390
.592
.9Or
egon
......
......
......
......
......
......
......
......
.....
17.3
34.8
43.3
50.7
59.8
73.6
80.9
87.5
91.7
Calif
orni
a...
......
......
......
......
......
......
......
...42
.267
.271
.275
.680
.086
.689
.691
.793
.3Al
aska
......
......
......
......
......
......
......
......
.....
17.2
50.0
49.3
58.0
70.9
81.3
84.4
85.4
89.8
Hawa
ii...
......
......
......
......
......
......
......
......
..39
.758
.670
.174
.384
.790
.694
.797
.297
.31
Rate
s re
flect
cov
ered
cha
rges
for
phy
sici
an c
laim
s pr
oces
sed
durin
g th
e pe
riod.
2St
artin
g wi
th f
isca
l ye
ar 1
993,
inc
lude
s da
ta f
or a
ll co
untie
s in
Mis
sour
i pl
us t
wo c
ount
ies
on t
he S
tate
bor
der
loca
ted
in K
ansa
s.3
Star
ting
with
fis
cal
year
199
3, i
nclu
des
data
for
all
coun
ties
in K
ansa
s ex
clud
ing
two
coun
tries
on
the
Stat
e bo
rder
.4
Star
ting
with
fis
cal
year
199
3, i
nclu
des
data
for
all
coun
ties
in M
aryla
nd e
xclu
ding
two
cou
ntrie
s on
the
Sta
te b
orde
r.5
Star
ting
with
fis
cal
year
199
3, i
nclu
des
data
for
the
Dis
trict
of
Colu
mbi
a pl
us t
wo c
ount
ies
in M
aryla
nd l
ocat
ed o
n th
e St
ate
bord
er p
lus
seve
ral
coun
ties
and
citie
s lo
cate
d in
Virg
inia
nea
r th
e St
ate
bord
er.
6St
artin
g wi
th f
isca
l ye
ar 1
993,
inc
lude
s da
ta f
or a
ll co
untie
s in
Virg
inia
exc
ludi
ng s
ever
al c
ount
ies
and
citie
s ne
ar t
he S
tate
bor
der.
NA—
Not
avai
labl
e.
Sour
ce:
Heal
th C
are
Fina
ncin
g Ad
min
istra
tion,
Bur
eau
of P
rogr
am O
pera
tions
.

1217
As the participation rate has increased, total allowed chargesbilled by nonparticipating physicians have declined. In addition,the number of unassigned claims submitted by nonparticipatingphysicians has declined (see table E–10). Total covered charges rep-resented by unassigned claims declined from 34.5 to 2.0 percentover the 1984–96 period. The proportion of charges billed by par-ticipation and assignment status varies by State; these data areshown in table E–11.
TABLE E–10.—DISTRIBUTION OF ALLOWED CHARGES FOR SERVICES BILLED BYPARTICIPATION STATUS OF PHYSICIAN AND ASSIGNMENT STATUS OF CLAIM, 1984–96 1
[In percent]
Time period ParticipantsNonparticipants
Assigned Unassigned
Oct. 1984–Sept. 1985 ...................................... 36.0 29.5 34.5Oct. 1985–Mar. 1986 ....................................... 36.3 29.4 34.3Apr. 1986–Dec. 1986 2 ..................................... 38.7 28.0 32.9Jan. 1987–Mar. 1988 3 ..................................... 48.1 25.2 26.7Apr. 1988–Dec. 1988 ....................................... 57.9 21.0 21.1Jan. 1989–Mar. 1990 ....................................... 62.0 19.0 18.5Apr. 1990–Dec. 1990 ....................................... 67.2 16.7 16.1Jan. 1991–Dec. 1991 ....................................... 72.3 14.6 13.1Jan. 1992–Dec. 1992 ....................................... 78.8 11.6 9.7Jan. 1993–Dec. 1993 ....................................... 85.5 8.5 6.0Jan. 1994–Dec. 1994 ....................................... 89.4 6.6 4.0Jan. 1995–Dec. 1995 ....................................... 92.6 4.6 2.8Jan. 1996–Dec. 1996 ....................................... 94.3 3.7 2.0
1 Rates reflect covered charges for physician claims processed during the period.2 The actual participation period was May through December 1986, and the participation agreements
were in effect for that time.3 The actual participation period is January 1987 through March 1988, and the participation agree-
ments are in effect for that time.
Source: Health Care Financing Administration, Bureau of Program Operations.

1218
TABLE E–11.—DISTRIBUTION OF ALLOWED CHARGES FOR SERVICES BILLED BY STATE,PARTICIPATION STATUS OF PHYSICIAN, AND ASSIGNMENT STATUS OF CLAIM, JANU-ARY–DECEMBER 1996 1
[In percent]
Census division/State Participatingphysician
Nonparticipating physician
Assigned Unassigned
National ...................................................... 94.3 3.7 2.0New England:
Maine ................................................. 97.4 2.1 0.5New Hampshire ................................. 94.8 3.4 1.9Vermont ............................................. 97.9 1.4 0.7Massachusetts ................................... 97.9 1.9 0.1Rhode Island ..................................... 99.5 0.4 0.1Connecticut ........................................ 95.1 3.1 1.8
Middle Atlantic:New York ............................................ 89.9 7.3 2.8New Jersey ......................................... 89.8 5.5 4.7Pennsylvania ...................................... 99.0 0.7 0.3
East North Central:Ohio ................................................... 97.8 1.9 0.2Indiana .............................................. 95.5 2.4 2.1Illinois ................................................ 93.0 4.2 2.8Michigan ............................................ 97.9 1.3 0.7Wisconsin ........................................... 93.4 3.2 3.3
West North Central:Minnesota .......................................... 81.9 10.9 7.2Iowa ................................................... 95.0 2.0 3.1Missouri 2 ........................................... 94.5 3.4 2.2North Dakota ..................................... 96.3 1.7 2.0South Dakota ..................................... 66.4 8.4 25.1Nebraska ............................................ 88.8 3.4 7.9Kansas 3 ............................................. 98.0 1.0 1.0
South Atlantic:Delaware ............................................ 96.7 1.8 1.5Maryland 4 .......................................... 94.3 4.4 1.3District of Columbia 5 ........................ 94.9 2.6 2.5Virginia 6 ............................................ 97.4 1.6 1.0West Virginia ..................................... 96.0 3.4 0.6North Carolina ................................... 94.7 3.1 2.2South Carolina ................................... 95.5 2.7 1.8Georgia .............................................. 95.8 2.6 1.6Florida ................................................ 95.8 3.1 1.1
East South Central:Kentucky ............................................ 95.5 3.2 1.3Tennessee .......................................... 96.6 2.3 1.1Alabama ............................................ 97.7 1.6 0.8Mississippi ......................................... 94.3 4.4 1.3
West South Central:Arkansas ............................................ 97.4 1.7 0.9Louisiana ........................................... 93.6 5.3 1.1Oklahoma ........................................... 93.8 3.3 2.9

1219
TABLE E–11.—DISTRIBUTION OF ALLOWED CHARGES FOR SERVICES BILLED BY STATE,PARTICIPATION STATUS OF PHYSICIAN, AND ASSIGNMENT STATUS OF CLAIM, JANU-ARY–DECEMBER 1996 1—Continued
[In percent]
Census division/State Participatingphysician
Nonparticipating physician
Assigned Unassigned
Texas .................................................. 92.5 5.4 2.1Mountain:
Montana ............................................. 91.8 3.8 4.5Wyoming ............................................ 81.0 5.7 13.3Idaho .................................................. 69.7 9.4 20.9Colorado ............................................. 90.3 5.6 4.0New Mexico ........................................ 90.8 5.4 3.7Arizona ............................................... 91.5 2.1 6.4Utah ................................................... 96.2 2.1 1.7Nevada ............................................... 98.8 0.7 0.5
Pacific:Washington ........................................ 92.9 3.1 3.9Oregon ............................................... 91.7 3.8 4.5California ........................................... 93.3 4.9 1.8Alaska ................................................ 89.8 7.4 2.8Hawaii ................................................ 97.3 1.7 0.9
1 Rates reflect charges for physician claims processed during the period.2 Includes data for all counties in Missouri plus two counties on the State border located in Kansas.3 Includes data for all counties in Kansas excluding two counties on the State border.4 Includes data for all counties in Maryland excluding two counties on the State border.5 Includes data for the District of Columbia plus two counties in Maryland located on the State border
plus several counties and cities located in Virginia, near the State border.6 Includes data for all counties in Virginia excluding several counties and cities near the State border.
Source: Health Care Financing Administration, Bureau of Program Operations.
DISTRIBUTION OF PHYSICIAN SERVICES
Tables E–12 to E–20 show the distribution of physicians’ servicesfor calendar year 1995. These tables provide data from the fourthyear of the implementation of the Medicare fee schedule. As notedearlier, the fee schedule appears to be having its intended effect.The projected pattern of redistribution from the procedurally ori-ented specialties to the primary care specialties has begun takingplace.
The 1995 data are tabulations from the 1994 National ClaimsHistory Procedure Summary, which is a summary of all claimsfiled with the Medicare carriers. The totals shown will differ fromtotal SMI outlay figures for 1995 shown in the budget for severalreasons. First, the amounts shown in these tables are allowedamounts, rather than reimbursements—that is, they include bothMedicare’s and the enrollee’s share of approved charges. Second,the amounts shown are for services rendered during calendar year1995; budget figures are for payments made during the fiscal yearregardless of when the services were rendered. Third, the amountsshown are only for services reimbursed by carriers under the feeschedule; hence, they do not include part B payments to hospital

1220
outpatient departments or to risk-based prepaid medical plans. Fi-nally, the amounts shown underestimate what they are supposedto represent by a small amount because some claims for servicesrendered in 1995 had not been processed by carriers at the timethe 1995 files were submitted to HCFA, and because some claimsrecorded had to be eliminated due to recording errors.
Table E–12 illustrates that in 1995, 76.7 percent of allowedamounts under the fee schedule were for physicians’ services, andanother 3.2 percent were for the services of limited license practi-tioners—psychologists, podiatrists, optometrists, audiologists, chiro-practors, dentists, and physical therapists. About 3.9 percent wentto independent laboratories in 1995, while 16.2 percent went tosuppliers of medical equipment, prosthetics, and ambulance serv-ices.
TABLE E–12.—ALLOWED AMOUNTS FOR CLAIMS BY TYPE OF PROVIDER, 1995
Type of providerAllowedamounts(millions)
Percent oftotal
Percentinpatient
Physicians ......................................................... $42,369.0 76.7 35.3Limited license practitioners 1 ......................... $1,784.0 3.2 1.4Laboratories ...................................................... $2,132.0 3.9 0.2Medical suppliers 2 ........................................... $8,932.0 16.2 0.8
All providers 3 ...................................... $55,217.0 100.0 27.31 Includes psychology, podiatry, optometry, audiology, chiropractic, dentistry, and physical therapy.2 Includes suppliers of medical equipment, prosthetics, and ambulance services.3 Total does not include charges for hospital outpatient department facility fees or for risk-based pre-
paid medical plans since these are not reimbursed under the CPR system.
Source: Health Care Financing Administration, Bureau of Data Management and Strategy.
About 27.3 percent of all allowed amounts were for hospital inpa-tient services, and about 35.3 percent of allowed amounts for physi-cians’ services were inpatient. The share of physicians’ servicesthat are inpatient has dropped in recent years, from nearly 64 per-cent in 1981.
Table E–13 shows the distribution of spending for physicians’services by specialty. (It excludes limited license practitioners, labs,and suppliers.) In 1995, generalists accounted for 25.8 percent ofspending, nonsurgical specialists for 27.1 percent, and surgical spe-cialists for 30.7 percent. Radiologists, anesthesiologists, and pa-thologists together accounted for 11.3 percent of allowed amounts.Radiation oncologists, osteopathic manipulative therapists,intensivists, emergency medicine physicians, and other physicianspecialties accounted for 5 percent of total allowed amounts forphysicians’ services.
The major physician specialties treating the Medicare population,in descending order of importance as measured by total allowedamounts, were general internists (13.5 percent of allowedamounts), ophthalmologists (9.6 percent), cardiologists (8.7 per-cent), radiologists (7.0 percent), and family practitioners (6.2 per-cent).

1221
TABLE E–13.—ALLOWED AMOUNTS FOR PHYSICIANS’ SERVICES BY SPECIALTY, 1995
Specialty Allowed charges(millions)
Percentof total
Percentinpatient
Generalists:Internal medicine .................................. $5,704.0 13.5 36.0Family practice ...................................... 2,633.0 6.2 23.5Clinics .................................................... 1,417.0 3.3 35.8General practice .................................... 1,149.0 2.7 17.6Pediatrics ............................................... 42.0 0.1 22.8
All generalists ................................... 10,945.0 25.8 31.0
Nonsurgical specialists:Cardiology .............................................. 3,693.0 8.7 51.2Gastroenterology .................................... 1,170.0 2.8 42.5Psychiatry .............................................. 968.0 2.3 31.6Dermatology ........................................... 966.0 2.3 0.8Hematology/oncology ............................. 941.0 2.2 17.1Pulmonary disease ................................ 897.0 2.1 64.8Nephrology ............................................. 709.0 1.7 49.1Neurology ............................................... 663.0 1.6 43.2Physical medicine and rehabilitation ... 326.0 0.8 53.0Medical oncology ................................... 284.0 0.7 16.3Rheumatology ........................................ 240.0 0.6 12.4Infectious disease ................................. 189.0 0.4 75.5Endocrinology ......................................... 177.0 0.4 32.9Allergy/immunology ................................ 101.0 0.2 3.5Geriatric medicine ................................. 77.0 0.2 29.2Nuclear medicine ................................... 65.0 0.2 18.9Peripheral vascular disease .................. 24.0 0.1 58.5
All nonsurgical specialists ............... 11,487.0 27.1 39.9
Surgical specialists:Ophthalmology ....................................... 4,082.0 9.6 1.9General surgery ..................................... 2,137.0 5.0 61.8Orthopedic surgery ................................ 2,101.0 5.0 57.9Urology ................................................... 1,784.0 4.2 23.9Thoracic surgery .................................... 728.0 1.7 89.5Otolaryngology ....................................... 514.0 1.2 13.5Neurosurgery .......................................... 363.0 0.9 83.1Gynecology/obstetrics ............................ 338.0 0.8 37.7Cardiac surgery ..................................... 314.0 0.7 96.4Vascular surgery .................................... 283.0 0.7 71.5Plastic and reconstructive surgery ....... 215.0 0.5 28.9Colorectal surgery .................................. 83.0 0.2 35.4Hand surgery ......................................... 29.0 0.1 17.9Surgical oncology .................................. 27.0 0.1 56.4
All surgical specialists ..................... 12,999.0 30.7 37.0
Other:Radiology ............................................... 2,949.0 7.0 28.6Anesthesiology ....................................... 1,291.0 3.0 65.7Emergency medicine .............................. 734.0 1.7 3.6

1222
TABLE E–13.—ALLOWED AMOUNTS FOR PHYSICIANS’ SERVICES BY SPECIALTY, 1995—Continued
Specialty Allowed charges(millions)
Percentof total
Percentinpatient
Pathology ............................................... 554.0 1.3 40.2Radiation oncology ................................ 502.0 1.2 4.6Critical care (intensivists) .................... 62.0 0.1 78.3Manipulative therapy ............................. 20.0 (1) 16.0Other physician specialties ................... 827.0 2.0 21.0
Total—all physicians ....................... 42,369.0 100.0 35.31 Less than 0.1 percent.Source: Health Care Financing Administration, Bureau of Data Management and Strategy.
The share of services provided on an inpatient basis varied byspecialty, generally increasing with specialization. About 31 per-cent of the services of generalists were inpatient in 1995. The inpa-tient share for nonsurgical specialists was 39.9 percent and 37 per-cent for surgical specialists.
Table E–14 shows the distribution of spending for physicians’services by type of service. About 39 percent of spending was formedical care (nonsurgical) in 1995. About 32.3 percent of spendingwas for surgical procedures in total, adding together the amountsfor surgeons, assistant surgeons, and anesthesiologists. About 9.8percent was for diagnostic laboratory tests, which would includenot only blood chemistry analysis and urinalysis, but also testssuch as EKGs. About 9.6 percent of spending was for radiology,and 5.2 percent was for consultations.
TABLE E–14.—ALLOWED AMOUNTS FOR PHYSICIANS’ SERVICES BY TYPE OF SERVICE,1995
Type of serviceAllowedcharges
(millions)Percent of total Percent
inpatient
Medical care ............................................... $16,564.0 39.1 31.8Surgery ........................................................ 12,099.0 28.6 48.0Assistance at surgery ................................. 245.0 0.6 92.8Anesthesia .................................................. 1,315.0 3.1 64.6Diagnostic laboratory tests ........................ 4,151.0 9.8 18.3Diagnostic radiology ................................... 3,349.0 7.9 22.0Consultations 1 ........................................... 2,221.0 5.2 57.4Therapeutic radiology ................................. 726.0 1.7 4.8Mammography ............................................ 64.0 0.2 0.4Pneumococcal vaccine ............................... 93.0 0.2 ....................Other 2 ......................................................... 1,540.0 3.6 0.3
All services .................................... 42,369.0 100.0 35.31 Includes first and second opinions for surgery.2 Includes treatment for renal patients, pneumococcal vaccine, and medical supplies, among other
services.Source: Health Care Financing Administration, Bureau of Data Management and Strategy.

1223
Table E–15 lists the top 20 individual services, ranked by totalallowed amounts on claims submitted by selected physicians for1995. The most important exclusion is amounts for the services ofanesthesiologists, since there would typically be a charge for anes-thesiology for the surgical procedures. The amounts for surgicalprocedures include claims by both the primary surgeon and any as-sistant surgeons, but not the amounts for anesthesiologists.
TABLE E–15.—TOP 20 SERVICES BILLED BY PHYSICIANS UNDER MEDICARE, 1995
Rankorder
Servicecode Description
Allowedcharges
(millions)
Percent oftotal
1. 99213 Office/outpatient visit, EST ........................... $2,856 6.72. 66984 Remove cataract, insert lens ....................... 2,096 4.93. 99214 Office/outpatient visit, EST ........................... 1,678 4.04. 99232 Subsequent hospital care ............................. 1,656 3.95. 99231 Subsequent hospital care ............................. 876 2.16. 99233 Subsequent hospital care—comprehensive 822 1.97. 99212 Office/outpatient visit, EST ........................... 735 1.78. 99223 Initial hospital care ...................................... 596 1.49. 99215 Office/outpatient visit, EST ........................... 577 1.4
10. 88305 Tissue exam by pathologist .......................... 497 1.211. 90844 Psychotherapy 45–50 minutes ..................... 486 1.112. 99254 Initial inpatient consult ................................ 470 1.113. J9217 Leuprolide acetate suspension ..................... 456 1.114. 93307 Echo exam of heart ...................................... 445 1.115. 99285 Emergency room visit ................................... 413 1.016. 92014 Eye, exam and treatment ............................. 366 0.917. 99238 Hospital discharge pay ................................. 360 0.918. 99255 Initial inpatient consult ................................ 360 0.819. E1400 Oxygen concentrator less than 2 lite ........... 357 0.820. 99284 Emergency department visit ......................... 346 0.8
Total .............................................................. 16,450 38.81 Amounts for surgical procedures include fees for primary and assistant surgeons, but not for anes-
thesiologists.
Note.—EST = established patient.
Source: Health Care Financing Administration, Bureau of Data Management and Strategy.
The top 20 services (out of more than 7,000) accounted for 38.8percent of all spending for all physicians’ services in 1995. Cataractextraction with implantation of an intraocular lens was the highestranked surgical procedure, accounting by itself for 4.9 percent oftotal allowed amounts for physicians’ services. Most of the servicesin the top 20 were evaluation and management services (that is,visits and consultations).
Table E–16 presents total allowed amounts for selected groups ofgeneric services, and shows the percent of total allowed amountsfor all physicians’ services accounted for by each group. As in tableE–15, certain physicians’ services—most notably for anesthesiol-ogists—are not included in the allowed amounts for each servicegroup. No attempt was made to define and rank all possible service

1224
groups, so that there may be other important service groups thatdo not appear in the table. For example, diagnostic radiology ac-counts for 7.9 percent of allowed amounts for physicians’ services(from table E–14), but radiological services do not appear in tableE–16.
TABLE E–16.—ALLOWED AMOUNTS FOR SELECTED GROUPS OF PHYSICIANS’ SERVICES,1995
Service groupAllowedcharges
(millions) 1
Percent oftotal
Office visits (99201–99215) .................................................... $6,718 15.9Hospital visits (99221–99238) ................................................. 4,662 11.0Cataract surgery (66830–66985) ............................................. 2,123 5.0Emergency room visits (99281–99285) ................................... 1,065 2.5SNF visits (99301–99313) ........................................................ 803 1.9EKGs (93000–93018, 93015–26) ............................................. 719 1.7Colonoscopy (45378–45385, 44388–44393, 45355) ............... 576 1.4Cardiac catheterization (93501–93553) .................................. 527 1.2Knee arthroplasty (27446, 27447, 29881) ............................... 372 0.9Coronary artery bypass (33510–33516) ................................... 206 0.5Hemodialysis/CAPD (90935–90947) ......................................... 171 0.4Hip arthroplasty (27130–27132) .............................................. 168 0.4Thromboendarterectomy (35301–35381) .................................. 166 0.4Transurethal surgery (52602) ................................................... 127 0.3Pacemaker inplant/removal (33200–33214, 33233–33237) ... 104 0.2Home visits (99341–99353) ..................................................... 94 0.2Pacemaker tests (93731–93736) ............................................. 86 0.2Vein bypass (35501–35587) .................................................... 79 0.2Prostatectomy (55801–55845) ................................................. 58 0.1Nursing home visits (99321–99333) ....................................... 42 0.1EEGs (95816–95827, 95950, 95955) ....................................... 41 0.1
Total ............................................................................. 18,908 44.61 Amounts for surgical procedures include fees for primary and assistant surgeons, but not for anes-
thesiologists.
Source: Health Care Financing Administration, Bureau of Data Management and Strategy.
The 21 service groups shown in table E–16 accounted for 44.6percent of all allowed amounts for all physicians’ services in 1995.The single most costly group was office visits (accounting for 15.9percent of total allowed amounts for physicians’ services), followedby hospital visits (11.0 percent). Cataract surgery of all types ac-counted for 5.0 percent of total allowed amounts for physicians’services. It should also be noted that the amount for hemodialysisincludes only physician services and does not include the muchlarger amounts for the facility charges for hemodialysis that werenot billed under the fee-for-service reimbursement system.
In recent years, there have been many changes in the deliveryof health care services. Some of the more significant changes affect-ing Medicare services have been in the delivery of surgical services.First, there has been significant growth in the amount of surgicalcare provided by some specialties. Second, there has been a dra-

1225
matic shift in the place of surgical care; that is, surgical care isnow frequently provided in outpatient settings, whereas previouslymost surgical care was provided in inpatient settings.
As shown in table E–17, the most significant shift in site of sur-gical care between 1980 and 1995 was out of inpatient settings andinto other settings. Outpatient hospital settings benefited mostfrom this shift, growing from only 3.3 percent of all surgicalcharges in 1980 to 25.5 percent in 1995. The proportions of surgerytaking place in a physician’s office and in other nonhospital set-tings also grew. In 1995 the proportion of all surgical care providedin inpatient settings had dropped to 45.3 percent.
Table E–18 shows the percent of total surgical charges by spe-cialty in 1980 and 1995. In 1980, three specialties (ophthalmology,general surgery, and orthopedic surgery) accounted for nearly halfof all Medicare surgical care. These same three specialties ac-counted for close to 44 percent of total surgical care in 1995. Theshares among these specialties changed. While ophthalmologistsaccounted for only 13.6 percent in 1980, by 1995 their share hadincreased to 20.4 percent due primarily to the substantial growthin cataract surgery during the 1980s. For gastroenterologists, sur-gical care represented much larger proportions of their total Medi-care practice in 1995 than in 1980. On the other hand, surgicalcharges for urologists represented much smaller proportions oftheir total Medicare practice in 1995 than in 1980.
As shown in table E–19, many different medical specialties par-ticipated in the shift to outpatient surgery. In 1980, only two spe-cialties (dermatology and podiatry) performed the majority of theirsurgical services in outpatient settings; in these cases, the care wasgenerally provided in the physician’s office. In 1995, eight special-ties provided a majority of their surgical care in outpatient set-tings: ophthalmology, podiatry, gastroenterology, dermatology, ENT(otology, laryngology, and rhinology), internal medicine, plastic sur-gery, and urology. Podiatrists and dermatologists continued pri-marily to work in their offices; internists split their noninpatientwork between office and outpatient settings, while most of theother specialties provided their surgical services in outpatient hos-pital and ambulatory surgical facilities. Most surgical specialties,such as general, orthopedic, cardiovascular, neurological, and tho-racic surgeons, remained closely tied to inpatient hospital settings.
In 1995, ophthalmologists provided most (39.9 percent) of thesurgery done in outpatient hospital settings (see table E–20). Thepredominance of ophthalmologists in this setting is due to cataractsurgery. Dermatologists accounted for the largest proportion of of-fice surgical charges, 24.7 percent. However, ophthalmologists andpodiatrists also represented significant percentages of office sur-gical charges, 20.3 and 17.6 percent respectively. In inpatient set-tings, the traditional surgical specialties—general surgery, ortho-pedic surgery, cardiovascular surgery, thoracic surgery, and urol-ogy accounted for 64.9 percent of all surgical charges.
Table E–21 summarizes the geographic practice cost indices for1997.

1226
TABLE E–17.—CHARGES SUBMITTED TO MEDICARE FOR ALL PHYSICIAN SURGICALSERVICES BY PLACE OF SERVICE, SELECTED YEARS 1980–95
Year and place of service
Surgical charges 1
Amount inmillions
Percent ofsurgicalcharges
As percent oftotal settings
charges
1980:Office ....................................................... $445 11.6 12.2Outpatient hospital 1 ............................... 129 3.3 29.5Inpatient hospital .................................... 3,231 84.4 44.1Other 2 ...................................................... 23 0.6 3.7
Total ................................................ 3,828 100.0 31.8
1990:Office ....................................................... 2,004 18.1 16.2Outpatient hospital 1 ............................... 2,867 26.0 54.3Inpatient hospital .................................... 5,563 50.4 40.6Ambulatory surgical center ..................... 488 4.4 51.2Other 2 ...................................................... 127 1.1 14.5
Total ................................................ 11,048 100.0 33.3
1993:Office ....................................................... 2,128 19.7 14.1Outpatient hospital 1 ............................... 2,731 25.3 48.4Inpatient hospital .................................... 5,085 47.2 38.4Ambulatory surgical center ..................... 697 6.5 90.5Other 2 ...................................................... 136 1.3 11.1
Total ................................................ 10,777 100.0 30.0
1994:Office ....................................................... 2,379 20.0 14.0Outpatient hospital 1 ............................... 3,046 25.6 47.9Inpatient hospital .................................... 5,518 46.4 38.5Ambulatory surgical center ..................... 798 6.7 91.0Other 2 ...................................................... 162 1.4 8.7
Total ................................................ 11,904 100.0 29.5
1995:Office ....................................................... 2,656 20.7 14.3Outpatient hospital 1 ............................... 3,273 25.5 47.3Inpatient hospital .................................... 5,817 45.3 38.8Ambulatory surgical center ..................... 887 6.9 91.0Other 2 ...................................................... 195 1.5 8.9
Total ................................................ 12,828 100.0 29.31 May include some services rendered in an ambulatory surgical center. Medicare began covering serv-
ices in ambulatory surgical centers in 1982.2 Includes homes, nursing homes, and other places of service.
Source: Health Care Financing Administration, Bureau of Data Management and Strategy.

1227
TABLE E–18.—SUBMITTED SURGICAL CHARGES AS A SHARE OF TOTAL SURGICALCHARGES AND AS A PERCENT OF TOTAL PRACTICE CHARGES BY MEDICAL SPECIALTY,1980 AND 1995
Specialty
Percent distribution ofsurgical charges
Surgical charges as apercent of total prac-
tice charges
1980 1995 1980 1995
Ophthalmology ........................................... 13.6 20.4 62.1 64.0General surgery .......................................... 22.1 11.8 71.6 71.0Orthopedic surgery ..................................... 13.0 11.6 73.6 70.9Cardiovascular disease .............................. 2.7 6.4 22.4 22.2Urology ....................................................... 10.7 5.8 75.6 41.9Gastroenterology ......................................... 1.7 5.5 45.9 60.1Dermatology ............................................... 2.4 5.3 60.9 70.0Podiatry ...................................................... 3.0 5.3 53.5 69.1Thoracic surgery ......................................... 8.0 4.7 82.2 82.4Internal medicine ....................................... 4.2 2.4 6.9 5.5Clinic and other group practice ................ 4.7 2.3 25.8 20.9Neurological surgery .................................. 2.9 2.2 70.2 78.0Otology, laryngology, rhinology .................. 1.9 1.7 49.7 43.7Plastic surgery ........................................... 1.3 1.4 88.1 84.0Other .......................................................... 8.4 13.2 .............. 9.5
All physicians ............................... 100.0 100.0 31.8 29.5
Source: Health Care Financing Administration, Bureau of Data Management and Strategy.
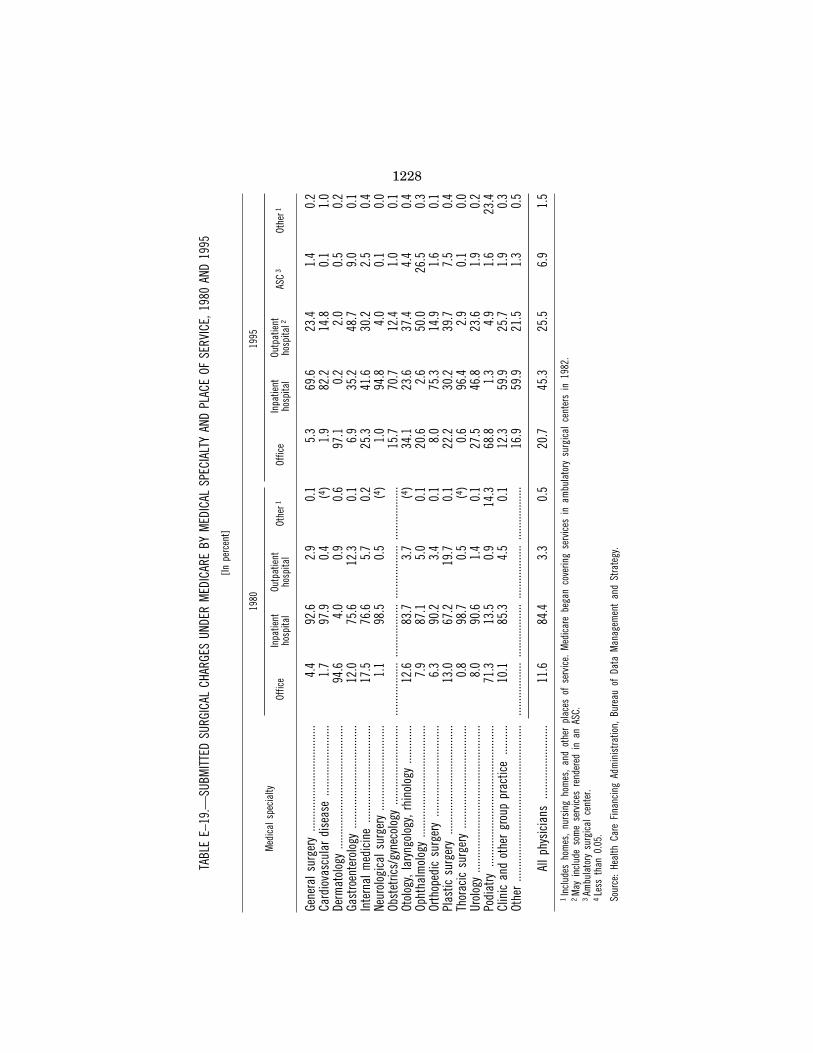
1228
TABL
E E–
19.—
SUBM
ITTE
D SU
RGIC
AL C
HARG
ES U
NDER
MED
ICAR
E BY
MED
ICAL
SPE
CIAL
TY A
ND P
LACE
OF
SERV
ICE,
198
0 AN
D 19
95
[In p
erce
nt]
Med
ical
spe
cial
ty
1980
1995
Offic
eIn
patie
ntho
spita
lOu
tpat
ient
hosp
ital
Othe
r1Of
fice
Inpa
tient
hosp
ital
Outp
atie
ntho
spita
l2AS
C3
Othe
r1
Gene
ral s
urge
ry...
......
......
......
......
......
...4.
492
.62.
90.
15.
369
.623
.41.
40.
2Ca
rdio
vasc
ular
dis
ease
......
......
......
......
1.7
97.9
0.4
(4)
1.9
82.2
14.8
0.1
1.0
Derm
atol
ogy
......
......
......
......
......
......
......
94.6
4.0
0.9
0.6
97.1
0.2
2.0
0.5
0.2
Gast
roen
tero
logy
......
......
......
......
......
.....
12.0
75.6
12.3
0.1
6.9
35.2
48.7
9.0
0.1
Inte
rnal
med
icin
e...
......
......
......
......
......
17.5
76.6
5.7
0.2
25.3
41.6
30.2
2.5
0.4
Neur
olog
ical
sur
gery
......
......
......
......
.....
1.1
98.5
0.5
(4)
1.0
94.8
4.0
0.1
0.0
Obst
etric
s/gy
neco
logy
......
......
......
......
......
......
......
......
......
......
......
......
......
......
......
......
...15
.770
.712
.41.
00.
1Ot
olog
y, la
ryng
olog
y, rh
inol
ogy
......
......
.12
.683
.73.
7(4
)34
.123
.637
.44.
40.
4Op
htha
lmol
ogy
......
......
......
......
......
......
..7.
987
.15.
00.
120
.62.
650
.026
.50.
3Or
thop
edic
sur
gery
......
......
......
......
......
.6.
390
.23.
40.
18.
075
.314
.91.
60.
1Pl
astic
sur
gery
......
......
......
......
......
......
.13
.067
.219
.70.
122
.230
.239
.77.
50.
4Th
orac
ic s
urge
ry...
......
......
......
......
......
..0.
898
.70.
5(4
)0.
696
.42.
90.
10.
0Ur
olog
y...
......
......
......
......
......
......
......
.....
8.0
90.6
1.4
0.1
27.5
46.8
23.6
1.9
0.2
Podi
atry
......
......
......
......
......
......
......
......
71.3
13.5
0.9
14.3
68.8
1.3
4.9
1.6
23.4
Clin
ic a
nd o
ther
gro
up p
ract
ice
......
....
10.1
85.3
4.5
0.1
12.3
59.9
25.7
1.9
0.3
Othe
r...
......
......
......
......
......
......
......
......
.....
......
......
......
......
......
......
......
......
......
......
......
...16
.959
.921
.51.
30.
5
All p
hysi
cian
s...
......
......
......
....
11.6
84.4
3.3
0.5
20.7
45.3
25.5
6.9
1.5
1In
clud
es h
omes
, nu
rsin
g ho
mes
, an
d ot
her
plac
es o
f se
rvic
e. M
edic
are
bega
n co
verin
g se
rvic
es i
n am
bula
tory
sur
gica
l ce
nter
s in
198
2.2
May
inc
lude
som
e se
rvic
es r
ende
red
in a
n AS
C.3
Ambu
lato
ry s
urgi
cal
cent
er.
4Le
ss t
han
0.05
.
Sour
ce:
Heal
th C
are
Fina
ncin
g Ad
min
istra
tion,
Bur
eau
of D
ata
Man
agem
ent
and
Stra
tegy
.
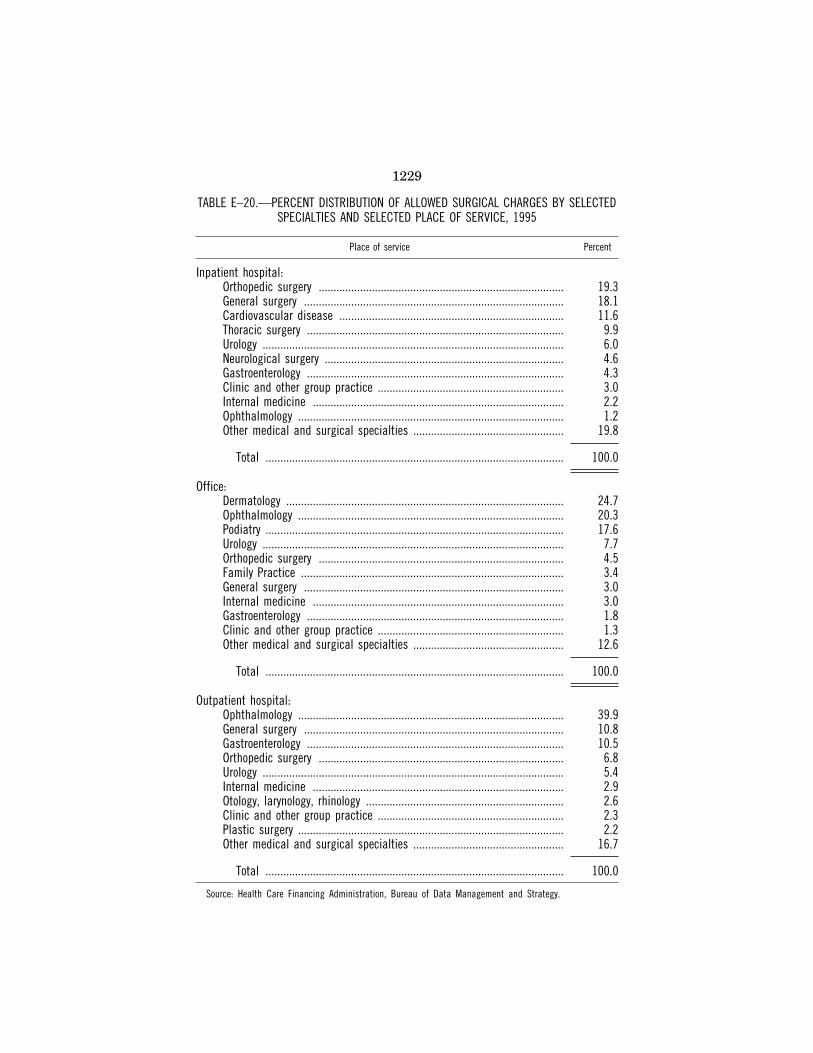
1229
TABLE E–20.—PERCENT DISTRIBUTION OF ALLOWED SURGICAL CHARGES BY SELECTEDSPECIALTIES AND SELECTED PLACE OF SERVICE, 1995
Place of service Percent
Inpatient hospital:Orthopedic surgery ................................................................................... 19.3General surgery ........................................................................................ 18.1Cardiovascular disease ............................................................................ 11.6Thoracic surgery ....................................................................................... 9.9Urology ...................................................................................................... 6.0Neurological surgery ................................................................................. 4.6Gastroenterology ....................................................................................... 4.3Clinic and other group practice ............................................................... 3.0Internal medicine ..................................................................................... 2.2Ophthalmology .......................................................................................... 1.2Other medical and surgical specialties ................................................... 19.8
Total ..................................................................................................... 100.0
Office:Dermatology .............................................................................................. 24.7Ophthalmology .......................................................................................... 20.3Podiatry ..................................................................................................... 17.6Urology ...................................................................................................... 7.7Orthopedic surgery ................................................................................... 4.5Family Practice ......................................................................................... 3.4General surgery ........................................................................................ 3.0Internal medicine ..................................................................................... 3.0Gastroenterology ....................................................................................... 1.8Clinic and other group practice ............................................................... 1.3Other medical and surgical specialties ................................................... 12.6
Total ..................................................................................................... 100.0
Outpatient hospital:Ophthalmology .......................................................................................... 39.9General surgery ........................................................................................ 10.8Gastroenterology ....................................................................................... 10.5Orthopedic surgery ................................................................................... 6.8Urology ...................................................................................................... 5.4Internal medicine ..................................................................................... 2.9Otology, larynology, rhinology ................................................................... 2.6Clinic and other group practice ............................................................... 2.3Plastic surgery .......................................................................................... 2.2Other medical and surgical specialties ................................................... 16.7
Total ..................................................................................................... 100.0
Source: Health Care Financing Administration, Bureau of Data Management and Strategy.

1230
TABLE E–21.—1997 GEOGRAPHIC PRACTICE COST INDICES BY MEDICARE CARRIERAND LOCALITY
Carriernumber
Localitynumber Locality name
Cost indices
Work Practiceexpense
Mal-practice
00510 00 Alabama ...................................... 0.980 0.871 0.92701020 01 Alaska ......................................... 1.064 1.155 1.61701030 00 Arizona ........................................ 0.996 0.955 1.32100520 13 Arkansas ..................................... 0.954 0.853 0.42700542 03 Marin/Napa/Solano, CA ............... 1.015 1.180 0.59600542 05 San Francisco, CA ....................... 1.068 1.330 0.59600542 06 San Mateo, CA ............................ 1.049 1.300 0.59600542 07 Oakland/Berkeley, CA .................. 1.042 1.215 0.59600542 09 Santa Clara, CA .......................... 1.064 1.289 0.59602050 17 Ventura ........................................ 1.028 1.192 0.68602050 18 Los Angeles, CA .......................... 1.056 1.207 0.75202050 26 Anaheim/Santa Ana, CA ............. 1.037 1.205 0.75202050 99 Rest of California ....................... 1.009 1.048 0.62700542 99 Rest of California ....................... 1.009 1.048 0.62700824 01 Colorado ...................................... 0.989 0.951 0.82710230 00 Connecticut ................................. 1.050 1.194 1.00100570 01 Delaware ..................................... 1.021 1.032 0.79200580 01 DC & MD/VA Suburbs ................. 1.051 1.192 0.98000590 04 Miami, FL .................................... 1.016 1.087 2.45600590 03 Ft. Lauderdale, FL ....................... 0.998 1.036 1.86700590 99 Rest of Florida ............................ 0.977 0.944 1.41701040 01 Atlanta, GA .................................. 1.007 1.030 0.90201040 99 Rest of Georgia ........................... 0.971 0.891 0.90201120 01 Hawaii ......................................... 0.999 1.220 0.92105130 00 Idaho ........................................... 0.962 0.882 0.58800621 16 Chicago, IL .................................. 1.028 1.080 1.38200621 15 Suburban Chicago, IL ................. 1.007 1.093 1.15900621 12 East St. Louis, IL ........................ 0.988 0.929 1.20200621 99 Rest of Illinois ............................ 0.965 0.884 0.82400630 00 Indiana ........................................ 0.982 0.917 0.35600640 00 Iowa ............................................. 0.960 0.877 0.67900650 00 Kansas ........................................ 0.964 0.891 1.19100660 00 Kentucky ...................................... 0.971 0.869 0.81900528 01 New Orleans, LA .......................... 0.999 0.946 0.99700528 99 Rest of Louisiana ........................ 0.969 0.870 0.91221200 03 Southern Maine ........................... 0.980 1.034 0.75921200 99 Rest of Maine ............................. 0.962 0.925 0.75900901 01 Baltimore/Surr Ctys, MD ............. 1.021 1.036 1.11500901 99 Rest of Maryland ........................ 0.984 0.953 0.86200700 01 Boston, MA .................................. 1.040 1.213 0.97800700 99 Rest of Massachusetts ............... 1.012 1.086 0.97800623 01 Detroit, MI ................................... 1.043 1.038 3.05100623 99 Rest of Michigan ........................ 0.998 0.935 1.84410240 00 Minnesota .................................... 0.990 0.965 0.59410250 00 Mississippi .................................. 0.958 0.845 0.72611260 01 St. Louis, MO .............................. 0.994 0.944 1.20700740 02 Metro Kansas City, MO ............... 0.989 0.949 1.207
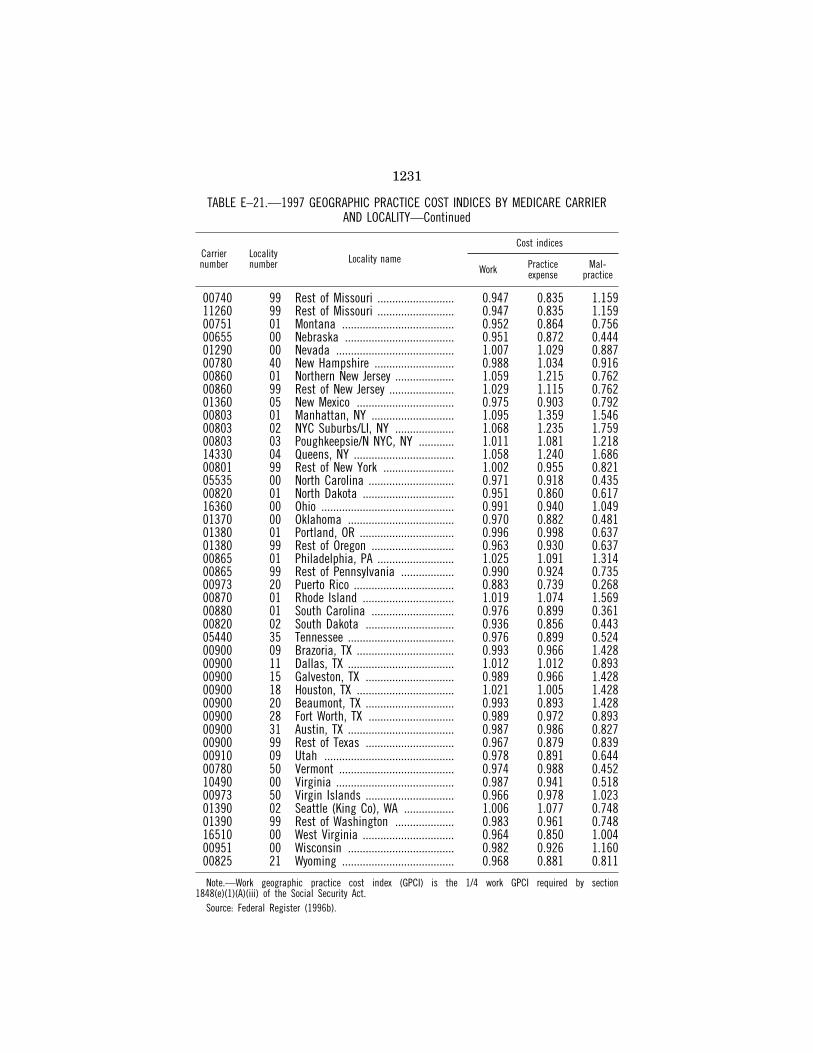
1231
TABLE E–21.—1997 GEOGRAPHIC PRACTICE COST INDICES BY MEDICARE CARRIERAND LOCALITY—Continued
Carriernumber
Localitynumber Locality name
Cost indices
Work Practiceexpense
Mal-practice
00740 99 Rest of Missouri .......................... 0.947 0.835 1.15911260 99 Rest of Missouri .......................... 0.947 0.835 1.15900751 01 Montana ...................................... 0.952 0.864 0.75600655 00 Nebraska ..................................... 0.951 0.872 0.44401290 00 Nevada ........................................ 1.007 1.029 0.88700780 40 New Hampshire ........................... 0.988 1.034 0.91600860 01 Northern New Jersey .................... 1.059 1.215 0.76200860 99 Rest of New Jersey ...................... 1.029 1.115 0.76201360 05 New Mexico ................................. 0.975 0.903 0.79200803 01 Manhattan, NY ............................ 1.095 1.359 1.54600803 02 NYC Suburbs/LI, NY .................... 1.068 1.235 1.75900803 03 Poughkeepsie/N NYC, NY ............ 1.011 1.081 1.21814330 04 Queens, NY .................................. 1.058 1.240 1.68600801 99 Rest of New York ........................ 1.002 0.955 0.82105535 00 North Carolina ............................. 0.971 0.918 0.43500820 01 North Dakota ............................... 0.951 0.860 0.61716360 00 Ohio ............................................. 0.991 0.940 1.04901370 00 Oklahoma .................................... 0.970 0.882 0.48101380 01 Portland, OR ................................ 0.996 0.998 0.63701380 99 Rest of Oregon ............................ 0.963 0.930 0.63700865 01 Philadelphia, PA .......................... 1.025 1.091 1.31400865 99 Rest of Pennsylvania .................. 0.990 0.924 0.73500973 20 Puerto Rico .................................. 0.883 0.739 0.26800870 01 Rhode Island ............................... 1.019 1.074 1.56900880 01 South Carolina ............................ 0.976 0.899 0.36100820 02 South Dakota .............................. 0.936 0.856 0.44305440 35 Tennessee .................................... 0.976 0.899 0.52400900 09 Brazoria, TX ................................. 0.993 0.966 1.42800900 11 Dallas, TX .................................... 1.012 1.012 0.89300900 15 Galveston, TX .............................. 0.989 0.966 1.42800900 18 Houston, TX ................................. 1.021 1.005 1.42800900 20 Beaumont, TX .............................. 0.993 0.893 1.42800900 28 Fort Worth, TX ............................. 0.989 0.972 0.89300900 31 Austin, TX .................................... 0.987 0.986 0.82700900 99 Rest of Texas .............................. 0.967 0.879 0.83900910 09 Utah ............................................ 0.978 0.891 0.64400780 50 Vermont ....................................... 0.974 0.988 0.45210490 00 Virginia ........................................ 0.987 0.941 0.51800973 50 Virgin Islands .............................. 0.966 0.978 1.02301390 02 Seattle (King Co), WA ................. 1.006 1.077 0.74801390 99 Rest of Washington .................... 0.983 0.961 0.74816510 00 West Virginia ............................... 0.964 0.850 1.00400951 00 Wisconsin .................................... 0.982 0.926 1.16000825 21 Wyoming ...................................... 0.968 0.881 0.811
Note.—Work geographic practice cost index (GPCI) is the 1/4 work GPCI required by section1848(e)(1)(A)(iii) of the Social Security Act.
Source: Federal Register (1996b).

1232
REFERENCES
Federal Register. (1996a, November 22). Medicare Program; Physi-cian fee schedule update for calendar year 1997 and Physicianvolume performance standard Rates of Increase for Federal fis-cal year 1997; Final notice. 61(227). pp. 59717–24.
Federal Register. (1996b, November 22). Medicare Program; Revi-sions to Payment Policies and Five-Year Review of and Adjust-ments to the Relative Value Units Under the Physician feeschedule update for calendar year 1997; Final rule. 61(227). pp.59490–714.
Physician Payment Review Commission. (1997). Annual report toCongress. Washington, DC: Author.