APPENDIX B. SUPPORTING INFORMATION USED … B. SUPPORTING INFORMATION USED IN THE STATE OF THE...
35
APPENDIX B. SUPPORTING INFORMATION USED IN THE STATE OF THE SYSTEM EVALUATION B-1. Bellevue Stormwater Basin Fact Sheets B-2. Impervious Area and Tree Canopy Cover for Drainage Basins and their Stream Buffers in Bellevue, 2007 B-3. Basin Evaluation by Available Evaluation Criteria B-4. Information used to Evaluate Basins, Evaluation Metrics, and Results B-5. Count of Flooded Structures from Historic Work Order Database B-6. Volume of Storage and Other Characteristics of Bellevue’s Public Regional Detention Ponds, Updated in 2009 B-7. B-IBI Scores at Bellevue Sites in all Sampled Years B-8. Sunset Creek Sedimentation Study B-9. Rates of Pre-spawn Mortality (PSM) in Kelsey Creek Index Reaches (Kelsey Creek, West Tributary, and Richards Creek) from Fall Salmon Spawner Surveys B-10. Hydrologic Monitoring Plan B-11. Water Quality in Bellevue’s Lakes B-12. Pollution Export Coefficients for Bellevue Runoff Based on Samples Collected from 1989 to 1993 B-13. Total Monthly Rainfall for 1962 and 1999 Measured at Sea-Tac Airport
Transcript of APPENDIX B. SUPPORTING INFORMATION USED … B. SUPPORTING INFORMATION USED IN THE STATE OF THE...

APPENDIX B. SUPPORTING INFORMATION USED IN THE STATE OF THE SYSTEM
EVALUATION
B-1. Bellevue Stormwater Basin Fact Sheets
B-2. Impervious Area and Tree Canopy Cover for Drainage Basins and their Stream Buffers in Bellevue, 2007
B-3. Basin Evaluation by Available Evaluation Criteria
B-4. Information used to Evaluate Basins, Evaluation Metrics, and Results
B-5. Count of Flooded Structures from Historic Work Order Database
B-6. Volume of Storage and Other Characteristics of Bellevue’s Public Regional Detention Ponds, Updated in 2009
B-7. B-IBI Scores at Bellevue Sites in all Sampled Years
B-8. Sunset Creek Sedimentation Study
B-9. Rates of Pre-spawn Mortality (PSM) in Kelsey Creek Index Reaches (Kelsey Creek, West Tributary, and Richards Creek) from Fall Salmon Spawner Surveys
B-10. Hydrologic Monitoring Plan
B-11. Water Quality in Bellevue’s Lakes
B-12. Pollution Export Coefficients for Bellevue Runoff Based on Samples Collected from 1989 to 1993
B-13. Total Monthly Rainfall for 1962 and 1999 Measured at Sea-Tac Airport


2012 STORM AND SURFACE WATER SYSTEM PLAN
Appendix B B-1
Appendix B-1. Bellevue Stormwater Basin Fact Sheets


2012 STORM AND SURFACE WATER SYSTEM PLAN
Appendix B B-3
Appendix B-2. Impervious Area and Tree Canopy Cover for Drainage Basins and their Stream Buffers in Bellevue, 2007.
Basin % Impervious
% Tree
Canopy
% Impervious in 100-
foot Stream Buffers
% Tree Canopy in
100-foot Stream
Buffers
Ardmore Area 43 30 8 83
Beaux Arts Area 34 53 * *
Clyde Beach Area 47 31 * *
Coal Creek Basin 20 58 8 85
East Creek Basin 48 35 29 65
Goff Creek Basin 30 59 35 55
Kelsey Creek Basin 40 33 17 55
Lakehurst Area 33 37 21 62
Lewis Creek Basin 29 49 17 69
Mercer Slough Basin 32 43 7 53
Meydenbauer Creek Basin 59 24 36 44
Newport Area 39 30 7 91
North Sammamish Area 32 46 9 86
Phantom Creek Basin 35 33 17 64
Richards Creek Basin 45 36 22 62
Rosemont Area 38 31 6 55
Sears Creek Basin 63 21 52 44
South Sammamish Area 31 48 16 75
Spirit Ridge Area 40 34 24 86
Sturtevant Creek Basin 71 18 62 23
Sunset Creek Basin 42 35 28 60
Valley Creek Basin 34 42 20 56
Vasa Creek Basin 40 40 17 73
West Tributary Basin 46 34 28 49
Wilkins Creek Basin 41 29 16 77
Yarrow Creek Basin 31 53 27 58
City-wide 46 36.2 Not available Not available
*No streams in this basin.


2012 STORM AND SURFACE WATER SYSTEM PLAN
Appendix B B-5
Appendix B-3. Basin Evaluation by Available Evaluation Criteria. Flood Protection Water Quality Aquatic Habitat Presence or Absence of Key Basin Issues
Basin
Primary Street
Closures per 100-year, 24-
hour Storm
Secondary Street
Closures per 100-year, 24-hour Storm
Flooded Structures
(2000-2009)
Note: >4 years less
than claims
Flooding Claims
(10/1/96-2/28/11)
Area Built prior to
Stormwater Control
Standards (%)
Total Impervious
Area (%) Phosphorus-
sensitive Lake
Impaired Water Body
(Ecology 303(d) list
2008)
Water Quality
Risk Level
(IDDE)
LWD Pieces per
Channel Width
Pool Frequency and Quality
(deep and cool with cover)
B-IBI Score (most
recent) Flood
Protection Water Quality Aquatic Habitat
Salmon Spawning Stream Basins
Coal Creek 0 1 7 6 8 20 No Yes Low Fair ND 17.6 √ √ √
East Creek 0 0* 2 0 38 48 No No High Poor Poor ND √ √
Goff Creek 0 0 3 0 29 30 No No High ND ND 6.4 √ √
Kelsey Creek 2 1 14 7 44 40 No Yes High Poor Poor 8.5 √ √ √
Mercer Slough 0 0 6 4 23 32 No Yes Medium ND ND ND √ √
Newport Area 0 0 4 0 52 39 No No Low ND ND 10.2 √ √ √
Richards Creek 1* 0 7 4 27 45 No No High Poor Poor 15.3 √ √ √
Valley Creek 0 0 4 1 21 34 No No High Poor Poor 6.4 √ √ √
Vasa Creek 0 0 8 2 32 40 Yes No Medium ND ND 42.6 √ √ √
West Tributary 0 0 5 2 35 46 No No High ND ND 17.7 √ √ √
Small and Steep Stream Basins
Ardmore 0 0 9 1 49 43 Yes Yes Low ND ND ND √ √
Lakehurst 0 0 3 3 16 33 No No Low ND ND 9.4 √ √
Lewis Creek 1 0 6 1 2 29 Yes Yes Medium ND ND 39.5 √ √ √
North Sammamish 0 0 8 4 45 29 Yes No Low NA NA NA √
Phantom Creek 0 0 3 1 34 32 Yes No Low ND ND 20.5 √ √
Sunset Creek 0 1 7 0 40 35 No No High Poor Poor 0 √ √ √
South Sammamish 0 0 4 0 17 31 Yes No Low ND ND ND
Wilkins Creek 0 0 4 2 59 41 Yes No Low ND ND 13 √ √
Yarrow Creek 0 0 10 2 14 31 No Yes High ND ND 35.6 √ √ √
Closed Conveyance System Basins (>96% piped storm drainage system)
Beaux Arts Area 0 1 3 0 38 34 No No NA NA NA NA √
Clyde Beach 0 0 8 1 31 47 No No NA NA NA NA √
Meydenbauer Creek 0 0 6 7 36 59 No Yes (Bay) Medium ND ND ND √ √
Redmond 400 NA NA 5 NA 46 NA NA NA NA NA NA
NA
Rosemont Area 1 0 3 6 40 38 Yes No NA NA NA NA √
Sears Creek 0 0 3 0 17 63 No No High ND ND ND √
Spirit Ridge 0 0 4 3 51 40 Yes No NA NA NA NA √ √
Sturtevant Creek 0 0 3 2 21 71 Yes No High ND ND ND √ √
Note: See Appendices B-1, B-2, and B-4 through B-14 for additional details and supporting information of the evaluation data.


2012 STORM AND SURFACE WATER SYSTEM PLAN
Appendix B B-7
Appendix B-4. Information used to Evaluate Basins, and for the Evaluation Metrics and Results
Road Closures Due to Storms
Road closures during the five storm events reported below are due to flooding unless otherwise indicated. Other storm-related causes of road closures include landslides and sink holes. The amount of rainfall reported below is the total amount of rain for the duration of the storm event, and the frequency applies to the maximum amount of rain that fell during a consecutive 24-hour period during the storm event. For purposes of evaluating the basins, the range in the number of road closures during an individual storm event are reported by road type, only for primary and secondary roads. Arterial/collector streets and neighborhood streets are included here because they may be addressed after the highest priority recurring road closures are fixed. The following recurring road closures reported for the 2001 and 2003 storm events have been resolved by flood control projects through the Capital Investment Program, and have not been closed during any storms that have occurred since the project was built:
• Kamber Road at East Creek (2004—culvert replacement) • SE 30th Street at East Creek (2010 to 2011—culvert replacement)
A project to reduce flooding at Factoria Boulevard was constructed in 2003, but this road flooded in a large storm in 2006. It is possible that regular maintenance since that time has prevented flooding in subsequent large storms. A project to evaluate flooding and capacity issues and determine steps to resolve the flooding at 156th Avenue SE at SE 11th Street is in progress as of 2011.
Storm Event Road Closures (Drainage Basin)
Date(s) Rainfall (inches)
Storm Frequency Primary* Secondary*
Arterial/Collector Streets*
Neighborhood Streets*
Nov. 14-15, 2001
3.5 >10-year, 24-
hour
1) West Lake Sammamish Parkway (Rosemont)
2) Factoria Blvd. (Richards)
3) 148th Avenue SE at Larsen Lake (Kelsey)
1) Kamber Road at East Creek (Sunset)
2) 156th Avenue at SE 11th St. (Kelsey)
none
1) NE 21st St. at 140th Avenue NE (Sears)
2) SE 7th Place near Lake Hills Connector (Kelsey)
3) SE 30th at Sunset Creek (Sunset)
Oct. 20-21, 2003
5.1 >100-year, 24-
hour
1) Bel-Red Road at 140th Avenue NE (Kelsey)
2) Factoria Blvd. (Richards)
3) 148th Avenue SE at Larsen Lake (Kelsey)
1) Kamber Road at East Creek (Sunset)
none
1) SE 7th Place near Lake Hills Connector (Kelsey)

2012 STORM AND SURFACE WATER SYSTEM PLAN
B-8 Appendix B
Storm Event Road Closures (Drainage Basin)
Date(s) Rainfall (inches)
Storm Frequency Primary* Secondary*
Arterial/Collector Streets*
Neighborhood Streets*
Nov. 5-7, 2006 3.2 <10-year, 24-
hour
1) West Lake Sammamish Parkway (Rosemont)
2) Factoria Blvd. (Richards)
none none
1) NE 21st St. at 140th Avenue NE (Sears)
2) SE 7th Place near Lake Hills Connector (Kelsey)
3) SE 30th at Sunset Creek (Sunset)
Dec. 2-4, 2007 6.1 >100-year, 24-
hour
1) Newport Way near Lakemont Blvd. - sinkhole (Lewis)
2) 148th Avenue SE at Larsen Lake (Kelsey)
1) 97th Place SE between SE 11th and SE 15th St. -landslide (Beaux Arts)
none
1) NE 21st St. at 140th Avenue NE (Sears)
2) SE 7th Place near Lake Hills Connector (Kelsey)
Dec. 11-12, 2010
4.6 >100-year, 24-
hour
1) West Lake Sammamish Parkway-landslide (Rosemont)
2) 148th Avenue SE at Larsen Lake (Kelsey)
1) 97th Place SE between SE 11th and SE 15th St. -landslide (Beaux Arts)
2) Lakemont/Newcastle Road-landslide (Coal)
none
1) NE 21st St. at 140th Ave NE (Sears)
2) SE 7th Place near Lake Hills Connector (Kelsey)
*Primary and secondary roads are priority routes during emergencies, and are priority
areas for preventing closures due to storms where it is not cost-prohibitive.
Arterial/collector streets and neighborhood streets are lower priorities for preventing
closures during storms.

2012 STORM AND SURFACE WATER SYSTEM PLAN
Appendix B B-9
Appendix B-5. Count of Flooded Structures from Historic Work Order Database.
Includes flood records from 1/1/2000 to 12/31/2014 that were not coded as having a private cause/remedy. These report numbers may include multiple calls for the same incident, maintenance issues (e.g., leaves blocking catch basins), and other issues involving the public storm system. All reports are investigated and actions taken for public safety and protection of property.
Any areas where recurring maintenance issues occur become part of the Routine Flood Prevention Maintenance Inspection List. Flooding incidents that may require infrastructure changes are reviewed as part of the Capital Investment Program. In rare cases, affected properties may be acquired.
Basin Number of
Flooded Structures
Flooded Structure Evaluation*
Paid Claims (*=Yes)
Additional Actions in Basin
Ardmore 9 Many *
Beaux Arts 3 Moderate
Clyde Beach 8 Many *
Coal Creek 7 Many * Maintenance surveillance; Capital Investment Program (CIP) flood control projects
East Creek 2
Few CIP flood control projects
Goff Creek 3 Moderate
Kelsey Creek 14 Many * Maintenance surveillance; CIP flood control projects; acquisition
Lakehurst 3 Moderate * Maintenance surveillance
Lewis Creek 6 Many * Maintenance surveillance; acquisition
Mercer Slough 6 Many *
Meydenbauer Creek 6 Many * Maintenance surveillance
Newport 4 Moderate Maintenance surveillance
North Sammamish 8 Many * Maintenance surveillance
Redmond 400 5 Many NA
Richards Creek 7 Many *
Rosemont 3 Moderate * Maintenance surveillance
Sears Creek 3 Moderate
South Sammamish 4 Moderate
Spirit Ridge 4 Moderate * Maintenance surveillance
Sturtevant Creek 3 Moderate * Maintenance surveillance
Sunset Creek 7 Many Maintenance surveillance; CIP flood control projects
Valley Creek 4 Moderate *
Vasa Creek 8 Many *
West Tributary 5 Many *
Wilkins Creek 4 Moderate *
Yarrow Creek 10 Many * Maintenance surveillance; CIP flood control projects
Total 155
*Few (0-2); Moderate (3-4); Many (>5); NA = Not available


2012 STORM AND SURFACE WATER SYSTEM PLAN
Appendix B B-11
Appendix B-6. Volume of Storage and other Characteristics of Bellevue’s Public Regional Detention Ponds (updated 2009).
Regional Pond
Volume at
Overflow
(ac-ft)
Tributary
Area
(ac)
Tributary
EIA
(ac)
Total Volume/Acre
Tributary EIA 1
(ft)
Stage at Overflow
(ft, NGVD)
Q at Overflow
(cfs)
Overflow
Return Period (yrs) Notes
Kelsey Creek Pond 2 (133)
32.0 1594 476 0.18 247.9 110.0 20.0 Larsen Lake is upstream
Larsen Lake Pond2 (149)
54.0 833 207 0.26 253.4 23.0 1.5
Lower West Tributary Pond2 (164S)
8.0 1423 517 0.07 109.2 85.0 5.0
Goff Creek and Upper West Tributary ponds are upstream
Goff Creek Pond2 (164N)
8.0 1268 427 0.07 113.4 53.0 2.0 Upper West Tributary pond is upstream
Upper West Tributary Pond2 (165)
22.0 463 238 0.09 131.2 39.0 10.0
Valley Creek Pond2 (197)
15.0 1298 288 0.05 198.5 37.0 5.0
Overlake Pond2 (179N)
12.0 514 312 0.05 246.6 55.0 25.0 Commissioners Pond upstream
Commissioners Pond2 (179S)
2.7 269 116 0.02 282.4 37.0 5.0
Total Kelsey Basin2
153.7 6470 2040 0.08
Lakemont (Lewis Creek Basin)3
31.6 252.4 85.1 0.37 634.64
I-405 Pond (Coal Creek Basin)5
19.5 4550 72.5 585
Coal Creek Parkway (Coal Creek Basin)6, 7
2.0 8.0
1 Volume includes all upstream regional pond storage. EIA = Effective Impervious Area, or impervious area that drains directly to the storm drain system and streams. 2 From Northwest Hydraulic Consultants. 2002. Hydrologic Study of Kelsey Creek Basin, Bellevue, WA. 3 From City of Bellevue. 2002. Lakemont Stormwater Filtration Facility, Operations and Maintenance Manual, Volume 1: Procedures Manual. 4 Emergency spillway overflow elevation. 5 From Jensen, Bruce. 2004. I-405 Rating Curve Development, Entranco, Inc., Bellevue, WA. 6 From Tetra Tech/KCM. 2006. Coal Creek Stabilization Program Final Environmental Impact Statement, Volume 2: Technical Appendices. 7 Data added in 2015 plan update.


2012 STORM AND SURFACE WATER SYSTEM PLAN
Appendix B B-13
Appendix B-7. B-IBI Scores at Bellevue Sites in all Sampled Years.
Note: Replicate scores are given, as well as mean B-IBI site scores. To obtain B-IBI site scores, metric values were individually averaged and scored; scores of averaged metric values were summed. Bold B-IBI scores indicate samples collected by King County; others were collected by Bellevue staff.

2012 STORM AND SURFACE WATER SYSTEM PLAN
B-14 Appendix B
Stream River Mile Site code Location 1998 2001 2002 2003 2004 2005 2006 2007 2008 2009 2010 2011 2012 2013 2014
Lewis 2.1 Lewis Above Lakemont
Lewis above lakemont facility spillway 56.4
Lewis 1.8 LewisUS/ravine Lewis upstream of I90 37.9 18.7 42.5 60 59.7 38.7 61.1
Lewis 0.8 LewisI90 Lewis on Lakemont Blvd. at I-90 43.5 47.4 36.9 35.7 13.2 38.1 39.5
Lewis 0.3 LewisElliot Lewis downstream of I90 43.7 37.5 22.4 26.7
Vasa 08LAK2827 Vasa between W Lk Samm Pkway & Lake Samm 24 22.3 23.2 24 10 39.2 21.1 23.6 27.2 23 22.4
Vasa 0.38 VasaTribble Vasa at Gary Tribble's 16455 SE 35TH ST Bellevue 98008 31.1
Vasa 1.9 UpperVasa Vasa in Horizon Heights Open Space, upstream of SE 45th St 33.1
Idylwood 08LAK3121 Idylwood in Redmond, near 175th & NE 34th St
Phantom 0.2 PhanWeowna Lower Phantom, just upstream of W Lk Samm in Weowna Park 30.3 20.5
Wilkins 0.33 WilkUpstr Upstream of Bypass, at NE 8th & Northup Wy. 13
Wilkins 0.26 WilkBypass In bypass reach, near NE 8th & Northup Wy. 10.9
Coal 4 Cindermines Coal off Newcastle Road at cinder mine detention site 58.8 31.5 35.9 62.9 52.6 42.6 41
Coal 2.3 Trailhead Coal above Coal Parkway 45.5 26.4 27.7 34.4 38.6 31.4 23
Coal 1.8 CoalPkwy Coal below Coal Parkway 31.1 17.1 20.4 28.5
Trib 0273 08EAS2540 Trib 0273, u/s Forest Dr. SE, trib to Coal Cr 25.9 24.4 17.7 21.5 19.6 35.3 15.8 25.1 28.4
Coal 1.3 Anna's Pond Coal Creek - channel around Anna's Pond 17.6
Goff 0.1 GoffMouth Just upstream of confluence w/ West Trib 6.4
Goff 1.7 GoffUsBp Goff upstream of bypass 7.5 6.4 9.4
Goff 1.6 GoffInBp Goff in bypass area 3.9 13.4 9.6

2012 STORM AND SURFACE WATER SYSTEM PLAN
Appendix B B-15
Goff 1.4 GoffDsBp Goff downstream of bypass 19.2 11.9 13.7
Valley 0.2 Valley Valley at Highland Park 5.6 6.4
Kelsey 3.9 Church Kelsey at Bellevue Christian Church 10 9.3
Kelsey 3.66-3.81 Peltzer/KelByrne
Kelsey upstream of GCC (1400 block 143rd. Place NE) 15.6 10.5 1.4
Kelsey 3.6 WAM06600-038087
Kelsey downstream of Peltzer 3 13.5 8.3 8.5 11.9
Kelsey 08EAS2272 Kelsey d/s of 140th Ave NE near NE 15th St 6.1 0 4.5 2.8 4.4 10.7 9 4.7 13.9 9.2 8.9 24.2
Kelsey 2.4 KelWeirs Kelsey at GCC within step weirs 8.4 4 9.3
Kelsey 2.3 KelGCfb Kelsey at GCC below step weirs 7.7 5.5 3.7
Kelsey 1.8 Glendale Kelsey at GCC wooded area 16.5 1.2 4.4 1.9 7.6
Kelsey 1.6 KelFarm Kelsey Farm 1.9 8.5
Kelsey 0.2 KelTrstl Kelsey under trestle and below culvert 10.2 11.2 10.6 20.8
West Trib 0.4 WTribFarm West Trib in Kelsey Farm, restored reach 11.4 17.7
Sunset 08EAS2546 Sunset near SE 32nd St 11.8 10.5 0 0 3.5 0.4 5.2 7 6.1 0.2 4.6
Sunset 0 Sunset/Richards Confluence of Sunset Creek and Richards Creek, north of SE 30th St 1.4 0
Lakehurst 0.3 Lkhrst405 Just upstream of pond, E of I405 9.4
Newport 0.4 NewpStab Stabilized reach d/s of swim club on 119th 12.5 10.2
Yarrow 0.2 Glory Hole 35.6
Trib 0160 0160 Just south of Vasa Park 42.6


2012 STORM AND SURFACE WATER SYSTEM PLAN
Appendix B B-17
Appendix B-8. Sunset Creek Sedimentation Study
Stream sediment samples have been collected for a number of years along Sunset Creek at SE 30th Street. Sample locations are shown in Figure B-8A below. This particular segment of Sunset Creek, at SE 30th Street, is the site of a recently constructed sediment trap and culvert replacement. The area has experienced periodic flooding and is a location where the City, with appropriate permits, has been removing builtup sediment directly from the stream. Samples were taken at the same key locations before and after installation of the new culvert and sediment trap.
As discussed in Chapter 6 of the Storm and Surface Water System Plan, too much fine sediment can smother salmon eggs laid in a stream. Table B-8A, taken from the Post Construction/2010 Conditions Report prepared by Herrera Environmental, shows changes in fine sediment content from year to year (pre-project 2007 and 2009 baseline) even before construction. Note that the table not only provides year-to-year direct comparison of fine sediment, it also shows changes in the sediment conditions for salmon spawning with readings of Good, Fair, and Poor.
Table B-8A shows a reduction in fine sediment post-construction. This is generally seen as improving salmon spawning conditions in three of the four sample sites from Poor to Fair. However, proper management of the new sediment trap requires many years of sampling data. Permit conditions from local, state, and federal agencies require that sediment sampling, stream cross-section survey, and a variety of other stream features be monitored for a period of 15 years. Additional downstream projects are planned as part of a comprehensive approach to flood control and stream enhancement along this segment of Sunset Creek, Richards Creek, and East Creek. Data will be collected and reports will be available as construction and monitoring continues.

2012 STORM AND SURFACE WATER SYSTEM PLAN
B-18 Appendix B
Figure B-8A. Sampling data taken in Sunset Creek.
I am doing some research hoping to find a COTS product that does clip-zip-s= hip for vector layers. It sounds like ERDAS Apollo might do the trick. Is= this true? How much does Apollo cost? What are some of the other advanta= ges of Apollo? We currently are a ESRI centric shop, but currently use an Autodesk Mapguid= e solution as our internal map browser. We hope to learn more about your p= roduct.
Date: 12/7/2011 File Name: V:\utpl\ArcGIS\Storm\UtilCompPlan_2010\ArcGIS\SE30th_Sunset_Monitoring.mxd
SE30th/ Sunset Creek Sediment Monitoring Locations
City ofBellevue
Storm and Surface Water System Plan
.

2012 STORM AND SURFACE WATER SYSTEM PLAN
Appendix B B-19
Table B-8A. Table taken from the Draft Sunset Creek, Richards Creek, and East Creek Channel Monitoring Report, 2012 Conditions prepared by Herrera Environmental Consultants, dated November, 2012.
A comparison of pre-project 2007, baseline, post-construction 2010, 2011, and 2012 bulk
sediment sample monitoring results according to the City of Bellevue’s monitoring protocol
standards.
Pre-project (2007) Sample
Location
Monitoring
Cross-Section
Location
Pre-project
(2007)
Baseline
(2009)
Post-con
(2010)
Post-con
(2011)
Post-con
(2012)
Pre-project
(2007)
Baseline
(2009)
Post-con
(2010)
Post-con
(2011)
Post-con
(2012)
SS-1 3 12 24.2 14.7 15.5 14.4 Good Poor Fair Fair Fair
SS-2 4 14.5 21.1 15.4 13 12.1 Fair Poor Fair Fair Fair
SS-3 6 18.5 19.8 13.5 12.1 13.9 Poor Poor Fair Fair Fair
SS-4 8 28 28.6 18.8 12.5 12 Poor Poor Poor Fair Fair
a Grain size condition is judged as:
Good is <12% finer than 0.85 mm (per Schuett-Hames et al. 199)
Fair is 12 - 17% finer than 0.85 mm
Poor is > 17% finer than 0.85 mm
% Finer than 0.85 mma Condition


2012 STORM AND SURFACE WATER SYSTEM PLAN
Appendix B B-21
Appendix B-9. Rates of Pre-spawn Mortality (PSM) in Kelsey Creek Index Reaches (Kelsey Creek, West Tributary, and Richards Creek) from Fall Salmon Spawner Surveys.
Year Percent Pre-Spawn Mortality Rate (female
carcasses only) Total Number of Observed Adult Spawner Carcasses
Species
2000-2001 74 35 (female) Coho
2002 0 11 (male and female) Chinook
2003 0 1 (female) Chinook
2006 7 200 (male and female) Chinook
2007 15 193 (male and female) Chinook
2008 6 16 (female) Coho
2009 40 5 (female) Chinook
2010 0 1 (male) Chinook
2011 0 2 (male and unknown) Chinook and Sockeye
2012 100 2 (female) Coho
2013 39 228 (male and female) Chinook and Coho
2014 56 91 (male and female) Coho

2012 STORM AND SURFACE WATER SYSTEM PLAN
Appendix B B-23
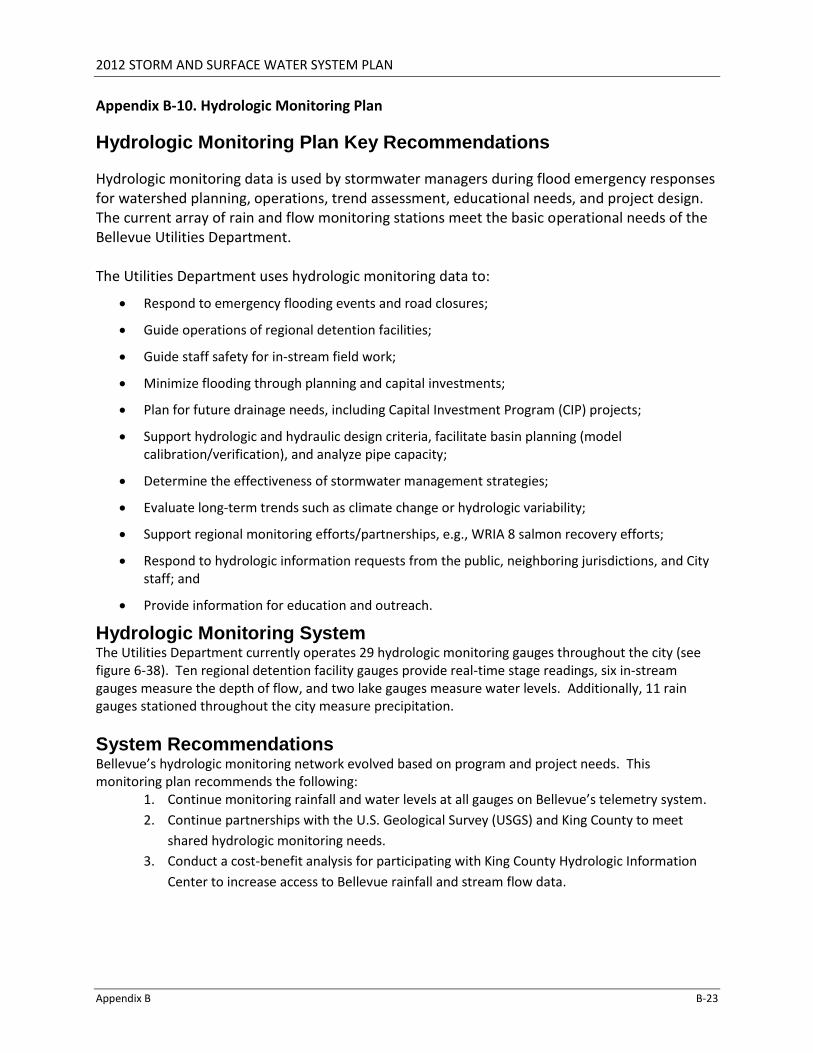
Appendix B-10. Hydrologic Monitoring Plan
Hydrologic Monitoring Plan Key Recommendations
Hydrologic monitoring data is used by stormwater managers during flood emergency responses for watershed planning, operations, trend assessment, educational needs, and project design. The current array of rain and flow monitoring stations meet the basic operational needs of the Bellevue Utilities Department. The Utilities Department uses hydrologic monitoring data to:
Respond to emergency flooding events and road closures;
Guide operations of regional detention facilities;
Guide staff safety for in-stream field work;
Minimize flooding through planning and capital investments;
Plan for future drainage needs, including Capital Investment Program (CIP) projects;
Support hydrologic and hydraulic design criteria, facilitate basin planning (model calibration/verification), and analyze pipe capacity;
Determine the effectiveness of stormwater management strategies;
Evaluate long-term trends such as climate change or hydrologic variability;
Support regional monitoring efforts/partnerships, e.g., WRIA 8 salmon recovery efforts;
Respond to hydrologic information requests from the public, neighboring jurisdictions, and City staff; and
Provide information for education and outreach.
Hydrologic Monitoring System The Utilities Department currently operates 29 hydrologic monitoring gauges throughout the city (see figure 6-38). Ten regional detention facility gauges provide real-time stage readings, six in-stream gauges measure the depth of flow, and two lake gauges measure water levels. Additionally, 11 rain gauges stationed throughout the city measure precipitation.
System Recommendations Bellevue’s hydrologic monitoring network evolved based on program and project needs. This monitoring plan recommends the following:
1. Continue monitoring rainfall and water levels at all gauges on Bellevue’s telemetry system.
2. Continue partnerships with the U.S. Geological Survey (USGS) and King County to meet
shared hydrologic monitoring needs.
3. Conduct a cost-benefit analysis for participating with King County Hydrologic Information
Center to increase access to Bellevue rainfall and stream flow data.
2012 STORM AND SURFACE WATER SYSTEM PLAN
B-24 Appendix B
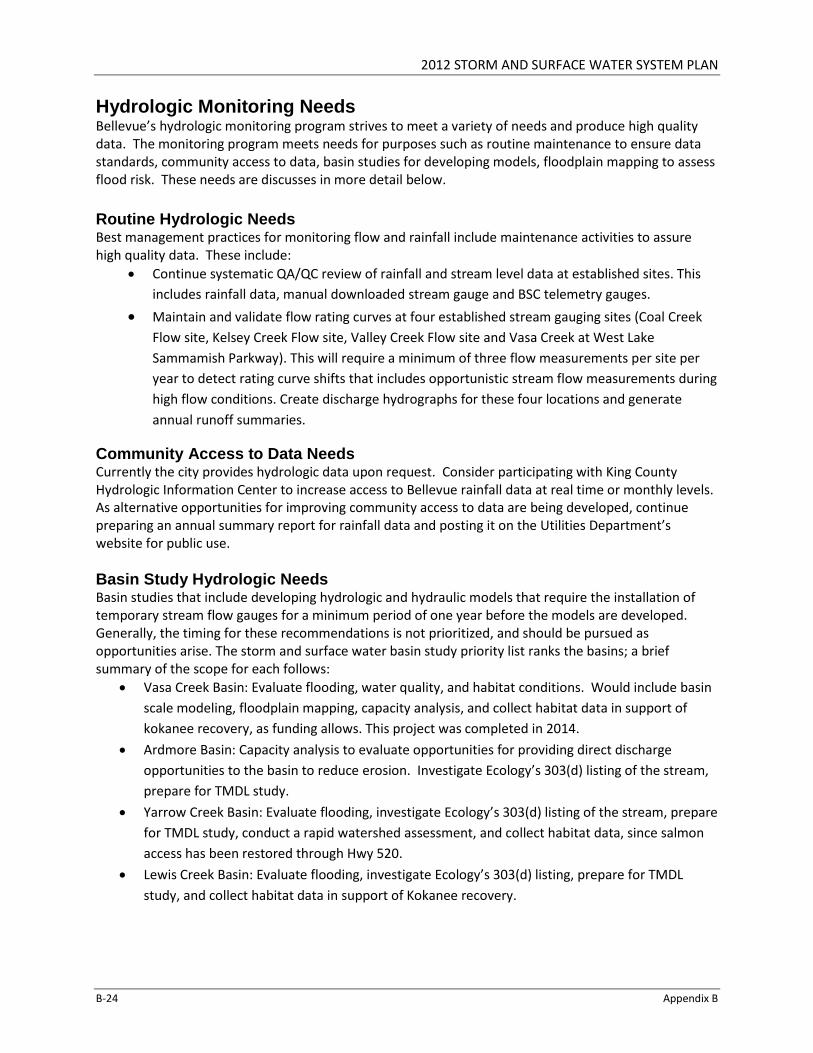
Hydrologic Monitoring Needs Bellevue’s hydrologic monitoring program strives to meet a variety of needs and produce high quality data. The monitoring program meets needs for purposes such as routine maintenance to ensure data standards, community access to data, basin studies for developing models, floodplain mapping to assess flood risk. These needs are discusses in more detail below.
Routine Hydrologic Needs Best management practices for monitoring flow and rainfall include maintenance activities to assure high quality data. These include:
Continue systematic QA/QC review of rainfall and stream level data at established sites. This
includes rainfall data, manual downloaded stream gauge and BSC telemetry gauges.
Maintain and validate flow rating curves at four established stream gauging sites (Coal Creek
Flow site, Kelsey Creek Flow site, Valley Creek Flow site and Vasa Creek at West Lake
Sammamish Parkway). This will require a minimum of three flow measurements per site per
year to detect rating curve shifts that includes opportunistic stream flow measurements during
high flow conditions. Create discharge hydrographs for these four locations and generate
annual runoff summaries.
Community Access to Data Needs Currently the city provides hydrologic data upon request. Consider participating with King County Hydrologic Information Center to increase access to Bellevue rainfall data at real time or monthly levels. As alternative opportunities for improving community access to data are being developed, continue preparing an annual summary report for rainfall data and posting it on the Utilities Department’s website for public use.
Basin Study Hydrologic Needs Basin studies that include developing hydrologic and hydraulic models that require the installation of temporary stream flow gauges for a minimum period of one year before the models are developed. Generally, the timing for these recommendations is not prioritized, and should be pursued as opportunities arise. The storm and surface water basin study priority list ranks the basins; a brief summary of the scope for each follows:
Vasa Creek Basin: Evaluate flooding, water quality, and habitat conditions. Would include basin
scale modeling, floodplain mapping, capacity analysis, and collect habitat data in support of
kokanee recovery, as funding allows. This project was completed in 2014.
Ardmore Basin: Capacity analysis to evaluate opportunities for providing direct discharge
opportunities to the basin to reduce erosion. Investigate Ecology’s 303(d) listing of the stream,
prepare for TMDL study.
Yarrow Creek Basin: Evaluate flooding, investigate Ecology’s 303(d) listing of the stream, prepare
for TMDL study, conduct a rapid watershed assessment, and collect habitat data, since salmon
access has been restored through Hwy 520.
Lewis Creek Basin: Evaluate flooding, investigate Ecology’s 303(d) listing, prepare for TMDL
study, and collect habitat data in support of Kokanee recovery.
2012 STORM AND SURFACE WATER SYSTEM PLAN
Appendix B B-25
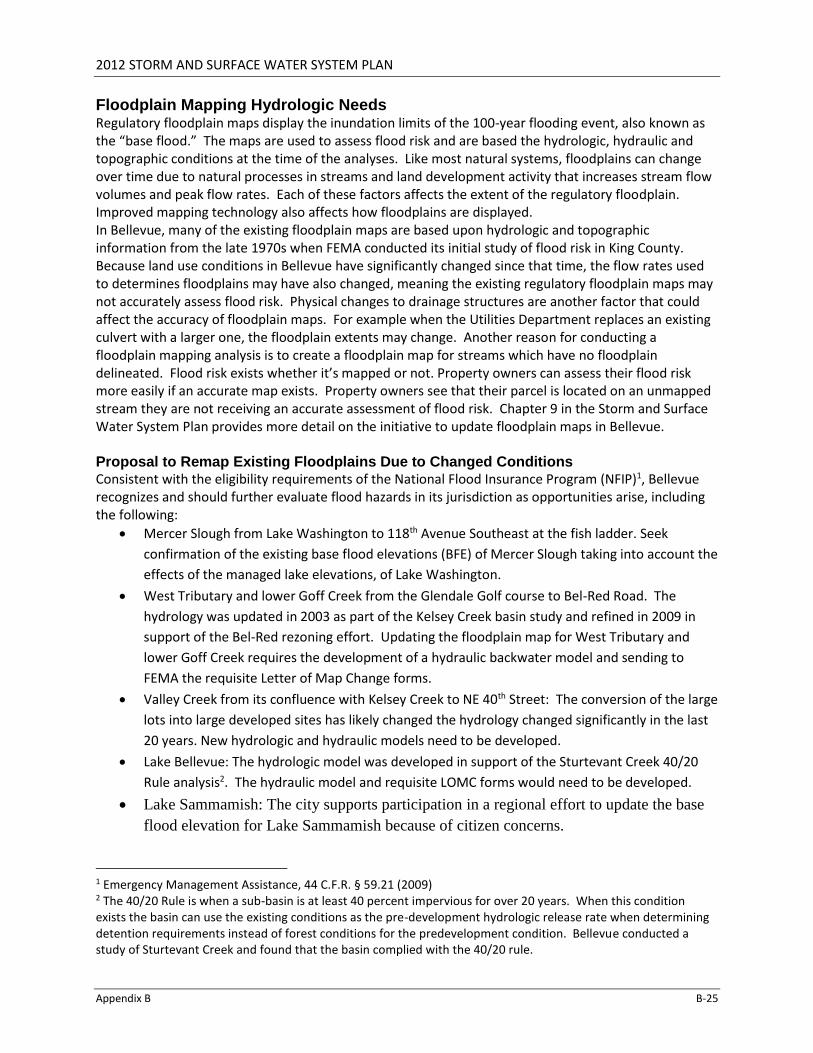
Floodplain Mapping Hydrologic Needs Regulatory floodplain maps display the inundation limits of the 100-year flooding event, also known as the “base flood.” The maps are used to assess flood risk and are based the hydrologic, hydraulic and topographic conditions at the time of the analyses. Like most natural systems, floodplains can change over time due to natural processes in streams and land development activity that increases stream flow volumes and peak flow rates. Each of these factors affects the extent of the regulatory floodplain. Improved mapping technology also affects how floodplains are displayed. In Bellevue, many of the existing floodplain maps are based upon hydrologic and topographic information from the late 1970s when FEMA conducted its initial study of flood risk in King County. Because land use conditions in Bellevue have significantly changed since that time, the flow rates used to determines floodplains may have also changed, meaning the existing regulatory floodplain maps may not accurately assess flood risk. Physical changes to drainage structures are another factor that could affect the accuracy of floodplain maps. For example when the Utilities Department replaces an existing culvert with a larger one, the floodplain extents may change. Another reason for conducting a floodplain mapping analysis is to create a floodplain map for streams which have no floodplain delineated. Flood risk exists whether it’s mapped or not. Property owners can assess their flood risk more easily if an accurate map exists. Property owners see that their parcel is located on an unmapped stream they are not receiving an accurate assessment of flood risk. Chapter 9 in the Storm and Surface Water System Plan provides more detail on the initiative to update floodplain maps in Bellevue. Proposal to Remap Existing Floodplains Due to Changed Conditions Consistent with the eligibility requirements of the National Flood Insurance Program (NFIP)1, Bellevue recognizes and should further evaluate flood hazards in its jurisdiction as opportunities arise, including the following:
Mercer Slough from Lake Washington to 118th Avenue Southeast at the fish ladder. Seek
confirmation of the existing base flood elevations (BFE) of Mercer Slough taking into account the
effects of the managed lake elevations, of Lake Washington.
West Tributary and lower Goff Creek from the Glendale Golf course to Bel-Red Road. The
hydrology was updated in 2003 as part of the Kelsey Creek basin study and refined in 2009 in
support of the Bel-Red rezoning effort. Updating the floodplain map for West Tributary and
lower Goff Creek requires the development of a hydraulic backwater model and sending to
FEMA the requisite Letter of Map Change forms.
Valley Creek from its confluence with Kelsey Creek to NE 40th Street: The conversion of the large
lots into large developed sites has likely changed the hydrology changed significantly in the last
20 years. New hydrologic and hydraulic models need to be developed.
Lake Bellevue: The hydrologic model was developed in support of the Sturtevant Creek 40/20
Rule analysis2. The hydraulic model and requisite LOMC forms would need to be developed.
Lake Sammamish: The city supports participation in a regional effort to update the base
flood elevation for Lake Sammamish because of citizen concerns.
1 Emergency Management Assistance, 44 C.F.R. § 59.21 (2009) 2 The 40/20 Rule is when a sub-basin is at least 40 percent impervious for over 20 years. When this condition exists the basin can use the existing conditions as the pre-development hydrologic release rate when determining detention requirements instead of forest conditions for the predevelopment condition. Bellevue conducted a study of Sturtevant Creek and found that the basin complied with the 40/20 rule.

2012 STORM AND SURFACE WATER SYSTEM PLAN
B-26 Appendix B
Proposals to map floodplains in locations where capital projects have altered the 100-year water surface elevation (e.g. culvert replacement projects)
Richards Creek from its confluence with Kelsey Creek to SE Eastgate Way where enlarged
culverts have been installed at Bannerwood Park, Kamber Road, and SE 30th Street as well as
channel improvements. For Richards Creek, the floodplain mapping initiative includes the need
to update the 1999 HSPF hydrology model and the hydraulic model for the creek. Lower Sunset
Creek from SE 32nd to the confluence with Richards Creek is recommended for inclusion with
this remapping because of the associated capital improvements recently completed for
improving conveyance through the stream channel.
Upper Sunset Creek in the vicinity of SE Allen Road. Hydrologic and hydraulic models need to be
developed for this stream reach to evaluate changes due to the installation of a high flow
bypass;
Coal Creek through Newport Shores: the models developed for the design of the new culverts
are sufficient for supporting floodplain mapping updates in the area.
Unmapped Floodplain Needs Chapter 9 of the Storm and Surface Water System Plan identifies the following locations needing
mapped floodplains:
o Sturtevant Creek- This creek should be mapped after the Bel-Red development is
completed.
o Sears Creek- This creek should be mapped after Redmond completes their regional
stormwater facilities that drain to Sears Creek, since these facilities will significantly
change the hydrology in the creek.
Conclusion Adequate hydrologic monitoring is critical for providing information for flood emergency response, health and safety, stormwater management, and the environmental and financial sustainability for Bellevue residents and businesses. Bellevue’s monitoring network, with proposed modifications, meets World Meteorological Organization recommendations and will meet Bellevue’s needs with a predictable level of effort for many years.

2012 STORM AND SURFACE WATER SYSTEM PLAN
Appendix B B-27
Appendix B-11. Water Quality in Bellevue’s Lakes
Lake Sammamish water contains high concentrations of phosphorus, a nutrient which can cause algae blooms and die-offs that reduce the oxygen in the water available for fish and other aquatic life, and reduces water clarity. In 1996, Bellevue, King County, the City of Redmond and the City of Issaquah set a goal of protecting the “ecological health and public benefits of Lake Sammamish.” Water quality indicator goals were set at 4.0 meters Secchi disk transparency, 2.8 micrograms per liter chlorophyll-a, and 22 micrograms per liter total phosphorus (Entranco et al. 1996). Since 1997, King County has collected water quality samples of Lake Sammamish in two locations to evaluate whether or not the water quality goals are being met. As of 2006, goals for phosphorus and transparency have been met each year for both stations except in 2004 and 2006 when the phosphorus goal was not met at one of the stations. The goal for chlorophyll-a has consistently not been met at both sampling stations. For more details, see http://green.kingcounty.gov/lakes/LakeSammamish.aspx.
Phantom and Larsen Lakes are much smaller than Lake Sammamish, and are also sensitive to phosphorus input. Phantom Lake is 63 acres, and has 7,392 feet of shoreline. The maximum water depth is 54 feet, and the mean water depth is 21 feet. It holds a volume of 1,450 acre-feet of water. The outlet of Phantom Lake was altered in approximately 1890, when a farmer diverted it from Kelsey Creek (and Lake Washington) by creating a new channel to the east, to Lake Sammamish. Bellevue has monitored the summer (June through September) water quality of Phantom Lake since 1991 for water clarity (Secchi visibility depth), nutrients (phosphorus), and algae (chlorophyll-a). From 1994 through 2008, goals set for the three measures were met for all years for clarity, 10 out of 14 years for nutrients, and 7 out of 14 years for algae; see Figure 6-5 for the Phantom Lake water quality monitoring results and goals from 1994 to 2008. Zooplankton and phytoplankton were monitored in Phantom Lake for over 10 years, beginning in 1997. The goal of the monitoring was to determine if overall aquatic biological conditions in Phantom Lake had improved, declined, or not changed since water quality improvements were implemented in 1990. Based on over 10 years of data, lake plankton conditions have generally improved.
Larsen Lake is near Phantom Lake, and forms the headwaters of Kelsey Creek. It is approximately 10.5 acres in surface area (Huitt-Zollars 2008), and averages about 9 feet deep. Water quality data, similar to Phantom Lake information, have been collected, but not yet analyzed.
Lake Bellevue is a small lake (approximately 10.4 acres) at the headwaters of Sturtevant Creek, which drains into Mercer Slough and ultimately into Lake Washington. The lake is on average 8 feet deep, with a maximum depth of approximately 11 feet. Lake Bellevue is situated within a densely urban (the Sturtevant Creek basin is on average 71 percent impervious surface area) drainage area, with development over the wetlands around the lake, including structures built over the lake itself. There are high phosphorus concentrations in the lake. Phosphorus, oils, water clarity and algae growth were sampled in 2004 and 2005 to determine how to manage algae, odor, and oils in the lake (Tetra Tech 2006). The analysis determined that only 24 percent of the phosphorus came from urban runoff to the lake; the remaining 76 percent was the result of phosphorus cycling among internal lake water, sediment, plants, and biota. Oil sheens were not attributed to stormwater runoff, but were likely from oil spills, creosote pilings, and nearshore parking lots. Water treatment best management practices and low impact development for redeveloping properties, education about spill prevention, lake aerators, alum treatments to reduce phosphorus, and ongoing monitoring were recommended in a 2006 Lake Bellevue water quality study (2006 Lake Bellevue Water Quality Study and Management Recommendations) to meet water quality goals for Lake Bellevue.


2012 STORM AND SURFACE WATER SYSTEM PLAN
Appendix B B-29
Appendix B-12. Pollution Export Coefficients for Bellevue Runoff based on Samples Collected from 1989 to 1993.
Note: Values presented are modified direct averages, estimated based on flow volumes and sampled concentrations during storm events (Storm) and between storm events (Base). Confidence limits, site descriptions, methods and additional analysis can be found in the original report (City of Bellevue 1995).
Land Use Type
% Im
pe
rvio
us
TSS (kg/ha-yr)
FC (no./ha-yr)
TP (kg/ha-yr)
Ortho-P (kg/ha-yr)
NO3+NO2-N (kg/ha-yr)
NH3-N (kg/ha-yr)
COD (kg/ha-yr)
Site Storm Base Storm Base Storm Base Storm Base Storm Base Storm Base Storm Base
New MFR 79 Goldsmith Park 21.6 ND ND 9.55E+08 0.096 0.235 0.03 0.171 0.276 0.706 0.33
0.377 32.7 ND
Food Distribution (Industrial)
Grocery Warehouse 194 33
2.07E+10
2.73E+09 2.19 3.45 0.652 6.76 2.15 0.818 775 1.1 375 58
Comm, Indust, MFR, SFR 50
Meydenbauer Creek 190 6.25
3.71E+10
2.35E+10 0.625 0.176 0.199 0.126 1.93 3.27 1.82
0.126 191 43.9
Comm, Indust, Service, Residential 72
Sturtevant Creek Downstream 340 11.8
2.17E+10
1.21E+10 1.39 0.485 0.301 0.373 2.02 1.86 1.99 0.41 151 37.9
Comm, Indust 71 Sturtevant Creek Upstream 303 14.4
1.34E+10
1.13E+10 1.15 0.422 0.295 0.281 2.28 2.39 2.66
0.597 196 ND
SFR, Light Indust, Service 37
West Tributary Downstream 79.6 16.5
1.99E+10
1.45E+11 0.26 0.46 0.079 0.368 0.656 6.72 0.283 2.85 28 ND
Indust, SFR 50 West Tributary Upstream 288 18.7
4.76E+10
3.15E+10 0.623 0.48 0.189 0.36 0.887 2.76 0.755 4.38 67.7 ND

2012 STORM AND SURFACE WATER SYSTEM PLAN
B-30 Appendix B
Appendix B-12, continued.
Site
Surfactants (kg/ha-yr)
Oil and Grease (kg/ha-yr)
Total Petroleum
Hydrocarbons Cadmium (kg/ha-yr)
Chromium (kg/ha-yr)
Copper (kg/ha-yr)
Nickel (kg/ha-yr)
Lead (kg/ha-yr)
Zinc (kg/ha-yr)
Storm Base Storm Base Storm Base Storm Base Storm Base Storm Base Storm Base Storm Base Storm Base
Goldsmith Park ND ND 1.3 ND 0.943 ND 0.0005 1.789 ND ND 0.0153 ND 0.0044 ND 0.0066 11.02 0.104 0.3605
Grocery Warehouse 2.72 ND 135 ND 90.2 ND ND ND 0.0483 ND 0.1393 ND ND ND ND 0.0285 2.362 0.3275
Meydenbauer Creek 0.881 ND 53.3 ND 36.9 ND 0.0024 ND 0.0247 ND 0.12 0.0452 0.0218 0.0062 0.0829 0.012 0.5845 0.1103
Sturtevant Creek Downstream ND 0.3727 14.6 ND 11.6 ND 0.0035 0.001 0.0273 ND 0.1153 0.0361 0.0384 ND 0.1064 0.0228 0.5993 0.3118
Sturtevant Creek Upstream ND 0.2811 42.9 ND 35.9 ND 0.0031 ND 0.0269 ND 0.1348 0.0228 0.0532 ND 0.1301 ND 0.6062 0.1861
West Tributary Downstream ND ND 3.03 ND 2.54 ND 0.0006 0.0032 ND ND 0.452 ND 0.0063 ND 0.0286 0.0311 0.1547 0.4068
West Tributary Upstream ND ND 7.33 ND 6.19 ND 0.0016 0.0017 ND ND 0.153 0.1475 0.0219 ND 0.1312 0.0392 0.5661 0.4055
Values are Modified Daily Averages, which is the total discharge volume for the study period multiplied by the mean pollutant concentration, calculated appropriately for a log normal distribution. Abbreviations used:
TSS Total suspended solids kg/ha-yr kilograms per hectare per year (annual loading) FC Fecal coliform bacteria ND Not detected in any samples TP Total phosphorus Comm Commercial
Ortho-P Orthophosphorus Indust Industrial COD Chemical Oxygen Demand MFR Multi-family Residential
NO3+NO2-N Nitrate-Nitrite SFR Single-family Residential NH3-N Ammonia

2012 STORM AND SURFACE WATER SYSTEM PLAN
Appendix B B-31
Dissolved metals were detected at all sites during storm events (see Table B-13A). Dissolved metals concentrations were generally higher for all metals sampled in basins with more impervious surface area. For example, zinc was highest in Sturtevant Creek, West Kelsey Creek, and Meydenbauer Creek drainage basins. Metal toxicity levels change with the hardness of the water, so determining whether concentrations in samples exceed state standards involves separate calculations for each sample. Additionally, state standards for metals have changed since the 1995 water quality report, so locations and numbers of exceedances were not available for this report.
Table B-12A. Median concentrations (µg/L) and annual yields (kg/ha-yr) for various metals analyzed at Bellevue monitoring locations during the first 6 hours of storm events, 1988-1993, as calculated by Whiley (2009).
Stations
Lead Cadmium Zinc Nickel Chromium Copper
Median
Conc. Yield
Median
Conc. Yield
Median
Conc. Yield
Median
Conc. Yield
Median
Conc. Yield
Median
Conc. Yield
W. Kelsey
Creek
Upstream
35.0 0.062 0.70 0.0012 179 0.318 11.0 0.020 >30%
nd == 33.5 0.06
W. Kelsey
Creek
Downstream
14.0 0.017 0.67 0.0008 84 0.101 5.5 0.007 >30%
nd == 22.0 0.026
Mercer
Slough
>30%
nd ==
>30%
nd == 46 0.041
>30%
nd ==
>30%
nd == 15.0 0.013
Coal Creek >30%
nd ==
>30%
nd == 54 0.097
>30%
nd ==
>30%
nd == 20.5 0.037
Meydenbauer
Creek
>30%
nd ==
>30%
nd == 170 0.394
>30%
nd ==
>30%
nd == 28.0 0.065
Sturtevant
Creek
Upstream
23.0 0.089 >30%
nd == 127 0.492
>30%
nd ==
>30%
nd == 23.0 0.089
Sturtevant
Creek
Downstream
27.5 0.076 0.85 0.0023 140 0.386 9.0 0.025 >30%
nd == 20.0 0.055
Wilkins
Creek
>30%
nd == n<4 == 49 ==
>30%
nd == 12.5 == 15.5 ==
Phantom
Lake n<4 == n<4 == 15 0.009 n<4 ==
>30%
nd == 10.0 0.006
Shaded data: >30% of reported observations less than detection limit; table value is median of concentrations above detection limit. <4: Reported observations number less than 4. = : Yield not calculated.

2012 STORM AND SURFACE WATER SYSTEM PLAN
Appendix B B-33
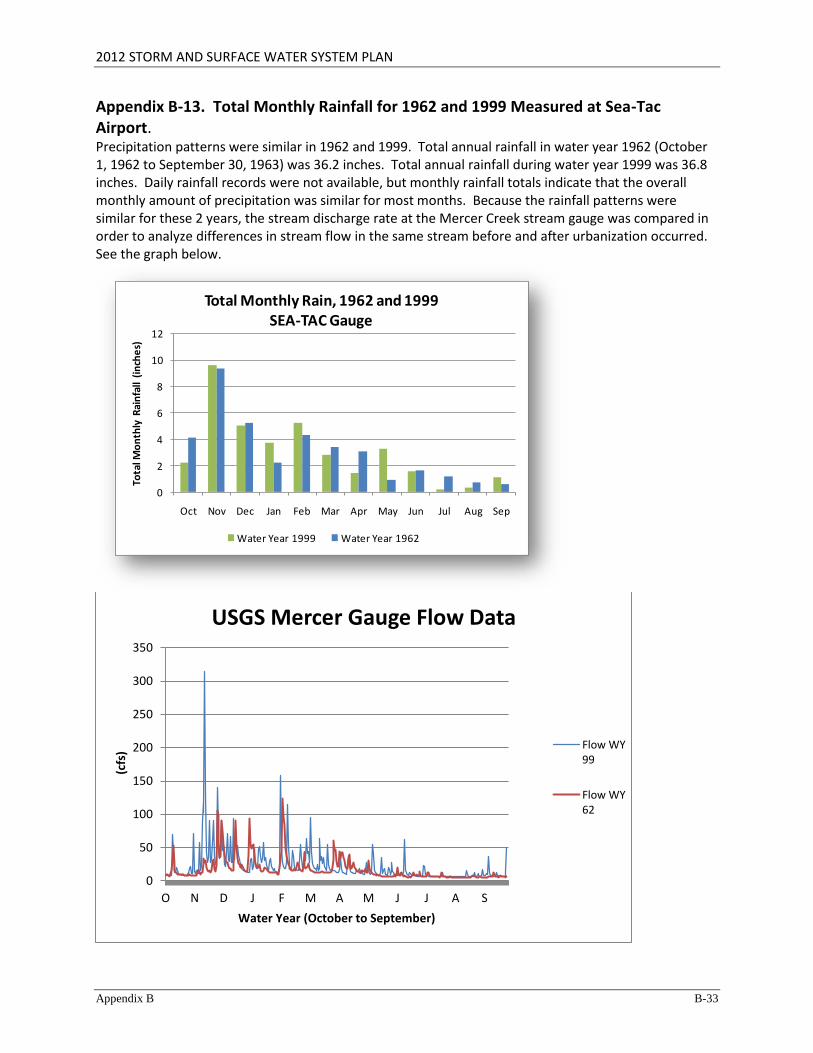
Appendix B-13. Total Monthly Rainfall for 1962 and 1999 Measured at Sea-Tac Airport. Precipitation patterns were similar in 1962 and 1999. Total annual rainfall in water year 1962 (October 1, 1962 to September 30, 1963) was 36.2 inches. Total annual rainfall during water year 1999 was 36.8 inches. Daily rainfall records were not available, but monthly rainfall totals indicate that the overall monthly amount of precipitation was similar for most months. Because the rainfall patterns were similar for these 2 years, the stream discharge rate at the Mercer Creek stream gauge was compared in order to analyze differences in stream flow in the same stream before and after urbanization occurred. See the graph below.
0
2
4
6
8
10
12
Oct Nov Dec Jan Feb Mar Apr May Jun Jul Aug Sep
Tota
l Mo
nth
ly R
ain
fall
(in
che
s)
Total Monthly Rain, 1962 and 1999SEA-TAC Gauge
Water Year 1999 Water Year 1962
0
50
100
150
200
250
300
350
O N D J F M A M J J A S
(cfs
)
Water Year (October to September)
USGS Mercer Gauge Flow Data
Flow WY99
Flow WY62