APPENDIX B – COASTAL ENGINEERING APPENDIX
61
APPENDIX B – COASTAL ENGINEERING APPENDIX GENERAL REEVALUATION REPORT (GRR) AND SUPPLEMENTAL ENVIRONMENTAL IMPACT STATEMENT (SEIS) FOR THE POPLAR ISLAND ENVIRONMENTAL RESTORATION PROJECT CHESAPEAKE BAY, TALBOT COUNTY, MARYLAND The hydraulic and hydrodynamic modeling for the 575-acre northern lateral expansion of the Poplar Island Restoration Project (PIERP) included the evaluation of four major components: 1. impacts to current velocity and changes to flow patterns (USACE-ERDC, 2005a), 2. changes in the residence time of water in Poplar Harbor, the open-water embayment, and the wetland cells within the proposed northern lateral alignment (USACE-ERDC, 2005a), 3. impacts to shoreline wave heights (USACE-ERDC, 2005b), and 4. life cycle analysis for the dike design (USACE-ERDC, 2005c). In addition, two previous studies (M&N, 2004; 2003) evaluated the potential for erosion and deposition of cohesive and non-cohesive sediment based on a generic northern alignment for the lateral expansion, as compared to the existing condition (the existing PIERP – 1,140 acres with 50 percent wetlands and 50 percent uplands). The results of each of these studies are summarized in the following sections. B.1 IMPACTS TO VELOCITY AND CHANGES IN FLOW PATTERN The purpose of this study was to assess the response of the surrounding area to the construction of the proposed northern lateral alignment using a numerical hydrodynamic circulation model. The ADvanced CIRCulation (ADCIRC) model was employed to assess the following issues: (1) Tidal elevation. (2) Current velocity. (3) Response of surrounding areas (Coaches Island, mainland) during a storm. (4) Changes in flow patterns resulting from the expanded island. (5) Feasibility for and functioning of a tidal gut between the existing and expanded island. The full details and results of the hydrodynamic modeling are presented in Poplar Island Expansion Flushing Study, Memorandum for the Record (USACE-ERDC, 2005a). Methods and results of the study are summarized in the following sections. Poplar Island Environmental Restoration Project September 2005 General Reevaluation Report (GRR) and Supplemental Environmental Impact Statement (SEIS) B-1
Transcript of APPENDIX B – COASTAL ENGINEERING APPENDIX

APPENDIX B – COASTAL ENGINEERING APPENDIX
GENERAL REEVALUATION REPORT (GRR) AND SUPPLEMENTAL ENVIRONMENTAL IMPACT STATEMENT (SEIS)
FOR THE POPLAR ISLAND ENVIRONMENTAL RESTORATION PROJECT
CHESAPEAKE BAY, TALBOT COUNTY, MARYLAND
The hydraulic and hydrodynamic modeling for the 575-acre northern lateral expansion of the Poplar Island Restoration Project (PIERP) included the evaluation of four major components:
1. impacts to current velocity and changes to flow patterns (USACE-ERDC, 2005a), 2. changes in the residence time of water in Poplar Harbor, the open-water embayment, and
the wetland cells within the proposed northern lateral alignment (USACE-ERDC, 2005a), 3. impacts to shoreline wave heights (USACE-ERDC, 2005b), and 4. life cycle analysis for the dike design (USACE-ERDC, 2005c).
In addition, two previous studies (M&N, 2004; 2003) evaluated the potential for erosion and deposition of cohesive and non-cohesive sediment based on a generic northern alignment for the lateral expansion, as compared to the existing condition (the existing PIERP – 1,140 acres with 50 percent wetlands and 50 percent uplands). The results of each of these studies are summarized in the following sections. B.1 IMPACTS TO VELOCITY AND CHANGES IN FLOW PATTERN The purpose of this study was to assess the response of the surrounding area to the construction of the proposed northern lateral alignment using a numerical hydrodynamic circulation model. The ADvanced CIRCulation (ADCIRC) model was employed to assess the following issues:
(1) Tidal elevation. (2) Current velocity. (3) Response of surrounding areas (Coaches Island, mainland) during a storm. (4) Changes in flow patterns resulting from the expanded island. (5) Feasibility for and functioning of a tidal gut between the existing and expanded
island. The full details and results of the hydrodynamic modeling are presented in Poplar Island Expansion Flushing Study, Memorandum for the Record (USACE-ERDC, 2005a). Methods and results of the study are summarized in the following sections.
Poplar Island Environmental Restoration Project September 2005 General Reevaluation Report (GRR) and Supplemental Environmental Impact Statement (SEIS)
B-1

B.1.1 Model Development ADCIRC Mesh. The finite-element mesh used in this study contained approximately 73,500 computational nodes and 142,000 elements (USACE-ERDC, 2005a). Depths on the mesh were referenced to mean tide level (MTL). Figure B-1 shows the ADCIRC mesh for the area directly adjacent to the existing Poplar Island and the proposed expansion area.
Figure B-1. ADCIRC mesh for the proposed northern lateral alignment Source: (USACE-ERDC, 2005a)
Existing Condition. The existing condition is defined by the most recent bathymetry information available as of December 2004. Bathymetry for the Poplar Island region was obtained from Poplar Island Environmental Restoration Project, Morphological Modeling (M&N, 2004). Bathymetry for the remainder of the numerical model domain was obtained from the National Geophysical Data Center (NGDC) Coastal Relief bathymetry database for coastal regions of the Atlantic Ocean. Option 1. This option uses the same finite-element mesh as the existing condition, with modifications in bathymetry in the region of proposed northern lateral alignment. Bathymetry in the region of proposed northern lateral alignment was modified based on the heights of the dikes and depths of the proposed wetland cells. Minor changes were made to the depths in the wetland cells to allow each cell to more appropriately drain through the openings. Water enters the tidal gut formed between the existing island and proposed expansion from one opening on the south side of the expansion area (Figure B-2).
Poplar Island Environmental Restoration Project September 2005 General Reevaluation Report (GRR) and Supplemental Environmental Impact Statement (SEIS)
B-2
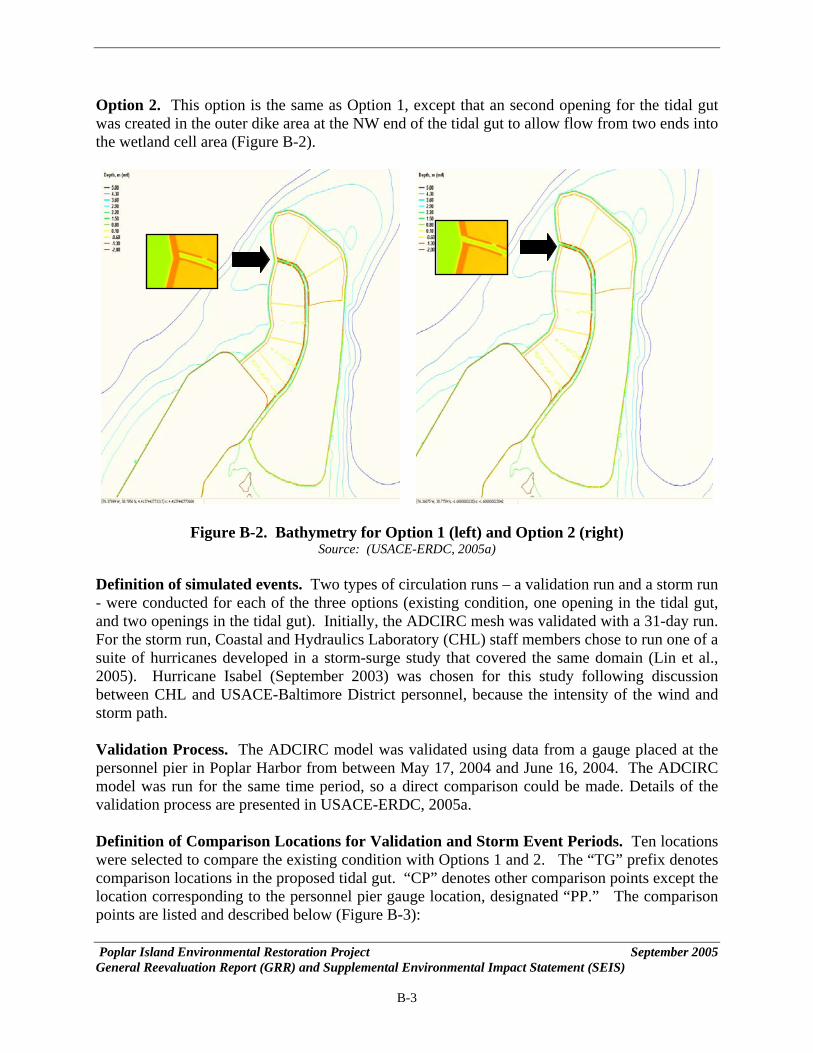
Option 2. This option is the same as Option 1, except that an second opening for the tidal gut was created in the outer dike area at the NW end of the tidal gut to allow flow from two ends into the wetland cell area (Figure B-2).
Figure B-2. Bathymetry for Option 1 (left) and Option 2 (right) Source: (USACE-ERDC, 2005a)
Definition of simulated events. Two types of circulation runs – a validation run and a storm run - were conducted for each of the three options (existing condition, one opening in the tidal gut, and two openings in the tidal gut). Initially, the ADCIRC mesh was validated with a 31-day run. For the storm run, Coastal and Hydraulics Laboratory (CHL) staff members chose to run one of a suite of hurricanes developed in a storm-surge study that covered the same domain (Lin et al., 2005). Hurricane Isabel (September 2003) was chosen for this study following discussion between CHL and USACE-Baltimore District personnel, because the intensity of the wind and storm path.
Validation Process. The ADCIRC model was validated using data from a gauge placed at the personnel pier in Poplar Harbor from between May 17, 2004 and June 16, 2004. The ADCIRC model was run for the same time period, so a direct comparison could be made. Details of the validation process are presented in USACE-ERDC, 2005a.
Poplar Island Environmental Restoration Project September 2005
Definition of Comparison Locations for Validation and Storm Event Periods. Ten locations were selected to compare the existing condition with Options 1 and 2. The “TG” prefix denotes comparison locations in the proposed tidal gut. “CP” denotes other comparison points except the location corresponding to the personnel pier gauge location, designated “PP.” The comparison points are listed and described below (Figure B-3):
General Reevaluation Report (GRR) and Supplemental Environmental Impact Statement (SEIS)
B-3

1. CP1 – South of Poplar Island 2. CP2 – Southwest Corner of Coaches Island 3. CP3 – Northwest Corner of Poplar Island 4. CP4 – North of Expansion Area 5. CP5 – Area between Expansion Area And Jefferson Island
ween Expansion Area and Mainland and Southeast of
6. CP6 – Navigation Channel bet7. CP7 – Navigation Channel between Mainland
Expansion Area 8. TG1 – Tidal Gut Entrance 9. TG2 – North End of Tidal Gut 10. PP – Personnel Pier Gauge Location
CP1
CP2
PP
TG1
CP4
Poplar Island Environmental Restoration Project September 2005
TG2
CP3
Comparison Point
Locations
CP6
CP7
CP5
CP1
CP2
PP
TG1
CP4
TG2
CP3
Comparison Point
Locations
CP6
CP7
CP5
Figure B-3. Points used for comparison of the model results Source: (USACE-ERDC, 2005a)
B.1.2 Water Level and Current Speed Results
Water levels calc lated for the existing condition were compared to those from Op n locations. Location TG2 showed a slight change in phase for the comparison of Option 1 to the existing condition, which was attributed to its location at the only opening of the tidal gut for Option 1. Current Speed Comparisons. Current speeds calculated for the existing condition were compared to those for Option 1 and Option 2. The only significant changes occurred at CP4,
Water Level Comparisons. u
tions 1 and 2. No significant changes were noted at most compariso
General Reevaluation Report (GRR) and Supplemental Environmental Impact Statement (SEIS)
B-4

TG1, and TG2, as described below. These changes were attributed to the introduction of the new y increasing friction in the shallower water
nd changing current speed and direction.
b. At TG1, the maximum increase in current speed for Option 1 was approximately
0.16 to 0.01 m/sec. For Option 2, there was an increase in maximum current speed of approximately 0.27 m/sec, from 0.16 to 0.43
of current speed with Option 1 and the increase of current speed with Option 2.
Water Lecondition to those of Option 1 and Option 2 were completed for the storm event, Hurricane Isabel. Slight water level changes were noted for the PP, CP2, CP5, CP7, TG1 and TG2 compareastern sidexpansion.the storm sincrease inthe storm s of the tidal gut
Option 1.
urrent speed during the highest intensity of the storm.
landmass of the proposed lateral expansion, thereba
a. Location CP4 demonstrated a maximum increase in current speed for both alternatives of approximately 0.11 m/sec from 0.15 m/sec to 0.26 m/sec.
0.20 m/sec, from 0.01 to 0.21 m/sec. The increase for Option 2 was 0.12 m/sec, from 0.01 to 0.13 m/sec.
c. At TG2, there was a decrease in maximum current speed for Option 1 by
approximately 0.15 m/sec, from
m/sec. The TG2 comparison point is located where there is relatively little flow until the opening of a dike in Option 2. This location explains the reduction
vel Comparisons for a Storm Event. Water level comparisons of the existing
ison locations, which were attributed to location of these comparison points on the e of Poplar Island and either inside or south of the proposed northern lateral
The land mass added in Options 1 and 2 acts as a barrier and promotes retention of urge until the peak of the storm passes and water level starts to lower. The largest
water level was 0.15 m over the existing condition for Option 1 at TG2 at the peak of urge. The increase can be attributed to existence of a barrier at the end
in
Current Speed Comparisons for a Storm Event. Current speed comparisons of the existing condition to Options 1 and 2 were conducted for the storm event, Hurricane Isabel. At the PP, CP1, CP3, and CP4 locations, there were only minor reductions of current speed, on the order of 0.04 to 0.10 m/sec. Four comparison points exhibited notable change in current speed as a direct result of circulation changes induced by introduction of a land mass in the expansion area:
a. At CP2, which is positioned at the southwest corner of Coaches Island, it was
observed for Options 1 and 2 that there was a 0.45 m/sec decrease in calculated c
b. At CP5 and CP6, a decrease in current speed of 0.40 m/sec was observed for both options during the time of highest storm surge, while at the CP7 location there was a slight decrease in speed as the surge was rising and a slight increase as the surge was receding.
Poplar Island Environmental Restoration Project September 2005 General Reevaluation Report (GRR) and Supplemental Environmental Impact Statement (SEIS)
B-5

c. The largest change in current speed was shown to occur for TG1, located at the tidal gut entrance. During the highest water levels, there was an increase of 0.5 m/sec. For the other tidal gut comparison location, TG2, there was a 0.20 m/sec decrease in current speed. This current speed changes occurred for both options.
B.1.3 Eva Following t ion of the plan formulation process, a proposal from National Marine
isheries Service (NMFS) and subsequent discussions with the Environmental Protection gency (USEPA), Fish and Wildlife Service (USFWS), Maryland Department of Natural esources (MDNR), and Maryland Department of the Environment (MDE) led to the
develop nnorthern lat In the NMF ame as those roposed by USACE, but approximately 130 acres of wetland located on the western side of the
er embayment protected by segmented reakwaters and bordered by salt marsh and mudflats. USACE-Baltimore District modified the
ased on the agency consultation to-date, the open-water embayment could potentially range
rmored sand dike imilar in cross section to the dikes of the existing project. Approximately 3,400 ft of the
ween segments.
luation of the Open-Water Embayment
he completFAR
me t and evaluation of an open-water embayment that could be incorporated into a eral alignment.
S proposal, the footprint of the northern lateral alignment was the splateral expansion was designated as an open-watbinitial open-water embayment proposed by NMFS to enhance the hydraulic characteristics of the proposal and minimize the impact on the dredged material placement capacity of the lateral expansion. The open-water embayment alignment consists of a 575-acre (nominal area contained within the project footprint) lateral expansion to the north and northeast of the existing project, and a 5-ft vertical raising of the existing upland cells (Cells 2 and 6). Bbetween 80 to 140 acres in size. Concerns pertaining to specific components of the open-water embayment will be discussed and evaluated further in the next design phase of the project based on additional consultation with each resource agency (USFWS, NMFS, USEPA, MDNR, and MDE) and MPA (the non-Federal sponsor); results of additional hydrodynamic modeling studies; and additional design considerations. However, for the evaluation conducted in this document, the size of the open-water embayment within the northern lateral expansion was estimated to be 130 acres in size. The alignment with the open-water embayment would be bounded by an aswestern leg of the perimeter dike would be replaced by segmented breakwaters. The breakwater segments are currently proposed to be approximately 200 ft long and separated by about 50-ft, except for one or two larger openings of approximately 200 ft. The breakwater structures will consist of a core of 250-lb underlayer stone and two layers of stone armor having a mean weight of approximately 2,500 lb. A high-strength geotextile sheet would be placed on the Bay bottom to minimize loss of stone into soft or loose surface deposits. Hydraulic analyses will be performed in the next design phase of the project to optimize the breakwater crest height, stone size, and dimension of openings bet The interior dikes of the alignment with the open-water embayment would be constructed to elevation +6.5 ft MLLW using sand and have minimal slope protection provided by established Poplar Island Environmental Restoration Project September 2005 General Reevaluation Report (GRR) and Supplemental Environmental Impact Statement (SEIS)
B-6

vegetation. Those dikes forming the perimeter of the proposed open water embayment will be raised to a minimum crest elevation of +9 ft MLLW and will require slope protection to prevent erosion from the exposure along the embayment. The present design assumption is that adequate slope protection can be provided by a double layer of 350-lb stone placed on a bedding layer and a geotextile filter, similar to the protection proposed for the eastern slopes of the expansion dikes. Dike height and slope protection requirements will be refined as hydraulic analyses are completed. ADCIRC Mesh. The finite-element mesh employed for the NMFS alternative differs from that employed in the originally investigated two alternatives, because substantial modification was required. High resolution was added to the ADCIRC mesh in the study area by incorporating drawings of the envisioned project provided by USACE-Baltimore District and CHL staff. This high resolution was used for the Existing Condition and for both storm and non-storm events to ensure one-to-one correspondence of points for comparisons. The mesh for the NMFS alternative differs only by bathymetric variations in the ADCIRC mesh. Depths on the mesh were referenced to mean tide level MTL. Figure B-4 shows the ADCIRC mesh for the area directly adjacent to the existing Poplar Island and the proposed expansion area.
Figure B-4. ADCIRC mesh used for the northern lateral alignment with the open-water embayment. Source: (USACE-ERDC, 2005a)
Existing Condition. As with the analysis for Options 1 and 2, the existing condition is defined by the most recent bathymetry information available as of December 2004. Bathymetry for the Poplar Island region was obtained from Poplar Island Environmental Restoration Project,
Poplar Island Environmental Restoration Project September 2005 General Reevaluation Report (GRR) and Supplemental Environmental Impact Statement (SEIS)
B-7

Morphological Modeling (M&N, 2004). Bathymetry for the remainder of the numerical model domain was obtained from the National Geophysical Data Center (NGDC) Coastal Relief bathymetry database for coastal regions of the Atlantic Ocean. Open-Water Embayment Alignment. Bathymetry defining this alternative was taken directly from the updated ADCIRC mesh, with only modifications in bathymetry in the region of the project expansion area. Bathymetry was entered using USACE-Baltimore guidance on the heights of the dikes, breakwaters, rock reefs and depths of the proposed wetland cells. Minor changes were made to the depths in the wetland cells to allow each cell to more appropriately drain through the openings. Figure B-5 shows bathymetry for the alignment with the open-water embayment.
Poplar Island Environmental Restoration Project September 2005
Ten locations were selected to compare the existing condition with the open-water embayment (Figure B-6). The “TG” prefix denotes comparison location in the proposed tidal gut. “CP” denotes other comparison points except the location corresponding to the Personnel Pier gauge location, designated “PP” and one entrance to the embayment area through one of the wide breakwater gaps, designated “BW1.” The comparison points are listed and described below:
Figure B-5. Bathymetry for the alignment with the open-water embayment
Source: (USACE-ERDC, 2005a) Definition of simulated events and validation process. The simulated events for both the validation process and storm events used to evaluated the alignment with the open-water embayment were the same as those used for Options 1 and 2 (Section B.1.1). Details of the validation process are presented in USACE-ERDC, 2005a. Definition of Comparison Locations for Validation and Storm Event Periods.
General Reevaluation Report (GRR) and Supplemental Environmental Impact Statement (SEIS)
B-8

1. CP1 – South of Poplar Island 2. CP2 – Southwest Corner of Coaches Island 3. CP3 – Northwest Corner of Poplar Island 4. CP4 – North of Expansion Area 5. CP5 – Area between Expansion Area And Jefferson Island 6. CP6 – Navigation Channel between Expansion Area and Mainland 7. CP7 – Navigation Channel between Mainland and Southeast of Expansion
Area 8. TG1 – Proposed Tidal Gut 9. BW1 – Breakwater Gap Entrance to Embayment Area 10. PP – Personnel Pier Gauge Location
Figure B-6. i ith the open-water embayment DC, 2005a)
Water Level condition were compared towere no significant changes between the existing condition and the alignment with the open-water embaym d or the storm event (USACE-ERDC, 2005a). Current speeds re compared to those for the alignment with the open-water embayment. Four of the ten locations (BW1, TG1, CP3 and CP5) had a
Po nts used for evaluation of the alignment wSource: (USACE-ER
and Current Speed Results. Water levels calculated for the existing those calculated for the alignment with the open-water embayment. There
ent for either the validation perio
calculated for the existing condition we
Poplar Island Environmental Restoration Project September 2005 General Reevaluation Report (GRR) and Supplemental Environmental Impact Statement (SEIS)
B-9

significant change in current speed. At these locations, there was a significant decrease in urrent speeds which can be attributed to the introduction of land in the expansion area, thereby
increasing friction in the shallower water and changing current speed and direction (USACE-ERDC, 2005a). B.2 PARTICLE TRACKING MODEL AND RESIDENCE TIME IN POPLAR
HARBOR, EXPANSION WETLAND CELLS, AND THE OPEN-WATER EMBAYMENT
B.2.1 Particle Tracking Model After the hydrodynamics for all events were simulated for the each option, the Particle Tracking Model (PTM) was run to evaluate residence times in Poplar Harbor, and to qualitatively visualize the flushing process in one of the proposed wetland cells within the northern lateral alignment (USACE-ERDC, 2005a). Point sources were defined in the Surface-water Modeling System (SMS) and were placed in two areas, (a) around Poplar Island and Harbor (Figure B-7), and (b) inside one of the wetland cells in the proposed northern lateral alignment (Figure B-7).
c
igure B-7. PoinF t sources placed around Poplar Island and Harbor area for Option 1, and
uring e PTM for each option and event, point sources of neutrally buoyant articles were created with the same attributes [elevation = 1.0 m above bed, number of parcels =
dius = 1.0 m, particle size = 0.2 mm (not active for neutrally
in the wetland cell in the expansion area for Option 2 Source: (USACE-ERDC, 2005a)
the initial run on thD
p10, parcel mass = 10.0 kg, parcel ra
Poplar Island Environmental Restoration Project September 2005 General Reevaluation Report (GRR) and Supplemental Environmental Impact Statement (SEIS)
B-10

buoyant particles), particle density = 1,035 kg/m3, and source type = instantaneous injection]
re eely than those placed on the east side in the harbor area, which is partially sheltered because of
the curved shape of Poplar Island. A comparison of the location and path of particles after eight days for the validation event for the existing condition and Option 1 (Figure B-8) indicated that the particle paths (denoted by the orange lines) were similar, but that there was a wider dispersement of particles for the existing condition.
(USACE-ERDC, 2005). Particle Tracking Model Results in Poplar Harbor for the Validation Run. After the PTM was run, a film loop was created to view the movement of each parcel placed around Poplar Harbor. For the validation run, clear periodic or cyclical tidal movement was observed for each of the options. Parcels that were placed on the west and south sides of the PIERP moved mofr
Poplar Island Environmental Restoration Project September 2005
Figure B-8. Particle track after eight days for existing condition (left) and Option 1 (right)Source: (USACE-ERDC, 2005a)
General Reevaluation Report (GRR) and Supplemental Environmental Impact Statement (SEIS)
B-11

Particle Tracking Results in an Expansion Wetland Cell for Validation Run. Particle
ovement was also modeled for a proposed wetland cell in the northern lateral expansion ptions 1 and 2 only). For Option 1 (Figure B-9), particles moved out from the wetland cell
and into others, then migrated south until exiting the expansion area and out into open water. During the Option 2 condition (Figure B-9), many particles remained in the wetland cell, with only a small percentage exiting into the tidal gut where they traveled to other wetland cells and out of the northern tidal gut opening and into open water.
m(O
Figure B-9. Particle track after eight days for Option 1 (left) and Option 2 (right)
Source: (USACE-ERDC, 2005a)
Poplar Island Environmental Restoration Project September 2005 General Reevaluation Report (GRR) and Supplemental Environmental Impact Statement (SEIS)
B-12

valuation of Particle Tracking Results in Poplar Harbor for Storm Events. The results of e PTM for the storm event indicated that many particles were swept away from the island area estward where they entered the main channel of the Chesapeake Bay. Most of the remaining articles were trapped in the large wetland cell at the southwest corner of Poplar Island. No iscernable differences in particle paths were observed during the modeled storm event for the xisting condition and Option 1 (Figure B-10) for the particles in Poplar Harbor.
Ethwpde
Figure B-10. Particle track for Existing Condition (left) and Option 1 (right) during storm Source: (USACE-ERDC, 2005a)
Poplar Island Environmental Restoration Project September 2005 General Reevaluation Report (GRR) and Supplemental Environmental Impact Statement (SEIS)
B-13

Evaluation of Particle Tracking Results in the Wetland Cell Area for the Storm. Particle ovement in the wetland cell area is significantly different than particle movement in Poplar arbor. For Option 1, most of the particles remained in the expansion area and moved between etland cells, with only a few moving out through the single tidal gut opening as the storm surge ceded (Figure B-11). For Option 2, as the water level increased with the storm surge, most
articles remained inside the expansion area, with only a few particles exiting through the orthern tidal gut opening (Figure B-11). The particles that exited were swept into the main hannel of Chesapeake Bay.
mHwrepnc
Figure B-11. Particle track for wetland area particles during storm for Option 1 (left) and
Option 2 (right) Source: (USACE-ERDC, 2005a)
B.2.2 Residence Time in Poplar Harbor Residence time is the average length of time that an entity of interest remains within the limits of
ied water area. Return of particles to the area is taken into account – that is, particles might leave the area, then return. Residence tim s for Poplar Harbor were calculated by tracking
times for each particle were sum ce time determined the average sidence time. If particles never exited the erence area, the total simulation time was cluded.
esidence Times in Poplar Island Harbor for Validation and Storm Periods. An updated ersion of the PTM was developed to allow residence time calculations for neutrally buoyant
a specife
the movement of neutrally buoyant particles, which represent water exchange. All residence med, and this total residen
rein
ref
Rv
Poplar Island Environmental Restoration Project September 2005 General Reevaluation Report (GRR) and Supplemental Environmental Impact Statement (SEIS)
B-14

particles. For the residence time calculations, a separate set of point sources was developed for e PTM. These sources were only placed inside Poplar Harbor and were regularly spaced
00 m apart, when possible (Figure B-12). A line of particles was also placed in the channel etween Coaches Island and Poplar Island. Point source attributes for residence calculations levation = 1.0 m above bed, number of parcels = 20, parcel mass = 10.0 kg, parcel radius =
5.0 m, particle size = 0.2 mm (not active for neutrally buoyant particles), particle density = ,035 kg/m3, source type = instantaneous injection] differed slightly from the set used for isualization. The number of parcels for each point source was doubled to 20, and the horizontal arcel radius was increased from 1 m to 25 m. The total number of particles used for this
th1b[e21vpconfiguration was 3,890.
Figure B-12. Residence time calculation area and location of point sources for Poplar Harbor
Source: (USACE-ERDC, 2005a)
Calculated average residence times for Poplar Harbor are shown in Table B-1. Residence times for the low-energy, eight day reference period of the validation event increased 8.3 percent for Option 1, and increased 15 percent for Option 2 from the baseline (existing condition) residence
the south end of the tidal gut intoof flow from the expansion area from the south end of the tidal gut relative to Option 1.
time of 4.07 days. The residence time for Option 1 is lower because of an increased current from the harbor reference area. Option 2 allows two points of egress
and thereby has a reduced current
Poplar Island Environmental Restoration Project September 2005 General Reevaluation Report (GRR) and Supplemental Environmental Impact Statement (SEIS)
B-15

Table B-1. Residence times in Poplar Harbor for each Option and event Source: (USACE-ERDC, 2005a)
Average Residence Time (days)
Validation Storm Existing 4.07 0.69 Option 1 4.41 0.91 Option 2 4.68 0.93
During the higher energy, four day storm period, both options produced an increase in residence time of approximately 33 percent over the existing condition for the storm, with a slightly lower increase for Option 1. The substantially shorter reference time for the storm events is expected as the water level and current increased significantly with the storm surge from Hurricane Isabel. Storms thus greatly shorten residence times and enhance flushing. Figure B-13 shows the approximate location of particles for the existing condition after the same 3-day period of the storm event and validation run, respectively.
Figure B-13. Dispersement of particles after three days of a modeled storm event (left) and after three days of the validation run (right) for the exis n
Source: (USAC DC, 2005a)
ting conditioE-ER
Poplar Island Environmental Restoration Project September 2005 General Reevaluation Report (GRR) and Supplemental Environmental Impact Statement (SEIS)
B-16

B.2.3 Residence Time in the Open-Water Embayment Residence time is the average length of time that an entity of interest remains within the limits of a specified water area. Return of particles to the area is taken into account – that is, particles might leave the area, then return. Residence times were calculated by tracking the movement of neutrally buoyant particles that represent water exchange. Residence times for all particles were summed, and the average residence time was formed. If particles never exited the reference area,
e total simulation time was used in the average. Outputs from the particle tracking model TM) for each condition and event were analyzed for residence times in the embayment area.
An update eutrally buoyant particles within the open pen-water embayment residence time calculations, a separate set of point sourcwere placed inside the calculation ar o apart when possible (Figure B-14). Point source attributes for lculatio of parcels = 20, parcel mass = 10.0 kg, parcel radius = 25.0 m, parti e = 0.2 mm ctive for neutrally buoyant particles), particle density = 1,035 kg/m3 (neutrally buoyant), source type = instantaneous injection] differed slightly fr used f alization.
th(P
d version of the PTM was applied to calculate residence time calculations for n-water embayment. For the o
es was developed for the PTM. These sources ea nly and were regularly spaced 25 m
residence ca ns [numbercle siz (not a
om the set or visu
Figure B-14. Residence time calculation area and location of point sources for the open-water embayment
Source: (USACE-ERDC, 2005a)
Poplar Island Environmental Restoration Project September 2005 General Reevaluation Report (GRR) and Supplemental Environmental Impact Statement (SEIS)
B-17

The existing condition has a small residence time (good flushing) for both the validation and storm conditions because the particles move freely in the current, and their travel is unrestricted. The open-water embayment is surrounded on three sides by land or dikes and thereby shelters the area from waves and currents. This sheltering produces a substantially longer residence time for both the validation and storm condition (Table B-2).
Table B-2. Residence times for the open-water embayment. Source: (USACE-ERDC, 2005a)
Average Residence Time (days)
Validation Storm Existing 0.25 0.18
Open-Water Embayment 3.79 1.10 During the low-energy, 8-day reference period of the validation, the average residence time for the open-water embayment was approximately 15 times longer than for the existing condition. During the higher energy, 4-day storm period, the average residence time for the open-water embayment for the storm decreased by 71 percent, from 3.79 days to 1.1 days. Figure B-15 shows the path of particles and their ending for both the storm and validation periods for locationthe open-water embayment.
Poplar Island Environmental Restoration Project September 2005
Figure B-15. Path of particles for the open-water embayment after a modeled storm event
(left) and after the validation period (right). Source: (USACE-ERDC, 2005a)
General Reevaluation Report (GRR) and Supplemental Environmental Impact Statement (SEIS)
B-18

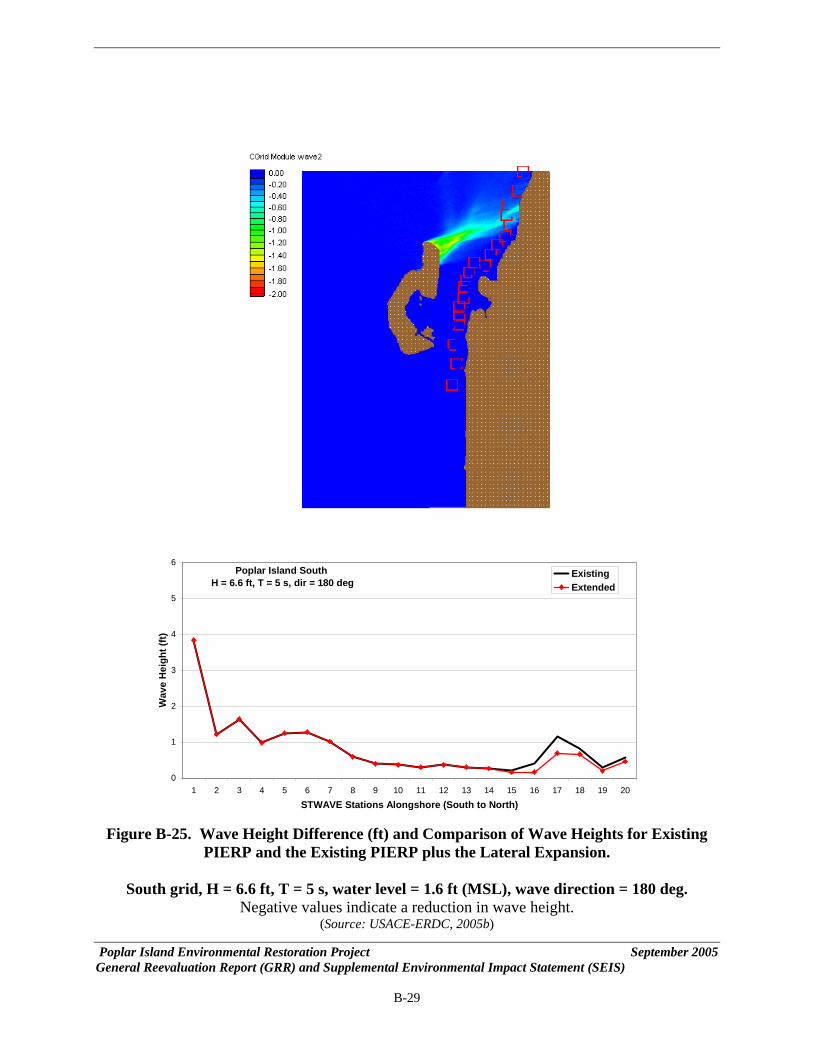
B.3 IMPACTS TO SHORELINE WAVE HEIGHTS Potential shoreline impacts from the 575-acre northern lateral alignment were evaluated by modeling the relative difference in wave height at the shoreline between the existing PIERP and the existing PIERP with the lateral expansion using the STWAVE model (Smith, Sherlock, and Resio, 2001). Details of the STWAVE model, model inputs, and sample model results can be found in Shoreline Impact Study for Poplar Island Expansion. Memorandum for the Record (USACE-ERDC, 2005b). Summary plots for each of the modeled scenarios (where negative values indicate a reduction in wave height) and comparison plots of the wave height for the existing and proposed project for 20 points along the shoreline are included in Figures B-16 through B-28. Negative values indicate a reduction in wave height, blue indicates no difference, and reds the maximum difference. Note that the scales vary from figure to figure. Preliminary results of the model indicated that in each case, the maximum difference in wave height for each case is directly in the lee of the lateral expansion, and no increases in wave height along the shoreline were predicted from the lateral expansion, as compared to the conditions from the existing PIERP. The maximum reductions in wave height from the lateral expansion are predicted to be 3-4 ft directly in the lee of lateral expansion. Close to the shore (depth of 9 ft), the maximum reductions in wave height are 1-1.5 ft. The sheltering effect of the northern lateral expansion was stronger for waves from the north and west, and weaker for waves from the south. Wave height did not increase along the shoreline as a result of the lateral expansion for any cases simulated.
Poplar Island Environmental Restoration Project September 2005 General Reevaluation Report (GRR) and Supplemental Environmental Impact Statement (SEIS)
B-19

Poplar Island West H = 3.3 ft, T = 4 s, dir = 270 deg
0
1
2
3
Wav
e H
eigh
t (ft)
Poplar Island Environmental Restoration Project September 2005
4
5
6
1 2 3 4 5 6 7 8 9 10 11 12 13 14 15 16 17 18 19 20
STWAVE Stations Alongshore (South to North)
ExistingExtended
Figure B-16. Wave Height Difference (ft) and Comparison of Wave Heights for Existing PIERP and the Existing PIERP plus the Lateral Expansion.
West grid, H = 3.3 ft, T = 4 s, water level = 1.3 ft (MSL), wave direction = 270 deg.
Negative values indicate a reduction in wave height (Source: USACE-ERDC, 2005b)
General Reevaluation Report (GRR) and Supplemental Environmental Impact Statement (SEIS)
B-20

Poplar Island West6
H = 1.6 ft, T = 3 s, dir = 270 deg
0
1
2
3
4
5
1 2 3 4 5 6 7 8 9 10 11 12 13 14 15 16 17 18 19 20
STWAVE Stations Alongshore (South to North)
Wav
e H
eigh
t (ft)
ExistingExtended
Figure B-17. Wave Height Difference (ft) and Comparison of Wave Heights for Existing PIERP and the Existing PIERP plus the Lateral Expansion.
West grid, H = 1.6 ft, T = 3 s, water level = 0.0 ft (MSL), wave direction = 270 deg. Negative values indicate a reduction in wave height
(Source: USACE-ERDC, 2005b)
Poplar Island Environmental Restoration Project September 2005 General Reevaluation Report (GRR) and Supplemental Environmental Impact Statement (SEIS)
B-21

Poplar Island North H = 3.3 ft, T = 5 s, dir = 10 deg
0
1
2
3
4
5
6
1 2 3 4 5 6 7 8 9 10 11 12 13 14 15 16 17 18 19 20
STWAVE Stations Alongshore (South to North)
Wav
e H
eigh
t (ft)
ExistingExtended
Figure B-18. Wave Height Difference (ft) and Comparison of Wave Heights for Existing PIERP and the Existing PIERP plus the Lateral Expansion.
North grid, H = 3.3 ft, T = 5 s, water level = 1.3 ft (MSL), wave direction = 10 deg. Negative values indicate a reduction in wave height
(Source: USACE-ERDC, 2005b)
Poplar Island Environmental Restoration Project September 2005 General Reevaluation Report (GRR) and Supplemental Environmental Impact Statement (SEIS)
B-22

Poplar Island North H = 6.6 ft, T = 5 s, dir = 10 deg
0
1
2
3
4
5
6
1 2 3 4 5 6 7 8 9 10 11 12 13 14 15 16 17 18 19 20
STWAVE Stations Alongshore (South to North)
Wav
e H
eigh
t (ft)
ExistingExtended
Figure B-19. Wave Height Difference (ft) and Comparison of Wave Heights for Existing PIERP and the Existing PIERP plus the Lateral Expansion.
North grid, H = 6.6 ft, T = 5 s, water level = 1.6 ft (MSL), wave direction = 10 deg. N t egative values indicate a reduction in ave heighw
(Source: USACE-ERDC, 2005b) Poplar Island Environmental Restoration Project September 2005 General Reevaluation Report (GRR) and Supplemental Environmental Impact Statement (SEIS)
B-23

Poplar Island North H = 9.8 ft, T = 6 s, dir = 10 deg
0
1
2
3
4
5
6
1 2 3 4 5 6 7 8 9 10 11 12 13 14 15 16 17 18 19 20
STWAVE Stations Alongshore (South to North)
Wav
e H
eigh
t (ft)
ExistingExtended
Figure B-20.
North grid, H = ction = 10 deg. Negative va ave height.
(Source: USACE-ERDC, 2005b)
Wave Height Difference (ft) and Comparison of Wave Heights for Existing PIERP and the Existing PIERP plus the Lateral Expansion.
9.8 ft, T = 6 s, water level = 1.6 ft (MSL), wave direlues indicate a reduction in w
Poplar Island Environmental Restoration Project September 2005 General Reevaluation Report (GRR) and Supplemental Environmental Impact Statement (SEIS)
B-24

Poplar Island North H = 1.6 ft, T = 3 s, dir = 10 deg
0
1
2
3
4
5
6
1 2 3 4 5 6 7 8 9 10 11 12 13 14 15 16 17 18 19 20
STWAVE Stations Alongshore (South to North)
Wav
e H
eigh
t (ft)
ExistingExtended
Figure B-21. Wave Height Difference (ft) and Comparison of Wave Heights for Existing PIERP and the Existing PIERP plus the Lateral Expansion.
North grid, H = 1.6 ft, T = 3 s, water level = 0.0 ft (MSL), wave direction = 10 deg.
Negative values indicate a reduction in wave height. (Source: USACE-ERDC, 2005b)
Poplar Island Environmental Restoration Project September 2005 General Reevaluation Report (GRR) and Supplemental Environmental Impact Statement (SEIS)
B-25

Poplar Island North H = 3.3 ft, T = 4 s, dir = 340 deg
0
1
2
3
4
5
6
1 2 3 4 5 6 7 8 9 10 11 12 13 14 15 16 17 18 19 20
STWAVE Stations Alongshore (South to North)
Wav
e H
eigh
t (ft)
ExistingExtended
Figure B-22. Wave Height Difference (ft) and Comparison of Wave Heights for Existing
North grid, H = 3.3 ft, T = 4 s, w
PIERP and the Existing PIERP plus the Lateral Expansion.
ater level = 1.6 ft (MSL), wave direction = 340 deg.Negative values indicate a reduction in wave height.
(Source: USACE-ERDC, 2005b)
Poplar Island Environmental Restoration Project September 2005 General Reevaluation Report (GRR) and Supplemental Environmental Impact Statement (SEIS)
B-26

Poplar Island North H = 1.6 ft, T = 3 s, dir = 340 deg
0
1
2
3
4
5
6
1 2 3 4 5 6 7 8 9 10 11 12 13 14 15 16 17 18 19 20
STWAVE Stations Alongshore (South to North)
Wav
e H
eigh
t (ft)
ExistingExtended
Figure B-23. Wave Height Difference (ft) and Comparison of Wave Heights for Existing PIERP and the Existing PIERP plus the Lateral Expansion.
North grid, H = 1.6 ft, T = 3 s, water level = 0.0 ft (MSL), wave direction = 340 deg.
Negative values indicate a reduction in wave height. (Source: USACE-ERDC, 2005b)
Poplar Island Environmental Restoration Project September 2005 General Reevaluation Report (GRR) and Supplemental Environmental Impact Statement (SEIS)
B-27

Poplar Island South H = 3.3 ft, T = 5 s, dir = 180 deg
0
1
2
3
4
5
6
1 2 3 4 5 6 7 8 9 10 11 12 13 14 15 16 17 18 19 20
STWAVE Stations Alongshore (South to North)
Wav
e H
eigh
t (ft)
ExistingExtended
Figure B-24. Wave Height Difference (ft) and Comparison of Wave Heights for Existing PIERP and the Existing PIERP plus the Lateral Expansion.
South grid, H = 3 ction = 180 deg. .3 ft, T = 5 s, water level = 1.3 ft (MSL), wave dire
Negative val ave height. ues indicate a reduction in w(Source: USACE-ERDC, 2005b)
Poplar Island Environmental Restoration Project September 2005 General Reevaluation Report (GRR) and Supplemental Environmental Impact Statement (SEIS)
B-28
Poplar Island South H = 6.6 ft, T = 5 s, dir = 180 deg
0
1
2
3
4
5
6
1 2 3 4 5 6 7 8 9 10 11 12 13 14 15 16 17 18 19 20
STWAVE Stations Alongshore (South to North)
Wav
e H
eigh
t (ft)
ExistingExtended
Figure B-25. Wave Height Difference (ft) and Comparison of Wave Heights for Existing
PIERP and the Existing PIERP plus the Lateral Expansion.
South grid, H = 6.6 ft, T = 5 s, water level = 1.6 ft (MSL), wave direction = 180 deg. Negative values indicate a reduction in wave height.
(Source: USACE-ERDC, 2005b)
Poplar Island Environmental Restoration Project September 2005 General Reevaluation Report (GRR) and Supplemental Environmental Impact Statement (SEIS)
B-29

Poplar Island South H = 11.5 ft, T = 6 s, dir = 180 deg
0
1
2
3
4
5
6
1 2 3 4 5 6 7 8 9 10 11 12 13 14 15 16 17 18 19 20
STWAVE Stations Alongshore (South to North)
Wav
e H
eigh
t (ft)
ExistingExtended
Figure B-26. Wave Height Difference (ft) and Comparison of Wave Heights for Existing PIERP and the Existing PIERP plus the Lateral Expansion.
South grid, H = 11.5 ft, T = 6 s, water level = 3.3 ft (MSL), wave direction = 180 deg.
Negative values indicate a reduction in wave height. (Source: USACE-ERDC, 2005b)
Poplar Island Environmental Restoration Project September 2005 General Reevaluation Report (GRR) and Supplemental Environmental Impact Statement (SEIS)
B-30

Poplar Island South H = 16.4 ft, T = 8 s, dir = 180 deg
0
1
2
3
4
5
6
1 2 3 4 5 6 7 8 9 10 11 12 13 14 15 16 17 18 19 20
STWAVE Stations Alongshore (South to North)
Wav
e H
eigh
t (ft)
ExistingExtended
Poplar Island Environmental Restoration Project September 2005
Figure B-27. Wave Height Difference (ft) and Comparison of Wave Heights for Existing
PIERP and the Existing PIERP plus the Lateral Expansion.
South grid, H = 1 ection = 180 deg. 6.4 ft, T = 8 s, water level = 6.6 ft (MSL), wave dirNegative val ave height. ues indicate a reduction in w
(Source: USACE-ERDC, 2005b)
General Reevaluation Report (GRR) and Supplemental Environmental Impact Statement (SEIS)
B-31

Poplar Island South H = 1.6 ft, T = 3 s, dir = 180 deg
0
1
2
3
4
5
6
1 2 3 4 5 6 7 8 9 10 11 12 13 14 15 16 17 18 19 20
STWAVE Stations Alongshore (South to North)
Wav
e H
eigh
t (ft)
ExistingExtended
Figure B-28. Wave Height Difference (ft) and Comparison of Wave Heights for Existing PIERP and the Existing PIERP plus the Lateral Expansion.
South grid, H = 1.6 ft, T = 3 s, water level = 0.0 ft (MSL), wave direction = 180 deg.
Negative values indicate a reduction in w ve height. a(Source: USACE-ERDC, 2005b)
Poplar Island Environmental Restoration Project September 2005 General Reevaluation Report (GRR) and Supplemental Environmental Impact Statement (SEIS)
B-32

B.4 LIFE CYCLE ANALYSIS FOR THE DIKE DESIGN The life-cycle analysis for the PIERP dike design was conducted by the U.S. Army Engineer Research and Development Center (USACE-ERDC), Coastal and Hydraulics Laboratory (CHL), for the USACE-Baltimore District. The report Life Cycle Analysis of Mid Bay and Poplar Island Projects, Chesapeake Bay, Maryland (USACE-ERDC, 2005c) is summarized in the following sections. The PIERP is an enhanced habitat with stone revetment around much of its perimeter, about 2.5 miles long and 0.5 miles wide. The PIERP is exposed to waves from all directions, with fetch distances ranging from less than one mile to twenty miles and more, depending on exposure direction. The PIERP is also subject to tides and storm surges, with a mean tide range of 1.2 feet. Extreme storm surges can reach much higher than the range of even extreme high astronomical tides, adding as much as six feet to the astronomical tide level. The occurrence of extreme conditions at Chesapeake Bay island sites involves an interplay between high winds, elevated water levels, high waves, and shallow water depths. Revetment damage is typically caused by energetic waves directly moving stone on the slope or by high water levels allowing high or moderately high waves to overtop the structure and collapse the crest by undermining the landward side. Extreme water levels do not necessarily coincide with extreme wave heights attacking the various reaches of the island perimeter. Optimized design of the PIERP revetments to withstand typical storm event conditions is necessary to prevent structural damage and failure. Recent advances in numerical modeling technology have provided tools for significantly improved accuracy of wave and water level estimates for storm events. With present technology, the time variation of winds, waves, and water levels during historical storms can be hindcast based on available historical information. The approach consisted of the following components:
a. Identify historical tropical and extratropical storms needed to develop design conditions at Chesapeake Bay project sites.
b. Acquire wind fields for historical storms identified in a, to be used for water level modeling. Open-ocean winds for most storms were available from previous studies.
c. Adjust wind fields over Chesapeake Bay waters as needed to represent winds over the bay suitable for water level modeling.
-Baltimore Dist
d. Analyze existing historical data from regional anemometers to develop local winds over Chesapeake Bay fetches for wave analysis.
e. Compute historical storm water levels using the existing ADCIRC numerical model, updating the re ed for other USACEgional bathymetry and shoreline grid already develop
rict studies a eague Island.t Ocean City Inlet and Assat
Poplar Island Environmental Restoration Project September 2005 General Reevaluation Report (GRR) and Supplemental Environmental Impact Statement (SEIS)
B-33

f. Hindcast historical storm waves using model winds along with measured winds from several area anemometers. Compute historical offshore waves using relationships for wind-wave growth over irregular, restricted fetches.
g. Transform waves through shallow nearshore waters to shore using a spectral wave transformation model (STWAVE).
h. Compute responses for these historical events, such as runup, overtopping as a function of crest height, structure damage as a function of stone size, and required toe stone weight. Use techniques based on recommendations given in the Coastal Engineering Model (CEM).
i. Recreate multiple life cycles of storms and project responses using the Empirical Simulation Technique (EST). Each life cycle represents a possible future condition, which is statistically consistent with historical storm forcing, response, and sequencing information. The EST simulation includes progressive revetment damage due to successive storms that may occur between maintenance opportunities. Realistic maintenance cycles are incorporated into the simulation. j. Compute life-cycle damage and function for selected designs that appear to be favorable.
A total of 95 historical tropical and extratropical stroms were chosen to report predicted water levels under various storm conditions at the PIERP (USACE-ERDC, 2005c). Fifty-two hurricanes were selected from the North Atlantic Hurricane Track Database (1851-2003) for simulation based upon the following criteria: storms with maximum wind speeds greater than 50 knots in the area between 75 and 79 deg W longitude and 36 and 39 deg N latitude. Forty-three northeasters (1954-2003) were identified in the Atmospheric Environmental Service of Canada (AES-40) wind fields (Swail et al., 2000) and in the reanalysis project database (Kalnay et al., 1996) by the U.S. National Centers for Environmental Prediction (NCEP) and the National Center for Atmospheric Research (NCAR). Storms were selected based upon the criteria of peak wind speeds greater than 20 m/sec (66 ft/s) or 10 m/sec (33 ft/s) with durations exceeding three days at the ocean entrance of the Chesapeake Bay. Water Level Data. NOAA historical water level data (1996-2003) for Chesapeake Bay was extracted to examine seasonal and daily water level variations, excluding daily tides. These variations were applied to the model results to account for the monthly mean variation of the water level. O g adjacent land area, the wind fields needed to Num as applied the Chesapeake le ADCIRC grid with a rudimentary representation of Chesapeake Bay was developed through previous Coastal Inlets
ver-Land Wind Adjustment. AES-40, NCEP/NCAR and PBL model wind fields areenerally accurate for the open coast and ocean applications. In the Chesapeake Bay and
be adjusted for over-bay and over-land effects.
erical Grid Develo uttich et al., 1992) wpment. The hydrodynamic model ADCIRC (LeBay area f gional scaor each historical area. A re
Poplar Island Environmental Restoration Project September 2005 General Reevaluation Report (GRR) and Supplemental Environmental Impact Statement (SEIS)
B-34

Research Program (CIRP) and Offshore and Coastal Technologies, Inc. (OCTI) studies and fined in Chesapeake Bay and far-field areas for the present study (Figure B-29) using National
M database GTOPO30 -- 30-sec arc resolution. The grid was constructed with a inimum resolution of 50 m (164 ft) and a maximum cell size of 500 m (1640 ft) in the open
reOcean Service (NOS) Digital Navigation Charts (DNC). Further grid development included the incorporation of overbank areas into the Chesapeake Bay tributaries to accurately predict storm surge in these relatively narrow branches of the bay (Figure B-30). The ADCIRC grid was extended to include low land topography data to +10 m (33 ft), mean tide level, from USGS Digital EEmocean.
Figure B-29. Portion revised ADCIRC grid resolution and shoreline
Source: (USACE-ERDC, 2005c)
Poplar Island Environmental Restoration Project September 2005 General Reevaluation Report (GRR) and Supplemental Environmental Impact Statement (SEIS)
B-35
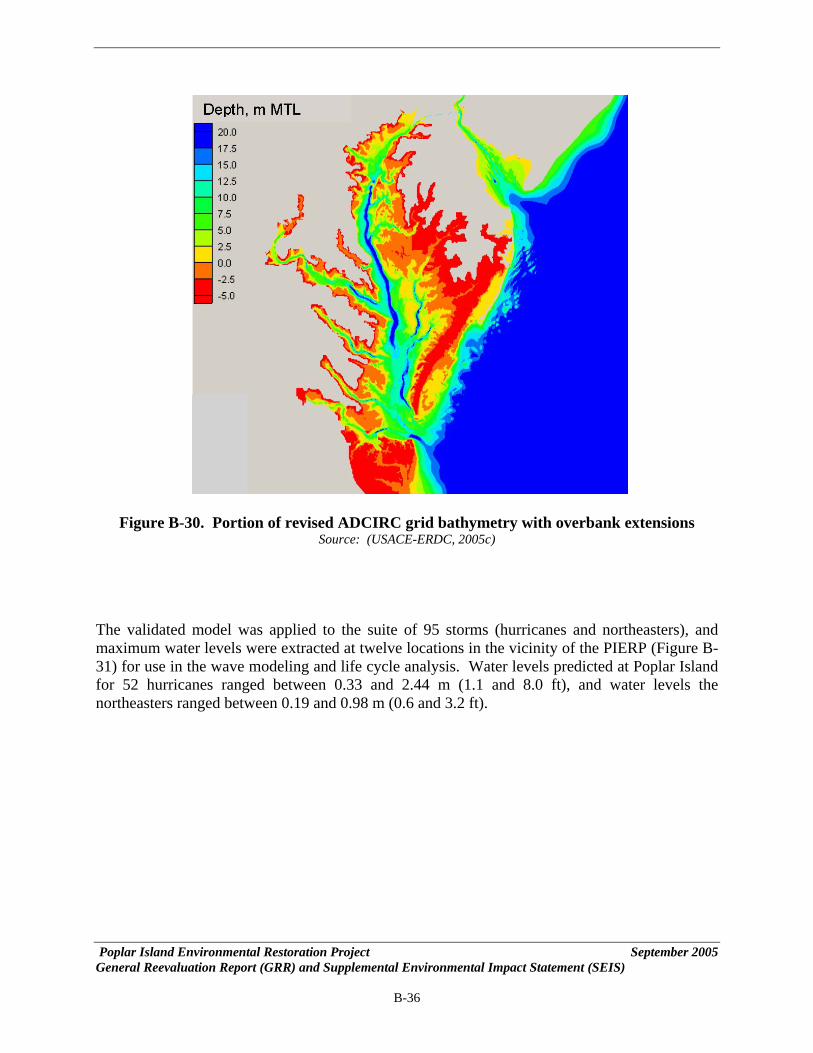
Figure B-30. Portion of revised ADCIRC grid bathymetry with overbank extensions Source: (USACE-ERDC, 2005c)
The validated model was applied to the suite of 95 storms (hurricanes and northeasters), and maximum water levels were extracted at twelve locations in the vicinity of the PIERP (Figure B-31) for use in the wave modeling and life cycle analysis. Water levels predicted at Poplar Island for 52 hurricanes ranged between 0.33 and 2.44 m (1.1 and 8.0 ft), and water levels the ortheasters ranged between 0.19 and 0.98 m (0.6 ann d 3.2 ft).
Poplar Island Environmental Restoration Project September 2005 General Reevaluation Report (GRR) and Supplemental Environmental Impact Statement (SEIS)
B-36

Figure B-31. Twelve Poplar Island locations for saving simulated water levels Source: (USACE-ERDC, 2005c)
B.4.1 Wave Modeling Life-cycle analysis for the PIERP required wave parameters around each island for a variety of storm conditions. Winds were carefully validated and, in the case of the AES-40 hindcast winds, adjusted to compensate for reduced over-water drag. Three steps were required for wave modeling to produce the life cycle inputs, including a restricted-fetch wave growth model (Smith, 1991) in the Automated Coastal Engineering System (ACES), application of a
ral shape in the Surface Water Modeling system (SMS), and the spectral odel STWAVE (Smith et al., 2001). Additional details of the wave modeling
transformat VE model indicated that longer period wave the bottom, resulting in greater
fraction (turning of the wave directions) and shoaling (increases in wave height in shallow epths) as compared to shorter period waves. This refraction indicated that there was more rning of the wave direction toward the PIERP for longer period waves.
he time period covered by tropical storms is 148 years (1856-2003), while the time period overed by northeasters is only 50 years (1954-2003). Northeasters are more common than
tropical storms and are less likely than tropical storms to be atypically severe. To populate the early tropical storm years with northeasters, the northeasters were folded back. Thus, a 148-year offshore time history of historical storm waves and water levels was created. For Poplar Island, sixteen points (Stations 1-16) were selected adjacent to shore for design analysis (Figure B-32). Another 16 points (Stations 17-32) were selected further offshore from
parametric spectansformation mtr
ions can be found in USACE-ERDC (2005c). Results of the STWAs interact more strongly with
redtu Tc
Poplar Island Environmental Restoration Project September 2005 General Reevaluation Report (GRR) and Supplemental Environmental Impact Statement (SEIS)
B-37

each of the points shown, approximately 300 m from shore (not shown). Finally, seven points (Stations 33-39) were selected adjacent to shore for the proposed northern lateral expansion (Figure B-32).
Figure B-32. Locations at the PIERP used for model result comparisons
portion of the NED alternative. ypically, the NED plan is the least expensive alternative over the project economic lifetime, cluding first cost and maintenance costs as well as extraneous benefits and costs. Therefore, the
basic objective of the optimization scheme described herein is to minimize total amortized costs including maintenance and first costs with the constraint that breach failures over the economic life are to be avoided. The constraint of avoiding breaches is required to avoid the large environmental costs (such as loss of sediment contained within the island) associated with a breach-type failure. A typical multi-layer rubble mound revetment (Figure B-33) was assumed for the lateral expansion.
Source: (USACE-ERDC, 2005c) B.4.2 Structural Optimization In this study, it is anticipated that the least cost dike structure cross section that prevents breaching during the economic life will provide the structureTin
Poplar Island Environmental Restoration Project September 2005 General Reevaluation Report (GRR) and Supplemental Environmental Impact Statement (SEIS)
B-38

Figure B-33. General Revetment Cross Section Variables that are most influential in the optimization are the crest height, armor stone size and structure slope. Damage occurs primarily as a result of waves attacking and displacing armor stones and as a result of wave overtopping producing scour of the crest. Damage to the armor layer will progress in a predictable and continuo s manner until the filter layers are exposed. At that po tively assume ching
uring one 3-hr increment. Damage to the cres rtopping is similar in that damage rogresses slowly unless the overtopping exceeds a certain magnitude. At that point, the damage
o a breached condition. Therefore, it was assumed that, for an narmored crest, the structure progresses from minor damage to breach within one time step of
uint, the deterioration will accelerate until the structure is breached. It was conservad that the damage progress re of the filter layers to breaes very rapidly from exposu
t because of ovedpprogresses very rapidly tu3-hrs if the overtopping rate exceeds this value. B.4.3 Results and Recommendations of the Life Cycle Analysis for the Northern Lateral Alignment Waves and Water Levels. Stations with an open exposure toward the south experience the highest waves. These are also the stations most dominated by hurricanes. North- and east-facing stations along the north end of Poplar Island are less dominated by hurricanes. Return period significant wave height (H
s) at stations 33 through 39 follow a smooth variation around the
proposed expansion for return periods up to about 40 - 50 years. For longer return periods, the impact of hurricanes causes a noticeable increase in significant wave height at stations 33, 34, and 39 relative to the other stations. Structural Analysis. The structural analysis of poplar island is composed of two primary parts: 1) preliminary analysis using only the historical waves and water levels and 2) final design using the simulated waves and water levels. The preliminary structural optimization for Poplar Island for the historical wave climate is separated into two parts: optimization for least cost and optimization for fewest repairs. Upland Cell Stability. The upland cell analysis consisted of analyzing the compound slope runup for the upland cells corresponding to stations 37 and 38 (Figure B-32). These stations Poplar Island Environmental Restoration Project September 2005 General Reevaluation Report (GRR) and Supplemental Environmental Impact Statement (SEIS)
B-39

show no overtopping breaches for return periods greater than five years, regardless of crest height. The stations also show no runup on the upland cells for the higher return periods. As such, there is no need to armor the upland cell slopes as long as the crest height of the lower structure is maintained at a reasonably high level of greater than 2.29 m (7.5 ft) MLLW. Conclusions and Recommendations. From the results of the preliminary and ELS investigations summarized above a few conclusions can be made:
1. The least cost solution that provides a reasonable level of protection for the reach represented by stations 33 – 34 (from the southwest start of expansion to northwest entrance) is the 40–yr return period design with an armored crest. This design can be expected to have a 5 percent chance of exceeding two repairs and a 2 percent chance of exceeding three repairs during the 50-yr life cycle. There is little apparent increase in cross sectional cost in going to larger stone, given that stone unit costs and equipment costs do not increase with increasing stone size. However, this is likely not the case. As such, the recommended design for the western side of the expansion is based on station 34 with the 40-yr return period cross section, armored crest at 2.9 m (9.5 ft) and primary slope of 1V:3H.
2. Based on the preliminary design, the northern reach represented by stations 35 – 36 is
between the sheltered eastern side and the exposed western side. The required stone sizes are between the two. The water level exposure is low, similar to the eastern side. So the recommended design for this reach is based on station 36 with the 40-yr return period cross section, armored crest at 2.9 m (9.5 ft) and primary slope of 1V:3H.
3. The least cost solution that provides a reasonable level of protection for the reach
represented by stations 37 – 38 is based on the station 37 cross section. The least cost alt he least cost crest height is the lowe
at provides a reasonable level of protection for the reach
ernative corresponds to the 10-yr return period design with an armored crest. Tst at 2.29 m (7.5 ft)
4. The least cost solution threpresented by station 39 corresponds to the 50-yr return period design with an armored crest at 3.2 m (10.5 ft).
So it is recommended that three different cross sections be used for the proposed northern lateral expansion. Each of the following designs have a primary armor seaside slope of 1V:3H and a toe seaside slope of 1V:2H. The final design return period was 40 years for all stations except 39, which was 50 years. The final recommended sections are as follows:
Western Reach (stations 33 – 34) Armor stone weight: 1.04 tonne (2300 lb) Primary underlayer stone weight: 0.10 tonne (230 lb) Crest: h
c = 2.9 m (9.5 ft) armored
Toe stone weight: 0.54 tonne (1200 lb) Toe underlayer weight: 0.054 tonne (120 lb)
Poplar Island Environmental Restoration Project September 2005 General Reevaluation Report (GRR) and Supplemental Environmental Impact Statement (SEIS)
B-40

Northern and Southeastern Reaches (stations 35, 36, 39) Armor stone weight: 0.29 tonne (650 lb) Primary underlayer stone weight: 0.03 tonne (65 lb) Crest: h
c = 2.9 m (9.5 ft) armored
Toe stone weight: 0.15 tonne (330 lb) Toe underlayer weight: 0.015 tonne (33 lb)
Eastern Reach (stations 37 – 38) Armor stone weight: 0.15 tonne (330 lb) Primary underlayer stone weight: 0.015 tonne (33 lb) Crest: h
c = 2.9 m (9.5 ft) armored
Toe stone weight: Toe underlayer weight: 0.005 tonne (12 lb)
nsion. The open-water embayment alignment roposed for the northern lateral alignment of the PIERP (Figure B-34) would provide semi-
between the wetland cells and the open-water embayment within the lateral xpansion. The bottom habitat of the open-water embayment would remain essentially
initial optimization of the segmented offshore breakwater d revetment using only historical wave conditions.
0.054 tonne (120 lb)
B.4.4 Open-Water Embayment (Offshore Breakwater Alternative) National Marine Fisheries Service (NMFS) proposed a variation for the northern lateral alignment that included an open-water embayment. In the NMFS proposal, the footprint of the northern lateral alignment was the same as those proposed by USACE, but approximately 130 acres of wetland located on the western side of the lateral expansion was designated as an open-water embayment protected by segmented breakwaters and bordered by salt marsh and mudflats. USACE-Baltimore District modified the initial open-water embayment proposed by NMFS to enhance the hydraulic characteristics of the proposal and minimize the impact on the dredged material placement capacity of the lateral expapprotected fisheries habitat adjacent to wetland and upland cells, and would increase the trophic interaction eundisturbed, preserving the existing bathymetry and benthic habitat. In addition, the construction of small rock reefs within the open-water embayment would provide cover and enhance fish habitat. Included in the proposal is a shoreline revetment that runs generally north-south in the middle of the lateral expansion. The analysis summarized in the following sections (USACE-ERDC, 2005c) was conducted to provide an an
Poplar Island Environmental Restoration Project September 2005 General Reevaluation Report (GRR) and Supplemental Environmental Impact Statement (SEIS)
B-41

Figu
Offsho e breakwaters would be configured as in Figure B-35, with a structure crest that was three stones wide. The sectiosectionit was through
re B-34. Alignment for the Open-Water Embayment with Offshore Breakwaters
re Breakwater Design. For this effort, it was assumed that the offshor
n included a traditional section with two-stones thick armor and filter layers. For the final , filter material may replace the core so there are only two stone classes. For all analyses, assumed that the structure was placed on a geotextile to prevent fines from leaching up the structure.
Offshore Breakwater Structures
The storical record occurred during Hurricane Hazel. The max (7.47ft) ML l dictates the minimum height of the crest for
Figure B-35. Typical Section for
maximum surge levels in the hiimum surge along this reach of Poplar Island was 2.048 m (6.72 ft) MSL or 2.278 mLW (USACE-ERDC, 2005c). This water leve
Poplar Island Environmental Restoration Project September 2005 General Reevaluation Report (GRR) and Supplemental Environmental Impact Statement (SEIS)
B-42

the shoreline revetment because the structure would likely be undermined if flooding because of stor ld likely be significant damage to the However, no such restriction has been placed on the stigation, an optimum combination of crest height for the offshore structures and armor size for the shoreline revetment is sought that wil ty of the embayment.
e one with the smallest cross-section and lope alternatives with seaward and leeward side slopes of
1V C, 2005c). Of these, the lowest crest is the least exp of 1.83 m (6-ft) MLLW, the largest stone with a return period of 100 years is the leas inor damage repair and years. Although the larger stone is least expensive, it h nit cost as the smaller stone, which may not be
e is selected for design. For the next higher crest turn period and there is
s (USACE-ERDC, 2005c). Because some secondary costs of repair are
Offshore Breakwaters and Revetment. he recommended stone weights and layer thicknesses for both the offshore breakwater and the vetment section are as follows:
Offshore breakwater design at x = 457 m (1,500 ft)
m surge overtopped the structure. In addition, there wou ecosystem if significant flooding occurred. crest height for the offshore breakwaters. In this inve
l minimize costs and maintain functionali
Initithe
al results indicate that the least-cost alternative is thlargest armor stone. The steep s
:1.5H are the least expensive (USACE-ERDensive. For the least-cost alternative with crest height
t expensive. There is one m no breaches for return periods of 35-100 as been assumed that this stone is the same ucase. So, the lower return period of 45 yearsth
height of 2.13 m (7-ft) MLLW, the least cost alternative is the 40 year reo repair for 40 year or greater return periods. n
Revetment analysis. The shoreline revetment analysis was conducted using similar methods to those that described used for the perimeter dike. The representative cross section is shown in Figure B-35. An unarmored crest with crest width of 7.62 m (25-ft) is assumed. For design of the revetment, the transmitted wave height past the offshore breakwater was determined. The wave transmission will occur because of wave overtopping, wave diffraction through the gaps, and wave transmission by porous flow through the structures. For this preliminary analysis, it was assumed that wave transmission as a result of porous flow was negligible. Wave transmission from overtopping depends on offshore structure crest height and incident wave height, wave length, and water level. Wave transmission from diffraction depends on gap width and wave period. The overtopping transmission was assumed to be constant along the length of the revetment while that due to diffraction will vary with location. The analyses indicated that the minimum cost for revetment landward of the 200-ft gap occurs or larger return periodf
unknown and because repairs are generally not desirable, it is expected that even larger return periods will be more economical. Therefore, a return period of 45 years was selected for the preliminary design. Recommendations for the Open-Water Embayment Tre
Crest Height: 1.83 m (6 ft) Armor Weight: 1,697 N (384 lb) Armor Thickness: 0.80 m (2.64 ft) Filter Layer Weight: 167 N (38 lb)
Poplar Island Environmental Restoration Project September 2005 General Reevaluation Report (GRR) and Supplemental Environmental Impact Statement (SEIS)
B-43
Filter Layer Thickness: 0.38 m (1.22 ft) Toe Armor Weight: 1,942 N (440 lb)
Revetment design
Crest Height: 2.13 m (7 ft) Armor Weight: 1,697 N (384 lb) Armor Thickness: 0.80 m (2.64 ft) Filter Layer Weight: 167 N (38 lb) Filter Layer Thickness: 0.38 m (1.22 ft) Toe Armor Weight: 1,942 N (440 lb)
B.5 HYDRODYNAMICS AND SEDIMENTATION MODELING Hydrodynamic and sedimentation modeling of the existing PIERP was conducted as part of the reconnaissance study by Moffatt & Nichol Engineers (M&N, 2003). Results of that report are described in the following sections. The Upper Chesapeake Bay Finite Element Model (UCB-FEM) (as developed by Moffatt & Nichol Engineers) was used to characterize the existing hydrodynamic and sedimentation
rns in the vicinity of the existing PIERP. The UCB-FEM was developed based on the S
col d d accretion were likely to occur.
ED-2D can be applied to sediment where flow velocities can be considered two-dimensional in the horizontal plane (i.e., the speed and direction can be satisfactorily represented as a depth-averaged velocity), and is useful for both deposition and erosion studies. The program treats two categories of sediment: 1) noncohesive, which is referred to as sand herein; and 2) cohesive, which is referred to as clay. Both sand and clay may be analyzed, but the model considers a single, effective grain size during each simulation. Therefore, a separate model run is required for each effective grain size. Input parameters for the sedimentation model include: settling velocity, water surface elevations, x-velocity, y-velocity, diffusion coefficients bed density, ritical shear stresses for erosion, erosion rate constants, and critical shear stress for deposition.
The non-cohesive sediment model was run using 0.1mm (.004 inch) sediment under no-wind onditions. Analysis of results shows negligible sand transport due solely to tidal currents.
patteU ACE finite element hydrodynamics (RMA-2) and sedimentation (SED-2D) models,
lectively known as TABS-2 (Thomas and McAnally, 1985). The UCB-FEM model evaluateand predicted areas where erosion an Correlation of the hydrodynamic model calibration results relative to NOAA predicted data for tidal elevations and current velocities is generally better than 90 percent. Predicted percent error is typically less than 10 percent for tidal elevations and less than 15 percent for current velocity. These values indicate that the hydrodynamic model is calibrated to acceptable accuracy and performs within allowable error ranges to provide an acceptable representation of hydrodynamic conditions. S
c
cModeled non-cohesive sediment transport for existing conditions is negligible for 4- and 13-mph winds for all directions. Sixteen-mph winds, when taken cumulatively with lower wind speeds, account for nearly 90 percent of the yearly wind occurrences and cause significant sediment
Poplar Island Environmental Restoration Project September 2005 General Reevaluation Report (GRR) and Supplemental Environmental Impact Statement (SEIS)
B-44
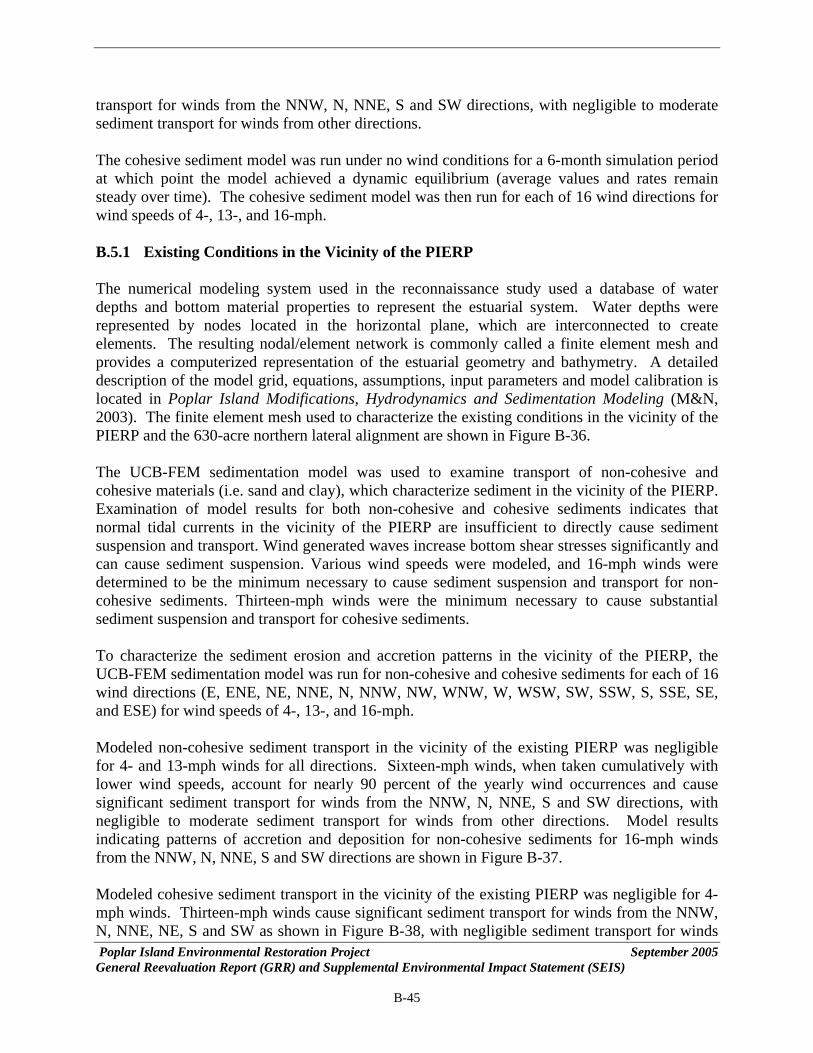
transport for winds from the NNW, N, NNE, S and SW directions, with negligible to moderate sediment transport for winds from other directions. The cohesive sediment model was run under no wind conditions for a 6-month simulation period at which point the model achieved a dynamic equilibrium (average values and rates remain steady over time). The cohesive sediment model was then run for each of 16 wind directions for
ind speeds of 4-, 13-, and 16-mph.
(M&N, 003). The finite element mesh used to characterize the existing conditions in the vicinity of the
-cohesive and ohesive materials (i.e. sand and clay), which characterize sediment in the vicinity of the PIERP.
o characterize the sediment erosion and accretion patterns in the vicinity of the PIERP, the
sediment transport in the vicinity of the existing PIERP was negligible or 4- and 13-mph winds for all directions. Sixteen-mph winds, when taken cumulatively with
ransport for winds from other directions. Model results dicating patterns of accretion and deposition for non-cohesive sediments for 16-mph winds
fr n in Figure B-37. Mo in the vicinity of the existing PIERP was negligible for 4-mp ignificant sediment transport for winds from the NNW, N, NNE, NE, S and SW as shown in Figure B-38, with negligible sediment transport for winds
w B.5.1 Existing Conditions in the Vicinity of the PIERP The numerical modeling system used in the reconnaissance study used a database of water depths and bottom material properties to represent the estuarial system. Water depths were represented by nodes located in the horizontal plane, which are interconnected to create elements. The resulting nodal/element network is commonly called a finite element mesh and provides a computerized representation of the estuarial geometry and bathymetry. A detailed description of the model grid, equations, assumptions, input parameters and model calibration is located in Poplar Island Modifications, Hydrodynamics and Sedimentation Modeling2PIERP and the 630-acre northern lateral alignment are shown in Figure B-36. The UCB-FEM sedimentation model was used to examine transport of noncExamination of model results for both non-cohesive and cohesive sediments indicates that normal tidal currents in the vicinity of the PIERP are insufficient to directly cause sediment suspension and transport. Wind generated waves increase bottom shear stresses significantly and can cause sediment suspension. Various wind speeds were modeled, and 16-mph winds were determined to be the minimum necessary to cause sediment suspension and transport for non-cohesive sediments. Thirteen-mph winds were the minimum necessary to cause substantial sediment suspension and transport for cohesive sediments. TUCB-FEM sedimentation model was run for non-cohesive and cohesive sediments for each of 16 wind directions (E, ENE, NE, NNE, N, NNW, NW, WNW, W, WSW, SW, SSW, S, SSE, SE, and ESE) for wind speeds of 4-, 13-, and 16-mph. Modeled non-cohesiveflower wind speeds, account for nearly 90 percent of the yearly wind occurrences and cause significant sediment transport for winds from the NNW, N, NNE, S and SW directions, with negligible to moderate sediment tin
om the NNW, N, NNE, S and SW directions are show
deled cohesive sediment transport h winds. Thirteen-mph winds cause s
Poplar Island Environmental Restoration Project September 2005 General Reevaluation Report (GRR) and Supplemental Environmental Impact Statement (SEIS)
B-45

from ing a normalized unitless scale due to the empirical use ack of available data to verify model calibration. In
eneral, for cohesive sediments, the areas of erosion and accretion are larger than for non-co ecause the properties of cohesive sediment (shape, plasticity, electric charge) cause the particles to remain in suspension for relatively long periods of time before they sett
other directions. Results are shown us of the sedimentation model and the l
ghesive sediment, b
le out.
Poplar Island Environmental Restoration Project September 2005 General Reevaluation Report (GRR) and Supplemental Environmental Impact Statement (SEIS)
B-46

Po Envi n Pro ber 2plar Island ronmental Restoratio ject Septem 005 Genera
Figure B
l Reevaluation Re and Supplem tal Environme t (SEIS)
B-47
-36 sape Fin B-F ondiLate Sour
port (GRR)
: The Upper Che
en
ake Bay –Northern
ntal Impact Statemen
ite Element Mesh (UCral Alignment (right) (
tion (left) 630-Acre
EM) for the Existing Cce: M&N, 2003)
-100 -90 -80 -70 -60 -50 -40
DEPTH IN FT
-30 -20 -10 0 -100 -90 -80 -70 -60 -50 -40
DEPTH IN FT
-30 -20 -10 0 -100 -90 -80 -70 -60 -50
DEPTH IN FT
0 -20 -10 0 -40 -3-100 -90 -80 -70 -60 -50
DEPTH IN
-40 -3
FT
0 -20 -10 0

Poplar Island Environmental Restoration Project September 2005 General Reevaluation Report (GRR) and Supplemental Environmental Impact Statement (SEIS)
B-48
North-Northwest Wind (16 mph) North Wind (16 mph) North-Northeast Wind (16 mph)
South Wind (16 mph) Southwest Wind (16 mph)
Figure B-37: Non-Cohesive Sediment –- Existing Conditions (Source: M&N, 2003)
-1.0 -0.8 -0.6 -0.4 -0.2 0 0.2 0.4 0.6 0.8 1.0
LE (UNITLESS)NORMALIZED SCA
-1.0 -0.8 -0.6 -0.4 -0.2 0
NORMALIZED SCA
EROSION
0.2 0.4 0.6 0.8 1.0
LE (UNITLESS)
ACCRETION

General Reevaluation Report (GRR) and Supplemental Environmental Impact Statement (SEIS)
B-49
North-Northwest Wind (13 mph) North Wind (13 mph) North-Northeast Wind (13 mph) Northeast Wind (13 mph) South Wind (13 mph) Southwest Wind (13 mph)
FigureB-38: Cohesive Sediment Existing Conditions (Source: M&N, 2003) -1.0 -0.8 -0.6 -0.4 -0.2 0 0.2 0.4 0.6 0.8 1.0
NORMALIZED SCALE (UNITLESS)
-1.0 -0.8 -0.6 -0.4 -0.2 0 0.2 0.4 0.6 0.8 1.0
NORMALIZED SCALE (UNITLESS)
ACCRETIONEROSION
Poplar Island Environmental Restoration Project September 2005

Poplar Island Environmental R orat P 2005 est ion roject SeptemberGeneral Reevaluation Report (GRR) and Supplemental Environmental Impact Statement (SEIS)
B-50
B.5.2 The Northern Lateral Expansion Alignment The UCB-FEM model is used to assess impacts by applying identical hydrodynamic input boundary conditions to existing con ith-project model bathymetry. Hydrodynamic results are then used as input into the sedimentation model, which is also run using identical boundary conditions existing condition and with-project conditions. The input conditions selected represent typical hydrodynam the vicinity of Poplar Island. Results of the hydrodynamic simulations are co several points around the project site and visually for the entire project vicinity. Figure B-39 shows comparison stations for the 630-acre northern lateral alignment.
Figure B-39: Results Comparison Locations (Source: M&N, 2003)
Report (GRR) and Supplemental Environmental Impact Statement (SEIS)
B-50
B.5.2 The Northern Lateral Expansion Alignment The UCB-FEM model is used to assess impacts by applying identical hydrodynamic input boundary conditions to existing con ith-project model bathymetry. Hydrodynamic results are then used as input into the sedimentation model, which is also run using identical boundary conditions existing condition and with-project conditions. The input conditions selected represent typical hydrodynam the vicinity of Poplar Island. Results of the hydrodynamic simulations are co several points around the project site and visually for the entire project vicinity. Figure B-39 shows comparison stations for the 630-acre northern lateral alignment.
Figure B-39: Results Comparison Locations (Source: M&N, 2003)
NORTH OF P CT
dition and w
ic conditions inmpared numerically at
dition and w
ic conditions inmpared numerically at
ROJE
NORTHWEST OF PR CTOJE
NORTHEAST OF PROJECT
SOUTHEAST O OJECTF PR
SOUTH OF PROJECT
EAST OF PROJECT
POPLA
R ISLAND
-100 -90 -80 -60 -50 -40 -30 -20 -10 0
DEPTH IN FT
NORTH OF P CT
-70
ROJE
NORTHWEST OF PR CTOJE
NORTHEAST OF PROJECT
SOUTHEAST O OJECTF PR
SOUTH OF PROJECT
EAST OF PROJECT
POPLA
R ISLAND
NORTH OF P CTROJE
NORTHWEST OF PR CTOJE
NORTHEAST OF PROJECT
SOUTHEAST O OJECTF PR
SOUTH OF PROJECT
EAST OF PROJECT
POPLA
R ISLAND
-100 -90 -80 -60 -50 -40 -30 -20 -10 0
DEPTH IN FT
-70 -100 -90 -80 -60 -50 -40 -30 -20 -10 0
DEPTH IN FT
-70

Popl ber 2005 ar Island Environmental Restoration Project SeptemGeneral Reevaluation Report (GRR) and Supplemental Environmental Impact Statement (SEIS)
B-51
The UCB-FEM sedimentation model was run for the 630-acre northern lateral alignment to assess erosion and accretion of both non-cohesive and cohesive sediments. Results were normalized to a unitless scale becaus pirical use of the sedimentation model as a result of insufficient local calibration da e sediments have properties (shape, plasticity, electric charge) that cause the par emain in suspension for relatively lon periods of time before they settle out, genera lting in a larger area affected by sedimentation and erosion from cohesive sediment as compared to non-cohesive sediments. Hydrodynamic model results indi r surface elevations would be unaffected by construction of the 630-acre northe teral alignment (Figure B-40), and re ely small impacts would occur to current velocities. Figures B-41 and B-42 visually show the differences in peak ebb and flood current velocity, respectively, in the project area due to construction of the project. Following construction of the 630-acre northern lateral alignment, flow would be displaced northward, and current uld increase at the northernmost point. Current velocity decreases where flow is blocked by the island, creating an area of increased quiescence to the east, west and immediately south of the 630-acre northern lateral alignment area. During the peak flood tide, shown in Figure B-42, flows are reversed relative to ebb tide currents but patterns of velocity change are similar to those observed for ebb flow conditions. Currents near the PIERP are on the order of 0.1 to 1.2 ft/sec, and construction of the additional beneficial use area does not significantly change current velocities in the surrounding vicinity. Figure B-43 graphically shows the ties at six loc tions in the vicinity of newly created habitat area
Non-Cohesive Sediments. Figures B-44 through B-45 show sedimentation modeling results for 0.004-inch non-cohesive sediments for 16-mph NNW, N and NNE winds, respectively. Comparison of sedimentation patterns with bathymetry shows that the areas of erosion correspond to shallow water depths while deposition occurs in adjacent deep water areas. Construction of the 630-acre northern lateral alignment would interrupt the long NNW wind fetch from across the Bay, thereby reducing the rates of erosion and accretion in the lee of the project as shown in Figure B-44. The difference plot in Figure B-44 shows a large area southeast of the project, labeled as both "more sediment" and “less sediment” on the scale, which represents areas that are eroding an under existing conditions and show no sediment transport in the with-project conditio Construction of the 630-acre north ent would also interrupt a large portion of the long wind fetch from the north, reducing the rates of erosion and accretion southeast of the PIERP as shown in the difference plot of Figure B-45. The region labeled as "m ent" and “less sediment” on the scale represents areas that are both eroding an respectively, under existing conditions, and similar to NNW wind conditions show no sediment transport in the with-project conditio Figure B-45 shows that construction of the 630-acre northern lateral alignment would interrupt the long wind fetch from the NNE, reducing the rates of erosion and accretion in Poplar Harbor. The difference plot in Figure B-42 shows areas within Poplar Harbor labeled as "m ent"
e of the emta. Cohesiv
ticles to rlly resu
cate that watern la
velocity wo
differences between current veloci.
d accreting ns.
ern lateral alignm
ns.
g
lativ
a
ore sedimd accreting,
ore sedim

and “less sediment” on the scale, which represent areas that are eroding and accreting, spectively, under existing conditions and show no sediment transport in the with-project
igure B-48 shows modeling results for 13-mph N winds. This figure shows a potential for creased erosion and decreased accretion north of the 630-acre northern lateral alignment area
fter construction, because of the increased flow west of the island. The figure also shows ecreased erosion of sediment from the shallow areas within Poplar Harbor and decreased eposition in the deeper areas of Poplar Island Narrows east of the 630-acre northern lateral lignment and within the sheltered areas south of the PIERP. Similarly for existing conditions, 3-mph NNE winds (Figure B-49) cause erosion of sediment within Poplar Harbor. Following onstruction of the 630-acre northern lateral alignment, a large area of Poplar Harbor, including fferson Island, is sheltered by the expansion, resulting in decreased erosion of sediment from e shallow areas within Poplar Harbor and decreased deposition in the deeper areas east of oplar Harbor in the Poplar Island Narrows. Erosion of Jefferson Island is greatly reduced after onstruction of the 630-acre northern lateral alignment. Modeling results for 13-mph NE winds, igure B-50, show results similar to NNE winds.
odel Results for the Northern Lateral Alignment. Hydrodynamics and sedimentation umerical modeling for the Poplar Island Modifications Reconnaissance Study show that xpansion of the PIERP would have minimal impacts on local tidal elevations and current elocities. Tidal elevations would be unchanged, and maximum increase or decrease in current elocity following construction of any alignment would be about 0.2 ft/sec.
onstruction of the 630-acre northern lateral alignment would have a beneficial impact because would provide shelter to Poplar Harbor from wind and waves coming from the NNW, N, NNE nd NE directions, reducing erosion of Jefferson Island and shallow areas of the harbor. This duction in erosion would likely reduce suspended sediment and improve water clarity within oplar Harbor.
reconditions. Cohesive Sediments. Figures B-47 through B-50 show sedimentation modeling results for cohesive sediments for 13mph NNW, N, NNE and NE winds, respectively. Figure B-47 shows a virtual absence of sediment movement within Poplar Harbor following construction of the 630-acre northern lateral alignment for NNW winds, and a reduction of sediment movement east and southeast of the island. Finadda1cJethPcF Mnevv CitareP
Poplar Island Environmental Restoration Project September 2005 General Reevaluation Report (GRR) and Supplemental Environmental Impact Statement (SEIS)
B-52

Poplar Island Environmental Restoration Project September 2005 General Reevaluation Report (GRR) and Supplemental Environmental Impact Statement (SEIS)
B-53
Northwest of Project
0.00
0.50
1.00
1.50
2.00
Ele
vatio
n (ft
, MLL
W)
-1.00
-0.50
2/1/2001 2/3/2001 2/5/2001 2/7/2001 2/9/2001 2/11/2001 2/13/2001 2/15/2001
Date
Tide
Existing Conditions Alignment 6
East of Project
0.50
1.00
1.50
2.00
atio
n (ft
, MLL
W)
North of Project
0.00
0.50
1.00
1.50
2.00
Ele
vatio
n (ft
, MLL
W)
Figure B-40: Poplar Island Tidal Results Comparison for a 630-Acre Northern Lateral
Alignment (Source: M&N, 2003)
-1.00
-0.50
0.00
2/1/2001 2/3/2001 2/5/2001 2/7/2001 2/9/2001 2/11/2001 2/13/2001 2/15/2001
Tide
El
Date
ev
Existing Conditions Alignment 6
Southeast of Project
1.00
1.50
2.00
LW)
-1.00
-0.50
0.00
0.50
2/1/2001 2/3/2001 2/5/2001 2/7/2001 2/9/2001 2/11/2001 2/13/2001 2/15/2001
Date
Tide
Ele
vatio
n (ft
, ML
Existing Conditions Alignment 6
South of Project
1.00
1.50
2.00
LW)
-1.00
-0.50
0.00
0.50
2/1/2001 2/3/2001 2/5/2001 2/7/2001 2/9/2001 2/11/2001 2/13/2001 2/15/2001
Tide
Ele
vatio
n (ft
Date
, ML
Existing Conditions Alignment 6
Northeast of Project
0.50
1.00
1.50
2.00
atio
n (ft
, MLL
W)
-1.00
-0.50
0.00
2/1/2001 2/3/2001 2/5/2001 2/7/2001 2/9/2001 2/11/2001 2/13/2001 2/15/2001
Date
Tide
Ele
v
Existing Conditions Alignment 6
-1.00
-0.50
2/1/2001 2/3/2001 2/5/2001 2/7/2001 2/9/2001 2/11/2001 2/13/2001 2/15/2001
Date
Tide
Existing Conditions Alternative 6

Poplar Island Environmental Restoration Project September 2005
Figure B-41: Peak Ebb Current Velocity – 630-Acre Northern Lateral Alignment vs. Existing Conditions (Source: M&N, 2003)
EXISTING CONDITIONS DIFFERENCEALIGNMENT 6
Figure B-42: Peak Flood Current Velocity – 630-Acre Northern Lateral Alignment vs. Existing Conditions (Source: M&N, 2003)
-0.20 -0.16 -0.12 -0.08 -0.04 0 0.04 0.08 0.12 0.16 0.20
SCALE IN FT/SEC
-0.20 -0.16 -0.12 -0.08 -0.04 0 0.04 0.08 0.12 0.16 0.20
SCALE IN FT/SEC
0 0.15 0.3 0.45 0.6 0.75 0.9 1.05 1.2 1.35 1.5
SCALE IN FT/SEC
0 0.15 0.3 0.45 0.6 0.75 0.9 1.05 1.2 1.35 1.50 0.15 0.3 0.45 0.6 0.75 0.9 1.05 1.2 1.35 1.5
SCALE IN FT/SEC
0 0.15 0.3 0.45 0.6 0.75 0.9 1.05 1.2 1.35 1.5
SCALE IN FT/SEC
0 0.15 0.3 0.45 0.6 0.75 0.9 1.05 1.2 1.35 1.50 0.15 0.3 0.45 0.6 0.75 0.9 1.05 1.2 1.35 1.5
SCALE IN FT/SEC
-0.20 -0.16 -0.12 -0.08 -0.04 0 0.04 0.08 0.12 0.16 0.20
SCALE IN FT/SEC
-0.20 -0.16 -0.12 -0.08 -0.04 0 0.04 0.08 0.12 0.16 0.20
SCALE IN FT/SEC
EXISTING CONDITIONS DIFFERENCE
0 0.15 0.3 0.45 0.6 0.75 0.9 1.05 1.2 1.35 1.5
SCALE IN FT/SEC
0 0.15 0.3 0.45 0.6 0.75 0.9 1.05 1.2 1.35 1.50 0.15 0.3 0.45 0.6 0.75 0.9 1.05 1.2 1.35 1.5
SCALE IN FT/SEC
0 0.15 0.3 0.45 0.6 0.75 0.9 1.05 1.2 1.35 1.5
SCALE IN FT/SEC
0 0.15 0.3 0.45 0.6 0.75 0.9 1.05 1.2 1.35 1.50 0.15 0.3 0.45 0.6 0.75 0.9 1.05 1.2 1.35 1.5
SCALE IN FT/SEC
ALIGNMENT 6
General Reevaluation Report (GRR) and Supplemental Environmental Impact Statement (SEIS)
B-54

Poplar Island Environmental Restoration Project September 2005
F Lat 03)
Northwest of Project
-1.00
-0.75
-0.50
-0.25
0.00
0.25
0.50
0.75
1.00
2/1/2001 2/3/2001 2/5/2001 2/7/2001 2/9/2001 2/11/2001 2/13/2001 2/15/2001
Date
/sec
)ci
ty (f
tt V
elo
Cur
ren
Existing Conditions Alignment 6
East of Project
-1.00
-0.75
-0.50
-0.25
0.00
0.25
0.50
0.75
1.00
2/1/2001 2/3/2001 2/5/2001 2/7/2001 2/9/2001 2/11/2001 2/13/2001 2/15/2001
Date
rren
city
(ft/s
ec)
t Vel
oC
u
Existing Conditions Alignment 6
Southeast of Project
-1.00
-0.75
-0.50
-0.25
0.00
0.25
0.50
0.75
1.00
2/1/2001 2/3/2001 2/5/2001 2/7/2001 2/9/2001 2/11/2001 2/13/2001 2/15/2001
Date
Cur
rent
Vel
ocity
(ft/s
ec)
Existing Conditions Alignment 6
South of Project
-1.00
-0.75
-0.50
-0.25
0.00
0.25
0.50
0.75
1.00
2/1/2001 2/3/2001 2/5/2001 2/7/2001 2/9/2001 2/11/2001 2/13/2001 2/15/2001
Date
ren
y (ft
/sec
)t V
eloc
itC
ur
Existing Conditions Alignment 6
Northeast of Project
-1.00
-0.75
-0.50
-0.25
0.00
0.25
0.50
0.75
1.00
2/1/2001 2/3/2001 2/5/2001 2/7/2001 2/9/2001 2/11/2001 2/13/2001 2/15/2001
Date
Cur
rent
Vel
ocity
(ft/s
ec)
Existing Conditions Alignment 6
North of Project
-1.00
-0.75
-0.50
-0.25
0.00
0.25
0.50
0.75
1.00
2/1/2001 2/3/2001 2/5/2001 2/7/2001 2/9/2001 2/11/2001 2/13/2001 2/15/2001
Date
Cur
rent
Vel
ocity
(ft/s
ec)
Existing Conditions Alignment 6
igure B-43: Poplar Island Current Velocity Results Comparison for a 630-Acre Northerneral Alignment (Source: M&N, 20
General Reevaluation Report (GRR) and Supplemental Environmental Impact Statement (SEIS)
B-55

Poplar Island Environmental Restoration Project September 2005
EXISTING CONDITIONS DIFFERENCE
-1.0 -0.8 -0.6 -0.4 -0.2 0 0.2 0.4 0.6 0.8 1.0
NORMALIZED UNIT SCALE
-1.0 -0.8 -0.6 -0.4 -0.2 0.2 0.4 0.6 0.8 1.0
NORMALIZED NIT SCALE
hesive Sediment – North-Northeast WinFigure B-44: Non-Co d 16 mph – 630-Acre
Northern Lateral Alignment vs. Ex ting Conditions (Source: M&N, 2003)
F l Alignm , 2003)
is
igure B-45: Non-Cohesive Sediment – North Wind 16 mph – 630-Acre Northern Lateraent vs. Existing Conditions (Source: M&N
0
U
-1.0 -0.8 -0.6 -0.4 -0.2 0 0.2 0.4 0.6 0.8 1.0
NORMALIZED UNIT SCALE
-1.0 -0.8 -0.6 -0.4 -0.2 0 0.2 0.4 0.6 0.8 1.0
NORMALIZED UNIT SCALE
-1.0 -0.8 -0.6 -0.4 -0.2 0 0.2 0.4 0.6 0.8 1.0
NORMALIZED UNIT SCALE
-1.0 -0.8 -0.6 -0.4 -0.2 0.2 0.4 0.6 0.8 1.0
NORMALIZED NIT SCALE
0
U
-1.0 -0.8 -0.6 -0.4 -0.2 0.2 0.4 0.6 0.8 1.0
NORMALIZED NIT SCALE
0
U
-1.0 -0.8 -0.6 -0.4 -0.2 0 0.2 0.4 0.6 0.8 1.0
NORMALIZED UNIT SCALE
-1.0 -0.8 -0.6 -0.4 -0.2 0 0.2 0.4 0.6 0.8 1.0
NORMALIZED UNIT SCALE
ACCRETIONEROSION ACCRETIONEROSION MORE SEDI MENTLESS SEDIMENT
ALIGNM NT 6E
EXISTING CONDITIONS DIFFERENCE
-1.0 -0.8 -0.6 -0.4 -0.2 0 0.2 0.4 0.6 0.8 1.0
NORMALIZED UNIT SCALE
-1.0 -0.8 -0.6 -0.4 -0.2 0.2 0.4 0.6 0.8 1.0
NORMALIZED NIT SCALE U
0 -1.0 -0.8 -0.6 -0.4 -0.2 0 0.2 0.4 0.6 0.8 1.0
NORMALIZED UNIT SCALE
-1.0 -0.8 -0.6 -0.4 -0.2 0 0.2 0.4 0.6 0.8 1.0
NORMALIZED UNIT SCALE
-1.0 -0.8 -0.6 -0.4 -0.2 0 0.2 0.4 0.6 0.8 1.0
NORMALIZED UNIT SCALE
-1.0 -0.8 -0.6 -0.4 -0.2 0.2 0.4 0.6 0.8 1.0
NORMALIZED NIT SCALE U
0 -1.0 -0.8 -0.6 -0.4 -0.2 0.2 0.4 0.6 0.8 1.0
NORMALIZED NIT SCALE U
0 -1.0 -0.8 -0.6 -0.4 -0.2 0 0.2 0.4 0.6 0.8 1.0
NORMALIZED UNIT SCALE
-1.0 -0.8 -0.6 -0.4 -0.2 0 0.2 0.4 0.6 0.8 1.0
NORMALIZED UNIT SCALE
ACCRETIONEROSION ACCRETIONEROSION MORE SEDI MENTLESS SEDIMENT
ALIGNM NT 6E
General Reevaluation Report (GRR) and Supplemental Environmental Impact Statement (SEIS)
B-56

Poplar Island Environmental Restoration Project September 2005
EXISTING CONDITIONS DIFFERENCE
-1.0 -0.8 -0.6 -0.4 -0.2 0 0.2 0.4 0.6 0.8 1.0
NORMALIZED UNIT SCALE
-1.0 -0.8 -0.6 -0.4 -0.2 0 0.2 0.4 0.6 0.8 1.0
NORMALIZED
Figure B-46: Non-Cohesive Sediment – North-Northwest Wind 16 mph – 630-Acre Northern Lateral Alignment vs. Existing Conditions (Source: M&N, 2003)
Figure B-47: Cohesive Sediment – Northeast Wind 13 mph 630-Acre Northern Lateral Alignment vs. Existing Conditions (Source: M&N, 2003)
UNIT SCALE
-1.0 -0.8 -0.6 -0.4 -0.2 0 0.2 0.4 0.6 0.8 1.0
NORMALIZED UNIT SCALE
-1.0 -0.8 -0.6 -0.4 -0.2 0 0.2 0.4 0.6 0.8 1.0
NORMALIZED UNIT SCALE
-1.0 -0.8 -0.6 -0.4 -0.2 0 0.2 0.4 0.6 0.8 1.0
NORMALIZED UNIT SCALE
-1.0 -0.8 -0.6 -0.4 -0.2 0 0.2 0.4 0.6 0.8 1.0
NORMALIZED NIT SCALE U
-1.0 -0.8 -0.6 -0.4 -0.2 0 0.2 0.4 0.6 0.8 1.0
NORMALIZED NIT SCALE U
-1.0 -0.8 -0.6 -0.4 -0.2 0 0.2 0.4 0.6 0.8 1.0
NORMALIZED UNIT SCALE
-1.0 -0.8 -0.6 -0.4 -0.2 0 0.2 0.4 0.6 0.8 1.0
NORMALIZED UNIT SCALE
ACCRETIONEROSION ACCRETIONEROSION MORE SEDI MENTLESS SEDIMENT
ALIGNM NT 6E
EXISTING CONDITIONS DIFFERENCE
-1.0 -0.8 -0.6 -0.4 -0.2 0 0.2 0.4 0.6 0.8 1.0
NORMALIZED UNIT SCALE
-1.0 -0.8 -0.6 -0.4 -0.2 0.2 0.4 0.6 0.8 1.0
NORMALIZED NIT SCALE U
0 -1.0 -0.8 -0.6 -0.4 -0.2 0 0.2 0.4 0.6 0.8 1.0
NORMALIZED UNIT SCALE
-1.0 -0.8 -0.6 -0.4 -0.2 0 0.2 0.4 0.6 0.8 1.0
NORMALIZED UNIT SCALE
-1.0 -0.8 -0.6 -0.4 -0.2 0 0.2 0.4 0.6 0.8 1.0
NORMALIZED UNIT SCALE
-1.0 -0.8 -0.6 -0.4 -0.2 0.2 0.4 0.6 0.8 1.0
NORMALIZED NIT SCALE U
0 -1.0 -0.8 -0.6 -0.4 -0.2 0.2 0.4 0.6 0.8 1.0
NORMALIZED NIT SCALE U
0 -1.0 -0.8 -0.6 -0.4 -0.2 0 0.2 0.4 0.6 0.8 1.0
NORMALIZED UNIT SCALE
-1.0 -0.8 -0.6 -0.4 -0.2 0 0.2 0.4 0.6 0.8 1.0
NORMALIZED UNIT SCALE
ACCRETIONEROSION ACCRETIONEROSION MORE SEDI MENTLESS SEDIMENT
ALIGNM NT 6E
General Reevaluation Report (GRR) and Supplemental Environmental Impact Statement (SEIS)
B-57
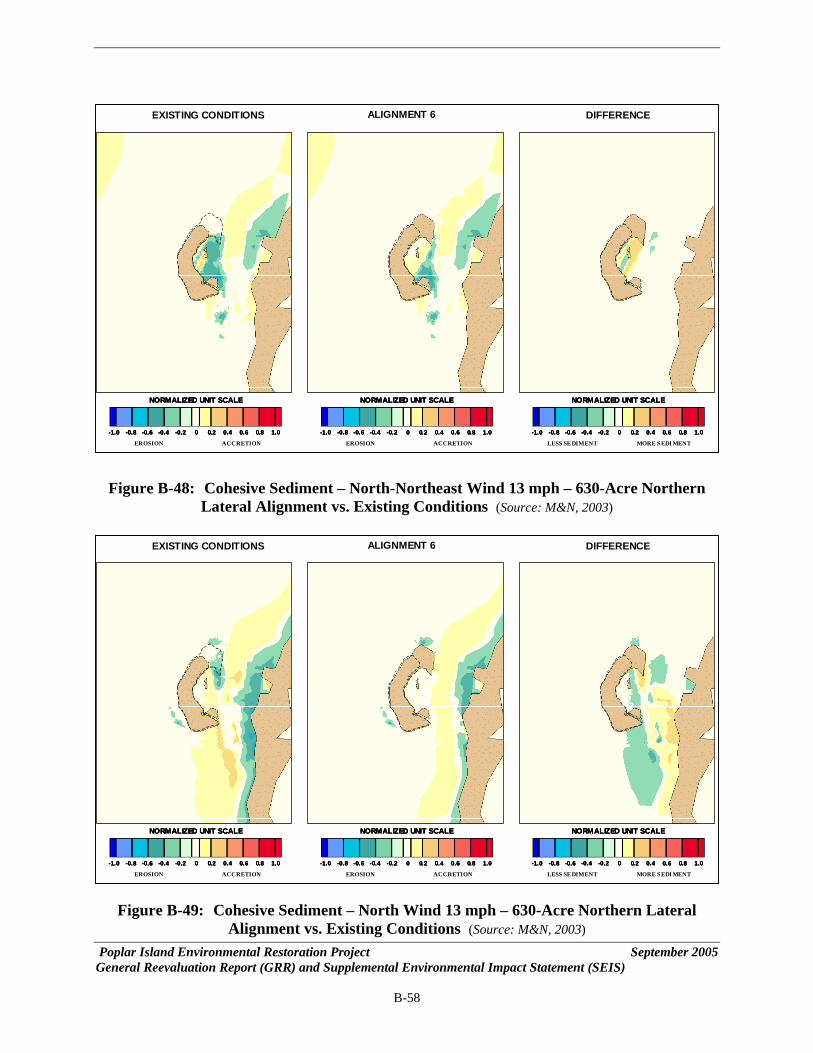
Fi n gure B-48: Cohesive Sediment – North-Northeast Wind 13 mph – 630-Acre NortherLateral Alignment vs. Existing Conditions (Source: M&N, 2003)
EXISTING CONDITIONS DIFFERENCE
-1.0 -0.8 -0.6 -0.4 -0.2 0 0.2 0.4 0.6 0.8 1.0
NORMALIZED UNIT SCALE
-1.0 -0.8 -0.6 -0.4 -0.2 0 0.2 0.4 0.6 0.8 1.0
NORMALIZED UNIT SCALE
-1.0 -0.8 -0.6 -0.4 -0.2 0 0.2 0.4 0.6 0.8 1.0
NORMALIZED UNIT SCALE
-1.0 -0.8 -0.6 -0.4 -0.2 0 0.2 0.4 0.6 0.8 1.0
NORMALIZED UNIT SCALE
-1.0 -0.8 -0.6 -0.4 -0.2 0 0.2 0.4 0.6 0.8 1.0
NORMALIZED UNIT SCALE
-1.0 -0.8 -0.6 -0.4 -0.2 0 0.2 0.4 0.6 0.8 1.0
NORMALIZED UNIT SCALE
-1.0 -0.8 -0.6 -0.4 -0.2 0 0.2 0.4 0.6 0.8 1.0
NORMALIZED UNIT SCALE
-1.0 -0.8 -0.6 -0.4 -0.2 0 0.2 0.4 0.6 0.8 1.0
NORMALIZED UNIT SCALE
-1.0 -0.8 -0.6 -0.4 -0.2 0 0.2 0.4 0.6 0.8 1.0
NORMALIZED UNIT SCALE
ACCRETIONEROSION ACCRETIONEROSION MORE SEDI MENTLESS SEDIMENT
ALIGNMENT 6
Figure B-49: Cohesive Sediment – North Wind 13 mph – 630-Acre Northern Lateral Alignment vs. Existing Conditions (Source: M&N, 2003)
Poplar Island Environmental Restoration Project September 2005 General Reevaluation Report (GRR) and Supplemental Environmental Impact Statement (SEIS)
B-58

EXISTING CONDITIONS DIFFERENCE
-1.0 -0.8 -0.6 -0.4 -0.2 0 0.2 0.4 0.6 0.8 1.0
NORMALIZED UNIT SCALE
-1.0 -0.8 -0.6 -0.4 -0.2 0 0.2 0.4 0.6 0.8 1.0
NORMALIZED UNIT SCALE
-1.0 -0.8 -0.6 -0.4 -0.2 0 0.2 0.4 0.6 0.8 1.0
NORMALIZED UNIT SCALE
-1.0 -0.8 -0.6 -0.4 -0.2 0 0.2 0.4 0.6 0.8 1.0
NORMALIZED UNIT SCALE
-1.0 -0.8 -0.6 -0.4 -0.2 0 0.2 0.4 0.6 0.8 1.0
NORMALIZED UNIT SCALE
-1.0 -0.8 -0.6 -0.4 -0.2 0 0.2 0.4 0.6 0.8 1.0
NORMALIZED UNIT SCALE
-1.0 -0.8 -0.6 -0.4 -0.2 0 0.2 0.4 0.6 0.8 1.0
NORMALIZED UNIT SCALE
-1.0 -0.8 -0.6 -0.4 -0.2 0 0.2 0.4 0.6 0.8 1.0
NORMALIZED UNIT SCALE
-1.0 -0.8 -0.6 -0.4 -0.2 0 0.2 0.4 0.6 0.8 1.0
NORMALIZED UNIT SCALE
ACCRETIONEROSION ACCRETIONEROSION MORE SEDI MENTLESS SEDIMENT
ALIGNMENT 6
Fi n
gure B-50: Cohesive Sediment – North-Northwest Wind 13 mph – 630-Acre NortherLateral Alignment vs. Existing Condition (Source: M&N, 2003)
Poplar Island Environmental Restoration Project September 2005 General Reevaluation Report (GRR) and Supplemental Environmental Impact Statement (SEIS)
B-59

REFERENCES
emirbilek, Z., Zundel, A., and Jones, R. (2004). “Particle Tracking Model (PTM) in the SMS: IV. Tutorial - sample sediment sources,” DOER Technical Report, U.S. Army Engineer Research and Development Center, Vicksburg, MS.
alnay, E., et al. 1996: The NCEP/NCAR 40-year Reanalysis Project. Bulletin, American Meteorological Society, 77(3), 437-471.
in, L., Cialone, M. A., and Bass, G. P. (in press). “Hurricane Isabel Storm Surge Simulation for Chesapeake Bay,” Chesapeake Research Consortium Publication 05-160, Heritage Press, Edgewater, MD.
Moffatt & Nichol Engineers (M&N). 2004. Poplar Island Environmental Restoration Project,
Morphological Modeling. Prepared for Maryland Port Administration. December. Moffatt & Nichol Engineers (M&N). 2003. Poplar Island Modifications,
Hydrodynamics, and Sedimentation Modeling. Final Report January 22, 2003. Report submitted to Maryland Port Admi istration and Maryland Environmental Services.
Smith, J. M. 19 s Paper
CERC-91-2, U.S. Army Engineer Waterways Experiment Station, Vicksburg, MS, 25 pp. Smith, J. M., Sherlock, A. R. and Resio, D. T. 2001. “STWAVE: Steady-State spectral Wave
Model User’s manual for STWAVE, Version 3.0,” ERDC/CHL SR-01-1, US Army Corps of Engineers Engineer Research and Development Center, Vicksburg, MS.
Swail, V.R., Ceccacci, E.A., and Cox, A.T., 2000. “The AES40 North Atlantic Wave
Reanalysis: Validation and Climate Assessment,” The 6th International Workshop On Wave Hindcasting and Forecasting, Monterey, California. 1-15.
Thomas, W.A., W.H. McAnally, Jr. and S.A. Adamec, Jr. 1985. A User’s Manual for the
Generalized Computer Program, SedimeHorizontal Plane (STUDH).
U.S. Army Corps of Engineers, Engineer Research and Development Center (USACE-ERDC),
Coastal and Hydraulics Laboratory (CHL). 2005a. Poplar Island Expansion Flushing Study. Memorandum for the Record. Prepared for USACE-Baltimore District. 23 May 2005.
D
K
L
n
91. “Wind-wave Generation on Restricted Fetches,” Miscellaneou
nt Transport in Unsteady, 2-Dimensional Flow,
Poplar Island Environmental Restoration Project September 2005 General Reevaluation Report (GRR) and Supplemental Environmental Impact Statement (SEIS)
B-60

U.S. Army Corps of Engineers, Engineer Research and Development Center (USACE-ERDC), Coastal and Hydraulics Laboratory (CHL). 2005b. Shoreline Impact Study for Poplar Island Expansion. Memorandum for the Record. Prepared for USACE-Baltimore District. 17 February 2005.
.S. Army Corps of Engineers, Engineer Research and Development Center (USACE-ERDC), Coastal and Hydraulics Laboratory (CHL). 2005c. Life Cycle Analysis of Mid Bay and Poplar Island Projects, Chesapeake Bay, Maryland. Prepared for USACE-Baltimore District. July. Draft.
U
Poplar Island Environmental Restoration Project September 2005 General Reevaluation Report (GRR) and Supplemental Environmental Impact Statement (SEIS)
B-61