
APPENDIX A P LAND USE EMETHODOLOGY HARBORING …
32
PORT LAND-USE EFFICIENCY METHODOLOGY W e examined the land-use efficiency of ten of the largest U.S. container ports and compared them to the Port of Singapore, an international port known for efficient land use. The standard measure of container throughput, twenty-foot equivalents units (TEUs)—roughly equal to half of a regular size container—was compared on a per-container-terminal-acres per-year basis. METHODS Data on 2001 container throughput (measured in TEUs) was collected from each port’s web site. When possible, terminal acreage was also taken from these web sites. This acreage included only the size of terminals completely or predominantly dedicated to handling containers, not the total acreage of the port, since TEUs measure only container movement. For the ports that separate container terminals from terminals that handle other cargo, container terminal acreage was taken directly from port web sites. These ports include Long Beach, Los Angeles, Seattle, and Oakland. 1 The acreage of Los Angeles’ vacant container terminal was not included. The container terminal acreage of New York/New Jersey was taken from the New York & New Jersey Harbor Navigation Study, which includes its own estimates of acreage and efficiency. 2 Charleston’s estimates come from the South Carolina port’s web site, which has a discussion of efficiency, and is verified with the “Draft Environmental Impact Statement (DEIS) for the Proposed Daniel Island Marine Cargo Terminal,” which provides the container processing and storage acreage for the three terminals that handle containers: Columbus Street, North Charleston, and Wando Welch. 3 A DEIS for Miami does not give a precise number for container terminal acreage; however, it specifies that cargo-related operations use 372.5 acres and maintain that “the port handles primarily containerized cargo.” 4 Houston acreage comes from Houston’s own 2003 efficiency study entitled “U.S. Container Terminal Throughput Density.” 5 In the cases of both Hampton Roads and Savannah, no numbers detailing the exact proportion of the terminals that are dedicated to containers, or any efficiency studies 1 APPENDIX A HARBORING POLLUTION Strategies to Clean Up U.S. Ports August 2004
Transcript of APPENDIX A P LAND USE EMETHODOLOGY HARBORING …

PORT LAND-USEEFFICIENCYMETHODOLOGY
We examined the land-use efficiency of ten of the largest U.S. container portsand compared them to the Port of Singapore, an international port known
for efficient land use. The standard measure of container throughput, twenty-footequivalents units (TEUs)—roughly equal to half of a regular size container—wascompared on a per-container-terminal-acres per-year basis.
METHODSData on 2001 container throughput (measured in TEUs) was collected from each port’sweb site. When possible, terminal acreage was also taken from these web sites. Thisacreage included only the size of terminals completely or predominantly dedicatedto handling containers, not the total acreage of the port, since TEUs measure onlycontainer movement.
For the ports that separate container terminals from terminals that handle othercargo, container terminal acreage was taken directly from port web sites. Theseports include Long Beach, Los Angeles, Seattle, and Oakland.1 The acreage ofLos Angeles’ vacant container terminal was not included.
The container terminal acreage of New York/New Jersey was taken from theNew York & New Jersey Harbor Navigation Study, which includes its own estimatesof acreage and efficiency.2 Charleston’s estimates come from the South Carolinaport’s web site, which has a discussion of efficiency, and is verified with the “DraftEnvironmental Impact Statement (DEIS) for the Proposed Daniel Island MarineCargo Terminal,” which provides the container processing and storage acreagefor the three terminals that handle containers: Columbus Street, North Charleston,and Wando Welch.3 A DEIS for Miami does not give a precise number for containerterminal acreage; however, it specifies that cargo-related operations use 372.5 acresand maintain that “the port handles primarily containerized cargo.”4 Houstonacreage comes from Houston’s own 2003 efficiency study entitled “U.S. ContainerTerminal Throughput Density.”5
In the cases of both Hampton Roads and Savannah, no numbers detailing the exactproportion of the terminals that are dedicated to containers, or any efficiency studies
1
APPENDIX A
HARBORING POLLUTIONStrategies to�Clean Up U.S. Ports
August 2004

produced by the ports themselves could be found.6 Therefore, estimates were calcu-lated based on available data. Hampton Roads published total area as well as con-tainer open storage area for its Newport News Marine Terminal. The area of thisterminal for containers was estimated to be the open storage area plus the proportionof pier feet dedicated to containers times the remaining area, to account for facilitiesused in container processing that may be outside of the storage area. The calculationamounted to 43 acres + [27%*(140.64–43)].
The container area of the Norfolk International Terminals, for which no openstorage area could be found, was taken to be 55 percent of the total area of theterminal minus the area of the piers devoted to other cargo. Fifty-five percent isthe proportion of berth linear feet for containers. The final calculation was then 55%*[811–(9+9+14)] acres. For Portsmouth Marine Terminal, there are 46.8 acres of openstorage area. This was added to one-third of the remaining terminal acreage, sinceall berths are used for container, break-bulk, and Ro/Ro cargo.
For Savannah, open storage acreage was added to 46 percent of remainingterminal acreage—since 92 percent of berth linear feet is container and Ro/Roberths. This percentage was then divided in half to get only containers.
The acreages for Savannah and Hampton Roads are intended only as estimates,based on the given data.
RESULTSThe Port of Singapore exemplifies the gold standard in land-use efficiency at its fourcontainer terminals: Tanjong Pagar, Keppel, Brani, and Pasir Panjang.7 Among U.S.ports, although Long Beach and Houston have the highest efficiencies (4,825 and4,417 TEUs/acre/year, respectively), they are still about four times less efficient thanthe Port of Singapore. The average of the top ten U.S. ports, 2,996 TEUs/acre/year,shows that the United States still has a long way to go to reach the efficiency alreadyin practice at some major ports abroad.
2
Harboring Pollution

ADDITIONAL TECHNICALINFORMATION FORMITIGATION MEASURES
DIESEL PARTICULATE FILTERS Diesel particulate filters (DPFs) can achieve an 85 percent or betetr reduction in PM.8
They are widely used in Europe and are available throughout the United States for1994 model year or newer engines that are 4 four-stroke, turbocharged, and that canmeet a 0.10 grams per brake horsepower-hour (g/bhp-hr) PM emission standard.9
DPFs are sensitive to sulfur levels in fuel and typically require fuel with sulfurcontent as low as 15 parts per million. Regular on-road diesel sold today typically hassulfur levels ranging from 50 to 500 parts per million and can destroy the filters.
More than 100,000 retrofits with diesel particulate filters (DPFs) have been doneworldwide.10 Currently at least four different manufacturers have verified DPFsin California, and three have been verified through the U.S. EPA. All of these are“passive” DPFs that rely on high engine exhaust temperatures boosted by a catalystand/or extra fuel to regenerate the particulate trap. Regeneration is necessary toremove soot buildup within the filters. These traps require high temperatures, ofaround 300 to 500 degrees Celsius to regenerate. Without regeneration, accumulatedsoot would either suddenly catch on fire, potentially damaging the filter, or it wouldblock too much air flow, causing excessive pressure buildups in the engine anddamaging or shutting the engine down.
“Active” DPFs are available in Europe, but have not yet been verified in theUnited States. These DPFs use electrical heaters or fuel burners to elevate tempera-tures for filter regeneration. Active DPFs are currently undergoing demonstrationprojects on both on- and off-road applications in the United States. In addition tothose applications, they are used on some locomotives in Europe.
Effects of Fuel Sulfur Levels on DPF SystemsUse of low sulfur diesel will improve the ability of traps to reduce particulate matter(PM) emissions. With certain DPF systems, levels of 50 parts per million (ppm) orlower are necessary to achieve reductions. Verification of DPF systems, however,requires the use of low sulfur diesel fuel at 15 ppm or lower. Each DPF technologyhas a somewhat different response to sulfur levels in diesel fuel, depending on thecatalyst used, but all manufacturers agree that the sulfur levels below 15 ppm ensure
3
APPENDIX B
HARBORING POLLUTIONStrategies to�Clean Up U.S. Ports
August 2004

optimum emission control and DPF durability. Low sulfur diesel fuel costs up to5 cents more per gallon than current California Air Resources Board (CARB) diesel,depending on fleet location.11 Because many refineries are located near shippingports, we also expect the incremental price for low sulfur diesel at these locationsto be low.
Factors Affecting DPF DurabilityManufacturers claim that the useful life of the technology can be as high as 8,000 to12,000 service hours, if traps are properly maintained. However, the useful life maybe reduced when a DPF system is installed on a poorly maintained engine withleaking fuel injectors, a dirty intake air cleaner, excessive oil consumption and/orlubricating oil in the exhaust. In addition, particulate matter can build up on a DPFsystem when an engine does not achieve the proper regeneration temperature ina required duration of time (i.e., soot overloading). With this buildup, if the DPFsubsequently begins to regenerate, the collected particulate can oxidize uncontrol-lably and ultimately destroy the DPF system.12
Installation of a DPF takes between 2.5 and 5 hours, and costs from $160 to $1,200for labor. An engine back pressure monitor, necessary with the installation of anytrap, costs between $1,000 and $1,200.13
Alternative Fuel Particulate Filters (APF)Currently, no verified APF system can be applied to a dedicated alternative fuelheavy-duty diesel vehicle. The South Coast Air Quality Management District(AQMD) is currently contracting with West Virginia University to develop a DPFsystem that can operate on a dedicated alternative fuel vehicles, but the demonstra-tion project is not expected to be complete until 2004 or later. Dual-fuel systems thatpilot-inject diesel but operate mostly on natural gas do, however, have an APF systemverified by CARB to reduce PM levels by 85 percent or more. Alternative fuels, likenatural gas, do not contain sulfur, so sulfur is not an issue for these applications.
FLOW THROUGH FILTERSFlow, through filters (FTFs) are an advanced emission-control technology that reducePM emissions by 30 to 60 percent. This passive metal filter has a vast inner surfacearea that forces contact with the catalyzed surface, but does not trap soot. Thetechnology is not currently commercially available, although it is expected to make itto the market soon. FTFs are not extremely sensitive to sulfur, continuing to functionwith fuel that has as much as 500 parts per million sulfur; however the filters may notbe able to handle the amount of soot generated by very old, dirty engines.14
DIESEL OXIDATION CATALYSTSDiesel oxidation catalysts (DOCs) can reduce total PM by 25 to 50 percent, dependingon the composition of the PM emitted.15 They, too, are not as sensitive to sulfur as
4
Harboring Pollution

5
Strategies to Clean Up U.S. Ports
HEAVY-DUTY DIESEL ENGINE STANDARDS
TABLE B-1U.S. EPA Emission Standards for Heavy-Duty Diesel Trucks, g/bhp·hr
Year NMHC NMHC + NOx CO NOx PM
1974 16 40
1979 1.5 5 or
10 25
1984 1.3 (T), or 0.5 (ss) 15.5 10.7 (T) or 9.0 (ss)
1988 0.60
1990 6.0
1991 5.0 0.25
1994 5.0 0.10
1998 4.0 0.10
2004 0.5 2.4 or 2.5
2007 0.14 0.20 0.01
Sources: http://www.epa.gov/otaq/retrofit/overoh-all.htm
T = Over the Transient Test Cycless = Over the Steady-state Test Cycle, NMHC=Non-methane hydrocarbons (similar to VOCs), CO=carbon monoxide,NOx=nitrgen oxides, PM=particulate matter
TABLE B-2U.S. EPA Tier 1-3 Nonroad Diesel Engine Emission Standards (g/bhp·hr)
Engine Power Tier Year CO VOCs NMHC+NOx NOx PM
hp < 11 Tier 1 2000 6.0 — 7.8 — 0.75
Tier 2 2005 6.0 — 5.6 — 0.60
11 ≤ hp < 25 Tier 1 2000 4.9 — 7.1 — 0.60
Tier 2 2005 4.9 — 5.6 — 0.60
25 ≤ hp < 50 Tier 1 1999 4.1 — 7.1 — 0.60
Tier 2 2004 4.1 — 5.6 — 0.45
50 ≤ hp < 100 Tier 1 1998 — — — 6.9 —
Tier 2 2004 3.7 — 5.6 — 0.30
Tier 3 2008 3.7 — 3.5 — -†
100 ≤ hp < 175 Tier 1 1997 — — — 6.9 —
Tier 2 2003 3.7 — 4.9 — 0.22
Tier 3 2007 3.7 — 3.0 — —†
175 ≤ hp < 300 Tier 1 1996 8.5 1.0 — 6.9 0.40
Tier 2 2003 2.6 — 4.9 — 0.15
Tier 3 2006 2.6 — 3.0 — —†
300 ≤ hp < 600 Tier 1 1996 8.5 1.0 — 6.9 0.40
Tier 2 2001 2.6 — 4.8 — 0.15
Tier 3 2006 2.6 — 3.0 — —†
600 ≤ hp < 750 Tier 1 1996 8.5 1.0 — 6.9 0.40
Tier 2 2002 2.6 — 4.8 — 0.15
Tier 3 2006 2.6 — 3.0 — —†
hp ≥ 750 Tier 1 2000 8.5 1.0 — 6.9 0.40
Tier 2 2006 2.6 — 4.8 — 0.15
† Not adopted, engines must meet Tier 2 PM standard.
See Table 3-1 for Tier 4 standards.

6
Harboring Pollution
DPFs, functioning with fuel that has as much as 500 parts per million sulfur. Thatsaid, reductions of pollutants are higher with the use of lower sulfur fuels. In fact,DOCs actually increase PM emissions when used with EPA off-road grade diesel,which has roughly 3,000 parts per million sulfur.
The installation of a DOC system is relatively straightforward and can be as simpleas installing a muffler replacement on a heavy truck. Nearly 20,000 DOCs have beeninstalled on urban buses and trucks in the United States and Europe. The earliesttrucks and buses retrofitted have accumulated more than 93,000 miles and have beenvirtually maintenance free. DOCs are also used in other parts of the world. In Mexico,for example, more than 8,000 heavy trucks have been retrofitted. Hong Kong recentlyembarked on a large retrofit program that involves 2,000 urban buses and more than40,000 medium-duty diesel vehicles. Hundreds of thousands of retrofits have beencompleted throughout the world.16
NOX CONTROL STRATEGIESWhile most advanced NOx reduction strategies are still under research and develop-ment, several others are already on the market for purchase. Exhaust Gas Recircula-tion (EGR) can reduce NOx by as much as 40 percent. Hundreds of buses have beenretrofitted with EGR in Europe, and many demonstrations are under way in theUnited States.17 EGR can increase PM emissions, and therefore should not be usedwithout a DPF or other PM control. LNCs require low sulfur diesel to achieve modestNOx reductions of 10 to 20 percent. A limited number of vehicles in the United Stateshave been retrofitted with this still improving technology.
COMBINED TECHNOLOGIESVarious diesel emission control strategies can be integrated into a single system. Oneintegrated strategy uses a DOC in combination with emulsified diesel fuel, a cleanerdiesel fuel described in detail below. Several terminal operators at the ports of LongBeach and Los Angeles have adopted this strategy for reducing diesel emissionsbecause it can quickly be integrated into existing operations with relatively lowupfront costs.
Another system that combines technologies uses a passive DPF in combinationwith a lean NOx catalyst (LNC). This retrofit system allows diesel units tosimultaneously achieve significant NOx, PM, CO, and ROG emission reductions.Prior to retrofitting the equipment, data logging of temperature profiles is necessaryto ensure that the duty cycle will result in exhaust temperatures that are high enoughfor the DPF to operate without clogging. The California Air Resources Board recentlyverified that one product that bundles a DPF with an LNC eliminates at least 85percent of diesel PM and 25 percent of NOx. Demonstrations of this controltechnology on construction equipment in Sacramento, California, have also provedsuccessful.18 LNCs are also available in combination with DOCs, achieving 25 percentreductions of both PM and NOx.

REDUCED TRUCK IDLINGIt is difficult to estimate the exact benefits of idling reductions from trucks becauseemissions and practices vary substantially with the size, location, and practices atspecific ports. Benefits are estimated in this report using emissions data and theassociated sources in Table B-3, and statistics from the Port of Los Angeles regardingthe number of containers that move through the port every day. In 2002, more than6.1 million TEUs moved in and out of the Port of Los Angeles. The port averages272 work days per year (52 five-day work weeks plus twelve weekend days duringthe late summer “peak” season). Therefore, an average working day sees the move-ment of 11,224 containers (approximately two TEUs equate to a “container”) in andout of the port. Truckers typically report spending one or more hours of idling timewhile running loads to and from the Port of Los Angeles. Assuming every truck thatcarried one of these containers idled for one hour, the estimated emissions would beas calculated in Table B-3. The proposed idle-reduction measure would decrease idletime from one hour in each instance to only 10 minutes.
The approximate emission reductions from this measure can be found in the lastrow of Table B-3. Nitrogen oxide (NOx) emissions from idling trucks at the Port ofLos Angeles would be reduced an average of nearly 1.5 tons a day, toxic PM would bereduced by 53 pounds per day, and emissions of the primary greenhouse gas, carbondioxide, would be reduced by nearly 85 tons per day.
In addition, the EPA estimates that the average truck wastes 0.8 to 1 gallon of fuelper hour of idling. Using the same assumptions used to calculate emission reductionsabove, we estimate that more than 9,200 gallons of fuel are wasted every day at thePort of Los Angeles, which accumulates to more than 2.5 million gallons of fuel wastedfrom unnecessary idling every year. This measure would save most of that wastedfuel, totaling more than 2 million gallons every year at the Port of Los Angeles.
TECHNICAL INFORMATION ON TUGBOAT RE-POWERSA number of tugboats have been repowered in California in recent years. The Port ofLos Angeles, the Port of Oakland, and the Carl Moyer Program have all subsidized
7
Strategies to Clean Up U.S. Ports
TABLE B-3Estimated Emissions From Idling
Average Truck’s Idle Pollutants COa CO2b VOCsa Nox
b PM10a
Grams/hour 94 8,224 12.5 144 2.57
Total tons per year 316 27,651 42 484 8.64
Reductions per year (tons) 263 23,043 35 403 6.7
a American Trucking Association Green Truck web site, www.truckline.com/air_emissions/1420.html as quoted inFrank Stodolsky, Linda Gaines, and Anant Vyas, “Analysis of Technology Options to Reduce the Fuel Consumption ofIdling Trucks,” Center for Transportation Research, Energy Systems Division, Argonne National Laboratory, Argonne,IL, June 2000, p. 31.
b U.S. EPA’s “Study of Exhaust Emissions from Idling Heavy Duty Diesel Trucks and Commercially Available Idle-Reducing Devices,” Certification and Compliance Division, Office of Transportation and Air Quality, Author: Han Lim,EPA420-R-02-025, October 2002, p. 9.

8
Harboring Pollution
tugboat repower projects. But based on a recent technical report that has not yetbeen published, we believe that the potential benefits of repowering tugs have beengenerally underestimated.19
This report contains data on existing engines and operations of ferry, tour boatand tugboat operators in the San Francisco Bay area. The report also includesdata on engine models, age, type of service, annual operating hours, and fuelconsumption. Emission rates for each engine were identified by contacting enginemanufacturers. While NOx emission rates were available for nearly all engines,emission factors for PM and other criteria emissions were scarce. Most existingmarine engines can be tuned for higher fuel economy (with higher NOx emissions)or low NOx emissions (with loss of fuel economy). It was assumed that current tugengines were tuned for high fuel economy. While data was acquired for both pro-pulsion and auxiliary engines, the analysis is focused on the much larger and higheremitting propulsion engines. Analysis is also focused on tugs with 1,500 horsepoweror larger propulsion engines, which are typically involved in cargo vessel escort andassist operations.
Data on operating hours was limited, and in some cases confidential, making itnecessary to estimate hours of operation for some tugs based on their type of serviceand similar data provided by the San Francisco Marine Exchange. SeaworthySystems, Inc. estimated the potential benefits of repowering by identifying potentialreplacement engines for each tug based on their experience with marine engines andtug operations. The emission rates of replacement engines were compared to theemission rates of currently installed engines. An estimate of emissions avoided wascalculated by assuming that each tug’s annual operating hours would remain con-stant after repowering.
Table B-4 below summarizes the emissions avoided by repowering varioustugboats, based on the data in the San Francisco Bay Area report.
Assuming the data collected are reasonably representative of tugs and theiroperation in other areas, tug engine repowering is a very cost-effective mitigationmeasure for ports working to substantially reduce NOx emissions.
TABLE B-4Emission Reductions From Tugboat Re-powers
AverageNOx
Average Average Average from CostNumber Annual NOx NOx Replacement per ton
Engine Size of Tugs Operating Emissions Emissions Engines of NOx
(HP) in Sample Hours (lbs/hr) (tons/yr) (tons/yr) Reduction Avoideda
1500-1999 8 2,688 96 129 67 48% $589
2000-2499 10 2,915 137 196 102 48% $447
2500+ 5 5,180 170 446 252 43% $223
a The estimate includes the capital cost of purchasing two new replacement engines per tug, but does not includethe cost of installation or the opportunity cost of taking the boat out of service. It does not include the cost orbenefits of replacing auxiliary engines.

9
Strategies to Clean Up U.S. Ports
FUEL CELLS (FOR SHORESIDE POWER)20
Fuel cell technology in marine applications offers many significant enhancementsover existing diesel generators. These include very low exhaust emissions, inherentlylow vibration and sound levels, and improved thermal efficiency (particularly at lowload levels). The U.S. Navy and many foreign navies are considering the use of inte-grated electric plants that employ fuel cells in future ship designs.
While ongoing studies are examining the use of fuel cells for ship propulsion,applications for fuel cells today may be limited to onshore power supply during shiphoteling, offshore platform auxiliary power, remote navigation, radar, and oceano-graphic data acquisition and transmission systems. Fuel cells for propulsion oftugboats, supply vessels, and commercial ships is technically feasible and has thecapability of maintaining high efficiency over a broad range of load requirements,but it is not yet commercially available. Issues such as availability of fuels andvarious physical and operating constraints must be considered for each application.Another consideration is how well fuel cells will perform relative to such competingsystems as diesel power plants. In the near term, fuel cells are likely to be competitivewith larger engines for tankers, container ships, and bulk carriers, where operationis at constant speeds and current high-efficiency, low-rpm diesel engines are used.Accordingly, fuel cells used for ship propulsion in the near future will likely be forthose applications where quiet operations are useful and where power settings arenot constantly changing.
Fuel cells are also available for auxiliary power. Auxiliary power units can provideelectricity to all systems aboard, including hotel services (lighting, plumbing, andpumps for water); bilge and ballast pumps; fuel transfer systems, cargo-handlingsystems; and navigation systems. At this time, less capital investment and less riskwould be required for these systems than it would be for ship propulsion systemsbased on fuel cells.
Fuel cells offer several other benefits for marine applications. For propulsionapplications, fuel cells have the advantage of modular design, which enablesflexibility in the arrangement of plant components, which could, in turn, leadto a more cost-effective layout of power and cargo spaces, and even of basic shipstructure. As with other electrical power plants, fuel cells might help mitigate themaneuvering problems of ships and tugs by enabling electrical power to be quicklyswitched to different locations—to reverse main propellers or to activate side thrustpropellers or water jets, for example.
Total efficiency improvements in the neighborhood of 10 to 20 percent above low-speed diesel powered engines will be realized for fuel cells. Typical efficiencies forlow-speed diesel power plants are in the neighborhood of 40 percent, while fuel cellssuch as the molten carbonate fuel cell (MCFC), which operates at higher tempera-tures than the phosphoric acid fuel cell (PAFC), have efficiencies of up to 55 percent.The solid oxide fuel cell (SOFC) is not currently available on the commercial market,but can achieve even higher efficiencies.
Significant progress has been made in the use of fuel cells for the power industry.At the present time, two technologies have been successfully employed in the

commercial market: the PAFC manufactured by United Technologies Company andthe MCFC manufactured by Fuel Cell Energy, Inc. A comparison of fuel cell tech-nologies is shown in Table B-5.
The current cost of fuel cells is estimated to be in the range of $4,000 per kW.21
While this cost is relatively high compared to the more conventional diesel tech-nology on the order of $300 to $500 per kW, the costs for fuel cells are projected to bein the range of $1,500 to $2,000 per kW in the next three to five years. With those costsin mind, several incentive programs have been adopted to assist in the commercial-ization of fuel cells. For example, the California Public Utilities Commission willprovide up to $2,500 per kW or 40 percent of the project cost for fuel cells operatingon nonrenewable fuels such as natural gas. This would reduce the cost per kW to$2,400 per kW. In addition to capital costs, operation and maintenance costs will runin the neighborhood of an additional $200 per kW.22
CLEANER MARINE FUELSMarine fuels used for international trips, including marine diesel oil (MDO) andmarine gas oil (MGO), are required to meet a minimum 60° Celsius flashpointspecification. The “flashpoint” specifications of non-marine lower sulfur fuels mayfall below the 60° Celsius specification. In fact, non-road and on-road diesel fuel inthe United States have a minimum 52° Celsius flashpoint, and the sulfur contentranges from 0.0015 percent (15 ppm) to 0.5 percent (5,000 ppm). However, in reality,the on-road and off-road fuel being sold by major U.S. suppliers has a much higherflashpoint. The 1996 average flashpoint was 73° Celsius for all blends of diesel soldin the United States.23
Vessel operators have argued that the lower specification for these fuels presentsan unacceptable risk, given the large quantities of fuel carried by large marinevessels, and would not comply with international treaties on ocean safety.24 In orderto accommodate the flashpoint requirements, British Petroleum has altered its fuelspecifications for ECD-1 (15 ppm sulfur content) to meet the 60° Celsius flashpoint.25
Other fuel providers in California are following suit. Lower sulfur distillates may also need different types of lube oil. This could be
overcome by installing an extra cylinder oil tank. Entec recently surveyed ship-builders to determine the costs associated with accommodating additional fuel
10
Harboring Pollution
TABLE B-5Fuel Cell Technologies
PEMFC PAFC MCFC SOFC
Ion Exchange Immobilized Liquid Immobilized LiquidElectrolyte Membrane Phosphoric Acid Molten Carbonate Ceramic
Operating Temperature 80°C 200°C 650°C 1,000°C
Electrical Efficiency 30–35% 36–38% 45–55% 45–50%
Overall Efficiency 50–60% 75–80% 75–80% 75–80%(Electrical + Thermal)
11
Strategies to Clean Up U.S. Ports
MARINE DIESEL STANDARDS
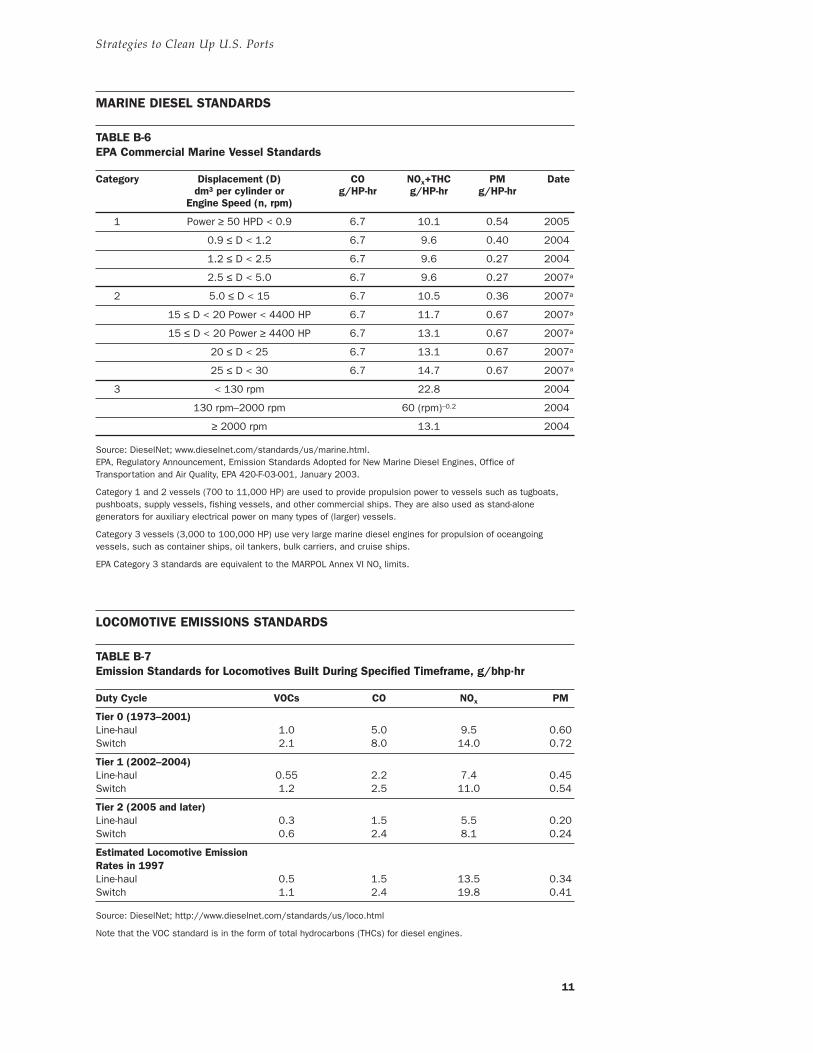
TABLE B-6EPA Commercial Marine Vessel Standards
Category Displacement (D) CO NOx+THC PM Datedm3 per cylinder or g/HP-hr g/HP-hr g/HP-hr
Engine Speed (n, rpm)
1 Power ≥ 50 HPD < 0.9 6.7 10.1 0.54 2005
0.9 ≤ D < 1.2 6.7 9.6 0.40 2004
1.2 ≤ D < 2.5 6.7 9.6 0.27 2004
2.5 ≤ D < 5.0 6.7 9.6 0.27 2007a
2 5.0 ≤ D < 15 6.7 10.5 0.36 2007a
15 ≤ D < 20 Power < 4400 HP 6.7 11.7 0.67 2007a
15 ≤ D < 20 Power ≥ 4400 HP 6.7 13.1 0.67 2007a
20 ≤ D < 25 6.7 13.1 0.67 2007a
25 ≤ D < 30 6.7 14.7 0.67 2007a
3 < 130 rpm 22.8 2004
130 rpm–2000 rpm 60 (rpm)–0.2 2004
≥ 2000 rpm 13.1 2004
Source: DieselNet; www.dieselnet.com/standards/us/marine.html.EPA, Regulatory Announcement, Emission Standards Adopted for New Marine Diesel Engines, Office ofTransportation and Air Quality, EPA 420-F-03-001, January 2003.
Category 1 and 2 vessels (700 to 11,000 HP) are used to provide propulsion power to vessels such as tugboats,pushboats, supply vessels, fishing vessels, and other commercial ships. They are also used as stand-alonegenerators for auxiliary electrical power on many types of (larger) vessels.
Category 3 vessels (3,000 to 100,000 HP) use very large marine diesel engines for propulsion of oceangoingvessels, such as container ships, oil tankers, bulk carriers, and cruise ships.
EPA Category 3 standards are equivalent to the MARPOL Annex VI NOx limits.
LOCOMOTIVE EMISSIONS STANDARDS
TABLE B-7Emission Standards for Locomotives Built During Specified Timeframe, g/bhp·hr
Duty Cycle VOCs CO NOx PM
Tier 0 (1973–2001)Line-haul 1.0 5.0 9.5 0.60Switch 2.1 8.0 14.0 0.72
Tier 1 (2002–2004)Line-haul 0.55 2.2 7.4 0.45Switch 1.2 2.5 11.0 0.54
Tier 2 (2005 and later)Line-haul 0.3 1.5 5.5 0.20Switch 0.6 2.4 8.1 0.24
Estimated Locomotive EmissionRates in 1997Line-haul 0.5 1.5 13.5 0.34Switch 1.1 2.4 19.8 0.41
Source: DieselNet; http://www.dieselnet.com/standards/us/loco.html
Note that the VOC standard is in the form of total hydrocarbons (THCs) for diesel engines.

storage. The available options are to install additional tank(s) or to split existingtank(s). So long as space is available, the cost for installing an additional tank(including all ancillary components) ranges from $30,000 to $95,000, depending onthe size of the ship.26 That price excludes the cost for lost cargo space and increasedfuel consumption due to the larger size of the vessel.
Furthermore, using appropriate lube oil in conjunction with the lower sulfur fuelwill alleviate corrosion.
12
Harboring Pollution

MODEL AQUATICRESOURCESPROTECTION PROGRAMFOR MARINE PORTS
This appendix contains the detailed Best Management Practices (BMPs) of themodel aquatic resources protection program for ports (“The Model Program”)
described in Chapter 3. The Model Program is organized in checklist form, sincethe stormwater issues are comprehensively covered by the Stormwater NationalPollutant Discharge Elimination System (NPDES) Permit under the Clean Water Actand the Stormwater Pollution Prevention Plans (SWPPPs) prepared under the permit.Shorelines, in-water, and overwater construction and maintenance permit issues arecovered by Army Corps of Engineers Section 404 and Section 10 permits, Section 401Water Quality Certification, state environmental and fish and wildlife agencies, localland-use jurisdictions (cities and counties), and Native American tribes, as applicable.
REFERENCES TO DETAILED BMP GUIDANCEA number of sources contain guidance for applying BMPs within the stormwaterelement, usually in a general industrial context. At the outset of the stormwaterNPDES program, the EPA outlined many practices in its publication Storm WaterManagement for Industrial Activities.27 A number of state environmental agencies havefollowed the EPA’s general pattern within comprehensive stormwater managementguidance handbooks. Two of the most up to date were issued within the last fewyears by the states of California and Washington.
BMPs within the shoreside and harbor element are less extensively catalogued. How-ever, the American Association of Port Authorities (AAPA) published an EnvironmentalManagement Handbook that covers a number of these areas, as well as a few storm-water topics and BMPs for construction, with convenient guidance sheets.28
The Model Program described here specifically cites the AAPA’s EnvironmentalManagement Practices (EMPs) in these cases. Environment Canada covered someof these elements with BMP guidance in “Best Management Practices (BMPs) forShip and Boat Building and Repair in British Columbia.”29 The Model Program alsocites these practices. Finally, the Code of Federal Register (CFR) has specified
13
APPENDIX C
HARBORING POLLUTIONStrategies to�Clean Up U.S. Ports
August 2004

regulations pertaining to fluid transfers to and from ships, which are cited under theappropriate topics.
MODEL AQUATIC RESOURCES PROTECTION PROGRAM ELEMENT 1: STORMWATER
A. Documentation and Analysis (Responsibility: port authority, tenants ifco-permittees)
1. Mapping and associated descriptive information should be assembled for thefollowing features:a. Facility boundaries and adjacent propertiesb. Topographyc. Surface watersd. Discharge pointse. Conveyance and discharge structures, such as storm drains and spoutsf. Drainage catchments and pathways where the runoff flowsg. Buildings on the terminal site from which runoff may flowh. Locations of potential contact between pollutants and rain or runoff
associated with the port’s industrial and commercial operations such as� loading, unloading, handling, and storage areas for materials (raw materials,finished products, etc.);� loading, unloading, handling, and storage areas for wastes (hazardous andnonhazardous);� tanks and drums for storage of oils and other liquids; and� outdoor manufacturing areas, areas subject to deposition of dusts orparticulate air emissions
i. Vehicle and equipment service areas (e.g., fueling, washing, steam cleaning,repairing)
j. Transit, parking, loading, and unloading areas for truck and rail transportk. General parking areas, access roads, other paved areasl. Cargo loading and unloading and transfer areas using stationary (e.g., cranes)
and mobile (e.g., forklifts) equipmentm. Areas of existing or potential erosion and/or dissolution of pollutants from
stockpiles and bare soiln. Port operations and maintenance activities, such as
� road maintenance;� sewage system operation and maintenance;� storm drain system operation and maintenance; and� general facilities and equipment maintenance (e.g., docks, piers, landscaping,utilities, fencing, buildings, mechanical facilities, warehouses, service vehicles)
o. Existing pollution control structures (for example, an oil/water separator orother control device)
p. Subsurface injection wells
14
Harboring Pollution

2. A thorough, systematic, and well-documented process of analysis is necessary toidentify existing and potential problems and to assess possible solutions. Theanalysis should assess:a. The types and extent of pollution risks posed by features described above
(1h–n) in the preceding listb. Recorded incidents of pollutant spills and leaks in the outdoor environmentc. Monitoring data showing the existence or lack of water pollution and eco-
logical problemsd. Alternatives for preventing identified problems or treating runoff to the extent
problems cannot be entirely prevented (refer to section B, Practice Specification).e. Selected alternatives and justification (BMPs chosen from the analysis under
2d should be matched to the problems identified in steps 2a-c)
B. Practice Specification (Responsibility: port authority, tenants if co-permitteesexcept as noted) Note: BMPs are indicated in italics.
1. Operational Practices. The following facility-wide practices should be implementedto prevent the development of stormwater pollution problems to the maximumextent possible:a. Pollution prevention personnel. Specific personnel should be assigned
responsibility for each aspect of the stormwater management program.b. Preventive maintenance. There should be a formal program of preventive
maintenance for the purpose of avoiding equipment deterioration and failurethat causes spills and leaks of pollutants.
c. Good housekeeping. There should be a policy for maintaining an orderly, cleanfacility and instruments to implement it (e.g., incentives, publicity, signs, draininlet stenciling, regular sweeping).
d. Spill response. There should be a clear, comprehensive, organized program torespond properly if a spill occurs, including: (1) whom to notify, (2) who is incharge, (3) specific instructions for different materials that could be spilled,(4) spill containment procedures, (5) easy-to-find-and-use spill clean-up kits,(6) how a spill will be prevented from getting into a drainage system (e.g., valving,diversion, absorption), (7) a disposal plan, and (8) a worker training program.
e. Illicit connection (IC) and illegal discharge (ID) control. There should bedocumentation of a program to review the storm drain system to find andremove connections that would introduce unallowable non-stormwaterdischarges (IC control). There should be an ongoing program to avoid ICreconnections and dumping of liquid or solid wastes into or where they couldenter the storm drain system (ID control).
f. Improved materials and waste management. The potential for materials used andwastes produced in the port can be reduced by such management strategies assubstitution of less polluting products for more contaminating ones anddecreasing waste through recycling and reuse of materials.
g. Inspection. The inspection program should be organized on three levels:
15
Strategies to Clean Up U.S. Ports

(1) annual comprehensive site compliance evaluation (site walk by supervisoryexperienced inspector, documentation review, completion of comprehensivechecklists, follow-up actions); (2) regular and ongoing program to findpotential problems before they occur (e.g., deteriorating equipment that mayleak or spill, BMPs needing maintenance); (3) record keeping. There should bea comprehensive system for recording and accessing information gatheredfrom carrying out all aspects of the stormwater management program.
h. Employee training. There should be a formal, documented training programfor all aspects of the stormwater management program and for all personnelwho perform or supervise any function that could affect runoff water qualityappropriate to the level and responsibilities of the employees. For example,outdoor workers may get “tailgate training” in why it is important and inhow to prevent polluting releases in their work. Supervisors may getclassroom training in assigning maintenance tasks for a treatment BMP.
2. Source Control Practices. These practices in some way prevent pollutants fromcoming into contact with rainfall or runoff. They should be used to the maximumextent that is appropriate to the port’s facilities and activities. The documentationand analysis should assess the applicability of appropriate practices on this list forthe features posing pollutant risks, and the SWPPP should specify their locationsand parameters. (Responsibility: port authority, tenants if co-permittees,contractors to port authority or tenants)a. Preferred source control practices applying to the port’s industrial and
commercial operations are:� Alter polluting activity (e.g., substitute nonpolluting for polluting material)� Cover activity (for example, stockpiles of petroleum coke or other potentiallypolluting substances or materials)� Contain activity (e.g., secondary containment vessel to catch leak or spill ofcontents of stored liquid; prevent runoff from draining out of contained area,with later evaporation or removal, treatment, and proper disposal. Note thatthroughout The Model Program, secondary containment means providing avolume at least equal to 110 percent of the volume of the largest stored con-tainer or 10 percent of the total stored volume, whichever is higher.) � Segregate activity (e.g., slope so that water running on the surface cannot passover an area that may be contaminated)
Note: AAPA’s EMPs Nos. O-11 and O-12 cover vehicle and equipment maintenanceand vehicle washing, respectively, from a port perspective.
b. Additional source control practices applying to the port’s industrial andcommercial operations that should be used only if no preferred practice canbe implemented:� Discharge stormwater to process wastewater treatment (with assurance thatstormwater discharge will not compromise treatment)
16
Harboring Pollution

� Discharge stormwater to sanitary sewer (with appropriate permits)� Discharge stormwater to dead-end “sump” or collecting basin (with laterevaporation or removal, treatment, and proper disposal)
c. Source control practices applying to areas subject to erosion:� Cover stockpiles� Erosion control for bare soils (for example, planting drought resistant vegeta-tion to hold soil in place)
d. Source control practices applying to port operations and maintenanceactivities (Responsibility: port authority, contractors for these activities):� Road maintenance BMPs such as sweeping (to remove dirt and potentialpollutants from runoff stream) and saw-cutting activities management (toavoid deposition of potentially polluting particles into runoff); paving activi-ties management; concrete activities management� Sewage system operation and maintenance BMPs such as reporting andrepairing blockages, leaks, ruptures, etc. and containment and clean up ofspills, leaks, and overflows� Storm drain system operation and maintenance BMPs such as cleaning ofcatch basins, drain inlets, conveyances, pump station forebays and catch basinstenciling and signage� General facilities and equipment maintenance BMPs. The preferred BMPsapplying to the port’s industrial and commercial operations also apply, asappropriate, to general facilities and equipment maintenance. AAPA’s EMPNo. O-2 covers buildings and grounds maintenance.
3. Treatment Practices. Each area or activity for which operational and source controlBMPs cannot fully prevent contact between pollutants and rainfall or runoffshould be served by a treatment BMP. The documentation and analysis shouldassess the need for and applicability of appropriate practices on this list, and theSWPPP should specify their locations and parameters. In both groups 3.a and 3.b,BMPs are listed roughly in the order of their effectiveness in reducing the concen-trations and mass loadings of pollutants, assuming proper selection, design, andoperation. However, performance varies for different pollutants. BMPs shouldalways be selected according to treatment objectives to prevent the discharge fromcausing or contributing to a violation of water quality standards.a. Practices most suitable for relatively highly developed port areas
Much of the land in port areas is usually densely developed and provideslittle land for the types of treatment BMPs that typically serve residential andother less developed areas. The BMPs in this group require little or no surfacespace, and the space can be used for more than one purpose. � Confined-space infiltration. Capable of infiltrating all of the runoff for thedesign rainfall condition; infiltration represents the only treatment BMP thatcan be 100 percent effective in reducing pollutants to surface water for thedesign condition; must be carefully sited, designed, constructed, and operatedto avoid infiltration failure or groundwater contamination. Types: Infiltration
17
Strategies to Clean Up U.S. Ports

trench with below-ground introduction of runoff via a pipe and subsurfaceinfiltration gallery.� Porous pavement. Allows infiltration of runoff into the pavement, and fromthere into the underlying soil; can be as effective as other types of infiltration.Types include: porous concrete, porous asphalt, which has coarse aggregateproducing substantial pore space, is subject to clogging by soil and otherparticles and should generally be avoided in areas where they tend to begenerated. Another type is open grid and modular pavements or blocks withopenings filled with gravel or soil and sometimes vegetation. Open grid andmodular pavements are best for areas with light vehicle loading and thereforeprobably have limited applicability in port areas.� Sand filter. Box with presettling chamber followed by sand bed; relativelyeffective, especially for solids and oils.� Multi-chamber treatment train. Filtration with enhanced capability to settlesolids and remove certain organic contaminants; intended especially for areasthat tend to generate relatively toxic pollutants.� Wet vault. Underground equivalent of surface pond; lack of light, vegetation,and associated biological activity reduces effectiveness for most pollutantsrelative to surface pond.� Extended-detention vault. Underground equivalent of surface extendeddetention pond; similar in effectiveness to surface pond (moderate) becausebiological activity not important in short residence time available.� Oil/water separator. Targeted at a single category of pollutants, unlike otherBMPs listed; stormwater runoff often has lower oil concentrations than deviceis capable of treating; therefore, only useful in areas that generate relativelyhigh concentrations.� Commercially marketed filtering devices (e.g., StormFilter® by StormwaterManagement, Inc.). Has used various filtering media in modular canisterarrangement; unless oversized, contact time is too short for highest levels ofpollutant removal.� Commercially marketed hydrodynamic devices (e.g., Aqua Swirl ConcentratorTM
by Aqua Shield, Inc.; Continuous Deflective Separation (CDS) unit by CDSTechnology, Ltd.; Downstream Defender’ by HIL Technology, Inc.; Stormceptor®by Rinker Materials, Inc.; Vortechs System by Vortechnics, Inc.). Uses forcesproduced by the velocity of water in circular motion as well as gravity toseparate particulate and floatable pollutants; capable of removing onlytrash and the largest particles typically present in stormwater, along withsome oil and floatables; should be used only for these purposes, sometimesas a pretreatment to remove the largest materials prior to additionaltreatment.� Commercially marketed gravity settlement devices (e.g., BaySaver by BaySaverStormwater Treatment Systems, Inc.). Similar purpose and limitations as hydro-dynamic devices but rely on gravity and density differences of materialswithout forces produced by velocity.
18
Harboring Pollution

� Commercially marketed multi-facet treatment systems (e.g., AquaFilter by AquaShield, Inc.; StormTreatTM by StormTreat Systems, Inc.). Combine processes(hydrodynamic and filtering for AquaFilter and gravity settling and wetlandplant treatment for StormTreatTM) to get added effectiveness; logistic limita-tions in enlarging limit to treating relatively small flows as a practical matter.� Commercially marketed drain inlet inserts (many manufacturers). Generally havesome type of filtering medium in a container that is suspended within a dropinlet to contact runoff as it falls; some filters catch only solids and then justtrash the largest particles; others with special media can remove such pol-lutants as metals and oil, but contact time is so limited that efficiencies arelow; inserts require frequent maintenance, therefore, they should be usedonly for purposes consistent with their abilities in short-term service or insituations where the necessary maintenance attention can be assured.
b. Practices most suitable for less-developed port areas
Ports often have land outside of the location of their most intense operationsthat could be used for treatment BMPs requiring more space. Whether or notthe port can and chooses to place treatment BMPs there depends on thecharacteristics of the location, if stormwater can be collected and conveyed tothe site, and the competition for space for future development and settingaside land to preserve or restore natural resources.� Open-space infiltration. See note on confined-space infiltration above. Typesinclude an infiltration trench with surface introduction of runoff in sheet flowand an infiltration basin.� Constructed wetland. Wetland built outside of jurisdictional waters and oper-ated for the primary purpose of treating stormwater and/or wastewater;relatively effective.� Wet pond. Pond with a permanent or semipermanent pool giving a longhydraulic residence time for treatment processes to occur; relatively effective.� Extended-detention pond. Holds water for 48 to72 hours; reduced hydraulicresidence time relative to wet pond lowers efficiency to moderate level.� Biofiltration. Vegetated with dense, fine plants (usually grasses); can berelatively effective with significant infiltration; efficiency varies dependingon pollutant with little infiltration. Removal of solids and oils are relativelyhigh, while removal of nutrients and dissolved pollutants are relativelylow. Types include biofiltration swale channels, generally with flow atmeasurable depth, and biofiltration strips, which have a broad surface withthin sheet flow.
4. Non-Stormwater Discharges. (Responsibility: port authority, tenants if co-permittees)Non-stormwater discharges are introductions of any liquid other than rainfallrunoff into a storm drain system, including water from other sources. Thedischarge can be via a permanent or semipermanent connection, direct dumpinginto a storm drain inlet, or dumping in a location that eventually drains to thestormwater system. The subject of non-stormwater discharge is a special facet of
19
Strategies to Clean Up U.S. Ports

illicit connection and illegal discharge control. Regulations under the Clean WaterAct recognize some allowed non-stormwater discharges that are not expected topollute (e.g., air conditioner condensate) or are emergencies (e.g., water used tofight a fire). Otherwise, stormwater NPDES permit users are required to certifyelimination of non-stormwater discharges based on a specific program of observa-tions and/or testing (e.g., dye testing). A model program for non-stormwaterdischarges would have certification, including:a. Identification of potential non-stormwater dischargesb. Description of test results and evaluation of the presence of any non-
stormwater dischargec. Evaluation criteria or test method usedd. Date of testing or evaluatione. Drainage points observed during the testing or evaluationf. Maintenance program for hose connections and valves to prevent non-
stormwater generation through leakage
5. Monitoring (Responsibility: port authority or other public agency undercooperative agreement with port authority)Monitoring required by the stormwater NPDES permit is infrequent and verybasic. Performed at that level, it would likely fail to diagnose many problems. Thebasic program involves only quarterly observations of visible signs of pollutionand a grab sample of stormwater runoff. Some ports perform their own moni-toring, while external agencies conduct it at others. A model monitoring programwould encompass:a. Flow-proportional composite sampling and analysis of stormwater runoff
discharges representative of the overall facility for a selection of storms duringthe year. (What is representative depends on the climatic characteristics ofthe location. The storm selection should represent storms following relativelyextended dry periods, relatively large rainfall quantities, and events withrelatively high rainfall intensities. Generally, at least 12 storms should besampled each year, but in semiarid climates with a limited number of eventsit is difficult to achieve this number. In these cases, the target should be atleast one-third of the annual rain storms.)
b. Sampling and analysis of receiving water qualityc. Sampling and analysis of the receiving water’s sedimentsd. Monitoring of biota inhabiting the receiving water to determine trends in key
populationse. Selected monitoring of best management practices (e.g., to trace problems,
establish effectiveness of new technologies)f. Special monitoring for projects like dredging and filling
The monitoring programs should be fully documented in terms of:a. Monitoring objectivesb. Sampling program design (locations, times, and methods of sampling)
20
Harboring Pollution

c. Field and laboratory analyses performed on samples and the methods used(analyses should be related to the potential pollutants)
d. Quality assurance/quality control programe. Data analysis methodsf. Available results and comparison to applicable regulatory criteriag. Interpretations of results and conclusions reached to date
MODEL AQUATIC RESOURCES PROTECTION PROGRAM ELEMENT 2:SHORESIDE AND HARBORMany activities in a port are conducted adjacent to, over, and in the water. Avoidingor minimizing water pollution from these activities depends largely on preventivesource controls. The lists in sections A and B represent practices employed some-where in the shipping industry, although the practices are not yet universal or evennecessarily widespread, and are not applicable to every situation.
Ports are taking some initiative in protecting and improving or restoring theaquatic natural resources under their jurisdictions. These areas are subject tooversight by a multitude of agencies administering a wide variety of laws andregulations. Section C presents some measures that ports can take in this regard, asappropriate to their specific setting and circumstances.
Note: BMPs are indicated in italics.
A. Ship Servicing Source Controls (Responsibility: port authority or itscontractor, except as noted; quite often these functions are the responsibilityof the shipping line or the terminal operator or their contracted providers)
1. Ship fueling—refer to 33 CFR 154 (Responsibility: fuel barge operator, shippingline, or fueling facility operator)a. Prohibition of waterside fueling, where spill and fire risks are high.b. Special care in waterside fueling by barge. (Note: Barge fueling can offer the
advantage of requiring only one fuel hose connection and disconnection,when many spills occur, compared to fueling with many tanker trucks. Specialcare involves increased presence of fire department personnel inspecting theoperation and ready provisions to localize any potential spill by containment.)
c. Automatic shutoff nozzles and fuel/air separation.d. Other specific practices. Refer to AAPA EMP No. O-6.
2. Liquid product loading and liquid waste unloading—refer to 33 CFR 154, 155, and158 and Environment Canada BMPs Nos. 3.1-3.9 and 4.1–4.3
a. Stop valve for each connection.b. Sanitary sewer connection or pump-out facilities and trucks to transport
for treatment off-site.c. Bulk storage and handling—liquid practices. Refer to AAPA EMP No. O-4.d. Chemical storage and handling—non-bulk. Refer to AAPA EMP No. O-5.
21
Strategies to Clean Up U.S. Ports

3. Solid product loading and solid waste unloading (Responsibility: shipping line,terminal operator, or port authority)a. Ship and shore solid waste handling. Refer to AAPA EMP No. O-8.b. Bulk storage and handling—dry. Refer to AAPA EMP No. O-3.c. Automobile storage and transport. Refer to AAPA EMP No. O-1.
4. Ballast water (Responsibility: shipping line, terminal operator, or port authority)a. Discharge prohibition (normally, now implemented by requiring deep-water
ballast exchange before reaching port).b. Collect, treat onshore, and recycle or discharge.c. On-board antibiotic measures (e.g., filtration; extermination by agitation or
salinity alteration; chemical, thermal, ultrasound, or ultraviolet light treatment).
5. Bilge water (Responsibility: shipping line, terminal operator, or port authority)a. Discharge prohibition (if oily or if any solvents, detergents, emulsifying agents,
or dispersants added).b. Collect, treat (to ≤10 miligrams/liter effluent oil and grease), on-site, and recycle or
discharge.c. Collect and treat off-site.
6. General ship maintenance (Responsibility: shipping line, terminal operator, orport authority)a. Vessel repair and maintenance BMPs. Refer to AAPA EMP No. O-13.
7. Routine ship cleaning (Responsibility: shipping line, terminal operator)a. Block scuppers; collect wash water and discharge to approved onshore facility with
treatment. Note: A scupper is a hole on the side of a boat that allows water,such as that from large waves splashing on board, to drain from decks.
8. Hull washing operations (in preparation for maintenance; usually, high pressureand sometimes ultra-high pressure)a. Prohibit on tide grids unless there is a collection sump with pump out for treatment.b. Restrict to areas where wash water can be contained (clean up area prior to washing
operation).c. Contain, collect, and treat wash water [Note: Practices vary with different
configurations (e.g., dry dock, marine railway, various lifts) and water volumeand solids content; refer to Environment Canada BMP No. 1.1.].
9. Abrasive blasting operationsa. Prohibit on tide grids.b. Shrouding for complete vessels or major portions thereof (Note: Practices vary with
different configurations [e.g., dry dock, marine railway, various lifts], but allrequire support frames and secure fastening to contain grit and dust; refer toEnvironment Canada BMP 1.2.).
22
Harboring Pollution

c. Permanent or temporary shelter with dust control and venting for components or parts.d. Convert to alternative.
� Ultra-high pressure wash—Refer to hull washing operations for BMP)� Wetted grit chemically treated to bind heavy metals.
e. Store clean blast material in covered, contained area away from water.f. Dry methods for spent blast material clean up.g. Prevention of spent blast material tracking by vehicles.h. Store spent blast material in covered, contained area away from water—Refer to
Environment Canada BMP Nos. 1.3-1.6.i. Recycle spent blast material (e.g., raw material for cement manufacture).
10. Other surface preparation (sanding, scraping, stripping)—Refer to EnvironmentCanada BMP Nos. 1.7-1.9a. Dustless sander.b. Tarp under blocked vessel.
11. Coating operations (e.g., painting)a. Alternative, nontoxic antifouling compounds (formulations preventing marine
organism attachment, instead of containing heavy metal toxins that killorganisms; non-solvent paints).
b. Shrouding for complete vessels or major portions thereof (Note: Practices vary withdifferent configurations [e.g., dry dock, marine railway, various lifts].� Tarp under blocked vessel.� Unless shrouded, use only rollers or brushes.� Use covered, contained mixing shelter away from water.
c. Other specific practices—Refer to AAPA EMP No. O-7 and Environment CanadaBMP Nos. 2.1-2.10.
12. Ship dismantling or demolitiona. Ship breaking BMPs—Refer to AAPA EMP No. O-15.
13. Port and contractor employee education
14. Ship personnel education
B. Harbor Operations Source Controls (Responsibility: port authority or itscontractor)
1. Pilingsa. Replacement of creosote-coated wood with concrete or steel.b. Use of nontoxic hydraulic fluid for pile driving.
2. Dredginga. Timed to minimize ecological impacts.
23
Strategies to Clean Up U.S. Ports

b. Silt curtain (impermeable barrier; most effective in reducing turbidity in still,nontidal waters).
c. Gunderboom (barrier to solids, but permeable to water; most effective inreducing turbidity when not operated in tidal flow).
d. Clamshell or specially designed dredge, operated with limitations on ascendingvelocity, multiple bites, and bottom stock piling (most effective in reducingturbidity with relatively soft sediments of uniform consistency).
e. Onshore confined disposal facility providing treatment for water.f. Other specific practices—Refer to AAPA EMP No. O-16.
3. Tug and other harbor craft operationsa. Replacement of two-stroke with four-stroke enginesb. Protection of marine mammals and sensitive aquatic habitats—Refer to AAPA EMP
No. O-9
4. Port and contractor employee education
C. Aquatic Natural Resources Stewardship (Responsibility: port authority)Note: These practices represent broad themes and are not detailed in any waybecause of their site-specific nature.
1. Removing barriers to migrating fish2. Nearshore habitat rehabilitation3. Estuarine wetlands rehabilitation4. Freshwater wetlands rehabilitation5. Contaminated marine sediment removal6. Contaminated onshore soil removal
24
Harboring Pollution

INTERNATIONALRULES AND TREATIES
The following summarizes the primary international laws, treaties, conventions,and annexes regulating the marine environment: the Law of the Sea Convention,
the IMO MARPOL Convention of 1973 & 1978, the International Convention on theControl of Harmful AntiFouling Systems on Ships 2001 (known as the AFSConvention), several European Union Directives, the European Union SustainabilityPolicy on Transportation, and the “ECOPORTS” Project.
LAW OF THE SEA CONVENTION30
The Law of the Sea Convention (LOSC), first created in 1958, is generally regarded asthe central international law governing most aspects of navigation and the protectionof the marine environment. The United States is not a party to the LOSC. However,the United States respects de facto portions of the LOSC, including the definitions ofExclusive Economic Zones.
The LOSC contains a “no harm” policy obligating members to apply preventivemeasures “to protect and preserve the marine environment” (LOSC Article 192) andto ensure that activities within their jurisdiction or control do not cause damage tothe environment of other states or to areas beyond the limits of national jurisdiction(LOSC Article 194(2)). The LOSC deals with all sources of pollution, including airpollution, that affect the marine environment. But it is not geared toward protectingthe terrestrial environment from pollution from ships.
IMO MARPOL CONVENTION OF 1973 & 1978The Protocol of 1978, commonly known as MARPOL and originally known as the 1973International Convention for the Prevention of Pollution From Ships, is the main inter-national convention covering pollution prevention of the marine environment by shipsfrom operational or accidental causes. Updated by additional amendments since itsinception, MARPOL comprises six “annexes.” In its original form, MARPOL addressedonly oil pollution issues, but expanded its coverage to tanker safety and pollutionprevention in 1978 following a spate of tanker accidents. Table D-1 outlines MARPOL’sannexes. The United States is party to only four. MARPOL’s 162 member states arerequired to accept Annexes I and II, while the remaining Annexes are voluntary.
25
APPENDIX D
HARBORING POLLUTIONStrategies to�Clean Up U.S. Ports
August 2004

Annex I: Prevention of Oil PollutionOil pollution of the seas was recognized as a problem in the first half of the20th century, and various countries introduced national regulations to controloil discharges within territorial waters. In 1954, the International Convention forthe Prevention of Pollution of the Sea by Oil (OILPOL) sought to address pollutionresulting from the two major causes of oil pollution-routine tanker operations andthe discharge of oily wastes from machinery operations. OILPOL took force in 1958,establishing “prohibited zones” extending at least 50 miles from the nearest land,in which the discharge of oil or oily mixtures was forbidden. It also required “con-tracting parties” to move to provide facilities to receive oily water and residues.OILPOL was expanded and further strengthened with amendments in 1962, 1969,and 1971, and was eventually incorporated into MARPOL as Annex I.
Annex I went into force in 1983, making oil discharges illegal in all but extremelylimited circumstances. It designated “special areas” where oil discharges are com-pletely prohibited.31 These areas deemed highly vulnerable to oil pollution, includethe Mediterranean, Black, Baltic, and Red seas, and the “Gulfs area” (the Persian Gulfand Gulf of Aden). Under Annex I, all oil-carrying ships are required to be capable ofretaining oily wastes on board. In 1978, Annex I was strengthened to require segre-gated ballast tanks (SBTs) on all new midsize tankers (20,000 to 70,000 dead weighttons).32 SBTs also were required to be positioned so that they would help protectcargo tanks in the event of a collision or grounding. Finally, 1992 amendments toAnnex I mandated double hulls on new oil tankers and established a double-hullretrofit phase-in schedule for existing tankers.
Annex II: Control of Bulk Liquid Substances Other Than OilAnnex II details the discharge criteria and measures for the control of pollutionby “noxious liquid substances” (i.e., chemicals) carried in bulk. Approximately250 chemicals and other liquids, including wine for example, are covered by thismeasure, which came into force in 1987. The discharge of their residues is allowedonly to reception facilities unless certain concentrations and conditions, which varywith the category of substances, are met. Residues containing noxious substances
26
Harboring Pollution
TABLE D-1MARPOL Annexes, Dates of Entry into Force and U.S. Participation
Measure Date of Entry U.S.into Force Participation
Annex I Prevention of Oil Pollution 1983 Yes
Annex II Control of Pollution From Noxious Liquid Substances 1987 Yesin Bulk
Annex III Pollution Prevention for Harmful Substances Carried 1992 Yesin Packaged Form
Annex IV Prevention of Sewage Pollution From Ships September 2003 No
Annex V Pollution Prevention for Garbage From Ships 1988 Yes
Annex VI Prevention of Air Pollution From Ships May 2005 No

cannot be discharged within 12 miles of any coastline. More stringent dischargerestrictions apply to the Baltic and Black sea areas.
Annex III: Prevention of Pollution from Harmful Substances in Packaged FormAnnex III went into force in 1992 and was the first of several voluntary measures.Member states ratifying MARPOL must adopt Annexes I and II but can choose notto accept the remaining four annexes even if the annexes have met the minimumrequirements for “entry into force.”. As a result, member states have taken muchlonger to adopt Annexes III through VI. Annex III establishes requirements for certainstandards on packing, marking, labeling, documentation, stowage, quantity limita-tions, exceptions, and notifications for preventing pollution from harmful substances.Under its terms, all incidents involving the discharge of harmful substances inpackaged form into the sea must be reported. The United States is a party to this annex.
Annex IV: Prevention of Sewage Pollution From ShipsAnnex IV went into force in September 2003. It imposes requirements for controllingsewage discharge into the sea. Ships are prohibited under its terms from dischargingsewage within four miles of land, unless they have one of three specified onboardadvanced treatment plants. Sewage must be fully ground up and disinfected beforedischarge within four to twelve miles offshore. The annex applies to most new largeships, while existing large ships have five years to comply. While the United States isnot a party to this annex, the federal Clean Water Act regulates ship sewage in U.S.territorial waters.33
Annex V: Prevention of Dumping Garbage From ShipsAnnex V went into force in 1988. It prohibits the disposal of garbage from ships incoastal waters and “special areas,” and restricts the manner in which garbage maybe disposed of in general. The annex requires that log books of incineration anddischarge be kept. The requirements are much stricter in a number of “special areas,”including the Baltic, Black, Mediterranean, Red, and North seas; the Persian Gulf andGulf of Aden; and the Caribbean and Antarctic areas. Most important, the annexcompletely bans dumping all forms of plastic into the sea. Plastics can take as long as450 years to biodegrade in seawater.34 Unfortunately, the dumping of garbage into thesea is still a common practice; recent surveys carried out in the United States havefound up to 10 tons of garbage per mile of coastline. The United States is a party tothis annex.
Annex VI: Prevention of Air Pollution From ShipsOriginally adopted in 1997, in May 2004, Annex VI garnered the requisite number ofinternational signatories to lead to its “entry into force” starting in May 2005. Thisannex establishes limits on several air pollutants generated by ships, although it doesnot cover several of the most harmful, including particulate matter, volatile organiccompounds, and carbon monoxide. The EPA passed similar standards for large U.S.marine vessels in January 2003. In May 2003, Annex VI was sent to Congress for U.S.
27
Strategies to Clean Up U.S. Ports

ratification; however, at the time of this writing, the U.S. had not yet ratified.35 Oncein effect, Annex VI will:
� Set limits on sulfur oxide (SOx) and nitrogen oxide (NOx) emissions from shipexhausts;36
� Prohibit deliberate emissions of ozone depleting substances;� Institute a global cap of 4.5 percent (45,000 parts per million) on the sulfur content offuel oil and require the IMO to monitor the worldwide average sulfur content of fuel;� Allow for the creation of special “SOx Emission Control Areas,” where morestringent controls on sulfur emissions will be imposed; and� Prohibit the onboard incineration of certain products, such as contaminatedpackaging materials and polychlorinated biphenyls (PCBs).
In the SOx Emission Control Areas, such as the Baltic Sea, ships have two choices.They may either use fuel oil with a sulfur content that does not exceed 1.5 percent(15,000 parts per million), or they may control their SOx emissions with an exhaust-gas cleaning system or with other technologies.
Prohibited ozone depleting substances include halons and chlorofluorocarbons(CFCs). New installations containing ozone depleting substances are prohibited onall ships, but hydro-chlorofluorocarbons (HCFCs) remain permissible until 2020.These requirements are in accordance with the Montreal Protocol of 1987, an inter-national environmental treaty, under which nations agreed to cut CFC consumptionand production in order to protect the stratospheric ozone layer.37
EnforcementViolations of MARPOL are punishable either under the laws of a nation party tothe convention, or under the law of the nation associated with the offending vessel.With the exception of very small vessels, ships on international voyages must carryvalid international certificates to present at foreign ports as evidence that theycomply with MARPOL. If inspecting authorities find evidence of an inaccurate,fraudulent, or missing certificate, they may detain the ship until they are satisfiedthat the ship can proceed to sea without presenting an unreasonable threat to themarine environment.
INTERNATIONAL CONVENTION ON THE CONTROL OF HARMFUL ANTIFOULINGSYSTEMS ON SHIPS IN 2001The International Convention on the control of harmful antifouling systems on ships(the AFS Convention), adopted by the IMO in 2001 and signed by the United States in2002 (but not yet ratified by Congress), will prohibit the use of harmful “organotins”in anti-fouling paints used on ships and will establish a mechanism to prevent thefuture use of other harmful substances in antifouling systems.38 Under the termsof the new AFS Convention, participating nations are required to prohibit and/orrestrict the use of harmful antifouling systems on ships flying their flag or otherwise
28
Harboring Pollution

operating under their authority, as well as on ships that enter a port, shipyard, oroffshore terminal of a participating nation.
Since January 2003, the application of organotin-based systems has been banned,fulfilling one of the tasks (Chapter 17 of Agenda 21) developed by the 1992 RioConference on Environment and Development. The harmful environmental effects oforganotin compounds were first recognized by the IMO in 1989. One year later, theIMO Marine Environment Protection Committee (MEPC) adopted a resolution thatrecommended that governments adopt measures to eliminate the use of antifoulingpaint containing tributyltin (TBT), one of the main organotins on nonaluminumhulled vessels of less than 25 meters in length, and eliminate the use of antifoulingpaints with a leaching rate of more than four micrograms of TBT per day. Forinformation on non-toxic alternatives to TBT, see Chapter 1.
Under the AFS Convention, these restrictions will tighten in January 2008, andships will be required either to be free of external paints with TBT on their hulls,external parts, or surfaces, or to apply a coating that forms a barrier to suchcompounds leaching from the underlying noncompliant antifouling systems.
The AFS Convention applies to all ships, including fixed and floating platforms,floating storage units (FSUs), and Floating Production Storage and Offtake units.
EUROPEAN UNION DIRECTIVES AND INITIATIVESThe European Union has issued several directives affecting the shipping and portoperations of its member nations.
Waste ReceptionThe Waste Reception Facilities at Ports (Directive 2000/59/EC) EU Directive requiresall member states to ensure that ports are equipped with reception facilities that canadequately handle all wastes from ships that normally call at those ports.39 Thefacilities are to be designed to minimize delay for vessels and to meet the needs ofships of all sizes calling at the port. The port authorities are also required to have awaste reception and handling plan.
This EU directive adopts a “polluter pays” principle, passing the cost of receptionand waste management onto shippers. To prevent dumping of wastes as a way toavoid paying fees at reception facilities, every vessel is required to contribute to thecost of facilities and treatment, whether or not it discharges waste.40 While thisapproach does not reward vessels that minimize waste, vessels may be charged alower fee if they demonstrate that they have implemented management practices oronboard technologies that reduce the amount of waste generated.
Vessel MonitoringThe EU’s Vessel Monitoring Directive (2002/59/EC) establishes a monitoring systemto prevent accidents and pollution at sea, and to minimize shipping-related harm to themarine and coastal environment.41 Under its terms, ships must provide informationon hazardous and dangerous goods they transport. Ports and national authorities are
29
Strategies to Clean Up U.S. Ports

also granted more authority to deny entry or exit from a port due to bad weathercircumstances, and they are encouraged to provide adequate resources for emergencyresponse, including places of refuge and procedures for accident and pollutionresponse.
Cleaner Marine FuelsResearch has demonstrated that the sulfur content of marine fuel contributessignificantly to acid rain, which poses a serious problem in Northern Europe.42
In November 2002, the EU introduced a revised Cleaner Marine Fuels Directive(COM(2002) 595 final, amendment of Directive 1999/32/EC), amending a 1999directive, to further strengthen sulfur limits in marine fuels.43 The revised directivewill bring EU nations far beyond compliance with the terms of Annex VI ofMARPOL. However, in June 2004, the EU Environment Council loosened the 2002language slightly to accommodate several Mediterranean EU members.44
The newly agreed to directive language contains three provisions:
� A 1.5 percent (15,000 parts per million) limit on sulfur for all vessels, regardless oftheir flag, that travel in the North Sea, English Channel, and the Baltic Sea, beginningin May 2006. These are the same sulfur limits and areas that were established asSulfur Emission Control Areas under MARPOL Annex VI.� A requirement that all passenger vessels on regular service to or from any port inthe European Union use fuel with a sulfur limit of 1.5 percent.� A 0.1 percent (1,000 parts per million) sulfur limit on all inland water vessels andon all ships while they are berthed in ports inside the European Union, beginning inJanuary 2010.45 (The November 2002 language originally required an intermediatefuel sulfur limit of 0.2% earlier than the 0.1% requirement. The new 0.1% requirementhas a later implementation time and allows an extra two years for compliance ofcertain vessels serving the Greek Islands.) This proposal will now go back to theEuropean Parliament for a second reading before a final agreement is made.
The current average sulfur content of marine fuels is approximately 2.7 percent,according to studies conducted for the European Union. Since ships will only berequired to use 0.1 percent sulfur fuels while berthed in an EU port, they can take onthe required fuel in the port of call. Thus the in-port requirement will apply to allvessels, regardless of their flag state and regardless of their last port of call.46
Sustainable TransportationThe EU is exploring strategies for sustainable development of European transporta-tion networks.47 The “Presidency Conclusion” serves as a framework for this effort:
A sustainable transport policy should tackle rising volumes of traffic andlevels of congestion, noise, and pollution, and encourage the use of environ-ment-friendly modes of transport as well as the full internalisation of socialand environmental costs. Action is needed to bring about a significant
30
Harboring Pollution

decoupling of transport growth and GDP growth, in particular by a shiftfrom road to rail, water, and public passenger transport.48
With a priority on reducing greenhouse gas emissions, in 2001 the EuropeanCommission adopted its White Paper: European Transport Policy for 2010.49 Thispolicy guideline calls for the revitalization of rail transport and the development ofshort sea shipping and inland waterway transportation as a means of reducingpollution and congestion, while increasing the safety of cargo transport.
The goal is to shift cargo from road transport to rail and waterway transportbecause rail and water are more energy-efficient, cleaner, and safer modes.50
However, the White Paper acknowledges the additional need to further reduceemissions from ships, in particular sulfur and particulate matter, and to improvelabor and safety standards of marine transportation.51
ECOPORTSThe EU’s “ECOPORTS” project is a three-year European cooperative study formallybegun June 1, 2002, at an estimated cost of $5 million.52 ECOPORTS focuses onthe development and implementation of an online environmental managementand information system. More than 50 ports have committed to be members of theproject, with a goal of adding an additional 100 members in Europe, including sea-ports, inland ports, industries located in ports, and other parties in the logistics chain.Key to the project will be the expertise gleaned from a series of studies that will deter-mine the best approach to address the need for the port sector and the EuropeanUnion to further develop and implement environmental practices.
These studies are based on seven work packages covering the technical develop-ment of environmental tools, testing and validating those tools, creating new projectsto use the tools, analyzing the impacts of those projects, sharing information onsuccessful projects, and developing a “ports and environment” network.
31
Strategies to Clean Up U.S. Ports

32
ENDNOTES
1 Port of Long Beach, www.polb.com; Port of Los Angeles, www.portoflosangeles.org; Port ofSeattle, http://www.portseattle.org/harbor/default.htm; Port ofOakland, www.portofoakland.com.
2 US Army Corps of Engineers,New York & New Jersey HarborNavigation Study, Chapter 4:Without-Project Condition,September 1999.
3 www.port-of-charleston.com/WhatsNew/press_room/pressroom.asp?PressRelease=23; US ArmyCorps of Engineers, Draft Environ-mental Impact Statement (DEIS)for the Proposed Daniel IslandMarine Cargo Terminal, August1999.
4 Miami Harbor General Reeval-uation Report Study, Draft Envi-ronmental Impact Statement,February 2003.
5 JWD under contract to Port ofHouston Authority, U.S. ContainerTerminal Throughout Density,February 2003.
6 Georgia Port Authority,www.gaports.com; Virginia PortAuthority, www.vaports.com
7 TEUs found at Port of SingaporeAuthority, http://www.mpa.gov.sg/index.html
8 The average fuel cost per hourfor diesel units was $2.38 per hour.During the same time period andunder comparable operating con-ditions, the LPG units averaged$1.96 per hour. This is based on afuel economy of 2.3 gph for LPGand 1.7 gph for the diesel units.The operational savings was real-ized from the differential fuel cost of$1.42 for diesel and $0.92 for LPG.
9 Ibid.
10 MECABriefing, San Francisco,Feb. 2, 2004.
12 CARB, Diesel Risk ReductionPlan, Appendix IV: Fuels Report,p. 27, October 2000.
12 CARB, Diesel Risk ReductionPlan, Appendix IX: Diesel PMControl Technologies, p. 29.,October 2000.
13 ARB, Staff Report, Solid WasteCollection Vehicles, F-6, 2003.
14 According to MECA, FTFsshould not be used with enginescertified to more than 0.1 g/bhp-hrPM.
15 “Retrofitting Emission Controlson Diesel-Powered Vehicles,” Man-ufacturers of Emission ControlsAssociation, Washington, D.C.,March 2002, p. 6
16 Ibid.
17 Manufacturers of EmissionControls Association, RetrofittingEmission Controls on Diesel-Powered Vehicles, March 2002,www.meca.org.
18 Cleaire, 2003
19 SFIA—Airfield DevelopmentProgram, Preliminary Report No. 7,Construction and Air EmissionsAnalysis and Mitigation Study, Table37.2-1 through 37.2-5, 2001, pre-pared by a consortium of con-sultants including Moffatt &Nichol Engineers and GAIAConsultants. We thank the authorsfor their permission to cite this yetunpublished report.
20 Information Provided by RonFriesen, Sierra Nevada Air QualityConsulting, November 2002.
21 White Paper Summary ofInterviews with Stationary FuelCell Manufacturers, CaliforniaStationary Fuel Cell Collaborative,August 2002.
22 Cost represents average costobtained in personal conversationsbetween Ron Friesen and repre-sentatives of Fuel Cell Energy, Incand United Technologies CorpFuel Cells.
23 From www.Chevron.com citingC.L. Dickson and G.P. Sturn, Jr.,Diesel Fuel Oils, 1996.
24 “Cruise ships not usinglowpollution fuels after all”, SeattlePost-Intelligencer Reporte—RobertMcClure, September 11, 2003.
25 Communication with ChuckLe Tavec, BP Amoco Oil, Novem-ber 10, 2003.
26 Prepared for the EuropeanCommission by Entec UK Limited,Quantification of emissions fromships associated with ship move-ments between ports in the Euro-pean Community, Final Report,July 2002.
27 U.S. Environmental ProtectionAgency (USEPA), Storm WaterManagement for Industrial Activi-ties. USEPAOffice of Water,Washington, DC, 1993.
28 American Association of PortAuthorities (AAPA), Environ-mental Management Handbook,AAPA, Alexandria, VA, 1998.
29 Environment Canada (undercontract to PCA Consultants Ltd.),Fraser River Action Plan, BestManagement Practices (BMPs) forShip and Boat Building and Repairin British Columbia, NorthVancouver, BC., 1995.
30 BMT, Study on the Economic,Legal, Environmental and Practical
Implications of a European UnionSystem to Reduce Ship Emissoinsof SO2 and NOx. 2000, EuropeanCommission.
31 With minor and well-definedexceptions.
32 SBTs were already required onnew tankers of 70,000 dwt andabove.
33 http://www.epa.gov/owow/oceans/regulatory/vessel_sewage/
34 Hellenic Marine EnvironmentProtection Association (HELMEPA)as cited on www.imo.org.
35 http://www.marinelog.com/DOCS/NEWSMMIII/MMIIIMay16c.html
36 NOx limits range from 9.8 to17 g/kW-hr depending on theengine’s maximum operatingspeed.
37 The stratospheric ozone layer isa UV protective layer miles abovethe earth’s surface. This beneficialozone layer should not be con-fused with tropospheric or groundlevel ozone, commonly known assmog, which is known to causerespiratory illnesses among otherhealth problems.
38 IMO, International Conventionon the Control of Harmful Anti-Fouling Systems on Ships 2001, inAdoption of the final act of theconference and any instruments,recommendations and resolutionsresulting from the work of the con-ference, International Conferenceon the Control of Harmful Anti-Fouling Systems for Ships, Editor.2001: IMO.
39 EC, Directive 2000/59/EC ofthe European Parliament and ofthe Council of 27 November 2000on port reception facilities for ship-generated waste and cargo resi-dues. 2000: Official Journal of theEuropean Communities.
40 The “polluter pays” approachis common in EU policies, but isparticularly controversial in thisinstance because of the potentialeconomic benefit for ships thatillegally dump wastes beforecalling on a port that does notrequire a minimum charge fromeach vessel. Many ports impose aclear flat-fee system that encour-ages the use of waste receptionfacilities. But circumstances at seamake monitoring and enforcementdifficult. Furthermore, some portsthat adopted a general waste re-ception fee for all vessels, regard-less of the amount of deliveredwaste, may be overloaded withwaste that shippers did not dis-pose of at ports that have reception
fees scaled to the amount of waste.The Port of Hamburg discontinuedits no-cost waste reception forthat reason after EU Directive2000/59/EC took effect.
41 EC, Directive 2002/59/EC of theEuropean Parliament and of theCouncil establishing a Communityvessel traffic monitoring and informa-tion system and repealing CouncilDirective 93/75/EEC. 2002:Official Journal of the EuropeanCommunities.
42 EC Study C.1/01/2002, DGEnvironment: Advice on impactof reduction in sulfur contentof marine fuels marketed inthe EU.
43 Commission of the EuropeanCommunities, Communicationfrom the Commission to the Euro-pean Parliament and the Council—A European Union strategy toreduce atmospheric emissionsfrom seagoing ships, in COM(2002)595 final. 2002; Commissionof the European Communities,Directive of the European Parlia-ment and of the Council amendingDirective 1999/32/EC as regardsthe sulphur content of marinefuels, in COM(2002)595 final,2002/0259 (COD). 2002.
44 EC Study C.1/01/2002, DGEnvironment: Advice on impact ofreduction in sulfur content ofmarine fuels marketed in the EU.
45 For more information, see:http://europa.eu.int/comm/environment/air/transport.htm#3.
46 Ibid.
47 This effort was also part of theEU’s preparation for the 2002 WoldSummit on Sustainable Develop-ment in Johannesburg.
48 Gothenburg European Council,Presidency Conclusions regardingSustainable Development. 2001, EC,Gothenburg European Council:Gothenburg.
49 EC, White Paper, EuropeanTransport Policy for 2010: time todecide. 2001, European Commu-nity: Luxemburg.
50 For every horsepower that iscapable to move 150 kg by road,500 kg can be moved by rail and4,000 kg by vessel according to theEU Directorate Energy andTransportation.
51 http://europa.eu.int/pol/trans/index_en.htm
52 www.ecoports.com; $5.04 mil-lion is roughly the equivalent of4.1 million Euros as of July 2004.See http://www.xe.com/ucc/convert.cgi.


