Appendix A Nonproliferation and Export Control Policy Fact ...
152
Nonproliferation and Export Control Policy Fact Sheet Appendix A Nonproliferation and Export Control Policy Fact Sheet This appendix contains a copy of the fact sheet on the President's Nonproliferation and Export Control Policy released by the White House on September 27, 1993. The fact sheet describes the major principles that guide the policy and the key elements of the policy. THE WHITE HOUSE Office of the Press Secretary September 27, 1993 For Immediate Release FACT SHEET NONPROLIFERATION AND EXPORT CONTROL POLICY The President today established a framework for U.S. efforts to prevent the proliferation of weapons of mass destruction and the missiles that deliver them. He outlined three major principles to guide our nonproliferation and export control policy: Our national security requires us to accord higher priority to nonproliferation, and to make it an integral element of our relations with other countries. * To strengthen U.S. economic growth, democratization abroad and international stability, we actively seek expanded trade and technology exchange with nations, including former adversaries, that abide by global nonproliferation norms. * We need to build a new consensus - embracing the Executive and Legislative branches, industry and public, and friends abroad -- to promote effective nonproliferation efforts and integrate our nonproliferation and economic goals. The President reaffirmed U.S. support for a strong, effective nonproliferation regime that enjoys broad multilateral support and employs all of the means at our disposal to advance our objectives. Key elements of the policy follow. Fissile Material The U.S. will undertake a comprehensive approach to the growing accumulation of fissile material from dismantled nuclear weapons and within civil nuclear programs. Under this approach, the U.S. will: Seek to eliminate where possible the accumulation of stockpiles of highly enriched uranium or plutonium to ensure that where these materials already exist they are subject to the highest standards of safety, security, and international accountability. * Propose a multilateral convention prohibiting the production of highly enriched uranium or plutonium for nuclear explosives purposes or outside of international safeguards. * Encourage more restrictive regional arrangements to constrain fissile material production in regions of instability and higA proliferation risk. "• Submit U.S. fissile material no longer needed for our deterrent to inspection by the International Atomic Energy Act. "* Pursue the purchase of highly-enriched uranium from the former Soviet Union A-1
Transcript of Appendix A Nonproliferation and Export Control Policy Fact ...

Nonproliferation and Export Control Policy Fact Sheet
Appendix A
Nonproliferation and Export Control Policy Fact Sheet
This appendix contains a copy of the fact sheet on the President's Nonproliferation and Export Control Policy
released by the White House on September 27, 1993. The fact sheet describes the major principles that guide
the policy and the key elements of the policy.
THE WHITE HOUSE
Office of the Press Secretary
September 27, 1993For Immediate Release
FACT SHEET
NONPROLIFERATION AND EXPORT CONTROL POLICY
The President today established a framework for U.S. efforts to prevent the proliferation of weapons of mass destruction and the missiles that deliver them. He outlined three major principles to guide our nonproliferation and export control policy:
Our national security requires us to accord higher priority to nonproliferation, and to make it an integral element of our relations with other countries.
* To strengthen U.S. economic growth, democratization abroad and international stability, we actively seek expanded trade and technology exchange with nations, including former adversaries, that abide by global nonproliferation norms.
* We need to build a new consensus -
embracing the Executive and Legislative branches, industry and public, and friends abroad -- to promote effective nonproliferation efforts and integrate our nonproliferation and economic goals.
The President reaffirmed U.S. support for a strong, effective nonproliferation regime that enjoys broad multilateral support and employs all of the means at our disposal to advance our objectives.
Key elements of the policy follow.
Fissile Material
The U.S. will undertake a comprehensive approach to
the growing accumulation of fissile material from
dismantled nuclear weapons and within civil nuclear
programs. Under this approach, the U.S. will:
Seek to eliminate where possible the
accumulation of stockpiles of highly
enriched uranium or plutonium to ensure
that where these materials already exist
they are subject to the highest standards of safety, security, and international accountability.
* Propose a multilateral convention prohibiting the production of highly
enriched uranium or plutonium for
nuclear explosives purposes or outside of
international safeguards.
* Encourage more restrictive regional arrangements to constrain fissile material production in regions of instability and higA proliferation risk.
"• Submit U.S. fissile material no longer
needed for our deterrent to inspection by
the International Atomic Energy Act.
"* Pursue the purchase of highly-enriched uranium from the former Soviet Union
A-1

Disposition of Surplus Highly Enriched Uranium Final EIS
and other countries and its conversion to peaceful use as reactor fuel.
" Explore means to limit the stockpiling of plutonium from civil nuclear programs, and seek to minimize the civil use of highly-enriched uranium.
" Initiate a comprehensive review of longterm options for plutonium disposition, taking into account technical, nonproliferation, environmental, budgetary and economic considerations. Russia and other nations with relevant interests and experience will be invited to participate in this study.
The United States does not encourage the civil use of plutonium and, accordingly, does not itself engage in plutonium reprocessing for either nuclear power or nuclear explosive purposes. The United States, however, will maintain its existing commitments regarding the use of plutonium in civil nuclear programs in Western Europe and Japan.
Export Controls
To be truly effective, export controls should be applied uniformly by all suppliers. The United States will harmonize domestic and multilateral controls to the greatest extent possible. At the same time, the need to lead the international community or overriding national security or foreign policy interests may justify unilateral export controls in specific cases. We will review our unilateral dual-use export controls and policies, and eliminate them unless such controls are essential to national security and foreign policy interests.
We will streamline the implementation of U.S. nonproliferation export controls. Our system mustbe more responsible and efficient, and not inhibit legitimate exports that play a key role in American economic strength while preventing exports that would make a material contribution to the proliferation of weapons of mass destruction and the missile that deliver them.
Nuclear Proliferation
The U.S. will make every effort to secure the indefinite extension of the Non-Proliferation Treaty in 1995. We will seek to ensure that the International Atomic Energy Agency has the resources needed to implement its vital safeguards responsibilities, and will work to strengthen the IAEA's ability to detect clandestine nuclear activities.
Missile Proliferation
We will maintain our strong support for the Missile Technology Control Regime. We will promote the principles of the MTCR Guidelines as a global missile nonproliferation norm and seek to use the MTCR as a mechanism for taking joint action to combat missile proliferation. We will support prudent expansion of the MTCR's membership to include additional countries that subscribe to international nonproliferation standards, enforce effective export controls and abandon offensive ballistic missile programs. The United States will also promote regional efforts to reduce the demand for missile capabilities.
The United States will continue to oppose missile programs of proliferation concern, and will exercise particular restraint in missile-related cooperation. We will continue to retain a strong presumption of denial against exports to any country of complete space launch vehicles or major components.
The United States will not support the development or acquisition of space-launch vehicles in countries outside the MTC1L
For MTCR member countries, we will not encourage new space launch vehicle programs, which raise questions on both nonproliferation and economic viability grounds. The United States will, however, consider exports of MTCR-controlled items to MTCR member countries for peaceful space launch programs on a case-by-case basis. We will review whether additional constraints or safeguards could reduce the risk of misuse of space launch technology. We will seek adoption by all MTCR partners of policies as vigilant as our own.
A-2
Nonproliferation and Export Control Policy Fact Sheet
Chemical and Biological Weapons
To help deter violations of the Biological Weapons Convention, we will promote new measures to provide increased transparency of activities and facilities that could have biological weapons applications. We call on all nations - including our own -- to ratify the Chemical Weapons Convention quickly so that it may enter into force by January 13, 1995. We will work with others to support the international Organization for the Prohibition of Chemical Weapons created by the Convention.
Regional Nonproliferation Initiatives
Nonproliferation will receive greater priority in our diplomacy, and will be taken into account in our relations with countries around the world. We will make special efforts to address the proliferation threat in regions of tension such as the Korean peninsula, the Middle East and South Asia, including efforts to address the underlying motivations for
weapons acquisition and to promote regional confidence-building steps.
In Korea, our goal remains a non-nuclear peninsula. We will make every effort to secure North Korea's full compliance with its nonproliferation commitments and effective implementation of the North-South denuclearization agreement.
In parallel with our efforts to obtain a secure, just, and lasting peace in the Middle East, we will promote dialogue and confidence-building steps to create the basis for a Middle East free of weapons of mass
destruction. In the Persian Gulf, we will work with other suppliers to contain Iran's nuclear, missile, and CBW ambitions, while preventing reconstruction of Iraq's activities in these areas. In South Asia, we will encourage India and Pakistan to proceed with multilateral discussions of nonproliferation and security issues, with the goal of capping and eventually rolling back their nuclear and missile capabilities.
In developing our overall approach to Latin America and South Africa, we will take account of the significant nonproliferation progress made in these regions in recent years. We will intensify efforts to ensure that the former Soviet Union, Eastern Europe and China do not contribute to the spread of weapons of mass destruction and missiles.
Military Planning and Doctrine
We will give proliferation a higher profile in our intelligence collection and analysis and defense planning, and ensure that our own force structure and military planning address the potential threat from weapons of mass destruction and missile around the world.
Conventional Arms Transfers
We will actively seek greater transparency in the area of conventional arms transfers and promote regional confidence-building measures to encourage restraint on such transfers to regions of instability. The U.S.
will undertake a comprehensive review of conventional arms transfer policy, taking into account national security, arms control, trade, budgetary and economic competitiveness consideration.
A-3

Nonproliferation of Weapons of Mass Destruction and the Means of Their Delivery
Appendix B Nonproliferation of Weapons of Mass Destruction
and the Means of Their Delivery
THE WHITE HOUSE
Office of the Press Secretary
JOINT STATEMENT BY THE PRESIDENT OF THE RUSSIAN FEDERATION
AND THE PRESIDENT OF THE UNITED STATES OF AMERICA
ON NON-PROLIFERATION OF WEAPONS OF MASS DESTRUCTION AND THE MEANS OF THEIR DELIVERY
President Clinton and President Yeltsin, during their meeting in Moscow on January 14, 1994, agreed that the proliferation of weapons of mass destruction and their missile delivery systems represents an acute threat to international security in the period following the end of the Cold War. They declared the resolve of their countries to cooperate actively and closely with each other, and also with other interested states, for the purpose of preventing and reducing this threat.
The Presidents noted that the proliferation of nuclear weapons creates a serious threat to the security of all states, and expressed their intention to take energetic measures aimed at prevention of such proliferation.
Considering the Treaty on the Nonproliferation of Nuclear Weapons as the basis for efforts to ensure the nonproliferation of nuclear weapons, they called for its indefinite and unconditional extension at conference of its participants in 1995, and they urged that all states that have not yet done so accede to this treaty.
e They expressed their resolve to implement effective measures to limit and reduce nuclear weapons. In this connection, they advocated the most rapid possible entry into force of the START I and START 11 treaties.
- They agreed to review jointly appropriate ways to strengthen security assurances for
the states which have renounced the possession of the nuclear weapons and that comply strictly with their nonproliferation obligations.
They expressed their support for the International Atomic Energy Agency in its efforts to carry out its safeguards responsibilities. They also expressed their intention to provide assistance to the Agency in the safeguards field, including through joint efforts of their relevant laboratories to improve safeguards.
" They supported the Nuclear Suppliers Group, and agreed with the need for effective implementation of the principle of full-scope IAEA safeguard as a condition for nuclear exports with the need for export controls on dual-use materials and technology in the nuclear field.
" They reaffirmed their countries' commitment to the conclusion as soon as possible.
I
B-1

Air Quality and Noise
Appendix C Air Quality and Noise
C.A
C.1.1
AIR QUALITY
INTRODUCTION
This appendix provides detailed data that support impact assessments to air quality and noise addressed in Sections 3.3.3, 3.4.3, 3.5.3, and 3.6.3, Affected Environment, and 4.3.1.2, 4.3.2.2, 4.3.3.2, 4.3.4.2, and 4.6.2.2, Environmental Consequences. The data presented include emission inventories from siterelated activities and highly enriched uranium (HEU) blending facilities. Section C.1.2 presents the methodology and models used in the air quality assessment. Section C.1.3 presents supporting data applicable to each site. The tables included in Sections C.1.4 through C.1.7 contain information applicable to the air quality assessments at each site, and the figures contain wind rose data at each site. Section C.2 presents the emission rates for the blending facilities considered as alternatives. Section C.3 presents noise data for those sites where noise regulations apply.
C.1.2 METHODOLOGY AND MODELS
The assessment of potential impacts to air quality is based on the comparison of proposed project effects with applicable standards and guidelines. The Industrial Source Complex Short-Term Model Version 2 (ISCST2) is used to estimate concentrations of pollutants from emission sources at each site.
The air quality modeling analysis performed for the candidate sites is considered to be a screening level analysis that incorporates conservative assumptions applied to each site so that the impacts associated with the respective alternatives can be compared among the sites. These conservative assumptions will tend to overestimate the pollutant concentrations at each site.
The assumptions incorporated into the air quality analysis at each site are as follows: major source criteria pollutant emissions were modeled using actual source locations and stack parameters to determine no action criteria pollutant concentrations; toxic/hazardous pollutant emissions were modeled from a single source centrally located within the
complex of facilities on each site assuming a 10meter (in) (32.8-feet [ft]) stack height, a stack diameter of 0.3 m (1 ft), a stack exit temperature equal to ambient temperature, and a stack exit velocity equal to 0.03 meter per second (m/s) (0.1 ftls), unless otherwise specified.
These assumptions will tend to overestimate pollutant concentrations since no credit is given to spatial and temporal variations of emission sources. More technical information can be found in the Environmental Protection Agency's (EPA's) User's Guide for the Industrial Source Complex (I$C2) Dispersion Models, EPA-450/4-92-008a, March 1992.
C.1.3
C.1.3.1
SUPPORTING DATA
Overview
This section presents supporting information for each of the four candidate sites considered for blending HEU to low-enriched uranium (LEU). Table C.1.3.1-1 presents the air quality standards applicable to each site. Subsequent sections present supporting information used in the air quality analysis at Oak Ridge Reservation (ORR), Savannah River Site (SRS), Babcock & Wilcox Facility (B&W) at Lynchburg, Virginia, and Nuclear Fuel Services, Inc. (NFS) at Erwin, Tennessee.
C.1.4 OAK RIDGE RESERVATION
This section provides information on meteorology and climatology, emission rates, modeling assumptions, atmospheric dispersion characteristics, and annual mean wind speeds and direction frequencies (Figure C.1.4-1) at ORR. Table C.1.4-1 presents emission rates of criteria and toxic/ hazardous pollutants at ORR. This information supportg data presented in the Environmental Consequences section for air quality.
Meteorology and Climatology. The wind direction above the ridge tops and within the valley at ORR tends to follow the orientation of the valley. On an annual basis, the prevailing winds at the National
C-1

4'
C) Table C.I3.1-1. AmbientAir Quality Standards Applicable to the Candidate Sites
Averaging Primary Secondary South Carolina Tennessee Virginia
lime NAAQSa NAAQS (SRS) (ORR & NFS) (B&W)
Pollutant (tg/m 3) (Wg/m 3) (gIgm 3) ([g/m3) (pg/m 3)
Criteria Pollutants
Carbon monoxide (CO) 8 hours 10,000 b 10,000 10,000 10,000
I hour 40,000 b 40,000 40,000 40,000
Lead (Pb) Calendar Quarter 1.5 1.5 1.5 1.5 1.5
Nitrogen dioxide (NO2) Annual 100 100 100 100 100
Ozone (03) 1 hour 235 235 235 235 235
Particulate matter (PM10) Annual 50 50 50 50 50
24 hours 150 150 150 150 150
Sulfur dioxide (SO2) Annual 80 b 80 80 80
24 hours 365 b 365 365 365
3 hours b 1,300 1,300 1,300 1,300
State Mandated Pollutants
Total suspended particulates (rSP) Annual b b 75 b 60
24 hours b b b 150 150
Gaseous fluorides (as HF) 1 month b b 0.8 1.2 b
I week b b 1.6 1.6 b
24 hours b b 2.9 2.9 b
12 hours b b 3.7 3.7 b
8 hours b b b 250 b
a The National Ambient Air Quality Standards, other than those for ozone, particulate matter, and those based on annual averages, are not to be exceeded more than once per year.
The ozone standard is attained when the expected number of days per year with maximum hourly average concentrations above the standard is less than or equal to one. The 24
hour particulate matter standard is attained when the expected number of days with a 24-hour average concentration above the standard is less than or equal to one. The annual
arithmetic mean particulate matter standard is attained when the expected annual arithmetic mean concentration is less than or equal to the standard. b There is no standard.
Note: NAAQS=National Ambient Air Quality Standards; pg=micrograms; m3=cubic meters.
Source: 40 CFR 50, SC DHEC 1992b; TN DEC 1994a; TN DHE 1991a; VAAPCB 1993a.
*1
Air Quality and Noise
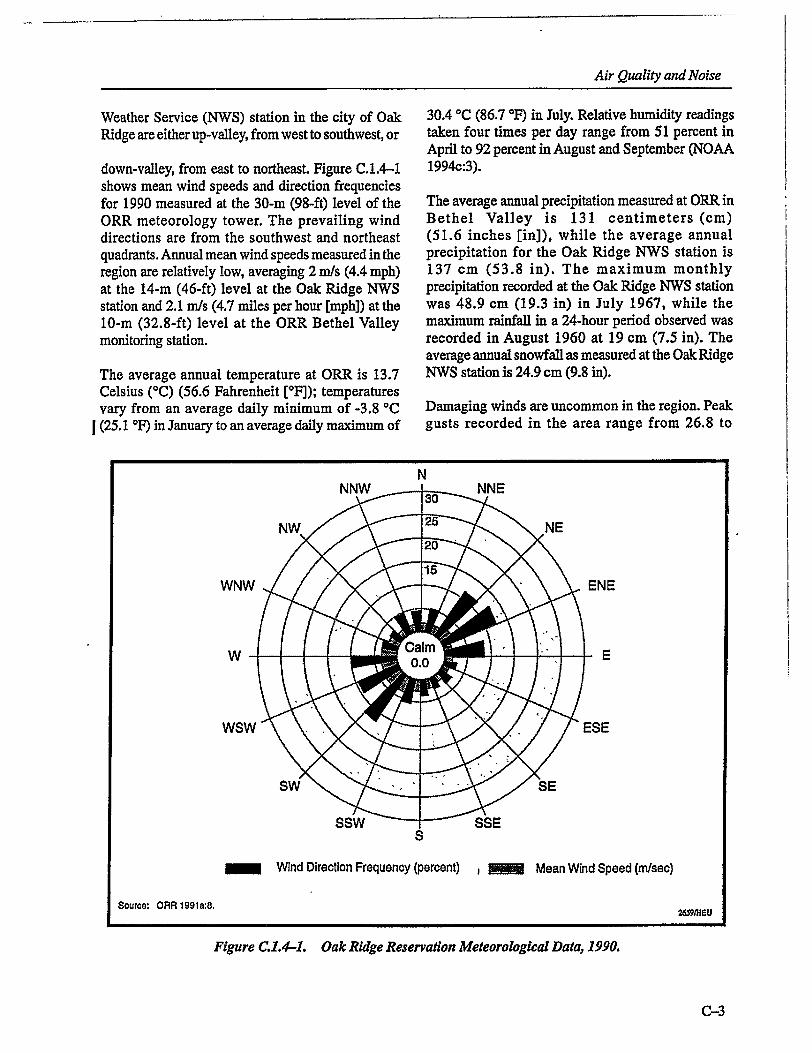
Weather Service (NWS) station in the city of Oak Ridge are either up-valley, from west to southwest, or
down-valley, from east to northeast. Figure C.1.4-1 shows mean wind speeds and direction frequencies for 1990 measured at the 30-m (98-ft) level of the ORR meteorology tower. The prevailing wind directions are from the southwest and northeast quadrants. Annual mean wind speeds measured in the region are relatively low, averaging 2 m/s (4.4 mph) at the 14-m (46-ft) level at the Oak Ridge NWS station and 2.1 nt/s (4.7 miles per hour [mph]) at the 10-m (32.8-ft) level at the ORR Bethel Valley monitoring station.
The average annual temperature at ORR is 13.7 Celsius (°C) (56.6 Fahrenheit ['F]); temperatures vary from an average daily minimum of -3.8 *C (25.1 F) in January to an average daily maximum of
30.4 'C (86.7 *F) in July. Relative humidity readings taken four times per day range from 51 percent in April to 92 percent in August and September (NOAA 1994c:3).
The average annual precipitation measured at ORR in Bethel Valley is 131 centimeters (cm) (51.6 inches [in]), while the average annual precipitation for the Oak Ridge NWS station is 137 cm (53.8 in). The maximum monthly precipitation recorded at the Oak Ridge NWS station was 48.9 cm (19.3 in) in July 1967, while the maximum rainfall in a 24-hour period observed was recorded in August 1960 at 19 cm (7.5 in). The average annual snowfall as measured at the Oak Ridge NWS station is 24.9 cm (9.8 in).
Damaging winds are uncommon in the region. Peak gusts recorded in the area range from 26.8 to
Figure C.1.4-1. Oak Ridge Reservation Meteorological Data, 1990.
C-3
N N NW.....-- o•-.. NN E
NW 25NE
WNW .ENE
w(
WSW' ESE
SW SE
SSW SSE S
Wind Direction Frequency (percent) Mean Wind Speed (rnsec)
Source: ORR 1991a:8. 2659/HU~t

Disposition of Surplus Highly Enriched Uranium Final EIS
30.8 m/s (60 to 68.9 mph) for the months of January through July; from 21.9 to 26.8 m/s (49 to 60 mph) for August, September, and December; and 16.1 to 20.1 m/s (36 to 45 mph) in October and
I November (ORNL 1982a:2-72). The fastest mile
wind speed (the 1.6 kilometer [km] [1-mile (mi)] passage of wind with the highest speed for the day)
recorded at the Oak Ridge NWS station for the period
of record 1958 through 1979 was 26.4 m/s
(59.1 mph) in January 1959 (NOAA 1994c:3).
The extreme mile wind speed at a height of 9.1 in
(30 ft) that is predicted to occur near ORR once in 100 years is approximately 40.2 m/s (89.9 mph). The approximate values for occurrence intervals of 10,
25, and 50 years are 29.1 rn/s (65.1 mph), 33.1 m/s
(74 mph), and 34 m/s (76.1 mph), respectively.
Between 1916 and 1972 there were 25 tornadoes reported in the counties of Tennessee, having borders
within about 64.4 km (40 mi) of ORR. The probability of a tornado striking a particular point in the vicinity of ORR is estimated to be 6.0x10"5 per year. The recurrence interval associated with this probability is 16,550 years (ORNL 1981a:3.3-7).
On February 21, 1993, a tornado passed through the northeastern edge of ORR and caused considerable damage to a number of structures in the nearby Union Valley Industrial Park. Damage from this tornado to
ORR was relatively light. The wind speeds associated with this tornado ranged from 17.9 m/s (40 mph) to those approaching 58.1 m/s (130 mph) (OR DOE 1993c:iii).
Emission Rates. Table C.1.4-1 presents the
emission rates of criteria and toxic/hazardous pollutants at ORR. The toxic/hazardous pollutant emissions presented in the table represent those pollutants with estimated concentrations at or beyond the ORR boundary that exceed 1 percent of
Tennessee Department of Environment and Conservation (TDEC) air quality standards. These emission rates were used as input into the ISCST2 model to estimate pollutant concentrations.
Modeling Assumptions. Additional model input
used to estimate maximum pollutant concentrations at or beyond the ORR site boundary include the following: criteria pollutant emissions were modeled from actual stack locations using
Table C.1.4-1. Emission Rates of Criteria and Toxic/Hazardous Pollutants
at Oak Ridge Reservation, 1992
Emission Rate Pollutant (kg/yr)
Carbon monoxide (CO) 94,648
Lead (Pb) a
Nitrogen dioxide (NO2) 887,911
Particulate matter (PM1o)b 21,655
Sulfur dioxide (SO2) 1,674,980
Total suspended particulates 21,655 (TSP)b
Toxic/Hazardous Pollutants
Chlorine 1,651
Hydrogen chloride 7,004
Nitric acid 9,526
Sulfuric acid 2,459 a No source indicated.
b It is conservatively assumed that PMIo emissions are TSP
emissions. Note: kg=kilogram; yr=year. Source: OR DOE 1993a.
actual stack heights, stack diameter, exit velocity, and exit temperature that were taken from operating permits issued by the Tennessee Air Pollution Control Board pursuant to the Tennessee
Air Quality Act; toxic/hazardous pollutant emissions were modeled from a centrally located stack in the Y-12 complex at a height of 10 m (32.8 ft), a stack diameter of 0.3 m (1 ft), an exit velocity of 0.03 m/s (0.1 ft/s), and an exit temperature equal to ambient temperature.
Atmospheric Dispersion Characteristics. Data collected at the ORR meteorological monitoring station (Y-12 Plant east tower) for the calendar year
1990 indicate that unstable conditions occur approximately 23 percent of the time, neutral
conditions approximately 31 percent of the time, and stable conditions approximately 46 percent of the time, on an annual basis.
Annual Mean Wind Speeds and Direction Frequencies. The Oak Ridge meteorological data for
wind speed and direction for 1990 are presented in
Figure C.1.4-1 as a wind rose. As shown in this figure, the maximum wind direction frequency is from the east-northeast with a secondary maximum from the
C-4

Air Quality and Noise
northeast. The mean wind speed from the east-northeast is 1.7 mIs (3.8 mph) and from the northeast is 2.3 m/s (5.1 mph), while the maximum mean wind speed is 3.3 ni/s (7.4 mph) from the southwest.
C.1.5 SAVANNAH RIVER SITE
This section provides information on climatology and meteorology, modeling assumptions, atmospheric dispersion characteristics, and annual mean wind speeds and direction frequencies (Figure C.1.5-1) at SRS.
Meteorology and Climatology. Figure C.1.5-1 shows annual mean wind speeds and wind direction frequencies for 1991 measured at the 60-m (200-ft) level of the SRS H-Area Weather Station. The wind data from the site indicate that there is no predominant wind direction at SRS. The highest
directional frequency is from the northeast. The average annual wind speed measured is 2.9 m/s (6.5 mph) and average monthly wind speeds range from 2.4 ni/s (5.4 mph), from June through August, to 3.5 m/s (7.8 mph) in February.
The average annual temperature at SRS is 17.3 *C (63.2 *F); average daily temperatures vary from 0 'C (32 *F) in January to 33.2 'C (91.7 *F) in July. Relative humidity readings taken four times per day range from 45 percent in April to 92 percent in August and September.
The average annual precipitation at SRS is 113 cm (44.5 in). Precipitation is distributed fairly evenly throughout the year, with the highest precipitation in summer (32.7 cm [12.9 in]) and the lowest in autumn (21.2 cm [8.3 in]). Although snow can fall from November throughApril, the average annual snowfall is only 2.8 cm (1.1 in); large snowfalls are rare.
E
N
ENEWNW
wsw
Mean Wind Speed (m/sec)Wind Direction Frequency (percent)
Source: WSRC 1992h.26601HEU
Figure C.1.5-1. Savannah River Site Meteorological Data, 1991.
C-5
ESE

Disposition of Surplus Highly Enriched Uranium Final EIS
Winter storms in the SRS area occasionally bring
strong and gusty surface winds with speeds as high as
22.8 m/s (51 mph). Thunderstorms can generate
winds with speeds as high as 21.5 m/s (48.1 mph)
and even stronger gusts. The fastest I-minute wind
speed recorded at Augusta between 1952 and 1993
was 27.7 m/s (62 mph) (NOAA 1994c:3).
The average number of thunderstorm days per year'at
SRS is 56. From 1954 to 1983, 37 tornadoes were
reported for a 1-degree square of latitude and
longitude that includes SRS. This frequency of
occurrence amounts to an average of about one
tornado per year. The estimated probability of a
tornado striking a point at SRS is 7.1x10"5 per year
I (NRC 1986a:32). Since operations began at SRS in
1953, six tornadoes have been confirmed on the site
or near SRS. Nothing more than light damage was
reported in any of these storms, except for a tornado
in October 1989. That tornado caused considerable
damage to timber resources in an undeveloped
wooded area of SRS (WSRC 1990b:1).
From 1899 to 1980, 13 hurricanes occurred in
Georgia and South Carolina, for an average
frequency of about one hurricane every 6 years.
Three hurricanes were classified as major. Because
SRS is about 160 km (99.4 mi) inland, the winds
associated with hurricanes have usually diminished
below hurricane force (greater than or equal to a
sustained speed of 33.5 m/s [75 mph]) before reaching the site (DOE 1992e:4-115)..
Emission Rates. Table C.1.5-1 presents the
emission rates of criteria pollutants at SRS. Toxic/
hazardous pollutant emissions presented in the table
represent those pollutants with estimated concentrations at or beyond the SRS boundary that
exceed 1 percent of South Carolina State standards
(SRS 1993a:4).
Modeling Assumptions. Emission rates for criteria
and toxic/hazardous pollutants were based on actual
site emissions data for the year 1990. Additional
model input used to estimate maximum criteria and
toxic/hazardous pollutant concentrations at or
beyond the SRS site boundary includes the
following: pollutant emissions modeled from actual
stack heights, actual effective stack diameters,
actual exit velocity, and actual exit temperature.
Table C.1.5-1. Emission Rates of Criteria and Toxic/Hazardous Pollutants at
Savannah River Site, 1990
Emission Rate Pollutant (kglyr)
Carbon monoxide (CO) 404,449
Lead (Pb) 509
Nitrogen dioxide (NO2) 4,278,380
Particulate matter (PM10) 1,963,180
Sulfur dioxide (SO2) 9,454,199
Total suspended 4,430,890 particulates (TSP)
Point & Volume Area
ToxiclHazardous Source Source Pollutants (kglyr) (kg/yr/m2)
3,3-Dichlorobenzidine 211 a
Acrolein a 1.94x10⁻³
Benzene 129,772 0.21
Bis (chloromethyl) ether 211 a
Cadmium oxide 243 a
Chlorine 21,147 10.1
Chlorofornif 1,035,006 13.6
Cobalt 5,970 4.58x10 4
Formic acid 46,949 a
Manganese 27,882 2.61
Mercury 918 1.15x10"
Nickel 23,023 6.02
Nitric acid 1,151,526 a
Parathion b b
Phosphoric acid 14,860 a a No sources indicated. b Data not available.
Note: kg=kilogram; yr=year, m2=square meter.
Source: SRS 1993a:4; SRS 1995a:10.
Atmospheric Dispersion Characteristics. Data
collected at the SRS meteorological monitoring
station for 1991 indicate that unstable conditions
occur approximately 38 percent of the time, neutral
conditions approximately 43 percent of the time,
and stable conditions approximately 19 percent of
the time, on an annual basis..
Annual Mean Wind Speeds and Direction
Frequencies. The SRS meteorological data for
wind speed and direction for 1991 are presented in
Figure C.1.5-1 as a wind rose. As shown in this
figure, the maximum wind direction frequency is
C-6

Air Quality and Noise
from the northeast with a secondary maximum from
the east-northeast. The mean wind speed from the
northeast is 3.8 m/s (8.5 mph) and from the
east-northeast is 3.8 m/s (8.5 mph), while the
maximum mean wind speed is 4.1 m/s (9.2 mph) from the west-northwest.
C.1.6 BABCOCK & WILCOX
This section provides information on climatology and meteorology, emission rates, modeling assumptions, atmospheric dispersion characteristics, and annual mean wind speeds and direction frequencies (Figure C.1.6-1) at B&W located at Lynchburg, Virginia.
Meteorology and Climatology. The climate of the Lynchburg area has mild summers and winters. Rainfall is fairly evenly distributed throughout the year, but there is a distinct summertime rainfall, occasioned by afternoon thunderstorms. There are occasional snow showers, but the mountains to the immediate west act as a barrier and shelter the area from many storms and high winds. The mountains also act as a barrier to extremely cold weather. Temperatures have fallen below zero only on a few days, and 37.8 *C (100 *F) heat is almost as rare, although this mark has been exceeded in the months of May through September (NOAA 1994b:7).
The average annual temperature at the Lynchburg NWS station is 13.3 *C (55.9 OF); temperatures may vary from an average daily minimum of -4.1 *C (24.7 'F) in January to an average daily maximum of 30 *C (86 *F) in July. Relative humidity readings taken three times per day range from 45 percent in
I April to 89 percent in August (NOAA 1994b:3).
The annual precipitation at the Lynchburg NWS station is 104 cm (40.9 in). The maximum monthly precipitation recorded at the Lynchburg NWS station was 29 cm (11.4 in) in October 1976, while the maximum precipitation observed in a 24-hour period was 15.9 cm (6.3 in) recorded in June 1972. The average annual snowfall as measured at the Lynchburg NWS station is 46 cm (18.1 in).
Prevailing wind directions at B&W are predominantly from the southwest with a mean speed of 3.4 m/s (7.7 mph). The fastest mile wind speed recorded at the Lynchburg NWS station for the period of record 1944
through 1993 was 25 in/s (55.9 mph) in May 1958. Peak gust wind recorded was 33.1 m/s (74 mph) in
I June 1993 (NOAA 1994b:3).
Severe weather in the Lynchburg area is generally limited to thunderstorms with a low probability of tornadoes. The average number of thunderstorm days
per year at Lynchburg is 40.5 (NOAA 1994b:3). The probability of a tornado actually striking the site is 3.0x10"4 per year, with a recurrence interval of 3,333 years (BW NRC 1986a:3-4).
Emission Rates. Table C.1.6-1 presents the emission rates of criteria and toxic/hazardous pollutants
determined from the AIRS Facility Subsystem (AFS) Plant" Emissions Inventory maintained by the Commonwealth of Virginia, Department of Environmental Quality, Air Division. Toxic/hazardous pollutant emissions presented in the table were obtained from the Toxic Chemical Release Form R
required by Section 313 of the Emergency Planning and Community Right-to-Know Act of 1986, also known as Title I1 of the SuperfundAmendments and Reauthorization Act. These emission rates were used as input into the ISCST2 model to estimate pollutant concentrations.
ModelingAssumptions. Additional model input used to estimate maximum pollutant concentrations at or beyond the B&W site boundary includes'the following: criteria pollutant emissions were modeled using actual stack locations and heights, stack diameters, exit velocity, and exit temperature; toxic/ hazardous pollutant emissions were modeled from a centrally located stack within the complex of facilities at a height of 10 m (32.8 ft), a stack diameter of 0.3 m (1 ft), an exit velocity of 0.03 m/s (0.1 ft/s), and an exit temperature equal to ambient temperature.
Atmospheric Dispersion Characteristics. Meteorological data collected at Lynchburg NWS for 1994 indicate that unstable atmospheric conditions occur approximately 18 percent of the time, neutral conditions approximately 76 percent of the time, and stable conditions approximately 6 percent of the time.
The wind speed and direction data at Lynchburg NWS are recorded during daylight hours only. The inclusion of observations during nighttime hours would increase the percentage of stable conditions significantly. This increase of stable conditions would tend to raise the
C-7

Disposition of Surplus Highly Enriched Uranium Final EIS
Table C.1.6-1. Emission Rates of Clteria and Toxic/FHazardous Pollutants at Babcock & Wilcox, 1994
Pollutant Carbon monoxide (CO) Lead (Pb) Nitrogen dioxide (NO2) Particulate matter (PM10) Sulfur dioxide (SO2) Total suspended particulates (TSP)
Toxic/Hazardous Pollutants Copper compounds Nitric acid Sulfuric acid Trichloroethylene
Emission Rate (kgyr)
1,678
36,760 176
2,447 232
218 213 53
14,697
concentrations of pollutants at or beyond the site boundary. The calculated concentrations of pollutants are such a small percentage of the standards that any increase due to meteorological conditions would still be well below the standards.
Annual Mean-Wind Speeds and Direction Frequencies. The Lynchburg NWS meteorological data for wind speed and direction for 1994 are presented in Figure C.1.6-1 as a wind rose. As shown in this figure,.the maximum wind direction frequency is from the south-southwest with a secondary maximum from the southwest. The mean wind speed from the south-southwest is 1.7 m/s (3.8 mph) and from the southwest is 1.8 m/s (4 mph), while the maximum mean wind speed is 2.1 m/s (4.7 mph) from the west.
' No source indicated. Note: kg=kilogram; yr=year.
j Source: BW EPA 1995a; VA DEQ 1995b.
Figure C.1.6-1. Lynchburg, Virginia-National Weather Service Meteorological Data, 1994.,
C-8

Air Quality and Noise
C.1.7 Nuclear Fuel Services, Inc.
This section provides information on climatology and meteorology, emission rates, modeling assumptions, atmospheric dispersion characteristics, and annual mean wind speeds and direction frequencies (Figure C. 1.7-1) at NFS located at Erwin; Tennessee.
Climatology and Meteorology. The climate of the Erwin vicinity is characterized by warm; humid summers and relatively mild winters. Cooler, drier weather in the area is usually associated with polar continental air masses, whereas warmer, wetter weather is associated with gulf maritime air masses.
The average annual temperature in the Erwin area is 13.1 IC (55.5 *F); temperatures may vary from an average daily minimum of -4.3 'C (24.3 OF) in January to an average daily maximum of 29.2 *C (84.6 "F) in July. Relative humidity readings taken four times per day range from 51 percent in April to 93 percent in August and September (NOAA 19940:3).
The annual precipitation in the Erwin area is 103 cm (40.7 in). The maximum monthly precipitation recorded near Erwin was 24.7 cm (9.7 in) in July 1949, while the maximum precipitation observed in a 24-hour period was 9.3 cm (3.7 in) recorded in October 1964. The average annual snowfall as measured near Erwin is 40.1 cm (15.8 in).
I The annual average wind speed is approximately 2.5 m/s (5.5 mph). The fastest mile wind speed recorded at the Bristol, Johnson City, Kingsport NWS station was 22.4 m/s (50.1 mph) in May 1951. Peak gust wind recorded was 28.2 mn/s (63.1 mph) in April 1991 (NOAA 19940:3).
The average number of thunderstorm days per year near Erwin is 42.8 (NOAA 19940:3).
Severe storms are infrequent in the Erwin region, which is'east of the center of tornado activity, south of most blizzard conditions, and too far inland to be often affected by hurricanes. Only one tornado has been recorded in Unicoi County since 1950 (NRC 1991a:3-1, 3-3).
Emission Rates. Table C.1.7-1 presents the emission rates of criteria pollutants determined from operating permits issued between 1981 and 1994 by the Tennessee Air Pollution Control Board pursuant to the Tennessee Air Quality Act. Toxic/hazardous
Table C.1.7-1. Emission Rates of Criteria and Toxic/Hazardous Pollutants at Nuclear Fuel
Services, 1994
Pollutant
Carbon monoxide (CO) Lead (Pb) Nitrogeix dioxide (NO2)
Particulate matter (PMI0P
Sulfur dioxide (SO2) Total suspended particulates
(TSP)b Volatile organic compounds (VOC)
Hydrogen fluoride (HF)
Toxic/Hazardous Pollutants
Ammonia Nitric acid
Emission Rate (kglyr)
7,146 a
33,865 1,558 1,081 1,558
6,918 405
9,573. 242
a No source indicated. b It is conservatively assumed that all PM10 emissions are TSP
emissions. Note: kg=kilogram; yr=year.
Souc: NF DEC nda; NF EPA 1994a.
pollutant emissions presented in the table were obtained from the Toxic Chemical Release Form R required by Section 313 of the Emergency Planning and Community Right-to-Know Act of 1986, also known as Title IlM of the SuperfundAmendments and Reauthorization Act. These emission rates were used as input into the ISCST2 model to estimate pollutant concentrations.
Modeling Assumptions. Additional model input used to estimate maximum pollutant concentrations at or beyond the NFS site boundary includes: criteria pollutant emissions modeled from stack 416 at a height of 33 m (108 ft), a stack diameter of 1.52 m (5 ft), an I exit velocity of 11.57 m/s (38 ft/s) (NF NRC 199 la:2-14), and an exit temperature of 177 *C (350 oF); toxic/hazardous pollutant emissions were modeled from a centrally located stack in the Building 300 complex at a height of 10 m (32.8 ft), a stack diameter of 0.3 m (1 ft), an exit velocity of 0.03 m/s (0.1 ft/s), and an exit temperature equal to ambient temperature.
Atmospheric Dispersion Characteristics. Meteorological data collected at NFS for the period March 1994 through February 1995 indicate that unstable atmospheric conditions occur approximately
C-9

77 percent of the time, neutral conditions approximately 22 percent of the time, and stable conditions approximately 1 percent of the time.
Annual Mean Wind Speeds and Direction Frequencies. The onsite meteorological data for wind speed and direction for the period March 1994 through February 1995 are presented in Figure C.1.7-1 as a wind rose. As shown in this figure, the maximnum wind direction frequency is from the south-southwest with a secondary maximum from the north-northwest. The mean wind speed from the south-southwest is 3 m/s (6.7 mph) and from the north-northwest is 3 m/s (6.7 mph), while the maximum mean wind speed is 3.6 m/s (8.1 mph) from the south-southeast.
C.2
Dispos Enrich
Potential ambient air quality impacts of the emissions that result from operating the HEU conversion and blending facilities at each site were analyzed using ISCST2 as described in Section C.1.2. The source of the blending facility emissions is assumed to be that which is described under the section, Modeling Assumptions, for each of the candidate sites. The model input data include the emission inventories for each of the blending facilities as presented in Tables C.2-1 through C.2-4.
N
ENEWNW
WA
WSW
ý Wind Direction Frequency (percent)
26621HEUI Source: NFS 1995b:2
Figure C.L7-1. Nuclear Fuel Services, Meteorological Data, March 1994 through February 1995.
C-10
ESE
Mean Wind Speed (m/sec)
__________ .. . -.
ition of Surplus Highly ed Uranium Final EIS
AIR QUALITY IMPACTS OF BLENDING FACILITIES

Air Quality and Noise
I
Pollutant Carbon monoxide (CO) Lead (Pb) Nitrogen dioxide (NO2) Ozone (03)b
Particulate matter (PM10) Sulfur dioxide (SO2)
Total suspended particulates (TSP)
Emission Rate (kgyr)
1,260 a
2,600 106 125
4,700 13,000
a No emissions from this process.
b Based on estimated generation of VOCs.
Note: kg=kilogram; yr=year.
| Source: OR LMES 1995c.
I [Table deleted.]
NOISE
INTRODUCTION
This section provides a summary of local noise regulations. A qualitative discussion ef operation noise sources and the potential for noise impacts is provided
Table C.2-1. Emission Rates of Pollutants for a Conversion and Blending Facility
Highly Enriched Uranium to Low-Enriched Uranium as Uranyl Nitrate Hexahydrate for the
Department of Energy Sites
Emission Rate Pollutant (kglyr)
Carbon monoxide (CO) 2,160
Lead (Pb) a
Nitrogen dioxide (NO2) 7,300
Ozone (03)b 215
Particulate matter (PM10) 170
Sulfur dioxide (SO2) 13,500
Total suspended particulates (TSP) 37,000 'No emissions from this process. b Based on estimated generation of volatile organic
compounds (VOCs). Note: kg=kilogram; yr-year. Source: OR LMES 1995b.
[Table deleted.]
Table C.2-2. Emission Rates of Pollutants for a Conversion and Blending Facility
Highly Enriched Uranium to Low-Enriched Uranium as Metalfor the Y-12 Plant
C-11I
Table C.2-3. Emission Rates of Pollutants for a Conversion and Blending Facility
Highly Enriched Uranium to Low-Enriched Uranium as Uranyl Nitrate Hexahydrate for
Two Commercial Sites
Emission Rate Pollutant (kglyr)
Carbon monoxide (CO) 2,172
Lead (Pb) a
Nitrogen dioxide (NO2) 1,089
Ozone (03)P 200
Particulate matter (PMIo)c 169
Sulfur dioxide (S02) 1,956
Total suspended particulates (TSP)c 169 a No emissions for this process. b Based on estimated generation of VOCs. C It is conservatively assumed that all PM10 emissions are TSP
emissions. Note: kg=kilogram; yr-year. Source: OR LMES 1995b; ORR 1995a:9.
Table C.2-4. Emission Rates of Pollutants for a
Conversion and Blending FacilityHighly Enriched Uranium to Low-Enriched
Uranium as Uranium Hexafluoride for Two Commercial Sites
Emission Rate Pollutant (kg/yr)
Carbon monoxide (CO) 2,258
Lead (Pb) a
Nitrogen dioxide (NO2) 1,433
Ozone (0 3)b 200
Particulate matter (PMIo)c 203
Sulfur dioxide (SO2) 2,934
Total suspended particulates (TSP)C 203
Gaseous fluorides (as HF) d 'No emissions for this process. b Based on estimated generation of VOCs. c It is conservatively assumed that all PM10 emissions am TSP
emissions. d Trace
Note: kg=kilogram; yrzyear.
] Source: OR LMES 1995a; ORR 1995a:9.
in Sections 3.3.3, 3.4.3, 3.5.3, and 3.6.3, Affected Environment, and 4.3.1.2,4.3.2.2,4.3.3.2,4.3.4.2, and
14.6.2.2, Environmental Consequences.
I
C.3
C.3.1
Disposition of Surplus Highly Enriched Uranium Final EIS
The Occupational Safety and Health Administration. (OSHA) standards for occupational noise exposure (29 CFR 1910) are applicable for worker protection at the site.
C.3.2 SUPPORTING DATA
This section provides a discussion of local noise regulations and presents any avIailable sound level monitoring data for the sites. There are no community noise regulations applicable to B&W and NFS.
C.3.2.1 Oak Ridge Reservation
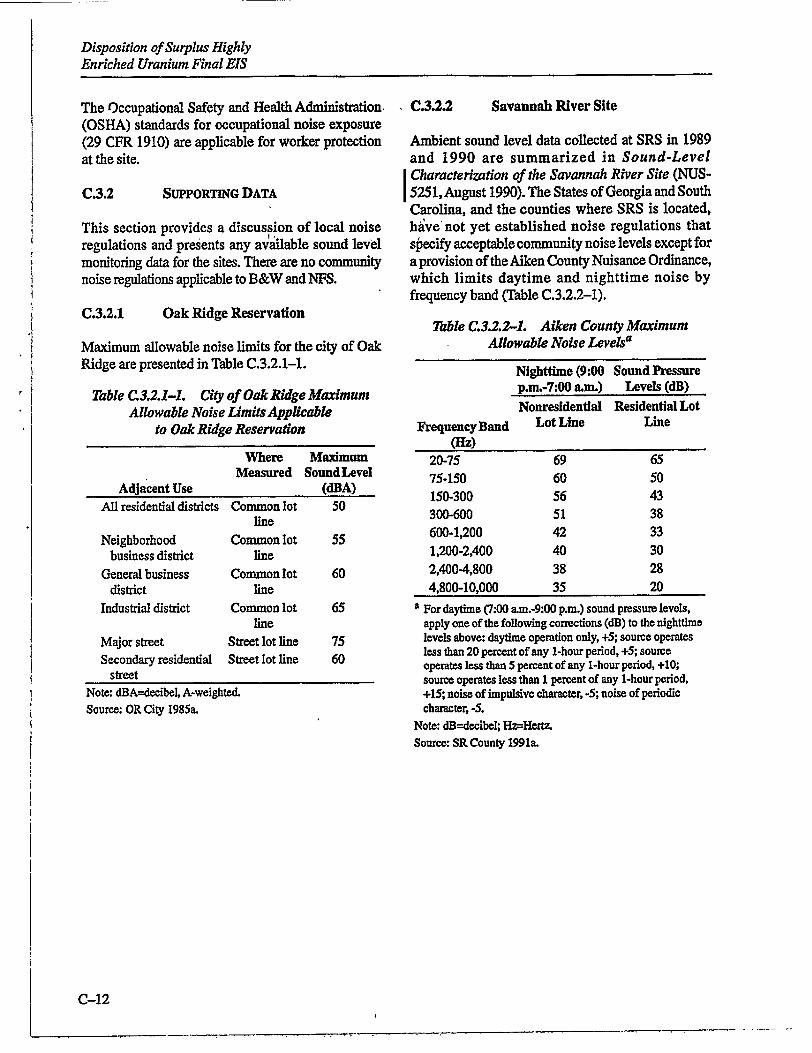
Maximum allowable noise limits for the city of Oak Ridge are presented in Table C.3.2.1-1.
Table C.3.2.1-1. City of Oak Ridge Maximum Allowable Noise Limits Applicable
to Oak Ridge Reservation
Where Maximum Measured SoundLevel
Adjacent Use (dBA) All residential districts Common lot 50
line Neighborhood Common lot 55
business district line General business Common lot 60
district line Industrial district Common lot 65
line Major street Street lot line 75 Secondary residential Street lot line 60
street Note: dBA-decibel, A-weighted. Source: OR City 1985a.
I C.3.2.2 Savannah River Site
Ambient sound level data collected at SRS in 1989 and 1990 are summarized in Sound-Level I Characterization of the Savannah River Site (NUS5251, August 1990). The States of Georgia and South Carolina, and the counties where SRS is located, have not yet established noise regulations that specify acceptable community noise levels except for a provision of the Aiken County Nuisance Ordinance, which limits daytime and nighttime noise by frequency band (Table C.3.2.2-1).
Table C.3.2.2-1. Aiken County Maximum Allowable Noise Levelsa
Nighttime (9:00 Sound Pressure p.m.-7:00 a.m.) Levels (dB) Nonresidential Residential Lot
FrequencyBand Lot Line Line (11)
20-75 69 65 75-150 60 50 150-300 56 43 300-600 51 38 600-1,200 42 33 1,200-2,400 40 30 2,400-4,800 38 28 4,800-10,000 35 20
a For daytime (7:00 am.-9:00 p.m.) sound pressure levels, apply one of the following corrections (dB) to the nighttime levels above: daytime operation only, +5; source operates less than 20 percent of any 1-hour period, +5; source operates less than 5 percent of any 1-hour period, +10; source operates less than I percent of any 1-hour period, +15; noise of impulsive character, -5; noise of periodic character, -5.
Note: dB=decibel; Hz=Hertz. Source: SR County 1991a.
C-12

Biotic Resources
Appendix D Biotic Resources
D.1 INTRODUCTION
This appendix includes a listing of the scientific names of common, nonthreatened, and nonendangered plant and animal species found in the
text. Additionally, tables are presented listing flora and fauna identified by the U.S. Fish and Wildlife Service (USFWS), National Marine Fisheries Service, and State governments as threatened, endangered, or other special status. Special status
species include State classifications such as species of concern, or species in need of management. [Text
deleted.] The threatened, endangered, and special status lists include all such species as could
potentially occur in a site area regardless of their
residence status (that is, breeding, year round,
summer, winter, or migratory) or likelihood of being
affected by project actions. Table D.1-1 lists nonthreatened and nonendangered plant and animal
species for the four sites. Tables D.1-2 through D.1-5 list Federal- and State-listed threatened, endangered, and other species' status for all four sites. All tables list species in alphabetical order by common name.
D-1

Disposition of Surplus Highly Enriched Uranium Final EIS
Table D.1-1. Scientific Names of Common Nonthreatened and Nonendangered Plant and Animal Species Referred to in the Text
Common Name Mammals
Beaver Black bear Eastern cottontail Eastern gray squirrel Feral hog
Gray fox House mouse Mink Opossum
Raccoon Red fox White-footed mouse
Whitetail deer Birds
Carolina chickadee
Common crow European starling Great homed owl Mourning dove Northern bobwhite Northern cardinal Red-tailed hawk Ruffed grouse Wild turkey
Reptiles
Eastern box turtle Eastern garter snake
Amphibians American toad Slimy salamander
Fish American shad
Black crappie Bluegill
Bream
Scientific Name
Castor canadensis Ursus americanus Sylvilagusfloridanus Sciurus carolinensis Sus scrofa Urocyon cinereoargenteus Mus musculus Mustela vison Didelphis marsupialis Procyon lotor Vulpes vulpes Peromyscus leucopus Odocoileus virginianus
Parus carolinensis Corvus brachyrhynchos Sturnus vulgaris Bubo virginianus Zenaida macroura Colinus virginianus Cardinalis cardinalis Buteojamaicensis Bonasa umbellus Meteagris gallopavo
Terrapene carolina Thamnophis sirtalis
Bufo americanus Plethodon glutinosus
Alosa sapidissima Pomoxis nigromaculatus Lepomis macrochirus Lepomis spp.
Common Name Fish (continued)
Catfish Central stoneroller Common carp Crappie Drum Herring Hickory shad Lake chubsucker Largemouth bass Mosquitofish Mud sunfish Olive darter Pickerel Redfin pickerel Sauger Shad Smallmouth bass Spotted bass Striped bass Sunfish White crappie
Plants Hemlock Hickory Loblolly pine Longleaf pine Oak Post oak Red oak Shortleaf pine Slash pine Virginia pine White oak Whitepine Yellow-poplar
Scientific Name
Ictalurus spp.
Campostoma Cyprinus carpio
Pomoxis spp.
Aplodinotus sp.
Alosa sp.
Alosa mediocris Erimyzon sucetta Micropterus salmoides
Gambusia affinis Acantharchus pomotis Percina squamata
Esox spp. Esox americanus Stizostedion canadense Clupeidae
Micropterns dolomieu Micropterus punctulatus
Morone saxatilis Lepomis spp. Pomoxis annularis
Tsuga canadensis Carya spp. Pinus taeda
Pinus palustris Quercus spp. Quercus stelata Quercus rubra Pinus echinata Pinus efliottii
Pinus virginiana
Quercus alba
Pinus strobus
Liriodendron tulipfera
D-2
------- - -- - ~ - , ----------- --

Mammals j Alleghany woodrat
Eastern cougarb Eastern small-footed bat Gray bat' Indiana bat'
j Rafinesque's big-eared bat River otter Smoky shrew Southeastern shrew
Birds American peregrine falconb
Appalachian Bewick's wren Arctic peregrine falcon Bachman's sparrow Bald eaglebG Barn owid Cooper's hawkd Grasshopper sparrow Northern harrier Ospreyd Red-cockaded woodpecker Sharp-shinned hawkd Swainson's warbler
Reptiles Eastern slender glass lizard Northern pine snake
Amphibians [Text deletedl Hellbenderd Tennessee cave salamander
Fish Alabama shad Amber darter Blue sucker Flame chub Frecklebelly madtom I-ighfin carpsucker Spotfin chubb Tennessee daced Yellowfin madtomb
Neooroma magister Fells concolor couguar
Myotis Ieibii
Myotis grisescens
Myotis soda!is
Plecotus rafinesquii
Lutra canadensis
Sorexfumeus Sorex longirostris
Falco peregrinus anatum
Thryomanes bewickii altus
Falco peregrinus tundrius
Aimophila aestivalis
Haliaeetus leucocephalus
Tyto alba
Accipiter cooperli
Ammodramus savannarum
Circus cyaneus
Pandion haliaetus
Picoides borealis
Accipiter striatus
Limnothtypis swainsonii
Ophisaurus attenuatus longicaudus
Pituophis melanoleucus melanoleucus
Cryptobranchus alleganiensis
Gyrinophiluspalleucus
Alosa alabamae Percina antesella
Cycleptus elongatus
Hemitremiaflammea Noturus munitus
Carpiodes velifer
Cyprinella monacha
Phoxinus tennesseensis
Noturusflavipinnis
NL E
NL E E
NL NL NL NL
E NL
E (S/A) NL T
NL NL NL NL NL E
NL NL
NL NL
NL NL
NL E
NL NL NL NL T
NL T
D E D
E E D T D
D
E T B E T D D D D T E D D
D T
D T
D E T D T
D E D E
D-3
f
Biotic Resources
! Table D.1-2. Federal- and State-Listed Threatened, Endangered, and Other Special Status Species That
May Be Found on the Site or in the Vicinity of Oak Ridge Reservation
Statusa
Common Name Scientific Name Federal State

Disposition of Surplus Highly Enriched. Uranium Final EIS
Table D.1-2. Federal- and State-Listed Threatened, Endangered, and Other Special Status Species That May Be Found on the Site or In the ,icluntty of Oak Ridge Reservation-Continued
Statusa Common Name Scientific Name Federal State
InvertebratesAlabama lampmusselb Appalachian monkeyface
pearlymusselb Birdwing pearlymusselb Cumberland bean pearlymusselb Cumberland monkeyface
pearlymusselb Dromedary pearlymusselb Fine-rayed pigtoeb
Green-blossom pearlymusseib Orange-footed pearlymusselb Painted snake coiled forest snail Pale lilliput pearlymusselb Pink mucket pearlymusselb Rough pigtoeb Shiny pigtoeb
Tan riffieshellb Tubercled-blossom pearlymusselb Turgid-blossom pearlymusseib White wartyback pearlymusselb Yellow-blossom pearlymusselb
Plants American barberry American ginsengd Appalachian bugbaned Auriculate false-foxglove
J Branching whltlowgrass Butternutd Canada (wild yellow) lilyd Carey's saxifraged Fen orchidd Golden seald Gravid sedged Heartleafmeehania Heller's catfoot Lesser ladies' tressesd Michigan lilyd Mountain honeysuckle Mountain witch alderd Northern bush honeysuckled Nuttall waterweedd Pink lady's-slipperd
Lampsilis virescens Quadrula sparsa
Conradilla caelata Villosa trabalis
Quadrula intermedia
Dromus dromas Fusconaia cuneolus Epioblasma torulosa gubernaculum Plethobasus cooperianus Anguispira picta Toxolasma cylindrellus Lampsilis abrupta Pleurobema plenum Fusconaia cor Epioblasma walkeri Epioblasma torulosa torunosa Epioblasma turgidula Plethobasus cicatricosus Epioblasmaflorentinaflorentina
Berberis canadensis Panax quinquefolius Cimicifuga rubifolia Tomanthera auriculata Draba ramosissima
Juglans cinerea Lilium canadense
Saxifraga careyana Liparis loeselii Hydrastis canadensis Carex gravida
Meehania cordata Gnaphalium helleri Spiranthes ovalis Lilium michiganense Lonicera dioica Fothergilla major Diervilla lonicera Elodea nuttallii Cypripedium acaule
D-4
E
,E
E E
E E E
E T E
E E
E E E E E
NL NL NL NL NL NL NL NL NL NL NL NL NL NL NL NL NL NL NL NL
E E
E E E
E E E E E E E E E E E E E
Spc T T E
SpC T T
SpC E T
SpC T
SpC SpC T
SpC T T
SpC E

Biotic Resources
Table D.1-2. Federal- and State-Listed Threatened, Endangered, and Other Special Status Species That
May Be Found on the Site or in the Vcinity of Oak Ridge Reservation-Continued
Status'
Common Name Scientific Name Federal State
Plants (continued) Prairie goldenrod Solidago ptarmicoides NL E
Purple fringeless orchidd Ploaanthera peramoena NL T
Slender blazing star Liatris cylindracea NL E
Spreading false foxgloved Aureolariapatuta NL T
Swamp lousewort Pedicularis lanceolata NL T
Tall larkspurd Delphinium exaltatum NL E
Tennessee purple coneflowerb Echinacea tenresseenis E E
Tubercled rein-orchidd Platantheraflava var herbiola NL T
Virginia spirea Spiraea virginiana T E
Whorled mountainmint Pycnanthemum verticillatum NL E-P
a Status codes: D=deemed in need of management; E=endangered; NL--notlisted; P=possibly extirpated; S/A=protected under the
similarity of appearances provision of the Endangered Species Acr SpC=special concern; T=threatened.
b USFWS Recovery Plan exists for this species.,
0 Observed near ORR on Melton -ill and Watts Bar Lakes.
d Recent record of species occurrence on OREL
Source: 50 CFR 17.11; 50 CER 17.12; DOE 1995w; ORDOE 1990a; ORFWS 1992b; OR NERP 1993a; ORNL 1981a; ORNL
So 1984b; ORNL 1988c; TN DEC 1995a; IN DEC 1995b; TN DEC 1995c; TN DEC 1995d; TN WRC 1991a; TN WRC
1991b.
t
D-5

Disposition of Surplus Highly Enriched Uranium Final EIS
Table D.1-3. Federal. and State-Listed Threatened, Endangered, and Other Special Status Species That May Be Found on the Site or in the Vicinity of Savannah River Site
Statusa
Common Name Scientific Name Federal StateMammals
Meadow vole Rafinesque's big-eared batb
Southern Appalachian eastern woodratb
j Spotted skunkb Star-nosed moleb
Swamp rabbit Birds
American peregrine falconbC
American swallow-tailed kite Appalachian Bewick's wrenb
Arctic peregrine falcon1b
[Text deleted.] Bald eaglebc Barn owlb Common ground doveb Cooper's hawkb
[Text deleted.] Kirtland's warbler1
Mississippi kiteb
Red-cockaded woodpeckerbIC Red-headed woodpeckerb Swainson's warblerb Wood storkb
Reptiles American alligatorb
Carolina swamp snakeb Eastern coral snakeb Green water snakeb
[Text deleted.] Spotted turtleb
Amphibians Carolina crawfish frogb Eastern bird-voiced treefrogb
Eastern tiger salamanderb
Northern cricket frog1
Pickerel frog1
Upland chorus frogb
Microtuspennsylvanicus Plecotus rafinesquii
Neotomafloridana haematorela
Spilogaleputorius Condylura cristata parva
Sylvilagus aquaticus
Falco peregrinus anatum
Elanoidesforficatus Thryomanes bewickii altus
Falco peregrinus tundrius
Haliaeetus leucocephalus Tyro alba
Columbina passerina Accipiter cooperii
Dendmica kirtiandii Ictinia mississippiensis
Picoides borealis Melanerpes erythrocephalus Limnothlypis swainsonji
Mycteria americana
Alligator mississippiensis Seminatrixpygaea Micrurusfulviusfulvius Nerodia cyclopion
Clemmys guttata
Rana areolata capito
Hyla avivoca ogechiensis Ambystoma tigrinum tigrinum
Acris crepitans crepitans Rana palustris Pseudacris triseriataferiarum
D-6
NL NL NL NL NL
NL
E NL NL
E (S/A)
T NL NL NL
E NL E
NL NL E
T (S/A) NL NL NL
NL
NL NL NL NL NL NL
SC SE SC SC SC SC
SE SE ST ST
SE SC ST SC
SE SC SE SC SC SE
NL SC SC SC
SC
SC SC SC SC SC SC

SBiotic Resources
Table D.1-3. Federal-. and State-Listed Threatened, Endangered, and Other Special Status Species That
May Be Found on the Site or in the Vicinity of Savannah River Site-Continued
Statusa
Common Name Scientific Name Federal State
Fish
[Text deleted.] Shortnose sturgeonb c
Invertebrates
[Text deleted.] Brother spike mussel
Plants
[Text deleted.] Beak-rushb Beak-rushb
Bog spice bushb [Text deleted.]
Cypress stump sedgeb
Durand's White Oak"
Dwarf bladderwortb Dwarf burheaib EUiott's crotonb
Few-fruited sedgeb
Florida bladderwort'
Florida false loosestrifeb Gaurab
Green-fringed orchidb Leafy pondweedb
Loose water-milfoib Milk-pea' Nailwortb Nestroniab Nutmeg hickoryb
Oconee azaleab
Pink tickseedb
Quill-leaved swamp potatob
Sandhil lilyb
Smooth coneflowerb
Trepocarpusb Wild water-celeryb Yellow cressb Yellow wild indigob
Acipenser brevirostrum
Eiiptiofraterna
Rhynchospora inundata Rhynchospora tracyi
Lindera subcoriacea
Carex decomposita
Quereus durandi
Utricularia olivacea
Echinodorusparvulus Croton elliottii
Carex oligocarpa
Utriculariaflorldana Ludwigia spathulata
Gaura biennis
Platanthera lacera
Potamogeton foliosus
Myriophyflum laxum
Astragalus villasus Paronychia americana
Nestronia umbellula Carya myrisqciformis Rhododendromflammeum
Coreopsis rosea
Sagittaria isoetiformis
Nolina georgiana
Echinacea laevigata
Trepocarpus aethusae
Vallisneria americana
Rorippa sessilijfora
Bautisia lanceolata
Status codes: E=endangered; NL--not listed; RC= regional of concern (unofficial, plants only); S/A-protected under the similarity
of appearances provision of the Endangered Species Act, SC=state of concern; SE=Statc endangered (official state list-animals
only); ST=State threatened (official state list-animals only); T=threatened. b Species occurrence recorded on SRS.
C USFWS Recovery Plan exists for this species.
d There is no official threatened or endangered status for plant species; defer to Federal standard.
Source: 50 CFR 17.11; 50 CFR 17.12; DOE 1992e; SC WD 1995a SR NERP 1990b; WSRC 1989e; WSRC 1993b.
D-7
E SE
SE
Sc SC RC
SC Sc Sc SC
SC SC
$C SC SC Sc
SC RC
SC SC SC RC
SC RC
SC SC
Sc
SC SC SC
NL
NL NL NL
NL NL NL NL NL NL NL NL NL NL NL NL NL NL NL NL NL NL NL NL E
NL NL NL NL
I I
Disposition of Surplus Highly Enriched Uranium Final EIS
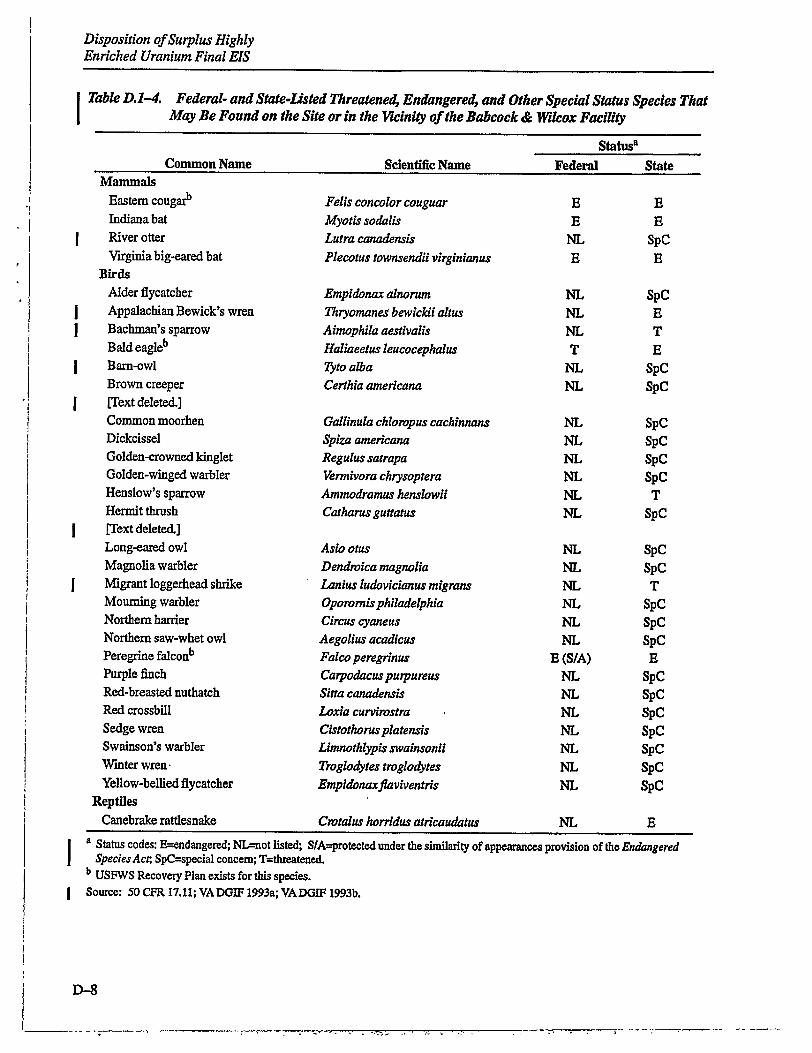
Table D.1-4. Federal- and State-Listed Threatened, Endangered, and Other Special Status Species That May Be Found on the Site or in the Vicinity of the Babcock & Wilcox Facility
Statusa Common Name Scientific Name Federal State
Mammals Eastern cougarb Indiana bat River otter Virginia big-eared bat
Birds Alder flycatcher
j Appalachian Bewick's wren Bachman's sparrow Bald eagleb Barn-owl Brown creeper [Text deleted.] Common moorhen Dickcissel Golden-crowned kinglet Golden-winged warbler Henslow's sparrow Hermit thrush [Text deleted.] Long-eared owl Magnolia warbler Migrant loggerhead shrike Mourning warbler Northern harrier Northern saw-whet owl Peregrine falconb Purple finch Red-breasted nuthatch Red crossbill Sedge wren Swainson's warbler Winter wren Yellow-bellied flycatcher
Reptiles Canebrake rattlesnake
Fells concolor couguar Myotis sodalis
Lutra canadensis Plecotus townsendii virginianus
Empidonax alnorum Thryomianesg bewickii altus Aimophila aestivalis
Haliaeetus leucocephalus Tyto alba Certhia americana
Gallinula chloropus cachinnans Spiza americana Regulus satrapa Vermivora chrysoptera Ammodramus henslowii Catharus guttatus
Asio otus Dendroica magnolia Lanius ludovicianus migrans Oporornis philadelphia Circus cyaneus Aegolius acadicus Falco peregrinus Carpodacus purpureus Sitta canadensis Loxia curvirostra Cistothorusplatensis Limnothlypis swainsonii Troglodytes troglodytes Empidonaxflaviventris
Crotalus horridus atricaudatus
E E
NL E
NL NL NL T
NL NL
NL NL NL NL NL NL
NL NL NL NL NL NL
E (S/A) NL NL NL NL NL NL NL
NL
E E
SpC E
SpC E T E
SpC SpC
SpC SpC SpC SpC T
SpC
SpC SpC T
SpC SpC SpC E
SpC SpC SpC SpC SpC SpC SpC
E
Ia Status codes: Efendangered; NL--not listed; $AA=protected under the similarity of appearances provision of the Endangered Species Acr, SpC=special concern; T=threatened. b USFWS Recovery Plan exists for this species. Source: 50 CFR 17.11; VADGIF 1993a; VADGIF 1993b.
D-8
I

Biotic Resources
Table D.1-5. Federal- and State-listed Threatened, Endangered, and Other Special Status Species That
May Be Found on the Site or in the Vicinity of the Nuclear Fuel Services Facility
Statusa
Common Name Scientific Name Federal State
Mammals Eastern cougarb Felis concolor couguar E E
Gray batt Myotis grisescens E E
Indiana batb Myods sodalis E E
River otter Lutra canadensis NL T
Birds Appalachian Bewick's wren Thryomanes bewickii altus NL T
Bachman's sparrow Aimophila aestivalis NL E
Bald eagleb Haliaeetus leucocephalus T T
[Text deleted.] Common raven Corvus corax NL T
Cooper's hawk Accipiter cooperii NL D
Golden eagle Aquila chrysaetos NL T
Grasshopper sparrow Ammodramus savannarum NL D
Northern harrier Circus cyaneus NL D
Osprey Pandion haliaetus NL T
Peregrine falconb Falcon peregrinus E (SIA) E
Red-cockaded woodpeckerb Picoides borealis E E
Sharp-shinned hawk Accipiter striatus NL D Reptiles
Northern pine snake Pituophis melanoleucus melanoleucus NL T
Amphibians Tennessee cave salamander GyrinophiIuspalleucus NL T
Fish Highfin carpsucker Carpiodes velifer NL D
Sharphead darter Etheostoma acuticeps NL D
I a Status codes: D=deemed in need of management; E=endangered; NL--not listed; S/A=protected under the similarity of appearances provision of the Endangered Species Act; T--fitened. b USFWS Recovery Plan exists for this species.
Source: 50 CFR 17.11; NFNRC 1991a; TN DEC 1995a.
D-9

Human Health
Appendix E Human Health
E.1 INTRODUCTION
Supplemental information on the potential impacts to humans from the normal operational releases of radioactivity and hazardous chemicals from the various blending technologies and their associated facilities is presented in this appendix. This information is intended to support assessments of normal operation for the highly enriched uranium (HEU) blending options described in the public and occupational health subsections of Sections 4.2
I through 4.3 of this environmental impact statement (EIS). Section E.2 provides information on radiological impacts during normal operations, while Section E.3 provides information on hazardous chemical impacts during normal operations. Section
A.4 provides information on health effects studies. Section E.5 describes radiological and hazardous chemical impacts during accident conditions.
E.2 RADIOLOGICAL IMPACTS TO HUMAN HEALTH
Section E.2 presents supporting information on the potential radiological impacts to humans during normal site operations. This section provides background information on the nature of radiation (Section E.2.1), the methodology used to calculate radiological impacts (Section E.2.2), and radiological releases from potential sites that could assume HEU blending processes (Section E.2.3).
E.2.1
E.2.1.1
BACKGROUND
Nature of Radiation and Its Effects on Humans
What is Radiation? Humans are constantly exposed to radiation from the solar system and from the earth's rocks and soil. This radiation contributes to the natural background radiation that has always surrounded us. But there are also man-made sources of radiation, such as medical and dental x-rays, household smoke detectors, and materials released from nuclear and coal-fired powerplants.
All matter in the universe is composed of atoms, and radiation comes from the activity of these tiny particles. Atoms are made up of even smaller particles (protons, neutrons, and electrons). The number and arrangement of these particles distinguishes one atom from another.
Atoms of different types are known as elements. There are over 100 natural and man-made elements. Some of these elements, such as uranium, radium, plutonium, and thorium, share a very important quality: they are unstable. As they change into more stable forms, invisible waves of energy or particles, known as ionizing radiation, are released. Radioactivity is the emitting of this radiation.
Ionizing radiation refers to the fact that this energy force can ionize, or electrically charge atoms by stripping off electrons. Ionizing radiation can cause a change in the chemical composition of many things, including living tissue (organs), which can affect the way they function.
The effects on people of radiation that is emitted during disintegration (decay) of a radioactive substance depends on the kind of radiation (alpha and beta particles, and gamma and x-rays) and the total amount of radiation energy absorbed by the body. Alpha particles are the heaviest of these direct types of ionizing radiation, and, despite a speed of about 16,000 kilometers per second (km/s) (9,940 miles per second [mi/s]), they can travel only several centimeters in the air. Alpha particles lose their energy almost as soon as they collide with anything. They can easily be stopped by a sheet of paper or the skin's surface.
Beta particles are much lighter than alpha particles. They camtravel as fast as 160,000 km/s (99,400 mi/s) and can travel in the air for a distance of about 3 meters (m) (9.8 feet [ft]). Beta particles can pass through a sheet of paper but may be stopped by a thin sheet of aluminum foil or glass.
Gamma and x-rays, unlike alpha or beta particles, are waves of pure energy. Gamma rays travel at the speed of light (300,000 km/s [186,000 mi/s]). Gamma
E-1

radiation is very penetrating and requires a thick wall of concrete, lead, or steel to stop it.
The neutron is another particle that contributes to radiation exposure, both directly and indirectly. Indirect exposure is associated with the gamma rays and alpha particles that are emitted following neutron capture in matter. Aneutron has about one qdarter the weight of an alpha particle and can travel at speeds of up to 39,000 km/s (24,200 mi/s). Neutrons are more penetrating than beta particles, but less than gamma rays.
The radioactivity of a material decreases with time. The time it takes a material to lose half of its original radioactivity is its half-life. For example, a quantity of iodine-131, a material that has a half-life of 8 days, will lose half of its radioactivity in that amount of time. In 8 more days, one-half of the remaining radioactivity will be lost, and so on. Eventually, the radioactivity will essentially disappear. Each radioactive element has a characteristic half-life. The half-lives of various radioactive elements may vary from millionths of a second to millions of years.
As a radioactive element gives up its radioactivity, it often changes to an entirely different element, one that may or may not be radioactive. Eventually, a stable element is formed. This transformation may take place in several steps and is known as a decay chain. Radium, for example, is a naturally occurring radioactive element with a half-life of 1,622 years. It emits an alpha particle and becomes radon, a radioactive gas with a half-life of only 3.8 days. Radon decays to polonium and, through a series of steps, to bismuth, and ultimately to lead.
Units of Radiation Measure. Scientists and engineers use a variety of units to measure radiation. These different units can be used to determine the amount, type, and intensity of radiation. Just as heat can be measured in terms of its intensity or its effects using units of calories or degrees, amounts of radiation can be measured in curies, rads, or reins.
The curie, named after the French scientists Marie and Pierre Curie, describes the "intensity" of a sample of radioactive material. The rate of decay of 1 gram of radium is the basis of this unit of measure. It is equal to 3.7x10 10 disintegrations (decays) per second.
The total energy absorbed per unit quantity of tissue is referred to as absorbed dose. The rad is the unit of measurement for the physical absorption of radiation. Much like sunlight heats the pavement by giving up an amount of energy to it, radiation gives up rads of energy to objects in its path. One rad is equal to the amount of radiation that leads to the deposition of 0.01 joule of energy per kilogram of absorbing material.
A roentgen equivalent man (rem) is a measurement of the dose from radiation based on its biological effects. The rem is used to measure the effects of radiation on the body, much like degrees Celsius can be used to measure the effects of sunlight heating pavement. Thus, 1 rem of one type of radiation is presumed to have the same biological effects as 1 rem of any other type of radiation. This standard allows comparison of the biological effects of radionuclides that emit different types of radiation.
An individual may be exposed to ionizing radiation externally from a radioactive source outside the body and/or internally from ingesting radioactive material. The external dose is different from the internal dose. An external dose is delivered only during the actual time of exposure to the external radiation source. An internal dose, however, continues to be delivered as long as the radioactive source is in the body, although both radioactive decay and elimination of the radionuclide by ordinary metabolic processes decrease the dose rate with the passage of time. The dose from internal exposure is calculated over 50 years following the initial exposure.
The three types of doses calculated in this EIS include an external dose, an internal dose, and a combined external and internal dose. Each type of dose is discussed below.
External Dose. The external dose can arise from several different pathways. The radiation causing the exposure is extarnal to the body in all of these pathways. In this EIS, these pathways include exposure to a cloud of radiation passing over the receptor, standing on ground that is contaminated with radioactivity, swimming in contaminated water, and boating in contaminated water. The appropriate measure of dose is called the effective dose equivalent. It should be noted that if the receptor departs from the source of radiation exposure, his
E-2
Disposition of Surplus Highly Enriched Uranium Final EIS

Human Health
dose rate will be reduced. It is assumed that external exposure occurs uniformly during the year.
Internal Dose. The internal dose arises from a radiation source entering the human body through either ingestion of contaminated food and water or inhalation of contaminated air. In this EIS, pathways for internal exposure include ingestion of crops contaminated either by airborne radiation depositing on the crops or by irrigation of crops using contaminated water sources, ingestion of animal products from animals that ingested contaminated food, ingestion of contaminated water, inhalation of contaminated air, and absorption of contaminated water through the skin during swimming. Unlike external exposures, once the radiation enters the body, it remains there for various periods of time, depending on decay and biological elimination rates.
The unit of measure for internal doses is the committed dose equivalent. It is the internal dose that each body organ receives from 1 "year intake" (ingestion plus inhalation). Normally, a 50- or 70-year dose-commitment period is used (that is, the
I-year intake period plus 49 or 69 years). The dose rate increases during the 1 year of intake. After the 1 year of intake, the does rate slowly declines as the radioactivity in the body continues to produce a dose. The integral of the dose rate over the 50 or 70 years gives the committed dose equivalent. In this EIS, a 50-year dose-commitment period was used.
The various organs of the body have different susceptibilities to harm from radiation. The quantity that takes these different susceptibilities into account to provide a broad indicator of the risk to the health of an individual from radiation is called the committed effective dose equivalent. It is obtained by
multiplying the committed dose equivalent in each major organ or tissue by a weighting factor
associated with the risk susceptibility of the tissue or organ, then summing the totals. It is possible that the committed dose equivalent to an organ is larger than the committed effective dose equivalent if that organ has a small weighting factor. The concept of committed effective dose equivalent applies only to internal pathways.
Combined External and Internal Dose. For convenience, the sum of the committed effective dose equivalent from internal pathways and the effective dose equivalent from external pathways is
also called the committed effective dose equivalent in this EIS (note that in DOE Order 5400.5, this quantity is called the effective dose equivalent).
The units used in this EIS for committed dose
equivalent, effective dose equivalent, and committed effective dose equivalent to an individual are the rem
and mrem (1/1000 of I rem). The corresponding unit for the collective dose to a population (the sum of the doses to members of the population, or the product of
the number of exposed individuals and their average dose) is the person-rem.
Sources of Radiation. The average person in the United States receives a total of about 350 millirem
per year (mremlyr) from all sources of radiation, both natural and man-made. The sources of radiation can be divided into six different categories: cosmic radiation, terrestrial radiation, internal radiation, consumer products, medical diagnosis and therapy, and other sources. Each category is discussed below.
Cosmic radiation is ionizing radiation resulting from energetic charged particles from space continuously hitting the earth's atmosphere. These particles and the secondary particles and photons they create are cosmic radiation. Because the atmosphere provides some shielding against cosmic radiation, the intensity of this radiation increases with altitude above sea level. For the sites considered in this EIS, the cosmic radiation ranged from about 27 to 45 niremlyr. The average annual dose to the people in the United States is about 27 mrem.
External terrestrial radiation is the radiation emitted from the radioactive materials in the earth's rocks and soils. The average annual dose from external terrestrial radiation is about 28 mrem. The external terrestrial radiation for the sites in this EIS ranged from about 28 to 70 mrem/yr.
Internal radiation arises from the human body metabolizing natural radioactive material that has entered the body by inhalation or ingestion. Natural radionuclides in the body include isotopes of uranium, thorium, radium, radon, polonium, bismuth, potassium, rubidium, and carbon. The major contributor to the annual dose equivalent for internal radioactivity are the short-lived decay products of radon, which contribute about
E-3

Disposition of Surplus Highly Enriched Uranium Final EIS
200 mrem/yr. The average dose from other internal radionuclides is about 39 norem/yr.
Consumer products also contain sources of ionizing radiation. In some products, like smoke detectors and airport x-ray machines, the radiation source is essential to the products' operation. In other products, such as television and tobacco, the radiation occurs incidentally to the product function. The average annual dose is about 10 mrem.
Radiation is an important diagnostic medical tool and cancer treatment. Diagnostic x-rays result in an average annual exposure of 39 mrem. Nuclear medical procedures result in an average annual exposure of 14 mrem.
There are a few additional sources of radiation that contribute minor doses to individuals in the United States. The dose from nuclear fuel cycle facilities, such as uranium mines, mills and fuel processing plants, nuclear power plants, and transportation routes, has been estimated to be less than I mrem/yr. Radioactive fallout from atmospheric atomic bomb tests, emissions of radioactive material from Department of Energy (DOE) and Nuclear Regulatory Commission (NRC) facilities, emissions from certain mineral extraction facilities, and transportation of radioactive materials contributes less than 1 mrem/yr to the average dose to an individual. Air travel contributes approximately 1 mremryr to the average dose.
The collective (or population) dose to an exposed population is calculated by summing the estimated doses received by each member of the exposed population. This total dose received by the exposed population is measured in person-rem. For example, if 1,000 people each received a dose of 1 millirem (0.001 rem), the collective dose is 1,000 persons x 0.001 rem = 1 person-rem. Alternatively, the same collective dose (1 person-rem) results from 500 people, each of whom received a dose of 2 millirem (500 persons x 2 millirem = 1 person-rem).
Limits of Radiation Exposure. The amount of man-made radiation that the public may be exposed to is limited by Federal regulations. Although most scientists believe that radiation absorbed in small doses over several years is not harmful, U.S.
E-4
Government regulations assume that the effects of all radiation exposures are cumulative.
The exposure to a member of the general public from DOE facility releases into the atmosphere is limited by the Environmental Protection Agency (EPA) toWan annual dose of 10 mrem, in addition to the natural background and medical radiation normally received (40 CFR 61, Subpart H). DOE also limits to 10 mrem the ddse annually received from material released into the atmosphere (DOE Order 5400.5). EPA and DOE also limit the annual dose to a member of the general public from radioactive releases to drinking water to 4 mrem (40 CFR 141; DOE Order 5400.5). The annual dose from all radiation sources from a site is limited by the EPA to 25 mrem (40 CFR 190). The DOE annual limit of radiation dose to a member of the general public from all DOE facilities is 100 mrem total from all pathways (DOE Order 5400.5).
The NRC limits depend on whether the site contains nuclear power reactors or other NRC-licensed facilities. For other-than-power-reactors, the EPA limits discussed above apply. For power-reactor sites, the guideline dose values that demonstrate compliance with the as low as reasonably achievable (ALARA) philosophy apply. These limit the annual doses to a member of the public to 5 mrem from airborne emissions and to 3 mrem (per reactor) from liquid releases (10 CFR 50 Appendix I). The annual total dose limit from all pathways combined is the same as the EPA limit of 25 rnrem (40 CFR 190). For people working in an occupation that involves radiation, DOE and the NRC limit doses to 5 rem (5,000 mrem) in any one year (10 CFR 20; 10 CFR 835).
E.2.1.2 Health Effects
Radiation exposure and its consequences are topics of interest to the general public. For this reason, this EIS places much emphasis on the consequences of exposure to radiation, even though the effects of radiation exposure under most circumstances evaluated in this EIS are small. This section explains the basic concepts used in the evaluation of radiation effects in order to provide the background for later discussion of impacts.
Radiation can cause a variety of ill-health effects in people. The most significant ill-health effect to depict
Disposition
of Surplus Highly
Enriched
Uranium Final EIS
Human Health
the consequences of environmental and occupational radiation exposure is induction of cancer fatalities. This effect is referred to as "latent" cancer fatalities because the cancer may take many years to develop and for death to occur and may not actually be the cause of death. In the discussions that follow, it should be noted that all fatal cancers are latent and the term "latent" is not used.
Health impacts from radiation exposure, whether from sources external or internal to the body, generally are identified as "somatic" (affecting the individual exposed) or "genetic" (affecting descendants of the exposed individual). Radiation is more likely to produce somatic effects than genetic effects. Therefore, for this EIS, only the somatic risks are presented. The somatic risks of most importance are the induction of cancers. Except for leukemia, which can have an induction period (time between exposure to carcinogen and cancer diagnosis) of as little as 2 to 7 years, most cancers have an induction period of more than 20 years.
For a uniform irradiation of the body, the incidence of cancer varies among organs and tissues; the thyroid and skin demonstrate a greater sensitivity than other organs. However, such cancers also produce relatively low mortality rates because they are relatively amenable to medical treatment. Because of the readily available data for cancer mortality rates and the relative scarcity of prospective epidemiologic studies, somatic effects leading to cancer fatalities rather than cancer incidence are presented in this EIS. The number of cancer fatalities can be used to compare the risks among the various alternatives.
The fatal cancer risk estimators presented in this appendix for radiation technically apply only to low-Linear Energy Transfer radiation (gamma rays and beta particles). However, on a per rem rather than a per rad basis, the fatal risk estimators are higher for this type of radiation than for high-Linear Energy Transfer radiation (alpha particles). In this EIS, the low-Linear Energy Transfer risk estimators are conservatively assumed to apply to all radiation exposures.
The National Research Council's Committee on the Biological Effects of Ionizing Radiations (BEIR) has prepared a series of reports to advise the U.S. Government on the health consequences of radiation
exposures. The latest of these reports, Health Effects of Exposure to Low Levels of Ionizing Radiation BEIR V, published in 1990, provides the most current estimates for excess mortality from leukemia and cancers other than leukemia expected to result from exposure to ionizing radiation. The BEIR V report updates the models and risk estimates provided in the earlier report of the BEIR III Committee, The Effects of Populations of Exposure to Low Levels of Ionizing Radiation, published in 1980. BEIR V models were developed for application to the U.S. population.
BEIR V provides estimates that are consistently higher than those in BHEIR III. This is attributed to several factors, including the use of a linear dose response model for cancers other than leukemia, revised dosimetry for the Japanese atomi6 bomb survivors, and additional followup studies of the atomic bomb survivors and other cohorts. BEIR In employs constant relative and absolute risk models, with separate coefficients for each of several sex-and-age-at-exposure groups, while BEIR V develops models in which the excess relative risk is expressed as a function of age at exposure, time after exposure, and sex for each of several cancer categories. BEIR IIl models were based on the assumption that absolute risks are comparable between the atomic bomb survivors and the U.S. population, while BEIR V models were based on the assumption that the relative risks are comparable. For a disease such as lung cancer, where baseline risks in the United States are much larger than those in Japan, the BEIR V approach leads to larger risk estimates than the BEIR II approach.
The models and risk coefficients in BEIR V were derived through analyses of relevant epidemiologic data including the Japanese atomic bomb survivors, ankylosis spondylitis patients, Canadian and Massachusetts fluoroscopy patients (breast cancer), New York postpartum mastitis patients (breast cancer), Israel Tinea Capitis patients (thyroid cancer), and Rocfester thymus patients (thyroid cancer). Models for leukemia, respiratory cancer, digestive cancer, and other cancers used only the atomic bomb survivor data, although results of analyses of the ankylosis spondylitis patients were considered. Atomic bomb survivor analyses were based on revised dosimetry with an assumed Relative Biological Effectiveness of 20 for neutrons and were restricted to doses of less than 400 rads. Estimates of
E-5

Disposition of Surplus Highly Enriched Uranium Final EIS
risks of fatal cancers other than leukemia were obtained by totaling the estimates for breast cancer, respiratory cancer, digestive cancer, and other cancers.
Risk Estimates for Doses Received During an Accident. BEIR V includes risk estimates for a single exposure of 10 rem to a population of 100,000 people (106 person-rem). In this case, fatality estimates for leukemia, breast cancer, respiratory cancer, digestive cancer, and other cancers are given for both sexes and nine age-at-exposure groups. These estimates, based on the linear model, are summarized in Table E.2.1.2-1. The average risk estimate from all ages and both sexes is 885 excess cancer fatalities per million person-rem. This value has been conservatively rounded up to 1,000 excess cancer fatalities per million person-rem
Although values for other health effects are not presented in this EIS, the risk estimators for non-fatal cancers and for genetic disorders to future generations are estimated to be approximately 200 and 260 per million person-rem, respectively. These values are based on information presented in 1990 Recommendations of the International Commission on Radiological Protection (International Commission on Radiological Protection [ICRP] Publication 60) and are seen to be 20 and 26 percent, respectively, of the fatal cancer estimator. Thus, for example, if the number of excess fatal cancers is projected to be "X," the number of excess genetic disorders would be 0.26 times "X."
Risk Estimates for Doses Received During Normal Operation. For low doses and dose rates, a linear-quadratic model was found to provide a significantly better fit to the data for leukemia than a linear one, and leukemia risks were based on a linear-quadratic function. This reduces the effects by a factor of 2 over estimates that are obtained from the linear model. For other cancers, linear models were found to provide an adequate fit to the data and were used for extrapolation to low doses. However, the BEIR V Committee recommended reducing these linear estimates by a factor between 2 and 10 for doses received at low dose rates (20 rem total). For this EIS, a risk reduction factor of 2 was adopted for conservatism.
Based on the above discussion, the resulting risk estimator would be equal to one-half the value
Table E.2.1.2-1. Lifetime Risks per 100,000 Persons Exposed to a Single Exposure of 10 Rem
Type of Fatal Cancer
Cancers Other Than Total
Gender Leukemiaa Leukemia Cancers Male 220 660 880 Female 160 730 890 Average 190 695 885b
a These are the linear estimates and are double the linear-quadratic estimates provided in BEIR V for leukemia at low doses and dose rates.
b This value has been rounded up to 1,000 excess cancer fatalities per million person-rem.
Source: NAS 1990a.
observed for accident situations or approximately 500 excess fatal cancer per million person-rem (0.0005 excess fatal cancer per person-rem). This is the risk value used in this EIS to calculate fatal cancers to the general public during normal operations. For workers, a value of 400 excess fatal cancers per million person-rem (0.0004 excess fatal cancer per person-rem) is used in this EIS. This lower value reflects the absence of children in the workforce. Again, based on information provided in ICRP Publication 60, the health risk estimators for non-fatal cancers and genetic disorders among the public are 20 and 26 percent, respectively, of the fatal cancer risk estimator. For workers, they are both 20 percent of the fatal cancer risk estimator. For this EIS, only fatal cancers are presented.
The risk estimates may be applied to calculate the effects of exposing a population to radiation. For example, in a population of 100,000 people exposed only to natural background radiation (0.3 rem/yr), 15 latent cancer fatalities per year of exposure would be inferred to be caused by the radiation (100,000 persons x 0.3 rem/yr x 0.0005 latent cancer fatalities per person-rem = 15 latent cancer fatalities per year).
Sometimes, calculations of the number of excess cancer fatalities associated with radiation exposure do not yield whole numbers and, especially in environmental applications, may yield numbers less than 1.0. For example, if a population of 100,000 were exposed as above, but to a total dose of only 0.001 rem, the collective dose would be 100 person-rem, and the corresponding estimated number of latent cancer fatalities would be 0.05
E-6

Human Health
(100,000 persons x 0.001 rem x 0.0005 latent cancer fatalities/person-rem = 0.05 latent fatal cancers).
I [Text deleted.] Since 0.05 is not an integral number, the interpreting of nonintegral numbers of latent
cancer fatalities needs to be defined. The answer is to
interpret the result as a statistical estimate. That is,
0.05 is the average number of deaths that would
result if the same exposure situation were applied to
many different groups of 100,000 people. In most
groups, no person (zero people) would incur a latent
cancer fatality from the 0.001 rem dose each member
would have received. In a small fraction of the
groups, one latent fatal cancer would result; in
exceptionally few groups, two or more latent fatal
cancers would occur. The average number of deaths
over all the groups would be 0.05 latent fatal cancers
(just as the average of 0, 0, 0, and 1 is 114, or 0.25).
The most likely outcome is zero latent cancer fatalities.
These same concepts apply to estimating the effects
of radiation exposure on a single individual. Consider
the effects, for example, of exposure to background
radiation over a lifetime. The "number of latent
cancer fatalities" corresponding to a single
individual's exposure over a (presumed) 72-year
lifetime to 0.3 rem/yr is the following:
1 person x 0.3 rem/yr x 72 years x 0.0005 latent cancer fatalities/person-rem =
0.011 latent cancer fatalities.
Again, this should be interpreted in a statistical sense;
that is, the estimated effect of background radiation
exposure on the exposed individual would produce a
1.1-percent chance that the individual might incur a
latent fatal cancer caused by the exposure. Presented
another way, this method estimates that
approximately 1.1 percent of the population might
die of cancers induced by the background radiation.
E.2.2 METHODOLOGY FOR ESTIMATING
RADIOLOGICAL IMPACTS OF
NORMAL OPERATION
The radiological impacts of normal operation of
reactors and support facilities were calculated using
Version 1.485 of the GENII computer code (GENII
The Hanford Environmental Radiation Dosimetry
Software System [December 1988]). Site-specific and
technology-specific input data were used, including location, meteorology, population, food production and consumption, and source terms. The GENII code
was used for analysis of normal operations and
design basis accidents. Section E.2.2.1 briefly
describes GENII and outlines the approach used for normal operations.
E.2.2.1 GENII Computer Code
The GENII computer model, developed by Pacific Northwest Laboratory for DOE, is an integrated
system of various computer modules that analyze
environmental contamination resulting from acute or
chronic releases to, or initial contamination in, air,
water, or soil. The model calculates radiation doses to
individuals and populations. The GENII computer
model is well documented for assumptions, technical
approach, methodology, and quality assurance issues.
The GENII computer model has gone through
extensive quality assurance and quality control steps.
These include the comparison of results from model
computations against those from hand calculations,
and the performance of iaternal and external peer
reviews. Recommendations given in these reports
were incorporated into the final GENII computer model, as deemed appropriate.
For this EIS, only the ENVIN, ENV, and DOSE
computer modules were used. The codes are
connected through data transfer files. The output of
one code is stored in a file that can be used by the next
code in the system. In addition, a computer code
called CREGENII was prepared to aid the user with
the preparation of input files into GENII.
CREGENJI. The CREGENII code helps the user,
through a series of interactive menus and questions,
prepare a text input file for the environmental
dosimetry programs. In addition, CREGENII
prepares a batch processing file to manage the file
handling needed to control the operations of
subsequent codes and to prepare an output report.
ENVIN.. The ENVIN module of the GENII code
controls the reading of the input files prepared by
CREGENII and organizes the input for optimal use in
the environmental transport and exposure module,
ENY. The ENVIN code interprets the basic input,
reads the basic GENII data libraries and other
optional input files, and organizes the input into
E-7

Disposition of Surplus Highly Enriched Uranium Final EIS
sequential segments on the basis of radionuclide decay chains.
A standardized file that contains scenario, control, and inventory parameters is used as input to ENVIN. Radionuclide inventories can be entered as functions of releases to air or water, concentrations in basic environmental media (air, soil, or water), or concentrations in foods. If certain atmospheric dispersion options have been selected, this module can generate tables of atmospheric dispersion parameters that will be used in later calculations. If the finite plume air submersion option is requested in addition to the atmospheric dispersion calculations, preliminary energy-dependent finite plume dose factors also are prepared. The ENVIN module prepares the data transfer files that are used as input by the ENV module; ENVIN generates the first portion of the calculation documentation-the run input parameters report.
ENV. The ENV module calculates the environmental transfer, uptake, and human exposure to radionuclides that result from the chosen scenario for the user-specified source term. The code reads the input files from ENVIN and then, for each radionuclide chain, sequentially performs the precalculations to establish the conditions at the start of the exposure scenario. Environmental concentrations of radionuclides are established at the beginning of the scenario by assuming decay of preexisting sources, considering biotic transport of existing subsurface contamination, and defining soil contamination from continuing atmospheric or irrigation depositions. Then, for each year of postulated exposure, the code estimates air, surface soil, deep soil, groundwater, and surface water concentrations of each radionuclide in the chain. Human exposures and intakes of each radionuclide are calculated for the following: (1) pathways of external exposure from atmospheric plumes, (2) inhalation, (3) external exposure from contaminated soil, sediments, and water, (4) external exposure from special geometries (that is, shielding parameters promulgated from topographic/geologic trends), and (5) internal exposures from consumption of terrestrial foods, aquatic foods, drinking water, animal products, and inadvertent intake of soil. The intermediate information on annual media concentrations and intake rates are written to data transfer files. Although these may be accessed
directly, they are usually used as input to the DOSE module of GENII.
GENII is a general purpose computer code used to model dispersion, transport, and long-term exposure I effects of specific radionuclides and pathways. [Text deleted.] GENII was chosen because it can model both air and surface transport pathways and is not restricted to any radionuclides.
DOSE. The DOSE module reads the annual intake and exposure rates defined by the ENV module and converts the data to radiation dose. External dose is calculated with precalculated factors from the EXTDF module or from a data file prepared outside of GENII. Internal dose is calculated with precalculated factors from the INTDF module.
EXTDF. The EXTDF module calculates the external dose-rate factors for submersion in an infinite cloud of radioactive materials, immersion in contaminated water, and direct exposure to plane or slab sources of radionuclides. EXTDF was not used. Instead, the dose rate factors listed in External Dose Rate Factors for Calculation of Dose to the Public
I (DOE/EH-0070, July 1988) were used for this EIS.
INTDF. Using Limits for Intakes of Radionuclides by Workers (ICRP Publication 30) model, the INTDF module calculates the internal (inhalation and ingestion) dose conversion factors of radionuclides for specific organs. The factors generated by INTDF were used for the calculations presented in this EIS.
E.2.2.2 Data and Assumptions
In order to perform the dose assessments for this EIS, different types of data must be collected and/or generated. In addition, calculational assumptions have to be made. This section discusses the data collected and/or generated for use in the dose assessment and assumptions made for this EIS.
Meteorological Data. The meteorological data used for both DOE sites were in the form of joint frequency data files. A joint frequency data file is a table listing the fractions of time the wind blows in a certain direction, at a certain speed, and within a certain stability class. The joint frequency data files were based on measurements over a 1-year period at various locations and at different heights at these two
E-8

Human Health
sites. Average meteorological conditions (averaged over the 1-year period) were used for normal operation. For use in design basis accidents, the 50
percentile option was used. For the other two sites, the meteorological data presented in Environmental Assessment for Renewal of Special Nuclear Material License No. SNM-42, Babcock & Wilcox Company, Naval Nuclear Fuel Division, Lynchburg, Virginia
I (Docket No. 70-27, August 1991) and Environmental
Assessment for Renewal of Special Nuclear Material
License No. SNM-124, Nuclear Fuel Services, Inc.,
Erwin Plant, Erwin, Tennessee (Docket No. 70-143, August 1991) were used.
Population Data. Population distributions were
based on 1990 Census of Population and Housing
data. Projections were determined for the year 2010
for areas within 80 km (50 mi) of the proposed facilities at each candidate site. The site population in
2010 was assumed to be representative of the
population over the operational period evaluated and
was used in the impact assessments. The population
was spatially distributed on a circular grid with 16
directions and 10 radial distances up to 80 km
(50 mi). The grid was centered on the facility from
which the radionuclides were assumed to be released.
Source Term Data. The source terms (quantities of
radionuclides released into the environment over a
given period) were estimated on the basis of latest conceptual designs of facilities, and experience with
similar facilities. The source terms used to generate the estimated impacts of normal operation are
provided in Section E.2.3 for the potential sites that
could assume HEU blending process facilities.
Source terms for site-dependent facilities are
included within this section.
Food Production and Consumption Data. Data
from the 1987 Census of Agriculture were used to
generate site-specific data for food production. Food
production was spatially distributed on the same
circular grid as was used for the population distributions. The consumption rates were those used
in GENII for the maximum individual and average
individual. People living within the 80-km (50-mi) assessment area were assumed to consume only food grown in that area.
Calculational Assumptions. Dose assessments were
performed. for members of the general public and
workers. Dose assessments for members of the public were performed for two different types of receptors considered in this EIS: a maximally exposed offsite
individual and the general population living within
80 kma (50 mi) of the facility. It was assumed that the
maximally exposed individual (MEI) was located at
a position on the site boundary that would yield the highest impacts during normal operation of a given
alternative. If more than one facility was assumed to
be operating at a site, the dose to this individual from
each facility was calculated. The doses were then
summed to give the total dose to this individual. An 80-kmn (50-mi) population dose was calculated for
each operating facility at a site. These doses then
were added to give the total population dose at that site.
To estimate the radiological impacts from normal
operation of HEU blending facilities, additional
assumptions and factors were considered in using GENII, as follows:
No prior deposition of radionuclides on ground surfaces was assumed.
I
For the maximally exposed offsite individual, the annual exposure time to the plume and to soil contamination was 0.7 years (NRC 1977b:1.109-68).
* For the population, the annual exposure time to the plume and to soil contamination was 0.5 years (NRC 1977b:1.109-68).
* A semi-infinite/finite plume model was used for air immersion doses. Other pathways evaluated were ground exposure, inhalation, ingestion of food crops and animal products contaminated by either deposition of radioactivity from the air or irrigation, ingestion of fish and other aquatic food raised in contaminated water, swimming and boating in contaminated surface water, and drinking contaminated water. It should be noted that not all pathways were available at every site.
* For atmospheric releases, it was assumed that ground level releases would occur for
E-9

Disposition of Surplus Highly Enriched Uranium Final EIS
all HEU blending facilities. For site-dependent facilities, reported release heights were used and assumed to be the effective stack height. Ignoring plume
rise makes the resultant doses conservative,
- The calculated doses were 50-year committed doses from 1 year of intake.
* Resuspension of particulates was not considered because calculations of dust loading in the atmosphere showed that this pathway was negligible compared with others.
The exposure, uptake, and usage parameters used in
the GENII model are provided in Tables E.2.2.2-1
through E.2.2.2-4.
Annual average doses to workers for no action at Oak
Ridge Reservation (ORR) and Savannah River Site
(SRS) were based on measured values received by
radiation workers during 1992. At Babcock and
Wilcox (B&W) and Nuclear Fuel Services (NFS),
annual average doses to workers for no action were
based on measured values received by radiation
workers during 1993. The average no action dose
received by a worker at these sites in future years was
assumed to remain the same as the average during
these earlier years. The total workforce dose in
future years was calculated by multiplying the
average worker dose by a projected future number of workers.
Doses to workers directly associated with HEU
blending process technologies and associated facilities were taken from the reports prepared by
Lockheed Martin Energy Systems, Inc. To obtain the
total workforce dose at a site with a particular HEU blending process technology and associated facilities
in operation, the site dose from no action was added
to that from the technology and facility being evaluated. The average dose to a site worker was then
calculated by dividing this dose by the total number of radiation workers at the site.
All doses to workers include a component associated with the intake of radioactivity into the body and another component resulting from external exposure to direct radiation.
E.2.2.3 Health Effects Calculations
Doses calculated by GENII were used to estimate health effects using the risk estimators presented in Section E.2.1.2. The incremental cancer fatalities in the general population and in groups of workers from radiation exposure were therefore estimated by multiplying the collective combined effective dose equivalent by 0.0005 and 0.0004 fatal cancers/person-rem, respectively. In this EIS, the collective combined effective dose equivalent is the sum of the collective committed effective dose equivalent (internal dose) and the collective effective dose equivalent (external dose) (see Section E.2.1.1).
Although health risk factors are statistical factors and therefore not strictly applicable to individuals, they have been used in the past to estimate the incremental risk to an individual from exposure to radiation. Therefore, the factors of 0.0005 and 0.0004 per rem of individual committed effective dose equivalent for a member of the public and for a worker, respectively, have also been used in this EIS to calculate the individual's incremental fatal cancer risk from exposure to radiation.
For the public, the health effects expressed in this EIS are the risk of fatal cancers to the maximally exposed individual and the number of fatal cancers to the 80-km (50-mi) population from exposure to radioactivity released from any site over the assumed operational period. For workers, the health effects expressed are the risk to the average worker at a site and the number of fatal cancers to all workers at that site from the associated period of site operations.
E-10

Table E.2.2.2-1. GENIIAnnual Exposure Parameters to Plumes and Soil Contamination
Maximal Individual General Population
External Exposure Inhalation of Plume External Exposure Inhalation of Plume
Plume Soil Contamination Exposure Time Breathing Rate Plume Soil Contamination Exposure Mime Breathing Rate
(hours) (hours) (hours) (cm3Is) (hours) (hours) (hours) (cm3/s)
6,140 6,140 6,140 270 4,380 4,380 4,380 270
Note: cm3=cubic centimeters. Source: HNUS 1995a.
Table E.2.2.2--2. GENII Annual Usage Parameters for Consumption of Terrestrial Food
Food Type
Maximum Individual Growing Holdup
Time Yield Time (days) (kgfim2) (days)
Consumption Rate
(kg/yr)
Leafy Vegetables 90 1.5 1 30
Root Vegetables 90 4 5 220
Fruit 90 2 5 330
Grains/Cereals 90 0.8 180 80
Note: kg=kilograms; m2=square meter Source: HNUS 1995a.
General Population
Growing Holdup Consumption Time Yield Time Rate (days) (kg/m2 ) (days) (kg/yr)
90 1.5 14 15
90 4 14 140
90 2 14 64
90 0.8 180 72
a-.
I
I

! t t13
Table E.2.2.2-3. GENIIAnnual Usage Parametersfor Consumption ofAnimal Products
Maximum Individual Human Stored Feed Fresh Forage
Consumption Diet Growing Storage Diet Growing Storage Rate Holdup Time Fraction Time Yield Time Fraction Time Yield Time
Food Type (kg/yr) (days) (days) (kglm 3) (days) (days) (kg/m3) (days) Beef 80 15 0.25 90 0.8 180 0.75 45 2 100 Poultry 18 1 1 90 0.8 180 Milk 270 1 0.25 45 2 100 0.75 30 1.5 0 Eggs 30 1 1 90 0.8 180
General Population Beef 70 34 0.25 90 0.8 180 0.75 45 2 100 Poultry 8 34 1 90 0.8 180 Milk 230 4 0.25 45 2 100 0.75 30 1.5 0 Eggs 20 18 1 90 0.8 180
Note: kg=kilograms; m3=cubic meters. Source: HNUS 1995a.
Table E.22.2-4. GENIIAnnual Usage ParametersforAquatic Activities
Maximum Individual General Population Transit Time Transit Time
to Usage Point Holdup Time Usage Rate to Usage Point Holdup Time Usage Rate Activity (days) (days) (per year) (days) (days)
Drinking Water 0 0 7301 0 0 Site dependent Swimming 0 0 100 hr 0 0 Site dependent Boating 0 0 100 hr 0 0 Site dependent Shoreline 0 0 500 hr 0 0 Site dependent Ingestion of Fish 0 0 40 kg 0 0 Site dependent Ingestion of Mollusks 0 0 6.9 kg 0 0 Site dependent Ingestion of Crustaceans 0 0 6.9 kg 0 0 Site dependent Ingestion of Plants 0 0 6.9 kg 0 0 Site dependent
Source: HNUS 1995a.

Human Health
E.2.3 NORMAL OPERAnON RELEASES
This section presents source terms and descriptions
of radiological releases to the environment from
normal operation of the four potential sites (ORR,
SRS, B&W, NFS), which could assume incumbent
HEU blending process operations. Each site-specific
table presents the source terms for each individual
facility located on its particular site, as annotated in
site environmental reports and referenced datacalls.
In addition, the source terms associated with the
technology-specific blending process operations
themselves are presented in Table E.2.3-1. It should
be noted that the volume of radioisotopes released
from the actual blending processes is small compared
to that of normal site operation releases (as illustrated in Tables E.2.3-2 through E.2.3-8).
All of the aforementioned values were used in
support of the public radiological dose (and
subsequent cancer risk) calculations, which are
presented in Sections 4.2 and 4.3.
The "site-specific" source terms are assumed to be
the no action quantities that would exist at the time
HEU blending operations would supposedly
commence at the given sites; these source terms were
utilized in the promulgation of the no action doses
that are given in the respective environmental reports
and referenced datacalls, and are also presented in
I Sections 4.2 and 4.3.
For further information on how source terms relate to
radiological dose, see Section E.2.1.
Table E.2.3-1. Annual Atmospheric Radioactive
Releasesa From the Various Blending Process Technologies (curies)
Technology
Isotope Metal UF6 UNH
U-235 1.Ix10"5 .1x10 4 6.9x10"5
U-238 2.5x10"4 6.2x10"4 3.2x10 4
a There are no liquid releases anticipated from the various
blending technology processes.
Note: UF6 = uranium hexaflouride; UNH = uranyl nitrate hexahydrate.
Source: OR LMES 1995a; OR LMES 1995b; OR LMES 1995c.
Table E.2.3-2. Annual Atmospheric Radioactive
I Releases From the Oak Ridge Reservation (curies)
Site Facility
Isotope ORNL K-25 Y-12
H-3 240 - -
Be-7 K-40 Ar-41 Co-57 Co-60 Sr-90a Tc-99 Ru-106 Cd-109 1-129 1-130 1-131 1-132 1-133 1-135 Xe-135 Xe-138 Cs-134 Cs-137 Cs-138 Ba-140 Ce-141 Eu-152 Eu-154 Eu-155 Os-191 Pb-212 Th-228 Th-230 Th-232 Th-234 U-234b U-235b
U-236b u.23gb Np-237 Pu-238
Pu-23? Am-241 Cm-244
3.8)
1 ,
2.6) 3.8x
- 4.OxlO 2
800 - 1.2xlO4
10 4.4x10 3
1.2O-a- 1.2x10⁻¹
. 4.5xl10 3
'7 0i 1fr3
5.0x10⁻³
2.0x1WO
2.5x10"4
5.5x10O 5.3x10⁻² 9.3x10⁻¹
2.OxlO10 4.7xi0"I
50 71
5.2x10"7
5.1x10 4
71 4.8x10⁻⁴
1.6x10⁻⁶ 2.5xl0"6 5.2x10"6
1.7x10⁻¹
3.7xI0"1
1.5xlO-6 5.7x10"8
3.3x10⁻⁸
8.6xi06 4.7x10⁻⁷ 3.8xi0"s 2.8xi0"5
4.7x10"2
1.5x10⁻³ 1.9x10 4
6.5xlO-3
3.8x10 4 5.9x10⁻⁵
1.1x10 4
1.8x10 2
4.0x10" 1.8xlO1
4.2x10⁻³ 5.7xlO 2.5x10⁻⁴
2.8x10"6 8.0X10⁻⁶ 4.6xl0"6 7.3x10⁻⁵
a Gross beta total is included within this value; total Sr is
assumed to be Sr-90.
b Gross alpha total is included within these values.
Source: OR DOE 1994c.
E-13

qX10-7 1X10⁻⁹
8x1O-9 U10-7 6x1O-9 7xIO-'
E-14
of Surplus Highly nium Final EIS
Table E.2.3-3.
Disposition Enriched Uj
AnnualAtmospherle Radioactive Releases From the
Savannah River Site (curies)
Site FacHity SRTC K-Reactor &Reactor F-Canyon
35,000 11900 - - I.SX10-2
I
H-Cauyon
2.1xIO-'
2.5xIO-4
LOW e DWpFa
20 2.IX10
6.lxlO-'
8.8xle
2.3x1G-5 2.4xIO
H-3
C-14 S-35 Ar-41 Cr-51 Co-60 Ni-63 Se-79 Sr-89 Sr-90P Y-90 Y-91 Zr-95 Nb-95 TC-99 Ru-106 Rh-106 Sn-126 Sb-125 Te-125m Te-127m Te-127 1-129 1-131 1-133 1-135 Xe-135 Cs-134 Cs-135 Cs-137 Ce-144 Pr-144 Pm-147 SM-151 EU-152 Eu-154 EU-155 U-235 Pu-238 Pu-239' Pu-240 Pu-241 Am-241 Cm-244
2.OxIO-6 j.gxjOr4
4.OxlO-6
1.0xie
4.1xIO
1.6X10-11.2xIO-5
IWO IWO
6.9xlG-' 6.7xIO-7 I.OX10-1
4.5x1O-9 4.4x1O 8.2xlW'
2.9xIO-5 9.4xIO-7 4.IxIO 3.OxIO-6 3.OxIO-6 7.6xle 1.6xlO-7 LU10-9
2.3xlO-7 1.6xlO-7
5.9xIG-5 2.OxIO
IWO
1.5xie
2.9xlO-' 1.0XIO-8
9.4xIO
LWO-6 6.8x1O-6
I.IXIO-6
4.4xlO-'
2.5xIO-3 2.9XIO-6
1.4XIO-6
4.6xIO4
1.8xIO-3 IWO 8.6xIO-4
6.IxIO-' 4.3xlO--'
2.4xjO-3 8.6x1O-5
4.OxIO-5
9.5XIO-1 8.8xIO-4 1.8X10⁻⁴
8.lxlCF' 6.5XIO-6
7 7. 4. 7. 8. 2.

Human Health
IWO
Table E.2.3-3. AnnualAtmospheric Radioactive Releases From the Savannah River Site (curies)-Continued
Site FadUty ?e CT51, H-3 FacHifies RBOF M-Area F-Area Waste H-Area Waste
1,200 94,000 1.7
1.5XIO 1.4xIO-4
6.OxIO-4 2.2xIO-2 7.6xIO-5 4.5xlO-4 4.7xIO4 1.5XIO-1
1.8XIO-4 1.8xIO-4
2.4xIO-4 IWO 2.3xIO-4 9.IX10-4
1.4xIO 5.2xIO-7
H-3
C-14 S-35 Ar4l Cr-51 Co-60 Ni-63 Se-79 Sr-89 SrqOb Y-90 Y-91 Zr-95 Nb-95 TC-99 Ru-106 Rh-106 Sn-126 Sb-125 Te-125m Te-127m Te-127 1-129 1-131 1-133 1-135 Xe-135 Cs-134 Cs-135 Cs-137 Ce-144 Pr-144 Pm-147 SM-151 Eu-152 Eu-154 Eu-155 U-235 Pu-238 Pu-2390 Pu-240 Pu-241 Am-241 Cm-244
5.9x10⁻⁹
8.3xICO
LWO
3.5x1O-6
5.gxlO-'
LIXIO-7
IWO3.8xie
2.4x1O 3.4x1O-7 2.7xlO
1.0XIO
2.Ix1O-7
E-15

Disposition of Surplus Highly Enriched Uranium Final EIS
Table E.2.3-3. AnnualAtmospheric Radioactive Releases From the Savannah River Site (curies)-:Continued
• Site Facility
Isotope Diffuse & Fugitive C-Reactor P-Reactor D-Area K-3 43 150 1,300 450 C-14 4.0x10"6 - -
S-35 2.0x1O6 - - "
Ar-41 Cr-51 .... Co-60 3.3x10"17 -
Ni-63 2.Oxl 7 - -
Se-79 Sr-89 -
Sr.90b 1.1x10 4 . . 7.2x10"6
Y-90 -
Y-91 -
Zr-95 2.4x10"14 -
Nb-95 Tc-99 -
Ru-106 -
Rh-106 -- Sn-126 .... Sb-125 .... Te-125m - -
Te-127m - -
Te-127 -- -
1-129 6.9x10 7 -
1-131 .... 1-133 .
1-135 -- -
Xe-135 - -
Cs-134 1.4x10"17 - -
Cs-135 Cs-137 4.3x10 11 - -
Ce-144 1.1x10 13 - -
Pr-144 Pm-147 - -
Sm-151 .... Eu-152 Eu-154 3.4x10"13 - -
Eu-155 1.6x10"13 - -
U-235 4.7x10"5 - -
Pu-238 4.6x10"12 - -
Pu-239c 4.7xi0 7 - - 8.4x10"7
Pu-240 Pu-241 Amn-241 8.9x10"13 - -
Cm-244 7.3x10 12 - -
a Values are projected; facility presently not in operating status. b Gross beta total is included within this value; total Sr is assumed to be Sr-90. C Gross alpha total is included within these values.
Note: CIF=Consolidated Inceneration Facility; DWPF=Defense Waste Processing Facility; RBOF=Receiving Basin Offsite Fuel; SRTC=Savannah River Technology Center.
Source: WSRC 1994f. E-16

Human Health
Table E.2.3-4. Annual Atmospherica' Radioactive Releases From the
Babcock & Widcox Site (curies)
Site faclity
Isotope NNFbb CNFP LTC
Co-60 3.2x10"5
Kr-85 . 13.4
Sr-90 - 4.9x10"6
U-234 4.0x10"6
U-235 2.2x10"7 1.8x10"7
U-238 9.3x10"7
a There was a release of 0.016 curies in 1994 due to liquid effluents from NNFD.
b Specific radionuclide release terms for this facility were not utilized in support of the impact analyses presented in Chapter 4 of
this EIS, due to doses being directly supplied from B&W.
Note: NNFD=Naval Nuclear Fuel Division; CNFP=Commercial Nuclear Fuel Plant; LTC--Lynchburg Technology Center.
Source: BW 1995b:1; BW NRC 1991a.
Table E.2.3-5. AnnualAtmospheric Radioactive Releases From the
Nuclear Fuel Services Site (curies)
Isotope Release
Th-228 6.62x10⁻⁷
Th-230 2.10x10"7
Th-232 7.33x10"7
U-234 7.12x10"5
U-235 1.21x10"6
U-236 7.23x10"9
U-238 5.23x10 7
Pu-238 2.71x10"9
Pu-239 1.45x10"9
Pu-240 1.31x1O"9
Pu-241 1.78x10" 7
Pu-242 1.86x10"12
Am-241 1.67x10 9
Source: NFS 1995b:2.
Table E.2.3-6. Annual Liquid Radioactive Releases from the
Oak Ridge Reservation Site (curies)
Site Facility
Isotope ORNL K-25 Y-12
H-3 1.8x103 "
K-40 - 1.9x10 2
Co-60 4.0x10"2
Sr-90 6.6x100 - "
Tc-99 3.0x10 2
Ru-106 3.8x10 2
Cs-137 5.5x10"1 1.2x10 3
Ce-143 - 2.0x10
Th-228 - 2.0x10 1
Th-230 - 2.4x0 5
Th-232 Th-234 - 3.6x10"2
U-234 1.810" 7.7x10"3 1I"5x0"
U-235 9.5x10r 1.4x10"2 4.6x10"3
U-236 - 5.8x10"4 6.1x10"4
U-238 5.6x10ý 6.0x10"3 2.1x10"2
Np-237 1.2x10"3
Pu-238 1.6x10⁻⁴
Pu-239 Source: OR DOE 1994c.
E-17

Disposition of Surplus Highly Enriched Uranium Final EIS
Table E.2.3-7. Annual Liquid Radioactive Releases From the
Savannah River Site (curies)
Isotope Release H-3 1.3x10 4
Sr-90 4.8x10"1
I-129 2.2xlo 2
Cs-137 2.5x10"1
Pm-147 7.OxlO-3
U-235 1.1x1O"5
Pu-239 9.6x10"3
Source: WSRC 1994f.
Table E.2.3-8. Annual Liquid Radioactive Releases From the
Nuclear Fuel Services Site (curies)
Isotope Release Tc-99 3.OxlO"3
Th-228 1.1xl0"4
Th-230 1.0x10 4
Th-232 8.4x10"5
Th-234 3.5x10"3 U-234 1.7xlO"2
U-235 5.1x10 4
U-238 2.4xi0"3
Pu-238 1.2x10"4
Pu-239 5.6xi0"4
Source: NFS 1995b:2.
E-1 8
I

Human Health
E.3
E.3.1
HAZARDOUS CHEMICAL IMPACTS TO HUMAN HEALTH
BACKGROUND
Two general types of adverse human health effects are
assessed for hazardous chemical exposure in this EIS.
These are carcinogenic and noncarcinogenic effects.
For this reason, two tables were developed to assist
the risk assessor in the evaluation process. Table
E.3.2-1, Chemical Toxicity Profiles, characterizes
each chemic4l in terms of physical properties,
potential exposure routes, and the effects on target
tissues/organs that might be expected. It is to be used
qualitatively by the risk assessor to determine how
exposure might occur (exposure route), what tissue or
organ system might be impacted (for example, central
nervous system dysfunction and liver cancer), and
whether the chemical might possess other properties
affecting its bioavailability in a given matrix (for
example, air, water, or soil). Table E.3.3-1, Exposure
Limits, provides the risk assessor with the necessary
information to calculate risk or expected adverse
effects should an individual be exposed to a
hazardous chemical for a long time at low levels
(chronic exposure) or to higher concentrations for a
short time (acute exposure). Where a dose effect
calculation is required (mg/kg/day), the Reference
Dose (RfD) is applicable, and where an inhalation
concentration effect is required, the Reference
Concentration (that is, RfC in mg/m3) is applicable
for chronic exposures. The Permissible Exposure
Limit (PEL) values, which regulate worker exposures
over 8-hour periods, determine the concentration
allowed for occupational exposures that would be
without adverse acute effects. Other values, such as
the Threshold Limit Value (TLV) are presented
because they are prepared by the American
Conference of Governmental Industrial Hygienists
(ACGIH) for guidance on exposures of 8-hour
periods and can be used to augment PELs or serve as
exposure levels in the absence of a PEL. All currently
regulated chemicals associated with each site and
every hazardous chemical are presented in Table
E.3.2-1.
It was assumed that under normal operation
conditions, members of the public would only
receive chroniic exposures atlow levels in the form of air emissions from i centrally located source term at
each site; since hazardous chemicals are not released
into surface or groundwaters or onto soil, inhalation
is assumed t6 be the only route of exposure; however,
all chemical quantities are accounted for as air
emissions ihat are several orders of magnitude
greater than all other possible routes combined. It
was further assumed that the MEI member of the
public would be at the site boundary, and this
assumption was used when calculating all public
exposures, which under normal operating conditions
are expected to be chronic and at very low levels. For
worker exposures to hazardous chemicals, it was
assumed that individuals were exposed only to low
air emission concentrations during an 8-hour day for
a 40-hour week for a maximum working lifetime of
40 years. The point of exposure chosen was 100 m
(328 ft) from a centrally located source term, since
the precise placement of source terms onsite could
not be made. Further, it could not be determined
where the involved and noninvolved workers would
be relative to the emission sources.
For every site involved in the analysis, Hazard
Indexes (His) were calculated for every alternative
action relative to the site. The exposure
concentrations of hazardous chemicals for the public
and the onsite workers were developed using the
Industrial Source Complex Short-Term (ISCST)
model for point, area, and volume sources. This
model, which estimates dispersion of emissions from
these sources, has been field tested and recommended
by EPA. The modeled concentrations were compared
with the RfC and PEL values unique to each chemical
to yield Hazard Quotients (HQs) for the public and
onsite workers, respectively. The HQs were summed
to give the His for each alternative action at each site,
as well as total HIs (that is, no action HI + alternative
HI). For cancer risk estimation, the inhaled
concentrations were converted to doses in mg/kg/day,
which were then multiplied by the slope factors
unique to each identified carcinogen. The risks for all
carcinogens associated with each alternative
(incremental risk) at each site were summed, and the
no action cancer risk for each site was added in order
to show the total risk should that alternative action be
implemented at a given site.
E-19

Disposition of Surplus Highly Enriched Uranium Final EIS
E.3.2 CHEMICAL TOXICITY PROFILES
I Table E.3.2-1 provides the reader with pertinent facts about each chemical that is included in the riskassessment of this EIS. This includes the Chemical Abstracts Service (CAS) number, which aids in the search for information available on any specific chemical and ensures a positive identity regardless of which name or synonym is used. It also contains physical information (that is, solubility, vaporpressure, and flammability) as well as presents incompatibility data that are useful in determining whether a hazard might exist and the nature of the hazard. The route of exposure, target organs/tissues, and carcinogenicity provide an abbreviated summary of how individuals may get exposed, what body functions could be affected, and whether chronic exposure could lead to increased cancer incidence in an exposed population.
E.3.3 REGULATED ExPosuRE LIiTrs
Hazardous chemicals are regulated by various agencies in order to provide protection to the public (EPA) and to workers (Occupational Safety and Health Administration [OSHA]), while others (National Institute for Occupational Safety and Health [NIOSH] and the ACGIH) provide guidelines. The RfDs and RfCs set by EPA represent exposure limits for long-term (chronic) exposure at low doses and concentrations, respectively, that can be considered safe from adverse noncancer effects. The PEL represents concentration levels set by OSHA that are safe for 8-hour exposures for the working lifetime without causing adverse noncancer effects. The slope factor or the unit risk are used to convert the daily uptake of a Carcinogenic chemical averaged over a lifetime to the incremental risk of an individual developing cancer. Table E.3.3-1 presents the information on exposure limits used to develop HQs for each of the hazardous chemicals and the HIs derived from their summation, and the slope factors used to calculate cancer, risk for each chemical at the exposure concehitrations identified at the various sites or associated with a proposed alternative action.
E-20

Table E.3.2-1. Chemical Toxicity Profiles
Vapor Route of
Compound CAS No. Solubility Pressure Flammabilitya Incompatibilities Exposureb Target Organs CarcinogenicityC
1,1,1- 71-55-6 0 .4 %d 100 mmd Combustible liquid, Strong caustics; strong Inh, ing, CNS, eyes, skin, CVS, EPA Group De
Trichloroethane burns with oxidizers; chemically cond Diverd
(TCA; methyl difficultyd active metals (for
chloroform) example, Zn, A], Mg No casife
Acetic acid
Ammonia
Benzene
Carbon mo
I Chlorine I
Chloroform
Chromium (Trivalent)
Miscible I1 mmd Class 11d
7664-41-7 3 4 %d 8.5 atmd Treat as a flammable gas d
71-43-2 0 .0 7%d 75 mmd Class EB Flammable liquidd
noxide 630-08-0 2 %d >35 atmd Flammable gas'
7782-50-5 0 .7%d 6.8 atm Nonflammable gasd
67-66-3 0 .5%d (77 "F)
160 mmd Noncombustible liquidd
7440-47-3 Varies with Varies with Varies with cmpdd cmpdd cmpdd
IJUWUers•x, "~tt •), wtr Strong oxidizers, strong
caustics, corrosive to metalsd
Strong oxidizers, acids, halogens, salts of Ag and Znd
Inh, cond Eyes, skin, resp sys, teethd
Inh, ing (soln), con (soln/ liq)d
Strong oxidizers, many Inh, abs, fluorides and perchlorates, ing, cond nitric acid
Strong oxidizers, bromine Inh, con trifluoride, chlorine (ie trifluoride, Lid
Reacts explosively or forms Inh, cond explosive compds with many common substances (for example, acetylene, ether, turpentine, ammonia, fuel gas, hydrogen, finely divided metals)d
Strong caustics, chemically Inh, abs, in active metals (for cond example, Al or Mg powder), K, strong oxidizersd
Varies with cmpdd Inh, big, cond
Eyes, skin, resp sysd
Eyes, skin, resp sys, blood, CNS, bone marrow (Leukemia)d
CVS, lungs, blood,
CNSd
Eyes, skin, resp sysd
Not classified
EPA Group Af
EPA Group A'
Not classified
EPA Group Df
g, Liver, kidneys, heart, EPA Group B2f skin, CNSd (In animals: liver and kidney cancer)
Eyes, skind Not classified
164-19-7

Table E.3.2-1. Chemical Toxicity Profiles-Continued
Compound Cobalt
(metal dust and fume)
Copper I (dusts and
mists)
I [Text deleted.] IHydrogen
chloride
I Hydrogen fluoride
[Text deleted.] Mercury (Cmpds
except organo alkyls; as Hg)
Methanol(methyl alcohol)
[Text deleted.] Nickel (refinery dust)
Nitric acid
CAS No. Solubility 7440-48-4 Insolubled
7440-50-8 Insolubled
7647-01-0 6 7 %d
(86 F)
Vapor Pressure Flammabilitya
0 mm Noncombustible (approx)d solid in bulk form;
fine dust bums at high tempd
0 mm Noncombustible (approx)d solid in bulk; fine
powder may ignited
Incompatibilities Strong oxidizers,
ammonium nitrated
Oxidizers, alkalis, sodium azide, acetylened
40.5 atmd Nonflammable gasd Hydroxides, amines,
7664-39-3 Miscibled 783 atmd Nonflammable gasd
7439-97-6 Insolubled 0.0012 mmd
67-56-1 Miscibled
7440-02-0 Insolubled
7697-37-2 Miscibled
Metal: Noncombustible liquidd
alkalis, copper, brass, Zn. Highly corrosive to most metalsd
Metals, water or steam. (Corrosive to metals. Will attack glass and concrete)d
Acetylene, ammonia, chlorine dioxide, azides, calcium, sodium carbide, Li, Rb, Cud
96 mmd Class IB Flammable Strong oxidizersd liquidd
0 mm Metal: combustible (approx)d solid, Ni sponge
catalyst ignites spontaneously in aird
48 mmd Noncombustible liquid, but increases flammability of combustible materialsd
Strong acids, S, Se, wood and other combustibles,
nickel nitrated
Combustible materials; metallic powders; hydrogen sulfide; carbides; alcoholsd (Corrosive to metals)
Target Organs Eyes, resp sys d
Eyes, skin, resp sys, liver, kidneys (Increase risk with Wilson's disease)d
CarcinogenicityC
EPA Group Cf
Inh, abs, ing, Eyes, skin, resp sys, cond CNS, GI tractd
Inh, ing, cond
Lungs, skin, nasal cavities (lung and nasal
cancer)
Inh, ing, Eyes, resp sys, skin, cond teethd
2. 1"
CZZv
Route of Exposureb
Inh, ing, cond
Inh, ing, cond
Inh, ing (soln), cond
Inh, abs(liq), ing (soln), cond
Inh, abs, cond
Eyes, resp sys, bones, skind
Eyes, skin, resp sys, CNS, kidneysd
Not classified
EPA Group D'
Not classified
EPA Group A
Not classified
Resp sys, skin, eyesd Not classified
I I

Table E.3.2-". Chemical Toxicity Profdles-Continued
Vapor Route of
Compound CAS No. Solubility Pressure Flammabilitya Incompatibilities Exposureb Thrget Organs CarcinogenicityC
[Text deleted.] Phosphoric acid 7664-38-2 Miscibled 0.03 mmd Noncombustible Strong caustics, most metals Inh, ing, Eyes, skin, resp sysd Not classified
liquidd (Do not mix with solutions cond
containing bleach or ammonia)d
Sulfuric acid 7664-93-9 Miscibled 0.001 nun Noncombustible Organic materials, chlorates, Inh, ing, Resp sis, eyes, skin, Not classified
liquid, but capable carbides, fulminates, cond teeth
of igniting finely water, powdered metalsd
divided combustible materialsd
Toluene 108-88-3 0.07% 21 mmd Class IB Flammable Strong oxidizersd Inh, abs, ing, CNS, eyes, resp sys, EPA Group D9
(74 F)d liquid d cond liver, kidneys, skind
Trichloroethylene 79-01-6 0.0001% 58 mramd Combustible liquid, Strong caustics and alkalis; Inh, abs, ing, Eyes, resp sys, heart, EPA Group B2
(TCE) (77 F)d but burns with chemically active metals cond liver, kidneys, CNS,
difficultyd (for example, B.A., Li, Na, skin (In animals:
Mg, Ti, and Be)d liver and kidney cancer)d
Uranium (Metal; 7440-61-1 Insolubled 0mm Combustible solidd Carbon dioxide, carbon Inh, ing, Skin, kidneys, bone EPA Group Ah
insoluble (apprx)d tetrachloride, nitric acid, cond marrow, lymphatic
cmpdsYd fluorined sys, (lung cancer)d
[ [Text deleted.]
I[Text deleted.] I a Flammable liquids are classified by OSHA (29 CFR 1910.106) as follows: Class IA-F.P below 73 OF and BP below 100 OF; Class IB-FLP below 73 OF and BP at or above 100 OF; Class
IC-FI.P at or above 73 'F and below 100 OF; Class II-FI.P at or above 100 OF and below 140 OF; Class IIA-FL.P at or above 140 OF and below 200 OF; Class IIIB-FI.P at or above 200
0F (DHHS 1992a). b Routes of exposure abbreviated as follows: inh = inhalation, abs = skin absorption, ing = ingestion, con = skin and/or eye contact.
c EPA Groups for Carcinogenicity are Classified as Follows: EPA Group A: Human Carcinogen; EPA Group BI: Probable Human Carcinogen-limited evidence in human studies; EPA
Group B2: Probable Human Carcinogen-sufficient evidence from animal studies, inadequate evidence or no data from human studies; EPA Group C: Possible Human Carcinogen; EPA
Group D: Not Classifiable as to Human Carcinogenicity. d NIOSH 1994a.
e EPA 1993a.
f ORNL 1994b.
g ORNL 1994a. h EPA 1994a.
Note: °F=Fahrenheit.
t!I

4r.
Table E.3.3-1. Exposure Limits
Chemical Reference Abstracts Reference Concentration
Service No. Dose (oral) (inhalation) Cancer Class' Slope Factor Occupational Exposure Levelb, c Compound (mg/kg/day) (mg/m3) (mg/kg/day)"I
1, 1,1-Trichloroethane 71-55-6 0 .035d 10C EPA Group Df None found OSHA-PEL: 1,900 mg/m3
64-19-7 0.1759
7664-41-7 0.0286' (34 mg/l, chronicY
71-43-2
630-08-0
0.6 12 5 h Not classified
0.1f EPA Group Dd
2.28x10"29 0.0 7 9 6 h EPA Group Af
0.3 8 5g
7782-50-5 0.1f
67-663 0.01f
Not classified
0.35h EPA Group Dd
0.03 5 h EPA Group B2Y
16065-83-1 1.0f
None found
None found
0.029 (oral)f 0.029 (inhalY
ACGIH-TLV: 1,910 mg/m 3, STEL: 2,460 mg/m3
NIOSH-REL: 1,900 mg/m3, (ceiling, 15 min.) IDLH: 3,885 mg/m3
OSHA-PEL: 25 mg/m3
ACGIH-TLV: 25 mg/m3, STEL: 37 mg/m 3
NIOSH-REL: 25 mg/m3, STEL: 37 mg/m3, IDLH: 125 mg/M3
OSHA-STEL: 35 mg/m3
ACGIH-TLV: 17 mg/m3, STEL: 24 mg/m3
MOSH-REL: 18 mg/m3 , STEL: 27 mg/m3, IDLH: 213 mg/m3
OSHA-PEL: 3.25 mg/M3, STEL: 16.25 mg/m3, ACGIH-TLV: 32 mg/m3, NIOSH-REL: 0.325 mg/m3, STEL: 3.25 mg/m3, IDLH: 5 mg/m3
None found OSHA-PEL: 55 mg/m3
ACGIH-TLV: 29 mg/m3
NIOSH-REL: 40 mg/m3 , IDLH: 1,392 mg/m3 None found OSHA-PEL: 3 mg/m3 (ceiling)
ACGIH-TLV: 1.5 mg/m3, STEL: 2.9 mg/M3
NIOSH-REL: 1.45 mg/M3 (ceiling, 15 min.), IDLH: 29.5 mg/m3
6.1xi0"3 (ora1)f 0.081 (inhal)i
Not classified None found
OSHA-PEL: 240 mg/m3 (ceiling) ACGIH-TLV: 49 mg/m3
NIOSH-REL: 9.78 mg/m3 (60 min.), IDLH: 2480 mg/m3
OSHA-PEL: 0.5 mg/M3
ACGIH-TLV: 0.5 mg/rm3
NIOSH-REL: 0.5 mg/m3 , IDLH: 25 mg/m3
(TCA; methyl chloroform)
Acetic acid
I
[ (Text deleted.]
Carbon monoxide
Chlorine
Chloroform
I Chromium (Trivalent)
Li"
I
I
Ammoniaj
I I
Benzene
1.35h

Table E.3.3-1. Exposure Liaits-Continued
Chemical Reference Abstracts Reference Concentration
Service No. Dose (oral) Cinhalation) Cancer Class' Slope Factor Occupational Exposure Levelb, c
Compound (mg/kgtday) (mg/m3) (mgl~kday)"1
Cobalt (metal dust and 7440-48-4 7x10"4 2.45xi0"3h Not classified None found OSHA-PEL: 0.1 mg/m3
i Copper (dusts and mists)
I [Text deleted.] Hydrogen chloride
j Hydrogen fluoride
[Text deleted.] Mercury
(vapor + compound)
| Methanol (methyl alcohol)
L [Text.deleted.] j Nickel (refinery dust)
SNitric acid
7xlo 3
2x10⁻³
7664-39-3 0.060
7439-97-6 3x10"4
(inorganic, chronic)
67-56-1 0.5f
7440-02-0 0 .0 0 7g
7697-37-2 0.0350
0.0 245 h EPA Group D0
7x10"3 f Not classified
0.21h Not classified
3 x10⁻⁴e EPA Group D
1.7 5h Not classified
0.024 5h EPA Group Ak
0.1225h None
None found
ACGIH-TLV: 0.05 mg/m' NIOSH-REL: 0.05 mglm3, IDLH: 20 mg/m3
OSHA-PEL: I mg/rm3
ACGIH-TLV: I mg/M3
NIOSH-REL: 1 mg/nM3, IDLH: 100 mg/m3
7440-50-8
7647-01-0 None found OSHA-PEL: 7 mg/rn3
ACGOH-TLV: 7.5 mg/rn 3 (ceiling) NIOSH-REL: 7 m•/m 3 , IDLH: 76 mg/m3
None found OSHA-PEL: 2.49 mg/m3 ACGIH-TLV: 2.6 mg/m3 (ceiling) NIOSH-REL: 2.5 mg/m3, 5.0 mg/m3 (ceiling,
15 rain), IDLH: 24.9 mg/m3
None found OSHA-PEL: 0.1 mg/m3 (ceiling), ACGIH-TLV: 0.05 mg/m3, NIOSH-REL: 0.05 mg/m3 (skin), IDLH: 10 mg/rm3
None found OSHA-PEL: 260 mg/r 3
ACGIH-TLV: 262 mg/rm3 (skin), STEL: 328 mgfm3
NIOSH-REL: 260 mg/m3 , STEL: 325 mg/m3 (skin), IDLH: 7,980 mg/m3
0.84 (inhal)h OSHA-PEL: 1 mg/m3 (metal and other compds) ACGIH-TLV: I mg/M3
NIOSH-REL: 0.015 mg/m3
None OSHA-PEL: 5 mg/m3 (metal and other cmpds) ACGIH-TLV: 5.2 mg/m3, STEL: 10 mg/rn NIOSH-REL:5 mg/M3, STEL: 10.mg/r 3
IDLH:65.5 mg/m
3
I [Text deleted.]
th
Iflume)
I

tor r'3I
Table E.3.3-1. Exposure Limits-Continued
Chemical Reference Abstracts Reference Concentration
Service No. Dose (oral) (inhalation) Cancer Classa Slope Factor Occupational Exposure Levelb, c Compound (mg/kg/day) (mg/m3) (mg/kg/day)-1
Phosphoric acid 7664-38-2 0 .007g 0 .02 4 5 h Not classified None found OSHA-PEL: 1 mg/m3, ACGIH-TLV: 1 mg/m3, STEL: 3 mg/rm3, NIOSH-REL: 1 mg/m 3, STEL: 3 mg/M3, IDLH: 1,000 mg/m3
Sulfuric acid 7664-93-9 0.0079 2.45x10⁻² h Not classified None found OSHA-PEL: 1 mg/m3
ACGIH-TLV: 1 mg/m3 , STEL: 3 mg/m3
NIOSH-REL: 1 mg/M3 , IDLH: 15 mg/rm3
Toluene 108-88-3 0.2f 0.4f EPA Group Df None found OSHA-PEL: 766 mg/m3, STEL: 1,149 mg/m3, (ceiling)
ACGIH-TLV: 188 mg/rn 3 (skin) NIOSH-REL: 375 mg/m3, STEL: 560 mg/m3, IDLH: 1,915 mg/m3
Trichloroethylene (TCE) 79-01-6 3 .82 g 13 .37 7h EPA Group B2d 6.0x10"3 OSHA-PEL: 546 mg/m3, 1,092 mg/m3 (ceiling) (inhal)J ACGIH-TLV: 269 mg/r 3 , STEL: 1,070 mg/nm
NIOSH-REL: 5,460 mg/m3 Uranium 235 + 238 7440-61-1 3.Ox10"3 f 0 .0 10 5 h EPA Group Ad InhalationJ OSHA-PEL: 0.25 mg/m3 (insol.cpds/metal)
(RiskpCi) ACGIH-TLV: 0.2 mg/m3 , STEL: 0.6 mg/m3 (insol U235 2.5x10"8 cpds/mctal)
U238 2.4x10⁻⁸ NIOSH-REL: 0.2 mg/m 3, STEL: 0.6 mg/m 3 (insol Average SF: cpds/metal), IDLH: 10 mg/m3 (as U)
2.45xl0"8
[Text deleted.] a EPA Groups for carcinogenicity are classified as follows: EPA Group A: Human Carcinogen; EPA Group B1: Probable Human Carcinogen - limited evidence in human studies; EPA
Group B2: Probable Human Carcinogen - sufficient evidence from animal studies, inadequate evidence or no data from human studies; EPA Group C: Possible Human Carcinogen; EPA Group D: Not Classifiable as to Human Carcinogenicity.
b OSHA and NIOSH exposure levels were taken from NIOSH 1994a unless otherwise indicated. c American Conference of Governmental Industrial Hygienists (ACGIH) exposure levels were taken from ACGIH nda unless otherwise indicated. d EPA 1993a. e PNL, 1995a. f ORNL 1994b. 5 Reference Dose calculated from OSHA-PEL, formula from the Center for Risk Management, Oak Ridge National Laboratories (ORNL 1992d). h Reference Concentration calculated from Reference Dose, formula from the Center for Risk Management, Oak Ridge National Laboratories (ORNL 1992d). _
Reference Dose calculated from Reference Concentration, formula from the Center for Risk Management, Oak Ridge National Laboratories (ORNL 1992d).. ' EPA 1994a. k ORNL 1994a. Note: mg milllgram; kg=kilogram.
-t

Human Health
E.3.4 HAZARDOUS CHEMICAL RISK/ EFFECTS CALCULATIONS
(Tables E.3.4-1 through E.3.4-15 show the chemicals associated with the various alternative activities (that is, no action or blend to low enriched uranium) and Tables E.3.4-16 through E.3.4-19 summarize the alternatives for each of the four sites and give the totals associated with the activities if implemented at each of
the four sites (that is, ORR, SRS, B&W, and NFS). i Table E.3.4-20 contains the emission rates and the
corresponding PELs for hazardous chemicals for the In-Tank Precipitation Facility and the Consolidated Incineration Facility at SRS. The terms associated with calculations are given in the footnotes for each table so that verification of each calculated value can be made.
E-27

t~T1 Table E.3.4--1. RiskAssessments From Exposure to Hazardous Chemicals at Oak Ridge Reservation: No Action j •i "
',.
S(,I
I ! I
S I I i
I ! I ! I I
I I
L•
R~egulated Exposure Laimits/Risk Factors Emissions Concentrations Hazard Quotient Cancer Risk
Boundary Worker Boundary Worker Boundary Worker Slope Annual 100 Meters Annual 100 Meters Annual 100 Meters
Rfi PWJa Factor MEIb 8 hours MEI& 8 hoursd MEIb'e 8 hours!
Chemical (mg/m3) (mg/m3 ) (mg/kglday)"1 (mg/m3) (mg/m3) (mg/m3) (mg/m3) (mg/m3) (mg/m3) 1,1,1-Trichloroethane 1 1,900 - 7.26xiO0 4.63x10⁻³ 7.26x10" 2.29x10"6 0 0 Acetic acid 0.6125 25 - 3.30x10 4 1.98x10 5 5.39x10• 7.93x10"7 0 0 Carbon monoxide 1.35 55 - 3.14x10"3 1.88 2.32x10"3 3.42x10"2 0 0 Chlorine 0.35 3 - 5.78x10"5 3.47x10"2 1.65x10 4 1.16x10⁻² 0 0 Hydrogen chloride 0.007 7 - 2.12x10⁻⁴ 1.27x10"I 3.03x10"2 1.82x10 2 0 0
Hydrogen fluoride 0.21 2.49 - 2.31xl06" 1.39x10 3 1.10x1O 5 5.57x10"4 0 0 Methanol 1.75 260 - 8.72x10"4 5.23x10"1 4.98x10 4 2.01xI0" 3 0 0 Nitric acid 0.1225 5 - 3 .l 4 xl04 1.88x10"1 2.56xi0 3 3.76x10"2 0 0 Sulfuric acid 0.0245 1 - 8.25x10" 5 4.95x10"2 3.37x10"3 4.95x10⁻² 0 0 VOC (toluene) 0.4 766 - 1.22x10"4 7.33xi0-2 3.05x10"4 9.57x10 5 0 0 Health Risk
Hazard Indexg 3.95x10" l.54x10"1
Total Cancer Riskh 0 0 a See Appendix E, Table E.3.3-1 for the OSHA-PEL, ACGIH-TLV, NIOSH-REL, and other exposure limit values. b MEI=maximally exposed individual of the public. c Hazard quotient for MEI=boundary annual emissionstreference concentration. d Hazard quotient for workers=100-meter, 8-hr emissionspemissible exposure limiL e Lifetime cancer risk for MEI=emissions concentrations) x (0286 [converts concentrations to doses]) x (Slope Factor).
f Lifetime cancer risk for workers: (Emissions for 8-hr) x (0.286 [converts concentrations to doses]) x (0.237 [fraction of year exposed]) x (0.571 [fraction of lifetime working]) x (Slope Factor).
g Hazard index=sum of individual hazard quotients. h Total cancer risk=sun of individual cancer risks. Source: OR MMES 1995L Note: mg-milligram; m3=cubic meter, kg=kllogramn

Table E.3.4-2. Risk Assessments From Exposure to Hazardous Chemicals at Savannah River Site: No Action
Regulated Exposure Linits/Risk Factors Emissions Concentrations Hazard Quotient Cancer Risk
Boundary Worker Boundary Worker Boundary Worker
Slope Annual 100 Meters Annual 100 Meters Annual 100 Meters
RfC PELa Factor MEIb 8 hours MEI b,c 8 hoursd ME&b'e 8 hours
Chemical (mglm3 ) (mg/m3) (mg/kg/day)"1 (mg/m3) (mgIm3 ) (mg/m 3) (mgtm3 ) (mg/m3) (mglm 3) S... . ...... . . ,- 1 o..tan-2 I C'7.,li-
5 A 'n,,lfY"3 1 fl~tvlfl"8 1 5;'4 i10"
0.0796 3.25 u.u09 1L..XU 1.35 55 - 5AlxI0"3
0.35 3 - 9.27x10 9
0.035 240 0.0061 4.79x10"6
0.00245 0.1 - 7A6x10"9
0.21 2.49 - 4.29xi0 8"
0.0003 0.1 - 1.89x0"7
0.0245 1 0.84 4.31x10"8
0.1225 5 - 3.73x10"6
0.0245 1 - 1.50x10"7
1.- IXIU
59.1
1.01x10"4
5.24x10"2
8.15x10 5
4.69X10⁻⁴ 2.06x10"3
4.70x10"4
4.07x10"2
1.63x10"3
4.01xlO 3 1.07 0 0
2.65X10"8 3.37x10"5 0 0
1.37x10"4 2.18x10⁴ 8.36x10"9 1.24x10"5
3.05xi0"6 8.15x10"4 0 0
2.04x10"7 1.88x10"4 0 0
6.29x10 4 2.06x10"2 0 0
1.76x10⁶ 4.70x10"4 L.03x10 8 1.53x10"5
3.04x10"5 8.15x10"3 0 0
6.11x10"6 1.63x10 3 0 0
Benzene Carbon monoxide
Chlorine Chloroform Cobalt Hydrogen fluoride
Mercury (vapor) Nickel (vapor & compounds)
Nitric acid Phosphoric acid
I
I
II

Table E.3.4-2. Risk Assessments From Exposure to Hazardous Chemicals at Savannah River Site: No Action-Continued
Regulated Exposure Limits/Risk Factors Emissions Concentrations Hazard Quotient Cancer Risk
Boundary Worker Boundary Worker Boundary Worker Slope Annual 100 Meters Annual 100 Meters Annual 100 Meters
RfC PELa Factor MEIb 8 hours MEl b,c 8 hoursd MEbe 8 hoursf Chemical (mg/r 3) (mg/m3) (mg/kg/day)-1 (mg/m3) (mg/m3) (mg/m3) (mg/m3 ) (mg/n 3) (mg/m3)
j Benzene (DWPF)F 0.0796 3.25 0.029 1.23x10"5 1.35x10"1 1.55x10"4 4.15x10⁻² 1.02x10⁻⁷ 1.51x10⁻⁴ Hydrogen fluoride (DWPF)g 0.21 2.49 - 8.39x10 12 9.16x10 8 3.99x10"11 3.68x1" 8 0 0
j Mercury (DWPF)" 0.0003 0.1 - 5.17x!0"8 5.65x10⁴ 1.72x10 4 5.65x10"3 0 0 • . Mercury oxide (DWPF)g 0.0003 0.1 - 6.36x10⁻¹⁸ 6.95x10"14 2.12x10"14 6.95x10"13 0 0
I Nickel compounds (DWPF)g 0.0245 1 0.84 3.16x10"16 3.45x10"12 1.29x10⁻¹⁴ 3.45x10"12 7.60x10⁻¹⁷ 1.12x10- 13
I Health Risk I Hazard Indexh 5.16x10"3 1.16 j Total Cancer Risk' 1.31x10"7 1.94x10"4
!aSee Appendix E, Table E.3.3-1 for the OSHA-PEL, ACGIH-TLV, NIOSH-REL, and other exposure limit values. b MEI=maximally exposed individual of the public.
| C Hazard quotient for MEI=boundary annual emissions/reference concentration. I d Hazard quotient for workers=100-meter, 8-hr emissions/permissible exposure limit.
I e Lifetime cancer risk for MEI=(emissions concentrations) x (0.286 [converts concentrations to doses]) x (Slope Factor).
I f Lifetime cancer risk for workers: (emissions for 8-hr) x (0.286 [converts concentrations to doses]) x (0.237 [fraction of year exposed]) x (0.57 1 [fraction of lifetime working]) x (Slope
The Defense Waste Processing Facility (DWPF), In-Tank Precipitation (ITP) facility, and Consolidated Incineration Facility (CIF) were not in operation during 1994, but potential emissions from DWPF based on limited trials are used to generate DWPF potential emissions. The ITP and CIF data were not included because only the inventory of chemicals to be processed through these facilities was available. Table E.3.4-20 presents the list of possible nTP/ CIF chemicals and their regulated levels.
h Hazard index=sum of individual hazard quotients.
Total cancer risk=sum of individual cancer risks. Note: 1994 actual emissions scaled to the year 2005. Scaling Factor=1.0 for all except: Bechtel (0.6), Separations (0.8), Power (0.8), and Reactors (0.1). Note: mrg=milligram; m3=cubic meter;, kg=kilogram. Source: SRS 1995a:2; SRS 1996a:l.
Q:;3

Table E.3.4-3. Risk Assessments From Exposure to Hazardous Chemicals at Babcock & Wdcox: No Action
Regulated Exposure Limits/Risk Factors
Emissions Concentrations Hazard Quotient Cancer Risk
Boundary Onsite Boundary Worker Boundary Worker
Slope Annual 100 Meters Annual 100 Meters Annual 100 Meters
RfC PELa Factor MEPb 8 hours MEIb,c 8 Hoursd MEIb'e 8 Hoursf
Chemical (mg/r 3 ) (mg/m3) (mg/kg/day)"1 (mg/m3 ) (mg/rm3 ) (mg/m3) (mg/m3) (mg/m3) (mg/m3)
Chromium 3.5 0.5 - 5.96x 10⁻¹o 1.03xl0-5 1.70x10"10 2.07x10"5 0 0
compounds (III)
Cobalt compounds 0.00245 0.1 - 5.96x1 0 ° 1.03x10"5 2.43x10"7 1.03xl0"4 0 0
Copper compounds 0.0245 1 - 1.43x10 7 2A8x10 3 5.84x10⁻⁶ 2.48x10"3 0 0
Hydrogen chloride 0.007 7 - 1.43x10⁻⁸ 2.48x10"4 2.04xi0-6 3.54x10 5 0 0
Hydrogen fluoride 0.21 2.49 - 2.98x10⁻⁹ 5.17xi0-5 1.42xlO"8 2.08xi0"5 0 0
Nickel compounds 0.0245 1 0.84 8.94x10"1° 1.55x10"5 3.65x10"8 1.55x10"5 2.15x10" 10 5.04x10"7
Nitric acid 0.1225 5 - lAOxlO7 2.43x10⁻³ 1.14x10" 4.86x10 4 0 0
Sulfuric acid 0.0245 1 - 3.49xi0-8 6.05x10⁻⁴ 1.42x10- 6.05xi0 4 0 0
Trichloroethylene 13.377 546 0.006 9.66xl06 1.67x10"1 7.22x10"7 3.07x10I4 1.66x10"8 3.89x10"5
(TCE) Health Risk
Hazard Indexg 1.15x10"5 4.07x10"3
Total Cancer Riskh 1.68x10"8 3.94x10"5
| See Appendix E, Table E,3.3-1 for the OSHA-PEL, ACGIH-TLV, NIOSH-REL, and other exposure limit values.
| b MEI=maximally exposed individual of the public.
j C Hazard quotient for MEI=boundary annual emissions/reference concentration.
d d Hazard quotient for workers=100-meter, 8-hr emissions/permissible exposure limit.
c Lifetime cancer risk for MEI=emissions concentrations) x (0.286 [converts concentrations to doses]) x (Slope Factor).
f f Lifetime cancer risk for workers=(eWissions for 8 hr) x (0.286 [converts concentrations to doses]) x (0.237 [fraction of year exposed]) x (0.571 [fraction of lifetime working]) x (Slope
Factor).
j g Hazard index=sum of individual hazard quotients.
h Total cancer risk=sum of individual cancer risks.
Note: mrg=milligram; m3=cubic meter, kg=kilogram.
Source: VA DEQ 1995a.
ni U) B-.

Table E.3.4-4. Risk Assessments From Exposure to Hazardous Chemicals at Nuclear Fuel Services: No Action I
Regulated Exposure Limits/Risk Factors Emissions Concentrations
Boundary Onsite Slope Annual 100 Meters
RfC PELV Factor MEIb 8 hours (mg/m3) (mg/m3) (mg/ke/davY1 (mt./m3l (nwom 3O
Hazard Quotient Boundary Worker Annual 100 Meters MEPb'e 8 Hoursd tm-/m31 f--i-3%
I I
Cancer Risk
Boundary Worker Annual 100 Meters ME~be 8 Hours
j Hazard Indexg 9.55x10.2 7.57x40.3
* Total Cancer Riskh 0 0 I SeeAppendix E, Table E.3.3-1 for the OSHA-PEL, ACGIH-TLV, NIOSH-REL, and other exposure limit values. | b MEI=maximally exposed individual of the public.
c C Hazard quotient for MEI=boundary annual emissions/reference concentration. d Hazard quotient for workers=100-meter, 8-hr emissions/permissible exposure limit. e Lifetime cancer risk for MEI=emissions concentrations) x (0.286 [converts concentrations to doses]) x (Slope Factor). f Lifetime cancer risk for workers: (Emissions for 8-hr) x (0.286 [converts concentrations to doses]) x (0.237 [fraction of year exposed]) x (0.571 [fraction oflifetime working]) x (Slope Factor). ! Hazard index=sum of individual hazard quotients. h Total cancer risk=sum of individual cancer risks. Note: mg-xmilligram; m3=cubic meter;, kg=kilogram. Source: NFS 1995b:2.
ChemicalAimnonia 0.1 35 - 9.17x10 3 1.50x10 1- 9.17x10 2 4.27x10 3 0 0 Hydrogen fluoride 0.21 2.49 - 3.88x10"4 6.33x10"3 1.85xi0"3 2.54x10 3 0 0 Nitric acid 0.1225 5 - 2.32x10"4 3.78x10"3 1.89x10"3 7.56x10"4 0 0 Health Risk
cz ..
ýX ;

Table E-3.4-5. Risk Assessments From Exposure to Hazardous Chemicals at Oak Ridge Reservation: Blend to 4-Percent Uranyl Nitrate
Hexahydnate for Commercial Reactor Fuel
Regulated Exposure Limits/fRsk Factors Emissions Concentrations Hazard Quotient Cancer Risk
Boundary Worker Boundary Worker Boundary Worker
Slope Annual 100 Meters Annual 100 Meters Annual 100 Meters
RfC PE Factor MEIb 8 hours MEP1c 8 Hoursd ME1b 8 Hoursf
Chemical (mg•m 3 ) (mglm3) (mg/kg/day)"1 (mgIm 3) (mglm3) (raghm3) (mglm3 ) (raglm3) (mglm3)
Carbon monoxide 1.35 55 _ 3.70x10 4 6.22x10"2 2.74x10 4 1.13x10 3 0 0
Uranium-235 0.0105 0.25 2.5x10"8 5.73x10"9 9-62x10"7 5-46xi0"7 3.85x10O 4.17x10 17 9.31x10"16
Uranium-238 0.0105 0.25 2.4x10⁻⁸ 1.71x10"7 2.87x10⁻⁵ 1-63x10 5 1.15x10 4 1.17x10 15 2.66x10"14
VOC (toluene) 0.4 766 _ 3.70x10⁻⁵ 6.22x10⁻³ 9.26xi0-5 8.12x10⁶ 0 0
Health Risk
Hazard Indexg 3.84x10"4 1.26x10 3
Total Cancer Riskh 1.21x10"15 2.75x10"14
a See Appendix E, Table E.3.3-1 for the OSHA-PEEL, ACGIH-TLV. NIOSH-REL, and other exposure limit values.
b MEI-maxim ly exposed individual of the public.
C Hazard quotient for MEI=boundary annual emissionslreference concentration.
d Hazard quotient for wokeras=10O-meter, 8-hr emissionslpermissible exposure limit.
C Lifetime cancer risk for MElI=emissions concentrations) x (0.286 [converts concentrations to doses]) x (Slope Factor).
f Lifetime Cancer Risk forWorker: (Emissions for 8-hr) x (0.286 [converts concentrations to doses]) x (0.237 [fraction of year exposed]) x (0.571 [fraction of lifetime working]) x
(Slope Factor).
g Hazard index=sum of individual hazard quotients.
h Total cancer zisk=sum of individual cancer risks.
Note mg=milligram; m3=cubic meter, kg=kilogmam.
Source: OR LMES 1995b.
P•
I

Table E.3.4-6. RiskAssessments From Exposure to Hazardous Chemicals at Savannah River Site: Blend to 4-Percent Uranyl Nitrate Hexahydrate for Commercial Reactor Fuel
Regulated Exposure Limits/Risk Factors Emissions Concentrations Hazard Quotient Cancer Risk Boundary Worker Boundary Worker Boundary Worker Slope Annual 100 Meters Annual 100 Meters Annual 100 Meters RfC PELa Factor MEIb 8 hours MEIbc 8 Hoursd MEIb,e 8 Hoursf Chemical (mg/m3) (mg/n 3) (mgIkg/day)-1 (mg/m3) (mg/m3) (mg/m3) (mg/m3) (mg/m3) (mg/m3) Carbon monoxide 1.35 55 - 4"2x10⁵ 5.57x10⁻² 3.05xi0"5 1.01x0-3 0 0 I Uranium-235 0.0105 0.25 2.5xi0-8 6.37x101- 0 8.61x10⁻⁷ 6.06x10⁻⁸ 3.44x10⁻⁶ 4.55x10.1 8 8.33x10.i 6 Uranium-238 0.0105 0.25 2.4x10⁻⁸ 1.90x10⁻⁸ 2.56x10⁻⁵ 1.81x10⁻⁶ 1.03x10_4 1.30x10. 16 2.38xi0. 14 VOC (toluene) 0.4 766 - 4.12x10"6 5.57x10"3 1.03x10 5 7.27x10" 0 0 Health Risk
Hazard Indexg 4.26x10 5 1.13x10. 3 [ Total Cancer Riskh 1.35x10.1 6 2.47x10. 14
a See Appendix E, Table E-3.3-1 for the OSHA-PEL, ACGIH-TLV, NIOSH-REL, and other exposure limit values. I b MEI=maximally exposed individual of the public. C Hazard quotient for MEI=boundary annual emissions/reference concentration. I d Hazard quotient for workers=100-meter, 8-hr emissions/permissible exposure limit. C Lifetime cancer risk for MEI=emissions concentrations) x (0.286 [converts concentrations to doses]) x (Slope Factor). f Lifetime cancer risk for workers: (Emissions for 8-hr) x (0.286 [converts concentrations to doses]) x (0.237 [fraction of year exposed]) x (0.571 [fraction oflifetime working]) x (Slope Factor). | Hazard index=sum of individual hazard quotients.
Ih Total cancer risk=sum of individual cancer risks. Note: mg=milligram; m3=cubic meter, kg=kilogram. Source: OR LMES 1995b.

Table E.3.4-7. Risk Assessments From Exposure to Hazardous Chemicals at Babcock & W•dcox: Blend to 4-Percent Uranyl Nitrate Hexahydrate for Commercial Reactor Fuel
I I
I I
I
U'
Regulated Exposure Limits/Risk Factors Emissions Concentrations Hazard Quotient Cancer Risk
Boundary Worker Boundary Worker Boundary Worker
Slope Annual 100 Meters Annual 100 Meters Annual 100 Meters
RfC PELa Factor MEP 8 hours MEIb 8 Hoursd NMb'e 8 Hours'
Chemical (mg/m3) (migm 3) (mg/kg/day)"1 (mg/m3) (mglm3) (rag/m 3) (mg/m3) (mg/m3) (mg/m3)
Carbon monoxide 1.35 55 - 1.34x10⁻⁶ 2.32x10⁻² 9.89x10"7 4.21x10"4 0 0
Uranium-235 0.0105 0.25 2.5x10⁻⁸ 2.07x10"11 3.58x10"7 1.97x10"9 1.43x10⁶ 1-48x10"19 3.47xi0-16
Uranium-238 0.0105 02.5 2.4x10"s 6.15x10"1 ° 1.07x10"5 5.86xi0"8 4.27x10"5 4.22x10"18 9.91x10"15
VOC (toluene) 0A 766 - 1.34x10- 2.32x10 3 3.34x10"7 3.02x10" 0 0
Health Risk
Hazard Indexg 1.38x10"6 4.68x10"4
Total Cancer Riskh 4.37x10"18 1.03x10"14
a See Appendix E, Table E.3.3-1 for the OSHA-PEL, ACGIH-TLV, NIOSH-REL, and other exposure limit values. b MEI--maximally exposed individual of the public.
' Hazard quotient for MEI=boundary annual emissionstreference concentration. d Hazard quotient for workers=100-meter, 8-hr emissions/permissible exposure limit.
C Lifetime cancer risk for MEI=emissions concentrations) x (0.286 [converts concentrations to doses]) x (Slope Factor).
f Lifetime cancer risk for workers: (Emissions for 8-hr) x (0.286 [converts concentrations to doses]) x (0.237 [fraction of year exposed]) x (0.571 [fraction of lifetime working]) x (Slope
Factor).
9 Hazard index=sum of indivddual hazard quotients. h Total cancer risk-sum of individual cancer risks.
Note: mg=milligram; m3=cubic meter;, kg=kilogram.
Source: OR LMES 1995b.
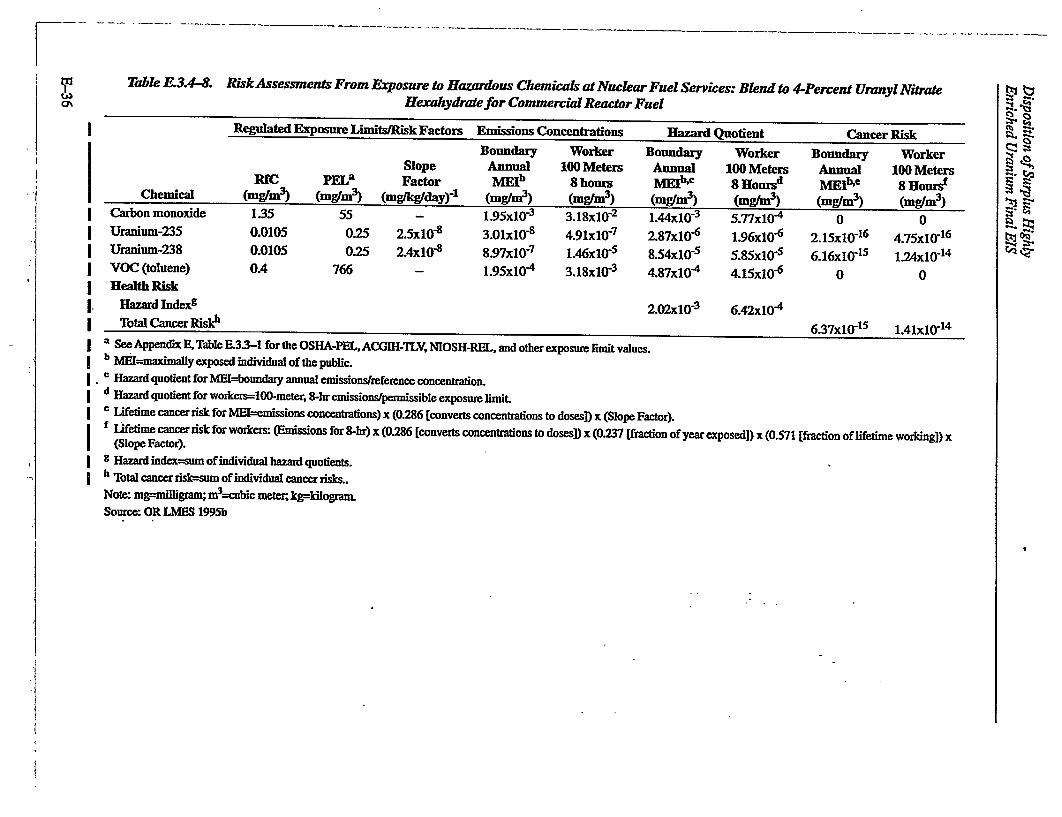
t 1Table E.34-8. RiskAssessments From Exposure to Hazardous Chemicals at Nuclear Fuel Services: Blend to 4-Percent Uranyl Nitrate I lHexahydrate for Commercial Reactor Fuel Z "
Regulated Exposure LimitsiRisk Factors Emissions Concentrations Hazard Quotient Cancer Risk Boundary Worker Boundary Worker Boundary Worker
Slope Annual 100 Meters Annual 100 Meters Annual 100 Meters RfC PEa Factor Mldb 8 hours MEIbXc 8 Hoursd ME~be 8 Hourst
Chemical (mg/m3 ) (mg/m3) (mg/kg/day)- (mg/m3) (mgIm3) (mgfm3 ) (mg/m3) (mg/m3) (mg/m3) Carbon monoxide 1.35 55 - 1.95x10⁻³ 3.18x10 2 1.44x10"3 5.77x10 4 0 0 Uranium-235 0.0105 0.25 2.5x10"8 3.01x10⁻⁸ 4.91x10⁻⁷ 2.87xl0-6 1.96x10⁻⁶ 2.15xi01- 6 4.75x10- 16
Uranium-238 0.0105 0.25 2.4x10"8 8.97x10⁻⁷ 1.46x10⁻⁵ 8.54x10⁻⁵ 5.85x10⁻⁵ 6.16xi0-15 1.24x10- 14
VOC (toluene) 0.4 766 - 1.95xi0"4 3.18x10⁻³ 4.87x10"4 4.15x10⁻⁶ 0 0 Health Risk
Hazard Indexg 2.02x10o3 6.4 2 xlO-4 Total Cancer Riskh 6.37x10 1 5 1.41x10. 14
4See Appendix ETable E.3.3-1 for the OSHA-PEL, ACGIH-TLV, NIOSH-REL, and other exposure limit values. b ME3---maximally exposed individual of the public. c Hazard quotient for ME[=boundaiy annual emissions/reference concentration. d Hazard quotient for workers=100-meter, 8-hr emissionstpennissible exposure limit. C Lifetime cancer risk for MEI=emissions concentrations) x (0.286 [converts concentrations to doses]) x (Slope Factor). f Lifetime cancer risk for workers: (Emissions for 8-hr) x (0.286 [converts concentrations to doses]) x (0.237 [fraction of year exposed]) x (0.571 [fraction of lifetime working]) x
(Slope Factor). g Hazard index=sum of individual hazard quotients. h Total cancer risk=sum of individual cancer risks.. Note: mg=mifligram; mO=cobic meter, kg=kilogram. Source: OR LMES 1995b
Cb.
�

Table E.3.4-9. Risk Assessments From Exposure to Hazardous Chemicals at Babcock & Wdcox: Blend to 4-Percent Uranium Hexafluoride for
Commercial Reactor Fuel
Regulated Exposure Limits/Risk Factors Emissions Concentrations Hazard Quotient Cancer Risk
Boundary Worker Boundary Worker Boundary Worker Slope Annual 100 Meters Annual 100 Meters Annual 100 Meters
RfC PEa Factor MEb 8 hours MEjb'c 8 Hoursd MEjIbe 8 Hoursf
Chemical (mg/m3) (mg/m3) (mg/kg/day)"1 (mg/M3) (mg/m3) (mg/m3) (mg/im3) (mg/m3) (mg/im3)
Carbon monoxide 1.35 55 _ 1.34x10⁻⁶ 2.32x10⁻² 9.89x10"7 4.21x10 4 0 0
Uranium-235 0.0105 0.25 2.5x10 8 3.28x10 11 5.68x10"7 3.12x10 9 2.27x10"6 2.34x10"19 5.50x10"16
Uranium-238 0.0105 0.25 2.4x10 8 1.20x10"9 2.07xlO5 1.14x10"7 8.29x10"5 8.21x10 18 1.93x10"14
YOC (toluene) 0.4 766 1 1.34x10⁻⁷ 2.32x10⁻³ 3.34x10l7 3.02x10" 0 0
Health Risk Hazard Index 1"44x10"6 5.09xi0"4
Total Cancer Riskh 8.44x10"18 198x10 14
a See Appendix E, Table E.3.3-1 for the OSHA-PEL, ACGIH-TLV, NIOSH-REL, and other exposure limit values. b ME1-maximally exposed individual of the public.
c Hazard quotient for MEI=boundary annual emissions/reference concentration. d Hazard quotient for workers=l00-meter, 8-hr emissions/permissible exposure limit.
C Lifetime cancer risk for MEI=emissions concentrations) x (0.286 [converts concentrations to doses]) x (Slope Factor).
f Lifetime cancer risk for workers: (Emissions for 8-hr) x (0.286 [converts concentrations to doses]) x (0.237 [fraction of year exposed]) x (0.571 [fraction of lifetime working]) x (Slope
Factor). , Hazard index=sum of individual hazard quotients. h Total cancer risk=sum of individual cancer risks.
Note: mg=miliigram; m3=cubie meter, kg=kilogram.
Source: OR LMES 1995a.

twp Table E.3.4-10. RiskAssessments From Exposure to Hazardous Chemicals at Nuclear Fuel Services: Blend to 4-Percent Uranium Hexafluoride 00 for Commercial Reactor Fuel
Regulated Exposure Limits/Risk Factors Emissions Concentrations Hazard Quotient Cancer Risk
Boundary Worker Boundary Worker Boundary Worker Slope Annual 100 Meters Annual 100 Meters Annual 100 Meters
RfC PELa Factor MEIb 8 hours MEIbc 8 Hoursd MElIb,e 8 Hoursf Chemical (mg/m3) (mg/m3) (mg/kg/day)-I (mg/m3) (mg/m3) (mg/m3) (mg/m3) (mg/m3) (mg/m3)
Carbon monoxide 1.35 55 - 1.95x10⁻³ 3.18x10"2 1.44x10"3 5.77x1O"4 0 0 Uranium-235 0.0105 0.25 2.5x10⁻⁸ 4.78x10⁻⁸ 7.80x10⁻⁷ 4.55x10⁻⁶ 3.12xi0-6 3.42x10⁻¹ 6 7.54x10⁻¹⁶
Uranium-238 0.0105 0.25 2.4x10⁻⁸ 1.74x10⁻⁶ 2.84x10⁻⁵ 1.66x10⁻⁴ 1.14x10⁻⁴ 1.20x10⁻¹⁴ 2.64x10⁻¹⁴
VOC (toluene) 0.4 766 - 1.95x10"4 3.18x10 3 4.87x10"4 4.15x10"6 0 0 Health Risk
Hazard Indexg 2.10x10⁻³ 6.98x10⁻⁴ Total Cancer Riskh 1.23x10 14 2.72xi0. 14
| See Appendix E, Table E.3.3-1 for the OSHA-PEL, ACGIH-TLV, NIOSH-REL, and other exposure limit values. b MEI=maximally exposed individual of the public.
c Hazard quotient for MEI=boundary annual emissions/reference concentration. I d Hazard quotient for workers=-00-meter, 8-hr emissions/permissible exposure limit.
C Lifetime cancer risk for MEI=emissions concentrations) x (0.286 [converts concentrations to doses]) x (Slope Factor). f Lifetime cancer risk for workers: (Emissions for 8-hr) x (0.286 [converts concentrations to doses]) x (0.237 [fraction of year exposed]) x (0.571 [fraction of lifetime working]) x
(Slope Factor).
g Hazard index=sum of individual hazard quotients. h Total cancer risk=sum of individual cancer risks. Note: rag=milligram; m3=cubic meter, kg=kilogram. Source: OR LMES 1995a.

Table E.3.4-11. Risk Assessments From Exposure to Hazardous Chemicals at Oak Ridge Reservation: Blend to 0.9-Percent Uranyl Nitrate Hexahydrate and Discard as Waste
Regulated Exposure Limits/Risk Factors Emissions Concentrations Hazard Quotient Cancer Risk Boundary Worker Boundary Worker Boundary Worker
Slope Annual 100 Meters Annual 100 Meters Annual 100 Meters RfC PELa Factor MEP 8 hours MEIb-c 8 Hoursd ME~be 8 Hoursf
Chemical (mg/m3) (mg/r 3) (mg/kgldayY1 (mg/m3) (mg/m3) (mg/m3) (mg/m3 ) (mg/m3) (mg/m3) Carbon monoxide 1.35 55 - 3.70x10"4 6.22x10"2 2.74x10"4 1.13xl0O3 0 0 Uranium-235 0.0105 0.25 2.5x10"8 5.73xi0"9 9.62x10 7 5.46xlO-7 3.85x10- 4.10xO-17 9.31x10 1 6
Uranium-238 0.0105 0.25 2.4xi0"8 1.71xlO"7 2.87x10⁻⁵ 1.63x10⁻⁵ 1.15x10⁻⁴ 1.7x10⁻¹⁵ 2.66x10 1 4
VOC (toluene) 0.4 766 - 3.70x10"5 6.22x10"3 9.26xi0"5 8.12x10"6 0 0 Health Risk
Hazard Indexg 3.84x10 4 1.26x10⁻³ Total Cancer Riskh 1.21x10"15 2.75x10- 14
See Appendix E, Table E.3.3-1 for the OSHA-PEL, ACGIH-TLV, NIOSH-REL, and other exposure limit values. b MEI=maximally exposed individual of the public. c Hazard quotient for MEI=boundary annual emissions/reference concentration. d Hazard quotient for workers= 100-meter, 8-hr emissions/permissible exposure limit. e Lifetime cancer risk for MEI=emissions concentrations) x (0.286 [converts concentrations to doses]) x (Slope Factor). f Lifetime cancer risk for workers: (Emissions for 8-hr) x (0.286 [converts concentrations to doses]) x (0.237 [fraction of year exposed]) x (0.571 [fraction of lifetime working]) x
(Slope Factor). S Hazard index=sumof individual hazard quotients. h Total cancer risk=sum of individual cancer risks. Note: mrg=milligram; m3=cubic meter;, kg=kilogram. Source: OR LMES 1995d.
tin

trl Table E.3.4-12. Risk Assessments From Exposure to Hazardous Chemicals at Savannah River Site: Blend to 0.9-Percent Uranyl Nitrate IHexahydrate and Discard as Waste
Regulated Exposure Limits/Risk Factors Emissions Concentrations Hazard Quotient Cancer Risk
Boundary Worker Boundary Worker Boundary Worker Slope Annual 100 Meters Annual 100 Meters Annual 100 Meters
RfC PELa Factor MEIb 8 hours MEIb,c 8 Hoursd MEIb&e 8 Hours! Chemical (mg/m3) (mg/im3) (mg/kg/day)-1 (mg/m3) (mg/m3) (mg/m3) (mg/m3) (mg/m3 ) (mg/m3)
Carbon monoxide 1.35 55 - 4.12x10 5 5.57x10"2 3.05x10"5 1.01xl0 3 0 0 Uranium-235 0.0105 0.25 2.5x10"8 6.37x10"t° 8.61x0"7 6.06x10"8 3.44x10"6 4.55x0-18 8.33x10⁻¹ 6
Uranium-238 0.0105 0.25 2.4x10"8 1.90xi0"8 2.56xl0"5 1.81x10"6 1.03x10 4 1.30x10"16 2.38x10"14
VOC (toluene) 0.4 766 - 4.12x10"6 5.57x10"3 1.03x10"5 7.27x10- 0 0 Health Risk
Hazard Indexg 4.26x10 5 1.13x10⁻³ Total Cancer Riskh 1.35xi0"16 2.47x10⁻¹⁴
a See Appendix E, Table E.3.3-1 for the OSHA-PEL, ACGIH-TLV, NIOSH-REL, and other exposure limit values. i b MEI--maximally exposed individual of the public.
C Hazard quotient for MEI=boundasy annual emissions/reference concentration. I d Hazard quotient for workers=100-meter, 8-hr emissions/permissible exposure limit.
e Lifetime cancer risk for MEI=emissions concentrations) x (0.286 [converts concentrations to doses]) x (Slope Factor). If Lifetime cancer risk for workers: (Emissions for 8-hr) x (0.286 [converts concentrations to doses]) x (0.237 (fraction of year exposed]) x (0.571 [fraction of lifetime working]) x (Slope Factor)-. .....
9 Hazard index--sum of individual hazard quotients. Ih Total cancer risk=sum of individual cancer risks.
Note: mg=milligram; m5=cubic meter, kg-kilogran. I Source: OR LMES 1995d.
I
I I I I I I I
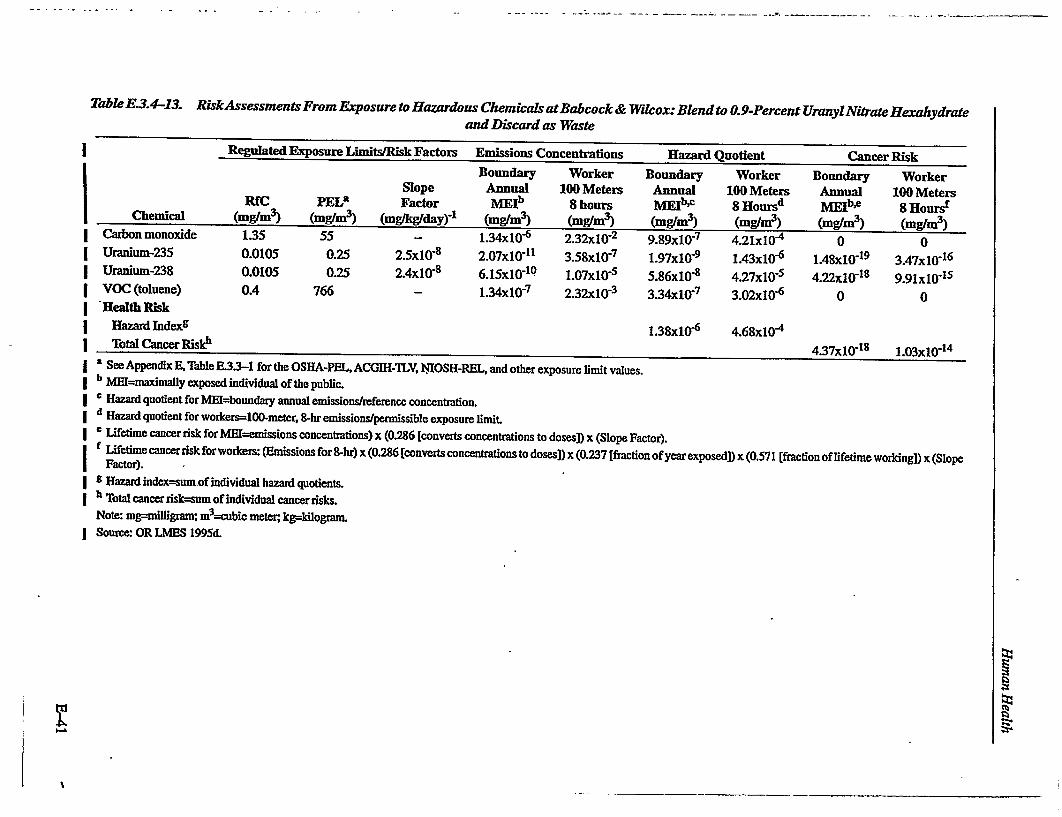
Table E.3.4-13. RiskAssessmentsFrom Exposure to Hazardous Chemicals at Babcock & Wilcox: Blend to 0.9-Percent Uranyl Nitrate Hexahydrate and Discard as Waste
Regulated Exposure Limits/Risk Factors Emissions Concentrations Hazard Quotient Cancer Risk Boundary Worker Boundary Worker Boundary Worker
Slope Annual 100 Meters Annual 100 Meters Annual 100 Meters RfC PELa Factor MEIb 8 hours MEIb' c 8 Hoursd MEIbe 8 Hoursf Chemical (mg/m3) (mg/rm3) (mg/kg/day)-1 (mg/m3) (mg/m3) (mg/m3) (mg/rm3) (mg/m3 ) (mg/m3)
Carbon monoxide 1.35 55 - 1.34x10⁻⁶ 2.32x10"2 9.89x10"7 4.21x10"4 0 0 Uranium-235 0.0105 0.25 2.5x10"8 2.07x1G-11 3.58x10⁻⁷ 1.97x10⁻⁹ 1.43x10- 1.48x10⁻¹⁹ 3.47x10⁻¹ 6
Uranium-238 0.0105 0.25 2.4x10"8 6.15x 10-'o 1.07x10 5 5.86x10 8- 4.27x10⁻⁵ 4.22x10⁻¹⁸ 9.91x10⁻¹⁵
VOC (toluene) 0.4 766 - 1.34x10"7 2.32xi0"3 3.34x10"7 3.02xi0"6 0 0 Health Risk
Hazard Indexg 1.38x10- 4.68x10.4
Total Cancer Risk1 4.37x10.1 8 1.03x10.14
[ See Appendix E, Table E.3.3-1 for the OSHA-PEL, ACGIH-TLV, NIOSH-REL, and other exposure limit values. I b MEI=maximally exposed individual of the public. c Hazard quotient for MEI--boundary annual emissions/reference concentration.
i d Hazard quotient for workers=100-meter, 8-hr emissions/permissible exposure limit. ' Lifetime cancer risk for MEI=emissions concentrations) x (0.286 [converts concentrations to doses]) x (Slope Factor). f Lifetime cancer risk for workers: (Emissions for 8-hr) x (0.286 (converts concentrations to doses]) x (0.237 [fraction of year exposed]) x (0.571 [fraction of lifetime working]) x (Slope Factor). 9 Hazard index=sum.of individual hazard quotients.
| h Total cancer risk=sum of individual cancer risks. Note: rg=milligram; m3=cubic meter, kg=kilogram.
| Sourne: OR LMES 1995d.

STable E.3.4-14. Risk Assessments From Exposure to Hazardous Chemicals at Nuclear Fuel Services: Blend to 0.9-Percent Uranyl NitrateHerahydrate and Discard as Waste
Regulated Exposure Limits/Risk Factors Emissions Concentrations Hazard Quotient Cancer Risk Boundary Worker Boundary Worker Boundary Worker
Slope Annual 100 Meters Annual 100 Meters Annual 100 Meters RfC PELa Factor MEIb 8 hours ME1' 8 Hoursd MEIb,e 8 HoursF
Chemical (mg/m3) (mg/m3) (mg/kg/day)-1 (mg/m3) (mg/m3) (mg/m3) (mg/m3) (mg/m3) (mg/m3) Carbon monoxide 1.35 55 - 1.95x10"3 3.18xlO"2 1.44x10"3 5.77x10"4 0 0 Uranium-235 0.0105 0.25 2.5xlO" 3.01x10"8 4.9Ix10-7 2.87x10⁻⁶ 1.96x10"6 2.15x10⁻¹⁶ 4.75x10⁻¹⁶
Uranium-238 0.0105 0.25 2.4x10"8 8.97x10⁻⁷ 1.46x10"5 8.54x10 5 5.85x10⁻⁵ 6.16x10-'s 1.36x10⁻¹⁴
VOC (toluene) 0.4 766 - 1.95x10 4 3.18x10"3 4.87x10"4 4.15x10"6 0 0 Health Risk
Hazard Indexg 2.02x10 3 6.42x10⁻⁴ Total Cancer Riskh 6.37x10⁻¹⁵ 1.41x10⁻¹⁴
a See Appendix E, Table E.3.3-1 for the OSHA-PEL, ACGIH-TLV, NIOSH-REL, and other exposure limit values. [ b MEI=maximally exposed individual of the public.
C Hazard quotient for MEI=boundary annual emissions/reference concentration. d Hazard quotient for workers=100-meter, 8-hr emissions/permissible exposure limit. e Lifetime cancer risk for MEI=emissions concentrations) x (0.286 [converts concentrations to doses]) x (Slope Factor). f Lifetimecancerrisk for workers: (Emissions for 8-hr)x (0.286 [converts concentrations todoses])x (0.237 [fraction of yearexposed]) x(0.571 [fraction oflifetime working]) x (Slope
Factor). g Hazard index=sum of individual hazard quotients.
I h Total cancer risk--sum of individual cancer risks. Note: mrg=milligram; m3=cubic meter;, kg=kilogram.
I Source: OR LMES 1995d.

Table E.3.4-15. Risk Assessments From Exposure to Hazardous Chemicals at Oak Ridge Reservation: Blend to 0.9-Percent Uranyl Metal and Discard as Waste
Regulated Exposure Limits/Risk Factors Emissions Concentrations Hazard Quotient Cancer Risk Boundary Worker Boundary Worker Boundary Worker
Slope Annual 100 Meters Annual 100 Meters Annual 100 Meters RfC PELa Factor MEjb 8 hours MEIb'€ 8 Hoursd MElbe 8 Hoursf
Chemical (mg/m3) (mg/m3) (mg/kg/day)"1 (mg/m3) (mg/m3) (mg/m3) (mg/m) (mg/m3) (mg/m3) Carbon monoxide 1.35 55 - 2.22x10"4 4.26x10"2 1.65x10"4 7.74x10 4 0 0 Uranium-235 0.0105 0.25 2.5x10"8 9.10x10¹⁰ 1.74x10"7 8.66x10⁻⁸ 6.97x10"7 6.50x10 18 1.69xi0"16
Uranium-238 0.0105 0.25 2.4x10"8 1.34x10"7 2.56x10"5 1.27x10"5 1.03x10"4 9.18x10"16 2.38x10⁻¹⁴
VOC (toluene) 0.4 766 - 1.85x10"5 3.55x10"3 4.63x10 5 4.63x10"6 0 0 Health Risk
Hazard Indexg 2.24x10"4 8.82x1OTotal Cancer Riskh 9.25x10"16 2.40x10"14
a See Appendix E, Table E.3.3-1 for the OSHA-PEL, ACGIH-TLV, NIOSH-REL, and other exposure limit values. b MEI--maximally exposed individual of the public. C Hazard quotient for MEI=boundary annual emissions/reference concentration. d Hazard quotient for workers=100-meter, 8-hr emissions/permissible exposure limit. c Lifetime cancer risk for MEI=emissions concentrations) x (0.286 [converts concentrations to doses]) x (Slope Factor).
f Lifetime cancer risk for workers: (Emissions for 8-hr) x (0.286 [converts concentrations to doses]) x (0.237 (fraction of year exposed]) x (0.571 [fraction of lifetime working]) x (Slope Factor).
I I I I
I I I I I I
I
tri
g Hazard indexfsum of individual hazard quotients.
h Total cancer risk=sum of individual cancer risks.
Note: mrg=milligram; m3=cubic meter, kg=kilogram. Source: OR LMES 1995c.
CTable deleted.]

Disposition of Surplus Highly Enriched Uranium Final EIS
Table E.3.4-16. Risk Assessments From Exposure to Hazardous Chemicals at Oak Ridge Reservation
Hazard Index Cancer Risk
Boundary Worker" Boundary Workere Annual 100 Meters Annual 100 Meters
Alternatives ME1a,b 8 Hours ME~ad 8 Hours
No Action 3.95xi0"2 0.154 0 0
Blend to LEU as 4% UNH for commercial reactor fuel 3.84x10"4 1.26xl0"3 1.21x10"15 2.75x10"14
Blend to LEU as 0.9% UNH and discard as waste 3.84x40 4 1.26x10⁻³ 1.21x10"15 2.75x10 14
Blend to LEU as 0.9% metal and discard as waste 2.24x10 4 8.82x10"4 9.25x10"16 2.40x10"14
No Action + Alternative
No Action + 4% UNH 3.99x10"2 0.155 1.21x10 15 2.75x10"14
No Action + 0.9% UNH 3.99x.102 0.155 1.21x10 15 2.75x10"14
No Action + 0.9% metal 3.97x10"2 0.155 9.25x10"16 2.40x10"14
a MEI=maximally exposed individual of the public. b Hazard index=sum of Individual Hazard Quotients (noncancer adverse health effects) for MEI.
c Hazard index=sum of Individual Hazard Quotients (noncancer adverse health effects) for Workers.
d Lifetime cancer risk=(Emissions Concentrations) x (0.286 [converts concentrations to doses]) x (Slope Factor).
C Lifetimecancerrisk=(emissionsfor8 hr) x (0.286 [converts concentrations to doses]) x (0.237 [fraction of yearexposed]) x (0.571
[fraction of lifetime working]) x (Slope Factor [exposed]) x (0.571 [Fraction of lifetime working]) x (Slope Factor).
Note: UNH=uranyl nitrate hexahydrate.
Source: OR LMES 1995b; OR LMES 1995c; OR LMES 1995d; OR MMES 1995i.
Table E.3.4-17. RiskAssessments From Exposure to Hazardous Chemicals at Savannah River Site
Hazard Index Boundary Worker' Annual 100 Meters
Boun Ann
Cancer Risk Ldary Workere nual 100 Meters
Alternatives MEI,"' 8 Hours M.~i, a nours NoAction 5.16x10 3 1.16 1.31x10"7 1.94x10"4
Blend to LEU as 4% UNH for commercial reactor fuel 4.26x10 5 1.13x10"3 1.35x10"16 2.47x!0"14
Blend to LEU as 0.9% UNH and discard as waste 4.26x10" 1.13x10 3 1.35x10"16 2.47x10"14
[Text deleted.]
No Action + Alternative
No Action + 4% UNH 5.20x10"3 1.16 1.31x10"7 1.94x10 4
No Action + 0.9% UNH 5.20x10s3 1.16 1.31x10"7 .94x10"4
[Text deleted.] N MEI=maximally exposed individual of the public.
b Hazard index=sum of Individual Hazard Quotients (noncancer adverse health effects) for MEL
I Hazard index=sum of Individual Hazard Quotients (noncancer adverse health effects) for Workers. d Lifetime cancer risk=(Emissions Concentrations) x (0.286 [converts concentrations to doses]) x (Slope Factor).
e Lifetime cancer risk=(emissions for 8 hr) x (0.286 [converts concentrations to doses]) x (0.237 [fraction ofyear exposed]) x (0.571
[fraction of lifetime working]) x (Slope Factor [exposed]) x (0.571 [Fraction of lifetime working]) x (Slope Factor).
Note: UNH=uranyl nitrate hexahydrate.
Source: OR LMSS 1995b; OR LMES 1995d; SRS 1995a:2: SRS 1996a:1.
E-44
I
I
I
I
I
!

Table E,2.3-8. Mixed Low-Level Waste and Low-Level Waste Treatment Facilities at Idaho National Engineering Laboratory
Treatment Method Input Capability Output Capability Total Capacitya Comment
Treatment Unit (m3/yr)
High Efficiency Acid leach Particulate Air Filter Leach (CPP-659)
ICPP debris treatment and containment
Advanced Mixed Waste Treatment Project
INEL waste treatment, 40 CFR 262.34
Liquid Effluent Treatment and Disposal Facility
Mixed LLW Treatment Facility
New Waste Calcining Facility
Water wash, carbon dioxide, abrasion
Amalgamation, compaction, incineration, macroencapsulation, stabilization, thermal desorption, vitrification
Absorption, neutralization, solidification
Fractionation, evaporation
Amalgamation, decontamination, incineration, macroencapsulation, neutralization, precipitation, sizing, stabilization
Calcification
Portable Water Treatment Adsorption, filtration, System neutralization
HLW, TRU, mixed LLW-contact-handled, remote-handled, alpha, solid, debris
HLW, TRU, mixed LLW-contact-handled, remote-handled alpha, solid, debris
Mixed TRU, mixed LLW, contact-handled, remote-handled alpha
Mixed LLW-contacthandled, aqueous liquid, solid, debris
Mixed LLW-contacthandled, remotehandled liquid (PEW evaporator)
Mixed LLWcontact-handled liquid, solid
Mixed LLW, HLW, mixed TRU remotehandled liquid
Mixed LLW-contacthandled, aqueous liquid
LLW solid to RWMC, I 1 Under modification;concentrated liquid to tank farm, nonhazardous to sanitary landfill
Mixed LLW, HLW, TRU solid, liquid
Mixed TRU, mixed LLW, LLW solid
Mixed LLW, LLW
Mixed LLW-contacthandled, remotehandled liquid to acid recycle for New Waste Calcining Facility, or tank farm
Mixed LLW-contacthandled
HLW-remote-handled solid
Mixed LLW
227
26,900
Planned
12,200
401
470
126
RCRA final 1990; interim NESHAP to 1999
Water wash operational, carbon dioxide existing, plan to use.
Unapproved, planned
Operational
Operational; RCRA final 1990; NESHAP final and State Prevention of Significant Deterioration 1988
Approved, planned
Operational; RCRA interim 1990
Existing, plan to use.
LA hi
�T1
(n
NJ
NJ

Table E.2.3-8. Mixed Low-Level Waste and Low-Level Waste Treatment Facilities at Idaho National Engineering Laboratory-Continued
Treatment Method Input Capability Output Capability Total Capacitya Comment
Treatment Unit (m3/yr)
oD f. %,XAd U0tot Melt drain_ evanorate Mixed LLW remote- Mixed LLW, remote- 42 Unapproved, planned
Treatment Facility
Sodium Processing Facility
Water reaction
TAN cask dismantlement Disassembly, recovery
Waste Reduction Operations Complex
Waste Reduction Operations Complex
Waste Reduction Operations Complex
Waste Experimental Reduction Facility
Waste immobilization
Amalgamation
Debris sizing
Neutralization
Incineration, stabilization, macroencapsulation
Vitrification or ceramic fusion
handled, alpha
Mixed LLW contact-handled
Mixed LLW contact-handled
Mixed LLW contact-handled, solid
Mixed LLW, LLW contact-handled, solid
Mixed LLW contact-handled
Mixed LLW contacthandled, liquid, solid
handled, alpha Mixed LLW contact
handled, decontaminated sodium
Mixed LLW contacthandled
LLW solid
Mixed LLW, LLW solid
LLW
LLW, mixed LLW solid to RWMC (stabilized solids and grout)
HLW, mixed TRU, mixed HLW solid ceramic LLW solid
698
11
0.4
23
4.2
Input 49,610; output 236 grout and 2,770 stabilized solids to RWMC
3,020
Existing, needs modification
Operational
Planned, approved
Planned, approved
Planned, approved
Interim NESHAP 1987, 1992; RCRA interim 1987, 1992; State final 1992. Shut down. Expect operation in 1996.
Unapproved, planned
a For those facilities already in use. this is a normal operating capacity, whereas for facilities under design or construction, this is a design capacity. Schedules and capacities for facilities
under design or construction are subject to changes such as availability of funds, results of treatability studies, and permit issuance.
[Text deleted.] Source: IN DOE 1995d.
W.
c-b c-b �
.- ,
a
0 a C-,
C-,
0,
VI,
I

Human Health
Table E.3.4-20. In-Tank Precipitation Facility and Consolidated Incineration Facility Chemicals and Regulated Levels-Continued
I I
I
Chemical
Chromium (hexavalent) compounds
Cresols (m-, o-, p-)
Cumene Dibutyl phthalate
Dichloroethyl ether
Dimethyl phthalate Dimethyl sulfate
Dioxane Epichlorohydrin Ethyl benzene
Ethylene dibromide
Ethylene dichloride
Ethylene glycol Ethylene imine (aziridine) Ethylene oxide Ethylene thiourea Formic acid
Furfural Heptachlor Hexachlorobenzene
Hexachlorobutadiene Hexachloroethane Hexachlorocyclopentadiene Hydrazine Hydrochloric acid
Hydrogen cyanide Hydrogen fluoride
Lead Lindane (all isomers)
Maleic anhydride Mercury (vapor) MEK Methanol Methoxychlor Methyl chloride Methylene chloride
Methyl hydrazine
Methyl iodide
Methyl methacrylate MIBK Napthalene Nickel oxide Nitrobenzene
E-47
Maximum Emission Rate (lb/hr)
0.009 0.0531 0.0531 0.0531
0.0531 0.0531 0.0531 0.0531
0.0531 0.0531
0.0531 0.0531 0.0531 0.0531
0.0531 0.0531 0.0531 0.0531 0.217 0.0531 0.0531 0.0531 0.0531 0.0531 4 3.81 3.81
0.09 0.0531 0.0531 0.02 0.0531 0.0531 0.0531 0.0531 0.0531 0.0531 0.0531 0.0531 0.0531 0.0531 0.054 0.0531
PEL (rmg/ms)
1 22
245 5
90 5 5
360
19 435 156.2 411 286
1.83
9 20
0.5
10 1.3
7 11 2.49 0.05
0.5 1
0.1
260 15
210 1765
0.35 28
410
50
5

Disposition of Surplus Highly Enriched Uranium Final EIS
Note- lb=pound; hr-hour; mg-mImwgrain; In Cuu1W u.
Source: SR DOE 1995b; SR DOE 1996a.
E-48
I
I
Table E.3.4-20. In-Tank Precipitation Facility and Consolidated Incineration Facility
Chemicals and Regulated Levels-Continued
Maximum Emission Rate PEL
Chemical (b/hr) (mg/mr)
Parathion 0.217 0.1
Pentachloronitrobenzene. 0.0531
Pentachlorophenol. 0.0531 0.5
Phenol 0.0531 19
Phosgene 0.0531 0.
Phthalic anhydride 0.0531 12
Selenium 0.0011 0.2
Sodium hydroxide 0.05 2
Tetrachloroethylene 0.0531 689
Toluene 0.0531 766
Toxaphene 0.217 0.5
Trichloroethylene (TCE) 0.0531 546
Vinyl chloride 0.0531
Vinylidine chloride 0.0531
* These rates are the maximum potential emiissions and would be in compliance with the most stringent applicable standards (for
example, SC DHEC Standards).
Note: The Consolidated Incineration Facility incinerates a wide range of combustible hazardous mixed and low-level wastes so that
the chemicals included in this table would become innocuous. The In-Tank Precipitation Facility is part of the pre-treatment
to remove metals/metal salts from materials potentially released from the Defense Waste Processing Facility. When these
facilities are integrated into the Defense Waste Processing Facility, hazardous chemical releases are expected to be reduced
by several orders of magnitude.

Human Health
I E.4
HEALTH EFFECTS STUDIES: EPIDEMIOLOGY
E.4.1 STUDY DESIGNS
Adverse health effects associated with ionizing
radiation exposure were first identified about 60
years ago. Studies published in the 1930s first
documented cancer among painters who used radium
to paint watch dials from 1910 to 1920. Radiation
therapy for disease has been used since the 1930s,
and studies have shown that the risk of cancer is
related to the amounts of radiation received. Nuclear
weapons research and manufacture, and consequent
exposure to radiation, began in the late 1930s.
Exposure to radionuclides has changed over time,
with higher levels occurring in the early days of
research and production. Due to concern regarding
potential adverse health effects, numerous
epidemiologic studies have been conducted among
workers who manufactured and tested nuclear
weapons. More recently, concerns about offsite
radiologic contaminants have resulted in health
studies among communities that surround DOE
Various epidemiologic studies have been cbnducted
at some of the sites evaluated in this EIS due to
concern regarding potential adverse health effects
associated with the manufacture and testing of
nuclear weapons. With a few exceptions, most
epidemiological studies of the populations living
near the site have been descriptive in nature and are
what epidemiologists refer to as "ecologic" or "correlational" studies. Occupational epidemiologic
studies (that is, studies of works) have been mostly
analytical. The various epidemiologic studies, along
with their assumptions and limitation are described in
Section E.4.2 through E.4.5. These studies focus on
the workforce and residents of communities
surrounding DOE and commercial sites. The
epidemiology articles related to the disposition of
surplus HEU include studies conducted at ORR,
SRS, B&W, and NFS and in communities
surrounding these sites. Currently, the only action
being taken with surplus HEU is interim storage,
which takes place only at the Y-12 Plant at Oak
Ridge, Tennessee. A number of options are under
consideration, which may affect activities at the Y
12 facility and the SRS. Two other locations that are
not DOE facilities, but may be affected, are B&W
and NFS.
.4.1.1 Ecologic Studies
Ecologic studies compare the frequency of a disease in groups of people in conjunction with simple
descriptive studies of geographical information in an
attempt to determine how health events among
populations vary with levels of exposure. These
groups may be identified as the residents of a
neighborhood, a city, or a county where demographic
information and disease or mortality data are
available. Exposure to specific agents may be defined
in terms of residential location or proximity to a
particular area, such as distance from a waste
disposal site. An example of an ecologic study would
be an examination of the rate of heart disease among
community residents in relation to the quality of their
drinking water.
The major disadvantage of ecologic studies is that the
measure of exposure is based on the average level of
exposure in the community, when what is needed is
each individual's exposure. Ecologic studies do not
take into account other factors, such as age and race,
that may also be related to disease. These types of
studies may lead to incorrect conclusions, known as
"ecologic fallacies." For the above example, it
would be incorrect to assume that the level of water
hardness influences the risk of getting heart disease.
Despite the obvious problems with ecologic studies,
they can be a useful first step in identifying possible
associations between risk of disease and
environmental exposures. However, because of their
potential for bias ecologic studies should never be
E-49E-49
facilities. The following section gives an overview of epidemiology followed by a review of epidemiologic
studies for sites evaluated in this EIS.
Epidemiology is the study of the distribution and
determinants of disease in human populations. The
distribution of disease is considered in relation to
time, place, and person. Relevant population
characteristics should include the age, race, and sex
distribution of a population, as well as other
characteristics related to health, such as social
characteristics (for example, income and education),
occupation, susceptibility to disease, and exposure to
specific agents. Determinants of disease include the
causes of disease, as well as factors that influence the
risk of disease.
E

Disposition of Surplus Highly Enriched Uranium Final EIS
considered as more than an initial step in an investigation of the cause of a disease.
E.4.1.2 Cohort Studies
The cohort study design is a type of epidemiologic study frequently used to examine occupational. exposures within a defined workforce. A cohort-study requires a defined population that can be classified as being exposed or not exposed to an agent of interest, such as radiation or chemicals that influence the probability of occurrence of a given disease. Characterization of the exposure may be qualitative (for example, high, low, or no exposure) or very quantitative (for example, radiation measured in rem, chemicals in parts per million). Surrogates for exposure, such as job titles, are frequently used in the absence of quantitative exposure data.
Individuals included in the study population are tracked for a period of time and fatalities recorded. In general, overall fatality rates and cause-specific fatality rates have been determined for workers at the EIS sites. Fatality rates for the exposed worker population are compared with fatality rates for workers who did not have the exposure (internal comparison), or are compared with expected fatality rates based on the U.S. population or State fatality rates (external comparison). If the fatality~rates differ from what is expected, an association is said to exist between the disease and exposure. In cohorts where the exposure has not been characterized, excess mortality can be identified. However, these fatalities cannot be attributed to a specific exposure, and additional studies may be warranted. More recent studies have looked at other disease endpoints, such as overall and cause-specific cancer incidence (newly diagnosed) rates.
Most cohort studies at the EIS sites have been historical cohort studies (that is, the exposure occurred some time in the distant past). These studies rely on past records to document exposure. This type of study can be problematic if exposure records are incomplete or were destroyed. Cohort studies require extremely large populations that have been followed for 20 to 30 years. They are generally difficult to conduct and are very expensive. These studies are not well suited to studying diseases that are rare. Cohort studies do, however, provide a direct estimate of the
risk of fatality from a specific disease, and allow an investigator to look at many disease endpoints.
E.4.1.3 Case-Control Studies
The case-control study design starts with the identification of persons with the disease of interest (case) and a suitable comparison (control) population of persons without the disease. Controls must be persons who are at risk for the disease and are representative of the population that generated the cases. The selection of an appropriate control group is often quite problematic. Cases and controls are then compared with respect to the proportion of individuals exposed to the agent of interest. Casecontrol studies require fewer persons than cohort studies, and, therefore, are usually less costly and less time consuming, but are limited to the study of one disease (or cause of fatality). This type of study is well suited for the study of rare diseases and is generally used to examine the relationship between a specific disease and exposure.
E.4.1.4 Definitions
Unfamiliar terms frequently used in epidemiologic studies, including those used in this document, are defined below.
Age, gender, and cigarette smoking are the principal determinants of mortality. Standardization is a statistical method used to control for the effects of age, gender, or other characteristics so that fatality rates may be compared among different population groups. There are two ways to standardize rates: the indirect method and the direct method. In general, the indirect method of standardization is most frequently used.
Indirect standardization: The disease rates in the reference (comparison) population are multiplied by the number of individuals in the same age and gender groups in the study population to obtain the expected rate of disease for the study population..
Direct standardization: The disease rates in the study population are multiplied by the number of individuals in the same age and gender groups in the reference
E-50
- -_... . ..... ...... r- -
Human Health
(comparison) population. This gives the expected rates of disease for the reference population if these rates had prevailed in that group.
Standardized mortality ratio (SMR): The SMR is the ratio of the number of fatalities observed in the study population to the number of expected fatalities. The expected number of fatalities is based on a
reference (or comparison population). Fatality rates for the U.S. (or State) population are most frequently used as the comparison to obtain expected rates. An
SMR of 1 indicates a similar risk of disease in the study population compared with the reference population. An SMR greater than 1 indicates excess risk of disease in the study population compared with the reference group, and an SMR less than I indicates a deficit of disease.
Relative risk: The ratio of the risk of disease among the exposed population to the risk of disease in the
unexposed population. Relative risks are estimated from cohort studies.
Odds ratio: The ratio of the odds of disease if exposed to the odds of disease if not exposed. Under certain conditions, the odds ratio approximates the
relative risk. Odds ratios are estimated from casecontrol studies.
E.4.2
E.4.2.1
OAK RIDGE RESERVATION, OAK
RIDGE, TN
Surrounding Communities
The population-based National Cancer Institute mortality survey for selected nuclear facilities (NIH Publication No. 90-874, July 1990; JAMA 1991a:1403-140 8) examined the cancer mortality within a 50-mile radius around several nuclear facilities, including Anderson and Roane counties. No excess cancer mortality was observed in the population living in the exposed counties when compared to the U.S. white male population, nor when compared to the population of the control counties (Blount, Bradley, Coffee, Jefferson, Hamblen, TN, and Henderson, NC), nor when time trends were assessed.
Tennessee Medical Management, Inc., used data from the Tennessee Cancer Reporting System to compare mortality and incidence data for counties
near Oak Ridge, Tennessee to the U.S. population for the 3-year period 1988 to 1990 (TMM 1993a). For Oak Ridge, total fatalities from all causes was
significantly lower than expected. For Anderson County, the observed number of fatalities from uterine cancer and from cancer of respiratory and
intrathoracic organs was statistically greater thanr
expected, and'the number of fatalities from brain cancer, breast cancer, and the "all other sites" category were lower than expected. for Anderson County. For Roane County, the number of fatalities from cancer of the respiratory and intrathoracic organs was statistically greater than expected; the
number of fatalities from cancer of the digestive organs and the peritoneum, from uterine cancer and
from lip, oral cavity, and pharynx cancer was lower than expected.
Tennessee Medical Management, Inc., examined
new (incident) cancer cases and identified the following statistically significant:. For Anderson County, the observed numbers of cases of cancer of
the prostate, lung, and bronchus were greater than
expected. Leukemia, stomach and small intestine cancers, and cancers of the colon and intestinal tract
were lower than expected. For Roane County, the number of cases of cancer of the lung and bronchus was greater than expected. Non-Hodgkins lymphoma, female breast cancer, esophageal cancer,
cancer of the pancreas,, and cancer in all sites were lower than expected. The only consistent excess reported for both cancer mortality and cancer incidence was for cancer of respiratory and intrathoracic organs.
Because of a concern for possible contamination of
the population by mercury, the Tennessee Department of Environment and Conservation (previously the Tennessee Department of Health and Environment) conducted a pilot study in 1984 (TN DHE 1984a). The study showed no difference in urine or hair mercury exposures (residence or activity
in contaminated of fish caught in the contaminated areas) compared to those with little potential exposure. Mercury levels in some soils measured as
high as 2,000 parts per million (ppm). Analysis of a
few soil samples showed that most of the mercury in the soil, however, was inorganic, thereby lowering the probability of bioaccumulation and health effects. Examination of the long-term effects of exposure to mercury and other chemicals continues.
E-51

Disposition of Surplus Highly Enriched Uranium Final EIS
E.4.2.2 State Health Agreement Program
Under the State Health Agreement program managed by the DOE's Office of Epidemiologic Studies, a grant was awarded to the Tennessee Department of Environment and Conversation (previously the Tennessee Department of Health and Environment). The purpose of the grant was to determine the extent. of exposure to contaminants among workers and residents of the surrounding community as a result of ORR operations, and to assess the current status of health outcomes and determine their potential association with these exposures.
A dose reconstruction feasibility study began in 1992, with the contract awarded by the State of Tennessee to ChemRisk. After performing an extensive review of Oak Ridge documents ChemRisk concluded that sufficient information exists to reconstruct past releases and offsite doses caused by radioactive and hazardous materials. They also concluded that doses from mercury, polychlorinated biphenyl (PCBs), radioactive iodine, and radioactive cesium may have been great enough to cause harmful health effects in the offsite population. Based on this information, a full dose reconstruction study was initiated in August 1994.
Other activities supported under the grant include development of a birth defects registry; a quality improvement program for the Tennessee cancer registry; a review and evaluation of the DOE occupational medical program; and the implementation of a community participation/public information program.
Technical support to the State health department is provided by a 12 member Oak Ridge Health Agreement Steering Panel. The Health Advisory Panel provides direction and oversight to those working on health studies, ensures public input, and informs the public of activities related to the health studies. A representative of the Centers for Disease Control and Prevention's National Center for Environmental Health is a member of the advisory panel. A representative from DOE serves as an exofficio member.
E.4.2.3 Workers
Between 1943 and 1985, there were 118,588 male and female individuals of all races who were ever employed in any of the Oak Ridge facilities. These included Oak Ridge National Laboratory (ORNL) for nuclear research (also called the X-10 Facility), Y-12 under management of the Tennessee-Eastman Corporation (1943 to 1947) which produced enriched uranium by the electromagnetic separation process, Y-12 under management of Union Carbide (1948 to 1984) which fabricated and certified nuclear weapons parts, and K-25 (Oak Ridge Gaseous Diffusion Plant) which produced enriched uranium through the gaseous process. Analyses at the Oak Ridge facilities have been carried out mostly for white males, and for specific cohorts taking into consideration time-related exposure risks.
Oak Ridge National Laboratory. The mortality experience of 8,375 white males employed at least a month between 1943 and 1972 at ORNL was compared with the U.S. white male population using SMR analyses in a 1985 paper by Checkoway, et al. (BJIM 1985a;525-533). Increases in fatalities from leukemia (SMR=1.49, 16 observed, 95 percent confidence interval [CI] for range 0.31-4.38), cancer of the prostate (SMR=1.16, 14 observed, 11.9 expected), and Hodgkin's disease (SMR=1.10, 5 observed, 3.7 expected) were observed, although none were statistically significant. Dose response analyses were performed for all causes of fatalities combined, all cancers combined, leukemia, and prostate cancer comparing exposed worker fatality rates with non-exposed worker fatality rates. Dosimetry data were available for the entire period of the study with the total population external radiation dose measuring 13,500 person-rem. No dose response gradients were observed. Fatality rates were calculated for 11 different job categories by length of time in each job in an attempt to determine whether specific work environments were related to cancer and leukemia. Leukemia mortality was observed to be related to length of employment in engineering and maintenance jobs.
Followup of this cohort was expanded through 1984 in an updated study by Wing et al. (JAMA 1991a:1397-1402). Again, fatality rates in the worker population were compared with those in the U.S. population. Non-statistically significant increases
E-52

Human Health
were noted for cancers of the pancreas (SMR=1.09, 25 observed, 95 percent CI for range 0.71-1.61), prostate (SMR=1.05, 26 observed, 95 percent CI for range 0.68-1.53), brain (SMR=1.04, 15 observed, 95 percent CI for range 0.58-1.72), and lymphosarcoman and/or reticulosarcoma (SMR=1.05, 9 observed, 95
percent CI for range 0.48-1.99). There was a significant increase in fatalities from leukemia (SMR=1.63, 28 observed, 95 percent CI for range 1.08-2.35). The total population external radiation
dose was 14,400 person-rem. Dose response analyses performed for all causes except cancer, lung cancer, and leukemia did not demonstrate a relationship between level of external radiation and increased risk
of fatality from these outcomes. There was a
significant dose response relationship (4.94 percent per rem) between cancer fatalities and level of external radiation dose using models with a 20-year lag. A subgroup of workers who were monitored for internal contamination had non-statistically elevated SMRs for cancer of the prostate (SMR=1.12, 10 observed, 95 percent CI for range 0.53-2.05) and lymphosarcoma and/or reticulosarcoma (SMR=1.65, 6 observed, 95 percent CI for range 0.60-3.59). The workers monitored for internal contamination had a statistically significant elevated SMR for leukemia (SMR=2.23 16 observed, 95 percent CI for range 1.27-3.62).
A second publication on the above data set examined the effect of controlling for a number of possible selection and confounding factors on the risk coefficient for all cancer dose responses (AJIM 1993a:265-279). Models were adjusted for the following variables with little change in the previously reported risk coefficients: employment during the World War H era, short-term employment, job category, and exposure to beryllium, lead, and mercury. The authors concluded that the previously calculated dose response estimate was fairly stable when adjustments were made for a wide range of potential confounders that were not explored in the earlier study.
Y-12 Plant. The Y-12 Plant is a nuclear weapons materials fabrication plant where the radiologic exposure of greatest concern is internal exposure from the inhalation of uranium compounds. The Tennessee Eastman Corporation managed the plant from 1943 to 1947. Polednak and Frome reported a
followup through 1974 of all 18,869 white male
workers employed atY-12 from 1943 to 1947 (JOM 1981a:169-17 8 ). The workers included those
exposed to internal (alpha) and external (beta)
radiation through the inhalation of uranium dusts,
electrical workers who performed maintenance in the
exposed areas, and other non-exposed workers.
Individual measures of exposure were not available
for any members of this cohort, so exposure levels
were inferred from plant areas of work and jobs. High
average air levels of uranium dust were documented
in departments employing chemical workers.
Elevated SMRs were observed for mental,
psychoneurotic, personality disorders (SMR=1.36,
33 observed, 24.2 expected), emphysema (SMR=l.16, 100 observed, 85.89 expected), diseases
of the bones and organs of movement (SMR=1.22, 11
observed, 8.49 expected), lung cancer (SMR=1.09,
324 observed, 296.47 expected), and external causes
of fatality (SMR=1.09, 623 observed, 571.77
expected). The lung cancer SMR was greater among
workers employed for 1 year or more compared with
workers employed less than 1 year and was more
pronounced in workers hired at the age of 45 or older
(SMR=1.51; 95 percent CI for range 1.01-2.31). Of
the workers employed after the age of 44, the SMR
for lung cancer was greatest for electrical workers
(SMR=1.55, 7 observed, Freeman-Thkey deviation
[D] is 1.11), alpha chemistry workers (SMR=3.02, 7
observed, D is 2.27) and beta process workers (SMR=I.51, 11 observed, D is 1.30).
During the early operation of the Y-12 Plant, from
1942 to 1947, a group of male workers was exposed
to phosgene gas on a chronic basis (N=694), and a
smaller group of males received acute exposures
(N=106) along with a group of females (N=91)
(ER 1980a:357-3 67; TIH 1985a:137-14 7 ). A control
group of 9,280 workers who also worked at Y-12
during the same era, but who did not have phosgene
exposure, was also described. All groups were
followed through the end of 1978. The SMRs for the
chronically exposed group and the control group
were similar for all causes examined. There was no
evidence of increased mortality from respiratory
diseases in this group, and the SMR for lung cancer,
while elevated, was similar to the lung cancer SMR
for workers in the rest of the plant. Among those with
acute exposures, the SMR for respiratory diseases
was elevated (SMR=2.66, 5 observed, confidence
factor not provided), and this elevation may be
related to residual lung damage from the acute
E-53
Disposition of Surplus Highly Enriched Uranium Final EIS
phosgene exposure. It was difficult to trace the vital status of the 91 women; therefore, description of these highly-exposed workers was limited to listing the frequency of their initial symptoms after exposure. As expected, nausea, vomiting, and cough were the most frequently reported symptoms. Unexpectedly, the women experienced a lower frequency of pneumonitis than their male counterparts.
The portion of the Y-12 cohort employed between 1947 and 1974 was described in a study by Checkoway et al. (AJE 1988a:255-366). This study included 6,781 white male workers first employed at Y-12 between 1947 and 1974 who were employed for at least 30 days. Mortality data were collected for the cohort through the end of 1979 and were used to perform SMR and cause-specific dose-response analyses. Non-statistically significant increases were observed for all cancers (SMR=1.01, 196 observed, 95 percent CI for range 0.88-1.17), diseases of the blood-forming organs (SMR=I.48, 3 observed, 95 percent CI for range 0.31-4.38), kidney cancer (SMR=1.22, 6 observed, 95 percent CI for range 0.45-2.66), brain cancer (SMR=I.80, 14 observed, 95 percent CI for range 0.98-3.03), and other lymphatic cancers (SMR=1.86, 9 observed, 95 percent CI for range 0.85-3.53). A statistically significant increase in fatalities from lung cancer (SMR=1.36, 89 observed; 95 percent CI for range 1.09-1.67) was observed compared with the U.S. lung cancer rates, but not with Tennessee lung cancer rates (SMR= 1.18, 95 percent CI for range 0.95-1.45). Dose-response analyses for lung cancer and internal
* alpha radiation dose and external gamma radiation dose did not reveal a positive relationship for a 0-year or 10-year lag. Examination of lung cancer rates distributed across both internal and external dose categories suggested a dose-response with external radiation dose among individuals who had 5 rem or more of internal dose. Brain cancer was not related to the level of internal or external radiation dose.
The Y-12 cohort studied by Checkoway was updated through the end of 1990 by Loomis and Wolf and included African-American and white female workers (AJIM 1996a:131-141). The dose-response analyses were not included in the update; therefore, only SMR analyses are reported here. For all workers examined as a group, non-statistically significant elevations were observed for cancer of the pancreas
E-54
(SMR=l.36, 34 observed, 95 percent CI for range 0.94-1.90), skin cancer (SMR=1.07, 11 observed, 95 percent CI for range 0.59-1.92), breast cancer (females only, SMR=1.21, 11 observed, 95 percent CI for range 0.60-2.17), prostate cancer (SMR=I.31, 36 observed, 95 percent CI for range 0.91-1.81), kidney cancer (SMR=l.30, 16 observed, 95 percent CI for range 0.74-2.11), brain cancer (SMR=l.29, 20 observed, 95 percent CI for range 0.79-2.00), cancers of other lymphatic tissues (SMR=1.32, 22 observed, 95 percent CI for range 0.82-1.99), and diseases of the blood-forming organs (SMR=l.23, 6 observed, 95 percent CI for range 0.45-2.68). The SMR for lung cancer was statistically significant (SMR=1.17, 202 observed; 95 percent CI for range 1.01-1.34), particularly in the white male segment of the population (SMR=1.20, 194 observed 95 percent CI for range 1.04-1.38). Examination of the lung cancer mortality by year of hire, latency, duration of employment, and calendar year at risk indicated the excess was confined to those who were first hired before 1954 (SMR=1.27, 161 observed, confidence factor not provided), and was greatest in persons employed 5 to 20 years with 10 to 30 years of followup. Elevated lung cancer fatalities were first evident between 1955 and 1964 and continued to increase from 1975 to 1979, followed by a decrease in lung cancer fatality rates.
Between 1953 and 1963 the Y-12 Plant used mercury in a process to produce large quantities of enriched lithium. Cragle et al. studied all workers employed at Y-12 at least 5 months between January 1, 1953, and April 30, 1958 (N=5663) (JOM 1984a:817-821). This group was categorized into workers exposed to mercury and workers not exposed to mercury based on results of urinalysis data supplied by the plant. Vital status followup was complete through the end of 1978, and SMRs were calculated. Compared with non-exposed workers, there were no differences in the mortality patterns for (1) mercury exposed workers as a whole, (2) workers with the highest mercury exposures, and (3) workers employed more than a year in a mercury process. The authors of this study acknowledge that mortality is not the optimal endpoint to assess health effects related to mercury exposure.
The mercury workers were involved in a clinical study by Albers et al. who examined 502 Y-12 workers, 247 of whom worked in the mercury

Human Health
process 20 to 35 years prior to the examination (AN 1988a:651-659). Correlations between declining neurological function and increasing exposure were identified. An exposure assessment was determined for each mercury worker during the time of employment in the mercury process. Study subjects who had at least one urinalysis equal to or greater than 0.6 mg/i of mercury showed decreased strength, coordination, and sensation along with increased tremor, and prevalence of Babinski and snout reflexes when compared with the 255 unexposed workers. Clinical polyneuropathy was associated with the level of the highest exposure, but not with the duration of exposure.
K-25 Site. The K-25 Site enriched uranium beginning in 1945 using a gaseous diffusion process. There was potential exposure to uranium dust, oxidized uranium compounds, uranium hexafluoride, and a number of chemical compounds used in the process. In later years of operation, the gas centrifuge process was used to enrich uranium. No analyses of fatality rates for this population have been published; however, health effects have been studied.
Powdered nickel was used at K-25 in the production of the barrier material used to separate and enrich uranium. Workers who fabricated the barrier material were exposed to nickel powder through inhalation. Cragle et al. (IARC 1984a:57-63 updated an earlier study by Godbold et al. (JOM 1979a:799-806) of 814 workers who were employed in the manufacture of barrier material between 1948 and 1953. A comparison group of white males employed at K-25 sometime between 1948 and 1953 (N=7552) was also selected. The SMRs in the barrier group were similar to those in the non-barrier worker group for most noncancer outcomes. The nickel workers were noted to have a higher rate of fatality from cancers of the buccal cavity and pharynx (SMR=2.92, 3 observed, 95 percent CI for range 0.59-8.54) than the non-nickel workers (SMR=0.23, 3 observed, 95 percent CI for range 0.05-0.67). When the directly standardized rates were compared, the rate of buccal cavity and pharynx cancer in the nickel workers was approximately 19 times higher than the rate in the non-nickel workers. The authors of this study acknowledged that the number of cases is quite small and recommended additional followup to determine if this trend continued. There were no nasal sinus cancers observed in the worker population exposed
to metallic nickel, in contrast to the results of studies of workers in nickel refineries, where the rates of sinus cancer related to nickel compounds are quite high.
K-25 workers employed in the gas centrifuge process were the focus of an interview study by Cragle et al. (AOEH 1992a:826-834). The study was conducted in order to determine the incidence rate for cancer and illness symptoms among workers exposed to epoxy resin and solvents prevalent in the process. A total of 263 workers determined to have worked longest and closest to the process were compared with 271 employees employed at the plant during the same time, but who did not work in the centrifuge process. The centrifuge workers and the non-centrifuge workers had similar overall cancer incidence rates. However, the centrifuge workers reported five incident bladder cancers versus none reported by the non-centrifuge group. The centrifuge workers also reported significantly more rashes, dizziness, and numb or tingling limbs during employment, which are symptoms associated with high solvent exposure. One of the epoxy resins used in the early years of the process was a potential bladder carcinogen, but none of the workers with bladder cancer had jobs that required routine, handson work with that material. A specific causative agent for the increase in bladder cancer was not identified.
Combined Oak Ridge Reservation Facilities. Frome et al. reported on the mortality experience of World War II workers employed at three ORR facilities between 1943 and 1947 (RR 1990a:138152). Poisson regression analyses were used to control for potential confounders such as facility of employment, socioeconomic status, period of followup, and birth year. The cohort included white males employed at any Oak Ridge facility at least 30 days between the start of the operation and 1947 and were never employed at an Oak Ridge facility after 1947 (N=28,008). Elevated mortality was statistically significant for all causes (SMR=1.11, 11,671 observed, 10,537 expected), tuberculosis (SMR=1.37, 108 observed, 78 expected), mental, psychoneurotic, and personality disorders (SMR=1.60, 81 observed, 50 expected), cerebrovascular disease (SMR=1.11, 833 observed, 753 expected), diseases of the respiratory system (SMR=1.25, 792 observed, 634 expected), emphysema (SMR=1.24, 209 observed, 168
E-55

Disposition of Surplus Highly Enriched Uranium Final EIS
expected), all accidents (SMR=1.28, 694 observed, 542 expected), and motor vehicle accidents (SMR=1.44, 339 observed, 235 expected). The only elevated site-specific cancer that was statistically significant was lung cancer (SMR=1.27, 850 observed, 667 expected). A surrogate for radiation exposure based on a worker's job and department was used to indicate the probability of exposure. This surrogate for actual radiation exposure was not associated with increased rates of cancer.
Carpenter investigated earlier reports of an association between brain cancer and employment at Y-12 by conducting a case-control study of workers employed between 1943 and 1977 at ORNL or Y-12 (JOM 1987a:601-604). Cases consisted of 72 white males and 17 white females with brain cancer. Four controls were selected for each case matched on age, sex, cohort, year of birth, and year of hire. Analyses with respect to internal and external radiation exposures indicated no association with brain cancer. Two companion papers were also published from this case-control study, one examined relationships between brain cancer and chemical exposures (AJIM 1988a:351-362), and the other examined nonoccupational risk factors (AJPH 1987a:11801182). No statistically significant association between the use of 26 chemicals evaluated and the risk of brain cancer was observed. The chemicals evaluated included those encountered in welding fumes, beryllium, mercury, 4,4-methylene bis 2chloroaniline or MOCA, cutting oils, thorium, methylene chloride, and other solvents. Excess brain cancer was observed, however, among individuals employed for more than 20 years (odds ratio=7.0, 9 cases; 95 percent CI 1.2-41.1). Analysis of 82 cases with complete medical records revealed an association with a previous diagnosis of epilepsy (odds ratio=5.7, 4 cases; 95 percent CI 1.0-32.1) recorded for pre-employment and health status followup.
Causes of fatality among white male welders (N=1,059) employed between 1943 and 1973 at the Y-12 Plant, the K-25 Site, and ORNL were studied by Polednak (AEH 1981a:235-242). Based on fatalities reported through 1974, mortality from all causes for welders was slightly lower than that expected based on fatality rates for U.S. white males (SMR=0.87, 173 observed, 199 expected, 95 percent confidence for range 0.75-1.01). Non-statistically
significant decreases in mortality were also observed for all cancers (SMR=0.88, 32 observed, 36.57 expected, 95 percent confidence for range 0.60-1.23), especially digestive cancer (SMR=0.49, 5 observed, 10.3 expected, 95 percent confidence for range 0.161.14); diseases of the circulatory system (SMR=0.74, 72 observed, 97.51 expected, 95 percent confidence for range 0.58-0.94); diseases of the digestive system (SMR=0.76, 9 observed, 11.86 expected, 95 percent confidence for range 0.35-1.44); and accidents (SMR=0.89, 16 observed, 17.86 expected, 95 percent confidence for range 0.51-1.44). Non-statistically significant increases were noted for lung cancer (SMR=1.50, 17 observed, 11.37 expected, 95 percent confidence for range 0.87-2.40); diseases of the respiratory system (SMR=1.33, 13 observed, 9.77 expected, 95 percent confidence for range 0.71-2.27), especially emphysema (SMR=2.21, 6 observed, 2.71 expected, 95 percent confidence for range 0.81-4.82); and suicide (SMR=1.64, 10 observed, 6.09 expected, 95 percent confidence for range 0.79-3.02). A subgroup of welders (N=536) exposed to nickel oxides (possible respiratory carcinogens) at K-25 were compared with welders at the other two facilities (N=523). The risk of lung cancer and other respiratory diseases did not differ between the two groups.
Combined Nuclear Sites. Workers at ORR have been included in several studies that have examined occupational risks across the nuclear complex, both in the United States and internationally. These combined studies have been undertaken in an attempt to increase the statistical power of the studies to detect the effects of low-level chronic radiation exposure.
Y-12 workers were included in a lung cancer casecontrol study of workers from the Fernald Feed Materials and Production Center cohort and the Mallinckrodt Chemical Works cohort. Dupree et al. conducted a nested case-control study of lung cancer (N=787) to investigate the relationship between lung cancer and uranium dust exposure (Epidemiology 1995a:370-375). Eligible cases were employed at least 183 days in any of the facilities and died before January 1, 1983, with lung cancer listed anywhere on the death certificate. Inclusion of fatalities through 1982 allowed over 30 years of observation at each facility. One control was matched to each case on facility, race, gender, and birth and
E--56

Human Health
hire dates within 3 years. Data collected on all study members included smoking history, first pay code (a surrogate for socioeconomic status), complete work histories, and occupational radiation monitoring records. Annual radiation lung dose from deposited uranium was estimated for each study member. Annual external whole body doses from gamma radiation were determined for workers who had personal monitoring data available. Potential confounders considered in the analysis were smoking (ever/never used tobacco) and pay code (monthly/ non-monthly). With a 10-year lag, cumulative lung doses ranged from 1 to 137 rad for cases and from 0 to 80 rad for controls. The odds ratios for lung cancer mortality for seven cumulative internal dose groups did not demonstrate increasing risk with increasing dose. An odds ratio of 2.0 was estimated for those exposed to 25 rad or more, but the 95 percent confidence interval of -.20 to 20 showed great uncertainty in the estimate. There was a suggestion of an exposure effect for workers hired at age 45 years or older.
A combined site mortality study included workers from ORNL, the Hanford Site, and the Rocky Flats Plant (RR 1993a:408-421). Earlier analyses of these cohorts indicated that risk estimates calculated through extrapolation from high-dose data to low-dose data did not seriously underestimate risks of exposure to low-dose radiation (AJE 1990a:917927; RR 1989a:19-35). The updated analyses were performed in order to determine whether the extrapolated risks represented an overestimation of the true risk at low doses. The study population consisted of white males employed at one of the three facilities for at least 6 months and monitored for external radiation. The Hanford population also included females and nonwhite workers. The total population dose was 123,700 person-rem. Analyses included trend tests for site-specific cancer fatalities
'and several broad noncancer categories. Statistically i significant trends were noted for cancer of the esophagus, cancer of the larynx, and Hodgkin's disease. These cancers were not related to radiation exposure levels in previously published studies. Excess relative risk models were calculated for the combined DOE populations and for each DOE site separately. Without exception, all risk estimates included the possibility of zero risk (that is, the confidence interval for the risk coefficient went from below zero to above zero). There was evidence of an
increase in the excess relative risk for cancer with increasing age in the Hanford and ORNL, populations; both populations showed significaht correlations of all cancer with radiation dose among those 75 years and older.
An international effort to pool data from populations, exposed to external radiation included the ORNL population, in addition to other radiation worker populations in the United States, Canada, and Britain (RR 1995a:117-132). The cohort comprised 95,673 workers (85.4 percent men) employed 6 months or longer, and the population dose was 384,320 personrem. There was no evidence of an association between radiation dose and mortality from all causes or from all cancers. There was a significant doseresponse relationship with leukemia, excluding chronic lymphocytic leukemia (excess relative risk=2.18 per SV; 90 percent CI for range 0.1-5.7) and multiple myeloma (excess relative risk not computed; 44 observed). The study results do not suggest that current radiation risk estimates for cancer at low levels of exposure are appreciably in error.
E.4.2A Memorandum of Understanding
The Department of Energy entered into a Memorandum of Understanding with the Department of Health and Human Services to conduct health studies at DOE sites. The NIOSH is responsible for the conduct and management of worker studies.
The following studies at ORR are managed by NIOSH with funding from DOE: a study of multiple myeloma among workers at the K-25 Site at Oak Ridge (expected completion date 1996); a multisite study to assess the potential association between paternal exposure to ionizing radiation and the risk of leukemia in offspring of exposed male workers; a study of neurologic health outcomes in workers exposed to high levels of mercury between 1953 and 1963; studies of mortality among Oak Ridge workers; a multisite study of mortality among female nuclear workers; i multisite exposure assessment of hazardous waste/cleanup workers; a chronic beryllium disease study; and a multisite study of heat stress and performance among carpenters.
E-57

Disposition of Surplus Highly Enriched Uranium Final EIS
E.4.3 SAVANNAH RIVER SITE, AIXEN, SC
The SRS, established in 1953 in Aiken, South Carolina, produces plutonium, tritium, and other nuclear materials. There are reports that millions of curies of tritium. have been released over the years both in plant exhaust plumes and in surface and groundwater streams (ED 1982a:135-152).
E.4.3.1 Surrounding Communities
In 1984, Sauer and Associates examined mortality. rates in Georgia and South Carolina by distance from the Savannah River Plant (now known as the Savannah River Site) (SR duPont 1984a). Mortality rates for areas near the plant were compared with U.S. rates and with rates for counties located more than 50 miles away. Breast cancer, respiratory cancer, leukemia, thyroid cancer, bone cancer, malignant melanoma of the skin, non-respiratory cancer, congenital anomalies or birth defects, early infancy fatality rates, stroke, or cardiovascular disease in the populations living within 50 miles of the plant did not show any excess risk compared with the reference populations.
E.4.3.2 State Health Agreement Program
Under the State Health Agreement program managed by the DOE Office of Epidemiologic Studies, a grant was awarded to the Medical University of South Carolina in 1991 to develop the Savannah River Region Health Information System. The purpose of the Savannah River Region Health Information System database was to assess the health of populations surrounding SRS by tracking cancer rates and birth defects rates in the area. Information from the registry is available to public and private health care providers for use in evaluating cancer control efforts. A steering committee provides advice to the Savannah River Region Health Information System and communicates public concerns to Savannah River Region Health Information System. It consists of 12 community members and persons with technical expertise representing South Carolina and Georgia.
E.4.3.3 Workers:
A descriptive mortality study was conducted that included 9,860 white male workers who had been
employed at lease 90 days at SRS between 1952 and the end of 1974 (AJIM 1988b:379-401). Vital status was followed through the end of 1980, and mortality was compared with the U.S. population. SMRs were computed separately for hourly and salaried employees. For hourly employees, non-statistically significant increases were seen for cancer of the rectum (SMR=1.09, 5 observed, 95 percent CI for range 0.35-2.54), cancer of the pancreas (SMR=1.08, 10 observed, 95 percent CI for range 0.59-2.13), leukemia and aleukemia (SMR=1.63, 13 observed, 95 percent CI for range 0.87-2.80), other lymphatic tissue (SMR=1.06, 5 observed, 95 percent CI for range 0.34-2A8), benign neoplasms (SMR=1.33, 4 observed, 95 percent CI for range 0.36-3.40), and motor vehicle accidents (SMR=1.10, 63 observed, 95 percent CI for range 0.84-1.40). Salaried employees exhibited non-statistically significant increases in cancer of the liver (SMR=1.84, 3 observed, 95 percent CI for range 0.38-5.38), cancer of the prostate (SMR=1.35, 5 observed, 95 percent CI for range 0.44-3.16), cancer of the bladder (SMR=1.87, 4 observed, 95 percent CI for range 0.51-4.79), brain cancer (SMR=1.06, 4 observed, 95 percent CI for range 0.29-2.72), leukemia and aleukemia (SMR=1.05, 4 observed, 95 percent CI for range 0.29-2.69), and other lymphatic tissue (SMR=1.23, 3 observed, 95 percent CI for range 0.26-3.61). No trends between increasing duration of employment and SMRs were observed. A statistically significant excess of leukemia fatalities was observed for hourly workers employed between 5 and 15 years (SMR=2.75, 6 observed, 95 percent CI for range 1.01-5.99). Review of the plant records and job duties of the workers who died from leukemia indicated that two of the cases had potential routine exposure to solvents, four had potential occasional exposure to solvents and one had potential for minimal exposure. Benzene, a known carcinogen, was reportedly not used at the plant.
The Department of Energy's Office of Epidemiologic Studies has implemented an Epidemiologic Surveillance Program at SRS to monitor the health of current workers. This program will evaluate the occurrence of illness and injury in the workforce on a continuing basis, and the results will be issued in annual reports. The implementation of this program will facilitate an ongoing assessment of the health and safety of SRS's workforce and will help identify emerging health issues.
E-58

Human Health
Currently operational at a number of DOE sites,. including production sites and research and ddvelopment facilities, epidemiologic surveillance uses routinely collected health data, including descriptions of illness resulting in absences lasting 5 or more consecutive workdays, disabilities, and OSHA recordable injuries and illnesses abstracted from the OSHA 200 log. These health event data, coupled with demographic data abouit the active workforce at the participating sites, are analyzed to evaluate whether particular occupational groups are at increased risk of disease or injury when compared with other workers at a site. As the program continues and data for an extended period of time become available, time trend analysis will become an increasingly important part of the evaluation of worker health. Monitoring the health of the workforce provides a baseline determination of the illness and injury experience of workers and a tool for monitoring the effects of changes made to improve the safety and health of workers. Noteworthy changes in the health of the workforce may indicate the need for more detailed study or increased health and safety measures to ensure adequate protection for workers.
E.4.3.4 Memorandum of Understanding
The Department of Energy entered into a Memorandum of Understanding with Health and Human Services to conduct health studies at DOE sites. The -Centers for Disease Control and Prevention's NCEH is responsible for dose reconstruction studies, and NIOSH is responsible for worker studies. These activities are funded by DOE.
A study of mortality among SRS workers employed from 1952 to 1974 that examined whether risks of fatalities due to selected causes may be related to occupational exposures at SRS is being conducted by NIOSH. SRS is also included in several multisite studies managed by NIOSH. The first study is to assess the potential association between paternal work-related exposure to ionizing radiation and the risk of leukemia in offspring of exposed male workers. The second study is to examine causes of fatality among female workers at nuclear weapons facilities to develop risk estimates based on exposures to external and internal ionizing radiation and to hazardous chemicals. A third multisite project
is a case-control study of multiple myeloma, a type of blood cell cancer.
A dose reconstruction project around the SRS is being conducted by NCEH to determine the type and amount of contaminants to which people living around the site may have been exposed, to identify exposure pathways of concern, and to quantify the doses people may have received as a result of SRS operations. The estimated completion date is 1999 or 2000.
E.4.4
E.4.4.1
BABCOCK & WILCOX SITE, LYNCHBuRG, VA
Surrounding Communities and Workers
Several potential sources of information were searched for epidemiologic or health studies of persons living near or working at the B&W site. No information was found in the medical literature or other accessible databases (for example, Toxline). The Campbell County Health Department has no information regarding studies conducted at the local level. The Virginia State Health Department Office of Health Hazards Control and the Virginia State Department of Environmental Quality had no information on any studies conducted by the State of Virginia.
E.4.5
E.4.5.1
NUCLEAR FUEL SERVICES SITE, ERWIN, TN
Surrounding Communities and Workers
Several potential sources of information were searched for epidemiologic or health studies of persons living near or working in the NFS site. No information was found in the medical literature. One report was found in Toxline. A study was conducted of kidney disease among plant workers, with guards, and local dairy farmers used as comparison groups (NIOSH 1988a:1). Workers had a higher prevalence of kidney stones than the guards, but a lower prevalence than the dairy workers. NFS employees had a higher prevalence of urinary tract infections than both the guards and dairy farmers. Kidney function was similar in all groups. The authors concluded that the urinary tract disorders in the NFS
E-59
Disposition of Surpluss Highly Enriched Uranium Final EIS
workers were not the result of occupational hazards. In 1979, the Centers for Disease Control investigated newspaper reports of increased rates of cancer fatalities in Unicoi County. The investigators compared the rates with four surrounding counties and also conducted occupational and environmental surveys. The investigators found that increasing cancer rates over time were due to'aging of the population, that age-adjusted rates had not changed
significantly, and that there did not appear to be any observable risks from exposures or emissions from the NFS site.
The Unicoi County Health Department and the Tennessee State Health Department Epidemiology Program Office were not aware of any studies condficted by local or State personnel.
E-60

Human Health
E.5
E.5.1
FACILITY ACCIDENTS
EVALUATION METHODOLOGIES AND ASSUMPTIONS
The potential for facility accidents and the magnitudes of their consequences are important factors in the evaluation of the alternatives being addressed in this EIS. The health risk issues are twofold and consider the following:
"* Whether accidents at any of the blending sites pose unacceptable health risks to workers or the general public.
" Whether alternative locations for facilities can provide lesser public or worker health risks. These lesser risks may arise from differences in meteorology that reduce environmental concentrations, from a greater isolation of the site from the public, or from a reduced frequency of such external accident initiators as seismic events and aircraft crashes.
E.5.1.1 Analysis Methodology
The MELCOR Accident Consequence Code System (MACCS) (NUREG/CR-6059, SAND92-2146, October 1993)was used to estimate the consequences of accidents involving the release of radioactivity. (The GENII code was also exercised for one case to investigate the effect of using different meteorological data at one site. A discussion of the GENII code is provided in Section E.2.2.1.)
The enhanced Chemical Hazard Evaluation Methodologies computer code was used to estimate the consequences of accidents involving the release of hazardous chemicals. The program was developed to provide several integrated estimation methods to assess toxic vapor dispersion, fire, and explosion impacts associated with episodic discharges of hazardous materials into the environment. The modules of Chemical Hazard Evaluation Methodologies used in this analysis were estimation of the discharge rate and duration of a gas or liquid released from a tank or pipeline, the size of liquid pools that form on the ground, and the size of the downwind area impacted by the release of a toxic gas
or vapor into the air. The vapor dispersion model is the straight line Gaussian type, which is similar to that used in GENII.
E.5.1.2 MELCOR Accident Consequence Code System Overview
MACCS models the onsite and offsite consequences of an accident that releases a plume of radioactive materials to the atmosphere. Should such an accidental release occur, the radioactive gases and aerosols in the plume would be transported by the prevailing wind while dispersing in the atmosphere. The environment would be contaminated by radioactive materials deposited from the plume, and the population would be exposed to radiation. The objectives of a MACCS calculation are to estimate the range and probability of the health effects induced by the radiation exposures not avoided by protective actions, and to estimate the economic costs and losses that would result from the contamination of the environment.
In order to understand MACCS, one must understand its essential elements: the division of the time scale after the accident into various "phases," and the division of the region surrounding the nuclear facility into a polar-coordinate grid.
The time scale after the accident is divided into three phases: emergency phase, intermediate phase, and long-term phase. The emergency phase begins immediately after the accident and could last up to 7 days following the accident. In this period, the exposure of a population to both radioactive clouds and contaminated ground is modeled. Various protective measures can be specified for this phase, including evacuation, sheltering, and dose-dependent relocation.
The intermediate phase can be used to represent a period in which evaluations are performed and decisions are made regarding the types of protective measure actions which need to be taken. In this period, the radioactive clouds are assumed to be gone, and the only exposure pathways are those from the contaminated ground. The protective measure that can be taken during this period is temporary relocation.
E-61

Disposition of Surplus Highly Enriched Uranium Final EIS
The long-term phase represents all time subsequent to the intermediate phase. The only exposure pathways considered here are those resulting from the contaminated ground. A variety of protective measures can be taken in the long-term phase to reduce doses to acceptable levels: decontamination, interdiction, and condemnation of property.
The spatial grid used to represent the region is centered on the facility itself. The user specifies the number of radial divisions as well as their endpoint distances. Up to 35 of these divisions may be defined, extending out to a maximum distance of 9,999 km (6,213 mi). The angular divisions used to define the spatial grid correspond to the 16 directions of the compass.
Since the emergency phase calculations utilize highly nonlinear dose-response models, due to higher doses for early fatality and early injury, those calculations must be performed on a finer grid than the calculations of the intermediate and long-term phases. For this reason, the 16 compass sectors are divided into 3, 5, or 7 user-specified subdivisions in the calculations of the emergency phase.
The increased likelihood of cancer fatality to a member of the public is taken as 5x10"4 times the dose in rem for values of dose less than 20 rem or when the rate of exposure is less than 10 rad/hr. For doses greater than 20 rem or dose rates greater than 10 rad/hr, the cancer fatalities are doubled. The MACCS code was applied in a probabilistic manner using a weather bin sampling technique. The weather bins consist of hourly data for the windspeed, wind direction, and stability class. Centerline doses as a function of distance were calculated for each of approximately 100 meteorological sequence samples; the mean value of these doses and increased likelihoods of cancer fatality for the distance corresponding to the location of the MEI at each site were reported for that individual. Mean values were selected instead of median values because they yielded higher dose values for each candidate site.
Offsite population doses, noninvolved worker population doses, and latent cancer fatalities are calculated by MACCS using a methodology similar to that described for the individuals. In the case of a population, each of the sampled meteorological sequences was applied to the population distribution
across 16 sectors. The weather bin sampling technique accounted for the frequency of occurrence of the wind blowing in each direction. Population doses are the sum of the individual doses in each sector. Once again, the mean value of the calculated population doses and latent cancer fatalities for each of the trials were reported. Mean values were selected instead of median values because they yielded higher dose values for each candidate site. Doses to noninvolved workers were calculated similarly, except that these workers will experience cancer fatalities of 4x1O04 times the dose in rem for doses less than 20 rem or exposure rates less than 10 rad/hr. For larger doses, above 20 rem and when the dose rate of exposure is greater than 10 rad/hr, the cancer fatalities are doubled.
A detailed description of the MACCS model is available in a three-volume report (NUREG/ CR-6059, SAND92-2146).
E.5.1.3 Application of Models
For the analysis of accidents involving the release of radioactivity at the four facilities of interest (ORR Y-12, SRS H-Canyon, B&W, and NFS), the MACCS calculations used the source term data presented in Section E.5.2. Elevated releases were assumed to be from existing stacks at B&W (11 m [36 ft]) and NFS (33 m [108 ft]); SRS and ORR stack releases were calculated at 10 m (33 ft). For each of the latter three sites, sequences from 1 year of hourly onsite meteorological data were sampled; for B&W, the closest available complete (24 hour) data set was that from Woodrum Airport in Roanoke, Virginia, 93 km (61 mi) west of B&W and Richmond International Airport, 144 km (90 mi) east of B&W.
Since the only B&W onsite digital data consisted of a (windspeed-wind direction-stability class) joint frequency distribution file, which is suitable input to the GENII code (but not to MACCS), data from the Roanoke airport and the Richmond International Airport were obtained and reduced to joint frequency distribution files. Each of these distributions was used as input to the GENII code with all other B&W site data (for example, population) being equivalent. The evaluation basis earthquake for the uranium hexafluoride (UF6) process was the scenario chosen for comparing GENII and MACCS results since it gave the maximum dose to workers and the public.
E-62

Human Health
The dose to the MEI from the GENII code is 0.034, 0.072, and 0.080 rem and to the general population within 80 km (50 mi) is 17, 46, and 28 person-rem using meteorological data from the B&W site, Roanoke, and Richmond, respectively. From this it is concluded that use of the Roanoke airport data in the MACCS code may result in a factor of 2 to 3 higher doses than if onsite B&W data were used.
The dose to the MEI and to the general population within 80 km (50 mi) was calculated with the GENII code using meteorological data from both B&W and Roanoke airport for all six accidents (a filter fire, an earthquake induced criticality, an evaluation basis earthquake for the uranyl nitrate hexahydrate (UNH) process, a fluid bed, an evaluation basis earthquake for the UF6 process, and a UF6 cylinder release). The dose for all six accidents to the MEI and the general population was an average 2.1 and 2.7 times larger, respectively, using the Roanoke airport meteorological data. This is consistent with the previous analysis reported in the B&W EA, which notes:
The onsite information is extremely valuable due to the unique nature of the site. The site has an unusual microclimate that would not mirror that of Lynchburg in terms of wind speeds, directions, or stabilities. The presence of a river on three sides of the site imposes unusual temperature conditions and reduces the stability of the air mass. The river will be cooler than the peninsula during the spring and the summer and warmer during the fall and winter. Diurnal variations of the river are minimal while the land surface will normally experience a 21-degree Fahrenheit diurnal variation. On clear cloudless nights, the valley bottoms in the area are often 10 to 15 degrees cooler than higher elevations. This can cause periods of both high stability and unstable conditions depending on cloud cover and wind speed during the following day. The deep river valley will also tend to divert the winds near surface level from the prevailing wind direction and cause additional instability. However, the river valley will tend to limit the directionality of the wind as compared to conditions observed at Lynchburg (BW NRC 1991a:38).
Radiation doses to the affected individuals and populations were calculated in the dosimetry models using the concentrations of radionuclides obtained from the dispersion models. Dose conversion factors were used to convert the radionuclide concentrations to organ dose equivalents and whole-body effective dose equivalents. Exposure pathways considered in the MACCS calculations for the period following an accident were direct radiation from the passing plume and from radioactive material deposited on the ground, inhalation from the plume, deposition on skin and inhalation of resuspended ground contamination. Ingestion of produce and animal products raised within 80 Ikn (50 mi) of the release is
not considered; this pathway would be easily interdicted in the case of an accident by bringing food in from outside this area. Liquid exposure pathways were not considered because interdiction is assumed. No credit was taken for short-term reactions such as evacuation and relocation. However, it was assumed that noninvolved workers would be shielded from the inhalation of radioactive materials for approximately half the time that the radioactive plume would be present at the site.
Three types of receptors were considered for quantitative evaluation of impacts: the offsite population, the MEI of the general public, and the noninvolved (collocated) worker. The offsite population consists of individuals residing within 80 km (50 mi) of a site. The ElI at NFS was taken as the nearest residence, located 250 m (820 ft) south of the plant and, in essence, across the street from the site fence (NF NRC 1991la:4-33). The MEl at B&W was assumed to be along the site boundary, 540 m (1,772 ft) west-southwest of the plant (BW NRC 1991a:73). For the SRS and ORR sites, the site boundary in the direction of minimum atmospheric plume attenuation was chosen; these values were found (from perusal of GENII runs) as 11,750 m
(38,550 ft) north-northwest and 619 m (2,031 ft) north-northwest, respectively.
I
Noninvolved worker populations, used in the radiation dose calculations, were based on total site worker populations less those involved in the blending process. Workers within the processing area are all of NFS and B&W, H-Area at SRS, and Y-12 at ORR. Workers in the processing areas were spatially distributed based on local building locations. Workers at facilities distant from the
E-63

Disposition of Surplus Highly Enriched Uranium Final EIS
process area (for example, M-Area at SRS, ORNL at ORR) were considered to be concentrated within one sector. The total worker populations used in the MACCS calculation were approximately 325 at NFS, 2,200 at B&W (including the Naval Nuclear Fuel Division (NNFD) Research Laboratory and the Commercial Fuel Facility), 17,000 at ORR (including 6,400 at Y-12), and 12,000 at SRS (including 3,800 in H-Area).
Data on the surrounding population by sector atY-12 and SRS are listed in Health Risk Data for Storage and Disposition of Weapons-Usable Fissile Materials Programmatic Environmental Impact Statement technical report (February 1996). Data on the surrounding population at NFS were obtained from Table 3.4 of the NRC Environmental Assessment for Renewal of Special Nuclear Material License No. SNM-124 prepared for NFS (Docket No. 10-143, August 1991). Data on the surrounding population at B&W were obtained from Table 3.7 of the NRC Environmental Assessment for Renewal of Special Nuclear Material License No. SNM-42 prepared for B&W (Docket No. 70-27, August 1991). Data on meteorology and stack heights at each site are given in Appendix C.
For SRS, the accident analysis was performed for the H-Area. If blending were to occur in the F-Area, the doses from an accidental release would be similar to an accidental release in H-Area. The dose to the MEIl would be slightly larger due to the decreased distance of 9,646 m (31,649 ft) from F-Area to the site boundary. The dose to the offsite population within 80 km (50 mi) would be slightly smaller due to F-Area being further from the offsite population than H-Area. The dose to the noninvolved workers would be smaller due to the smaller workforce in the F-Area. The dose to noninvolved workers in the processing area is the dominant portion of the dose to the total site noninvolved workers. The dose to noninvolved workers not in the processing area would be a minimal effect due to the distance to the other areas.
The noninvolved (collocated) worker was considered for the chemical accident impact analysis. All of the workers at NFS are in the immediate vicinity of the blending process; because of the short distance to the site boundary and for the purpose of comparison with the other sites, the distance and direction to the MEI
was also used for the noninvolved worker. For the B&W site, the noninvolved worker is 230 m (755 ft) northeast of the facility being analyzed (at the experimental facility). For both SRS and ORR, the noninvolved worker was located 644 m (2,113 ft) from the facility. The direction of minimum atmospheric plume attenuation (southeast and north-northeast, respectively) was chosen.
Estimates of release durations from the chemical tanks involved in the accidents described in Section E.5.2 were performed using CHEMS-PLUS. It was found that assuming a release of the entire contents of any of the chemical tanks over 1 hour was reasonable. Atmospheric chemical concentrations experienced by the MEIs and noninvolved workers described above were calculated and compared with health-based criteria, Immediately Dangerous to Life or Health (IDLH) concentrations, TLV for 15-min Short Term Exposure Limits (STEL) and 8-hour Time Weighted Average (TWA) concentrations. The latter two limits are included to indicate exposure to levels which are occupationally acceptable for shortand long-term exposure, respectively.
The meteorological conditions used to estimate chemical impacts were approximations of mean conditions. The average site windspeeds given in Chapter 3 of this EIS were used together with the median stability class for each site (as obtained from the joint frequency distribution described above). The windspeeds for ORR, SRS, B&W, and NFS were 2.0, 2.9, 3.4, and 2.5 m/s (4.4, 6.5, 7.7, and 4.4 ft/s), respectively, and the stability classes were D, C, D, and A, respectively.
E.5.2 BOUNDING ACCEDENTS
The postulated accidents for each conversion/ blending process were analyzed at each of the candidate sites (a subset of Y-12, SRS, NFS, and B&W). It was assumed that the inventory of hazardous/radioactive materials, the process, and the facilities were the same at all four facilities. The differentiating parameters of the analyses were distances to the site boundary (or nearest resident), surrounding population, distribution of collocated workers, meteorology, and stack height.
A set of potential accidents was postulated for which there may be releases of radioactivity and hazardous
E-64

Human Health
chemicals that could impact noninvolved onsite workers and the offsite population. A set of accident scenarios was selected to represent bounding cases. In assessing the bounding accident scenarios for the Conversion and Blending Facility, the following parameters were evaluated: (1) material at risk; (2) energy sources (fires, explosions, earthquakes, and process design-related events); (3) barriers to release; and (4) protective features of the facility. It is expected that each of these parameters would be unchanged for the range of LEU enrichment considered, except in the case of the evaluation basis earthquake accident scenario.
The bounding chemical release accidents could include a spill from nitric acid and sodium hydroxide storage tanks, and the rupture of processing lines resulting in the emptying of a hydrogen fluoride tank and a fluorine cylinder, depending on the alternative process considered. The details of chemical release quantities and resulting impacts are provided under each alternative in Chapter 4.
E.5.2.1 Facility Accidents Postulated for Blending Highly Enriched Uranium to Low-Enriched Uranium as Uranyl Nitrate Hexahydrate
The accident scenarios that were considered included a tornado, straight winds, an aircraft crash, a truck crash, nuclear criticality, process-related accidents, and an evaluation basis earthquake. With the exception of the filter fire (with continuous exhaust flow), all of the accident scenarios that are considered potentially bounding can be initiated by the evaluation basis earthquake. Therefore, it is concluded that the evaluation basis earthquake would result in the highest atmospheric release of radioactivity and hazardous chemicals. The evaluation basis earthquake is assumed to initiate the nuclear criticality and other release scenarios.
In a filter fire accident, it is assumed that a fire occurs that releases all the uranium in the bag filters, traps, and the high-efficiency particulate air filters and releases it to the atmosphere through the stacks in a matter of minutes. The quantity of material assumed to be released is 0.15 kg (0.33 lb) of HEU. The accident annual frequency was estimated to be in the range of 104 to 10"2; 10.3 was chosen for use in comparing alternatives. The source term analyzed
and the resulting doses are shown in Tables E.5.2.1-1 and E.5.2.1-2.
Table E.5.2.1-1.
Nuclide
"- U-232" U-234 U-235 U-236 U-238
Source: OR LMES 1995b.
Source Term for a Filter Fire Accident
Release Activity (curies) 1.3x10 4
4.Oxio-3 1.6xl0"4 2.2x10-. 2.4x10⁻⁵
In an earthquake-induced criticality accident, it is assumed that storage racks containing multiple critical masses of uranium powder and uranyl nitrate solution are damaged directly by seismic shaking and indirectly by falling debris. Safe spacing is lost and moderators are added as water from the fire system or organic solutions. This results in the possible formation of one or more critical assemblies. In an accidental criticality, it is assumed that Wxl0 19
fissions occur before reaching a stable, subcritical condition and that all material releases occur within a 2-hour period. The amount of radioactive material released as fission products created by the nuclear criticality is 46,000 Ci of krypton isotopes, 65,000 Ci of xenon isotopes, and 1,600 Ci of iodine isotopes. The accident annual frequency was estimated to be in the range of 10 to 10' ; 10e was chosen for use in comparing alternatives. The source term analyzed and the resulting doses are shown in Tables E.5.2.1-3 and E.5.2.1--4.
In the evaluation basis earthquake accident scenario, it is assumed that the building collapses, resulting in ruptured containers, piping and tanks releasing uranium solutions, water, toxic gases, flammable gases, and toxic and reactive liquids. This is assumed to result in the release of 0.076 Ci of uranium isotopef for processing to 4-percent UNH' (67 percent of the activity is U-234); and the release of 0.19 Ci of uranium isotopes for processing to 0.9-percent UNH (54 percent of the activity is U-234). The accident annual frequency was estimated to be in the range of I0-5 to 10-3; 10-4 was chosen for use in comparing alternatives. The source terms analyzed and the resulting doses are shown in Tables E.5.2.1-5 through E.5.2.1-8.
E--65

Disposition of Surplus Highly Enriched Uranium Final EIS
Table E.5.2.1-2. Resulting Doses for a Filter Fire I Accident I
I I
I
Receptor Dose Maximally
Noninvolved Exposed Population Workers Individual Within80 km
Site (person-rem) (rem) (person-rem) Y-12 11 1.0x10"2 1.5 SRS 2.3 6.6xi0"5 0.37
B&W 24 1.2x10"2 0.9 NFS 1.6 2.3x10"3 1.3
Source: Results shown are derived from MACCS runs.
Table E.5.2.1-3. Source Term for a Criticality Accident
Nuclide Kr-83m Kr-85m Kr-85 Kr-87 Kr-88 Kr-89
Xe-131m Xe-133m Xe-133
Xe-135m Xe-135 Xe-137 Xe-138 1-131 1-132 1-133 1-134 1-135
Source: OR LMES 1995b.
I I
I
IReleaseActivity
(curies) 160 150
1,600 990 650
42,000 8.2xio-2 1.8
27 2,200
360 49,000 13,000
2.2 280
40 1,100
130
Table E.5.2.1-5. Source Term for an Evaluation Basis Earthquake Accident (4-percent Uranyl
Nitrate Hexahydrate)
Nuclide U-232 U-234 U-235 U-236
I U-238 I Source: OR LMES 1995d.
Release Activity (curies) 1.7x10" 5.1xi0-2 2.1x10 3
2.5xlo 5.9X10"3
5.9x10³
Table E.5.2.1-6. Resulting Doses for an Evaluation Basis Earthquake Accident
(4-percent Uranyl Nitrate Hexahydrate)
Receptor Dose Maximally
Noninvolved Exposed Population Workers Individual Within 80 km
Site (person-rem) (rem) (person-rem) Y-12 320 , 0.31 44 SRS 70 1.9x10. 3 11
B&W 760 0.36 26 NFS 67 7.8x10 2 38
Source: Results shown are derived from MACCS runs,
Table E.5.2.1-7. Source Term for an Evaluation Basis Earthquake Accident (0.9-percent Uranyl
Nitrate Hexahydrate)
Nuclide U-232 U-234 U-235 U-236 U-238
Source: OR LMES 1995d.
Release Activity (curies) 6.0x10 2
0.1 4.1xI0"
3
4.3xlo-4 2.2xI0-22.2x10
2
I Table E.5.2.1-4. Resulting Dosa Accident
Receptor] Maxima!
Noninvolved Expose Workers Individu
Site (person-rem) (rem) Y-12 38 5.1xi0" SRS 8.5 3.0x10"
B&W 80 5.6x10": NFS 8.7 1.4x10"C
Source: Results shown are derived from
E-66
es for a Criticality
Dose Uy d Population al Within 80 kn
(person-rem) 2 3
0.33 2 1.9 2 2.2
MACCS runs.
tt---�-t-.---- -r, -:'rr -- - -
II
I

Human Health
Table E.5.2.1-8. Resulting Doses for an Evaluation Basis Earthquake Accident
(0.9-percent Uranyl Nitrate Hexahydrate)
Receptor Dose Maximally
Noninvolved Exposed Population Workers Individual Within 80 km
Site (person-rein) (rem) (person-rem) Y-12 960 0.94 130 SRS 210 5w1lc 32
B&W 2,300 1.1 79 NFS 200 0.23 110
Source: Results shown are derived from MACCS runs.
E.5.2.2 Facility Accidents Postulated for Blending Highly Enriched Uranium to Low-Enriched Uranium as Uranium Hexafluoride
The accident scenarios that were considered included a tornado, straight winds, an aircraft crash, a truck crash, nuclear criticality, process-related accidents, and a evaluation basis earthquake. With the exception of the fluidized bed release and the filter fire (with continuous exhaust flow), all of the accidbnt scenarios that are considered potentially bounding can be initiated by the evaluation basis earthquake. Therefore, it is concluded that the evaluation basis earthquake would result in the highest atmospheric release of radioactivity and hazardous chemicals. The evaluation basis earthquake is assumed to initiate the nuclear criticality, UF6, and other release scenarios.
In a fluidized bed release, it is assumed that the high temperature filters are removed for replacement but the filter housing is closed without new filters inside. The inventory of one bed is swept out of the stack by the nitrogen used to fluidize the bed. The quantity of material assumed to be released is 7.5 kg (16.5 lb) of HEU. The accident annual fre.quencr was estimated to be in the range of 10.4 to le"; 10"Twas chosen for use in comparing alternatives. The source term analyzed and the resulting doses are shown in Tables E.5.2.2-1 and E.5.2.2-2.
In a filter fire accident, it is assumed that a fire occurs that releases all the uranium in the bag filters, traps, and the filters, and releases it to the atmosphere in a matter of minutes. The quantity of material assumed
to be released is 0.15 kg (0.33 lb) of HEU. The source term analyzed and the resulting doses are shown in Tables E.5.2.1-1 and E.5.2.1-2.
Table E.5.2.2-1. Source Term for a Fluidized Bed Release
Release Activity Nuclide (curies) U-232 5.5x10 3
U-234 0.16 U-235 6.5x10"3
U-236, 9.1x10 4
U-238 l.0xl0 3
Source: OR LMES 1995a.
In an earthquake-induced criticality accident, it is assumed that storage racks containing multiple critical masses of uranium powder and uranyl nitrate solution are damaged directly by seismic shaking and indirectly by falling debris. Safe spacing is lost, and moderators are added as water from the fire system or organic solutions. This results in the possible formation of one or more critical assemblies. In an accidental criticality, it is assumed that lx10 19
fissions occur before reaching a stable, subcritical condition and that all material releases occur within a 2-hour period. The amount of radioactive material released as fission products created by the nuclear criticality is 46,000 ci of krypton isotopes, 65,000 ci of xenon isotopes, and 1,600 ci of iodine isotopes. The source term analyzed and the resulting doses are shown in Tables E.5.2.1-3 and E.5.2.1-4.
In the evaluation basis earthquake accident scenario, it is assumed that the building collapses, resulting in ruptured containers, piping, and tanks releasing uranium solutions, water, toxic gases, flammable gases, and toxic and reactive liquids. This is assumed to result in the release of 0.061 Ci of uranium (76 percent of the activity is U-234). The source term analyzed and the resulting doses are shown in Tables E.5.2.2-4 and -B.5.2.2-4.
In the UF 6 accident release, the evaluation basis earthquake causes equipment failures and a pressurized release of a UF6 cylinder. Thirty percent of a cylinder containing UF6 gas is assumed to be released into the atmosphere consistent with the NRC's Nuclear Fuel Cycle Facility Accident
E-67

Disposition of Surplus Highly Enriched Uranium Final EIS
Analysis Handbook (NUREG-1320, May 1988). After the accident, it is estimated that there would be a release of thirty percent of the material to equalize the pressure inside and outside the cylinder. The thirty percent release of UF 6 gas was derived from the relationship provided in NRC's Handbook:
Percent Release = 30 MFg0 91
In this relationship, MWg is the mole fraction of the pressurized gas. It is reported in the NRC Handbook that this relationship was developed using measured data, and bounds observed releases of aerosols produced from pressurized powders. When MFg
I Table E.5.2.2-2. Resulting Doses for a Fluidized Bed Release
Receptor Dose
Maximally Noninvolved Exposed Population
Workers Individual Within 80 km Site (person-rem) (rem) (person-rem)
B&W 990 0.49 38 NFS 68 9.7x10 2 53
Source: Results shown are derived from MACCS runs.
Table E.5.2.2-3. Source Term for an Evaluation Basis Earthquake Accident (Uranium
Hexafluoride)
Nucilde U-232 U-234 U-235 U-236 U-238
Source: OR LMES 1995a.
Release Activity (curies) 9.3x10"3
4.6x10"2
1.8xl0"3
2.4x10 4
3.2x1073
I
II I I I
I
I
Table E.5.2.2-4. Resulting Doses for an Evaluation Basis Earthquake Accident
(Uranium Hexafluoride)
I
Release Activity Nuclide (curies) U-232 1.6 U-234 1.6 U-235 5.8x10"2
U-236 6,5x10"3
U-238 0.6 Source: OR LMES 1995a.
Table E.5.2.2-6. Resulting Doses for a Uranium Hexqfluoride Cylinder Accident
Receptor Dose Maximally
Noninvolved Exposed Population Workers Individual Within 80km
Site (person-rem) (rem) (person.rem) B&W 54,000 26 1,900 NFS 5,000 5.7 3,000
Source: Results shown are derived from MACCS runs.
I
E-68
Receptor Dose
Maximally Noninvolved Exposed Population
Workers Individual Within 80 km Site (person-rem) (rem) (person-rem)
B&W 524 0.25 18 NFS 46 5.4x10"2 26
Source: Results shown are derived from MACCS runs.
equals one, all the material in the cylinder would be a gas under normal temperature and pressure, which is a conservative assumption for the analysis in this EIS. Therefore, for a pressurized release during cylinder filling operation, the soiarce is calculated to be 30 percent of 6,300 kg (13,600 lb), which is 1,900 kg (4,100 lb) of 1.5 percent assay LEU. The accident annual frequency was estimated to be in the range of 10-5 to 10"3; 104 was chosen for use in comparing alternatives. The source term analyzed and the resulting doses are shown in Tables E.5.2.2-5 and E.5.2.2-6.
Table E.5.2.2-5. Source Term for a Uranium Hexqfluoride Cylinder Accident

Human Health
E.5.2.3 Facility Accidents Postulated for Blending Highly Enriched Uranium to Low-Enriched Uranium as Metal
The accident scenarios that were considered included a tornado, straight winds, an aircraft crash, a truck
crash, nuclear criticality, process-related accidents, and an evaluation basis earthquake. With the
exception of the filter fire (with continuous exhaust
flow), all of the accident scenarios that are potentially
bounding can be initiated by the evaluation basis
earthquake. Therefore, it is concluded that the
evaluation basis earthquake would result in the
worst-case atmospheric release of radioactivity and
hazardous chemicals. The evaluation basis earthquake is assumed to initiate the nuclear criticality and other release scenarios.
In a filter fire accident, it is assumed that a fire occurs
that releases all the uranium in the bag filters, traps,
and the high-efficiency particulate air filters, and
releases it to the atmosphere in a matter of minutes.
The quantity of material assumed to be released is
0.15 kg (0.33 lb) of HEU. The source term analyzed and the resulting doses are shown in Tables E.5.2.1-1 and E.5.2.1-2.
In an earthquake-induced criticality accident, it is assumed that storage racks containing multiple critical masses of uranium metal are damaged directly by seismic shaking and indirectly by falling debris. Safe spacing is lost and moderators added as
water from the fire system. This results in the
possible formation of one or more critical assemblies. In an accidental criticality, it is assumed that 1xl0 19
fissions occur before reaching a stable, subcritical condition and that all material releases occur within a
2-hour period. The amount of radioactive material released as fission products created by the nuclear
criticality is 46,000 Ci of krypton isotopes, 65,000 Ci
of xenon isotopes, and 1,600 Ci of iodine isotopes. The source term analyzed and the resulting doses are shown in Tables E.5.2.1-3 and E.5.2.1-4.
In the evaluation basis earthquake accident scenario, it is assumed that the building collapses resulting in
ruptured containers, piping and tanks releasing uranium mixtures, water and reactive liquids. This is
assumed to result in the release of 2.lx10" 3 Ci of uranium isotopes (48 percent of the activity is U-232 and 33 percent of the activity is U-234). The source
E-69

Disposition of Surplus Highly Enriched Uranium Final EIS
E-70

Sociceconomics
Appendix F Socioeconomics
El INTRODUCTION
Appendix F includes the supporting data used for assessing potential impacts in the socioeconomics sections of this environmental impact statement (EIS). The socioeconomic analysis involved two major steps: 1) the characterization and projection of existing social, economic, and infrastructure conditions surrounding each of the candidate sites (that is, the affected environment) and 2) the evaluation of potential changes in socioeconomic
conditions that could result from the operation of highly enriched uranium (HEU) blending facilities in the regions addressed (that is, the environmental consequences). Data and analyses used to support the assessments made for the Affected Environment and Environmental Consequences sections are presented in the following tables. The tables are organized by resource area and site. For example, Table F.1-2 is the first resource area, Employees by Place of Residence, and the four sites: Oak Ridge Reservation (ORR); Savannah River Site (SRS); Babcock & Wilcox (B&W); and Nuclear Fuel Services (NFS).
F-I

'*11 Table P.1-i. Regional Economic Areas for Candidate Sites (Counties and Independent Cities)
ORR SRS B&W NFS South
Tennessee Tennessee (cont.) Georgia Carolina Virginia Virginia (cont.) Tennessee Vilrginia Anderson Jefferson Burke Aiken Amherst' Montgomery Carter Scott Blount Knox Columbia Allendale Appomattox Redford City Greene Smyth Campbell Loudon Glascock Bamberg Bedford Pulaski Hawkins Washington Cocke Morgan Jefferson Bamwell Bedford City Roanoke Sullivan Grainger Roane Jenkins Edgefield Botetourt Roanoke City Unicoi Hamblen Scott Lincoln Campbell Salem City Washington Hancock Sevier McDuffie Lynchburg City Wythe
Union Richmond Carroll Wilkes Craig Warren Floyd West Virginia
Franklin Monroe Giles Grayson . North Carolina
Galax City Alleghany Halifax
Note: The independent cities of Virginia are listed separately from the counties of Virginia. Source: DOC 1995a.
4

Socioeconomics
Table F.1-2. Distribution of Employees by Place of Residence in Oak Ridge Reservation Region of Influence, 1990
County/City Anderson County
Clinton Oak Ridge
Knox County Knoxville
Loudon County Lenoir City
Roane County Harriman Kingston
Total ROI
Total Employees
Note: City values are included within county totals. Source: ORR 1991a:4.
Number of Employees 5,053
.1,035
3,292 5,490 4,835
848 638
2,537 802
1,033 13,928
15,273
Total Site Employment (%) 33.1
6.8 21.6
36 31.7
5.6 4.2
16.6
5.3 6.8
91.3
100
Table F.1-3. Distribution of Employees by Place of Residence in Savannah River Site Region of Influence, 1991
County/City Aiken County
Aiken North Augusta
Allendale County Bamberg County Barnwell County Columbia County Richmond County
Augusta Total ROI
Total Employees
Note: City values are included within county totals. Source: SRS 1991a:3.
Number of Employees 9,978 4,928 2,666
217 329
1,401 2,036 3,358 2,780
17,319
19,208
Total Site Employment (%) 51.9 25.7 13.9 1.1 1.7 7.3
10.6 17.5 14.5 90.1
100
F-3
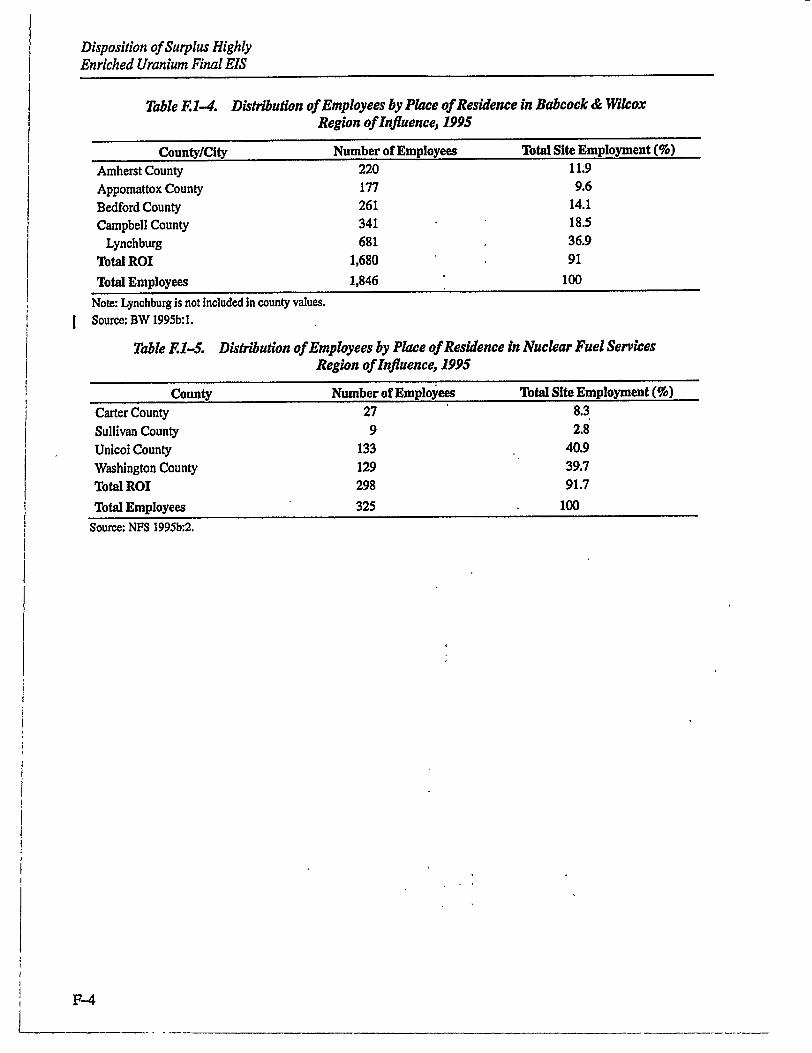
Disposition of Surplus Highly Enriched Uranium Final EIS
Table F.1-4. Distribution of Employees by Place of Residence in Babcock & Wilcox Region of Influence, 1995
County/City Number of Employees Total Site Employment (%) Amherst County 220 1 1;9
Appomattox County 177 9.6
Bedford County 261 14.1
Campbell County 341 18.5
Lynchburg 681 36.9
Total ROI 1,680 91
Total Employees 1,846 100
Note: Lynchburg is not included in county values. Source: BW 1995b:M.
Table F.-5. Distribution of Employees by Place of Residence in Nuclear Fuel Services Region of Influence, 1995
County Number of Employees Total Site Employment (%) Carter County 27 8.3
Sullivan County 9 2.8
Unicoi County 133 40.9
Washington County 129 39.7
Total ROI 298 91.7
Total Employees 325 100
Source: NFS 1995b:2.
-4F-
I

Table Fl-6. Oak Ridge Reservation Regional Economic Area Employment and Local Economy, 1995-2000, No Action Alternative
Regional Economic Area 1995 1996 1997 1998 1999 2000 Civilian labor force 486,400 491.800 497 1'0 9 ".
Total employment 462,900 467,900 473,000 478,200 483,400 Unemployment rate 4.9 4.9 4.9 4.9 4. (percentage)
Personal income 16,498,303 16,860,612 17,230,877 17,609,273 17,995,979 (thousand dollars) I Per capita income 18,198 18,397 18,598 18,801 19,007 (dollars per person) j Source Census 1993a; Census 1993b; DOC 1990c; DOC 1990d; DOC 1994j; DOC 1995a; DOL 1991a; DOL 1995a.
513,600 488,700
4.9
18,391,177
19,214
Table F1-7. Savannah River Site Regional Economic Area Employment and Local Economy, 1995-2000, No Action Alternative
Regional Economic Area 1995 1996 1997 1998 1999 2000 Civilian labor force 261,400 264,600 267,900 271,300 274,700 278,100
[ Total employment 243,800 246,800 249,900 253,100 256,200 259,400 Unemployment rate 6.7 6.7 6.7 6.7 6. 6.7 (percentage) Personal income 10,608,794 10,875,892 11,149,716 11,430,433 11,718,219 12,013,250 (thousand dollars) Per capita income 17,789 18,011 18,237 18,465 18,696 18,930
(dollars per person) | Source: Census 1993a; Census 1993c; Census 1993e; DOC 1990c; DOC 1990d; DOC 1994j; DOC 1995a; DOL 1991a; DOL 1995a.
r)

- I
'71
Regional Economic Area 19M 1996 1997 1998 1999 2000
Civilian labor force 338,100 340,900 343,600 346,400 349,300 352,100
Total employment 321,400 324,000 - 326,700 329,400 332,000 334,700
Unemployment rate 4.9 4.9 4.9 4.9 4.9 4.9 (percentage)
Personal income 14,357,210 14,592,163 14,830,960 15,073,665 15,320,342 15,571,056 (thousand dollars)
Per capita income 18,041 18,188 18,336 18,486 18,636 18,788 (dollars per person)
Source: Census 1993a; Census 1993d; Census 1993g; Census 1993h; DOC 1990c; DOC 1990d; DOC 1994j; DOC 1995a; DOL 1991a; DOL 1995a.
Table F.1-9. Nuclear Fuel Services Regional Economic Area Employment and Local Economy, 1995-2000, No Action Alternative
Regional EconomicArea 1995 1996 1997 1998 1999 2000
Civilian labor force 269,600 272,000 274,500 277,000 279,500 282,100
Total employment 253,800 256,100 258,400 260,800 263,100 265,500
Unemployment rate 5.9 5.9 5.9 5.9 5.9 - 5.9 (percentage)
Personal income 9,355,762 9,526,817 9,700,999 9,878,366 10,058,976 10,242,887 (thousand dollars)
Per capita income 16,814 16,967 17,122 " 17,278 17,435 17,594
(dollars per person) Source: Census 1993a; Census 1993b; Census 1993g; DOC 1990c; DOC 1990d; DOC 1994j; DOC 1995a; DOL 1991a; DOL 1995a.
!
I
I
!
I
Table .I--8. Babcock & W'dcox Regional Economic Area Employment and Local Economy, 1995-2000, No Action Alternative

Socioeconomics
Table F.1-10. Oak Ridge Reservation Region of Influence Population, 1990-2000, No Action Alternative
County/City Anderson County
Clinton Oak Ridge
Knox County Knoxville
Loudon County Lenoir City
Roane County Harriman Kingston
1990 68,250
8,972 27,310
335,749 165,121 31,255
6,147 47,227
7,119 4,552
1992 70,525
9,484 25,313
347,583 167,287 33,242
6,807 48,094
7,157 4,631
1994 72,400
9,700 26,000
356,700 171,700 34,100 7,000
49,400 7,300 4,800
Total ROI 482,481 499,444 512,600 Note: City values are included in county totals. Source: Census 1993a; Census 1993b; DOC 1990c; DOC 1990d; DOC 1994j.
1996 74,100
10,000 26,600
365,300 175,800 34,900
7,200 50,500
7,500 4,900
524.800
1998 75,800 10,200 27,200
373,300 179,700
35,700
7,300 51,700
7,700 5,000
536.500
2000 77,400 10,400 27,800
381,500 183,600 36,500
7,500 52,800
7,900 5,100
548.200
Table PI-li. Savannah River Site Region of Influence Population, 1990-2000, No Action Alternative
County/City 1990 1992 1994 1996 1998 2000 Aiken County 120,940 128,566 133,000 137,000 140,400 144,000
Aiken 19,872 22,429 23,200 23,900 24,500 25,100 North Augusta 15,351 16,379 16,900 17,500 17,900 18,300
Allendale County 11,722 11,744 12,200 12,500 12,800 13,200 Bamberg County 16,902 16,991 17,600 18,100 18,600 19,000 Barnwell County 20,293 21,089 21,800 22,500 23,000 23,600 Columbia County 66,031 73,000 75,500 77,800 79,700 81,800 Richmond County 189,719 202,434 209,400 215,700 221,100 226,700
Augusta 44,639 44,467 46,000 47,400 48,600 49,800 Total ROI 425,607 453,824 469,500 483,600 495,600 508,300
Note: City values are included in county totals. Source: Census 1993a; Census 1993c; Census 1993e; DOC 1990c; DOC 1990d; DOC 1994j.
Table F.1-12. Babcock & Wilcox Region of Influence Population, 1990-2000, No Action Alternative
County/City 1990 1992 1994 1996 1998 2000
Amherst County 28,578 29,031 29,800 30,500 31,000 31,500 Appomattox County 12,298 12,542 12,900 13,200 13,400 13,600 Bedford County 51,729 54,562 56,100 57,300 58,300 59,200 Campbell County 47,572 48,703 50,100 51,200 52,000 52,900
Lynchburg 66,049 66,097 68,000 69,500 70,600 71,800 Total ROI 206,226 210,935 216,900 1 221,700 225,300 229,000
Note: Lynchburg is not included in county totals. Source: Census 1993a; Census 1993g; DOC 1990c; DOC 1990d; DOC 1994j.
F-7
. . o

Disposition of Surplus Highly Enriched Uranium Final EIS
Table F.l-13. Nuclear Fuel Services Region of Influence Population, 1990-2000, No Action Alternative
County 1990 1992 1994 1996 1998 2000
Carter County 51,505 52,029 53,400 54,600 55,600 56,600
Sullivan County 143,596 146,676 150,500 153,800 156,600 159,500
Unicoi County 16,549 16,791 17,200 17,600 17,900 18,300
Washington County 92,315 94,934 97,400 99,600 101,400 103,200
Total ROI 303,965 310,430 318,500 325,600 331,500 337,600
Source: Census 1993a; Census 1993b; DOC 1990c; DOC 1990d; DOC 1994j.
Table F.1-14. Oak Ridge Reservation Region of Influence Housing Units, 1990-2000,
No Action Alternative
County/City 1990 1992 1994 1996 1998 2000
Anderson County 29,323 30,300 31,100 31,800 32,500 33,300
Clinton 4,006 4,200 4,300 4,500 4,500 4,600
Oak Ridge 12,694 11,800 12,100 12,400 12,600 12,900
Knox County 143,582 148,600 152,500 156,200 159,700 163,200
Knoxville 76,453 77,500 79,500 81,400 83,200 85,000
Loudon County 12,995 13,800 14,200 14,500 14,800 15,200
Lenoir City 2,734 3,000 3,100 3,200 3,300 3,300
Roane County 20,334 20,700 21,300 21,800 22,200 22,700
Harriman 3,234 3,300 3,300 3,400 3,500 3,600
Kingston 2,071 2,100 2,200 2,200 2,300 2,300
Total ROI 206,234 213,400 219,100 224,300 229,200 234,400
Note: City values are included in county totals.
Source: Census 1991c; Census 1993a; Census 1993b; DOC 1990c; DOC 1990d; DOC 1994j.
Table F.1-15. Savannah River Site Region of Influence Housing Units, 1990-2000,
No Action Alternative
County/City 1990 1992 1994 1996 1998 2000
Aiken County 49,266 52,400 54,200 55,800 57,200 58,700
Aiken 8,543 9,600 10,000 10,300 10,500 10,800
North Augusta 6,810 7,300 7,500 7,700 7,900 8,100
Allendale County 4,242 4,300 4,400 4,500 4,600 8,100
Bamberg County 6,408 6,400 6,700 6,900 7,000 7,200
Barnwell County 7,854 8,200 8,400 8,700 8,900 9,100
Columbia County 23,745 26,300 27,200 28,000 28,700 29,400
Richmond County 77,288 82,500 85,300 87,900 90,100 92,400
Augusta 21,588 21,500 22,300 22,900 23,500 24,100
Total ROI 168,803 180,100 186,200 191,800 196,500 201,600
Note: City values are included in county totals. Source: Census 1991a; Census 1991b; Census 1993a; Census 1993c; Census 1993e; DOC 1990c; DOC 1990d; DOC 1994j.
F-
I I

Socioeconomics
Table F.1-16. Babcock & Widcox Region of Influence Housing Units, 1990-2000, No Action Alternative
County/City 1990 1992 1994 1996 1998 2000
Amherst County 10,598 10,800 11,100 11,300 11,500 11,700
Appomattox County 4,913 5,000 5,200 5,300 5,400 5,400
Bedford County 22,226 23,400 24,100 24,600 25,000 25,500
Campbell County 19,008 20,300 20,900 21,400 21,700 22,100
Lynchburg 27,233 27,300 28,000 28,600 29,100 29,600
Total ROI 83,978 86,800 89,300 91,200 92,700 94,300
Note: Lynchburg is not included in the county totals.
Source: Census 1991u; Census 1993a; Census 1993g; DOC 1990c; DOC 1990d; DOC 1994j.
Table F.1-17. Nuclear Fuel Services Region of Influence Housing Units, 1990-2000, No Action Alternative
County 1990 1992 1994 1996 1998 2000
Carter County 21,779 22,000 22,600 23,100 23,500 23,900
Sullivan County 60,623 61,900 63,500 64,900 66,100 67,300
Unicoi County 7,076 7,200 7,400 7,500 7,700 7,800
Washington County 38,378 39,500 40,500 41,400 42,100 42,900
Total ROI 127,856 130,600 134,000 136,900 139,400 141,900
Source: Census 1991c; Census 1993a; Census 1993b; DOC 1990c; DOC 1990d; DOC 1994j.
Table F.1-18. Candidate Sites-Total Student Enrollments, 1995-2000, No Action Alternative
Site ROI 1995 1996 1997 1998 1999 2000
ORR 83,400 84,300 85,200 86,100 87,100 88,000
SRS 88,200 89,300 90,400 91,600 92,700 93,900
B&W 34,200 34,400 34,700 35,000 35,300 35,600
NFS 52,500 53,000 53,500 53,900 54,400 54,900
Source: BW School 1995a; NF School 1995a; OR School 1995a; SR School 1995a; Appendix Tables El-10 through 13.
Table F.l-19. Candidate Sites-Total Teachers, 1995-2000, No Action Alternative
Site ROI 1995 1996 1997 1998 1999 2000
ORR 5,140 5,190 5,250 5,310 5,370 5,420
SRS 5,060 5,120 5,180 5,250 5,310 5,380
B&W 2,400 2,420 2,440 2,460 2,480 2,500
NFS 2,920 2,950 2,980 3,000 3,030 3,060
Source: BW School 1995a; NF School 1995a; OR School 1995a; SR School 1995a; Appendix Tables F.1-10 through 13.
F-9

Disposition of Surplus Highly Enriched Uranium Final EIS
Table P.1-20. Candidate Sites-Total Number of Sworn Police Officers, 1995-2000, No Action Alternative
Site ROI 1995 1996 1997 1998 1999 2000 ORR 792 801 809 818 827 836 SRS 956 968 980 992 1,010 1,020 B&W 358 361 364 367 370 373 NFS 556 561 566 571 577 582
Source: BW Police 1995a; DOJ 1994a; NF Police 1995a; OR Police 1995a; Appendix Tables F.I-10 through 13.
Table F.1-21. Candidate Sites-Total Number of Firefighters, 1995-2000,
No Action Alternative
Site ROI 1995 1996 1997 1998 1999 2000ORR 1,120 1,130 1,150 1,160 1,170 1,180
SRS 1,363 1,380 1,400 1,420 1,430 1,450,
B&W 960 968 976 984 992 1,000
NFS 1,201 1,210 1,220 1,230 1,250 1,260
Note: Kingsport Fire Department in Sullivan County and Limestone Cove Volunteer Fire Department in Unicol County were excluded from the NFS ROI total because firefighter data were unattainable.
Source: BW Fire 1995a; NF Fire 1995a; OR Fire 1995a; SR Fire 1995a; Appendix Tables F.I-10 through 13.
Table F.i-22. Candidate Sites-Total Number of Physicians, 1995-2000, No Action Alternative
Site ROI 1995 1996 1997 1998 1999 2000 ORR 1,300 1,320 1,330 1,350 1,360 1,380 SRS 1,370 1,390., . 1,410 1,420 1,440 1,460 B&W 299 302 304 307 309 312 NFS 870 878 886 894 902 910
Source: AMA 1994a; Appendix Tables FI-I0 through 13.
Table P.1-23. Candidate Sites-Hospital Occupancy Rates, 1995-2000, No Action Alternative
Site ROI 1995 1996 1997 1998 1999 2000 ORR 73 74 75 76 77 78 SRS 65 66 66 67 68 69 B&W 70 71 71 72 72 73 NFS 61 62 63 63 64 64
Source: AHA 1994a; Appendix Tables Fl-10 through 13.
F-10
I
I

Socioeconomics
Table F,1-24. Changes to Total Employment, Unemployment Rate, and Per Capita Income During Full
Operation of the Uranyl Nitrate Hexahydrate Blending Facility
Site No Action UNH Percent Change
Oak Ridge Reservation Unemployment rate 4.9 4.8 NA
Total employment 488,700. 489,144 0.1
Per capita income (dollars per person) 19,214. 19,225 0.1
Savannah River Site Unemployment rate 6.7 6.6 NA
Total employment 259,400 259,770 0.1
Per capita income (dollars per person) 18,930 18,952 0.1
Babcock & Wilcox Unemployment rate 4.9 4.8 NA'
Total employment 334,700 335,111 0.1
Per capita income (dollars per person) 18,788 18,802 <0.1
Nuclear Fuel Services Unemployment rate 5.9 5.7 NA
Total employment 265,500 265,879 0.1
Per capita income (dollars per person) 17,594 17,612 0.1
Note: NA=not applicable. Source: BEA 1995c; BW 1995b:1; Census 1992a; Census 1993b; Census 1993c; Census 1993d; Census 1993e; Census 1993g;
Census 1993h; DOC 1990c; DOC 1990d; DOC 1994j; DOC 1995a; DOL 1991a; NFS 1995b:2; OR LMES 1995b;
ORR 1991a:4; SRS 1991a:3.
Table F.1-25. Changes to Total Employment, Unemployment Rate, and Per Capita Income
During Full Operation of the Uranium Hexafluoride Blending Facility
site No Action uF6 Percent Change
Babcock & Wilcox Unemployment Rate 4.9 4.8 NA
Total employment 334,700 335,111 0.1
Per capita income (dollar per person) 18,788 18,802 <0.1
Nuclear Fuel Services
Unemployment rate 5.9 5.7 NA
Total employment 265,500 265,879 0.1
Per capita income (dollar per person) 17,594 17,612 0.1
Note: NA--not applicable.
Source: BEA 1995c; BW 1995b:l; Census 1992a; Census 1993b; Census 1993d; Census 1993g, Census 1993h; DOC 1990c;
DOC 1990d; DOC 1994j; DOC 1995a; DOL 1991a; NFS 1995b:2; OR LMMS 1995a.
F-11

Disposition of Surplus Highly Enriched Uranium Final EIS.
Table F.1-26. Changes to Total Employmen4 Unemployment Rate, and Per Capita Income During Full Operation of the Metal Blending Facility
Site No Action Metal Percent Change Oak Ridge Reservation
Unemployment rate 4.9 4.8 NA Total employment 488,700 489,144 0.1 Per capita income (dollar per person) 19,214 19,220 <0,1 [Text deleted.]
Note: NA=not applicable. Source: BEA 1995c; Census 1992a; Census 1993b; Census 1993c; Census 1993e; DOC 1990c; DOC 1990d; DOC 1994j;
DOC 1995a; DOL 1991a; OR LMES 1995c; ORR 1991a:4.
F-12
I I I
I

Intersite Transportation
Appendix G Intersite Transportation
G.1 TRANSPORTATION RISK ANALYSIS METHODOLOGY
Health impacts from transportation are presented in
this appendix for four blending options: 1) uranyl
nitrate hexahydrate (UNH) crystals as commercial
reactor fuel feed material, 2) UNH as low-level waste
(LLW), 3) uranium hexafluoride (UF 6) as fuel feed material, and 4) metal LLW.
This assessment estimates the health effects, in terms
of annual fatalities, from the transportation of
radioactive materials needed for blending highly
enriched uranium (HEU) to low-enriched uranium (LEU) with appropriate blendstock material and from
the transportation of the blended products to a site for
either fuel fabrication or disposal as LLW.
Calculations were performed using RADTRAN Version 4 to estimate unit risks, that is, the risk of
transporting each type of material over a distance of
1 kilometer (km) (0.62 miles [mid through different
population zones. In a series of linked spreadsheets, the impacts were calculated for each alternative using
actual distances and population zones, and summed for total health effects. The data used and health risk
impacts are summarized in Tables G.1-1 through G.1-8.
Highly enriched uranium would be transported via
safe secure trailers (SSTs). The blendstock would consist of natural uranium (NU), depleted uranium
(DU), or LEU in oxide as triuranic-octaoxide (U308), metal, or UF6 form. The shipments of LEU and LLW would be transported in Department of
Transportation (DOT)-approved packages by
commercial carriers. The number of packages per
shipment would be in accordance with regulatory
requirements. Trucks would be loaded to capacity, as
determined by either weight or radiological dose limitations.
RADTRAN combines user-determined demographic, transportation, packaging, and
material factors with health physics data to calculate the expected radiological consequences of accident
free and accident risk of transporting radioactive material. Tables G.1-1 and G.1-2 give the isotopic
compositions used for each material type considered. HEU was assumed to be 93-percent U-235; even
though the average assay of surplus HEU was
Table G.1-1. Isotopic Composition by Percent of Uranium Materials
Material U-232 U-234 U-235 U-236 U.238
I-EU (93% U-235) 0 1 93.1 0.5 5.4
DU (0.2% U-235) 4.0x10"6 3.6x10⁻³ 0.2 0 99.8
NU (0.71% U-235) 4.0x10⁻⁶ 5.4x10"3 0.71 0 99.3
LEUW (0.9% U-235) 4.0x10- 9.5x10"3 0.9 3.3x10"3 99
LEU4 (4% U-235) 4.0x10⁻⁶ 3.3x10"2 4 1.5x10⁻² 96
Specific activity 2.2x10 4 6.2 2.1x10"3 6.3x10"2 3.3x10"4
(cure/kilogram) Source: ORR 1995a:3.
Table G.1-2. Contribution by Isotope to Total Speeifc Activity (curies per kilogram)
Material U-232 U-234 U-235 U-236 U-238 Tbtal
HEU (93% U-235) 0 6.2x10"2 2.0x10"3 3.2x10"4 1.8x10"5 6.4x10"2
DU (0.2% U-235) 8.8x10⁴ 2.2x10 4 4.2x10⁶ 0 3.3x10 4 .4x10"3
NU (0.71% U-235) 8.8x10 4 3.4x10"4 L.5x10" 0 3.3x10 4 1.6x10"3
LEU1 (0.9% U-235) 8.8x10 4 5.9x10- 1.9x10"5 21x0"6 3.3x10⁴ 1.8x10"3
LEU4 (4% U-235) 8.8x10 4 2.1x10 3 8.4x10 5 9.5x10⁶ 3.2x10⁴ 3.4x10"3
Source: ORR 1995a:3.
G-1

Disposition of Surplus Highly Enriched Uranium Final EIS
estimated to be lower, 93 percent was used in transportation analyses to assess the highest potential impact. The blendstock materials were NU with 0.71-percent U-235 or DU with 0.2-percent U-235. The product materials were fuel feed material with 4-percent U-235 or LLW with 0.9-percent U-235.
The transport index is a iegulatory characteristic of a package and is equal to the radiation dose rate in millirem per hour at a distance of 1 meter (m) (3.3 feet [ft]) from the outside of the package. The transport index values were estimated to be the maximum allowed by regulatory requirements, as indicated by regulatory checks incorporated in RADTRAN. These regulatory checks limit the product of the number of packages and the transport index (of each package) to a value of about 16. The quantity of material per package, number of packages per truckload, and number of-truckloads per year were estimated.
The transportation accident model in RADTRAN assigns accident probabilities to a set of accident categories. For the truck analysis, the eight accidentseverity categories defined in Nuclear Regulatory Commission's (NRC) Final Environmental Statement on the Transportation of Radioactive Material by Air and Other Modes (NUREG-0170, December 1977) were used. The least severe accident category (Category I) represents low magnitudes of crush force, accident-impact velocity, fire duration, or puncture-impact speed. The most severe category (Category VIII) represents a large crush force, higliimpact velocity, high puncture-impact speed, an 88-kilometer per hour (km/hr) (54.6-mi/hr) collision into the side of the vehicle, and a 982 Celsius (*C) (1,800 Fahrenheit [IF]) fire lasting 1.5 hrs to produce a release of HEU. The release fractions for Category VIII accidents were conservatively estimated to be 0.1 for the strictly controlled SST shipments of HEU and 1 for other shipments.
Unit risk factors for radiological exposure from transportation were calculated in terms of fatal cancers for each type of material to be shipped a distance of 1 km (0.62 mi) in rural, suburban, and urban population zones. These unit risk factors are presented in Table G.1-3. The RADTRAN code was used to estimate population and occupational doses (unit dose factors) for transportation of each material over 1 km (0.62 mi) in each population zone. The unit
G-2
dose factors were converted to unit risk factors by multiplying the occupational accident-free unit dose factors by 4.0x10'4 cancers per person-rem and the public accident-free and accident unit dose factors by 5.0x!0"4 cancers per person-rem (ICRP 199 la:22).
Radiological exposures from handling of uranium materials during loading and unloading of trucks were estimated per shipment (truckload) as shown in Table G.1-4. It was estimated that there would be two cargo handlers and 35 other workers within 50 m (165 ft) of the loiding/unloading operations. Accident-free risks to cargo handlers and other workers were summed for determining total health impacts.
Table G.1-5 presents the computed health risks per year from the transport of HEU to blending sites for each alternative; Table G.1-6 presents the risks from the transport of blendstock materials; and Table 0.1-7 presents the risks from transporting commercial reactor fuel feed material and LLW from blending sites to either a fuel fabrication plant or LLW disposal site.
For these calculations, distances and the fractions for rural, suburban, and urban populations for each intersite route were estimated using the INTERSTAT routing code. Among the routes considered, the average population distribution for rural, suburban, and urban were 78, 20, and 2 percent, respectively. Annual radiological transportation impacts were calculated by multiplying route distance by the number of shipments and then multiplying by the sum of the products of the rural distance fraction and rural unit risk factor, the suburban distance fraction and suburban unit risk factor, and the urban distance fraction and urban unit risk factor. Tables G.1-5, G.1-6, and G.1-7 also include estimates of nonradiological impacts due to air pollution and highway accidents. Fatalities from potential air pollution were estimated using 1.0x10⁻⁷ cancer fatalities per urban kilometer. Highway accident fatalities were estimated from national statistics using 1.5x10⁸ rural, 3.7x10"9 suburban, and 2.1x10"9
urban for occupational risks per kilometer, and 5.3x10"8 rural, 1.3x10"8 suburban, and 7.5x10"9
[ urban for nonoccupational risks per kilometer.
Table G.1-8 presents a suinmary of the cumulative annual transportation health impacts for all blending options.

TabIeG.1-3. Unit Dose and Risk Factorsfor Radfological HeaUh Risks
Unit Dose Factors (person-rem) Unit Itisk Factors (fatal cancers)
Accident Accident-Free Accident Accident-Free
Material Pkgs Weight per
per Ship- Transport Public DWance Material Form Package ment Crew Off-lAnk' On-Linkb StopsF Total Public Public Crew (I km) (kilogram)
Rural BEU-93 Metal, 2 48 9.7xIO-10 8.2xlO-6 :5.IxIW8 2.lxlO-6 5.OxlO-5 5.2xlO"5 4.8xlo-13 2.6xlG-" 3.3xlO-9
5.8xlO-6 6.OxlO-6 5.0XIOUF6
Suburban HEU-93 Metal, UF6
Urban HEU-93 Metal,
2 48 1.3xlO 1.8xlO-'
2 48 3.9xlO-7 * 3.OxIG-5
6.IxIO 6.7xlG-" 3.lxlO-8 7.2xlO-9
6.5xlO-7 2.IxIO-5 5.OxIO 7.2xIO 1.9xlO-'o 3.6xlG-' 1.2xlO-'
UF6 UNH UNH UNH Metal Metal Metal UNH UNH UNH
UF6
UF6 UF6 Metal Metal Metal UNH UNH UNH UF6 UF6
8.7xlo-12 1.2xlG-' 3.5xlO-9 4.4xlO-" 6.IxIO 1.8XIO-1
4.6xlD-" 6.3xlO-9 1.8XI04
2.SxIO-" 3.5xIO-9 I.OXIO-8
2.OxIO-"
2.8xlO 8.OxlG-9 2.5xlG-" 3.4xlO-9 I.OXIO 3.4xlO-" 4.7xlO-9
2.6xlg-8 3.3xlO-9 3.lxlO*8 7.2xlO"9 3.6xlG-8 1.2xlO-'
2.6xlO--s 3.3xlO-9
3.lxlG-8 7.2xlO-9 3.6xlO-8 1.2xlO-' 2.6xlO-8 3.3xlO-9
3.IxIO-" 7.2xlO'9 3.6xlG-9 1.2xlO-8 2.6xlO-8 3.3xlO-9
3.1XIO-8 7.2xlO'9 3.640-8 1.2xlO-' 2.6xlW$ 3.3xlO-9
3.IXIG-8 7.2xlW9 3.6XIO-8 1.2X10⁻⁸
2.6xlO-8 3.3xlO-9
3.lxlO-8 7.2XIO-9 3.6xlo-8 1.2X10⁻⁸
2.6xlO-8 3.3xlO-9 3.IxIG-8 7.2xlO-9
Ruml Suburban Urban Rural
Suburban Urban Rural Suburban
Urban Ruml Suburban Urban Rural
Suburban Urban Ruml Suburban
Urban Rural Suburban
1.7xlO-8 2.4xlO-6 6.9XIO-6 8.9xlO-' 1.2xlO 3.6xlG-5 9.1XIO-8 1.3xlO-s 3.6xlO-5 5.IxIW8
7.OxIO-6 2.OxlO-5 4.OxIO-8
5.5xlO-6 1.6xlO-' 5.Oxl(rI 6.9xlO-6 2.OxlO-5 6.8xl(r' 9.4xlO-6
8.2xlO-6 1.8XIO-5 3.OxIO-5 8.2xlO-6 1.8XIO 3.OxIO-5 8.2xlO-6
1.8XIO-5 3.OxlOO 8.2xlOr6
I.SX10.5 3.040-5 8.2xle
1.8xle 3.040-5 8.240-6 1.8XIO-5
3.040-5 8.2xlW6 1.8xlO-5
5.lxlO-' 5.8xlW6 6.5xlO
5.lxlO-8 5.8xlO 6.5xlG-7 5.1XIO-8 5.8xlO-6 6.5xlO-7
5.lxlO-' 5.8XIO-6 6.5xi(r7
5.lxlO-" 5.8XIW6
6.540-7 5.IxIO-' 5.8xlO-6 6.5xlO-7
5.140 5.840
2.lxlO
6.OxIW6 2.lxlO-' 2.IxIO-6
5.9xlO 2.lxlO-5
2.lxIW6 5.9XIO-6
2.IxIO-5
2.IxIW6 5.9xIO 2.IxIO-5
2.IxIW6
6.OxIO-6 2.IxIO
2.IxIO
5.9X10⁻⁶
2.IxIG--' 2.IxIO 5.9XIO
5.OxIO-5 5.OxlO-' 5.OXIO-5
5.OX10-5 5.OxlG'5 5.OxlO-5 5.OxlO-5
5.OxlO 5.OXIO-5
5.OxIO 5.OxlO-5 5.OXIO-,5
5.OXIO-5 5.()XIO-5
5.OxIO-' 5.Oxl(Y5 5.OxlG-5 5.OxIO--5 5.OxlO-5
5.OxlO-5
5.2xlO 6.1xIO-5 7.2xlO-5 5.2xlO 6.lxlO-5
7.IX1075 5.2xlO-5 6.lxlO--5 7.IxIO-S 5.2xlO 6.lxlO'5 7.IxIO-' 5.240-5 6.140 7.2xlO-5 5.2xlO-5
6.IxIO-' 7.lxlO 5.240-5
6.140-5
49 48 48 5 5 5 5 5 5
48 48 48 50 50 50 4 4
HEU-93 HEU-93 BEU-93 DU-0.2 DU-0.2 DU-0.2 NU-0.7 NU-0.7 NU-0.7 NU-0.7 NU-0.7 NU-0.7 LEU-1 IEU-1 LEU-1 LEU-4 LEU-4 1EU-4 IEU-4 LEU-4
35 35 35
2,200 2,200 2,200 2,200 2,200 2,200 6,133 6,133 6,133
93 93 93 43 43 43
1,516 1,516 M

Table G.1-3. Unit Dose and Risk Factors for Radiological Health Risks-Continued
U ... . , r.....sk ac rs afa cancers)
Material Weight
per Distance Material Form Package (1 km) (kilogram)
Urban LEU-4 U6 1,516 Rural LEU-1 UNH 87 Suburban LEU-1 UNH 87 Urban LEU-1 UNH 87
Accident-Free . eL AcenImPkgs per
Shipment
50
50 50 50
"-..IA.U 4.0x10⁻⁸ 5.5xl0-6
1.6x10"5
Handling (Each Loading or Unloading) Handling (One Loading Plus One Unloading)
a Off-link is population within 500 m (1,640 ft) of the highway. b On-link is population sharing the highway. ' Truck stop en route (for example, gas). Source: RADTRAN model results.
Trlansport Public Crew Off.Linka On.Linkb Stopsc
3.UXIU
8.2xlO-6
1.8x1L-5 3.0x10⁻⁵
6.ox1o-2 1.2x10⁻¹
l.2x101 x (.110
5.lxlO 8
5.8x106.5x10"7
4.0x10⁻³ 8.IxIO-
2. lm 0
6.0xl0-6 2.lxltY
5
5.0X10-.' 5.OxlO-5
5.0x10⁻⁵
5.0x10⁻⁵
Toa Puli Puli Crew-17.lx10"• 5.2x10⁻⁵ 6.1x10-S 7.2x10'5
1Ax10"• 2.0x10⁻¹ 1
2.8x10⁻⁹
8.OxlO-9
3.6x1O-" 2.6x10⁻⁸
3.1x10⁻⁸ 3.6x10⁻⁸
1.6xlO
1.2x10 8
3.3x10"9
7.2x10⁻⁹ 1.2x10⁻⁸
2.4x10⁻⁵ A Rr I¢n-5
Table G.1-4. Accident-Free Radiological Exposure From Transferring Materials Between Storage and a Truck
Types of Populationa Population Size Cargo Handlers
Collective population 2 Average individual dose 1
Other Workers Collective population 35 Average individual dose 1
a Under normal (accident-free) conditions the public does not receive a measurable dose. Source: RADTRAN model results.
Dose Later Cancer Fatality
6.0x10"2 person-rem 3.0x10 2 rem
4.x0O03 person-rem 1.2xl0"4rein
1.2xl4 rem0
2.4x10⁻⁵
4.2xl1 w
1.6X10⁻⁶
Unit Dose Factorm (nercnn-"~mi IT • '11) ! lP • If, • \
,Accident
Total Public Public Crew
IP. _ _ _

Table G.1-5. Annual Health Effects From Transportation of Highly Enriched Uranium (93-Percent U-235) From Y-12 Plant to Blending Plants
Radiologicala Nonradiologicaib Air
Population Accident Accident-Free Accident Pollution Total
Health
Shipmentsc Distance Rural Suburban Urban Public Crew Public Crew Effectd Destination (per year) (kin) (%) (%) (%) UNH Blending to Fuel Feed Material
B&W 6 526 68 31 1 1.3x10"6 1.1x10 4 3.0x1"O 2 .5x10" 7.2x10"5 6.9x10"6 7.4x10"4
NFS 6 247 68 31 1 6.2x10"7 6.OxlO 5 3.0x10"4 1.2x10⁴ 3.4x10"5 3.3x10"6 5.1x10 4
SRS 6 479 71 27 2 1.2x10"6 9.8x10 5 3.0x10"4 2.4x10⁴ 6.7x10"5 1.1x10 5 7.2x1O"4
Y-12 6 0 0 0 0 0 1.9x10"5 2.9x10"4 0 0 0 3.1x10"4
UNH Blending to LLW B&W 22 526 68 31 1 2.7x10"7 3.9x0"4 1.1x0"3 9.3x10"4 2.6x10"4 2.6x10"5 2.7x10"3
NFS 22 247 68 31 1 1.3x10 7 2.2x10"4 1.xlO"3 4.4x10 4 1.2X10⁴ 1.2x10"6 1.9x10"3
SRS 22 479 71 27 2 2.3x10"7 3.6x10"4 1.1x0"3 8.7x10"4 2.5x10 4 4.1x10"5 2.6x10"3
Y-12 22 0 0 0 0 0 7.1xlO5 1.1xlO 3 0 0 0 1.lxlO"3
UF6 Blending to Fuel Feed Material B&W 105 526 68 31 1 1.3x10⁶ 1.9x10"3 5.3x10"3 4.4x10"3 1.3x10" 3 1.2x10 4 1.3x10"2
NFS 105 247 68 31 1 6.0x10"7 1.1x0"3 5.2x10"3 2.1x10"3 5 .9xiO0 5.7x10 5 8.9x10"3
Metal Blending to LLW [Text deleted.]
Y-12 33 0 0 0 0 0 1.1x10"4 1.6x10"3 0 0 0 1.7x10"3
a Cancer fatalities. b Fatalities. C A shipment is a truckload. d Estimated fatalities per year.
Source: RADTRAN model results.
-4 ft N
'.4 ft
I-I N

Table G.1-6. Annual Hea Il Effectsi From TransportatIon of Uranium Hexaftuoride, Uranium Oxide, and MetalBlendstock
Radiological" Nonradiologicalb Air
Accident Accident-Free Accident Pollution
Total Health Destination Material ShipmentsF Distance Public Crew Public Crew Effectd origin (per year) (kIan)
I
Uranium nexanuoride tUJF6) Paducah GE Piketon GE Paducah GE Piketon GE Paducah B&W Paducah NES Piketon B&W Piketon NFS
Uranium Oxide (U30S) Hanford SRS Hanford Y-12 Hanford B&W Hanford NFS Hanford SRS Hanford Y-12 Hanford B&W Hanford NFS GE B&W GE NFS GE SRS GE Y-12 GE B&W GE NFS GE SRS GE Y-12
DU-0.2 DU-0.2 NU-0.7 NU-O.7 NU-0.7 NU-O.7 NU-0.7 NTJ-0.7
NU-0.7 NU-0.7 NU-0.7 NU-0.7 DU-0.2 DU-0.2 DU-0.2 DU-0.2 NU-O.7 NU-0.7 NU-0.7 NU-0.7 DU-0.2 DU-02 DU-0.2 DU-0.2
23 23 22 22 22 22 22 22
15 15 15 15 16 16 16 16 15 is 15 15 16 16 16 16
1,278 IR5I(Y 8.8xl104 1.2xlG03 2.4x10⁻³ 6.8x10⁻⁴ l.OxIO-4 5.3x10⁻³
1,323 IWO10 9.1x10⁻⁴ 1.3x10 3 2.5xl0- 3 7.0x10⁻⁴ 1.2xloA4 5.5x10³I 1,278 IWO10 8.4x1074 1.2x1 2.3x10 3 6.5x10⁴ 9.6xI0-5 5.Ixl(Y 3
1,323 2.2x10⁻⁵ 8.7x10⁻⁴ 1.21( 2.4x10⁻⁵ 6.7x10⁻⁴ LWlxO t 5.2xloY 1,013 2.7xIGY5 6.8xI0 4 1.2x10⁻³ L.810 IWO10 4.9xI0-5 4.2x10⁻³
734 IWO10 5.1x10⁻⁴ LW1x1 3 13x1(Y3 3.7x10⁻⁴ IWO1(Y 3.4x10 3
858 2.5xlOr IWO10 LWO10 1.5x10- 3 4.2x10O IWO10 IWO10 916 IWO10 6.3xI0-4 1.2x1 3 1.6x1 3 4.5x10⁻⁴ 6.5xI0-5 3.9X10⁻³
4,442 1.1X10⁻⁴ 1.8X10⁻³ 1.0X10⁻³ 5.9X10⁻³ L.7x1 3 2.0x10⁻⁴ 1.1x1 2
3,969 9.3x10⁻⁵ 1.7x10⁻³ 9.7x10⁴ 5.3x10⁻³ 1.5x10³ 1.7x10⁴ 9.7x10⁻³
4,422 1.110 L.8x1 3 1.OxlO-3 5.8x10³ 1.6x10⁻³ 1.9x10⁻⁴ 1.lxlO2
4,216 9.9Xj0 5- 1.8X1(Y 3 9.9X10⁻⁴ 5.6xj0-3 1.6x10⁻³ 1.8X10⁴ 1.OxlO 2
4,442 1.1x1 4 IWO10 .LlO-3 6.3x10 3 1.8x1 3 IWO10 .LlO-2
3,969 9.6x10⁻⁵ 1.8x1 3 I.Ox10-3 5.6x10⁻³ 1.6x1(r L.8W0 1.0x10⁻²
4,422 L.1x1 4 IWO10 1.1x1G03 6.2x10³ 1.8x10⁻³ IWO10 1.lxlO-2
4,216 1.0x1 4 19LWOY3 1Lxlt 3 6.0x10'3 1.7x1 3 IW10 1.1x10 2
801 2.5x10⁻⁵ IWO10 7.8x10⁻⁴ I.OxIO-3 2.8x10⁻⁴ 4.6x1(Y 5 2.5x10⁻³
860 IWO1(Y 4.Ox10-4 7.8x10⁴ 1.1x1 3 IWO10 5.7x10⁻⁵ IWO10 596 1.8x10⁻⁵ 2.9x10⁻⁴ 7.6x10⁻⁴ 7.5x10⁻⁴ 2.1x10⁴ 4.1xlO 5 IWO10 791 2.5x10⁵ 3.7x10⁴
7.8xlO04 9.8x10⁻⁴ IWO10 .0IWO 25x10-3
801 IWO10 4.0x10⁴ 8.3x10⁴ LW1x1 3 IWO10 5.0x10⁻⁵ IWO1(Y 860 IWO10 4.3x10~ 8.3xl10 4 LW1x1 3 IWO10 6.1x10⁻⁵ 2.8x1(Y 3
596 1.9X10⁻⁵ IWO10 8.1x10⁻⁴ 8.0x10⁻⁴ 2.3x10⁴ 4.4x10⁻⁵ 2.2x10⁻¹ 791 IWO14Y 4.0x10⁻⁴ 8.3xl10 4 1.lx1GO3 IWO10 5.3xI0-5 2.7xl10 3
N �jN�

Table G.-6. Annual Health Effects From Transportation of Uranium Hexaflnoride, Uradiwn Oxide, and MeftalBlendstock-Continued
Radiologicalu Nonradjologicaib
Air Accident Accident-Free Accident Pollution
Total Health Destination Material Shipments Distance Public Crew Public Crew Effecti
Origin (per year) (kIan) Metal
Fernald Y-12 DU-0.2 20 466 2.Oxl(Y5 32x104 i.Oz40 7.4x10⁴ 2.1x10⁻⁴ IWO10 23xIQ03
I [Text deleted.]
Cancer fatalities. bFatalities.
A Ashipmient is a truckload.
Note: GE=General Electric Wilmington. Source: RADTRAN model results.
Table G.-7. AnnualHealth Effects From Transportation of FuelFeed Material and Low-Level Waste From the Blending Plant to Destination
Radiologicala Nonradiologicalb
Accident Accident-Free Accident MirPollution Total Health
Destination Distance Public crew Public Crew Effectc Origin (kin)
Uranyl Nitrate Hexahydrated (4-Percent Enrichment) B&W ABB-CE 1,301 1.2xl10 4 IU710-3 3.8x10³ U.x10-3 2.0x10³ 3.1x10⁻⁴ 1.6x10⁻²
B&W B&W 0 0 2.3x10 3.4x10⁻³ 0 0 0 3.6x10⁻³
B&W GE 801 6.4x1&5' 1.8X10⁻³ 3.6x1(Y 4.6x10⁻³ LR31073 IWO10 1.2x10 B&W, SNPC 4,422 IWO10 8.6xIG03 4.74103 2.7x10² 7.7xl10 3 8.7xIG04 4.9x10 2
B&W WCFP 607 4.9xl10 5 LUxlO 3 3.6x10⁻³ 3.5xlG03 9.9,X10 4 LU510-4 9.6x10⁻³
NIPS ABB-CE 1,095 9.7xi(r-5 2.3x1(r 3 3.710-3 6.OxlO-3 LU710-3 2.3x10⁻⁴ 1.4102
NIPS B&W 595 5.Ox10-5 LUx1O 3 3.6410 IU31tY 3 9.4x10⁻⁴ 9x0 5 9.3x10⁻³
NIPS GE 860 6.x10-5 1.9,XI0 3 3.640-3 5.IXI10 3 L.410-3 2.7410 4 l.2x10-2
NIPS SNPC 4,216 2.5x10⁻⁴ 8.2x10⁻³ 4.6xl0 3 2.6x10⁻² 7.4410 3 8.34104 4.7x10⁻²
-4 NIPS WCFF 519 4.lxlO05
1.2X10³ 3.5x10⁻³
3.0x10⁻³
8Sx104
1.5x10⁴
8.8x10r3

AccidentRadiologicar Nouradiologicalb
Accident-Free Accident Air Pollution
Public Crew Public Crew Total Health Effecf
TabkG.1-7. Annual ReaUh Effects From 7hrnsporzWon of Fuel FeedMaterial and Low-Level Waste From the Bknding Plant to Deamation-Confinued
Destination Distance Origin (Ikm)
SRS ABB-CE 1,321 I.IX10-4
SRS B&W 705 5.7xlO-5 SRS GE 596 4.7xIO SRS SNPC 4,442 2.7xIO-4 SRS WCFF 98 7.7xlW6 Y-12 ABB-CE 948 7.6xlO--5 Y-12 B&W 526 4.4xIO-S Y-12 GE 791 6.3xIO-5 Y-12 SNPC 3,969 2.4xIO-4 Y-42 WCFF 450 3.6xIO-5
Uranyl Nitrate Hexahydrate (0-9-Percent Enrichment) Y-12 NTS 3,181 7.9xIG-5 SRS NTS. 3,654 9.6xlO-5 B&W NTS. 3,715 I.OXIO-4
NFS 3,428 9.2XIO-5 Uranium Henfluoridef (4-Percent Enridunent)
B&W ABB-CE 1,301 4.7xlO-5 D&W B&W 0 0 B&W GE 801 2.5il(Y-1 B&W .,.SNI)6 4.422 I.IX104
B&W 'WCFF .607 1.9XIO-5 NFS ABB-CE.- .1,095 3.8xIO-5 NFS B&W 595 2.OxIO NFS GE 860 2.7xIO-5 NFS SNPC 4,216 9.9XIO NFS WCFF 519 1.6xle
2.7xI01.6xlo-3 I.AxIO-3
8.6xlO-3 4.IxIO 1.9XIO-3
1.2xlO-3 1.7xjO-3 7.7xIO-3 I.IXIO-3
3.6xIO-3 4.1XIO-3
4.2xlo-3 3.8xIO
7.8xlO-4 6.5x1O-5 4.9xIO-4 2.5xlO-3 4.Ox1O 6.7xlO'4 3.9xIO-4 5.3xIO
3.5xIO-4
3.8xIO3.6xlO-3 3.6xIO-3 4.6x1O 3.4xlO-3 3.6xIO 3.SxIO-3 3.6xIO73 4.5xIO-3 3.5xIO-3
7.4xlO--' 4.IxICO 3.5xIO 2.7xlO-2 5.7xlO 4.7xlO-3 3.OxIO-3 4.6xjO-3 2.5xlO-2 2.6xlO-3
I.IXIO-2
LRIO 1.3xIO 1.2xlG-2
2.OxIO
0 l.3xjO-3
TWO 1.0XIO-3
l.7xlO-3
9.5xjO-4 1.4xl(r3
7.5xjO-3 8.6xlO-4
2.IxIO-3 l.2xlO-3 I.OXIO-3
7.8xIO-3 l.6xjO-4 l.3xjO-3 8.3xjO-4 1.3xlo-3 7.OxlO-3 7.3xlO-4
3.2xlO-3 3.7xIO-3 3.SxIO-3 3.4xIO-3
5.8XIO-4
0 3.7xIO-4
2.2xIO-3 2.8xlO-4 4.9xl(Y4 2.7xlQ4 4.lxlO 2.1xIO-3 2.4xIG4
3.5xIO-4
1.9XIO 1.9XIO-4
9.3xIO-4 3.2xIO
1.9XIO 8.1XIO-5 2.3xlb-4 7.8xlO-4 1.2xIO-4
2.8xIO-4 3.5xlO-4 5.lxlO-4 3.OxIO-4
8.9XIO-5 0
6.1x1O-5 2.5ilO 4.4xIO-5 6.6x1(YS
2.6xlO-5 7.6xlO--5 2.4xlO 4.4xIO-5
1.7xlO-?1.1XIO 9.6xlO-3 5.OxIO 4.6xlO-3 l.2xjO-2 8.7xIO-3 1.2xIO-2 4.5xlo-2 8.IXIO-3
2.IxIO-2 2.4xlO 2.4xle 2.2xle
4.6xIO-3
I.OXIO 3.3xlO
1.4xjO-2 2.8xIO-3 4.IXIO-3
2.7x1O-3 3.5xIO-3 I.AxIO-2 2.5xIO-3
2.SxIG-3 2.5xIO-3
2.6xIO-3
2.5xIO
1.OXIO-3
9.6xlO-4 1.()XIO-3
l.3xjO-3 I.OX10-3
1.IXIO-3
I.OXIO-3
I.OXIO-3
1.3xIO
I.OXIO

Table G.1-7. Annual Health Effects From Transportation of Fuel Feed Material and Low-Level Waste
From the Blending Plant to Destination-Continued
Radiologicala Nonradiologicalb
Accident Accident-Free Accident Air Pollution Total Health
Destination Distance Public. Crew Public Crew Effectc
Origin (km) Metalg (0.9-Percent Enrichment)
Y-12 NTS 3,181 1.2x10 4 5.2x10"3 3.6x10 3 1.7xi0"2 4.8x1O" 4.1x1O" 3.lxlO 2
[Text deleted.]
I Cancer fatalities. b Fatalities; C Esmated fatalities per year.
d There would be 70 shipments (truckloads) per year.
* There would be 40 shipments per year.
f There would be 20 shipments per year. 9 There would be 59 shlpments per year.
Note: ABB-CE=Asea Brown-Boveri Combustion Engineering- GE=General Electric Wilmington; SNPC=Siemans Nuclear Power Corporation; WCFF=Westinghouse Columbia Fuel
Facility. Source: RADTRAN m6del results.
Table G.1-8. Cwnulative Annual Health Impacts From Transportation of Highly Enriched Uranium and Other Materias
for Each Blending Option
%0
I
Radiologicala Nonradiologicalb Air
Accident Accident-Free Accident Pollution
Origin of Blending Conversion Blending Total Health
Material Site Site Destinatione Public Crew Public Crew Effectd
UNH Blending to Fuel Feed Material
Paducah GE B&W ABB-CE 1.7 xiO0 4.1x10"3 6.1x10"3 1.lx10.2 3.0x10"3 4.6x10"4 2.4x1( 2
Paducah GE B&W B&W 4.7x1O"5 1.6x10"3 5.6x10⁻³ 3.5x10"3 1.Ox10"3 1.5x10"4 12xL1 2
Paducah GE B&W GE 1.1xl0 4 3.1x10⁻³ 5.9x10 3 8.2x10 3 "2.3x1 3 3.6x10 4 2.OxlO 2
Paducah GE B&W SNPC 3.2x10 4 9.9x10 3 6.9x10 3 3.lxl0 2 8.7x10"3 1.0x10" 5."xl0 2
Paducah GE B&W WCFL• 9-6x10"5 2.7x10 3 5.8xi0"3 . 7.0x10⁻³ 2.Oxl0" 3.0x10 4 1.8x10 2
'-4
-I
-S

0
0
Paducah Paducah Paducah Padizcah Paducah Paducah Paducah Paducah Paducah Paducah Paducah Paducah Paducah Paducah Paducah Paducah Piketon Piketon Piketon Piketon Piketon Piketon
GE GE GE GE GE GE GE GE GE GE GE GE GE GE GE GE GE GE GE GE GE GE
B&W NFS NFS NFS NES NFS SRS SRS SRS SRS SRS Y-12 Y-12 Y-12 Y-12 Y-12 B&W B&W B&WB&W B&W NFS
WCFF ABB-cE B&W GE SNPC WCFF ABB-CE B&W GE SNPC WCFF ABB-cE B&W GE SNPC WCFF ABB-cE B&W GE SNPC WCFF AJBBcE
9.6x10'5
l.5x10-4
9.8xleY ul.210
3.0x10 4
8.9xltT 5
l.5X10 4
9.7xlO4 8.7xlOY 3.lxl10 4
4.8x10⁻⁵
1.2xl0 4
8.9x10⁻⁵
.l1X104
2.8x10⁻⁴
8.lxlo 5
l.7x10-4
4.9x10⁻⁵
l.1x10 3.3x10⁻⁴
9.8X10⁻⁵
1.5x10 4
2.7x10⁻³
3.6x10r3
2.7x10Y3
3.2xl10 3
2.5xlGY3
4.0x1073
2.8xl0' 3
2.64073 9.8Xl0 3
l.6x10-3
3.140O 2.5410 3
3.O40-3
8.9xi0-3
2.3410 3
4.lXIty 3
l.6xl10 3
9.9xltY 3
2.7410 3
3.7x10Y3
5.8XI10 3
6.OxlW3 5.8x10⁻³
5.9xlO-3 6.9xUT-3
:5.8x10³
6.0x10⁻³
5.8x10⁻³
5.8x10r3
6.9x10r3
5.6x10³
5.9x10³
5.8x10³
5.9x10³
6.8x10⁻³
5.8x1073
6.lXlOr3
:5.6xl03
5.9xjHY 3
7.OxlO-3
5.8x10³
6.Oxl(Y3
7.OxlO0 9.5XI10 3
6.8x10³
8.5xl10 3
3.Oxlt0 6.5xlo03
1.1XI10 2
7.3x10³
6.7x10⁻³
3.1x10²
3.9,x1- 3
8.Ox1O-3 6.2xitY 3
7.9x100 2.8x10T 5.9x1003
ul.10 3.6x10Y3
8.2x10³
3.lxlO0
9.6x10⁻³
2.Ox10O3
2.7x10⁻³
i.9Xi0O3
2.4x10⁻³
8.4x10⁻³
1.8x10⁻³
3.0x10⁻³
2.1xl10 3
l.9x10-3
8.7xjO- 3
2.3x10⁻³
2.2x10⁻³
7.9410 3
1.7x10 3
3.0xi0-3
2.3xlo03
8.7x10⁻³
2.0x10⁻³
2.7x10r3
3.OXlOA4
3.9x10⁴
2.57x10 4
4.2x10⁻⁴
3.8x10⁻⁴
5.0X10⁻⁴
3.4xlO-4
3.4x10Y4
l.8X10 4
3.4x10⁻⁴
3.8x10⁻⁴
9.2x10 4
2.7xlO~ 4.7x10⁻⁴
1.6x10⁻⁴
3.8x1lO4 i.OxiO-3
3.1x10⁻⁴
4.0x10⁴
l.8X10-2
2.2xl10 2
l.8X10 2
2.1x10⁴
5.6x10 2
l.7x102
2.5x1W2
1.9x10⁻²
l.8x102
5.8x10²
1.3x10⁻²
2.7x10⁻²
l.9XI10 2
5.3x10⁻²
l.6x10-2
2.OxlO-2
5.8x10⁻² 1.8x10² 2.3xl0-
2
TableG.1-8. Cwmdative Annual Health Impacts From Transortation of Highly Enriched Uranium and OilerMaterial for Each Blending Option-Continued
Radiologicala Nonradiologicalb
Air Accident Accident-Frie Accident Pollution
Origin of Blending Conversion Blending Total Health Material site site Destinatione Public Crew Public Crew Effect'
UNH Blending to Fuel Feed Material (Continued)

Table G.1-8. Cumulative Annual Health Impacts From Transportation of Highly Enriched Uranium and Other Materials for Each Blending Option-Continued
Radiologicala Nonradiologicaib Air
Accident Accident-Free Accident Pollution
Origin of Blending Conversion Blending Total Health
Material Site Site Destinationc Public Crew Public Crew Effectd
UNH Blending to Fuel Feed Material (Continued) 03181Piketon GE NFS B&W 9.9x10⁻⁵ 2.7x1(Y3 5.8x10 6.9x10⁻³ 2.Ox1003 2.6x10⁻⁴ 1.x
Piketon GE NFS GE l.2xl10 4 3.2x1(Y3 5.9XI10 3 8.6x10⁻³ 2.4xl(r3 4.4x10⁻⁴ 2.lxlO-2
Piketon GE NFS SNPC 3.0x10 4 9.5x1(Y3 6.9x10 3 3.Ox10-2 8.4xl10 3 1.0X10⁻³ 5.6x10⁻²
'Piketon GE NPS WCFF 9.lXl(Y 5 2.6x10⁻³ 5,8x10 3 6.6x10⁻³ 1.9X10⁻³ 3.2x10⁴ 1.7x10²
Piketon GE SRS ABB-CE 1.6x10⁻⁴ 4.OxlOf 6.lxlO3 u.xlO2 3.1x10⁻³ 5.1x1O-4 25x10'
Piketon GE SRS B&W q.9x1O-5 2.8x1(r 5.8X10⁻³ 7.4x10⁻³ 2.lx1O-1 3.5x1O74 1.9x10 2
Piketon G9 SRS GE 8.9x10⁻⁵ 2.6xl10 3 5.8xl10 3 6.8xl10 3 1.9x1(Y 3.6x1Oe 1.8x10 2
Piketon GE SRS SNPC 3.2x10⁻⁴ 9.9x1031 6.9x1(Y 3 3.1x10⁻² 8.7x10⁻³ 1.1X10⁻³ 5.8x10²
Piketon GE SRS WCFF 4.9x10 5 1.7x10 3 5.7x10⁻³ 3.9x10⁻³ 1.lxlO 3 l.9X1O-4 LW3x1 2
Piketon GE Y-12 ABB-CE l.2x10-4 3.lxlO3 5.9xl10 3 8.OxlI0 2.3xl10 3 3.5x10r4 2.OxlO0
Piketon GE Y-12 B&W 9.1x10 5 2.5x10⁻³ 5.8x10⁻³ 6.3xl10 3 1.8X1(Y 3 2.4xlOA4 1.7x10 2
Piketon GE Y-12 GE IXlO 4 3.0x10⁻³ 5.9x10⁻³ 7.9x1(Y 2.2x10⁻³ 3.9xlO-4 2.Oxl(Y2
Piketon GE Y-12 SNPC 2.8x10⁻⁴ 9.OxlO-3 6.8x10 3 2.8x10² 7.9x10Y 9.4xlO4 5.3x10⁻²
Piketon GE Y-12 WCFF 8.3x10⁵ 2A4xlO 3 5.7x10⁻³ :5.9x1&- 1.7X10⁻³ 2.8xlO~ 1 .6xl10 2
Hanford - B&W ABB-CE 2.3x1O-4 4.7xl(Y3 5.1x10³ 1.31(Y 3.7x1(Y 3 5.0x10⁻⁴ 2.7xl10 2
Hanford - B&W B&W 1.1X1O-4 2.2x10⁻³ 4.7xl10 3 6.1x10³' 1.7X10⁻³ 1.9XIO-4 1.5X10 2
Hanford - B&W GE L.7x1 4 3.7xl(Y3 4.9x10⁻³ 1.1x10 3.0x10³ 4.lxlO~ 2.3xlOY
Hanford - B&W SNPC 3.9x10r4 1.x1Oe 6.Ox1lO 3 3.3x10⁻² 9.4xl10 3 i.ixio~ 6.lxlO-2
Hanford - D&W WCFF l.6x104 3.3x10⁻³ 4.9x10⁻³ 9.5x1IY 2.7X'10-3 3.5x10⁴ 2.1xlO-2
Hanford - NFS ABB-CE 2.Ox10~ 4.lxlO-3 5.0x10⁻³ 1.2xl10 2 3.3x10 3 4.1x10⁻⁴ 2.5x10²
Hanford - NFS B&W 1.5x10 4 3.2x10⁻³ 4.8x10³ 9.0x10⁻³ 2.6x1(Y 3 2.7x10⁴ 2.OxlOr2
Hanford - NFS GE 1.710 3.7x10⁻³ 4.9x10⁻³ 1.lXl0-2 3.0x10⁻³ 4.5x10⁴ 2.3xl10 2
Hanford - NFS SNPC 3.5x10 4 1.OXl(Y 2 5.9x1& 3.2xl10 2 9.0x10-3 ix0 4 5.8x10⁻²
Hanford .- NES WCFF I.4x1O-4 3.Oxl(Y3 4.8xl0-3 8.7x1O-3 2.:5x10⁻³ 3.3xl10 4 2.OxlO2
Hanford - SRS ABB-CE 2.2x10 4 4.7x10⁻³ 5.lX1O' 3 1.4x10⁻² 3.8x10⁻³ 5.6x1O-4 2.8x10 2
Hanford - SRS - B&W 1.7xj0-4 3.5x10⁻³ 4.9x1O~ 1.0x10' 2.9x10⁻³ 4.Ox1O-4 2.2x10²
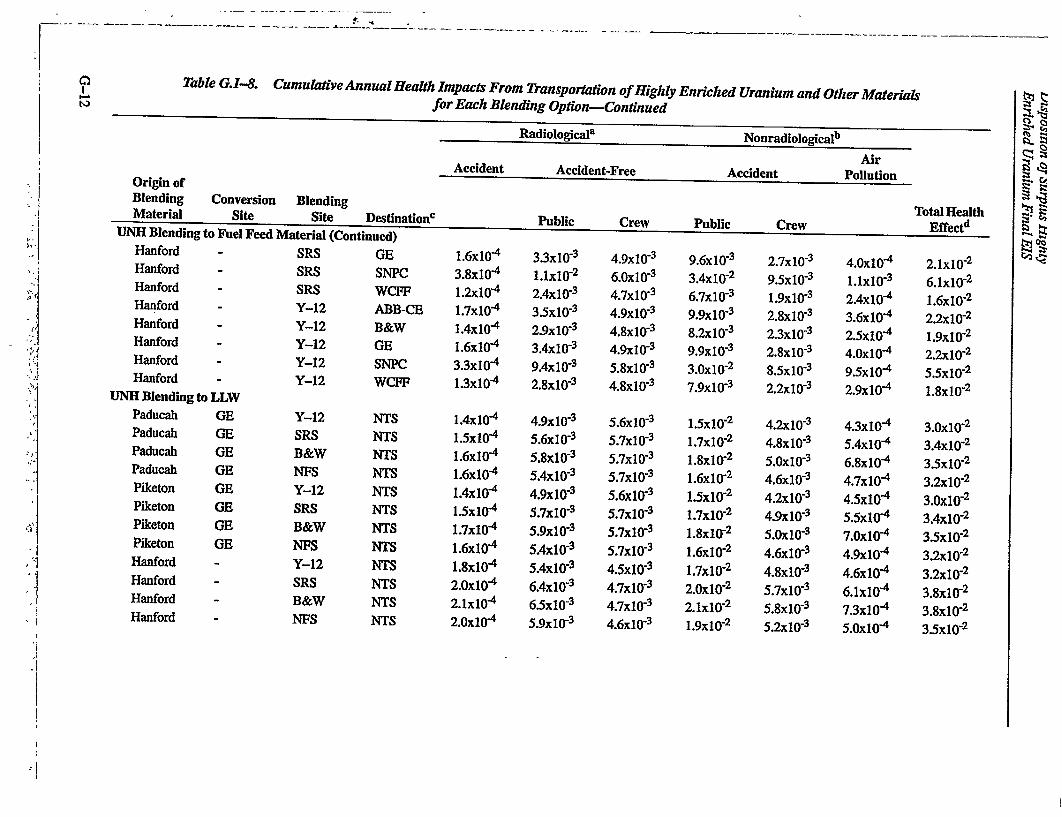
TabkG.1-8. CumukaveAnnuameauh impacts From 2)`ansP0Fftd0n Of HighlY Enriched Uranium and Other Materiah 1ý
fOr Each Blending OptIon-Continued
Radiologicala Nonradiologicalb
Accident Accident-Fre Air
Origin of e Accident Pollution
Blending Conversion Blending F Material Site Total Health Site Destinationc Public Crew Public Crew Effectd UNH Blending to Fuel Feed Material (Continued) Hanford - SRS GE 1.6xlo-4 Hanford - 3.3xlO 4.9xl0-I 9.6XIO-1 2.7xlO-3 4.OxIO IWO SRS SNPC 3.8xlO-4 I.IX10-2 -3 3.4xle 9.5XIO I.IX10 6.IxIO Hanford - SRS WCFF LWO 2.4xlO-3 4.7xlo-3 6.7xlO-3 j.qxl0-3 2.4x10⁻⁴ 1.6xlO-2 Hanford - Y-12 ABB-CE 1.7xlo-4 3.5xlO-3 4.9xlO-3 q.qxl0-3 2.8XIO-3 3.6xlO-4 2.2xio-2 Hanford - Y-12 B&W 1-4xlO"4 2.9xiGO 4.8xlO 8.2xlO-3 2.3xlO-3 2.5xI0-4 l.qxl0 Hanford - Y-12 GE l.6xj0-4 3.4xlO-3 4.9xio-3 q.qxl0-3 2.8xlO-3 4.0x10⁻⁴ IWO Hanford - Y-12 SNPC 3.3xlO-4 9.4xl0-3 5.8xl0-3 IWO 8.:5x,0-3 9.5xlO-4 5.5xlO-2 Hanford - Y-12 WCFF l.3xl0-4 2.8xlO-3 4.8xlO 7.9xlO-3 2.2xlO-3 2.9xlO-4 1.8x,0-2
UNH Blending to LLW Paducah GE Y-12 NTS 1.4xlO 4.9xlo-3 5.6xlO-3 I.SX10 4.2xio-3 4.3xlO-4 IWO Paducah GE SRS NTS 1.5xio-4 5.6xlO-3 5.7xlO-3 1.7xlo-2 4.8xlO-3 5.4xlO-4 3.4xlO-2 Paducah GE B&W NTS l.6xl0-4 5.8xlO-3 5.7xlo-3 1.8XIO-2 5.0xl0-3 6.8xlO-4 3.5xlO-2 Paducah GE NFS NTS 1.6XIO-4 5.4xI0-3 IWO 1.6x,0-2 4.6xlo-3 4.7xlO-4 3.2xlO-2 Piketon GE Y-12 NTS IAX10-4 4.9xlO 5.6xlO 1.5xlO-2 4.2xI0-3 4.5xI0-4 IWO Piketon GE SRS NTS 1.5xI04 5.7xlO-3 5.7xlO-3 1.7xlo-2 4.9xlO-3 5.5xlO-4 3.4xlO-2 Piketon GE B&W NTS 1.7x,0-4 5.9xlO-3 5.7xlG-3 1.8XIO 5.OxIO-3 7.0xl0-4 3.5xlO-2 Piketon GE NFS NTS 1.6XIO-4 5.4xI0-3 5.7xlo-3 1.6XIO 4.6xlO-3 4.9xle 3.2xlO-2 Hanford - Y-12 NTS 1.8xlO-4 5.4xj0-3 4.540-3 LA10-2 4.8xI0-3 4.6x,0-4 IWO Hanford - SRS NTS IWO 6.4xlO-3 4.7xio-3 2.0xl0-2 5.7xlO 6.lxlO 3.8xlO-2 Hanford - B&W NTS 2.IxIO-4 6.5xlO-3 4.7x,0-3 2.IxIO-2 5.8xlO-3 7.3xlO-4 3.8xlO-2 Hanford - NFS NTS 2.OxlO-4 5.9xlO-3 4.6xlO l.qxl0-2 5.2xio-3 5.0xl0-4 3.5xlO-2

Table G.1-8. CumulativeAnnual Health Impacts From Transportation of Highly Enriched Uranium and Other Materials for Each Blending Option-Continued
Radiological2 Nonradiologicalb Air
Accident Accident-Free Accident Pollution
Origin of Blending Conversion Blending Total Health Material Site Site DestinationC Public Crew Public Crew Effectd
UF6 Blending to Fuel Feed Material Paducah B&W ABB-CE 7.5x10"5 3.3x10 3 7.6x10"3 8.2x10"3 2.3x10 3 2.6x10"4 2.2x10"2
Paducah - B&W B&W 2.8xlO 5 2.6x10"3 7.4xlO 3 6.2x10 3 1.8x10"3 1.7x10 4 1.8x10⁻²
Paducah - B&W GE 5.4x10"5 3.0x10 3 7.5x10"3 7.5x10"3 2.1x10 3 2.3x10 4 2.lxlO2
Paducah - B&W SNPC l.x104 5.0x10"3 7.8x1l3 1.4xi0"2 4.0x10"3 4.2x10"4 3.1x10"2
Paducah - B&W WCFF 4.8x10"5 2.9x10 3 7.5x10"3 7.2x10 3 2.0x10 3 2.1xlO-4 2.0xl0 2
Paducah - NFS ABB-CE 5.9xi0"5 2.2xi0"3 7.4xi0"3 5.lxl10 3 1.4xi0"3 1.6x10⁻⁴ l.6x10 2
Paducah - NFS B&W 4.0x10"5 2.OxlO 3 7.3x10"3 4.3x10"3 l.2x1" 3 1.2x10⁻⁴ 1.5x10 2
Paducah - NFS GE 4.7x10"5 2.1x10"3 7.3x10"3 4.8x10"3 1.4x10"3 1.7x10"4 1.6x10 2
Paducah - NFS SNPC 1.2x10⁻⁴ 3.9x10"3 7.6x10 3 1.1x0 2 3.lxlO 3 3.3x10⁴ 2.6x10"2
Paducah - NFS WCFF 3.6x10"5 l.9x10"3 7.3x10"3 4.2x10"3 1.2xi" 3 1.4x10 4 1.5x10"2
Piketon - B&W ABB-CE 7.2x10"5 3.2x10"3 7.5x10"3 8.0xl0 3 2.3x10"3 2.7x10 4 2.lx10 2
Piketon - B&W B&W 2.6xi0"5 2.5x10⁻³ 7.4x10⁻³ 5.9x10"3 l.7x1O 3 1.8x10"4 1.8xlO 2
Piketon - B&W GE 5.1x10⁻⁵ 2.9x10⁻³ 7.5x10⁻³ 7.2x10 3 2.lxlt0 3 2.4x0O-4 2.0x0-2 Piketon - B&W SNPC 1.4x0 5 4.9x10"3 7.8x10"3 1.4xlO 2 3.9x10.3 4.3x10 4 3.lxl0"2
Piketon - B&W WCFF 4.5x10⁻⁵ 2.8xlO 3 7.5xl0 3 6.9x10"3 2.0xl0 3 2.2x10 4 1.9x10"2
Piketon - NFS ABB-CE 6.5x10"5 2.3x10"3 7.4x10"3 5.4x10"3 1.5x10 3 1.9x10⁻⁴ 1.7x10 2
Piketon - NFS B&W 4.7x40 5 2.1x10 3 7.3x1TR 3 4.6x10 3 l.3x10"3 1.5x10"4 1.6x10"2
Piketon - NFS GE 5.4x10 5 2.2x140 3 7.4x1O 3 5.lxlO03 lAx10i3 2.0x10⁴ 1.6x10"2
Piketon - NFS SNPC i.3x10-5 4.0x0-3 7.6x10 3 I.ixlO2 3.2x10 3 3.6xiO4 2.6x10 2
Piketon - NFS WCFF 4.3x10 5 2.0xi0-3 7.3x10"3 4.5x10"3 1.3x10 3 1x10⁻⁴ 1.5x10"2
Metal Blending to LLW Fernald Y-12 NTS 1.4x0-4 5.7xi0"3 6.2x10"3 1.8x10"2 5.0x10"3 4.4x10"4 3.5x10"2
[Text deleted.] C cancer fatalities.
b Fatalities. C Destination is either a fuel fabrication site or NTS for LLW.
0~t
-4 (b �1 C., -4
'-9 N
":3
-4
0

G.2 6M, TYPE B RADIOACTIVE MATERIALS SHIPMENT PACKAGING TEST SEQUENCE
In addition to meeting standards demonstrating it can withstand normal conditions of transport without loss or dispersal of its radioactive contents, the model 6M, Type B packaging used for Department of Energy (DOE) shipments must survive certain severe hypothetical accident conditions that demonstrate resistance to impact, puncture, fire, and, water submersion. Test conditions do not duplicate accident environments but, rather, produce damage equivalent to extreme and unlikely accidents. The 6M, Type B packaging is judged as surviving extreme sequential testing if it retains all its contents except for minuscule allowable releases, and the dose rate outside the packaging does not exceed 1 rem/hr at a distance of 1 m from the package surface. Drum sizes (outer package) can vary from 38 to 416 liters (10 to 110 gallons).
The complete sequence of tests is listed below:
" Drop Test. A 9-m (30-ft) drop onto a flat, essentially unyielding, horizontal surface, striking the surface in a position for which maximum damage is expected.
"* Puncture Test. A 1-m (40-inch) drop onto the upper end of a 15-centimeter (6-inch) diameter solid, vertical, cylindrical, mild steel bar mounted on an essentially unyielding, horizontal surface.
Thermal Test. An exposure for not less than 30 minutes to a heat flux not less than that of a radiation environment of 800 °C (1,475 'F) with an emissivity coefficient of at least 0.9.
Water-Immersion Test. A subjection to water pressure equivalent to immersion under a head of water of at least 15 m (50 ft) for not less than 8 hours.
The regulatory test conditions for the 6M, Type B packaging and other similar packaging are much more demanding than they might appear. For example, an impact on a very hard surface (desert caliche) at over 322 km/hr (200 mph) is not as likely to deform the packaging as would a drop of 9 m (30 ft) onto an unyielding target.
A typical 6M, Type B packaging approved for use by DOE is covered by Certificate of Compliance
I Number 9965, dated February 16, 1996.
The 6M, Type B packaging is made up of several component parts each playing an integral engineered role in containment and confinement of the radioactive material being shipped. The applicable DOE Safety Analysis Report for Packaging provides additional detail that shows that the package provides a high level of public safety regardless of the accidental conditions it might encounter during transportation. Although 6M, Type B packagings have been involved in severe accidents, the integrity of the packaging has never been compromised.
G-14
Disposition of Surplus Highly Enriched Uranium Final EIS
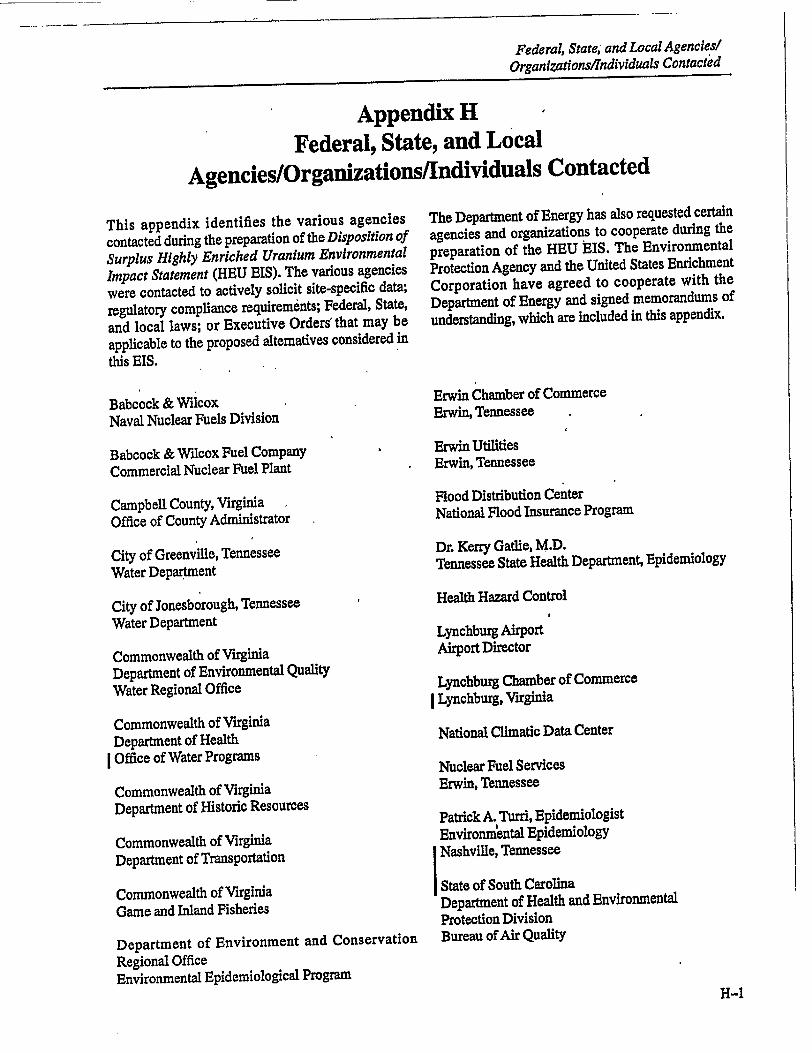
Federal, State; and Local Agencies/ Organizations/Individuals Contacted
Appendix H Federal, State, and Local
Agencies/Organizations/Individuals Contacted
This appendix identifies the various agencies contacted during the preparation of the Disposition of Surplus Highly Enriched Uranium Environmental Impact Statement (HEU EIS). The various agencies were contacted to actively solicit site-specific data;
regulatory compliance requirements; Federal, State, and local laws; or Executive Orders that may be
applicable to the proposed alternatives considered in this EIS.
Babcock & Wilcox Naval Nuclear Fuels Division
Babcock & Wilcox Fuel Company Commercial Nuclear Fuel Plant
Campbell County, Virginia Office of County Administrator
City of Greenville, Tennessee Water Department
City of Jonesborough, Tennessee Water Department
Commonwealth of Virginia Department of Environmental Quality Water Regional Office
Commonwealth of Virginia Department of Health Office of Water Programs
Commonwealth of Virginia Department of Historic Resources
Commonwealth of Virginia Department of Transportation
Commonwealth of Virginia Game and Inland Fisheries
Department of Environment and Conservation Regional Office Environmental Epidemiological Program
The Department of Energy has also requested certain agencies and organizations to cooperate during the
preparation of the HEU EIS. The Environmental Protection Agency and the United States Enrichment
Corporation have agreed to cooperate with the
Department of Energy and signed memorandums of
understanding, which are included in this appendix.
Erwin Chamber of Commerce Erwin, Tennessee
Erwin Utilities Erwin, Tennessee
Flood Distribution Center National Flood Insurance Program
Dr. Kerry Gatlie, M.D. Tennessee State Health Department, Epidemiology
Health Hazard Control
Lynchburg Airport Airport Director
Lynchburg Chamber of Commerce Lynchburg, Virginia
National Climatic Data Center
Nuclear Fuel Services
Erwin, Tennessee
Patrick A. Turri, Epidemiologist Environnmental Epidemiology I Nashville, Tennessee
State of South Carolina Department of Health and Environmental Protection Division Bureau of Air Quality
H-1

Disposition of Surplus Highly Enriched Uranium Final EIS
State of Tennessee Attorney General's Office Environmental Protection Division
State of Tennessee Department of Health and Environment
State of Tennessee Division of Underground Storage Tanks
I State of Tennessee Department of Transportation Map Sales Department
I State of Tennessee State Wildlife Division
Tn-Cities Airport FAA Airport Director
Unicoi County, Tennessee County Executive, Paul Monk
Unicoi County, Tennessee Department of Health
U.S. Department of Agriculture National Resources Conservation Service
U.S. Department of Agriculture Soil Conservation Service
U.S. Department of Commerce Federal Emergency Management Agency
H-2
U.S. Department of the Interior Geological Survey Nashville, Tennessee
U.S. Department of the Interior Geological Survey Reston, Virginia
U.S. Department of the Interior Geological Survey Richmond, Virginia
U.S. Department of the Interior National Park Service
* U.S. Department of Transportation Federal Aviation Administration
Virginia Game and Inland Fisheries
Virginia Polytechnic Institute and State University Department of Crop and Soil Environmental Sciences
Virginia Polytechnic Institute and State University Virginia Water Resources Research Center
Wayne Scott Scott's Farm Erwin, Tennessee

UNITED STATES ENVIRONMENTAL PROTECTION AGENCY
WASHINGTON, D.C. 20460
JUL2 196
ENFORCEMENTAND COMPLIACE ASSURANE
Mr. J. David.Nulton, Director NEPA Compliance and Outreach
'Office of Fissile Mater~ials Disposition U;S. Department of Energy .1000 Independence Avenue, S.W. Washington, D;C, 20585
Dear, Mr. Nulton:
Thank you for your letter dated May 2, 1995, inviting our participation as'a potential cooperating agency in the preparation of the Environmental Impact Statement (EIS) for the Disposition of Surplus. Highly "Enriched Uranium (AEU). We would be pleased to be a cooperating agency.
In order to define our specific involvement, we have enclosed a Memorandum of Understanding (MOU) to be signed by both agencies. This MOU has been coordinated by the staffs at EPA and DOE. After signature, we, request that the MOU be sent to the EPA point of contact. EPA Offfice of Federal Activities will distribute copies of the MOU internally.to the appropriate program offices.
In response to the questions posed in your May 2, 1995, memorandum, we offer the following response. We were, asked to comment on the issues-identified for analysis and if there were any additibnal issues. Concerning the'EIS alternatives, we suggest that DOE discuss: the form of the material, the location for treatment and storage of the material, any uses of the blended down material, and if applicable, how and where it will be disposed. Through the Clean Water Act Section 102, and the Safe Drinking Water Act Section 1428, staltes have developed comprehensive state groundwater protection programs and state wellhead protection programs to protect priority areas for future water supplies. We recommend that DOE work with the appropriate state agencies to ensure that adequate groundwater protection approaches are developed in determining the disposal and storage locations for the material.

We appreciate the opportunity to work along with DOE on this project. If you have any questions, please call me at'(202). 605053. Our staff contact on the issue is Susan Offerdalpat (202) 260-5059.
Sincerely,
/chard E. Sanderson irerctor
Office of Federal ActivitiesEnclosure

MEMORANDUM OF UNDERSTANDING BETWEEN THE DEPARTMENT OF ENERGY AND THE
ENVIRONMENTAL PROTECTION AGENCY AS A COOPERATING AGENCY ON THE ENVIRONMENTAL IMPACT STATEMENT FOR THE DISPOSITION OF SURPLUS HIGHLY ENRICHED URANIUM
The purpose of this document is to establish a framework for technical cooperation between the Department of.Energy (DOE) and the Environmental Protection Agency (EPA) concerning the 'developm6nt of the.Environmental Impact Statement (ETS) for the Disposition of Surplus Highly Enriched Uranium (HEU). DOE is the. lead agency and EPA is a cooperating'agency. When countersigned by both parties, the following paragraphs will provide the basis for the roles between the two agencies as they conduct technical coordination, on issues of 'mutual concern.
This memorandum of understanding .(MOU) pertains to the exchange of information on technical issues. It does not abrogate, alter, or'in any way niodify existing or future environmehtal compliance'or cleanup agreements, other enforceable agreements, any permitting or. regulatory requirement, or enforcement. actions. Further, it will not alter EPA's responsibilities. under the National Environmental. Policy Act (NEPA) and.Section 309 of the Clean Air Act to provide scoping comments and conduct an official review of the draft and final EIS. This MOU will in no way affect state actions" or policy with respect to specific DOE sites. Funds and other resoturces will not be.exchanged as a result of this MOU.
The DOE has responsibility for compliance with the requirements of NEPA andl preparation of the draft and final EIS. Accordingly, DOE agrees,
- to provide EPA 'withi EIS information on areas f6r which DOE would like EPA -technical review and comments. These areas include but are not limited to radiation; mixed waste, risk management, transportation, ground water, and NEPA implemdritation;
- to invite EPA to participate in internal and external meetings concerning areas that DOE would like EPA technical review 'and comments. These areas include; but are not limited to, radiation, mixed waste, ris'k management, transportation, .ground water, and NEPA implementation;
to provide copies of the draft and final EIS as soon as practical to allow EPA sufficient time to review and comment on these documents;
Enclosure
I

NOTE:% The meetings mentioned above will: assist EPA's understanding of the HEU" EIS. and related issues, assist DOE in early identification and resolution of EPA issues, and thereby expedite review of thb draft and final EIS.
to consult with EPA regarding mitigative measures to be included in the EIS;
-to indicate in the draft and final EIS cover page that EPA is a cooperating agenlcy. Also, the draft and final EIS will include, in the introductory section, a statement that describe's EPA's role as a cooperating agency, and EPA's NEPA and Section 309 CAA authorities.
The EPA agrees:
to assist DOE in.defining issues and concerns to be addressed in the EIS. This will be done as part of EPA's participation in document review meetings.
- to provide information in those areas that EPA has regulatory auth6rity and/or technical expertise, that include, but are not.limited to, radiation, mixed waste, risk management, transportation; ground water, and NEPA implementation.
- -to review and comment, in a timely manner, on those sections of the draft and final EIS document where EPA has specific technical. expertise and/or regulatory authority.
The Agency points of contact for this MOU are:
EPA DOE
Mr. Richard E. Sanderson Director Office of Federal Activities Environmental Protection Agency 401 M-Street, SW Washington, D.C. 20460
202-260-5053
Mr. J. David Nulton Director Office of NEPA Compliance and
Outreach Office of Fissile Materials Disposition Department of Energy 1000 Independence Avenue, SW Washington, D.C. 20585
202-586-4513
2

This agreement will be effective upon signature by both EPA and DOE. It can be modified by mutual agreement only and in writing. It can be terminated either when the NEPA process is completed (issuance of DOE's record of decision), or when written notice is given by either agency.
DOE Approval:
Richard E. Sanderson Director Office of Federal Activities Environmental Protection Agency 401 M Street, SW Washington, D.C. 20460
// 4 1oDavid Nulton
Director
Office of NEPA Compliance and Outreach
Office of Fissile Materials Disposition Department of Energy 1000 Independence Avenue, SW Washington, D.C. 20585
3
EPA Approval:

United States Enrichment Corporation
2 Democracy Center 6903 Rockledge Drive U -TQBethesda, MD 20817
lu os cTel: (301) 564-3200 Fax: (301) 564-3201
United States Enrichment Corporition
July 21, 1995
Mr. J. David Nulton Office of Fissile Materials Disposition (MD-I) Foirestal Building U. S. Department of Energy 1000 Independence A',enue S.W.. Washington, D.C. 20585
Dear Mr. Nulton:
Enclosed is the signed Memorandum of Understanding conberning cooperation on the Environmental Impact Statement for.Disposition of Highly Enriched Uranium. We look forward to working with your agency in this important endeavor.
Please cofitact me at (301) 564-3409 or Patrick Gorman at 564-3412, to discuss matters related to the addressed above.
Sincerely,
T. Michael Taimi Environmental Policies and Assurances Manager
Enclosure
Offices in Paducah. Kentucky Portsmouth, Ohio Washington, DC

MEMORANDUM OF.UNDERSTANDING .BETWEE.N THE DEPARTMENT OF ENERGY AND THE
UNITED STATES ENRICHMENT CORPORATION FOR COOPERATION ON THE PREPARATION OF AN ENVIRONMENTAL IMPACT STATEMENT FOR THE
DISPOSITION OF SURPLUS HIGHLY ENRICHED URANIUM.
July7, 1995
The purpose of, this document is to establish a framework for technical cooperation between the Department of Energy; (DOE) and the United States Enrichment Corporation (USEC) concerning the developmerit of.the Environmental Impact Staterhent (EIS) on the disposition of s urplUs highly enrilehd uranium described in DOE.s Notice of Intent published in the Federal Register. DOEis the lead agency in the preparatibn of this EIS, with USEC cooperating on relevant portions. When signed by both parties, the foll6wing paragraphs will govern the coordination between the'two agencies as they conduct technical coordination on issues of mutual concern.
This memorandum of understanding'(MOU) pertains to the exchange of infdrmation on technical issues. It does not abrogate, alter, or in any way modify existing or future agreements between DOE and USEC .or in any way alter their rights or responsibilities. DOE and USEC will each fund their oWn activities under this MOU and no funds and other resources will be exchanged as a result of this MOU.
The Department'has responsibility for compliance with the requirements of NEPA and preparation.of the draft and. final E18. Therefore, DOE agre'es.:
• To provide USEC with information'on areas for which DOE would like USEC technical review and comments.
To invite USEC to participate in internal and external meetings concerning scheduling and in areas for which DOE would like USEC technical review and comments. These technical areas include, but are not limited to, uranium.materials, blending services; and transpottation.
To provide copies of all drafts as soon as practical to.help allow USEC sufficient time to review and comment on these documents.
To consult with USEC regarding mitigative measures to be included in the EIS.

The USEC agrees:
To assist DOE in.defining issues.and concerns to be addressed in the EIS. This will be 'done as .part. of USEC's larticipation in document review meetings.
To, prbvide information in those areas tlhat USEC has responsibility and/or technical expertise.
" To review and .comment, in a timely rn'anner, on. all drafts of the EIS
document.
The agency point's of contact for this MOU are:
USEC DOE
Mr. T. Michael Taimi Environmental Assurance and Policies Manager.
United States Enrichment Corporatioh Two Democracy Center 6903 Rockledge Drive -Bethesda, Maryland 20817
(301) 564-3409
Mr. J, David Nulton Director; NEPA Compliance & Outreach Office of Fissile Materials Dispositibn U.S. Department of Energy 1000 Independence Avenue, S.W. Washington, D.C. 20585 -
(202) 586-4513
This agreement will be effective upon Signature of both USEC and DOE. It can be modified by mutual agreement only and in writing. It can be terminated either when the NEPA process is completed (issuance of DOE's record of. decision) or when written notice is give by either- agency.
USEC Approval: DOE Approval:
NIVd. David Nulton p artmrent of Energy
Mr. T. Michael Taimi United States Enrichment Corporation

Applicable Laws, Regulations, and Other Requirements
Appendix I Applicable Laws, Regulations, and Other Requirements
1.1 INTRODUCTION
This appendix identifies and presents the environmental standards and statutory requirements that may apply to the disposition of surplus highly enriched uranium (HEU). These statutes and regulations provide the standard against which to evaluate the ability of potential blending sites to meet environmental, safety, and health requirements.
Table I.1-1 lists applicable Federal environmental statutes, regulations, and Executive Orders for the
proposed action. The table also identifies the associated permit, approval, and consultation requirements generally required to implement any alternative. Table 1.1-2 lists applicable State environmental, safety, and health statutes and regulations for Tennessee, South Carolina, Virginia, North Carolina, Ohio, and Kentucky, and Table 1.1-3 provides a list of selected Department of Energy (DOE) environment, safety, and health orders.
1-1

Tabl L1-1. Federal Environmental Statutes, Reguations, and Orders t
Resource EIS-Level Potential Applicability: Permits, 9. Category Statute/Regulation/Order Citation Responsible Agency Approvals, Consultations, and Notifications 2.
Air Resources Clean AirAct, 42 USC 7401 et seq. Environmental Requires sources to meet standards and obtain permits to satisfy:. * as amended Protection Agency National Ambient Air Quality Standards, State Implementation i 63
(EPA) Plans, Standards of Performance for New Stationary Sources, (NESHAP), and Prevention of Significant Deterioration (PSD).
National Ambient Air Quality 42 USC 7409 et seq. EPA Requires compliance with primary and secondary ambient air quality Standards (NAAQS/State standards governing S02, NO,, CO, 03, Pb, and PM10 and emission t 4
Implementation Plans limits/reduction measures as designated in each state's State Implementation Plan.
Standards of Performance for 42 USC 7411 EPA Establishes control/emission standards and recordkeeping New Stationary Sources renuirements for new or modified sources Rnecificalev iddressed hv
National Emission Standards for Hazardous Air Pollutants (NESHAP)
Prevention of Significant Deterioration (PSD)
Noise ControlAct of 1972
Clean WaterAct
National Pollutant Discharge Elimination System (NPDES) (Section 402 of Clean Water Act)
Dredged or Fill Material (Section 404 of Clean Water ActlRivers and Harbors Appropriations Act of 1899)
42 USC 7412 EPA
42 USC 7470 et seq. EPA
42 USC 4901 et seq. EPA
33 USC 1251 et seq. EPA
33 USC 1342 EPA
33 USC 1344 U.S. Army Corps of 33 USC 401 et seq. Engineers
a standard. Requires sources to comply with emission levels of carcinogenic or
mutagenic pollutants; may require a preconstruction approval, depending on the process being considered and the level of emissions that will result from the new or modified source.
Applies to areas that are in compliance with National Ambient Air Quality Standards (NAAQS). Requires comprehensive preconstruction review and the application of Best Available Control Technology to major stationary sources (emissions of 100 tons/year) and major modifications; requires a preconstruction review of air quality impacts and the issuance of a construction permit from the responsible State agency setting forth emission limitations to protect the PSD increment.
Requires facilities to maintain noise levels that do not jeopardize the health and safety of the public.
Requires EPA or State-issued permits and compliance with provisions of permits regarding discharge of effluents to surface waters.
Requires permit to discharge effluents (pollutants) to surface waters and stormwaters; permit modifications are required if discharge effluents are altered.
Requires permits to authorize the discharge of dredged or fill material into navigable waters or wetlands and to authorize certain structures or work in or affecting navigable waters.
Water Resources

Table LI-i. Federal Environmental Statutes, Regulations, and Orders-Continued
Category Water
Resources (continued)
Statute/Regulation/Order Wild and Scenic Rivers Act
Safe Drinking Water Act
Executive Order 11988: Floodplain Management
Executive Order 11990: Protection of Wetlands
Compliance with Floodplain/ Wetlands Environmental Review Requirements
Resource Conservation and Recovery Act (RCRA)/ Hazardous and Solid Waste Amendments of 1984
Comprehensive Environmental Response, Compensation, and Liability Act of 1980 (CERCLA)ISuperfund Amendments and Reauthorization Act of 1986 (SARA)
Hazardous Wastes and Soil Resources
Citation 16 USC 1271 et seq.
42 USC 300f et seq.
3 CFR, 1977 Comp., p. 117
3 CFR, 1977 Comp., p. 121
10 CFR 1022
42 USC 6901 et seq./PL 98-616
42 USC 9601 et seqJPL 99-499
Responsible Agency Fish and Wildlife
Service (USFWS), Bureau of Land Management, Forest Service, National Park Service
EPA
Water Resources Council, Federal Emergency Management Agency, Council on Environmental Quality (CEQ)
U.S. Army Corps of EngineerslOSFWS
DOE
EPA
EPA
EIS-Level Potential Applicability: Permits, Approvals, Consultations, and Notifications
Consultation required before construction of any new Federal project associated with a river designated as wild and scenic or under study in order to minimize and mitigate any adverse effects on the physical and biological properties of the river.
Requires permits for construction/operation of underground injection wells and subsequent discharging of effluents to ground aquifers.
Requires consultation if project impacts a floodplain.
Requires Federal agencies to avoid the long- and short-term adverse impacts associated with the destruction or modification of wetlands.
Requires DOE to comply with all applicable floodplain/wetlands environmental review requirements.
Requires notification and permits for operations involving hazardous waste treatment, storage, or disposal facilities; changes to site hazardous waste operations could require amendments to RCRA hazardous waste permits involving public hearings.
Requires cleanup and notification if there is a release or threatened release of a hazardous substance; requires DOE to enter into Interagency Agreements with EPA and state to control the cleanup of each DOE site on the National Priorities List (NPL).
M~
ZZ

Table LI-1. Federal Environmental Statutes, Regulations, and Orders-Continued
1sUuUrce
Category Hazardous
Wastes and Soil Resources (continued)
Statute/Regulation/Order Community Environmental
Response Facilitation Act
Farmland Protection Policy Act of 1981
Federal Facility Compliance Act of 1992
Federal Land Policy and Management Act
Biotic Fish and Wildlife Resources Coordination Act
Bald and Golden Eagle Protection Act
Migratory Bird Treaty Act
Wilderness Act of 1964
Wild Free-Roaming Horses and Burros Act of 1971
Citation PL 102-426
7 USC 4201 et seq.
42 USC 6961
43 USC 1701
Responsible Agency EPA
Soil Conservation Service
States
Federal and State land planning agencies
16 USC 661 et seq. USFWS
16 USC 668 et seq. USFWS
16 USC 703 et seq. USFWS
16 USC 1131 et seq. Department of Commerce (DOC) and Department of Interior (DOI)
DOE shall consult with DOI and minimize impact.
EIS-Level Potential Applicability: Permits, Approvals, Consultations, and Notifications
Amends CERCLA (40 CFR 300) to establish a process for identifying, prior to the termination of Federal activities, property that does not contain contamination. Requires prompt identification of parcels that will not require remediation to facilitate the transfer of such property for economic redevelopment purposes.
DOE shall avoid any adverse effects to prime and unique farmlands.
Waives sovereign immunity for Federal facilities under RCRA and requires DOE to develop plans and enter into agreements with states as to specific management actions for specific mixed waste streams.
Requires Federal and/or State land-planning agencies to retain Federal ownership of public lands unless it is determined that disposal of such parcel will serve the national interest.
Requires consultation on the possible effects on wildlife if there is construction, modification, or control of bodies of water in excess of 10 acres in surface area.
Consultations should be conducted to determine if any protected birds are found to inhabit the area. If so, DOE must obtain a permit prior to moving any nests due to construction or operation of tritium supply and recycling facilities.
Requires consultation to determine if there are any impacts on migrating bird populations due to construction or operation of tritium supply and recycling facilities. If so, DOE will develop mitigation measures to avoid adverse effects.
DOE shall consult with DOCIDOI and minimize impact.
16 USC 1331 et seq. DOI

Table LI-i. Federal Environmental Statutes, Regulations, and Orders-Continued
Resource Category
Biotic Resources (continued)
Statute/Regulation/Order Endangered Species Act of
1973
Cultural National Historic Resources Preservation Act of 1966, as
amended ArchaeologicalandHistorical
Preservation Act of 1974
Archaeological Resources Protection Act of 1979
American Indian Religious Freedom Act of 1978
Worker Safety and Health
Native American Graves Protection and Repatriation Act of 1990
Executive Order 11593: Protection and Enhancement of the Cultural Environment
Occupational Safety and Health Act (OSHA)
OSHA Guidelines
Hazard Communication Standard
Atomic Energy Act of 1954
National Environmental Policy Act (NEPA)
42 USC 4321 et seq. CEQ
Other
'-4
Citation 16 USC 1531 et seq.
16 USC 470 et seq.
16 USC 469 et seq.
16 USC 470aa et seq.
42 USC 1996
25 USC 3001
3 CFR 154, 19711975 Comp., p. 559
5 USC 5108
29 USC 660
29 CFR 1910.1200
42 USC 2011
Responsible Agency USFWS/National
Marine Fisheries Service
President's Advisory Council on Historic Preservation
DOI
DOI
DOI
DOI
DOI
OSHA
OSHA
OSHA
DOE
EIS-Level Potential Applicability: Permits, Approvals, Consultations, and Notifications
Requires consultation to identify endangered or threatened species and their habitats, assess DOE impacts thereon, obtain necessary biological opinions and, if necessary, develop mitigation measures to reduce or eliminate adverse effects of construction or operation.
DOE shall consult with the State Historic Preservation Officer (SHPO) prior to construction to ensure that no historical properties will be affected.
DOE shall obtain authorization for any disturbance of archaeological resources.
DOE shall obtain authorization for any excavation or removal of archaeological resources.
DOE shall consult with local Native American tribes prior to construction to ensure that their religious customs, traditions, and freedoms are preserved.
DOE shall consult with local Native American tribes prior to construction to guarantee that no Native American graves are disturbed.
DOE shall aid in the preservation of historic and archaeological data that may otherwise be lost during construction activities.
Agencies shall comply with all applicable worker safety and health legislation (including guidelines of 29 CFR 1960) and prepare, or have available, Material Safety Data Sheets.
Agencies shall comply with all applicable worker safety and health legislation (including guidelines of 29 CFR 1960) and prepare, or have available, Material Safety Data Sheets.
DOE shall ensure that workers are informed of, and trained to handle, all chemical hazards in the DOE workplace.
DOE shall follow its own standards and procedures to ensure the safe operation of its facilities.
DOE shall comply with NEPA implementing procedures in accordance with 10 CFR 1021.
So,

Table Li-1. Federal Environmental Statutes, Regulations, and Orders-Continued Resource
EIS-Level Potential Applicability: Permits, Category Statute/Regulation/Order Citation Responsible Agency Approvals, Consultations, and Notifications Other Toxic Substances Control Act 15Usc2601etseq. EPA DOE shall comply with inventory reporting requirements and chemical (continued) (TSCA) control provisions of TSCA to protect the public from the risks of exposure to chemicals; TSCA imposes strict limitations on use and disposal of PCB-contarninated equipment. Hazardous Materials 49 USC 1801 et seq. Department of DOE shall comply with the requirements governing hazardous Transport Transportation materials and waste transportation.
Hazardous Materials Transportation Uniform Safety Act of 1990
Emergency Planning and Community Right-To-Know Act of 1986
Executive Order 12088: Federal Compliance with Pollution Control Standards
Executive Order 11514: Protection and Enhancement of Environmental Quality
Pollution Prevention Act of 1990
Executive Order 12114: Environmental Effects Abroad Major Federal Actions
Executive Order 12843: Procurement Requirements and Policies for Federal Agencies for OzoneDepleting Substances
(DOT) 49 USC 1801 DOT
42 USC 11001 et seq.
EPA
3 CFR, 1978 Comp., Office of Management p. 243 and Budget
3 CFR, 1966-1970 Comp., p. 902
42 USC 1100111050
January 4, 1979
April 21, 1993
CEQ
EPA
Department of State CEQ
EPA
Restricts shippers of highway route-controlled quantities of radioactive materials to use only permitted carriers.
Requires the development of emergency response plans and reporting requirements for chemical spills and other emergency release, and imposes right-to-know reporting requirements covering storage and use of chemicals which are reported in toxic chemical release forms.
Requires Federal agency landlords to submit to OMB an annual plan for the control of environmental pollution and to consult with EPA and State agencies regarding the best techniques and methods.
Requires Federal agencies to demonstrate leadership in achieving the environmental quality goals of NEPA; provides for DOE consultation with appropriate Federal, State, and local agencies in carrying out their activities as they affect the environment.
Establishes a national policy that pollution should be reduced at the source and requires a toxic chemical source reduction and recycling report for an owner or operator of a facility required to file an annual toxic chemical release form under Section 313 of SARA.
Enable responsible officials of Federal agencies having ultimate responsibility for authorizing and approving actions encompassed by this order to be informed of pertinent environmental considerations and to take such considerations into account, with other pertinent considerations of national policy, in making decisions regarding such actions.
Requires Federal agencies to minimize procurement of ozone depleting substances and conform their practices to comply with Title VI of Clean AirActAmendments reference stratospheric ozone protection and to recognize the increasingly limited availability of Class I substances until final phaseout.

Table LI-1. Federal Environmental Statutes, Regulations, and Orders-Continued
Resource Category
Other (continued)
Statute/Regulation/Order Executive Order 12856:
Federal Compliance with Right-To-Know Laws and Pollution Prevention Requirements
Executive Order 12873: Federal Acquisition, Recycling, and Waste Prevention
Executive Order 12898: Federal Actions to Address Environmental Justice in Minority Populations and Low-Income Populations
Nuclear Waste Policy Act of 1982
Executive Order 10480: Further Providing For the Administration of the Defense Mobilization Program
Executive Order 12148: Floodplain Management
Executive Order 12472: Assignment of National Security and Emergency Preparedness Telecommunications Functions-4
Citation August 3, 1993
October 20, 1993
February 11, 1994
42 USC 10101 et seq.
August 1953
July 20, 1979
April 3, 1984
Responsible Agency EPA
EPA
EPA
EPA
Federal Emergency Management Agency (FEMA)
FEMA
National Communication System (NCS)
EIS-Level Potential Applicability: Permits, Approvals, Consultations, and Notifications
Requires Federal agencies to achieve 50 percent reduction of agency's total releases of toxic chemicals to the environment and offsite transfers, to prepare a written facility pollution prevention plan not later than 1995, and to publicly report toxic chemicals entering any waste stream from Federal facilities, including any releases to the environment, and to improve local emergency planning, response, and accident notification.
Requires Federal agencies to develop affirmative procurement policies and establishes a shared responsibility between the system program manager and the recycling community to effect use of recycled items for procurement.
Requires Federal agencies to identify and address as appropriate, disproportionately high and adverse human health or environmental effects of its programs, policies, and activities on minority populations and low-income populations.
DOE shall dispose of radioactive waste per standards of 40 CFR 191.
Delegates to the Director, FEMA, with authority to redelegate, the priorities and allocation functions conferred on the President by Title I of the Defense Production Act of 1950, as amended.
Transferred functions and responsibilities associated with Federal emergency management to the Director, FEMA. The order assigns the director, FEMA, the responsibility to establish Federal policies for and to coordinate all civil defense and civil emergency planning, management, mitigation, and assistance functions of Executive Agencies.
Establishes the NCS. The NCS consists of the telecommunications assets of the entities represented on the NCS of Principals and an administrative structure consisting of the Executive Agent, the NCS Committee of Principals, and the Manager.
*4.
lLj
.4. N
C.2 C.2.

00
'-Executive Order 12580: Superfund Implementation
January 23, 1987 Var. Agencies
au -owylua management are considered for any action undertaken in a floodplain and that floodplain impacts be avoided to the extent practicable.
Delegates to the heads of executive departments and agencies the responsibility for undertaking remedial actions for releases, or threatened releases that are not on the National Priority List and removal actions other than emergencies where the release is from any facility under the jurisdiction or control of executive departments and agencies.agencies.
Table 1.-2. State Environmental Statutes, Regulations, and Orders Resource Category Legislation Citation Responsible Agency Oak Ridge
Reservation, and Nuclear Fuel Services,Tennessee
Air Resources Tenness Air Pdnlntinn ^ , ..--_ -- ... ........ .
Water Resources
Regulations
Tennessee Water Quality Control Act
Hazardous Wastes Tennessee Underground Storage Tank and Soil Resources Program Regulations
Tennessee Hazardous Waste Management Act
Tennessee Solid Waste Processing and Disposal Regulations
z1-Cmules, Division or IN Air Io'lution Control Air Pollution Board
TN Water Quality Control Board
TN Division of Underground Storage Tank Programs
TN Division of Solid Waste Management
TN Division of Solid Waste Management
"TN Code, Title 69, Chapter 3
TN Rules, Chapter 1200-1-15
TN Code, Title 68, *Chapter46
TN Rules, Chapter 1200-1-7
Potential Applicabilitylpermits
Permit required to construct, modify, or operate an air contaminant source; sets fugitive dust requirements.
Authority to issue new or modify existing NPDES permits required for a water discharge source.
Permit required prior to construction or modification of an underground storage tank.
Permit required to construct, modify, or operate a hazardous waste treatment, storage, or disposal facility.
Permit required to construct or operate a solid waste processing or disposal facility.
Table LI-1. Federal Environmental Statutes, Regulations, and Orders--Continued Resource
EIS-Level Potential Applicability: Permits, Category Statute/Regulation/Order Citation Responsible Agency Approvals, Consultations, and Notifications Other Executive Order 12656: May 24, 1977 Var. Agencies This order assigns emergency preparedness responsibilities to Federal (continued) Assignment of Emergency departments and agencies. Preparedness Responsibilities
Executive Order 11988: 3CFR, 1977 Comp., Var. Agencies Directs Federal agencies to establish procedures to ensure that the Floodplain Management p. 117 EPA notentin! effec.t! of•Ai•,A hI,,-". .. A . .
Potential Applicability/Permits

Table M1-2. State Environmental Statutes, Regulations, and Orders-Continued
Resource Category Biotic Resources
Cultural Resources
Worker Safety and Health
Legislation Tennessee State Executive Order on
Wetlands Tennessee Threatened Wildlife Species
Conservation Act of 1974 Tennessee Rare Plant Protection and
Conservation Act of 1985
Tennessee Water Quality Control Act
Tennessee Desecration of Venerated Objects
Tennessee Abuse of Corpse
Native American Indian Cemetery Removal and Reburial
Tennessee Protective Easements
No State-level legislation identified
Savannah RiverSite, South Carolina
Air Resources South Carolina Pollution Control Act! South Carolina Air Pollution Control Regulations and Standards
Augusta-Aiken Air Quality Control Region
South Carolina Atomic Energy and Radiation Control Act
SC Code, Title 48, Chapter 1
40 CFR 81.114
SC Department of Health and Environmental Control (SCDHEC)
SC and GA
SC Code, Title 13, SCDHEC Chapter 7
Permit required prior to construction or modification of an air contaminant source.
Requires Savannah River Site and surrounding communities in the 2-state region to attain NAAQS.
Establishes standards for radioactive air emissions.
'-4
�0
Citation TN State Executive
Order TN Code, Title 70,
Chapter 8 TN Code, Title 70,
Chapter 8-301 et seq.
TN Code, Title 69, Chapter 3
TN Code, Title 39, Chapter 17-311
TN Code, Title 39, Chapter 17-312
TN Comp. Rules and Regulations, Chapter 400-9-1
TN Code, Title 11, Chapter 15-101
Responsible Agency TN Division of Water
Quality Control TN Wildiife Resources
Agency
TN Wildlife Resources Agency
TN Division of Water Quality Control
TN Historical Commission
TN Historical Commission
TN Historical Commission
TN State Government
Potential Applicability/Permits Consultation with responsible agency.
Consultation with responsible agency.
Consultation with responsible agency.
Permit required prior to alteration of a wetland.
Forbids a person to offend or intentionally desecrate venerated objects including a place of worship or burial.
Forbids a person from disinterring a corpse that has been buried or otherwise interred.
Requires notification if Native American remains are uncovered.
Grants power to the state to restrict construction on land deemed as a "protective" easement

T I-
South Carolina Solid Waste Regulations SC Code, Title 61, Chapter 60
South Carolina Industrial Solid Waste SC Code, Title 61, Disposal Site Regulations Chapter 66
South Carolina Hazardous Waste SC Code, Title 44, Management Act Chapter 56
Biotic Resources
Cultural Resources
Worker Safety and Health
Babcock & Wilcox, Virginia
Air Resources
South Carolina Solid Waste Management Act
South Carolina Nongame and Endangered Species Conservation Act
South Carolina Institute of Archaeology and Anthropology
No State-level legislation identified
Virginia Air Pollution Control Law
SC Code, Title 44, Chapter 96
SC Code, Title 50, Chapter 15
SC Code, Title 60, Chapter 13-210
VA Code 10.1-1300 et. seq.
SCDHEC
SC Pollution Control Authority
SCDHEC
SCDHEC
SC Wildlife and Marine Resources Department
SC State Historic Preservation Office
VA Department of Air Pollution Control
Table L1-2. State Environmental Statutes, Regulations, and Orders-Continued Resource Category Legislation Citation Responsible Agency Pote, Water Resources South Carolina Pollution Control Act SC Code, Title 48, SCDHEC Permit reqi
Chapter 1 modificat South Carolina Water Quality Standards SC Code, Title 61, SCDHEC Permit reqi Chapter 68 modificat South Carolina Safe Drinking WaterAct SC Code, Title 44, SCDHEC Establishes Chapter 55 HazardousWastesand South Carolina Underground Storage SC Code, Title 44, SCDHEC Permit requ Soil Resources Tanks Act Chapter 2 modificat
tank. Permit required to store, collect, dispose, or
transport solid wastes. Permit required for industrial solid waste
disposal systems. Permit required to operate, construct, or
modify a hazardous waste treatment, storage, or disposal facility.
Establishes standards to treat, store, or dispose of solid waste.
Consult with SC Wildlife and Marine Resources Department and minimize impact.
Consult with SC State Historic Preservation Officer, and minimize impact.
Permit required for any new source; operating permit required for any non-exempt source; and performance, monitoring, and reporting required for both new and existing sources.
ntial Applicability/Permits uired prior to construction or ion of a water discharge source. tired prior to construction or ion of a water discharge source. drinking water standards.
aired prior to construction or ion of an underground storage
I ENý nt

Table L1-2. State Environmental Statutes, Regulations, and Orders-Continued
Resource Category
Water Resources
Hazardous Wastes and Soil Resources
Biotic Resources
Worker Safety and Health
Legislation State Air Pollution Control Regulations
State Water Control Law
Virginia Regulations
Virginia Waste Management Act
Virginia Waste Management Regulations
Virginia Erosion and Sediment Act
Virginia Endangered Species Act
Virginia Endangered Plant and Insect Species Act
Virginia Environmental Quality Act
State plan state; administers OSHA regulations
'-
Citation State Air Pollution
Control Board Regulations (SAPCBR) 120
VA Code 62.1
VA Code 680
VA Code 10.1
VR 672
VA Code 10.1-580-571
VA Code 29.1-563-570
VA Code 3.1-1020-1030
VA Code 10.1-1200-1221
NA
Responsible Agency VA State Air Pollution
Control Board
VA Department of Environmental Quality
VA Department of Environmental Quality
VA Waste Management Board
VA Department of Waste Management
VA Department of Conservation and Recreation
VA Department of Game and Inland Fisheries
VA Department of Agriculture and Consumer Services
VA Department of Environmental Quality
VA Department of Labor and Industry
Potential ApplicabilitylPermits Permit required for any new source; operating
permit required for any non-exempt source; and performance, monitoring, and reporting required for both new and existing sources.
Permits required for any discharges that fall under the VA NPDES program; VA Pollution Abatement program; Pretreatment program; and the VA Water Protection Program.
Permits required for any discharges that fall under the VA NPDES program; VA Pollution Abatement program; Pretreatment program; and the VA Water Protection Program.
Required to identify and properly store, transport, and dispose of hazardous wastes as identified by regulations.
Required to identify and properly store, transport, and dispose of hazardous wastes as identified by regulations.
Consultation with responsible agency.
Adoption of Federal list of threatened and endangered species. Consultation with responsible agency.
Requires contact with endangered species coordinator.
Consultation with responsible agency.
c�
.� Cb
(b
0

Table L1-2. State Environmental Statutes, Regulations, and Orders-Continued Resource Category Legislation Citation Responsible Agency Potential Applicability/Permits Cultural Resources Virginia Antiquities Act Section 2305 VA Department of Historic Makes it a felony to remove human remains
Resources from a grave without a court order or appropriate permit. Cave Protections Act VA Department of Protects all geological, biological, and
Conservation and historical features in caves from vandalism.
North Carolina Other Transportation
Ohio Other Transportation
Complies with Federal laws
Transportation of Hazardous Waste
Recreation, Natural Heritage Division
VA Division of Solid Waste Management
Ohio Administrative EPA Code
Required to properly manage hazardous waste transportation through use of registered haulers, manifests, and reeordkeeping.
Kentucky Other Transportation Transportation of Hazardous Waste 401 KAR; Chapter 33 Department of Required to properly manage hazardous waste
Environmental Protection transportation through use of registered -Division of Waste haulers, manifests, and recordkeeping.
Management
I I I3oý

Applicable Laws, Regulations, and Other Requirements
Table L1-3. Selected Department of Energy Environment, Safety, and Health Orders
DOE Order Order Title
1300.2A Department of Energy Technical Standards Program
1360.2B Unclassified Computer Security Program
3790.1B Federal Employee Occupational Safety and Health Program
4330.4B Maintenance Management Program
4700.1 Project Management System
5400.1 General Environmental Protection Program
5480.19 Conduct of Operations Requirements for DOE Facilities
5480.20A Personnel Selection, Qualification, and Training, Requirements for DOE Nuclear Facilities
5480.21 Unreviewed Safety Questions
5480.22 Technical Safety Requirements
5480.23 Nuclear Safety Analysis Reports
5482. 1B Environment, Safety, and Health Appraisal Program
5484.1 Environmental Protection, Safety, and Health Protection Information Reporting Requirements
5530.1A Accident Response Group
5530.3 Radiological Assistance Program
5530.4 Aerial Measuring System
5530.5 Federal Radiological Monitoring and Assessment Center
5630.12A Safeguards and Security Inspection and Assessment Program
5632.1C Protection and Control of Safeguards and Security Interests
5700.6C Quality Assurance
5820.2A Radioactive Waste Management
0 151.1 Comprehensive Emergency Management System [Text deleted.]
0 225.1 Accident Investigations 0231.1 Environment, Safety, and Health Reporting
0232.1 Occurrence Reporting and Processing of Operations Information
0420.1 Facility Safety 0425.1 Startup and Restart of Nuclear Facilities
0440.1 Worker Protection Management for DOE Federal and Contractor Employees [Text deleted.]
0451.1 National Environmental Policy Act Compliance Program
0460.1 Packaging and Transportation Safety
0 460.2 Departmental Materials Transportation and Packaging Management
0470.1 Safeguards and Security Program
1-13

United States Enrichment Corporation Privatization Act
Appendix J
United States Enrichment Corporation Privatization Act
[provisions pertaining to transfers and sales
of Russian and Department of Energy uranium]
H.R. 3019, BALANCED BUDGET DOWN PAYMENT ACT
(Public Law 104-134, signed April 26,1996)
TITLE III.-RESCISSIONS AND OFFSETS
CHAPTER 1-ENERGY AND WATER DEVELOPMENT
Subchapter A-United States Enrichment Corporation Privatization
SEC. 3101. SHORT TITLE.
This subchapter may be cited as the USEC
Privatization Act.
SEC. 3112. URANIUM TRANSFERS AND SALES.
(a) Transfers and Sales by the Secretary: The
Secretary shall not provide enrichment services or
transfer or sell any uranium (including natural
uranium concentrates, natural uranium hexafluoride,
or enriched uranium in any form) to any person except
as consistent with this section.
(b) Russian HEU:
(1) On or before December 31, 1996, the United
States Executive Agent under the Russian HEU
Agreement shall transfer to the Secretary without
charge title to an amount of uranium hexafluoride
equivalent to the natural uranium component of low
enriched uranium derived from at least 18 metric tons
of highly enriched uranium purchased from the
Russian Executive Agent under the Russian HEU
Agreement. The quantity of such uranium
hexafluoride delivered to the Secretary shall be based
on a tails assay of 0.30 [percent] U-235. Uranium
hexafluoride transferred to the Secretary pursuant to
this paragraph shall be deemed under United States
law for all purposes to be of Russian origin.
(2) Within 7 years of the date of enactment of this
Act, the Secretary shall sell, and receive payment for,
the uranium hexafluoride transferred to the Secretary
pursuant to paragraph (1). Such uranium hexafluoride shall be sold
(A) at any time for use in the United States for the
purpose of overfeeding;
(B) at any time for end use outside the United States;
(C) in 1995 and 1996 to the Russian Executive Agent
at the purchase price for use in matched sales pursuant to the Suspension Agreement; or,
(D) in calendar year 2001 for consumption by end
users in the United States not prior to January 1, 2002,
in volumes not to exceed 3,000,000 pounds U30 8
equivalent per year.
(3) With respect to all enriched uranium delivered to
the United States Executive Agent under the Russian
HEU Agreement on or after January 1, 1997, the
United States Executive Agent shall, upon request of
the Russian Executive Agent, enter into an agreement
to deliver concurrently to the Russian Executive
Agent an amount of uranium hexafluoride equivalent
to the natural uranium component of such uranium.
An agreement executed pursuant to a request of the
Russian Executive Agent, as contemplated in this
paragraph, may pertain to any deliveries due during
any period remaining under the Russian HEU
Agreement. The quantity of such uranium
hexafluoride delivered to the Russian Executive
Agent shall be based on a tails assay of 0.30 U-235.
J-1

Disposition of Surplus Highly Enriched Uranium Final EIS
Title to uranium hexafluoride delivered to the Russian Executive Agent pursuant to this paragraph shall transfer to the Russian Executive Agent upon delivery of such material to the Russian Executive Agent, with such delivery to take place at a North American facility designated by the Russian Executive Agent. Uranium hexafluoride delivered to the Russian Executive Agent pursuant to this paragraph shall be deemed under U.S. law for all purposes to be of Russian origin. Such uranium hexafluoride may be sold to any person or entity for delivery and use in the United States only as permitted in subsections (b)(5), (b)(6) and (b)(7) of this section.
(4) In the event that the Russian Executive Agent does not exercise its right to enter into an agreement to take delivery of the natural uranium component of any low-enriched uranium, as contemplated in paragraph (3), within 90 days of the date such lowenriched uranium is delivered to the United States Executive Agent, or upon request of the Russian Executive Agent, then the United States Executive Agent shall engage an independent entity through a competitive selection process to auction an amount of uranium hexafluoride or U308 (in the event that the conversion component of such hexafluoride has previously been sold) equivalent to the natural uranium component of such low-enriched uranium. An agreement executed pursuant to a request of the Russian Executive Agent, as contemplated in this paragraph, may pertain to any deliveries due during any period remaining under the Russian HEU Agreement. Such independent entity shall sell such uranium hexafluoride in one or more lots to any person or entity to maximize the proceeds from such sales, for disposition consistent with the limitations set forth in this subsection. The independent entity shall pay to the Russian Executive Agent the proceeds of any such auction less all reasonable transaction and other administrative costs. The quantity of such uranium hexafluoride auctioned shall be based on a tails assay of 0.30 U-235. Title to uranium hexafluoride auctioned pursuant to this paragraph shall transfer to the buyer of such material upon delivery of such material to the buyer. Uranium hexafluoride auctioned pursuant to this paragraph shall be deemed under United States law for all purposes to be of Russian origin.
(5) Except as provided in paragraphs (6) and (7), uranium hexafluoride delivered to the Russian Executive Agent under paragraph (3) or auctioned pursuant to paragraph (4), may not be delivered for consumption by end users in the United States either directly or indirectly prior to January 1, 1998, and thereafter only in accordance with the following schedule:
Annual Maximum Deliveries to End Users
(millions of lb Year U308 equivalent) 1998 2 1999 4 2000 6 2001 8 2002 10 2003 12 2004 14 2005 16 2006 17 2007 18 2008 19
2009 and each year 20 thereafter
(6) Uranium hexafluoride delivered to the Russian Executive Agent under paragraph (3) or auctioned pursuant to paragraph (4) may be sold at any time as Russian-origin natural uranium in a matched sale pursuant to the Suspension Agreement, and in such case shall not be counted against the annual maximum deliveries set forth in paragraph (5).
(7) Uranium hexafluoride delivered to the Russian Executive Agent under paragraph (3) or auctioned pursuant to paragraph (4) may be sold at any time for use in the United States for the purpose of overfeeding in the operations of enrichment facilities.
(8) Nothing in this subsection (b) shall restrict the sale of the conversion component of such uranium hexafluoride.
(9) The Secretary of Commerce shall have responsibility for the administration and enforcement of the limitations set forth in this subsection. The Secretary of Commerce may require any person to
J-2

United States Enrichment Corporation Privatization Act
provide any certifications, information, or take any action that may be necessary to enforce these limitations. The United States Customs Service shall maintain and provide any information required by the Secretary of Commerce and shall take any action requested by the Secretary of Commerce which is necessary for the administration and enforcement of the uranium delivery limitations set forth in this section.
(10) The President shall monitor the actions of the United States Executive Agent under the Russian HEU Agreemint and shall report to the Congress not later than December 31 of each year on the effect the low-enriched uranium delivered under the Russian HEU Agreement is having on the domestic uranium mining, conversion, and enrichment industries, and the operation of the gaseous diffusion plants. Such report shall include a description of actions taken or proposed to be taken by the President to prevent or mitigate any material adverse impact on such industries or any loss of employment at the gaseous diffusion plants as a result of the Russian HEU Agreement.
(c) Transfers to the Corporation:
(1) The Secretary shall transfer to the Corporation without charge up to 50 metric tons of enriched uranium and up to 7,000 metric tons of natural uranium from the Department of Energy's stockpile, subject to the restrictions in subsection (c)(2).
(2) The Corporation shall not deliver for commercial end use in the United States-.
(A) any of the uranium transferred under this subsection before January 1, 1998;
(B) more than 10 percent of the uranium (by uranium hexafluoride equivalent content) transferred under this subsection or more than 4,000,000 pounds, whichever is less, in any calendar year after 1997; or
to time, sell natural and low-enriched uranium (including low-enriched uranium derived from highly enriched uranium) from the Department of Energy's stockpile.
(2) Except as provided in subsections (b), (c), and (e), no sale or transfer of natural or low-enriched uranium shall be made unless
(A) the President determines that the material is not necessary for national security needs,
(B) the Secretary determines that the sale of the material will not have an adverse material impact on the domestic uranium mining, conversion, or enrichment industry, taking into account the sales of uranium under the Russian lHEU Agreement and the Suspension Agreement, and
(C) the price paid to the Secretary will not be less than the fair market value of the material.
(e) Government Transfers: Notwithstanding subsection (d)(2), the Secretary may transfer or sell enriched uranium
(1) to a Federal agency if the material is transferred for the use of the receiving agency without any resale or transfer to another entity and the material does not meet commercial specifications;
(2) to any person for national security purposes, as determined by the Secretary; or
(3) to any State or local agency or nonprofit, charitable, or educational institution for use other than the generation of electri6ity for commercial use.
(f) Savings Provision: Nothing in this subchapter shall be read to modify the terms of the Russian HEU Agreement.
(C) more than 800,000 separative work units contained in low-enriched uranium transferred under this subsection in any calendar year.
(d) Inventory Sales:
(1) In addition to the transfers authorized under subsections (c) and (e), the Secretary may, from time
J-3

Index
Index
A accident history 3-33, 3-67, 3-95, 3-119 Aiken County 3-43, 3-51, 3-57, 3-61, 3-65 Aiken, South Carolina 1-4, 2-32, 3-43, 3-5 1,
3-56, 3-58, 3-61, 3-65 air quality 3-1, 3-13, 3-49, 3-80, 3-102, 4-2,
4-15,4-23,4-49,4-67,4-79,4-125,4-146, C-I, C-10
Air Quality Control Region (AQCR) 3-13, 3-49, 3-81, 3-102
Allendale County 3-43, 3-57, 3-61, 3-65 alternatives eliminated 2-9 ambient air quality 3-49, 3-81 American Society for Testing Materials (ASTM)
1-3, 2-2 Amherst County 3-88, 3-90 Anderson County 3-13, 3-26 Appalachian Mountains 3-97 Appomattox County 3-88 aquatic resources 3-24, 3-59, 3-87, 4-5 assumptions 2-12, 2-20 Atomic Energy Commission 3-43, 4-148 Augusta, Georgia 3-43, 3-52, 3-61, 3-65
B Babcock & Wilcox (B&W) 1-4,2-33,3-74,4-29,
4-53, 4-66,4-77,4-103, 4-123, 4-125, 4-133, 4-134, 4-141, C-7
Bamberg County 3-61, 3-65 Barnwell County 3-43, 3-57, 3-61 baseline characteristics 3-12, 3-49, 3-80, 3-102 Bear Creek 3-15, 3-19, 3-24, 3-25 biotic resources 3-2, 3-20, 3-58, 3-87, 3-110,
4-4,4-17,4-30,4-54,4-67,4-84, D-1 blending 1-2, 1-4, 1-6, 1-12, 2-2, 2-4, 2-10,
2-11, 2-14,2-31, 2-34, 4-109, 4-142 Bureau of Land Management 3-10, 4-I
C Campbell County 3-74, 3-81, 3-86, 3-88, 3-90 Campbell County Health Department 3-95 chemical environment 3-32, 3-67, 3-94, 3-117 Clean Air Act 1-1, 3-101, 4-2 Clean Water Act (CWA) 3-80, 3-101, 4-5 climatology 3-13, 3-49, 3-102, C-1, C-5, C-7,
C-9 ClinchRiver 3-10, 3-13, 3-15, 3-18, 3-24, 3-25,
3-30, 4-25,4-83
commercial material 1-6, 2-3, 2-16, 2-18 Commercial Nuclear Fuel Plant (CNFP) 3-74,
3-78, 3-85 community services 3-26, 3-61, 3-90, 3-114 Comprehensive Environmental Response,
Compensation, and Liability Act (CERCLA) 3-10, 3-18, 3-48, 3-68,4-28,4-83
Council on Environmental Quality (CEQ) 1-1, 3-78,3-101,4-5
CSX Transportation (CSXT) 3-30, 3-65, 3-80, 3-93,3-97,3-99,3-102, 3-108,4-30,4-54
cultural resources 3-3, 3-25, 3-60, 3-87, 3-111, 4-5,4-17
D Department of Energy (DOE) 2-1, 3-10, 3-46 depleted uranium (DU) 1-2 disposition 1-1, 1-3, 1-4, 1-8, 1-9, 2-1, 2-2,
2-3, 2-4,2-7,2-36
E East Fork Poplar Creek 3-15, 3-18, 3-24, 4-27,
4-28,4-82,4-83 emergency preparedness 3-33, 3-68, 3-95, 3-119 Endangered Species Act 3-2, 3-3, 3-25, 3-59, 4-5 enrichment 1-2, 1-7, 2-2, 2-10, 2-11, 2-12,
2-13 environmental justice 4-7, 4-159 Environmental Protection Agency (EPA) 1-1, 3-2,
3-10, 3-12,3-41, 3-48, 3-56, 3-68, 3-72, 3-120,4-2,4-9,4-10
Environmental Regulatory Setting 3-10, 3-48, 3-78, 3-101
Erwin, Tennessee 1-4, 2-34, 3-97, 3-99, 3-101, 3-106, 3-108, 3-111, 3-112, 3-114, 3-119, 3-120,4-29,4-53
F facility accidents 4-9, 4-11, 4-32, 4-58, 4-68,
4-86 Federal Facility Compliance Agreement (FFCA)
3-11, 3-12,3-34, 3-41, 3-48, 3-49, 3-68, 3-69,3-72,4-21
Fernald, Ohio 2-14 Fissile Materials Disposition Program 1-8 floodplains 4-3 Fourmile Branch 3-52, 3-56, 3-60, 4-28 fuel fabrication 1-4, 2-4, 2-22
IX-!

Disposition of Surplus Highly Enriched Uranium Final EIS
G geology 3-2, 3-20, 3-58, 3-86, 3-110,4-4,4-17 groundwater 3-19, 3-56, 3-84, 3-108, 4-3, 4-4,
4-16, 4-28, 4-29, 4-30, 4-53, 4-54, 4-83
H Hanford Site 2-14, 4-109 Hazardous and Toxic Chemical Consequences 4-9,
4-10,4-32,4-58,4-68,4-86 hazardous waste 3-41, 3-72, 3-96, 3-120 health effects studies 3-33, 3-67, 3-95, 3-119 high-level waste (HLW) 3-34, 3-69, 3-95, 3-119 highly enriched uranium (HEU) 1-2, 1-13, 4-22,
4-103,4-142,4-152 historic resources 3-25, 3-60, 3-87, 3-111, 4-6 Housing 3-26, 3-61, 3-90, 3-112 Human Health 4-142
I Industrial Source Complex Short-Term Model
(Version 2) (ISCST2) 4-2, 4-9, 4-10 intersite transportation 4-95 irradiated fuel 1-6
3 James River 3-74, 3-78, 3-80,3-81, 3-83,3-85,
3-86, 3-87, 3-88, 3-93, 3-96, 4-29, 4-53 Joint Statement between the United States andRussia
on Nonproliferation of Weapons of Mass Destruction and the Means of Their Delivery 2-1,
Jonesborough, Tennessee 3-103, 4-54
K Kazakhstan, Republic of 1-13
L land resources 3-1, 3-7, 3-43, 3-74, 3-97, 4-1,
4-15 Land Use 3-7, 3-43, 3-74, 3-97 Limited Commercial Use 1-6, 2-8, 4-118 local transportation 3-30, 3-65, 3-90, 3-114 low-enriched uranium (LEU) 1-2, 4-22, 4-142 low-level waste (LLW) 3-34, 3-69, 3-95, 3-119 Lynchburg, Virginia 1-4, 2-33, 3-74,3-78, 3-81,
3-83, 3-87, 3-88, 3-90, 3-93, 3-96
M Martin Creek 3-97, 3-99, 3-103, 3-106, 3-111,
4-30,4-54 Maximum Commercial Use 1-6, 2-9,4-119 metal blending 1-4, 4-79 meteorology 3-13, 3-49, 3-102
IX-2
methodology 4-1, 4-95 mixed low-level waste 3-41, 3-72, 3-96, 3-120
N National Ambient Air Quality Standards (NAAQS)
3-13, 3-49, 3-81, 3-102, 4-25, 4-51 National Emission Standards for Hazardous Air
Pollutants (NESHAP) 4-2 National Environmental Policy Act (NEPA) 1-1,
1-8 National Pollutant Discharge Elimination System
(NPDES) 3-15, 3-32, 3-41, 3-56, 3-67, 3-72, 3-80,3-83,3-94,3-96,3-101,3-106,3-118, 3-119, 3-120,4-3,4-27, 4-28,4-29,4-30, 4-53,4-54,4-83
National Primary and Secondary Ambient Air Quality Standards 4-2
National Priorities List 3-10, 3-48, 3-68 Native American resources 3-26, 3-60, 3-88,
3-112,4-6 natural uranium (NU) 1-2, 4-158 No Action Alternative 1-6, 2-8, 4-14, 4-117 No Commercial Use 1-6, 2-8, 4-117 noise 3-1, 3-13, 3-49, 3-80, 3-102, 4-2, 4-3,
4-15,4-23,4-25,4-49,4-52,4-79,4-81, 4-125
Nolichucky River 3-97, 3-103, 3-106, 3-108, 3-110,3-111, 3-119, 3-120,4-30,4-53, 4-54
I
non-commercial material 2-3, 2-47, 2-19 nonhazardous waste 3-42, 3-72, 3-96, 3-120 Nonproliferation and Export Control Policy 2-29 North Augusta, South Carolina 3-52 North Indian Creek 3-103, 3-106 Nuclear Fuel Services, Inc. (NFS) 1-4, 2-34, 3-97,
4-29, 4-48, 4-53, 4-66, 4-78, 4-103, 4-123, 4-125, 4-133, 4-135, 4-141, C-9
Nuclear Regulatory Commission (NRC) 2-15, 2-29, 2-31, 2-34, 2-35, 3-5, 3-78, 3-80, 3-95, 3-99, 3-101, 3-119, 3-120, 4-2, 4-40
Nuclear Waste Policy Act 1-7, 1-8
0 Oak Ridge Reservation (ORR) 1-4, 2-31, 3-5,
4-25,4-47,4-77,4-82,4-122,4-123,4-125, 4-131, 4-133, 4-135
Oak Ridge Reservation Annual Site Environmental Report for 1993 3-31
OakRidge, Tennessee 1-4,2-31,3-5,3-13,3-20, 3-30
Occupational Health Risks 4-10

Index
Occupational Safety and Health Administration (OSHA) 3-119,4-10,4-25,4-32,4-52,4-82
Office of Fissile Materials Disposition 1-8, 1-13 off-spec material 1-3, 2-3, 2-16, 2-18 Openness Initiative 1-2, 1-4
P Paducah, Kentucky 2-14,4-109 paleontological resources 3-26, 3-60, 3-88,
3-112,4-6 Pantex Plant 3-46 Piketon, Ohio 4-109 Pollution Prevention 3-12, 3-49, 3-80, 3-102 Poplar Creek 3-15 Population 3-26, 3-61, 3-90, 3-112 Portsmouth, Ohio 2-14 Preferred Alternative 1-3, 1-6, 1-7, 1-8, 2-9 prehistoric resources 3-25, 3-60, 3-87, 3-111,
4-6 proliferation 1-1, 1-2, 1-10, 1-12 Proposed Action 1-2, 1-3, 2-9, 4-155 public and occupational health 3-4, 3-31, 3-65,
3-93, 3-117, 4-7, 4-17, 4-32, 4-55, 4-67, 4-85, 4-135, E-1
public health risks 4-8
R radiation environment 3-31, 3-93, 3-117 radiological impacts 4-10, 4-32, 4-55, 4-68,
4-85 regional economy characteristics 3-26, 3-61, 3-88,
3-112 Resource Conservation and Recovery Act (RCRA)
3-10, 3-11, 3-41, 3-48, 3-68, 3-72, 3-101, 4-21,4-47
Russia 4-152
S Safe Drinking Water Act 3-2 Savannah River 3-52, 3-56, 3-58, 3-59, 3-60,
3-65,4-28 Savannah River Site (SRS) 1-4,2-32,3-43,4-28,
4-47,4-77,4-103,4-122,4-124,4-125, 4-132, 4-134,4-135
Savannah River Site Environmental Report for 1993 3-66
Savannah River Valley 3-43 screening criteria 1-9, 2-1 site description 3-10, 3-46, 3-78, 3-99 site infrastructure 3-1, 3-10, 3-46, 3-78, 3-99,
4-2,4-15,4-23,4-49,4-67,4-79,4-123
socioeconomics 3-3, 3-26, 3-61, 3-88, 4-6, 4-17, 4-31, 4-54, 4-67, 4-84, 4-133, F-1
soils 3-2, 3-20, 3-58, 3-86, 3-110, 4-4, 4-17 South Carolina Department of Health and
Environmental Control 3-69 spent fuel 1-7, 1-8, 1-12, 2-3 Storage and Disposition of Weapons-Usable Fissile
Materials Programmatic Environmental Impact Statement (Storage and Disposition PEIS) 1-1, 1-8, 1-9, 1-10, 2-1, 2-8, 4-122, 4-123
Substantial Commercial Use 1-6, 2-9, 4-118 surface water 3-13, 3-52, 3-81, 3-103, 4-3,
4-15,4-25,4-28, 4-29,4-53,4-82
T Tennessee Department of Environment and
Conservation (TDEC) 3-13, 3-15, 3-33, 3-34, 3-101, 3-106, 3-111, 3-119, 4-25,4-51
Tennessee River 3-15 Tennessee River Basin 3-103 Tennessee Water Quality Standards 3-106 terrestrial resources 3-24, 3-58, 3-87, 3-111, 4-5 threatened and endangered species 3-25, 3-59,
3-87,3-111,4-5 Toxic Substance Control Act (TSCA) 3-12, 3-13,
3-41, 3-49 transuranic waste (TRU) 3-34, 3-69, 3-95, 3-119
U U.S. Department of Agriculture 3-110 U.S. Department of Housing and Urban
Development 3-83 U.S. Fish and Wildlife Service 3-2, 4-5 U.S. Forest Service 3-43 U.S. Naval Reactor Program 3-97, 3-99 Unicoi County 3-97, 3-102, 3-103, 3-112, 3-114 Unicoi County Health Department 3-119 United States Enrichment Corporation (USEC) 1-1,
1-6,4-158 uranium 4-148 uranium hexafluoride (UF6) 1-4, 2-25, 4-49, uranyl nitrate hexahydrate (UNH) 1-4,2-20, 4-22,
4-67
V Virginia Department of Environmental Quality
3-83, 3-95 Virginia State Water Control Board 3-83 visual resources 3-7, 3-43, 3-74, 3-97
IX-3

Disposition of Surplus Highly Enriched Uranium Final EIS
W waste management 3-4,3-34,3-68, 3-95, 3-119,
4-11, 4-20, 4-42, 4-61, 4-72, 4-88, 4-135 Water Quality Control Act 3-18, 3-106 water resources 3-2, 3-13, 3-52, 3-81, 3-103,
4-3, 4-15,4-25, 4-53,4-67,4-82,4-131 weapons-usable fissile material 1-2 wetlands 3-24, 3-59, 3-87, 3-111, 4-5
Y Y-12 Plant 1-4, 2-31, 3-7, 4-14, 4-103, 4-107
IX-4
Office of Fissile Materials Disposition, MD-4 United States Department of Energy 1000 Independence Avenue, SW Washington, D.C. 20585
Official Business Penalty for Private Use $300