APPENDIX A COVER - Test Valley
25
Appendix A Household and Travel to Work Movements Between Key Settlements
Transcript of APPENDIX A COVER - Test Valley
Appendix A Household and Travel to Work Movements Between Key
Settlements
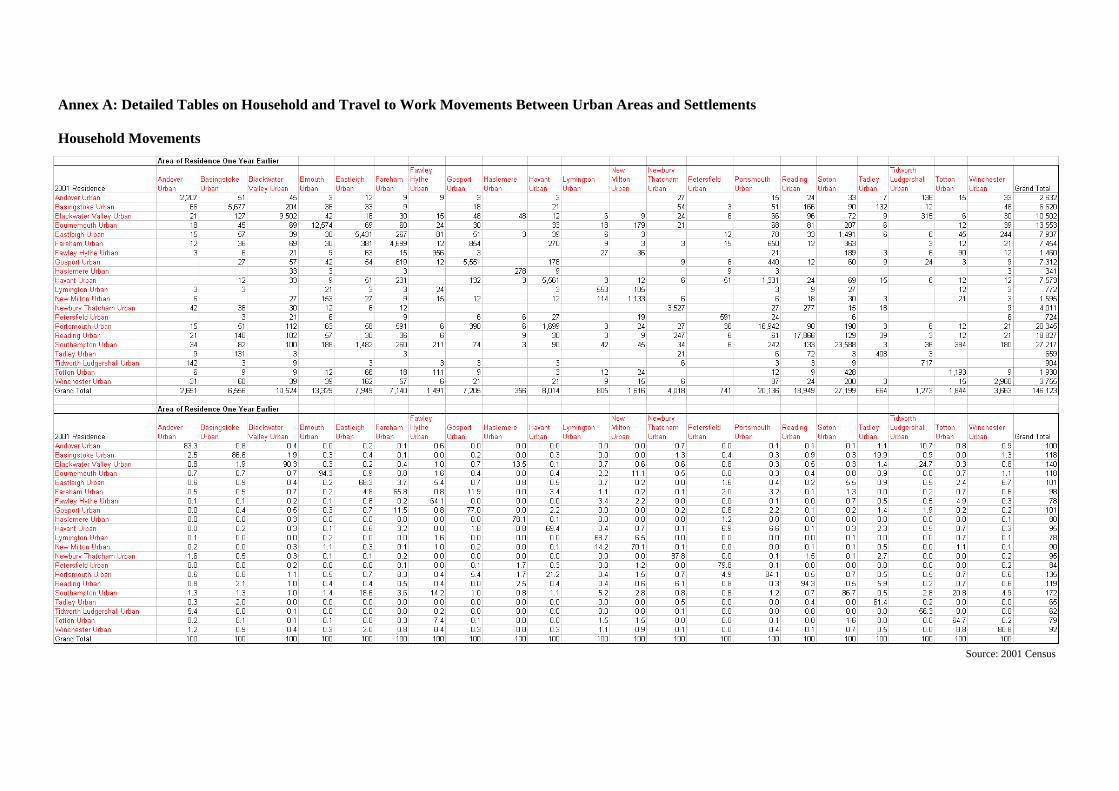
Annex A: Detailed Tables on Household and Travel to Work Movements Between Urban Areas and Settlements Household Movements
Source: 2001 Census

Travel to Work Movements
Source: 2001 Census

Note on Source: The source of the data in this Annex is the 2001 Census Special Migration Statistics. These provide origin and destination data on all household and travel to work movements between each of the wards of England and Wales. This very large dataset has been reconfigured by DTZ to show movements between the settlements of Central Hampshire (defined by collections of wards) as examined and explained in Section 2 of this report. It is therefore the data that underlies the mapping contained in this report section.
However, due to the very large breadth of data being analysed and space limitations DTZ have been selective in terms of the settlements that have been included for presentation in this annex. The data for a number of the smaller rural settlements has been excluded to make presentation more straightforward. However, all data covering every settlement will be handed over to the Central Hampshire authorities in an excel format at the end of this HMA study.

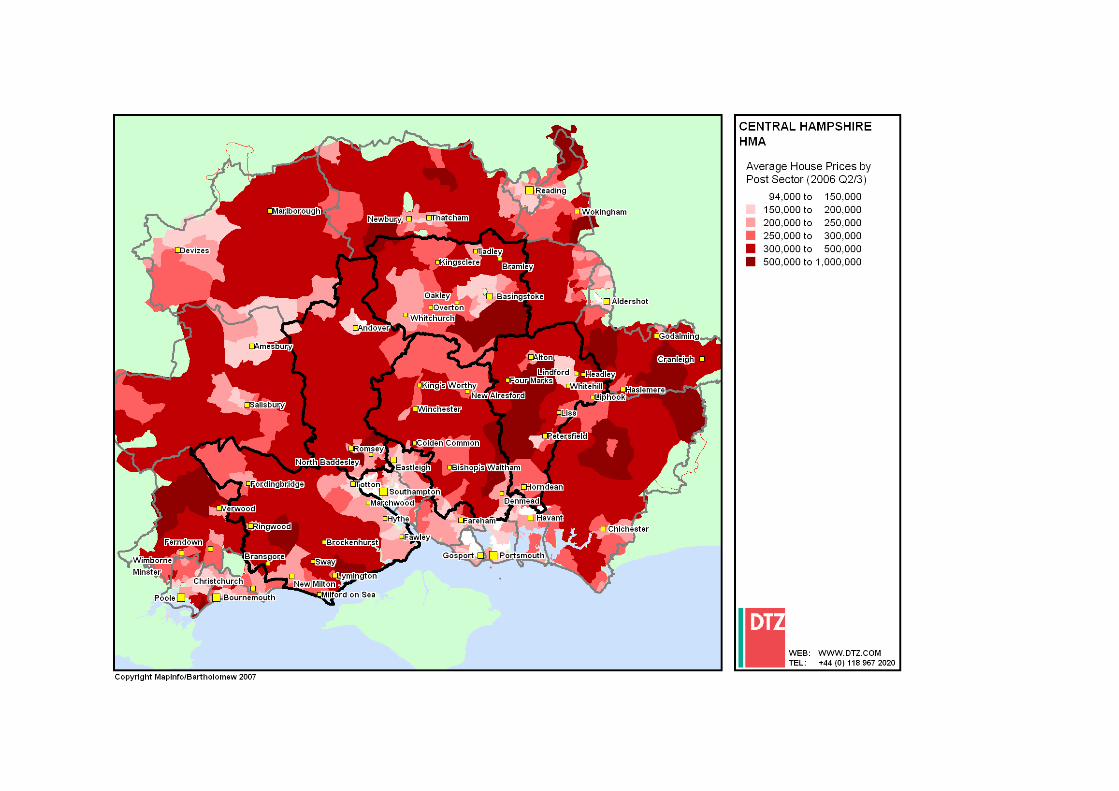
Appendix B Selected Maps


Appendix C Economic Terminology

HMA GLOSSARY
Gross Domestic Product (GDP) A measure of the total value of goods and services produced by the domestic economy during a given period, usually one year. Obtained by adding the value contributed by each sector of the economy in the form of profits, compensation to employees, and depreciation (consumption of capital). Gross Value Added (GVA) Gross Value Added is the difference between output and intermediate consumption for any given sector/industry. That is the difference between the value of goods and services produced and the cost of raw materials and other inputs which are used up in production. The difference between GVA at basic prices and GDP at market prices is the inclusion of taxes less subsidies on products in the latter. Since these taxes (such as VAT, excise duties etc) do not reflect output (value added) produced by the UK economy, the former measure is better for productivity analysis. As a result, GVA is now the preferred measurement for economic output in the UK. Output The value of final goods and services produced. In comparing output in different time periods, the effect of changes in the price level is removed. GDP is a common measure of economic output, as is GVA. Productivity The amount of output per unit of input (labour, equipment, and capital). There are many different ways of measuring productivity. For example, in a factory productivity might be measured based on the number of hours it takes to produce a good, while in the service sector productivity might be measured based on the revenue generated by an employee divided by his/her salary. Unemployment/Claimant Count: Unemployment is a count of jobless people who want to work, are available to work, and are actively seeking employment. Unemployment is calculated using data from the Labour Force Survey (LFS), so it is subject to sampling differences. The claimant count measures only those people who are claiming unemployment-related benefits (Jobseeker's Allowance). It is always the lower measure because some unemployed people are not entitled to claim benefits, or choose not to do so. Benefits rules vary over time and between different countries, so it is more difficult to make comparisons. The claimant count comes from the administrative records of Jobcentre Plus (formerly Employment Service), and is available earlier than the LFS-based unemployment data. Annual Business Enquiry (ABI) The ABI measures the number of jobs located within a given geographical location. Location Quotient A location quotient is a commonly utilized technique for comparing locations. It measures the concentration of a specific variable in one location relative to a benchmark. For example, we have used location quotients to show the concentration of employment by sector and age groups within the

population relative to the South East benchmark. In this case, if a location scores greater than one for a given sector, this indicates a relative concentration of employment in the sector relative to the South East. A score of less than one indicates an under-representation of employment in the sector relative to the South East.
Appendix D Housing Need Assessment Summary Calculations

BASINGSTOKE & DEANE HOUSING NEED ESTIMATE Final Version Stage and Step in Calculation Minimum Estimate Upper Estimate STAGE 1: CURRENT NEED 1.1 Transfer tenants in housing need 631 11101.2 plus Waiting list applicants in housing need 2,848 41801.3 plus Homeless households without self-contained accommodation (if not included in 1.2 above)
130 130
1.4 equals Total current housing need (1.1 + 1.2 + 1.3) 3609 54201.5 times Annual quota for the reduction of current need (assuming the backlog of need will be addressed over 5 years)
20% 20%
1.6 equals Annual requirement of units to reduce current need (2.6 x 2.7) 722 1084STAGE 2: NEWLY ARISING NEED 2.1 New household formation (per year) 1305 13052.2 times Proportion of new households unable to buy or rent in the market 59% 59%2.3 plus Existing households falling into need 149 2372.4 equals Total newly arising need per year (2.1 x 2.2) + 2.3 919 1007STAGE 3 : FUTURE SUPPLY OF AFFORDABLE HOUSING 3.1 Dwellings available when transfer tenants (1.1) are rehoused over the next 5 years 126 222
3.2 plus Annual supply of social rented re-lets (net - excluding transfers, mutual exchanges etc)
736 736
3.3 plus Annual supply of intermediate housing available for re-let or re-sale at sub market levels
N/A 0
3.4 plus surplus stock 0 03.5 plus Committed supply of new social rented homes (per annum) 200 2003.6 minus units to be taken out of management 0 03.7 equals annual supply of affordable units (3.1 + 3.2 + 3.3 + 3.4 + 3.5 - 3.6) 1062 1158NET SHORTFALL OF AFFORDABLE HOMES (SOCIAL RENTED) PER ANNUM Overall shortfall (1.6 + 2.4 – 3.7) per annum 579 933
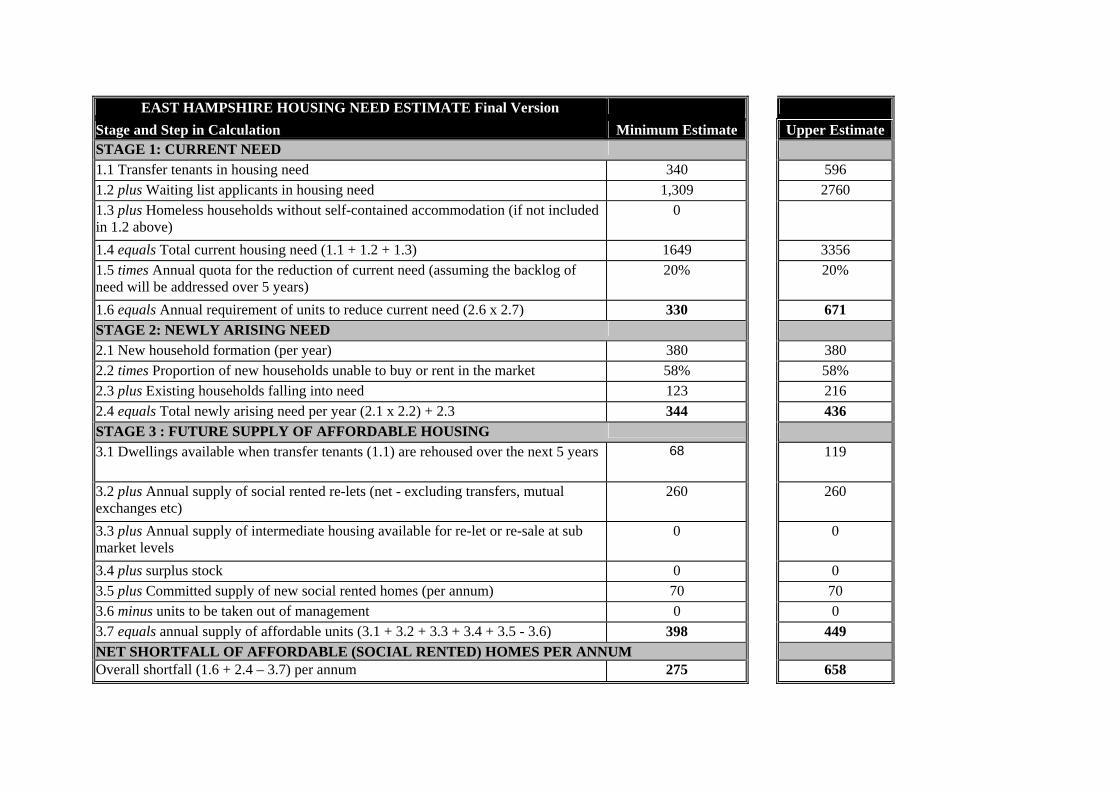
EAST HAMPSHIRE HOUSING NEED ESTIMATE Final Version
Stage and Step in Calculation Minimum Estimate Upper EstimateSTAGE 1: CURRENT NEED 1.1 Transfer tenants in housing need 340 596 1.2 plus Waiting list applicants in housing need 1,309 2760 1.3 plus Homeless households without self-contained accommodation (if not included in 1.2 above)
0
1.4 equals Total current housing need (1.1 + 1.2 + 1.3) 1649 3356 1.5 times Annual quota for the reduction of current need (assuming the backlog of need will be addressed over 5 years)
20% 20%
1.6 equals Annual requirement of units to reduce current need (2.6 x 2.7) 330 671 STAGE 2: NEWLY ARISING NEED 2.1 New household formation (per year) 380 380 2.2 times Proportion of new households unable to buy or rent in the market 58% 58% 2.3 plus Existing households falling into need 123 216 2.4 equals Total newly arising need per year (2.1 x 2.2) + 2.3 344 436 STAGE 3 : FUTURE SUPPLY OF AFFORDABLE HOUSING 3.1 Dwellings available when transfer tenants (1.1) are rehoused over the next 5 years 68 119
3.2 plus Annual supply of social rented re-lets (net - excluding transfers, mutual exchanges etc)
260 260
3.3 plus Annual supply of intermediate housing available for re-let or re-sale at sub market levels
0 0
3.4 plus surplus stock 0 0 3.5 plus Committed supply of new social rented homes (per annum) 70 70 3.6 minus units to be taken out of management 0 0 3.7 equals annual supply of affordable units (3.1 + 3.2 + 3.3 + 3.4 + 3.5 - 3.6) 398 449 NET SHORTFALL OF AFFORDABLE (SOCIAL RENTED) HOMES PER ANNUM Overall shortfall (1.6 + 2.4 – 3.7) per annum 275 658
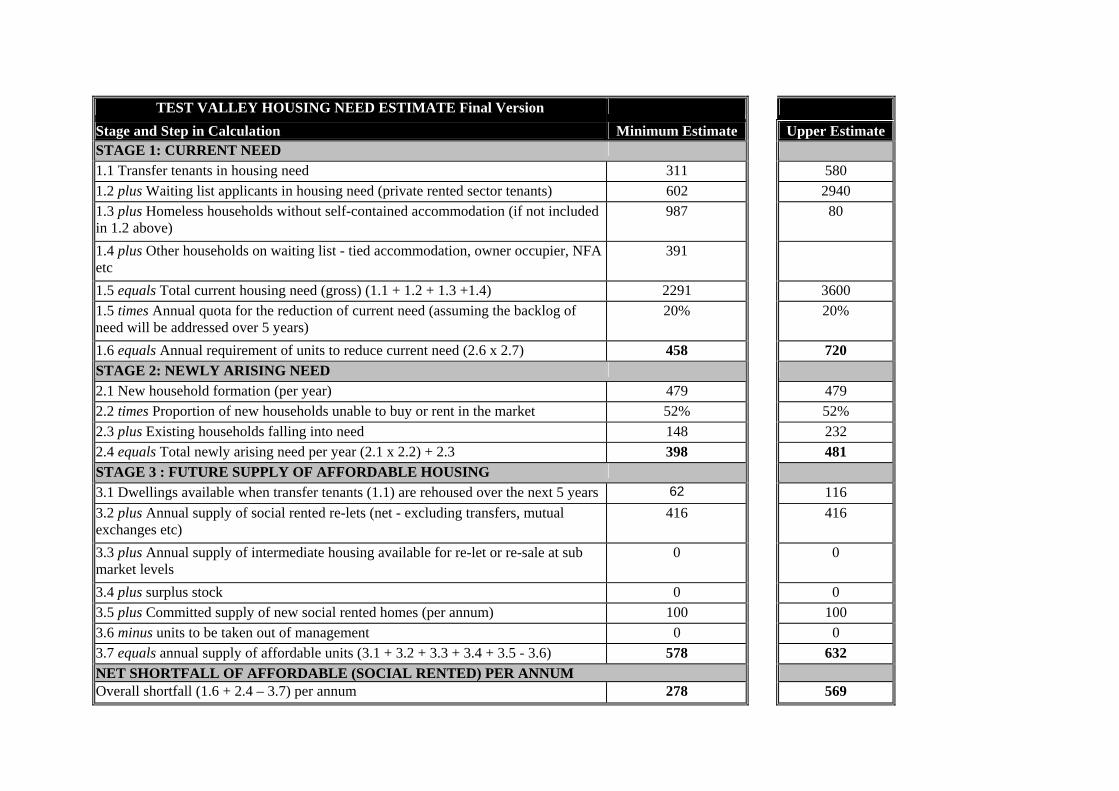
TEST VALLEY HOUSING NEED ESTIMATE Final Version Stage and Step in Calculation Minimum Estimate Upper Estimate STAGE 1: CURRENT NEED 1.1 Transfer tenants in housing need 311 580 1.2 plus Waiting list applicants in housing need (private rented sector tenants) 602 2940 1.3 plus Homeless households without self-contained accommodation (if not included in 1.2 above)
987 80
1.4 plus Other households on waiting list - tied accommodation, owner occupier, NFA etc
391
1.5 equals Total current housing need (gross) (1.1 + 1.2 + 1.3 +1.4) 2291 3600 1.5 times Annual quota for the reduction of current need (assuming the backlog of need will be addressed over 5 years)
20% 20%
1.6 equals Annual requirement of units to reduce current need (2.6 x 2.7) 458 720 STAGE 2: NEWLY ARISING NEED 2.1 New household formation (per year) 479 479 2.2 times Proportion of new households unable to buy or rent in the market 52% 52% 2.3 plus Existing households falling into need 148 232 2.4 equals Total newly arising need per year (2.1 x 2.2) + 2.3 398 481 STAGE 3 : FUTURE SUPPLY OF AFFORDABLE HOUSING 3.1 Dwellings available when transfer tenants (1.1) are rehoused over the next 5 years 62 116 3.2 plus Annual supply of social rented re-lets (net - excluding transfers, mutual exchanges etc)
416 416
3.3 plus Annual supply of intermediate housing available for re-let or re-sale at sub market levels
0 0
3.4 plus surplus stock 0 0 3.5 plus Committed supply of new social rented homes (per annum) 100 100 3.6 minus units to be taken out of management 0 0 3.7 equals annual supply of affordable units (3.1 + 3.2 + 3.3 + 3.4 + 3.5 - 3.6) 578 632 NET SHORTFALL OF AFFORDABLE (SOCIAL RENTED) PER ANNUM Overall shortfall (1.6 + 2.4 – 3.7) per annum 278 569

WINCHESTER HOUSING NEED ESTIMATE Final Version Stage and Step in Calculation Minimum Estimate Upper EstimateSTAGE 1: CURRENT NEED 1.1 Transfer tenants in housing need 600 730 1.2 plus Waiting list applicants in housing need 1,495 - 1.3 plus Homeless households without self-contained accommodation (if not included in 1.2 above)
59 -
1.4 equals Total current housing need (1.1 + 1.2 + 1.3) 2,154 2590 1.5 times Annual quota for the reduction of current need (assuming the backlog of need will be addressed over 5 years)
20% 20%
1.6 equals Annual requirement of units to reduce current need (2.6 x 2.7) 431 518 STAGE 2: NEWLY ARISING NEED 2.1 New household formation (per year) 540 540 2.2 times Proportion of new households unable to buy or rent in the market 54% 54% 2.3 plus Existing households falling into need 102 123 2.4 equals Total newly arising need per year (2.1 x 2.2) + 2.3 394 415 STAGE 3 : FUTURE SUPPLY OF AFFORDABLE HOUSING 3.1 Dwellings available when transfer tenants (1.1) are rehoused over the next 5 years 120 146
3.2 plus Annual supply of social rented re-lets (net - excluding transfers, mutual exchanges etc)
352 352
3.3 plus Annual supply of intermediate housing available for re-let or re-sale at sub market levels
0 0
3.4 plus surplus stock 0 0 3.5 plus Committed supply of new social rented homes (per annum) 70 100 3.6 minus units to be taken out of management 30 30 3.7 equals annual supply of affordable units (3.1 + 3.2 + 3.3 + 3.4 + 3.5 - 3.6) 512 568 NET SHORTFALL (OR SURPLUS) OF AFFORDABLE UNITS PER ANNUM Overall shortfall (1.6 + 2.4 – 3.7) per annum 312 365

NEW FOREST HOUSING NEED ESTIMATE Final Version
Stage and Step in Calculation Minimum Estimate Upper EstimateSTAGE 1: CURRENT NEED 1.1 Transfer tenants in housing need 320 390 1.2 plus Waiting list applicants in housing need 2,728 4170 1.3 plus Homeless households without self-contained accommodation (if not included in 1.2 above)
270 270
1.4 equals Total current housing need (1.1 + 1.2 + 1.3) 3318 4830 1.5 times Annual quota for the reduction of current need (assuming the backlog of need will be addressed over 5 years)
20% 20%
1.6 equals Annual requirement of units to reduce current need (2.6 x 2.7) 664 966 STAGE 2: NEWLY ARISING NEED 2.1 New household formation (per year) 340 340 2.2 times Proportion of new households unable to buy or rent in the market 66% 66% 2.3 plus Existing households falling into need 244 354 2.4 equals Total newly arising need per year (2.1 x 2.2) + 2.3 469 578 STAGE 3 : FUTURE SUPPLY OF AFFORDABLE HOUSING 3.1 Dwellings available when transfer tenants (1.1) are rehoused over the next 5 years 64 78
3.2 plus Annual supply of social rented re-lets (net - excluding transfers, mutual exchanges etc)
403 403
3.3 plus Annual supply of intermediate housing available for re-let or re-sale at sub market levels
0 0
3.4 plus surplus stock 0 0 3.5 plus Committed supply of new social rented homes (per annum) 65 65 3.6 minus units to be taken out of management 0 0 3.7 equals annual supply of affordable units (3.1 + 3.2 + 3.3 + 3.4 + 3.5 - 3.6) 532 546 NET SHORTFALL OF AFFORDABLE (SOCIAL RENTED) HOMES PER ANNUM Overall shortfall (1.6 + 2.4 – 3.7) per annum 600 998

Appendix E Stakeholder Consultation

1
Central Hampshire & New Forest SHMA Stakeholder Event – 3rd July 2007 Questions around the data: How far would the HMA provide data at ward or parish level so that variations within Districts can be evidenced? How does the HMA relate to Blackwater and PUSH? Why ‘lower demand’ for affordable housing in Winchester? [note draft figures] Key themes in the discussion groups Overall housing numbers
• Some highlighted that the biggest problem was the overall draft South East Plan targets – without reviewing these the impact that other policies have would be marginal. The question was asked by some attendees whether the RSS targets would be changed in the light of the HMA
• A related point was around the impact that PUSH development would have on Central Hampshire
Socio-economic patterns
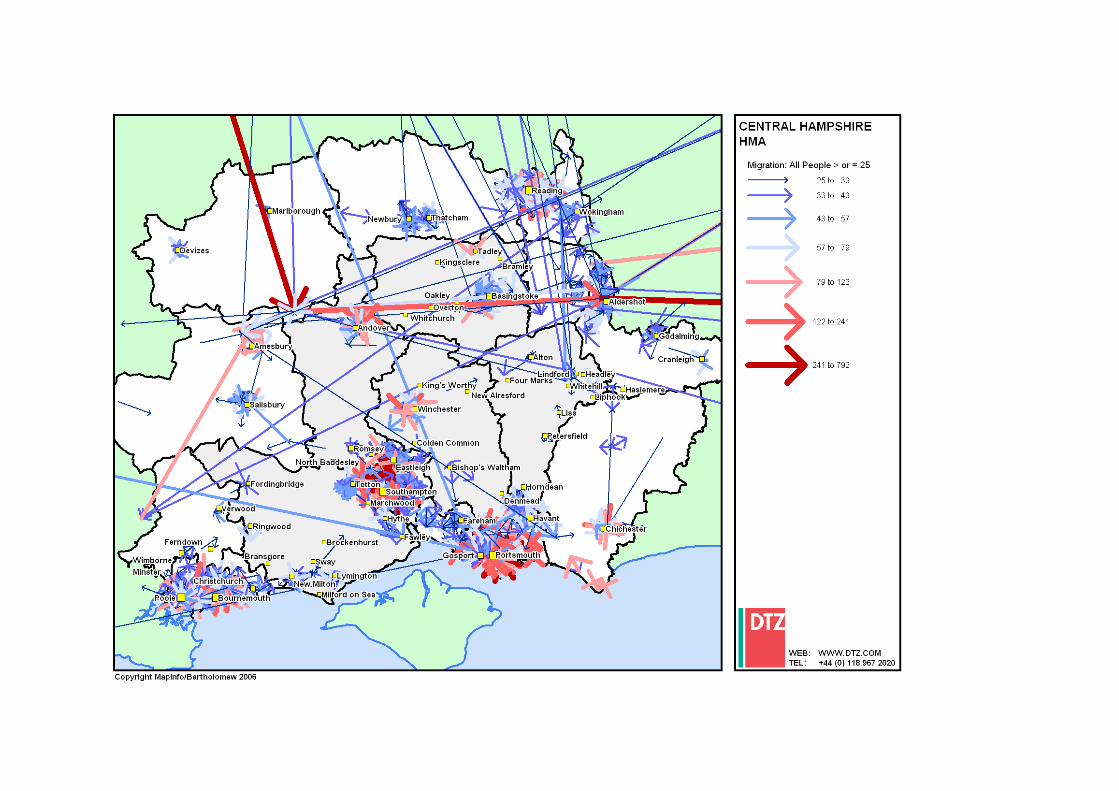
• There was discussion about the patterns of household migration and travel to work – some highlighted the influence of the M3 & M27 on movements. There was also the perception (confirmed in the data) of large movements to and from Blackwater Valley to Basingstoke. Hampshire road infrastructure has good primary routes which allow fairly large distance movements.
• Commuting distances have increased – job locations determined by employers and greater mobility of the labour force allows people to live where they wish. Some suggested that employers are consulted about the type of housing required for their employees (so that it can be provided close to employment) – though the practicalities of doing this with such a mobile workforce were acknowledged. There is also a high proportion of commuting to London from the authorities and main settlements including Basingstoke, Winchester and Andover, with issues for public transport as well as weekend or second homes bought by those who work away in the week (though data from Westminster suggests they buy in London). Counter to this there was the perception that more people were working from home – though not as important for younger generation /people in early stages of career
• There was significant discussion about the implications of an ageing population through national demographic trends but also in migration to some of the authorities for retirement. There were questions around how a suitable range of accommodation would be provided? Were there real choices for older people and what would give them an incentive to move out of larger properties? Some attendees suggested the need for good local alternative accommodation (older people may not be willing to move out of their community). Is the market providing the right product? There were limited examples (beyond McCarthy & Stone products) of market provision specifically for older people.
• There were comments on the accommodation and impact of recent EU migrants and there was a perception that most are not living in the Central Hampshire area. They come in to work, but are likely to live in Portsmouth and Southampton, willing to travel long distances. The likelihood is that if employment changes this pattern of migration will change. In the longer term no one really knows whether these immigrants will settle in the UK or return home.
• Some made the point about the Census 2001 data being out of date [need to include in intro to SHAM that this really only impacts on demographic data and trends are generally well known and change slowly, apart from migration which can change rapidly so need to pick this up through discussions with stakeholders. Economic, supply, house price, income, affordability and need data is all current]

2
Demand for different tenures • There was a firmly held view that the old social distinctions implied by “social renter” or
“owner occupier” no longer applied and this made it easier to create a genuine mixed tenure community provided the physical configuration of the scheme was sensible.
• Some argued that a greater range of tenure types should be available – eg low cost renting for say 10 years (at above regulated rents and without granting tenancies which are for life and then capable of being inherited) could give people greater security than assured shorthold tenancies but ensure affordable rented accommodation is released for those who need it.
• Views were divergent about the recent growth of the private rented sector and the dependency with the buy-to-let market. On the one hand, half of the attendees were opposed to buy-to-let investment and this seemed to be around the ‘unfairness’ wealth distribution which allowed some people to invest in second / buy-to-let properties whilst others could not even afford one home. There was also the feeling amongst some that the provision of flats has gone to far and there was starting to be a backlash against flats (Andover has had higher proportions than 5 years ago) - perception that some were being left empty. On the other hand, others argued that the new BTL market and growth of the private rented sector provides a valued service and a form of tenure that has been long argued for within the UK (comparison was made with large proportions of private renting in other European countries).
• Some commented that the market was not functioning property which created the need for affordable housing – the polarisation of income and wealth, inheritance (from people who own outright) was making this more stark. There is also a current trend for young people moving in with parents, either because they cannot afford market housing or to give them time to save.
• The lack of interaction with private landlords was perceived as a potential opportunity missed, particularly given the sector’s role in housing economic migrants. Concern was also expressed about the amateur private sector landlords and over-crowding.
• A view that EU migrants were currently housed in Houses in Multiple Occupation in the private sector – though often outside Central Hampshire eg Southampton. Pressures could arise as they become more wealthy, should they decide to enter the owner occupier market, putting more pressure on the limited resource (though likely to seek out more affordable locations, perhaps in the PUSH area).
Affordable housing & need
• There was concern about Winchester housing need figures being lower than previous assessment – some questioned whether it was because households were not registering because of the limited prospect of being re-housed? [Note need to make clear the difference in approach, figures also gone up since first draft]
• Developers in discussion group confirmed that there was now less concern about tenure mix – generally it should not effect the private element of housing on sites. Some stated that LAs, developers, RSLs were working together better than ever before but the principal blockage to the system was lack of suitable available land.
• Equally, there was a shift in attitude towards development adjacent to villages with “nimbyism” gradually giving way to an understanding that development, particularly of affordable housing, is needed to sustain villages. Rural exception sites were considered important but needed use clear communication about local need to gain support.
• There was a general feeling that the delivery of affordable housing was a national rather than simply a local issue. Further central government subsidy would be important in unlocking the problem. The question was raised about how will we attract funding into the Central Hampshire area, given the priorities elsewhere eg PUSH agenda.
• A more imaginative approach should be taken to allow government land ( including local, central government, MOD, NHS etc ) to be used for housing, setting aside current regulations about “best value”.
• A clear but flexible affordable housing planning position was considered essential to enable and not stifle development.

3
• Repeated mention was made of right to buy having depleted the social rented stock and the fact that development has used up resources without bringing the number of units back to the starting position.
• There was relatively limited discussion about intermediate products and generally a limited understanding from delegates about the options and what they do. There were concerns about whether there was any incentive for households to move from social rented accommodation if they were able to access a different tenure. There was a general consensus that there was limited movement from the social rented sector.
Supply of new housing
• There was discussion around a range of different types of sites for new housing development and the pros and cons associated with each.
• Some developers called for the need for more large sites and the need to bring reserve sites forward so that targets can be delivered (tied to concern highlighted above about the overall housing numbers), highlighting that the build out rate on large sites was 5/10 years. Significant expansion of Whitely, Winchester was mentioned.
• There was also a plea that HMA/ policy would need to be sufficiently flexible for requirements in future as it is difficult to foresee trends (eg no one predicted the expansion of the BTL/ apartment market)
• Some suggested that English Partnerships should not sell land to developers but to RSLs so that greater affordable housing is built, but would need political buy-in to do this – the profits could then be reinvested in affordable housing
• There were sensitivities around the conversion of large detached housing to smaller units. Tied to this there was a call for more detail on the effect of conversions on the profile of stock. Some cited that this could be done with community acceptance if done sensitively (and well designed). There was often a stark choice between ‘garden-grabbing’ and developing in the open countryside which made for difficult political choices
• It was also highlighted that there would be some significant contributions sought from developments along the M27 – required to provide HA contributions, with implications for other contributions.
Type and size of new housing
• There was general consensus of need for larger homes both in the market and affordable sectors. This was informed by a number of issues – people occupy more space than their household size suggests, changing lifestyle / working from home meant people needed or wanted more space. There was the perception that demand for second hand properties had increased because often more space is available. Older people need more space too eg for a life times possessions, visits from relatives, space for carers etc..
• Stakeholders acknowledged that there would be an issue with densities if more larger houses were delivered.
• There was also an acknowledgement of the price differences between new build and second hand homes with there being a price premium on new build – so encouragement to developers to build smaller properties would not necessarily aid first time buyers – they are usually better off entering the second hand market.
• There was concern about the division between what people get in market and social rented – those in social rented accommodation were occupying properties to the max whilst those in owner occupied properties had additional space – with implications for local communities and families in social rented accommodation living on top of each other. This is exacerbated by the tendency for owner occupiers to extend their homes whereas this rarely happens in the social rented sector – creating further polarisation of the stock
• There was a concern about the inflexibility of the housing market – people extending homes rather than moving and older people not downsizing, particularly in rural areas where turnover of the stock is much slower

4
• There were calls for affordable housing delivered in the future to be larger – little case for developing 1 bed homes – they have limited use, 2 beds are more flexible and the difference in price cost to build is marginal. Although apparent need for one beds is high on all LA waiting lists, those in priority need often need larger homes and also reflects entitlement of couples to only one bed dwellings. Should affordable homes reflect size of market homes? LAs would be better able to meet need?
• In both the market and affordable sector there was a view that 1 bedroom dwellings were only occupied by only those households who cannot afford larger
• There is significant ‘under-occupation’ in both the private and the social rented sector, though finding a suitable property to which to downsize was considered the major obstacle, with larger homes in the social rented sector often occupied by single older people. Mention was made of the preference for bungalows, the most land-hungry units of all.
Policy Implications
• No one disagreed with the need for affordable housing though there were concerns about mobility within the social rented sector – should be seen as first step with mobility out tied to employment opportunities, skills and wider social mobility
• Question was raised about how we can deliver more? Some argued (not just developers) that delivery was tied to market housing so there was a case for more housing overall, including land supply, in order to increase the amount of affordable housing.
• DTZ asked about the trend amongst LAs across the South East to up affordable housing quotas (in line with SE Plan). Developers present agreed that this (40% affordable) was achievable on greenfield generally but brownfield sites often difficult because of existing use value – much depends on the site
• There were complaints about the demand for free serviced land – there was little incentive for landowners/developers to provide this
• The viability study was considered very important – need to avoid discouraging developers from bringing sites forward (particularly smaller rural sites)
• The issues of rural affordable housing was discussed. Some questioned whether allocating land for affordable housing was worth the effort given the difficulty in bringing schemes forward in practice? Rural exceptions were also controversial and there was a need to convince people of need for affordable housing.
Future scenarios
• Some groups considered potential issues for the future. What would be the impact of Gordon Brown’s leadership – housing a priority – should ensure continuity
• One stakeholder highlighted that the last 5 years had witnessed extraordinary growth in prices – likely to be a slower pace of change in future. There was anecdotal evidence that BTL take up was slowing down (Reading/ Southampton market saturated?). There would be impacts on delivering housing overall without this part of market demand and a view that it may be difficult for the market to respond and change the type of output because the sites being developed currently are well suited to town centre flat market.
• Stakeholders acknowledged that social segregation was hard to reverse and trying to change this through mix of new housing was not the only solution. There were also limited comments about the ‘strong pull’ of some secondary schools influencing housing demand – would this change in the future with Government reform to school access.
• DTZ asked whether environmental requirements/ constraints would impact. Stakeholders, including developers felt that the costs associated with the Code for Sustainable Homes would gradually come down as developers gear up, but the cost of these requirements will come out of land values. Some stakeholders also suggested that the South Downs National Park may cover a large area by 2026, constraining the ability to deliver housing.