APPENDICES - europeristat.com · list of contributors to the european perinatal health report:...
37
141 APPENDICES
Transcript of APPENDICES - europeristat.com · list of contributors to the european perinatal health report:...

141
APPENDICES

APPENDIX A: LIST OF CONTRIBUTORS TO THE EUROPEAN PERINATAL HEALTH REPORT: HEALTH AND CARE OF PREGNANT WOMEN AND BABIES IN EUROPE IN 2015.
* Scientific Committee member** Executive board member
Austria Gerald Haidinger* The Medical University of Vienna, Department of Epidemiology, Centre of Public HealthAbteilung für Epidemiologie Zentrum für Public Health der Medizinische Universität [email protected]
Jeannette Klimont Statistics [email protected]
BelgiumSophie Alexander*/** Université Libre de Bruxelles, School of Public Health, Epidemiology, Biostatistics and Clinical Research CentreUniversité Libre de Bruxelles, Ecole de Santé Publique, Centre de Recherche en Epidémiologie, biostatistique et recherche [email protected]
Wei-Hong ZhangUniversité Libre de Bruxelles, School of Public Health, Epidemiology, Biostatistics and Clinical Research CentreUniversité Libre de Bruxelles, Ecole de Santé Publique, Centre de Recherche en Epidémiologie, biostatistique et recherche [email protected]
Michel Willems FPS Economy, SMEs, Self-employed and Energy Direction générale Statistique et Information économiqueDirection thématique Société [email protected]
Freddy VerkruyssenFPS Economy, SMEs, Self-employed and EnergyDirection générale Satistique et Information économiqueDirection thématique Société[email protected]
Frédéric DebièveUniversité Catholique de Louvain, Departement ObstetricsColleges for maternal and neonatal [email protected]
Virginie van LeeuwCentre d’Epidémiologie Périnatale (Cepip)[email protected]
Roland Frédéric Devlieger KU Leuven, Departement [email protected]
Régine Goemans Studie Centrum Perinatale Epidemiologie
Olivier GillisBrussels-Capital Health and Social [email protected]
Erik HendrickxFlemish Agency for Care and HealthVlaams Agentschap Zorg en [email protected]
Dominique Dubour Agence pour la qualité de la [email protected]
Francoise RenardFocal Point for the data collection on national health statistics for Eurostat, OECD and WHO
EUROPEAN PERINATAL HEALTH REPORT
142

Bart van OvermeireColleges for maternal and neonatal healthJoachim van KeirsblikVlaams Vereniging OG perinatal workgroup
Willem OmbeletVlaams Vereniging OG perinatal workgroup
Philippe PetitGOLFB perinatal workgroup
Patrick Emonts GOLFB perinatal workgroup
Samuel NdameOffice de la Naissance et de l’enfance ONE
BulgariaRumyana Kolarova* National Center of Public Health and [email protected]
Evelin Jordanova National Stastitical Institute
Croatia Urelija Rodin* Croatian National Institute of Public [email protected]
Boris Filipovic-GrcicSchool of Medicine University of Zagreb
Cyprus Vasos Scoutellas*Ministry of Health, Health Monitoring [email protected]
Despina StylianouMinistry of Health, Health Monitoring [email protected]
Theopisti Kyprianou Ministry of Health, Health Monitoring [email protected]
Afroditi ElisseouGynecologist Obstetrician, Mother and Child Medical [email protected]
Thalia PapadouriPediatrics Department, Makarios III [email protected]
Gabriel KalakoutisObstetrics & gynaecology, Aretaeio [email protected]
Czech Republic Petr Velebil* Institute for the Care of Mother and ChildUstav pro peci o matku a [email protected]
Denmark Laust Hvas Mortensen* Statistics Denmark [email protected]
Anne-Marie Nybo AndersonUniversity of [email protected]
Estonia Luule Sakkeus* Estonian Institute for Population Studies, School of Governance, Law and Society, Tallinn [email protected]
Kärt AllveeEstonian Medical Birth Register, National Institute for Health Development [email protected]
Gleb Denissov Register of Causes of Death, National Institute for Health [email protected]
Finland Mika Gissler*/** THL National Institute for Health and [email protected]
143

Anna HeinoTHL National Institute for Health and WelfareSpecial planning [email protected]
France Béatrice Blondel*/** French National Institute of Health and Medical Research (INSERM) U1153-EPOPéInstitut national de la santé et de la recherche mé[email protected]
Alice Hocquette**French National Institute of Health and Medical Research (INSERM) U1153-EPOPéInstitut national de la santé et de la recherche mé[email protected]
Marie Delnord**French National Institute of Health and Medical Research (INSERM) U1153-EPOPéInstitut national de la santé et de la recherche mé[email protected]
Catherine Deneux TharauxFrench National Institute of Health and Medical Research (INSERM) U1153-EPOPéInstitut national de la santé et de la recherche mé[email protected]
Monica SaucedoFrench National Institute of Health and Medical Research (INSERM) U1153-EPOPéInstitut national de la santé et de la recherche mé[email protected]
Mélanie Durox**French National Institute of Health and Medical Research (INSERM) U1153-EPOPéInstitut national de la santé et de la recherche mé[email protected]
Jennifer Zeitlin**French National Institute of Health and Medical Research (INSERM) U1153-EPOPéInstitut national de la santé et de la recherche mé[email protected]
Grégoire ReyNational Center of Statistics for Medical Causes of Death (CépiDc) French National Institute of Health and Medical Research (INSERM)Institut national de la santé et de la recherche mé[email protected]
Jeanne FressonDirectorate for Research, Studies, Assessment, and Statistics (DREES), The Health and Solidarity MinisterialDirection de la recherche, des études, de l’évaluation et des statistiques (DREES), Ministère des Solidarités et de la Santé[email protected]
Annick VilainDirectorate for Research, Studies, Assessment, and Statistics (DREES), The Health and Solidarity MinisterialDirection de la recherche, des études, de l’évaluation et des statistiques (DREES), Ministère des Solidarités et de la Santé[email protected]
Sylvie ReyDirectorate for Research, Studies, Assessment, and Statistics (DREES), The Health and Solidarity MinisterialDirection de la recherche, des études, de l’évaluation et des statistiques (DREES), Ministère des Solidarités et de la Santé[email protected]
EUROPEAN PERINATAL HEALTH REPORT
144

Germany Nicholas Lack*Bavarian Institute for Quality [email protected]
Guenther Heller*IQTIGInstitut für Qualitätssicherung und Transparenz im [email protected]
Anton Scharl Department of Obstetrics and Gynaecology, Klinikum Amberg
Greece Aris Antsaklis*Athens University Medical SchoolDepartment of Fetal Maternal and Perinatal [email protected]
Peter DrakakisAthens University Medical School
Konstantinos VoulgarisHellenic Statistical Authority ELSTAT [email protected]
Hungary István Berbik*Department of Obstetrics and GynaecologyVaszary Kolos Teaching HospitalVaszary Kolos Kórház
Iceland Helga Sól Ólafsdóttir* Landspitali University Hospital Department of Obstetrics and GynaecologyLandspítali v/ [email protected]
Ragnheiður I. Bjarnadottir, Landspitali University HospitalLandspítali v/ HringbrautHildur HarðardóttirLandspitali University HospitalLandspítali v/ Hringbraut
Brynja RagnarsdóttirLandspitali University HospitalLandspítali v/ Hringbraut
Vigdís Stefánsdóttir Landspitali University HospitalLandspítali v/ Hringbraut
Sigríður HaraldsdóttirLandlaeknis Directorate of Health
IrelandSheelagh Bonham* The Healthcare Pricing Office (HPO)[email protected]
Edel ManningUniversity College CorkDepartment of Obstetrics and [email protected]
ItalyMarina Cuttini*Clinical Care and Management Innovation Research Area, Bambino Gesù Children’s Hospital, IRCCSArea di Ricerca Innovazioni Clinico-Gestionali e Tecnologiche, Ospedale Pediatrico Bambino Gesù, [email protected]
Maria LaccheiClinical Care and Management Innovation Research Area, Bambino Gesù Children’s Hospital, IRCCSArea di Ricerca Innovazioni Clinico-Gestionali e Tecnologiche, Ospedale Pediatrico Bambino Gesù, [email protected]
Cristina TamburiniDirector of Statistics Unit, Directorate General of Digitalization, Health Information System and Statistics, Italian Ministry of HealthDirettore dell’Ufficio di Statistica, Direzione Generale del Sistema di Digitalizzazione e Informativo Sanitario e di Statistica, Ministero della [email protected]
145

Fulvio BasiliStatistics Unit, Directorate General of Digitalization, Health Information System and Statistics, Italian Ministry of HealthUfficio di Statistica, Direzione Generale del Sistema di Digitalizzazione e Informativo Sanitario e di Statistica, Ministero della [email protected]
Valerio MontorioStatistics Unit, Directorate General of Digitalization, Health Information System and Statistics, Italian Ministry of HealthUfficio di Statistica, Direzione Generale del Sistema di Digitalizzazione e Informativo Sanitario e di Statistica, Ministero della [email protected]
Marzia LoghiIntegrated Service System for Health, Assistance, Welfare and Justice, Italian National Institute for StatisticsServizio Sistema integrato salute, assistenza, previdenza e giustizia, Istituto Nazionale di [email protected]
Marilena PappagalloIntegrated Service System for Health, Assistance, Welfare and Justice, Italian National Institute for Statistics Servizio Sistema integrato salute, assistenza, previdenza e giustizia, Istituto Nazionale di [email protected]
Serena DonatiNational Centre for Diseases Prevention and Health Promotion, National Institute of HealthCentro Nazionale Prevenzione delle Malattie e Promozione della Salute, Istituto Superiore di Sanità[email protected]
Alice MaraschiniNational Centre for Diseases Prevention and Health Promotion, National Institute of HealthCentro Nazionale Prevenzione delle Malattie e Promozione della Salute, Istituto Superiore di Sanità[email protected]
Latvia Janis Misins*Centre for Disease Prevention and Control of Latvia Slimïbu Profilakses un Kontroles Centrs (SPKC)[email protected]
Irisa ZileCentre for Disease Prevention and Control of LatviaSlimïbu Profilakses un Kontroles Centrs (SPKC)[email protected]
Lithuania Jelena Isakova* Institute of Hygiene, Health Information CentreHigienos [email protected]
Rita GaidelyteInstitute of Hygiene, Health Information CentreHigienos [email protected]
LuxembourgGuy Weber* (starting in 2015)Ministry of Health, Directorate of Health, Epidemiology and Statistics UnitMinistère de la Santé, Direction de la Santé, Service Epidémiologie & [email protected]
Nathalie de Rekeneire*Ministry of Health, Directorate of Health, Epidemiology and Statistics UnitMinistère de la Santé, Direction de la Santé, Service Epidémiologie & [email protected]
Diane PivotMinistry of Health, Directorate of Health, Epidemiology and Statistics UnitMinistère de la Santé, Dirrection de la Santé,Service Epidémiologie & [email protected]
EUROPEAN PERINATAL HEALTH REPORT
146

Yolande Wagener* (until 2015)Ministry of Health, Department of Health,Ministère de la Santé, Direction de la Santé, Division de la Médecine Scolaire
Audrey Billy Luxembourg Institute of Health, Department of Population Health [email protected]
Sophie CouffignalLuxembourg Institute of Health, Department of Population Health [email protected]
Aline LecomteLuxembourg Institute of Health, Department of Population Health [email protected]
Malta Miriam Gatt* Directorate for Health Information and Research, National Obstetric Information Systems (NOIS) [email protected]
Netherlands Jan Nijhuis* Maastricht University Medical Center, Department of Obstetrics & Gynecology, Maastricht Universiteit Maastricht, Medisch Centrum, Afdeling Obstetrie en Gynaecologie [email protected]
Ashna Hindori - Mohangoo** TNO Healthy Living, Department Child Health, Leiden [email protected] Perinatal Interventions Suriname, Perisur Foundation, Paramaribo [email protected]
Peter Achterberg National Institute for Public Health and the Environment (RIVM)[email protected]
Koos van der VeldenThe Netherlands Organisation for Health Research and Development (ZonMw)[email protected]
Pien OfferhausThe Royal Dutch College of Midwives (KNOV)[email protected]
Anneke KweeThe Netherlands Society of Obstetrics and Gynaecology (NVOG)[email protected]
Floris GroenendaalPaediatric Association of the Netherlands (NVK)[email protected]
Lisa Broeders The Netherlands Perinatal Registry and Audit (Perined)[email protected]
Chantal HukkelhovenWageningen [email protected]
Anita Ravelli Academic Medical Research Center [email protected]
Adja Waelput Erasmus Medical Center [email protected]
Norway Kari Klungsoyr* Norwegian Institute of Public Health Department of Health [email protected];DepartmentofPublicHealth and Primary [email protected]
Rupali AkerkarNorwegian Institute of Public Health Department of Health Data Management and [email protected]
147

Poland Katarzyna Szamotulska*/** National Research Institute of Mother and Child, Department of Epidemiology and Biostatistics Instytut Matki i Dziecka, Zaklad Epidemiologii i [email protected]
Ewa Mierzejewska National Research Institute of Mother and Child, Department of Epidemiology and Biostatistics Instytut Matki i Dziecka, Zaklad Epidemiologii i [email protected] collaboration from The Central Statistical Office, the National Health Fund and Ministry of Health
Portugal Henrique Barros*/**University of Porto Medical School, Department of Hygiene and Epidemiology Serviço de Higiene e Epidemiologia, Faculdade de Medicina do Porto [email protected]
Sofia Correia University of Porto Medical School, Department of Hygiene and Epidemiology Serviço de Higiene e Epidemiologia, Faculdade de Medicina do Porto [email protected]
Anna Isabel RibeiroEPIUnit – Institute of Public Health, University of PortoEPIUnit - Instituto de Saúde Pública, Universidade do PortoDepartment of Public Health and Forensic Sciences and Medical Education, Faculty of Medicine, University of PortoDepartamento de Ciências da Saúde Pública e Forenses e Educação Médica, Faculdade de Medicina, Universidade do [email protected]
Romania Mihai Horga*East European Institute for Reproductive [email protected]
Vlad Tica East European Institute for Reproductive HealthFaculty of Medicine, University “Ovidius” [email protected]
Alexandra CucuNational Institute of Public Health, Minsitry of [email protected]
Lucian PuscasiuEast European Institute for Reproductive HealthUniversity of Medicine and Pharmacy [email protected]
SlovakiaJán Cáp*National Health Information CenterNárodné centrum zdravotníckych informácií[email protected]
Slovenia Natasa Tul Mandic*University Medical Centre, Perinatology Unit, Ljubljana University Univerze v [email protected]
Ivan Verdenik University Medical Centre, Department of Obstetrics & Gynecology, Research [email protected]
Spain Francisco Bolúmar*Alcala University Medical School, Department of Health Sciences and Social MedicineUniversidad de Alcalá, Departamento de Ciencias Sanitarias y Médico [email protected]
EUROPEAN PERINATAL HEALTH REPORT
148

Óscar Zurriaga Subdirector General de Investigación, Innovación, Tecnología y CalidadDirección General de Investigación, Innovación, Tecnología y [email protected]
Mireia JanéSub-directorate General for Epidemiological Surveillance and Public Health Emergency Response at the Public Health Agency of CataloniaSub-direcció General de Vigilància i Resposta a Emergències de Salut Pú[email protected]
Maria José VidalSub-directorate General for Epidemiological Surveillance and Public Health Emergency Response at the Public Health Agency of CataloniaSub-direcció General de Vigilància i Resposta a Emergències de Salut Pú[email protected]
Carmen BaronaPublic Health, Generalitat ValencianaDirección General de Salud Pública
Rosa MasPublic Health, Generalitat ValencianaDirección General de Salud Pública
Adela Recio AlcaideSenior Statistical State [email protected]
Sweden Karin Källén*The National Board of Health and Welfare, Department of Evaluation and Analysis, Epidemiology and Methodological Support [email protected]
Karin Gottvall*The National Board of Health and Welfare Department of Statistics, Monitoring and [email protected]
Ellen Lundqvist The National Board of Health and Welfare, Department of Statistics and Comparisons, Statistics Unit [email protected]
Switzerland Mélanie Riggenbach*Swiss Federal Statistical Office, Section HealthOffice fédéral de la statistique, Section Santé de la [email protected]
Suzanne Grylka Institut für Hebammen, ZHAW Zürcher, Hochschule für Angewandet Wissenschaften
Andrea Weber-Käser Schweizerischer Hebammenverband
United KingdomAlison Macfarlane*/**Maternal and Child Health Research Centre,School of Health Sciences,City, University of London, [email protected]
Nirupa DattaniMaternal and Child Health Research Centre,School of Health Sciences,City, University of London, [email protected]
Lucy SmithMBRRACE collaboration, Department of Health Sciences, University of Leicester, [email protected]
Marian KnightMBRRACE collaboration, National Perinatal Epidemiology Unit, University of Oxford, [email protected]
Elizabeth McLarenOffice for National Statistics, Health Analysis and Life Events, Titchfield, [email protected]://www.ons.gov.uk/peoplepopulationandcommunity/healthandsocialcare/childhealth
149

Nicola Haines Office for National Statistics, Health Analysis and Life Events, Titchfield, [email protected]
Vasita PatelOffice for National Statistics, Health Analysis and Life Events, Titchfield, [email protected]
Dominic Gair Analytical Section Head, Secondary Care Service, NHS Digital, Leeds, [email protected]
Hannah KnightNational Maternity and Perinatal AuditRoyal College of Obstetricians and GynaecologistsLondon, England
Craig ThomasYstadegau iechyd sylfaenol & chymunedol a gwasanaethau cymdeithasolPrimary & community health and social services statistics Ystadegau iechyd, gwasanaethau cymdeithasol a phoblogaeth IechydHealth, social services and population statisticsGwasanaethau Gwybodaeth a DadansoddiKnowledge and Analytical Services Llywodraeth CymruWelsh Government [email protected]
Rhian OsborneYstadegau iechyd sylfaenol & chymunedol a gwasanaethau cymdeithasolPrimary & community health and social services statistics Ystadegau iechyd, gwasanaethau cymdeithasol a phoblogaeth IechydHealth, social services and population statisticsGwasanaethau Gwybodaeth a DadansoddiKnowledge and Analytical Services Llywodraeth CymruWelsh Government [email protected]
Mark Piper Information Manager (Acute), NHS Wales Informatics Service, Gwasanaeth Gwybodeg GIG Cymru, Pontypool, [email protected]
Rachael WoodNHS National Services Scotland, Information Services Division, Edinburgh, [email protected]
Nicola SteedmanNHS National Services Scotland, Information Services Division, Edinburgh, [email protected]
Samantha ClarkeNHS National Services Scotland, Information Services Division, Edinburgh, [email protected]
Kirsten MonteathNHS National Services Scotland, Information Services Division, Edinburgh, [email protected]
Sean MallonHospital Information Branch, Department of Health NI, Belfast Northern [email protected]
Siobhán MorganHospital Information Branch, Department of Health NI, Belfast Northern [email protected]://www.health-ni.gov.uk/topics/doh-statistics-and-research
Sinead MagillNorthern Ireland Maternal and Child Health, Public Health Agency, Belfast, Northern [email protected]
Heather ReidNorthern Ireland Maternal and Child Health, Public Health Agency, Belfast, Northern [email protected]
EUROPEAN PERINATAL HEALTH REPORT
150

APPENDIX B
TABLE OF CONTENTS
Core IndicatorsC1_A: Fetal mortality rate by gestational age and birth weight (numbers)
C1_B: Fetal mortality rate by gestational age and birth weight (rates per 1000 total births)
C2_A: Neonatal mortality rate (numbers and rates per 1000 live births)
C2_B: Neonatal mortality rate for births at ≥24 weeks of gestation
C3: Infant mortality rate (numbers and rates per 1000 live births)
C4_A: Distribution of birth weight for live births
C4_B: Distribution of birth weight by plurality for live births
C5_A: Distribution of gestational age for live births
C5_B: Distribution of gestational age by plurality for live births
C6_A: Maternal mortality ratio (numbers and ratios per 100 000 live births) from routine statistics
C6_B: Maternal mortality ratio (numbers and ratios per 100 000 live births) from enhanced data systems
C7: Multiple mortality rate (rates per 100 women)
C8: Distribution of maternal age (rates per 100 women)
C9: Distribution of parity (rates per 100 women)
C10: Mode of delivery (rates per 100 total births)
Recommended IndicatorsR8: Percentage of women who smoked during pregnancy
R12: Distribution of maternal pre-pregnancy body mass index
151

EUROPEAN PERINATAL HEALTH REPORT
152
Number of total births Number of fetal deaths Number of terminations Number of fetal deaths without terminations (if possible)
Country/coverage
Source Inclusion criteria for fetal deaths
All* ≥1000 g ≥28weeks
≥24weeks
All* ≥1000 g ≥28weeks
≥24weeks
All* ≥1000 g ≥28weeks
≥24weeks
All* ≥1000 g ≥28weeks
≥24weeks
Belgium 1 500+ grams. if BW unknown, 22+ weeks; cannot distinguish terminations
122 838 120 524 120 584 121 109 598 359 368 530 598 359 368 530
Bulgaria (2014)1
1,3 a) 800+ grams and / or 26+ weeks of gestation;b) <800 grams and / or <26 weeks - provided that the foetus was born alive and lived at least 3 days
68 122 67 719 67 806 68 047 537 367 388 471 43 0 0 0 494 367 388 471
Czech Republic
1 500+ grams if BW not available 22+ weeks. Cannot distinguish terminations from fetal deaths
111 162 108 962 108 179 108 536 398 274 296 348 398 274 296 348
Denmark 1,2,4 22+ weeks 57 871 57 028 57 558 57 734 194 NA 115 146 24 0 0 0 170 NA 115 146
Germany2 1 500+ grams 728 496 723 416 724 006 NA 2559 1630 1759 NA 2559 1630 1759 NA
Estonia 1,3,4 22+ weeks. Terminations register includes pregnancies up to 20 weeks, thus all fetal deaths in Estonia are without terminations
13 961 13 897 13 897 13 948 54 39 43 50 0 0 0 0 54 39 43 50
Ireland 1 24+ weeks or 500+ grams ( national criteria), Source 1: 500+ grams only. Induced abortions not included
65 913 65 586 65 627 65 837 290 189 222 273 0 0 0 0 290 189 222 273
Greece 1 22+ weeks 92 159 90 683 91 119 91 447 312 243 270 308 312 243 270 308
Spain 1 180+ days / 500 grams
421 590 398 599 356 157 357 270 1307 897 968 1106 1307 897 968 1106
France 5 22 weeks or 500 grams. Terminations included
764 704 758 775 758 852 762 961 6648 2501 3359 5172 2824 885 1073 2208 3824 1616 2286 2964
France (Survey, 2016)
1 22+ weeks 13 369 13 211 13 217 13 305 137 58 63 102 58 24 23 45 79 34 40 57
Croatia 1 22+ weeks.Terminations not included
37 428 37 234 37 237 37 391 176 112 119 160 0 0 0 0 176 112 119 160
Italy 8 fetal death: 180+ days miscarriage: <180 days
487 042 483 759 482 647 484 213 2265 1067 1175 1442 485 NA 0 6 1780 1067 1175 1436
Cyprus 1 22+ weeks or 500+ grams. Cannot distinguish TOP
9425 9333 9219 9247 31 10 13 17 31 10 13 17
Latvia 3 22+ weeks 500 grams (if BW < 500 g but GA ≥ 22). Induced abortions not included
21 826 21 721 21 728 21 798 106 70 73 86 0 0 0 0 106 70 73 86
Lithuania1,3 1,2,3 22+ weeks 31 601 31 483 31 491 31 577 126 84 90 113 0 0 0 0 126 84 90 113
Luxembourg 1 22+ weeks or 500+ grams
6889 6837 6842 6873 57 26 27 43 27 12 11 21 30 14 16 22
Hungary 1 Miscarriage/abortion: <24 weeks or if GA missing, <30 cm or <500 grams. Late fetal death (stillbirth): 24+ weeks, or if GA missing, 30+ cm or 500+ grams, while in case of twin birth at least one of the fetus was born alive
92 253 91 386 91 507 92 002 573 311 338 407 47 NA 0 1 526 311 338 406
C1_A: Fetal mortality rate by gestational age and birth weight (numbers)
CORE INDICATORS

153
Number of total births Number of fetal deaths Number of terminations Number of fetal deaths without terminations (if possible)
Country/coverage
Source Inclusion criteria for fetal deaths
All* ≥1000 g ≥28weeks
≥24weeks
All* ≥1000 g ≥28weeks
≥24weeks
All* ≥1000 g ≥28weeks
≥24weeks
All* ≥1000 g ≥28weeks
≥24weeks
Malta 1,2 22+ weeks - if GA missing 500+ grams
4453 4425 4429 4448 18 8 11 15 0 0 0 0 18 8 11 15
Netherlands 1 Perined registrates all fetal deaths from 16+ weeks. However, for the core indicators: 22+ weeks or – if GA unknown 500+ grams. Induced abortions are included
169 234 167 584 165 475 166 113 809 345 358 482 809 345 358 482
Austria 1 Only stillbirths are included (defined according the WHO definition - 500 grams limit). Terminations not registered
83 884 83 465 83 496 83 788 277 188 202 245 0 0 0 0 277 188 202 245
Poland (2014)
1 500+ grams, if BW unknown 22+ weeks
376 968 375 160 375 283 376 612 1321 887 932 1169 0 0 0 0 1321 887 932 1169
Portugal 1 22+ weeks (equivalent to 500 grams). If GA<24 weeks (equivalent to <500 grams), death certificate is not compulsory unless the mother wants to register it or there is a suspicious of an induced abortion
86 048 85 448 85 587 85 841 286 NA 218 263 286 NA 218 263
Romania 3 Fetal deaths do not include abortions
201 760 201 178 201 298 201 738 737 688 724 734 0 0 0 0 737 688 724 734
Slovenia 1 500+ grams. Induced abortions are included
20 397 20 259 20 271 20 370 124 67 72 108 61 26 24 47 63 41 48 61
Slovakia 1 22+ weeks 55 824 55 610 55 647 55 809 209 192 197 201 0 0 0 0 209 192 197 201
Finland 1 22+ weeks 55 832 55 507 55 481 55 638 244 105 114 141 73 NA 0 3 171 105 114 138
Sweden (2014)
1 22+ weeks. Induced abortions are not included
115 710 115 156 115 206 115 586 464 323 350 423 0 0 0 0 464 323 350 423
United Kingdom
1 22+ weeks 4429 2289 2486 3501 884 204 197 485 3545 2085 2289 3016
UK: England and Wales
2 24+ weeks 699 204 683 190 692 387 695 596 3147 2067 2232 3147 234 110 109 234 2913 1957 2123 2913
UK: Scotland 1 22+ weeks. Fetal deaths at 22+ weeks can be identified from hospital discharge data. In addition fetal deaths at 24+ weeks are registered by law
54 550 54 171 54 033 54 242 262 139 155 208 37 1 2 10 225 138 153 198
UK: Northern Ireland
1 24+ weeks. Terminations cannot be identified from data
24 544 24 420 24 461 24 533 82 56 63 82 82 56 63 82
Iceland 2 Fetal deaths: 22+ weeks. Terminations are not allowed after 22 weeks
4098 4079 4080 4088 10 8 8 8 0 0 0 0 10 8 8 8
Norway 1 22+ weeks or 500+ grams. Induced abortions are not included. Only terminations due to fetal anormaly are recorded
59 931 59 640 59 467 59 668 220 130 136 181 3 0 1 2 217 130 135 179
Switzerland (2014)
1 22+ weeks or >500 grams. If <22 weeks and <500 grams, included only if there is a twin alive
85 263 84 741 84 778 85 099 372 176 209 279 57 7 9 25 315 169 200 254
NOTES: Fetal mortality rate per 1000 total births = ((number of fetal death)/(number of total births))*1000 Euro-Peristat requested data for all births at 22 completed weeks of gestation or with a birth weight of 500 grams if gestational age was missing. * this includes births with unknown GA 22+ weeks 1. In Bulgaria and Lithuania, all live births with unknown GA (N=2476 for Bulgaria; N=2579 for Lithuania) were considered as live births occurring at 24+ weeks of gestational age and all live births with unknown BW (N=2772 for Bulgaria; N=2579 for Lithuania) were considered as live births occurring at 1000+ grams. 2. In Germany, 124 fetal deaths among 869 infants with birth weight below 500 g were documented in the database. 3. In Lithuania, all stillbirths with unknown GA N=3 were considered stillbirths occurring at 24+ weeks of gestational age and all stillbirths with unknown BW N=3 were considered stillbirths occurring at 1000+ grams.

EUROPEAN PERINATAL HEALTH REPORT
154
Fetal mortality rate per 1000 total births (without terminations, if possible)
Fetal mortality rate per 1000 total births
Country/coverage Source All* ≥1000 g ≥28 weeks ≥24 weeks All* ≥1000 g ≥28 weeks ≥24 weeks
Belgium 1 4.9 3.0 3.1 4.4 4.9 3.0 3.1 4.4
Bulgaria1 1,3 7.3 5.4 5.7 6.9 7.9 5.4 5.7 6.9
Czech Republic 1 3.6 2.5 2.7 3.2 3.6 2.5 2.7 3.2
Denmark 1,2,4 2.9 NA 2.0 2.5 3.4 NA 2.0 2.5
Germany 1 3.5 2.3 2.4 3.1 3.5 2.3 2.4 3.1
Estonia 1,3,4 3.9 2.8 3.1 3.6 3.9 2.8 3.1 3.6
Ireland 1 4.4 2.9 3.4 4.1 4.4 2.9 3.4 4.1
Greece 1 3.4 2.7 3.0 3.4 3.4 2.7 3.0 3.4
Spain 1 3.1 2.3 2.7 3.1 3.1 2.3 2.7 3.1
France 5 5.0 2.1 3.0 3.9 8.7 3.3 4.4 6.8
France (Survey, 2016) 1 5.9 2.6 3.0 4.3 10.2 4.4 4.8 7.7
Croatia 1 4.7 3.0 3.2 4.3 4.7 3.0 3.2 4.3
Italy 8 3.7 2.2 2.4 3.0 4.7 2.2 2.4 3.0
Cyprus 1 3.3 1.1 1.4 1.8 3.3 1.1 1.4 1.8
Latvia 3 4.9 3.2 3.4 3.9 4.9 3.2 3.4 3.9
Lithuania1 1,2,3 4.0 2.7 2.9 3.6 4.0 2.7 2.9 3.6
Luxembourg 1 4.4 2.0 2.3 3.2 8.3 3.8 3.9 6.3
Hungary 1 5.7 3.4 3.7 4.4 6.2 3.4 3.7 4.4
Malta 1,2 4.0 1.8 2.5 3.4 4.0 1.8 2.5 3.4
Netherlands 1 4.8 2.1 2.2 2.9 4.8 2.1 2.2 2.9
Austria 1 3.3 2.3 2.4 2.9 3.3 2.3 2.4 2.9
Poland 1 3.5 2.4 2.5 3.1 3.5 2.4 2.5 3.1
Portugal 1 3.3 NA 2.5 3.1 3.3 NA 2.5 3.1
Romania 3 3.7 3.4 3.6 3.6 3.7 3.4 3.6 3.6
Slovenia 1 3.1 2.0 2.4 3.0 6.1 3.3 3.6 5.3
Slovakia 1 3.7 3.5 3.5 3.6 3.7 3.5 3.5 3.6
Finland 1 3.1 1.9 2.1 2.5 4.4 1.9 2.1 2.5
Sweden 1 4.0 2.8 3.0 3.7 4.0 2.8 3.0 3.7
United Kingdom
UK: England and Wales 2 4.2 2.9 3.1 4.2 4.5 3.0 3.2 4.5
UK: Scotland 1 4.1 2.5 2.8 3.7 4.8 2.6 2.9 3.8
UK: Northern Ireland 1 3.3 2.3 2.6 3.3 3.3 2.3 2.6 3.3
Iceland 2 2.4 2.0 2.0 2.0 2.4 2.0 2.0 2.0
Norway 1 3.6 2.2 2.3 3.0 3.7 2.2 2.3 3.0
Switzerland 1 3.7 2.0 2.4 3.0 4.4 2.1 2.5 3.3
NOTES: Fetal mortality rate per 1000 total births = ((number of fetal death)/(number of total births))*1000 Euro-Peristat requested data for all births at 22 completed weeks of gestation or with a birth weight of 500 grams if gestational age was missing. In Germany, 124 fetal deaths among 869 infants with birthweight below 500 g were documented in the database * this includes births with unknown GA 22+ weeks 1: In Bulgaria and Lithuania, all live births with unknown GA (N=2476 for Bulgaria; N=2579 for Lithuania) were considered as live births occurring at 24+ weeks of gestational age and all live births with unknown BW (N=2772 for Bulgaria; N=2579 for Lithuania) were considered as live births occurring at 1000+ grams
C1_B: Fetal mortality rate by gestational age and birth weight (rates per 1000 total births)

155
Fetal mortality rate per 1000 total births (without terminations, if possible)
Fetal mortality rate per 1000 total births
Country/coverage Source All* ≥1000 g ≥28 weeks ≥24 weeks All* ≥1000 g ≥28 weeks ≥24 weeks
Belgium 1 4.9 3.0 3.1 4.4 4.9 3.0 3.1 4.4
Bulgaria1 1,3 7.3 5.4 5.7 6.9 7.9 5.4 5.7 6.9
Czech Republic 1 3.6 2.5 2.7 3.2 3.6 2.5 2.7 3.2
Denmark 1,2,4 2.9 NA 2.0 2.5 3.4 NA 2.0 2.5
Germany 1 3.5 2.3 2.4 3.1 3.5 2.3 2.4 3.1
Estonia 1,3,4 3.9 2.8 3.1 3.6 3.9 2.8 3.1 3.6
Ireland 1 4.4 2.9 3.4 4.1 4.4 2.9 3.4 4.1
Greece 1 3.4 2.7 3.0 3.4 3.4 2.7 3.0 3.4
Spain 1 3.1 2.3 2.7 3.1 3.1 2.3 2.7 3.1
France 5 5.0 2.1 3.0 3.9 8.7 3.3 4.4 6.8
France (Survey, 2016) 1 5.9 2.6 3.0 4.3 10.2 4.4 4.8 7.7
Croatia 1 4.7 3.0 3.2 4.3 4.7 3.0 3.2 4.3
Italy 8 3.7 2.2 2.4 3.0 4.7 2.2 2.4 3.0
Cyprus 1 3.3 1.1 1.4 1.8 3.3 1.1 1.4 1.8
Latvia 3 4.9 3.2 3.4 3.9 4.9 3.2 3.4 3.9
Lithuania1 1,2,3 4.0 2.7 2.9 3.6 4.0 2.7 2.9 3.6
Luxembourg 1 4.4 2.0 2.3 3.2 8.3 3.8 3.9 6.3
Hungary 1 5.7 3.4 3.7 4.4 6.2 3.4 3.7 4.4
Malta 1,2 4.0 1.8 2.5 3.4 4.0 1.8 2.5 3.4
Netherlands 1 4.8 2.1 2.2 2.9 4.8 2.1 2.2 2.9
Austria 1 3.3 2.3 2.4 2.9 3.3 2.3 2.4 2.9
Poland 1 3.5 2.4 2.5 3.1 3.5 2.4 2.5 3.1
Portugal 1 3.3 NA 2.5 3.1 3.3 NA 2.5 3.1
Romania 3 3.7 3.4 3.6 3.6 3.7 3.4 3.6 3.6
Slovenia 1 3.1 2.0 2.4 3.0 6.1 3.3 3.6 5.3
Slovakia 1 3.7 3.5 3.5 3.6 3.7 3.5 3.5 3.6
Finland 1 3.1 1.9 2.1 2.5 4.4 1.9 2.1 2.5
Sweden 1 4.0 2.8 3.0 3.7 4.0 2.8 3.0 3.7
United Kingdom
UK: England and Wales 2 4.2 2.9 3.1 4.2 4.5 3.0 3.2 4.5
UK: Scotland 1 4.1 2.5 2.8 3.7 4.8 2.6 2.9 3.8
UK: Northern Ireland 1 3.3 2.3 2.6 3.3 3.3 2.3 2.6 3.3
Iceland 2 2.4 2.0 2.0 2.0 2.4 2.0 2.0 2.0
Norway 1 3.6 2.2 2.3 3.0 3.7 2.2 2.3 3.0
Switzerland 1 3.7 2.0 2.4 3.0 4.4 2.1 2.5 3.3
C2_A: Neonatal mortality rate (numbers and rates per 1000 live births)
Number oflive births*
Annual deaths Cohort deaths
Number of neonatal deaths Neonatal mortality rate per 1000 live births
Number of neonatal deaths Neonatal mortality rate per 1000 live births
Country/coverage Source All(day 0-27)
Early(day 0-6
Late(day 7-27)
All(day 0-27)
Early1
(day 0-6)Late2
(day 7-27)Source All
(day 0-27)Early
(day 0-6)Late
(day 7-27)All
(day 0-27)Early3
(day 0-6)Late4
(day 7-27)*
Belgium 122 240 NA NA NA NA NA NA 1 254 194 60 2.1 1.6 0.5
Bulgaria (2014) 1 67 585 298 211 87 4.4 3.1 1.3 NA NA NA NA NA NA
Czech Republic 1 110 764 165 106 59 1.5 1.0 0.5 NA NA NA NA NA NA
Denmark 57 677 NA NA NA NA NA NA 1,2,4 109 89 20 1.9 1.5 0.3
Germany 2 737 575 1700 1352 348 2.3 1.8 0.5 NA NA NA NA NA NA
Estonia 1,3 13 907 21 16 5 1.5 1.2 0.4 1,3 21 16 5 1.5 1.2 0.4
Ireland5 65 623 NA NA NA NA NA NA 1 NA 178 NA NA 2.7 NA
Greece 1 91 847 260 179 81 2.8 1.9 0.9 NA NA NA NA NA NA
Spain 1 420 283 771 519 252 1.8 1.2 0.6 NA NA NA NA NA NA
France 2,3 760 421 1860 1285 575 2.4 1.7 0.8 NA NA NA NA NA NA
France (Survey, 2016) 13 232 NA NA NA NA NA NA NA NA NA NA NA NA
Croatia 2 37 252 116 82 34 3.1 2.2 0.9 1 119 84 35 3.2 2.3 0.9
Italy 4 484 777 1055 809 246 2.2 1.7 0.5 NA NA NA NA NA NA
Cyprus 1,2 9394 18 15 3 1.9 1.6 0.3 1,2 18 15 3 1.9 1.6 0.3
Latvia 3 21 720 55 45 10 2.5 2.1 0.5 3 54 45 9 2.5 2.1 0.4
Lithuania 2,3 31 475 74 53 21 2.4 1.7 0.7 1,2,3 74 53 21 2.4 1.7 0.7
Luxembourg 2 6832 11 9 2 1.6 1.3 0.3 NA NA NA NA NA NA
Hungary 1 91 680 245 155 90 2.7 1.7 1.0 NA NA NA NA NA NA
Malta 4435 NA NA NA NA NA NA 1,2 16 12 4 3.6 2.7 0.9
Netherlands 168 425 NA NA NA NA NA NA 1 511 431 80 3.0 2.6 0.5
Austria 1 83 607 163 130 33 1.9 1.6 0.4 1 161 130 31 1.9 1.6 0.4
Poland (2014) 1 375 647 1074 772 302 2.9 2.1 0.8 NA NA NA NA NA NA
Portugal 85 762 NA NA NA NA NA NA 1 177 118 59 2.1 1.4 0.7
Romania 3 201 023 859 595 264 4.3 3.0 1.3 NA NA NA NA NA NA
Slovenia 20 273 NA NA NA NA NA NA 1 15 12 3 0.7 0.6 0.1
Slovakia 1 55 615 110 84 26 2.0 1.5 0.5 NA NA NA NA NA NA
Finland 1,2 55 588 69 53 16 1.2 1.0 0.3 1 73 55 18 1.3 1.0 0.3
Sweden (2014) 1 115 246 177 141 36 1.5 1.2 0.3 NA NA NA NA NA NA
United Kingdom 1 1739 1293 446 2.2 1.7 0.6
UK: England and Wales (2014)
1 694 312 1503 1123 380 2.2 1.6 0.5 NA NA NA NA NA NA
UK: Scotland 1,2 54 288 102 73 29 1.9 1.3 0.5 1 82 53 29 1.5 1.0 0.5
UK: Northern Ireland 2 24 462 88 77 11 3.6 3.1 0.4 2 88 77 11 3.6 3.1 0.4
Iceland 1 4088 5 4 1 1.2 1.0 0.2 NA NA NA NA NA NA
Norway 1 59 711 86 70 16 1.4 1.2 0.3 1 87 70 17 1.5 1.2 0.3
Switzerland (2014) 1 84 891 195 159 36 2.3 1.9 0.4 1 192 156 36 2.3 1.8 0.4
1. Annual early neonatal mortality rate per 1000 live births = ((number of early neonatal deaths occurring during the year)/(number of live births occurring during the year))*1000 2. Annual late neonatal mortality rate per 1000 live births = ((number of late neonatal deaths occurring during the year)/(number of live births occurring during the year))*1000 3. Cohort early neonatal mortality rate per 1000 live births = ((number of early neonatal deaths occurring to babies born during the year)/(number of total live births occurring during the year))*1000 4. Cohort late neonatal mortality rate per 1000 live births = ((number of late neonatal deaths occurring to babies born during the year)/(number of live births occurring during the year))*1000 5. In Ireland, information on late neonatal deaths is unavailable (see C3 Infant mortality) Inclusion criteria were based on gestational age 22+ weeks; if gestational age was missing, births were included if birth weight was at least 500 grams.

EUROPEAN PERINATAL HEALTH REPORT
156
C2_B: Neonatal mortality rate for births at ≥24 weeks of gestation
Number of live births Number of neonatal deaths Neonatal mortality rate
Country/coverage Source Inclusion criteria for live births
All ≥24 weeks* All ≥24 weeks* All ≥24 weeks*
Belgium 1 22+ weeks or 500+ g 122 240 120 579 254 197 2.1 1.6
Bulgaria1 (2014) 1 22+ weeks 67 585 67 576 298 283 4.4 4.2
Czech Republic 1 22+ weeks or 500+ g, if BW unavailable
110 764 108 188 165 131 1.5 1.2
Denmark 1,2,4 22+ weeks 57 677 57 588 109 81 1.9 1.4
Germany 2 22+ weeks 737 575 NA 1700 NA 2.3 NA
Estonia 1,3 22+ weeks 13 907 13 898 21 17 1.5 1.2
Ireland 1 22+ weeks 65 623 65 564 NA NA NA NA
Greece 1 22+ weeks 91 847 91 139 260 NA 2.8 NA
Spain 1 180+ days / 500 g 420 283 356 164 771 NA 1.8 NA
France 2,3 22+ weeks or 500+ g 760 421 757 789 1860 1592 2.4 2.1
France (Survey, 2016) 22+ weeks 13 232 13 203 NA NA NA NA
Croatia 1 22+ weeks 37 252 37 231 119 101 3.2 2.7
Italy 4 22+ weeks 484 777 482 771 1055 NA 2.2 NA
Cyprus 1,2 22+ weeks 9394 9230 18 12 1.9 1.3
Latvia 3 22+ weeks 21 720 21 712 54 48 2.5 2.2
Lithuania1 1,2,3 22+ weeks 31 475 31 464 74 64 2.4 2.0
Luxembourg 2 22+ weeks 6832 6830 11 8 1.6 1.2
Hungary2 1 22+ weeks 91 680 91 595 245 217 2.7 2.4
Malta 1,2 22+ weeks or 500+ g 4435 4433 16 14 3.6 3.2
Netherlands 1 22+ weeks or 500+ g 168 425 165 631 511 328 3.0 2.0
Austria 1 22+ weeks 83 607 83 543 161 113 1.9 1.4
Poland (2014) 1 22+ weeks 375 647 375 443 1074 912 2.9 2.4
Portugal 1 22+ weeks (incomplete at 22-23 weeks)
85 762 85 578 177 NA 2.1 NA
Romania 3 22+ weeks 201 023 201 004 859 706 4.3 3.5
Slovenia 1 22+ weeks 20 273 20 262 15 8 0.7 0.4
Slovakia 1 22+ weeks 55 615 55 608 110 106 2.0 1.9
Finland 1 22+ weeks 55 588 55 497 73 65 1.3 1.2
Sweden (2014) 1 22+ weeks 115 246 115 163 177 148 1.5 1.3
United Kingdom 1 22+ weeks 1739 1366
UK: England and Wales (2014)
1 22+ weeks 694 312 670 439 1503 1136 2.2 1.7
UK: Scotland 1,2 22+ weeks 54 288 NA 102 NA 1.9 NA
UK: Northern Ireland 1 22+ weeks 24 462 24 451 88 80 3.6 3.3
Iceland 1 22+ weeks 4088 4080 5 2 1.2 0.5
Norway 1 22+ weeks 59 711 59 487 87 71 1.5 1.2
Switzerland (2014) 1 22+ weeks or 500+ g 84 891 84 820 192 149 2.3 1.8
We used cohort data, but when these were not available, we used annual data (except for Scotland where the annual data were considered to be more complete) * excluding births with unknown GA 24+ weeks Note: 1. In Bulgaria and Lithuania, all live births with unknown GA (N=2476 for Bulgaria; N=2579 for Lithuania) were considered as live births occured at 24+ weeks of gestational age 2. In Hungary, late neonatal deaths with unknown GA (N=90) were considered as 24+ weeks

157
Number of
live birth
Annual deaths Cohort deaths
Country/coverage Source Inclusion criteria for live births Infant deaths Infant mortality rate
Infant deaths Infant mortality rate
Belgium 1 22+ weeks or 500+ g 122 240 NA NA 381 3.1
Bulgaria (2014) 1 22+ weeks 67 585 517 7.6 NA NA
Czech Republic 1 22+ weeks or 500+ g, if BW unavailable
110 764 272 2.5 NA NA
Denmark 1,2,4 22+ weeks 57 677 NA NA 151 2.6
Germany 2 22+ weeks 737 575 2405 3.3 NA NA
Estonia 5,3 22+ weeks 13 907 35 2.5 40 2.9
Ireland 1,2 22+ weeks 65 623 225 3.4 NA NA
Greece 1 22+ weeks 91 847 364 4.0 NA NA
Spain 1 180+ days / 500 g 420 283 1139 2.7 NA NA
France 2,3 22+ weeks or 500+ g 760 421 2655 3.5 NA NA
France (Survey, 2016) 22+ weeks 13 232 NA NA NA NA
Croatia 1,2 22+ weeks 37 252 154 4.1 143 3.8
Italy 4 22+ weeks 484 777 1506 3.1 NA NA
Cyprus 2 22+ weeks 9394 24 2.6 20 2.1
Latvia 3 22+ weeks 21 720 90 4.1 93 4.3
Lithuania 2,3 22+ weeks 31 475 132 4.2 111 3.5
Luxembourg 2,3 22+ weeks 6832 16 2.3 NA NA
Hungary 1 22+ weeks 91 680 383 4.2 NA NA
Malta 2 22+ weeks or 500+ g 4435 NA NA 23 5.2
Netherlands 3 22+ weeks or 500+ g 168 425 597 3.5 NA NA
Austria 1 22+ weeks 83 607 221 2.6 196 2.3
Poland (2014) 1 22+ weeks 375 647 1573 4.2 NA NA
Portugal 1 22+ weeks (incomplete at 22-23 weeks)
85 762 254 3.0 NA NA
Romania 3 22+ weeks 201 023 1493 7.4 NA NA
Slovenia 2 22+ weeks 20 273 NA NA 34 1.7
Slovakia 1 22+ weeks 55 615 110 2.0 NA NA
Finland 1,2 22+ weeks 55 588 96 1.7 92 1.7
Sweden (2014) 1 22+ weeks 115 246 261 2.3 NA NA
United Kingdom 22+ weeks NA NA NA NA
UK: England and Wales, 2014
1 22+ weeks 694 312 2204 3.2 NA NA
UK: Scotland 1,2 22+ weeks 54 288 158 2.9 136 2.5
UK: Northern Ireland 3 22+ weeks 24 462 124 5.1 124 5.1
Iceland 1 22+ weeks 4088 6 1.5 NA NA
Norway 1 22+ weeks 59 711 118 2.0 130 2.2
Switzerland (2014) 1 22+ weeks or 500+ g 84 891 259 3.1 254 3.0
C3: Infant mortality rate (numbers and rates per 1000 live births)
Number of live births Number of neonatal deaths Neonatal mortality rate
Country/coverage Source Inclusion criteria for live births
All ≥24 weeks* All ≥24 weeks* All ≥24 weeks*
Belgium 1 22+ weeks or 500+ g 122 240 120 579 254 197 2.1 1.6
Bulgaria1 (2014) 1 22+ weeks 67 585 67 576 298 283 4.4 4.2
Czech Republic 1 22+ weeks or 500+ g, if BW unavailable
110 764 108 188 165 131 1.5 1.2
Denmark 1,2,4 22+ weeks 57 677 57 588 109 81 1.9 1.4
Germany 2 22+ weeks 737 575 NA 1700 NA 2.3 NA
Estonia 1,3 22+ weeks 13 907 13 898 21 17 1.5 1.2
Ireland 1 22+ weeks 65 623 65 564 NA NA NA NA
Greece 1 22+ weeks 91 847 91 139 260 NA 2.8 NA
Spain 1 180+ days / 500 g 420 283 356 164 771 NA 1.8 NA
France 2,3 22+ weeks or 500+ g 760 421 757 789 1860 1592 2.4 2.1
France (Survey, 2016) 22+ weeks 13 232 13 203 NA NA NA NA
Croatia 1 22+ weeks 37 252 37 231 119 101 3.2 2.7
Italy 4 22+ weeks 484 777 482 771 1055 NA 2.2 NA
Cyprus 1,2 22+ weeks 9394 9230 18 12 1.9 1.3
Latvia 3 22+ weeks 21 720 21 712 54 48 2.5 2.2
Lithuania1 1,2,3 22+ weeks 31 475 31 464 74 64 2.4 2.0
Luxembourg 2 22+ weeks 6832 6830 11 8 1.6 1.2
Hungary2 1 22+ weeks 91 680 91 595 245 217 2.7 2.4
Malta 1,2 22+ weeks or 500+ g 4435 4433 16 14 3.6 3.2
Netherlands 1 22+ weeks or 500+ g 168 425 165 631 511 328 3.0 2.0
Austria 1 22+ weeks 83 607 83 543 161 113 1.9 1.4
Poland (2014) 1 22+ weeks 375 647 375 443 1074 912 2.9 2.4
Portugal 1 22+ weeks (incomplete at 22-23 weeks)
85 762 85 578 177 NA 2.1 NA
Romania 3 22+ weeks 201 023 201 004 859 706 4.3 3.5
Slovenia 1 22+ weeks 20 273 20 262 15 8 0.7 0.4
Slovakia 1 22+ weeks 55 615 55 608 110 106 2.0 1.9
Finland 1 22+ weeks 55 588 55 497 73 65 1.3 1.2
Sweden (2014) 1 22+ weeks 115 246 115 163 177 148 1.5 1.3
United Kingdom 1 22+ weeks 1739 1366
UK: England and Wales (2014)
1 22+ weeks 694 312 670 439 1503 1136 2.2 1.7
UK: Scotland 1,2 22+ weeks 54 288 NA 102 NA 1.9 NA
UK: Northern Ireland 1 22+ weeks 24 462 24 451 88 80 3.6 3.3
Iceland 1 22+ weeks 4088 4080 5 2 1.2 0.5
Norway 1 22+ weeks 59 711 59 487 87 71 1.5 1.2
Switzerland (2014) 1 22+ weeks or 500+ g 84 891 84 820 192 149 2.3 1.8

EUROPEAN PERINATAL HEALTH REPORT
158
C3: Infant mortality rate, births ≥22 weeks of gestation in 2010
Number of live births Percentage of live births
birth weight in grams
Country/coverage Source All stated Not stated <500 500-1499 1500-2499 2500-4499 ≥4500
Belgium 1 120 600 1640 0.0 0.9 6.0 92.2 0.9
Bulgaria (2014) 1 64 813 2772 0.0 1.4 8.5 89.7 0.5
Czech Republic 1 109 141 1623 0.0 1.1 6.6 91.5 0.8
Denmark 1,2,4 57 227 450 0.0 0.7 4.2 92.5 2.5
Germany 1 725 913 24 0.1 1.2 5.7 91.8 1.2
Estonia 1 13 906 1 0.0 0.8 3.3 93.1 2.8
Ireland 1 65 623 0 0.0 0.9 4.8 92.1 2.2
Greece 1 90 772 1075 0.0 1.1 8.2 90.5 0.2
Spain 1 398 786 21 497 0.0 0.9 7.4 91.1 0.6
France 5 759 099 0 0.0 1.0 6.4 91.9 0.7
France (Survey 2016) 1 13 215 17 0.0 1.0 6.4 91.8 0.7
Croatia 1 37 252 0 0.0 0.8 4.3 93.5 1.4
Italy 1 484 399 378 0.0 1.0 6.4 92.1 0.5
Cyprus 1 9358 36 0.0 1.2 9.4 89.2 0.2
Latvia 1 21 720 0 0.0 0.7 3.8 92.7 2.8
Lithuania1 1,2 28 896 2579 0.0 0.7 3.8 93.4 2.1
Luxembourg 1 6831 1 0.0 0.8 5.8 92.7 0.6
Hungary 1 91 645 35 0.0 1.4 7.1 90.5 1.0
Malta 1 4431 4 0.0 0.9 5.3 93.2 0.5
Netherlands 1 168 007 418 0.1 0.9 5.1 92.1 1.8
Austria 1 83 607 0 0.0 0.9 5.5 92.5 0.9
Poland (2014) 1 375 638 9 0.0 0.9 5.0 92.7 1.4
Portugal 1 85 727 35 0.0 1.0 7.9 90.8 0.3
Romania 5 201 023 0 0.0 0.9 7.0 91.6 0.5
Slovenia 1 20 273 0 0.0 1.0 5.4 92.6 1.1
Slovakia 1 55 615 0 0.0 0.9 6.7 91.5 0.8
Finland 1 55 537 51 0.0 0.6 3.6 93.5 2.3
Sweden (2014) 1 115 210 36 0.0 0.7 3.5 92.3 3.4
United Kingdom
UK: England and Wales 1 683 997 8905 0.1 0.9 6.0 91.4 1.6
UK: Scotland 1 54 231 57 0.0 0.9 5.9 91.1 2.0
UK: Northern Ireland 1 24 440 22 0.0 0.8 5.4 91.6 2.1
Iceland 1 4088 0 0.1 0.6 3.6 91.3 4.3
Norway 1 59 710 1 0.0 0.8 3.7 92.5 3.0
Switzerland (2014) 1 84 881 10 0.0 0.9 5.5 92.9 0.8 Note 1. In Lithuania, live births with unknown GA and BW are not included.

159
Number of live births Percentage of live births
birth weight in grams
Country/coverage Source All stated Not stated <500 500-1499 1500-2499 2500-4499 ≥4500
Belgium 1 120 600 1640 0.0 0.9 6.0 92.2 0.9
Bulgaria (2014) 1 64 813 2772 0.0 1.4 8.5 89.7 0.5
Czech Republic 1 109 141 1623 0.0 1.1 6.6 91.5 0.8
Denmark 1,2,4 57 227 450 0.0 0.7 4.2 92.5 2.5
Germany 1 725 913 24 0.1 1.2 5.7 91.8 1.2
Estonia 1 13 906 1 0.0 0.8 3.3 93.1 2.8
Ireland 1 65 623 0 0.0 0.9 4.8 92.1 2.2
Greece 1 90 772 1075 0.0 1.1 8.2 90.5 0.2
Spain 1 398 786 21 497 0.0 0.9 7.4 91.1 0.6
France 5 759 099 0 0.0 1.0 6.4 91.9 0.7
France (Survey 2016) 1 13 215 17 0.0 1.0 6.4 91.8 0.7
Croatia 1 37 252 0 0.0 0.8 4.3 93.5 1.4
Italy 1 484 399 378 0.0 1.0 6.4 92.1 0.5
Cyprus 1 9358 36 0.0 1.2 9.4 89.2 0.2
Latvia 1 21 720 0 0.0 0.7 3.8 92.7 2.8
Lithuania1 1,2 28 896 2579 0.0 0.7 3.8 93.4 2.1
Luxembourg 1 6831 1 0.0 0.8 5.8 92.7 0.6
Hungary 1 91 645 35 0.0 1.4 7.1 90.5 1.0
Malta 1 4431 4 0.0 0.9 5.3 93.2 0.5
Netherlands 1 168 007 418 0.1 0.9 5.1 92.1 1.8
Austria 1 83 607 0 0.0 0.9 5.5 92.5 0.9
Poland (2014) 1 375 638 9 0.0 0.9 5.0 92.7 1.4
Portugal 1 85 727 35 0.0 1.0 7.9 90.8 0.3
Romania 5 201 023 0 0.0 0.9 7.0 91.6 0.5
Slovenia 1 20 273 0 0.0 1.0 5.4 92.6 1.1
Slovakia 1 55 615 0 0.0 0.9 6.7 91.5 0.8
Finland 1 55 537 51 0.0 0.6 3.6 93.5 2.3
Sweden (2014) 1 115 210 36 0.0 0.7 3.5 92.3 3.4
United Kingdom
UK: England and Wales 1 683 997 8905 0.1 0.9 6.0 91.4 1.6
UK: Scotland 1 54 231 57 0.0 0.9 5.9 91.1 2.0
UK: Northern Ireland 1 24 440 22 0.0 0.8 5.4 91.6 2.1
Iceland 1 4088 0 0.1 0.6 3.6 91.3 4.3
Norway 1 59 710 1 0.0 0.8 3.7 92.5 3.0
Switzerland (2014) 1 84 881 10 0.0 0.9 5.5 92.9 0.8
Note 1. In Lithuania, live births with unknown GA and BW are not included.
C4_B: Distribution of birth weight by plurality for live births in 2010
% live births % of live singleton births
% of live multiple births
Birth weight (g) Birth weight (g) Birth weight (g)
Country/coverage
Source <1500 1500-2499
All stated
<1500 1500-2499
All stated*
<1500 1500-2499
All stated*
Belgium 1 0.9 6.0 120 600 0.7 4.5 116 452 8.1 48.2 4148
Bulgaria (2014) 1 1.4 8.5 64 813 0.9 6.8 62 533 12.6 54.4 2280
Czech Republic 1 1.2 6.6 109 141 0.8 5.2 105 930 11.5 52.4 3211
Denmark 1,2,4 0.8 4.2 57 227 0.5 3.1 55 320 7.4 38.3 1907
Germany 1 1.3 5.7 725 913 0.9 4.1 11.9 45.9
Estonia 1 0.8 3.3 13 906 0.5 2.4 13 453 10.8 30.9 453
Ireland 1 0.9 4.8 65 623 0.6 3.3 63 158 8.8 41.3 2465
Greece 1 1.1 8.2 90 772 0.7 5.4 86 096 9.2 59.6 4676
Spain 1 1.0 7.4 398 786 0.7 5.4 381 254 7.1 51.2 17 532
France 5 1.0 6.4 759 099 0.8 5.0 735 321 8.0 47.8 23 778
France (Survey, 2016)
1 1.1 6.4 13 215 0.8 5.0 12 757 9.8 45.6 458
Croatia 1 0.8 4.3 37 252 0.7 3.2 36 150 6.6 39.0 1102
Italy 1 1.0 6.4 484 399 0.7 4.8 468 226 9.2 53.0 16 173
Cyprus 1 1.2 9.4 9358 0.6 6.7 8 876 11.0 60.2 482
Latvia 1 0.7 3.8 21 720 0.6 2.8 21 073 5.7 34.6 647
Lithuania1 1 0.7 3.8 28 896 0.5 2.9 28 097 6.9 33.4 799
Luxembourg 1 0.9 5.8 6831 0.5 4.2 6 590 10.8 49.4 241
Hungary 1 1.4 7.1 91 645 NA NA NA NA NA NA
Malta 1 1.0 5.3 4431 0.7 3.9 4 299 11.4 52.3 132
Netherlands 1 1.0 5.1 168 007 0.8 3.8 162 728 7.8 43.6 5279
Austria 1 1.0 5.5 83 607 0.7 4.1 81 012 9.6 49.2 2595
Poland (2014) 1 0.9 5.0 375 638 0.7 3.8 365 900 8.4 49.4 9738
Portugal 1 1.0 7.9 85 727 0.7 6.0 82 771 9.5 59.7 2956
Romania 5 0.9 7.0 201 023 0.7 6.1 196 892 8.7 50.7 4131
Slovenia 1 1.0 5.4 20 273 0.7 3.7 19 497 8.6 48.5 776
Slovakia 1 1.0 6.7 55 615 0.8 5.6 54 217 8.8 50.6 1398
Finland 1 0.6 3.6 55 537 0.5 2.6 54 061 6.8 38.2 1476
Sweden (2014) 1 0.8 3.5 115 210 0.6 2.6 111 811 7.7 35.0 3399
United Kingdom
UK: England and Wales
1 1.0 6.0 683 997 0.8 4.7 663 099 8.7 48.7 20 898
UK: Scotland 1 0.9 5.9 54 230 0.7 4.6 52 673 8.0 49.5 1557
UK: Northern Ireland 1 0.9 5.4 24 440 0.6 4.0 23 740 9.0 51.1 700
Iceland 1 0.7 3.6 4088 0.6 2.2 3 945 5.6 43.4 143
Norway 1 0.8 3.7 59 710 0.6 2.5 57 732 6.9 38.7 1978
Switzerland (2014) 1 0.9 5.5 84 881 0.6 3.9 81 833 8.6 47.6 3048

EUROPEAN PERINATAL HEALTH REPORT
160
C5_A: Distribution of gestational age for live births
Number of live births Percentage of live births
Gestational age in weeks
Country/coverage Source All stated Not stated 22-23 24-27 28-31 32-36 37-38 39-41 ≥42
Belgium 1 120 627 1613 0.0 0.3 0.7 7.0 26.7 65.1 0.2
Bulgaria (2014) 1 65 109 2476 0.0 0.2 0.8 6.3 21.5 70.5 0.6
Czech Republic 1 108 220 2544 0.0 0.3 0.8 6.4 19.1 70.2 3.1
Denmark 1,2,4 57 619 58 0.1 0.3 0.6 5.3 18.8 72.9 2.1
Germany 1 725 680 266 0.1 0.4 0.9 7.2 25.4 65.6 0.5
Estonia 1 13 906 1 0.1 0.3 0.7 4.7 17.8 73.9 2.6
Ireland 1 65 613 10 0.1 0.2 0.7 5.4 19.1 72.1 2.4
Greece 1 91 175 672 0.0 0.3 0.9 10.1 43.7 45.0
Spain 1 356 197 64,086 0.0 0.3 0.7 6.6 23.1 67.7 1.6
France 5 758 056 0 0.0 0.3 0.7 6.1 21.6 70.4 0.8
France (Survey, 2016)
1 13 212 20 0.1 0.4 0.8 6.3 22.9 69.1 0.5
Croatia 1 37 252 0 0.1 0.3 0.5 5.6 21.9 69.5 2.0
Italy 1 482 976 1801 0.0 0.3 0.7 6.6 27.8 63.7 0.9
Cyprus 1 9237 157 0.1 0.3 0.8 10.9 43.7 44.1 0.2
Latvia 1 21 720 0 0.0 0.3 0.6 4.8 17.7 75.4 1.1
Lithuania1 1,2 28 896 2579 0.0 0.2 0.5 4.6 16.4 78.2 0.1
Luxembourg 1 6831 1 0.0 0.2 0.8 6.3 30.2 62.4 0.1
Hungary 1 91 635 45 0.0 0.5 0.9 7.3 26.5 64.6 0.2
Malta 1 4435 0 0.0 0.3 0.5 5.8 30.6 62.5 0.2
Netherlands 1 165 833 2592 0.1 0.3 0.7 5.8 23.6 68.2 1.3
Austria 1 83 607 0 0.1 0.3 0.8 6.7 24.5 67.3 0.4
Poland (2014) 1 375 642 5 0.1 0.3 0.7 6.2 22.1 69.1 1.5
Portugal 1 85 591 171 0.0 0.2 0.8 7.0 27.0 64.8 0.1
Romania 5 201 023 0 0.0 0.2 0.9 7.4 27.3 63.7 0.6
Slovenia 1 20 273 0 0.1 0.3 0.8 6.4 19.8 72.0 0.7
Slovakia 1 55 615 0 0.0 0.3 0.7 6.0 20.9 71.5 0.6
Finland 1 55 516 72 0.0 0.2 0.5 5.0 18.0 72.3 4.0
Sweden (2014) 1 115 229 17 0.1 0.3 0.6 4.8 18.5 68.8 7.0
United Kingdom
UK: England and Wales
1 692 902 3155 0.1 0.3 0.8 6.4 20.8 68.9 2.7
UK: Scotland 1 54 057 231 0.0 0.3 0.7 7.1 19.6 70.3 1.9
UK: Northern Ireland
1 24 462 0 0.0 0.2 0.8 6.3 20.5 71.3 0.8
Iceland 1 4086 2 0.1 0.2 0.5 5.3 16.8 75.2 1.9
Norway 1 59 513 198 0.0 0.3 0.6 5.3 18.3 71.7 3.8
Switzerland (2014) 1 84 866 25 0.1 0.3 0.6 6.2 26.5 65.7 0.5
Note 1. In Lithuania, live births with unknown GA and BW are not included.

161
C5_B: Distribution of gestational age by plurality for live births
Number of live births Percentage of live births
Gestational age in weeks
Country/coverage Source All stated Not stated 22-23 24-27 28-31 32-36 37-38 39-41 ≥42
Belgium 1 120 627 1613 0.0 0.3 0.7 7.0 26.7 65.1 0.2
Bulgaria (2014) 1 65 109 2476 0.0 0.2 0.8 6.3 21.5 70.5 0.6
Czech Republic 1 108 220 2544 0.0 0.3 0.8 6.4 19.1 70.2 3.1
Denmark 1,2,4 57 619 58 0.1 0.3 0.6 5.3 18.8 72.9 2.1
Germany 1 725 680 266 0.1 0.4 0.9 7.2 25.4 65.6 0.5
Estonia 1 13 906 1 0.1 0.3 0.7 4.7 17.8 73.9 2.6
Ireland 1 65 613 10 0.1 0.2 0.7 5.4 19.1 72.1 2.4
Greece 1 91 175 672 0.0 0.3 0.9 10.1 43.7 45.0
Spain 1 356 197 64,086 0.0 0.3 0.7 6.6 23.1 67.7 1.6
France 5 758 056 0 0.0 0.3 0.7 6.1 21.6 70.4 0.8
France (Survey, 2016)
1 13 212 20 0.1 0.4 0.8 6.3 22.9 69.1 0.5
Croatia 1 37 252 0 0.1 0.3 0.5 5.6 21.9 69.5 2.0
Italy 1 482 976 1801 0.0 0.3 0.7 6.6 27.8 63.7 0.9
Cyprus 1 9237 157 0.1 0.3 0.8 10.9 43.7 44.1 0.2
Latvia 1 21 720 0 0.0 0.3 0.6 4.8 17.7 75.4 1.1
Lithuania1 1,2 28 896 2579 0.0 0.2 0.5 4.6 16.4 78.2 0.1
Luxembourg 1 6831 1 0.0 0.2 0.8 6.3 30.2 62.4 0.1
Hungary 1 91 635 45 0.0 0.5 0.9 7.3 26.5 64.6 0.2
Malta 1 4435 0 0.0 0.3 0.5 5.8 30.6 62.5 0.2
Netherlands 1 165 833 2592 0.1 0.3 0.7 5.8 23.6 68.2 1.3
Austria 1 83 607 0 0.1 0.3 0.8 6.7 24.5 67.3 0.4
Poland (2014) 1 375 642 5 0.1 0.3 0.7 6.2 22.1 69.1 1.5
Portugal 1 85 591 171 0.0 0.2 0.8 7.0 27.0 64.8 0.1
Romania 5 201 023 0 0.0 0.2 0.9 7.4 27.3 63.7 0.6
Slovenia 1 20 273 0 0.1 0.3 0.8 6.4 19.8 72.0 0.7
Slovakia 1 55 615 0 0.0 0.3 0.7 6.0 20.9 71.5 0.6
Finland 1 55 516 72 0.0 0.2 0.5 5.0 18.0 72.3 4.0
Sweden (2014) 1 115 229 17 0.1 0.3 0.6 4.8 18.5 68.8 7.0
United Kingdom
UK: England and Wales
1 692 902 3155 0.1 0.3 0.8 6.4 20.8 68.9 2.7
UK: Scotland 1 54 057 231 0.0 0.3 0.7 7.1 19.6 70.3 1.9
UK: Northern Ireland
1 24 462 0 0.0 0.2 0.8 6.3 20.5 71.3 0.8
Iceland 1 4086 2 0.1 0.2 0.5 5.3 16.8 75.2 1.9
Norway 1 59 513 198 0.0 0.3 0.6 5.3 18.3 71.7 3.8
Switzerland (2014) 1 84 866 25 0.1 0.3 0.6 6.2 26.5 65.7 0.5
% of live births % of live singleton births % of live multiple births
Gestational age in weeks Gestational age in weeks Gestational age in weeks
Country/coverage Source All stated <32 32-36 All Stated <32 32-36 All Stated <32 32-36
Belgium 1 120 627 1.1 7.0 116 474 0.8 5.5 4153 9.5 49.1
Bulgaria (2014) 1 65 109 1.1 6.3 62 819 0.8 4.9 2290 9.0 43.0
Czech Republic 1 108 220 1.1 6.4 105 050 0.9 5.2 3170 10.4 46.4
Denmark 1,2,4 57 619 0.9 5.3 55 692 0.7 4.2 1927 8.3 36.7
Germany 1 725 937 1.3 7.2 698 955 0.9 5.6 27 382 11.7 47.0
Estonia 1 13 906 1.1 4.7 13 453 0.7 3.7 453 12.4 34.2
Ireland 1 65 613 1.1 5.4 63 148 0.7 3.9 2465 9.5 43.8
Greece 1 91 175 1.3 10.1 86 482 0.8 7.3 4693 8.9 61.6
Spain 1 356 197 1.0 6.6 340 215 0.7 4.9 15 982 7.1 42.6
France 5 758 056 1.0 6.1 731 479 0.7 4.8 26 577 8.9 42.6
France (Survey, 2016)
1 13 212 1.2 6.3 12 753 0.9 5.1 459 10.9 38.3
Croatia 1 37 252 0.9 5.6 36 150 0.7 4.6 1102 8.1 40.0
Italy 1 482 976 1.0 6.6 466 813 0.7 5.0 16 163 9.1 51.8
Cyprus 1 9237 1.1 10.9 8756 0.7 8.3 481 9.4 58.8
Latvia 1 21 720 0.9 4.8 21 073 0.8 4.0 647 7.0 31.4
Lithuania1 1 28 896 0.8 4.6 28 097 0.6 3.7 799 7.5 36.9
Luxembourg 1 6831 1.1 6.3 6589 0.5 4.9 242 14.9 42.6
Hungary NA NA NA NA NA NA NA NA NA
Malta 1 4435 0.9 5.8 4303 0.7 4.7 132 8.3 43.2
Netherlands 1 165 833 1.1 5.8 160 578 0.9 4.5 5255 9.0 43.5
Austria 1 83 607 1.2 6.7 81 012 0.9 5.3 2595 10.4 50.2
Poland (2014) 1 375 642 1.1 6.2 365 902 0.8 5.0 9740 9.5 52.8
Portugal 1 85 591 1.0 7.0 82 637 0.7 5.3 2954 9.2 55.5
Romania 5 201 023 1.1 7.4 196 892 0.9 6.6 4131 8.2 41.7
Slovenia 1 20 273 1.1 6.4 19 497 0.8 4.6 776 9.9 50.5
Slovakia 1 55 615 1.0 6.0 54 217 0.8 5.0 1398 9.9 45.0
Finland 1 55 516 0.8 5.0 54 036 0.6 3.9 1480 7.3 45.4
Sweden (2014) 1 115 229 0.9 4.8 111 827 0.7 3.9 3402 8.5 34.2
United Kingdom
UK: England and Wales
1 692 902 1.2 6.4 671 040 0.9 5.0 21 862 9.8 49.3
UK: Scotland 1 54 056 1.1 7.1 52 501 0.9 5.7 1555 8.7 56.2
UK: Northern Ireland
1 24 462 1.1 6.3 23 762 0.8 4.9 700 12.0 53.4
Iceland 1 4086 0.8 5.3 3943 0.6 3.8 143 5.6 48.3
Norway 1 59 513 0.9 5.3 57 543 0.7 4.0 1970 7.7 41.6
Switzerland (2014) 1 84 866 1.0 6.2 81 818 0.7 4.7 3048 9.5 48.5
Note 1. In Lithuania, live births with unknown GA and weight are not included.

EUROPEAN PERINATAL HEALTH REPORT
162
C6_A: Maternal mortality ratio (numbers and ratios per 100 000 live births) from routine statistics
Note: 1. Numbers of deaths for the United Kingdom are the sum of the numbers of registered deaths in England and Wales, Scotland and Northern Ireland
Country/coverage Source Number of live births
(2011-2015)
Number of maternal deaths
Maternal Mortality Ratio
per 100 000 live births
Alternate years of data provided
Enhanced
Belgium 1 629 650 29 4.6
Bulgaria 1 349 643 24 6.9 2010-2014
Czech Republic Yes
Denmark 3,4 287 862 9 3.1
Germany 2 3470 800 145 4.2
Estonia 3,4 69 886 3 4.3 Yes
Ireland 1,2 347 706 9 2.6 Yes
Greece 1 484 929 14 2.9
Spain 1 2266 532 71 3.1 2010-2014
France 3 4107 315 264 6.4 2010-2014 Yes
France (Survey, 2016)
Croatia 2 199 976 11 5.5
Italy 5 2938 004 107 3.6 2006-2012 Yes
Cyprus 4 48 017 3 6.2 Yes
Latvia 2 101 415 25 24.7
Lithuania 2,3 152 423 10 6.6
Luxembourg 3 33 111 2 6.0 2012-2013
Hungary 1,2 450 197 59 13.1
Malta 2 21 392 0 0.0
Netherlands Yes
Austria 2 401 581 44 11.0
Poland 1 1932 709 37 1.9 2010-2014
Portugal 1 437 687 26 5.9
Romania 1 1008 913 151 15.0
Slovenia 2 105 618 6 5.7
Slovakia 2 281 758 12 4.3
Finland 2 291 387 8 2.7
Sweden 1 554 769 20 3.6 2010-2014
United Kingdom1 EW:2Scotland: 2
NI: 3”
3952 352 242 6.1 Yes
Iceland 1 21 766 1 4.6
Norway 1 300 264 13 4.3
Switzerland 1 411 163 20 4.9 2010-2014

163
C6_B: Maternal mortality ratio (numbers and ratios per 100 000 live births) from enhanced data systems
Country/coverage Source Number of live births
(2011-2015)
Number of maternal deaths
Maternal Mortality Ratio
per 100 000 live births
Alternate years of data provided
Enhanced
Belgium 1 629 650 29 4.6
Bulgaria 1 349 643 24 6.9 2010-2014
Czech Republic Yes
Denmark 3,4 287 862 9 3.1
Germany 2 3470 800 145 4.2
Estonia 3,4 69 886 3 4.3 Yes
Ireland 1,2 347 706 9 2.6 Yes
Greece 1 484 929 14 2.9
Spain 1 2266 532 71 3.1 2010-2014
France 3 4107 315 264 6.4 2010-2014 Yes
France (Survey, 2016)
Croatia 2 199 976 11 5.5
Italy 5 2938 004 107 3.6 2006-2012 Yes
Cyprus 4 48 017 3 6.2 Yes
Latvia 2 101 415 25 24.7
Lithuania 2,3 152 423 10 6.6
Luxembourg 3 33 111 2 6.0 2012-2013
Hungary 1,2 450 197 59 13.1
Malta 2 21 392 0 0.0
Netherlands Yes
Austria 2 401 581 44 11.0
Poland 1 1932 709 37 1.9 2010-2014
Portugal 1 437 687 26 5.9
Romania 1 1008 913 151 15.0
Slovenia 2 105 618 6 5.7
Slovakia 2 281 758 12 4.3
Finland 2 291 387 8 2.7
Sweden 1 554 769 20 3.6 2010-2014
United Kingdom1 EW:2Scotland: 2
NI: 3”
3952 352 242 6.1 Yes
Iceland 1 21 766 1 4.6
Norway 1 300 264 13 4.3
Switzerland 1 411 163 20 4.9 2010-2014
Country/coverage Source Number of live births(2011-2015)
Number of maternal deaths
Maternal mortality ratio
per 100 000 live births
Alternate years of data provided
Belgium
Bulgaria
Czech Republic 2 433 860 33 7.6
Denmark
Germany
Estonia 3,4 69 886 9 12.9
Ireland 1,3 347 706 32 9.2
Greece
Spain
France 4 4130 285 369 8.9 2008-2012
France (Survey, 2016)
Croatia
Italy 10 2132 333 207 9.7 2008-2012
Cyprus
Latvia
Lithuania
Luxembourg
Hungary
Malta
Netherlands 2 855 310 44 5.1
Austria
Poland
Portugal
Romania
Slovenia
Slovakia
Finland
Sweden
United Kingdom 2 2341 624 200 8.5 2012-2014
Iceland
Norway
Switzerland

EUROPEAN PERINATAL HEALTH REPORT
164
C7: Multiple birth rate (rates per 1000 women)
Number of women Multiple birth rate per 1000 women
Country/coverage Source All stated Not stated Twins Triplets or more Multiples
Belgium 1 120 681 0 17.3 0.3 17.6
Bulgaria1 (2014) 1 64 427 0 17.8 0.2 18.0
Czech Republic 2 107 618 0 14.5 0.1 14.7
Denmark2 1,2,4 56 895 0 16.9 0.2 17.0
Germany 1 714 574 0 18.8 0.4 19.2
Estonia 1 13 731 0 16.6 0.1 16.7
Ireland 1 64 650 0 18.7 0.5 19.2
Greece3 1 88 554 4 13.2 0.1 13.3
Spain 1 412 266 0 22.1 0.3 22.4
France 5 748 589 0 17.1 0.3 17.5
France (Survey, 2016) 1 13 077 0 17.3 0.4 17.7
Croatia 1 36 866 0 14.8 0.2 15.0
Italy 9 478 003 403 16.4 0.4 16.9
Cyprus 1 9171 0 26.0 0.9 26.8
Latvia 1 21 496 0 15.1 0.1 15.2
Lithuania4 1,2 28 608 0 13.4 0.4 13.7
Luxembourg 1 6762 0 17.9 0.4 18.3
Hungary (2012)3 1 88 819 0 16.0 0.3 16.4
Malta 1 4385 0 15.1 0.2 15.3
Netherlands 1 166 700 0 16.7 0.3 17.0
Austria 1 82 565 0 15.4 0.3 15.7
Poland (2014) 1 372 046 0 13.0 0.2 13.2
Portugal 1 84 556 0 17.3 0.2 17.5
Romania3 1 199 646 0 10.1 0.2 10.4
Slovenia2 1 20 003 0 19.3 0.2 19.5
Slovakia 1 55 112 0 12.7 0.1 12.8
Finland 1 55 080 0 13.4 0.1 13.5
Sweden (2014) 1 113 999 0 14.9 0.2 15.1
United Kingdom
UK: England and Wales 2 689 751 0 15.8 0.2 16.1
UK: Scotland 1 53 689 62 14.2 0.3 14.6
UK: Northern Ireland 3 23 937 0 14.3 0.3 14.6
Iceland 1 4026 0 17.4 0.2 17.6
Norway 1 58 927 0 16.6 0.2 16.9
Switzerland (2014) 1 83 696 0 18.0 0.4 18.3
Note 1. In Bulgaria, mothers of babies with unknown GA are not included. 2. In Denmark and Slovenia, data are based on mothers delivering live or stillbirths (and terminations). 3. In Greece, Hungary and Romania multiple maternity rate was calculated based on number of births. N total births for Greece = 92 159; N total births for Hungary = 90 305; N total births for Romania = 201 760 4. In Lithuania, mothers with babies of unknown GA are not included

165
Number of women Multiple birth rate per 1000 women
Country/coverage Source All stated Not stated Twins Triplets or more Multiples
Belgium 1 120 681 0 17.3 0.3 17.6
Bulgaria1 (2014) 1 64 427 0 17.8 0.2 18.0
Czech Republic 2 107 618 0 14.5 0.1 14.7
Denmark2 1,2,4 56 895 0 16.9 0.2 17.0
Germany 1 714 574 0 18.8 0.4 19.2
Estonia 1 13 731 0 16.6 0.1 16.7
Ireland 1 64 650 0 18.7 0.5 19.2
Greece3 1 88 554 4 13.2 0.1 13.3
Spain 1 412 266 0 22.1 0.3 22.4
France 5 748 589 0 17.1 0.3 17.5
France (Survey, 2016) 1 13 077 0 17.3 0.4 17.7
Croatia 1 36 866 0 14.8 0.2 15.0
Italy 9 478 003 403 16.4 0.4 16.9
Cyprus 1 9171 0 26.0 0.9 26.8
Latvia 1 21 496 0 15.1 0.1 15.2
Lithuania4 1,2 28 608 0 13.4 0.4 13.7
Luxembourg 1 6762 0 17.9 0.4 18.3
Hungary (2012)3 1 88 819 0 16.0 0.3 16.4
Malta 1 4385 0 15.1 0.2 15.3
Netherlands 1 166 700 0 16.7 0.3 17.0
Austria 1 82 565 0 15.4 0.3 15.7
Poland (2014) 1 372 046 0 13.0 0.2 13.2
Portugal 1 84 556 0 17.3 0.2 17.5
Romania3 1 199 646 0 10.1 0.2 10.4
Slovenia2 1 20 003 0 19.3 0.2 19.5
Slovakia 1 55 112 0 12.7 0.1 12.8
Finland 1 55 080 0 13.4 0.1 13.5
Sweden (2014) 1 113 999 0 14.9 0.2 15.1
United Kingdom
UK: England and Wales 2 689 751 0 15.8 0.2 16.1
UK: Scotland 1 53 689 62 14.2 0.3 14.6
UK: Northern Ireland 3 23 937 0 14.3 0.3 14.6
Iceland 1 4026 0 17.4 0.2 17.6
Norway 1 58 927 0 16.6 0.2 16.9
Switzerland (2014) 1 83 696 0 18.0 0.4 18.3
Note 1. In Bulgaria, mothers with babies of unknown GA are not included. 2. In Denmark and Slovenia, data are based on mothers delivering live or stillbirths (and terminations). 3. In Greece, Hungary, and Romania data are based on babies. 4. In Lithuania, mothers with babies of unknown GA and weight are not included. 5. In Hungary and Romania, data are based on live births only. In Hungary, data include 10 births <22 weeks and <500 g which could not be removed.
C8: Distribution of maternal age (rates per 100 women)
Number of WomenPercentage of women delivering live or stillbirths
Age in years
Country/coverage Source All stated Not stated
<15 15-17 18-19 20-24 25-29 30-34 35-39 40-44 45-49 ≥50
Belgium 1 120 618 63 0.0 0.4 1.3 11.9 33.9 33.9 15.2 3.1 0.2 0.0
Bulgaria1 (2014) 1 64 427 0 0.5 4.3 5.4 21.7 30.9 23.6 11.5 2.0 0.1 0.0
Czech Republic 2 107 545 73 0.0 0.0 2.4 12.3 29.9 34.4 17.7 3.2 0.1 0.0
Denmark2 1,2,4 56 895 0 0.0 0.1 0.9 11.0 32.7 34.1 17.3 3.7 0.2 0.0
Germany 1 714 574 0 0.0 0.6 1.6 10.9 28.5 35.3 19.2 3.9 0.2 0.0
Estonia 1 13 731 0 0.0 0.7 2.0 14.6 33.9 29.0 15.6 4.0 0.2 0.0
Ireland 1 64 648 2 0.0 0.5 1.4 8.8 19.0 36.1 28.0 6.0 0.3 0.0
Greece3 1 92 159 0 0.1 1.0 1.4 8.0 22.5 37.3 23.7 5.2 0.7 0.1
Spain 1 412 266 0 0.0 0.7 1.3 7.2 18.0 35.4 29.7 7.1 0.4 0.0
France 5 748 581 8 0.1 0.4 1.5 12.5 31.7 33.2 16.4 3.9 0.2 0.0
France (Survey, 2016) 1 13 071 6 2.0 11.9 31.2 33.7 17.2 3.8 0.2
Croatia 1 36 866 0 0.0 0.8 2.2 14.2 30.6 33.2 15.9 2.8 0.2 0.0
Italy 9 478 061 345 0.0 0.3 1.0 8.2 21.1 33.1 26.5 9.0 0.7 0.1
Cyprus 1 9153 18 0.0 0.4 1.0 9.2 30.5 37.5 17.4 3.7 0.3 0.0
Latvia 1 21 496 0 0.0 0.9 2.5 17.1 32.7 28.4 14.5 3.6 0.2 0.0
Lithuania4 1,2 28 608 2552 0.0 1.0 2.8 16.5 35.2 28.8 12.9 2.7 0.1 0.0
Luxembourg 1 6762 0 0.1 0.3 1.1 8.5 25.2 37.4 22.7 4.4 0.3 0.0
Hungary3,5 1 91 690 0 0.1 2.3 4.0 14.6 25.1 30.0 19.6 4.2 0.1 0.0
Malta 1 4385 0 0.1 1.1 1.8 11.6 30.0 36.3 16.1 2.9 0.1 0.0
Netherlands 1 166 696 4 0.0 0.2 0.7 9.3 30.9 38.1 17.6 3.1 0.1 0.0
Austria 1 82 565 0 0.0 0.5 1.6 13.2 29.8 34.2 16.7 3.7 0.2 0.0
Poland (2014) 1 372 046 0 0.0 0.9 2.7 16.1 34.5 31.1 12.4 2.2 0.1 0.0
Portugal 1 84 552 4 0.1 0.8 1.8 10.3 22.4 35.2 24.0 5.2 0.2 0.0
Romania3,5 5 201 023 0 0.3 4.3 5.0 19.1 32.7 24.1 12.1 2.3 0.1 0.0
Slovenia2 1 20 003 0 0.0 0.2 0.8 10.5 33.6 36.2 15.7 2.8 0.1 0.0
Slovakia 1 55 078 34 0.1 2.3 3.9 15.9 30.0 30.9 14.3 2.5 0.1 0.0
Finland 1 55 080 0 0.0 0.3 1.4 14.0 29.4 34.1 17.2 3.4 0.2 0.0
Sweden (2014) 1 112 769 1230 0.0 0.2 1.0 12.8 30.9 33.6 17.3 4.0 0.2 0.0
United Kingdom
UK: England and Wales 2 689 751 0 0.0 0.9 2.6 15.6 28.5 31.2 17.2 3.8 0.3 0.0
UK: Scotland 1 53 751 0 0.0 1.1 2.9 15.9 27.9 31.5 17.0 3.5 0.2 0.0
UK: Northern Ireland 1 24 544 0 0.0 0.8 2.3 14.0 27.3 33.2 18.4 3.6 0.3 0.0
Iceland 1 4026 0 0.0 0.3 1.8 16.0 32.4 29.3 16.3 3.5 0.3 0.0
Norway 1 58 927 0 0.0 0.2 1.1 12.2 32.8 33.5 16.7 3.3 0.2 0.0
Switzerland (2014) 1 83 696 0 0.0 0.1 0.6 8.2 25.6 38.2 22.2 4.7 0.3 0.0

EUROPEAN PERINATAL HEALTH REPORT
166
C9: Distribution of parity (rates per 100 women)
Number of live births Percentage of women delivering live or stillbirths
Parity
Country/coverage Source All stated Not stated 0 1 2 3 4+
Belgium 1 120 615 66 42.5 34.5 14.7 5.3 3.0
Bulgaria1 (2014) 1 65 503 99 51.2 36.0 7.7 2.5 2.7
Czech Republic 2 107 618 0 48.3 35.7 11.3 2.9 1.8
Denmark2 1,2,4 56 895 0 45.5 37.5 12.8 2.9 1.4
Germany 1 714 574 0 49.0 34.3 11.4 3.5 2.0
Estonia 1 13 731 0 42.3 37.3 14.4 4.0 2.1
Ireland 1 64 650 0 38.2 34.8 17.8 6.1 3.1
Greece1 1 92 159 0 47.8 39.0 9.8 3.4
Spain 1 412 266 0 51.5 48.5
France
France (Survey, 2016) 1 13 074 3 42.5 35.4 14.3 4.8 3.0
Croatia 1 36 866 0 49.0 33.3 12.0 3.2 2.4
Italy 9 478 154 252 52.7 35.0 9.5 2.1 0.8
Cyprus 1 9166 5 48.4 36.3 11.2 3.0 1.1
Latvia 1 21 496 0 43.1 37.3 13.8 3.6 2.1
Lithuania 2 31 587 14 47.4 37.6 10.6 2.5 1.8
Luxembourg 1 6762 0 47.6 35.5 11.8 3.6 1.6
Hungary1,3 1 91 449 241 46.7 32.3 13.5 4.1 3.3
Malta 1 4385 0 50.7 34.8 9.5 3.1 1.9
Netherlands 1 166 659 41 44.6 36.1 13.4 3.8 2.0
Austria 1 82 565 0 48.8 35.0 11.4 3.2 1.6
Poland (2014) 1 372 036 10 48.1 37.3 10.2 2.7 1.7
Portugal 1 84 556 0 53.5 35.6 8.0 2.0 0.8
Romania1,3 2 201 760 0 54.5 29.3 8.4 3.4 4.4
Slovenia2 1 20 003 0 49.0 38.0 10.0 2.0 1.0
Slovakia 1 49 480 5632 41.7 37.0 12.0 4.1 5.2
Finland 1 55 080 0 41.6 34.3 14.4 4.9 4.8
Sweden (2014) 1 113 815 184 43.1 37.4 13.5 3.7 2.2
United Kingdom
UK: England and Wales 2 686 587 3164 38.8 36.1 15.5 5.8 3.8
UK: Scotland 1 53 624 127 43.2 35.5 13.7 4.7 2.7
UK: Northern Ireland 1 24 544 0 38.4 34.8 17.7 6.2 2.9
Iceland 1 4025 1 39.8 35.4 18.5 4.8 1.6
Norway 1 58 924 3 42.7 36.6 15.0 3.9 1.8
Switzerland (2014) 1 83 377 319 49.5 36.5 11.1 2.3 0.7 Note 1. In Bulgaria, Greece, Hungary and Romania data are based on babies. 2. In Denmark and Slovenia, data are based on mothers delivering live or stillbirths (and terminations). 3. In Hungary and Romania, data are based on live births only. In Hungary, data include 10 births <22 weeks and <500 g which could not be removed.

167
C10: Mode of delivery (rates per 100 total births)
Number of live births Percentage of women delivering live or stillbirths
Parity
Country/coverage Source All stated Not stated 0 1 2 3 4+
Belgium 1 120 615 66 42.5 34.5 14.7 5.3 3.0
Bulgaria1 (2014) 1 65 503 99 51.2 36.0 7.7 2.5 2.7
Czech Republic 2 107 618 0 48.3 35.7 11.3 2.9 1.8
Denmark2 1,2,4 56 895 0 45.5 37.5 12.8 2.9 1.4
Germany 1 714 574 0 49.0 34.3 11.4 3.5 2.0
Estonia 1 13 731 0 42.3 37.3 14.4 4.0 2.1
Ireland 1 64 650 0 38.2 34.8 17.8 6.1 3.1
Greece1 1 92 159 0 47.8 39.0 9.8 3.4
Spain 1 412 266 0 51.5 48.5
France
France (Survey, 2016) 1 13 074 3 42.5 35.4 14.3 4.8 3.0
Croatia 1 36 866 0 49.0 33.3 12.0 3.2 2.4
Italy 9 478 154 252 52.7 35.0 9.5 2.1 0.8
Cyprus 1 9166 5 48.4 36.3 11.2 3.0 1.1
Latvia 1 21 496 0 43.1 37.3 13.8 3.6 2.1
Lithuania 2 31 587 14 47.4 37.6 10.6 2.5 1.8
Luxembourg 1 6762 0 47.6 35.5 11.8 3.6 1.6
Hungary1,3 1 91 449 241 46.7 32.3 13.5 4.1 3.3
Malta 1 4385 0 50.7 34.8 9.5 3.1 1.9
Netherlands 1 166 659 41 44.6 36.1 13.4 3.8 2.0
Austria 1 82 565 0 48.8 35.0 11.4 3.2 1.6
Poland (2014) 1 372 036 10 48.1 37.3 10.2 2.7 1.7
Portugal 1 84 556 0 53.5 35.6 8.0 2.0 0.8
Romania1,3 2 201 760 0 54.5 29.3 8.4 3.4 4.4
Slovenia2 1 20 003 0 49.0 38.0 10.0 2.0 1.0
Slovakia 1 49 480 5632 41.7 37.0 12.0 4.1 5.2
Finland 1 55 080 0 41.6 34.3 14.4 4.9 4.8
Sweden (2014) 1 113 815 184 43.1 37.4 13.5 3.7 2.2
United Kingdom
UK: England and Wales 2 686 587 3164 38.8 36.1 15.5 5.8 3.8
UK: Scotland 1 53 624 127 43.2 35.5 13.7 4.7 2.7
UK: Northern Ireland 1 24 544 0 38.4 34.8 17.7 6.2 2.9
Iceland 1 4025 1 39.8 35.4 18.5 4.8 1.6
Norway 1 58 924 3 42.7 36.6 15.0 3.9 1.8
Switzerland (2014) 1 83 377 319 49.5 36.5 11.1 2.3 0.7
Number of total birthsPercentage of total births
Mode of delivery
Country/coverage Source All stated Not stated Vaginal -spontaneous
Vaginal -instrument
Vaginal -total
Caesarean -no labour or
elective
Caesarean -during
labour or emergency
Caesarean -total
Belgium 1 121 185 1653 69.2 9.5 78.7 11.3 10.0 21.3
Bulgaria (2014) 2 62 912 1435 57.0 43.0
Czech Republic1 2 107 618 0 71.2 2.7 73.9 17.4 8.7 26.1
Denmark 1,2,4 57 847 0 72.0 6.4 78.4 11.3 10.3 21.6
Germany 1 728 496 0 60.9 6.8 67.8 16.1 16.1 32.2
Estonia 1 13 961 0 76.3 4.2 80.5 6.6 12.9 19.5
Ireland 1 65 912 1 53.6 15.1 68.7 31.3
Greece
Spain 2 385 478 27 965 60.4 15.1 75.4 8.5 16.0 24.6
France 5 758 890 2990 67.9 11.2 79.1 7.1 13.8 20.9
France2 (Survey, 2016)
1 13 301 10 67.6 12.1 79.8 9.8 10.5 20.2
Croatia 1 37 428 0 77.0 1.4 78.4 11.5 10.1 21.6
Italy 9 480 217 6340 61.1 3.5 64.6 22.7 12.8 35.4
Cyprus 1 9422 3 39.4 3.7 43.1 40.5 16.4 56.9
Latvia 1 21 826 0 75.6 2.4 78.0 9.3 12.7 22.0
Lithuania 1,2 29 019 2582 76.3 1.9 78.1 8.4 13.4 21.9
Luxembourg 1 6861 1 56.1 11.2 67.3 16.9 15.8 32.7
Hungary 3 92 098 0 61.0 39.0
Malta 1 4453 0 63.8 4.2 68.0 19.5 12.5 32.0
Netherlands 1 165 295 3939 74.1 8.4 82.6 8.7 8.7 17.4
Austria 1 83 884 0 63.1 7.2 70.3 14.6 15.0 29.7
Poland (2014) 2 369 709 0 57.8 42.2
Portugal3 3 83 957 2091 67.1 32.9
Romania 4 153 746 48 004 52.6 0.5 53.1 3.6 43.3 46.9
Slovenia 1 20 336 0 75.9 2.8 78.8 9.8 11.5 21.2
Slovakia 1 55 824 0 66.8 2.1 68.9 17.7 13.4 31.1
Finland 1 55 759 0 74.4 9.2 83.6 6.4 10.0 16.4
Sweden (2014) 1 115 710 0 75.7 6.0 81.7 7.8 10.5 18.3
United Kingdom
UK: England 1 632 784 3446 60.0 13.0 73.0 11.5 15.5 27.0
UK: Wales 2 32 128 210 63.1 10.9 73.9 12.0 14.0 26.1
UK: Scotland4 1 54 273 240 55.3 12.2 67.5 14.9 17.6 32.5
UK: Northern Ireland 1 24 540 4 58.2 12.0 70.1 15.4 14.5 29.9
Iceland 1 4091 7 76.4 7.6 83.9 8.4 7.6 16.1
Norway 1 59 930 0 73.3 10.2 83.5 5.8 10.7 16.5
Switzerland2 (2014) 1,2,3 81 969 3237 54.9 10.8 65.8 17.8 16.4 34.2 Note. 1. In the Czech Republic, N corresponds to the number of mothers instead of babies. 2. In Switzerland, there are 185 caesarean sections with unknown mode of onset that are not included here, and three in France 3. In Portugal, N corresponds to the number of deliveries instead of babies. 4. In Scotland, 181 vaginal deliveries with unknown mode of delivery (instrumental or not) are excluded here.

EUROPEAN PERINATAL HEALTH REPORT
168
R8: Percentage of women who smoked during pregnancy in 2015
Definition of period Period 1 Period 2
Country/coverage
Source Period 1 Period 2 All statedN
Not statedN
Smokers%
All statedN
Not statedN
Smokers%
Belgium
Bulgaria
Czech Republic 2 During pregnancy 107,618 0 7.2
Denmark 1 1st trimester 2nd trimester 56416 479 11.0 56 416 479 7.5
Germany 1 During pregnancy 490 834 203 740 9.0
Estonia 1 1st trimester During pregnancy 13128 603 7.6 13 128 603 6.1
Ireland
Greece
Spain
ES: Catalonia 3 Before pregnancy 3rd trimester 63400 7061 22.8 60 292 10 169 13.0
ES: Valencia (2016)
4 End of pregnancy 23 658 5886 18.3
France (Survey, 2016)
1 Before pregnancy 3rd trimester 11702 1375 29.8 11 720 1357 16.3
Croatia 1 During pregnancy 35 847 1019 7.8
Italy (2013) 11 Before pregnancy During pregnancy 20.5 5.3
Cyprus 1 During pregnancy 8 858 313 6.3
Latvia 1 During pregnancy 21 496 0 7.9
Lithuania 1 Before pregnancy During pregnancy 28608 2552 8.0 28 608 2552 4.4
Luxembourg 1 1st trimester 3rd trimester 6720 42 13.3 6713 49 10.7
Hungary
Malta 1 At booking 4385 0 7.7
Netherlands 4 During pregnancy 1682 59 6.0
Austria 1 3rd trimester 62 326 20 239 12.5
Poland
Portugal
Romania
Slovenia 1 During pregnancy 20 003 0 9.5
Slovakia
Finland 1 1st trimester After 1st trimester 53988 1771 14.7 53 988 1771 7.5
Sweden 1 1st trimester 3rd trimester 110016 4973 5.1 109 308 5681 3.8
United Kingdom
UK: England (2015/16)
2 Booking Delivery 438099 126756 14.2 456 344 108 511 12.3
UK: Wales 2 3rd trimester 29 584 1576 17.3
UK: Scotland 1 At booking 52237 1539 16.4
UK: Northern Ireland
1 During pregnancy 24 172 15 14.3
Iceland
Norway 1 First visit End of pregnancy 53610 5317 5.5 50 009 8918 3.6
Switzerland

169
R12: Distribution of maternal prepregnancy body mass index
Prepregnancy body mass index Percentage of women delivering live or stillbirths
Country/coverage Source All stated Not stated <18.5 18.5-24.9 25.0-29.9 ≥30.0
Belgium 1 112 745 7964 5.4 59.1 22.8 12.7
Bulgaria
Czech Republic
Denmark 1 56 308 587 4.6 62.0 20.8 12.6
Germany 1 669 397 45 177 3.9 58.1 23.1 14.9
Estonia
Ireland
Greece
Spain
France, Survey (2016) 1 11 588 1489 7.4 60.8 20.0 11.8
Croatia 1 35 102 1764 5.5 67.6 19.0 7.8
Italy
Cyprus
Latvia
Lithuania
Luxembourg
Hungary
Malta 1 3475 910 2.8 59.7 23.8 13.7
Netherlands
Austria 1 79 100 3465 6.4 64.5 19.0 10.0
Poland
Portugal
Romania
Slovenia 1 19 983 20 4.7 66.1 19.6 9.6
Slovakia
Finland 1 54 577 1182 3.5 61.2 22.1 13.2
Sweden (2014) 1 108 218 6771 2.6 57.8 25.9 13.7
United Kingdom
UK: England (2015/16) 2 461 266 103 589 2.9 47.5 28.4 21.2
UK: Wales (2016) 1 24 040 0 2.4 43.6 28.4 25.6
UK: Scotland 1 52 387 1389 2.9 46.5 27.9 22.7
UK: Northern Ireland 1 23 871 316 1.9 47.9 29.8 20.4
Iceland
Norway 1 43 683 15 239 4.2 62.4 21.6 11.6
Switzerland

EUROPEAN PERINATAL HEALTH REPORT
170
Country Source N° Source name Start date Data from
Type of data Coverage Completeness Participation Linked Source
Institution Other comments on data source
P= Population H= hospital O= Other
C= Country level O= Other
U = Unknown O= Obligatory V= Voluntary
Y= Yes N=No
Austria 1 birth + cause of death statistics for infant death
1984 2015 P C 100% O Y Statistics Austria Linkage of birth statistics and causes of death statistics for infant death
Austria 2 Cause of death statistics
1970 2015 P C 99% O N Statistics Austria
Belgium 1 Civil Registration
1966 2015 H C 100% O Y Statistics Belgium (Statbel)
Bulgaria 1 Vital Statistics 2014 P C 100% O NA National Statistics Institute
Bulgaria 2 National birth register
2011 2014 P C 100% O N National center for public health and analysis
Bulgaria 3 National center for public health and analysis
2000 2014 P C U O N National center for public health and analysis
Croatia 1 Croatian Medical Birth Database
1990 2015 H C 100% O Y Croatian Public Health Institute
Croatia 2 Croatian Mortality Database
NA 2015 P C U O N Croatian Central Bureau of Statistics (CBS)
Cyprus 1 Birth Register 2007 2015 H C 100% O Y The Health Monitoring Unit, Cyprus ministry of health
The recording of medical data for births started from the year 2007 for all public maternity units. From the year 2014 the data also includes the private maternity units as well.
Cyprus 2 Death Register 2004 2015 P C 100% O Y The Health Monitoring Unit, Cyprus ministry of health
Death certificates, collected and coded by the Health monitoring unit. All administrative sources of information are used to collect data on deaths: medical death certificates, autopsy reports, coroner’s reports, population registry of ministry of interior, EMCDDA of Cyprus, police records, accidents at work from the Ministry of Labor, Ministry of Foreign Affairs for deaths abroad. Even press reports are used to corroborate data.
Cyprus 3 Combined data from Demographic Report and from the Death Register
2004-2007 2015 P C 100% O Y Health Monitoring Unit, Cyprus Ministry of Health
Cyprus 4 Combined data from the Birth register, Death register, and the Demographic Report
2011-2020 2015 P C 99% O Y Statistical Service and Ministry of Health
Covers all residents except nationals who deliver out of the country.
Czech Republic
1 Czech Statistical Office (CZSO)
1987 2015 P C 100% O N Czech Statistical Office (CZSO)
Vital statistics
APPENDIX C:

171
Country Source N° Source name Start date Data from
Type of data Coverage Completeness Participation Linked Source
Institution Other comments on data source
Czech Republic
2 Institute of Health Statistics and Information of the Czech Republic
2001 2015 P C 99.5% O Institute of Health Statistics and Information of the Czech Republic
Denmark 1 Medical birth register
1973 2015 P C ± 100 % Y The Danish Health Data authority, under the Danish Ministry of Health
Hospital and home births included
Denmark 2 National patient register
1977 2015 P C ± 100 % N The Danish Health Data authority, under the Danish Ministry of Health
Contains information on all contacts with the Danish hospitals
Denmark 3 Danish causes of death register
1970 2015 P C 100% O N The Danish Health Data authority, under the Danish Ministry of Health
Causes of death, civil status and causes of death related data
Denmark 4 The Centralized Civil Register
2015 P
Estonia 1 Estonian Medical Birth Register
1992 2015 H/P (both) C 99.9% O Y National Institute for Public Health
Includes all deliveries in Estonia, including home deliveries
Estonia 2 Estonian Cause of Death Register
1983 2015 H/P (both) C 99.6% O Y National Institute for Public Health
Includes all deaths on the territory of Estonia, partly court decisions and deaths abroad of Estonian residents
Estonia 3 Linked Data from EMSR (Medical Birth) and SPR (Causes of Death)
1992 2015 O C 99.8% O Y National Institute for Public Health
Some births, occurring to residents abroad, can be registered in later years.
Estonia 4 Report of a health care institution on maternal deaths and child health
1960 2015 P C _ NA N Health Statistics Unit, National Institute for Public Health
Estonia 5 Statistics Estonia based on Registry of Causes of Death
1920 2015 P C NA NA N National Institute for Public Health
Finland 1 Medical Birth Register
1987 2015 P C 100% O Y National Institute for Health and Welfare THL
Covers all occurring births in Finland despite citizenship or residence.
Finland 2 Cause-of-Death Register
1936 2015 P C 100% O N Statistics Finland Includes Finnish citizens and permanent residents (with valid ID number).
France 1 National Perinatal Survey
2016 2016 P C 100% for the minimum data set (core indicators)
V N INSERM Representative sample of births in France.
France 2 Civil Registration
1900 2015 P C 100% O N INSEE (National Institute Of Statistics and Economics Studies)
Recording of births, deaths on the French territory
France 3 Routine death statistics
1979 2015 P C 100% O N National centre of statistics for medical causes of death (CépiDc)
France 4 National confidential survey on maternal mortality, ENCMM
1996 2015 O C 100% V Y Inserm UMR 1153-Obstetrical, Perinatal and Pediatric Epidemiology Research Team
death certificates of women of reproductive age, birth registers and national hospital discharge data

EUROPEAN PERINATAL HEALTH REPORT
172
Country Source N° Source name Start date Data from
Type of data Coverage Completeness Participation Linked Source
Institution Other comments on data source
France 5 PMSI 1998 2015 H O 99% O N ATIH : Technical agency of hospitalization information
Linkage of hospital episodes is feasible. covers both public and private hospitals in France and the overseas districts
Germany 1 IQTIG 2015 2015 H C 95-98% with 90% certainty
O Federal Institute for the Quality of Medical Care
Germany 2 Destatis 1834 2015 P C 99.9% O Y Federal Statistical Office
Germany 3 Destatis terminations
1976 2015 P C 99.5% O N Federal Statistical Office
A special register of the Federal Bureau of statistics for terminations
Greece 1 Hellenic Statistical authority
2015 P C O
Hungary 1 Hungarian Central Statistical Office
1865 2015 P C 100% O Y
Hungary 2 WHO, UNICEF, UNFPA, World Bank Group and United Nations Population Division Maternal Mortality Estimation Inter-Agency Group
1990 2015 P C 100% O Y
Hungary 3 National Health Insurance Fund of Hungary
2015 H C 100% O Y
Iceland 1 The Icelandic Birth Registration (IBR)
1972 2015 P C 99% O Y
Ireland 1 National Perinatal Reporting System (NPRS)
1985 2015 P C 100% O N The National Perinatal Reporting System (NPRS), managed by the Healthcare Pricing Office (HPO) at the Health Service Executive (HSE)
The birth notification form (BNF01) is completed where the birth takes place (either hospital/home).
Ireland 2 Central Statistical Office
2015 Central Statistics Office
link provided by SC member https://www.cso.ie/en/statistics/birthsdeathsandmarriages/ ( data from online PDF)
Ireland 3 Confidential Maternal Death Enquiry Ireland
2015 National Perinatal Epidemiology Centre, Cork
link provided by SC member https://www.ucc.ie/en/npec/publications/ ( data from online PDF)
Italy 1 Birth certificates (CEDAP, Certificato di assistenza al parto)
1978 2015 P C 99% O N Ministry of Health
Italy 2 Survey on hospital discharges for spontaneous abortion
1979 2015 H C 95% O N National Institute of Statistics of Italy (ISTAT)
Data are collected using an individual form containing information on the woman and on the operation.

173
Country Source N° Source name Start date Data from
Type of data Coverage Completeness Participation Linked Source
Institution Other comments on data source
Italy 3 Survey on induced abortion
1979 2015 H C 100% O N National Institute of Statistics of Italy (ISTAT)
Data are collected using an individual form containing information on the woman and on the operation.
Italy 4 Death Register before the first year of life
2015 P C 100% O N National Institute of Statistics of Italy (ISTAT)
Italy 5 Death Register beyond the first year of life
1871 2015 P C 100% O N National Institute of Health
Italy 6 Hospital Discharge
1995 2015 H C 100% O N Regional authorities and Ministry of Health
Italy 7 Merged Datasource (1,2,3,4,6)
Y
Italy 8 Merged Datasource (1,2,3,6)
Y
Italy 9 Merged Datasource (1,2,6)
Y
Italy 10 Merged Datasource (5,6)
Y
Italy 11 Survey on health status and use of health services
1993 2013 P C 100% O N National Institute of Statistics of Italy (ISTAT)
The survey uses a stratified random sampling to obtain national representativeness
Latvia 1 Newbos Register of Latvia (The Medical Birth Register)
2000 2015 P C 99% O Y The Centre for Disease Prevention and Control of Latvia
Covers all deliveries, except nationals who deliver out of the country.
Latvia 2 Register of Causes of Death
1996 2015 P C 99% O Y The Centre for Disease Prevention and Control of Latvia
Also includes Latvians who have died abroad if possible
Latvia 3 The Medical Birth Register and Register of Cause of Death
2015 Y Combined data source
Lithuania 1 Medical Date of Births
1993 2015 H C 99% O N HI HIC responsible for processing, Children's Hospital, Affiliate of Vilnius University Hospital Santariskiu Klinikos Centre of Neonatology responsible for analysing
Standard forms filled in maternity hospitals
Lithuania 2 Database of the Demographic Statistics
1994 2015 P C 100% O Y Central Statistical Office (Statistics Lithuania)
Lithuania 3 Causes of Death register
2010 2015 P C 100% O Y Institute of Hygiene Healf Information Centre (HI HIC)

EUROPEAN PERINATAL HEALTH REPORT
174
Country Source N° Source name Start date Data from
Type of data Coverage Completeness Participation Linked Source
Institution Other comments on data source
Luxembourg 1 Perinatal Health Monitoring System
2009 2015 H C 100% O N Luxembourg institute of Health
Available in all maternity units and liberal midwifes attending home deliveries.
Luxembourg 2 Stillbirths and early neonatal causes of death register
1967 2015 P C 99% O Y Ministry of Health - Direction of Health
Luxembourg 3 Cause of Death Register- Registre des causes de décès du certificat de décès
1967 2015 P C 99% O Y Ministry of Health - Direction of Health
Malta 1 National Obstetrics Information System
1999 2015 P C 100% V N Directorate for Health Information and Research
Records all births on the Maltese islands
Malta 2 National Mortality Register
1995 2015 P C 100% O N Directorate for Health Information and Research
Norway 1 Medical Birth Register of Norway
1967 2015 P C 99% O NA The Norwegian Institute of Public Health
Includes stillbirths and livebirths 12-16 weeks GA and up.
Poland 1 Central Statistical Office
1946 2014 P C 100% O N Central Statistical Office
Birth and death certificates
Poland 2 Ministry of Health Data (Hospital discharge data MZ-29)
2014 H C 100% O N Centrum Systemów Informacyjnych Ochrony Zdrowia
Portugal 1 National Statistics - Live births and fetal, neonatal and infant deaths
1935 2015 P C Almost 100% O N National Statistics Institute (INE) / Department of Demographic and Social Statistis / Demographic Statistics Unit (INE/DES/DM)
Based on routine data from birth and death certificates at a national level.
Portugal 2 Hospital Discharge Data
2015 H C 100% of public hospitals
O N Central Administration of the Health System (ACSS)
Diagnosis-related Group classification according to ICD9, developed for financial purposes. We have used all cases coded as "Pregnancy, Delivery and Puerperium”.
Portugal 3 Hospitals' survey
2000 2015 H C Almost 100% O N National Statistics Institute AND General Directorate for Health
Romania 1 National Centre for Statistics and Informatics in Public Health (NCSIPH) for maternal deaths
1945 2015 C 100% O N NICSPH
Romania 2 NIS births & NCSIPH fetal/neonatal/infant deaths
2000 2015 H C 100% O N National Institute for Statistics data for fetal deaths. National Center for Statistics and Informatics in Public Health for fetal deaths as a modality to validate the cause of death.
National Institute for Statistics data for births and National Centre for Statistics and Informatics in Public Health for fetal/neonatal/infant deaths

175
Country Source N° Source name Start date Data from
Type of data Coverage Completeness Participation Linked Source
Institution Other comments on data source
Romania 3 NCSIPH fetal/neonatal/infant deaths
2000 2015 H C 100% O N National Institute for Statistics data for fetal deaths. National Center for Statistics and Informatics in Public Health for fetal deaths as a modality to validate the cause of death.
National Centre for Statistics and Informatics in Public Health for fetal/neonatal/infant deaths
Romania 4 NCSIPH DRG 2007 2015 H O Public hospitals only
O Y NCSIPH NCSIPH data from the DRG system. Public hospitals only.
Romania 5 National Institute for Statistics demographic statistics for births
2000 2015 H C U O N NIS
Slovakia 1 NCZI SOR SON 2015 H C 100% O N National health information center
Slovakia 2 Statistical Office SR
2015 P C 100% O NA Statistical office
Slovenia 1 National Perinatal Information System of Slovenia
1986 2015 H C 100% O N Institute of Public Health
Slovenia 2 Death certificates database
2015 P C U O NA Institute for Public Health
Spain 1 Vital Statistics 1858 2015 P C U O N National Statistics Office.
Collects Vital Statistics among others statistics,
Spain 2 Minimum Data set
1997 2015 H C 93.2% V N Ministry of Health All public hospital and around 66% of private hospitals in 2015
Spain: Catalonia
3 Register of babies
1993 2015 H C O N Subdirectorate-General for Epidemiological Surveillance and Public Health Emergency Response. Public Health Agency of Catalonia. Department of Health.
Spain: Valencia
4 Obstetrics Medical Record Primary Care
2004 2016 O O 60% O N Regional Health Authority
Sweden 1 Medical Birth Register
1973 2014 P C 98% O Y The National Board of Health and Welfare
All pregnancies and deliveries in Sweden
Switzerland 1 BEVNAT, statistics of natural population change (vital statistics)
1871 2014 P C ± 100% O Y Swiss Federal Statistical Office
Some underreporting of fetal deaths (including TOP) and births occurring outside the country
Switzerland 2 MS, Medical Hospital Statistics combined with data from
1998 2014 H C ±97% O Y Swiss Federal Statistical Office
National hospital data (plus some birthing homes)
Switzerland 3 The Swiss Federation of Midwifes
2005 2014 O C ± 99% O N Swiss Federal Statistical Office, Swiss Federation of Midwifes
the Swiss Federation of Midwifes (births at home and in the remaining birthing home0s)
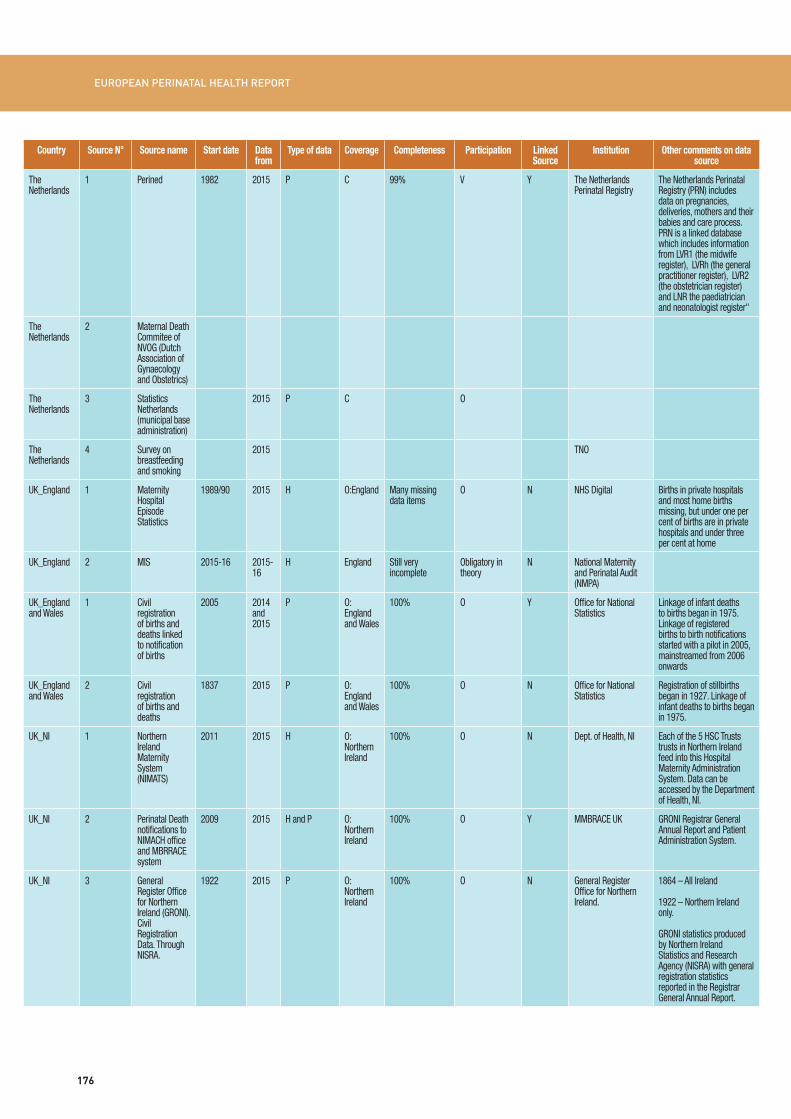
Country Source N° Source name Start date Data from
Type of data Coverage Completeness Participation Linked Source
Institution Other comments on data source
The Netherlands
1 Perined 1982 2015 P C 99% V Y The Netherlands Perinatal Registry
The Netherlands Perinatal Registry (PRN) includes data on pregnancies, deliveries, mothers and their babies and care process. PRN is a linked database which includes information from LVR1 (the midwife register), LVRh (the general practitioner register), LVR2 (the obstetrician register) and LNR the paediatrician and neonatologist register"
The Netherlands
2 Maternal Death Commitee of NVOG (Dutch Association of Gynaecology and Obstetrics)
The Netherlands
3 Statistics Netherlands (municipal base administration)
2015 P C O
The Netherlands
4 Survey on breastfeeding and smoking
2015 TNO
UK_England 1 Maternity Hospital Episode Statistics
1989/90 2015 H O:England Many missing data items
O N NHS Digital Births in private hospitals and most home births missing, but under one per cent of births are in private hospitals and under three per cent at home
UK_England 2 MIS 2015-16 2015-16
H England Still very incomplete
Obligatory in theory
N National Maternity and Perinatal Audit (NMPA)
UK_England and Wales
1 Civil registration of births and deaths linked to notification of births
2005 2014 and 2015
P O: England and Wales
100% O Y Office for National Statistics
Linkage of infant deaths to births began in 1975. Linkage of registered births to birth notifications started with a pilot in 2005, mainstreamed from 2006 onwards
UK_England and Wales
2 Civil registration of births and deaths
1837 2015 P O: England and Wales
100% O N Office for National Statistics
Registration of stillbirths began in 1927. Linkage of infant deaths to births began in 1975.
UK_NI 1 Northern Ireland Maternity System (NIMATS)
2011 2015 H O: Northern Ireland
100% O N Dept. of Health, NI Each of the 5 HSC Trusts trusts in Northern Ireland feed into this Hospital Maternity Administration System. Data can be accessed by the Department of Health, NI.
UK_NI 2 Perinatal Death notifications to NIMACH office and MBRRACE system
2009 2015 H and P O: Northern Ireland
100% O Y MMBRACE UK GRONI Registrar General Annual Report and Patient Administration System.
UK_NI 3 General Register Office for Northern Ireland (GRONI).Civil Registration Data. Through NISRA.
1922 2015 P O: Northern Ireland
100% O N General Register Office for Northern Ireland.
1864 – All Ireland
1922 – Northern Ireland only.
GRONI statistics produced by Northern Ireland Statistics and Research Agency (NISRA) with general registration statistics reported in the Registrar General Annual Report.
EUROPEAN PERINATAL HEALTH REPORT
176

Country Source N° Source name Start date Data from
Type of data Coverage Completeness Participation Linked Source
Institution Other comments on data source
UK_Scotland 1 Composite file created by linking 3 data sources:
Y Information Services Division of NHS National Services Scotland
Creating the composite file: SMR02 records were extracted for all live births 22+ weeks and all fetal deaths 22+ weeks (including therapeutic abortions). A data linkage was carried out to match NRS Stillbirths and Deaths (infant deaths among babies born in 2015) to the SMR02 base file.
a) SMR02 - Scottish Morbidity Record 02 (Maternity Inpatients and Daycases)
1975 2015 H O: Scotland
~98% V
b) National Records of Scotland Stillbirths registrations
1974 2015 P O: Scotland
100% O
c) National Records of Scotland Death Registrations
1974 2015-2016
P O: Scotland
100% O
UK_Scotland 2 National Records of Scotland Death Registrations
1974 2015-2016
P O: Scotland
100% O N Information Services Division of NHS National Services Scotland
All deaths (including infant and maternal) are included in this register.
UK_Wales 1 Maternity Indicators Dataset
2015 2015/2016
H O: Wales Any patients treated in Welsh Hospitals
O Y NWIS (NHS Wales Informatics Service)
UK_Wales 2 Maternity Indicators Dataset (Birth records only)
2016 2016 H O: Wales U O N NHS Wales Informatics Service
United Kingdom
1 MMBRACE UK 2013 2015 P C Full for neonatal deaths from 20 weeks gestation. Full for stillbirths from 24 weeks gestation. We request data from 22 weeks gestation for fetal deaths but cannot confirm coverage as they are not registered deaths. We think they are fairly well completed.
O N University of Oxford and University of Leicester
Previous system ran from 1992 to 2010.
United Kingdom
2 Confidential Enquiry into Maternal Deaths
1928 2012-2014
P C 100% O Y MMBRACE -UK . National Perinatal Epidemiology Unit, University of Oxford
177

![Perinatal psychological interventions to promote ...... · use antidepressant drugs during the perinatal period [10]. The proportion of pregnant or lactating women that are prescribed](https://static.fdocuments.in/doc/165x107/60dea7fc668add4af258c386/perinatal-psychological-interventions-to-promote-use-antidepressant-drugs.jpg)