Maternal and Perinatal Outcomes in Health Facilities and Perinatal Outcomes in ... Giving Life:...
44
Saving Mothers, Giving Life Maternal and Perinatal Outcomes in Health Facilities Phase 1 Monitoring and Evaluation Report
Transcript of Maternal and Perinatal Outcomes in Health Facilities and Perinatal Outcomes in ... Giving Life:...
Saving Mothers, Giving Life
Maternal and Perinatal Outcomes in
Health Facilities
Phase 1 Monitoring and Evaluation Report

Suggested Citation Centers for Disease Control and Prevention. Saving Mothers, Giving Life: Maternal and Perinatal Outcomes in Health
Facilities. Phase 1 Monitoring and Evaluation Report. Atlanta, GA: Centers for Disease Control and Prevention, US Dept of Health and Human Services; 2014.

Photographs by Riccardo Gangale, 2013
Saving Mothers, Giving Life: Maternal and Perinatal
Outcomes in Health Facilities
Phase 1 Monitoring and Evaluation Report
2014

ii Maternal and Perinatal Health Outcomes
Acknowledgements
This report was prepared by staff of the Centers for Disease Control and Prevention (CDC) of the US Government, located both at CDC headquarters and in the Uganda and Zambia CDC country offices.
Thousands of individuals participated in activities to monitor and evaluate Phase 1 of the Saving Mothers, Giving Life (SMGL) initiative, including staff affiliated with country SMGL teams and implementing organizations; district and national-level Ministry of Health officials; Village Health Teams and community health workers; headquarters representatives of all US Government agencies involved; the Government of Norway; and private-sector SMGL partners. Because those involved in this momentous effort are too numerous to name individually, the organizations they represent are acknowledged below.
Uganda
Government of Uganda
Ministry of Health of Uganda
District Medical/Health Officers
Uganda Village Heath Teams
CDC Country Office
US Agency for International Development (USAID) Mission in Uganda
Baylor Children’s Foundation
Uganda Infectious Diseases Institute (Makerere University, Uganda)
Marie Stopes Uganda (MSU)
STRIDES for Family Health
Health Care Improvement Project (HCI)
Uganda Health Marketing Group (UHMG)
Uganda Episcopal Conference (UEC)
Health Initiatives for the Private Sector (HIPS)
Strengthening Decentralization for Sustainability (SDS)
Uganda Blood Transfusion Services (UBTS)
Makerere University School of Public Health
Securing Uganda’s Right to Essential Medicines (SURE)
Zambia
Government of Zambia
Zambia Ministry of Community Development, Mother and Child Health (MCDMCH)
Zambia Central Statistics Office
District and Provincial Medical/Health Officers
Community Health Workers and Safe Motherhood Action Groups (SMAGs)
CDC Country Office
US Agency for International Development (USAID) Mission in Zambia
Center for Infectious Disease Research in Zambia (CIDRZ)
Zambia Center for Applied Health Research and Development (ZCAHRD) (Boston University)
Maternal and Child Health Integrated Program (MCHIP)
Zambia Integrated Systems Strengthening Program (ZISSP)
Communication Support for Health (CSH)
University of Zambia (UNZA), Department of Population Studies
Global Partners American College of Obstetricians and Gynecologists
Every Mother Counts
Merck for Mothers
Government of Norway
Project CURE
US Government Agencies:
Centers for Disease Control and Prevention (CDC)
US Agency for International Development (USAID)
Peace Corps
US Department of Defense (DOD)
Office of the US Global AIDS Coordinator (OGAC)

iiiMaternal and Perinatal Health Outcomes
Contents
Summary of Findings ....................................................................................................................................................................................................................................................................................1
Introduction ..............................................................................................................................................................................................................................................................................................................................3
SMGL Monitoring and Evaluation ...........................................................................................................................................................................................................................................5
Assessing SMGL’s Effect on Maternal and Perinatal Health Outcomes in Facilities ....................................................7
Data Sources ..........................................................................................................................................................................................................................................................................................................................9
Maternal and Perinatal Health Indicators .......................................................................................................................................................................12
Institutional Delivery Rate .....................................................................................................................................................................................................................................................................12
Proportion of All Births in EmONC Facilities ..................................................................................................................................................................................................13
Active Management of the Third Stage of Labor ...............................................................................................................................................................................14
Cesarean Sections as a Proportion of All Births......................................................................................................................................................................................15
Met Need for EmONC .....................................................................................................................................................................................................................................................................................16
Direct Obstetric Case Fatality Rate......................................................................................................................................................................................................................................19
Maternal Deaths ........................................................................................................................................................................................................................................................................................................20
Perinatal Mortality Rate in Health Facilities ...................................................................................................................................................................................................23
Stillbirth Rate in Health Facilities .............................................................................................................................................................................................................................................24
Predischarge Neonatal Mortality Rate ........................................................................................................................................................................................................................26
Table 1. Summary of Maternal and Perinatal Outcome Indicators for Health Facilities in SMGL-Supported Districts in Uganda .............................................................................................................................................................................................................27
Table 2. Summary of Maternal and Perinatal Outcomes Indicators for Health Facilities in SMGL-Supported Districts in Zambia ...............................................................................................................................................................................................................28
Conclusions ............................................................................................................................................................................................................................................................................................................................29
References .................................................................................................................................................................................................................................................................................................................................30
Appendix: Maternal and Perinatal Outcomes and Indicators for All SMGL-Supported Facilities ..................................................................................................................................................................................................................31

iv Maternal and Perinatal Health Outcomes
List of Acronyms
AMTSL Active Management of the Third Stage of Labor
BEmONC Basic Emergency Obstetric and Newborn Care
CDC Centers for Disease Control and Prevention
CEmONC Comprehensive Emergency Obstetric and Newborn Care
CFR case fatality rate (for direct obstetric complications receiving care)
C-section Cesarean section
EmONC Emergency Obstetric and Newborn Care
HFA Health Facility Assessment
M&E monitoring and evaluation
MCH maternal and child health
MMR maternal mortality ratio
NMR neonatal mortality rate (in health facilities, at discharge)
PMR perinatal mortality rate (in health facilities, at discharge)
POMS Pregnancy Outcomes Monitoring Survey
PPH postpartum hemorrhage
RAMOS Reproductive Age Mortality Study
RAPID Rapid Ascertainment Process for Institutional Deaths
SMAG Safe Motherhood Action Group
SMGL Saving Mothers, Giving Life
VHT Village Health Team
WHO World Health Organization
WRA women of reproductive age

1Maternal and Perinatal Health Outcomes
Summary of FindingsSaving Mothers, Giving Life (SMGL) is a 5-year initiative designed to aggressively reduce deaths related to pregnancy and childbirth through a coordinated approach that strengthens maternal health services in high-mortality settings.
Phase 1 of the initiative resulted in sharp reductions in the number of maternal deaths in the eight pilot districts in Uganda and Zambia. The improvements in access to, availability of, and quality of maternity care in the participating districts have saved the lives of many women who experienced major obstetric complications. They have also saved the lives of many infants born to women with these complications.
Improvements were reported in nearly all measures of maternal and perinatal health tracked before and after Phase 1. For example,
Increase in the Institutional Delivery Rate: The SMGL initiative increased the number of women delivering at health facilities by encouraging communities to promote facility delivery, improving transportation, and preparing facilities for an increased demand in their services. In Uganda, the proportion of deliveries that took place at any health facility increased by 62%, from 46% before Phase 1 (baseline) to 74% after Phase 1 (endline). In Zambia, it increased by 35%, from 63% at baseline to 84% at endline.
Increase in EmONC Facility Births: The proportion of all births that take place in an Emergency Obstetric and Newborn Care (EmONC) facility serves as a crude indicator of the capacity of a country’s health system to respond to obstetric and newborn emergencies. The proportion of all births delivered in EmONC facilities increased from 28% at baseline to 36% at endline in Uganda and from 26% to 30% in Zambia.
Increase in Active Management of the Third Stage of Labor (AMTSL): This critical intervention can prevent postpartum hemorrhage, which is a major cause of maternal death. It should be a routine standard of care in facilities providing
delivery care. In Uganda, the percentage of births in which the mother received AMTSL in Comprehensive EmONC facilities doubled, from 42% at baseline to 85% at endline.
Increase in Cesarean Section (C-section) as a Proportion of All Births: C-sections can prevent maternal and perinatal deaths and severe maternal health complications such as obstetric fistula. The World Health Organization recommends that C-sections make up 5% – 15% of all births. In Uganda, the population-based C-section rate increased by 23%, from 5.3% at baseline to 6.5% at endline. In Zambia, the rate increased by 15%, from 2.7% to 3.1%.
Increase in Met Need for EmONC: The met need for EmONC is the proportion of all women with major obstetric complications who are treated in EmONC facilities. It is an indicator of whether the coverage and use of EmONC services are adequate. In both Uganda and Zambia, the met need improved. In Uganda, obstetric care for complications received in all health facilities increased by 42%, from 46% at baseline to 66% at endline. In Zambia, it increased by 31%, from 34% to 45%.
At EmONC facilities, met need increased by 25% in Uganda (from 39% to 49%) and by 23% in Zambia (from 26% to 32%).
Decrease in the Obstetric Case Fatality Rate (CFR): The CFR represents the proportion of women dying because of direct obstetric complications out of all women who were admitted to health facilities who experienced such complications. In Uganda, the all-facility CFR decreased by 25% (from 2.6% at baseline to 2.0% at endline).
The CFR for EmONC facilities in Uganda (providing either Basic or Comprehensive EmONC) fell by 18% (from 2.9% to 2.4%). In Zambia, the all-facility CFR decreased by 34% (from 3.1% to 2.0%), and the rate for EmONC facilities declined by 35% (from 3.4% to 2.2%).

2 Maternal and Perinatal Health Outcomes
Decrease in Maternal Mortality in Facilities: In both countries, the maternal mortality ratio (MMR) in all facilities declined by 35%, from 534 maternal deaths per 100,000 live births at baseline to 345 per 100,000 at endline in Uganda and from 310 to 202 maternal deaths per 100,000 in Zambia. The MMR in EmONC facilities declined by 24% in Uganda (from 829 to 634 maternal deaths per 100,000) and by 28% in Zambia (from 629 to 453 maternal deaths per 100,000).
Decrease in Perinatal Deaths in Facilities: The perinatal mortality rate (PMR) is defined in this report as the number of stillbirths and predischarge neonatal deaths divided by the total number of births in the same facilities. It is an overall measure of the quality of antenatal and obstetric care. In Uganda, the PMR fell by 17%, from 39.3 perinatal deaths per 1,000 live births at baseline to 32.7 per 1,000 at endline. In Zambia, it fell by 14%, from 37.9 to 32.8 perinatal deaths per 1,000.
Decrease in the Stillbirth Rate in Facilities: Both Uganda and Zambia showed comparable declines in total stillbirth rates (20% and 19%, respectively). In Uganda, the intrapartum stillbirth rate declined by 28% (from 22.4 intrapartum stillbirths per 1,000 live births to 16.0 per 1,000), which suggests improvements in the quality of delivery care in health facilities.
Little Change in the Predischarge Neonatal Mortality Rate (NMR): The NMR did not change significantly in either Uganda or Zambia. Given that the overall PMR decreased, the lack of change in predischarge NMR may be due to the poor survivability of infants who were saved from being stillborn. It may also be due to a change in the way stillbirths and live births were classified.

3Maternal and Perinatal Health Outcomes
Introduction Saving Mothers, Giving Life (SMGL) is a 5-year initiative designed to aggressively reduce deaths related to pregnancy and childbirth through a coordinated approach that strengthens maternal health services in high-mortality settings. SMGL’s evidence-based interventions are focused primarily on the critical period of labor, delivery, and the 48 hours postpartum, when most maternal deaths and about half of newborn deaths occur. SMGL works to improve the existing health network within each district to ensure that women can receive quality facility-based care within 2 hours of the onset of labor or obstetric emergencies.
Coordinated and funded by a public-private partnership,1 SMGL strives to improve access to, demand for, and the quality of basic and comprehensive Emergency Obstetric and Newborn Care (EmONC).2 It also seeks to strengthen links to other essential services for women and children, including family planning and HIV prevention, care, and treatment.
SMGL began in June 2012 in eight pilot districts, four each in Uganda and Zambia (see Figure 1 for demographic and population data). Phase 1 (the pilot phase) activities took place from June 2012 through May 2013 and were preceded by a planning and start-up period of about 8 months.
1. Current partners are the American College of Obstetricians and Gynecologists, Every Mother Counts, Merck for Mothers, the Government of Norway, Project CURE, and the US Government [Centers for Disease Control and Prevention (CDC), US Agency for International Development (USAID), Peace Corps, US Department of Defense, and US Office of the Global AIDS Coordinator (OGAC)]. The governments of Uganda and Zambia were central to the partnership and all activities.
2. EmONC facilities are those that have recently performed specific life-saving obstetric interventions called “signal functions” that are recommended by the World Health Organization. Basic care interventions include administration of parenteral antibiotics, uterotonics, or anticonvulsants; manual removal of placenta; removal of retained products; assisted vaginal delivery; and basic neonatal resuscitation. Comprehensive care interventions include two additional services: ability to perform obstetric surgery (e.g., Cesarean section) and blood transfusion.
The SMGL Model
SMGL’s essential components and concepts include the following:
A comprehensive approach. Maternal deaths cannot be prevented by any one intervention alone. Reducing maternal mortality requires a solution that addresses multiple health system issues at multiple levels. SMGL uses evidence-based interventions that are designed to address three dangerous delays that pregnant women face in childbirth: delays in deciding to seek care for an obstetric emergency, delays in reaching a health facility in time, and delays in receiving quality care at health facilities.
An adequate number of high-quality delivery facilities, including EmONC, that are accessible within 2 hours of the onset of labor or obstetric emergencies.
An integrated communication-transportation system that functions 24 hours a day/7 days a week to encourage and enable pregnant women to use delivery care facilities. This system should include community outreach and interventions that increase awareness of these facilities.
An adequate number of skilled birth attendants who can provide quality care for normal delivery and who are able to identify and refer obstetric emergencies.
A functional supply chain system to ensure that facilities have the equipment, supplies, commodities, and drugs they need to deliver high-quality obstetric care.
A system that accurately records every birth and maternal and neonatal death.

4 Maternal and Perinatal Health Outcomes
Uganda
Population of the country (2014 Uganda Bureau of Statistics projection)
36,615,600
Total fertility rate (2011 DHS) 6.2
SMGL-Supported Districts in Uganda
Total population of the 4 SMGL-supported districts (2011 Uganda Bureau of Statistics projection)
1,750,000
Estimated number of births in the 4 SMGL-supported districts during Phase 1 (2012 – 2013 endline data and DHS age-specific fertility rates)
78,261
Combined area of the 4 SMGL-supported districts 13,079 sq km
Population density of the 4 SMGL-supported districts 26.2 WRA per sq km
SMGL = Saving Mothers, Giving Life; DHS = Demographic and Health Survey; WRA = women of reproductive age. Note: The total fertility rate indicates the average number of births a woman would have in her lifetime at current age-specific fertility rates.
Figure 1. Demographic and Population Data for Uganda, Zambia, and Their SMGL-Supported Districts
Zambia
Population of the country (2010 national census) 13,092,666
Total fertility rate (2007 DHS) 6.2
SMGL-Supported Districts in Zambia
Total population of the 4 SMGL-supported districts (Projected from 2010 national census data for 2011)
925,198
Estimated number of births in the 4 SMGL-supported districts during Phase 1 (crude birth rate combined with census projection)
37,267
Combined area of the 4 SMGL-supported districts 49,412 sq km
Population density of the 4 SMGL-supported districts 3.9 WRA per sq km
Uganda
Zambia

5Maternal and Perinatal Health Outcomes
Participating US Government agencies, along with partner governments and multiple partner organizations, built on existing district maternal and child health services. SMGL-supported staff conducted routine monitoring during the first year of the project, including baseline and endline assessments3 before and after Phase 1.
Results from monitoring and evaluation indicate that SMGL interventions are effective, because of a combination of the following factors:
� Greater supply of services, including increased availability of and improved access to obstetric services.
� Increased demand for obstetric and HIV services, due to voucher programs and intensified activities to increase community awareness, as well as to women’s growing recognition of the importance of facility delivery and skilled attendance at birth.
� Improved quality of care at facilities that hired more staff, trained and mentored more staff in EmONC, stocked necessary equipment and supplies, and had reliable supplies of medicines.
The first year of SMGL was designed to provide “proof of concept” in the eight pilot districts to determine (1) if the SMGL interventions could improve health outcomes for women and their infants and (2) how these interventions could be scaled up as SMGL expands. The declines in mortality achieved in both countries are extraordinary given the short timeframe of Phase 1 (12 months).
This report, which focuses on Maternal and Perinatal Health Outcomes in Health Facilities, is one of five SMGL documents prepared by the Centers for Disease Control and Prevention (CDC) and by the Uganda and Zambia CDC country offices. The other documents are an Executive Summary and reports on the following topics: Monitoring and Evaluation Overview, Maternal Mortality, and Emergency Obstetric and Newborn Care Access and Availability.
CDC, in collaboration with the US Agency for International Development and the US Office of the Global AIDS Coordinator, led the monitoring and evaluation efforts for the SMGL initiative. These activities were conducted in close collaboration with the governments of Uganda and Zambia and partner organizations.
SMGL Monitoring and Evaluation Extensive monitoring and evaluation (M&E) of SMGL during Phase 1 was essential to assess potential changes in the key indicators closely related to maternal and neonatal mortality. SMGL M&E efforts drew upon the experience of existing global initiatives designed to standardize data-collection methods for monitoring interventions, making decisions, and developing health policies related to maternal and neonatal outcomes and care.
The SMGL M&E Framework included a range of indicators designed to measure program achievements in Phase 1. These indicators can be grouped into four broad categories:
� Impact — such as changes in the number of maternal and newborn deaths.
� Outcomes — such as percentage of deliveries in health facilities and rates for Cesarean sections (C-sections).
� Outputs — such as the number of EmONC signal functions performed, HIV tests conducted, and PMTCT (prevention of mother-to-child HIV transmission) services provided.
� Processes — such as hiring and training personnel, upgrading facilities, and stockpiling life-saving medicines.
Several M&E methods were used to assess the various aspects of SMGL during Phase 1. The most important of these processes were
� Health Facility Assessments (HFAs): HFAs were conducted before and after Phase 1 at all facilities that provide delivery services in
3. SMGL baseline assessments generally covered the period before SMGL interventions started in June 2012. Endline assessments covered the first year of SMGL implementation, but varied by data source. Details are provided when data methods are presented.

6 Maternal and Perinatal Health Outcomes
SMGL-supported districts in both Uganda and Zambia. In Uganda, HFAs were conducted in 16 hospitals or Level IV health centers (high-level advanced care facilities), 72 Level III health centers (middle-level facilities), and 19 Level II health centers (lower-level primary care facilities), for a total of 107 facilities. In Zambia, HFAs were conducted in 6 hospitals, 91 health centers (middle-level facilities), and 16 health posts (lower-level facilities), for a total of 113 facilities.
The HFAs gathered baseline and endline data on maternity care infrastructure; EmONC availability and use; human resources; and drugs, equipment, and supplies. (See the Emergency Obstetric and Newborn Care Access and Availability report for more detail.)
� Routine Health Information Systems: Existing Health Management Information Systems (HMIS), which collect monthly statistics from health facilities, were used to monitor access to and quality, efficiency, and use of maternal and child health (MCH) services. For example, one health information system supported by the President’s Emergency Plan for AIDS Relief (PEPFAR) monitors MCH and HIV-related indicators. (See the Emergency Obstetric and Newborn Care Access and Availability report for more detail.)
� Facility-Based Pregnancy Outcome Monitoring: To track key facility indicators, Uganda and Zambia intensified existing efforts to document maternal and neonatal outcomes accurately and completely. These outcomes included maternal complications, the use of life-saving interventions such as C-sections, and more thorough identification and investigation of maternal deaths.
In Zambia, reductions in maternal mortality were monitored through routine identification and investigation of deaths that occurred in facilities before and during SMGL Phase 1. (See later sections of this report, Maternal and Perinatal Outcomes in Health Facilities, for more detail.)
� Community-Based Maternal Mortality Identification: In Uganda, SMGL built on the existing data-collection infrastructure of the Village Health Teams (VHTs) to collect information on maternal deaths in the four SMGL-supported districts. To obtain baseline information, one member of the VHT visited each household in his or her village. If any households reported deaths of women of reproductive age (WRA) during the baseline period, health personnel at the parish level followed up. If the deceased woman had been pregnant at the time of her death or in the 3 months preceding it, a verbal autopsy interview was conducted in the household, followed by death certification and classification of cause of death.
After the SMGL initiative began in June 2012, monitoring switched to a prospective approach. VHTs reported on any death of WRA in the village, and the same procedure was followed. In October 2013, the SMGL partners conducted a second retrospective data collection to identify all deaths of WRA during Phase 1.
Zambia did not have a community-based system to collect health data in place before the SMGL initiative began. It set up a new system of community key informants, who tracked each pregnant woman until the end of the 42-day postpartum period. However, logistical challenges limited the coverage and completeness of the data gathered.
In addition, although a March 2012 census of the four SMGL-supported districts identified maternal deaths during the baseline period, an endline census did not occur. As a result, Zambia only monitored maternal deaths that occurred in health facilities. (See the Maternal Mortality report for more detail.)

7Maternal and Perinatal Health Outcomes
Assessing SMGL’s Effect on Maternal and Perinatal Health Outcomes in Facilities Maternal and perinatal outcome indicators reflect how effective SMGL interventions have been in improving Basic and Comprehensive EmONC in health facilities. SMGL-supported staff tracked several impact and outcome indicators of MCH services, including the following:
� Institutional delivery rate in EmONC facilities.
� Active Management of the Third Stage of Labor (AMTSL) rate.
� C-section rate.
� Met need for EmONC.
� Case fatality rate.
� Maternal mortality ratio.
� Perinatal mortality rate.
� Stillbirth rate.
� Predischarge neonatal mortality rate.
In Zambia, M&E data collection began before the official start-up in June 2012; SMGL-supported staff conducted situation analyses and transitional interventions in 2011. Lessons learned in Zambia were incorporated into the M&E plans for Uganda, where planning activities started in early 2012 (Figure 2).
Selected Key Findings from SMGL Phase 1
� Maternal mortality fell sharply (by 30%) in Uganda’s four SMGL-supported districts. (The equivalent population-based maternal mortality ratios could not be calculated for SMGL-supported districts in Zambia.) Maternal mortality also declined by 35% in health facilities that implemented SMGL interventions in both Uganda and Zambia. These improvements are likely due to women’s increased access to emergency obstetric care and the effective care they receive once they arrive at health facilities. (See the Maternal Mortality report for more detail.)
� The percentage of all births in SMGL-supported districts that occurred at health facilities increased from 46% to 74% in Uganda (a 62% increase) and from 63% to 84% in Zambia (a 35% increase). (See later sections of this report, Maternal and Perinatal Outcomes in Health Facilities, for more detail.)
� The percentage of all facilities performing specific life-saving interventions called “signal functions” increased. By the end of Phase 1, both
countries had an adequate number of facilities (relative to each district’s population) to provide Basic and Comprehensive EmONC. In particular, middle-level health clinics in both countries made substantial gains in their ability to perform more life-saving interventions. The percentage of middle-level facilities that were providing four or more of the recommended seven signal functions increased from 31% to 57% in Uganda and from 27% to 44% in Zambia. (See the Emergency Obstetric and Newborn Care Access and Availability report for more detail.)
� SMGL-supported districts showed improvement in treatment for HIV-positive mothers and prophylaxis for their infants. In Uganda, 28% more HIV-positive women received treatment and 27% more infants received prophylaxis. Increases in Zambia were 18% and 29%, respectively. (See the Emergency Obstetric and Newborn Care Access and Availability report for more detail.)

8 Maternal and Perinatal Health Outcomes
For the purposes of monitoring facility outcomes, the baseline and endline periods are defined as 12-month periods that extended before and after the official SMGL launch. The baseline period included outcomes during June 2011 – May 2012. The endline period included outcomes during June 2012 – May 2013. In Uganda, data collection continued after May 2013 so that selected outcomes from June 2013 could be included.
MCH indicators in both countries were reported quarterly, from January – March 2011 through April – June 2013, to allow immediate feedback to the program. Results for some indicators are presented separately for all health facilities in SMGL-supported districts, as well as for those with Basic or Comprehensive EmONC.
UG
AN
DA
ZAM
BIA
Baseline Health Facility Assessment
Dec Jan Feb Mar April May June Jul Aug Sep Oct Nov Dec Jan Feb Mar April May June
Baseline Health Facility Assessment
Prospective Monitoring of AggregateFacility Outcomes
Retrospective Aggregate Facility
Outcomes
Endline Health Facility
Assessment
Endline Health Facility Assessment
Baseline and Endline Aggregate non-CEmONC Facility Outcomes
2012 2013
SMGL Phase 1 Begins
SMGLPhase 1
Ends
Retrospective POMSin CEmONC Facilities
Prospective POMS in CEmONC Facilities
Endline RAPIDBaseline RAPID
NOTE: Baseline period is June 2011–May 2012. Endline period is June 2012–May 2013. POMS = Pregnancy Outcomes Monitoring Survey; RAPID = Rapid Ascertainment Process for Institutional Deaths; SMGL = Saving Mothers, Giving Life.
Figure 2. Data Collection for Maternal and Perinatal Outcomes in Health Facilities in SMGL-Supported Districts in Uganda and Zambia
Significance TestingTo determine whether changes between the baseline and endline periods were significant, SMGL evaluation staff calculated a z-statistic for the observed change, which is used to determine the significance levels of the change. These significance levels are presented in Tables 1 and 2 in the Maternal and Perinatal Health Indicators section (pages 27 – 28).
The data presented in this report are not subject to sampling error because they are complete counts, not samples. However, the data may be affected by random variation. That is, the number of events that actually occurred can be considered as one possible result among many possible results that could have arisen under the same circumstances. Thus, when a change is labeled as significant, it means that the difference is extremely unlikely to be due to random variability. See the Appendix (pages 31 – 35) for complete data.

9Maternal and Perinatal Health Outcomes
Data Sources Because of differences in existing data availability before SMGL, Uganda and Zambia used different data-collection approaches and tools to monitor their maternal and perinatal health outcomes. Although the definitions of indicators were standard, the differences in the primary data used to compute these indicators are substantial, and their direct comparison is not advisable.
In Uganda, data were collected through the following methods:
� A Pregnancy Outcomes Monitoring Survey (POMS) in Comprehensive EmONC (CEmONC) facilities that collected individual-level data on all pregnancy outcomes.
� An aggregation of all pregnancy outcomes data from non-CEmONCs (POMS aggregate).
� The RAPID (Rapid Ascertainment Process for Institutional Deaths) method, which was developed by Immpact, a global research initiative. The RAPID method identifies unreported maternal deaths in health facilities by reviewing all facility records relating to deaths among women of reproductive age (aged 15 – 49 years), and then identifying those that are pregnancy-related (Immpact, 2007). This approach minimizes the underreporting of maternal deaths that occur outside the obstetric area, which can be missed in routine reporting.
� Population data from a mini-census in the four SMGL-supported districts.
� A Reproductive Age Mortality Study (RAMOS) cross-checked with facility data.
In Zambia, data were collected through the following methods:
� Routine, facility-level aggregated data collected monthly or quarterly.
� Population data from the 2010 national census.
� SMGL baseline census to identify women of reproductive age, followed by verbal autopsies. For endline data, deaths were reported by community key informants, cross-checked with facility monitoring reports.
Details about these collection methods are described in more detail in the following sections.
UgandaPregnancy Outcomes Monitoring Survey The baseline HFA found that pregnancy outcome events were poorly captured in the routine health information system. To correct for this problem, SMGL-supported staff conducted a retrospective POMS in November 2012 in 16 CEmONC facilities (hospitals and Level IV health centers), collecting data from the period January 2011 - October 2012. From November 2012 on, POMS collected data prospectively.
The POMS captured individual-level data on the outcomes of pregnant women who received care at these facilities. Births at the 16 CEmONC facilities accounted for about 59% of all births in SMGL-supported health facilities that provide delivery care in 2011, according to the baseline HFA data.
The POMS collected individual-level data from the 16 CEmONC facilities on the following:
� Maternal age.
� Parity.
� Type of delivery.
� Presentation and position.
� Plurality (e.g., twins, triplets).
� Pregnancy outcome.
� Apgar scores.
� Maternal and newborn complications.
� Weight at birth.
� Provision of AMTSL.
� Obstetric surgeries and pregnancy terminations.
The POMS’ data-collection tools and standard operating procedures were designed to extract individual-level data from the following primary data sources:
� Maternity registers.
� Operation theater registers (obstetric and general theaters).

10 Maternal and Perinatal Health Outcomes
� Registers from women’s inpatient wards (obstetrics, gynecology, and female wards), including admission and discharge registers, daily report registers, and nurses’ “round books.”
� Maternal death notification forms and audit forms.
For each patient, up to three maternal complications were recorded, with the most immediately life-threatening complication listed first.
Aggregated Data from Non-CEmONC FacilitiesSMGL-supported staff collected aggregate pregnancy outcome data from nine Basic EmONC (BEmONC) facilities and 103 non-EmONC facilities from data collection forms used as part of a point-in-time HFA questionnaire (Averting Maternal Death and Disability Program, 2010).
These data were retrospective, covering 29 months ( January 2011 – May 2013), and were collected in conjunction with the endline HFA. Data were also actively collected from maternity registers, typically the only data source in lower-level facilities.
The aggregate HFA pregnancy outcome data and the individual-level POMS data were summed for each month to provide estimates for the main indicators of obstetric care in EmONC facilities. The aggregate pregnancy outcomes were the only source of estimates of obstetric care in non-EmONC facilities.
Population DataPopulation data were needed to estimate the number of births, which was used in the denominator of many of the SMGL indicators. In the absence of a recent Uganda census (the last one was in 2002), establishing population estimates for SMGL-supported districts was a challenge.
This challenge was compounded by variations in population projections issued and used by different institutions in Uganda. Thus, SMGL-supported staff decided to conduct a four-district census at the end of Phase 1, using the existing VHTs to collect data.
Trained interviewers counted all women of reproductive age (WRA) and their live births during June 2012 – May 2013. They also counted all deaths of WRA that occurred during the same period. Virtually all villages (98%) in the four districts were included. This process was part of the endline RAMOS conducted in October – November 2013. Baseline and endline RAMOSs are described in the SMGL report on Maternal Mortality.
The four-district census counted about 400,000 WRA, a figure similar to the district-level WRA population estimates for the four districts. The number of live births counted in the census was about 35% lower than what had been estimated from the results of the 2011 Uganda Demographic and Health Survey (Uganda Bureau of Statistics and ICF International Inc., 2012). Thus, 2011 age-specific fertility rates were applied to the WRA and stratified by age group to estimate the number of live births at endline and baseline.
Maternal Death IdentificationAll community-level maternal deaths identified during the RAMOS (baseline and endline) were cross-checked with WRA deaths identified in EmONC facilities (detected by the RAPID method in CEmONC facilities and by HFAs in other health facilities). Maternal deaths from both sources were matched by age, residence, date of death, place of death, and cause of death, when available.
When a facility maternal death was reported in a RAMOS but not identified through facility reviews, it was added to the count of facility maternal deaths. This method improved the case detection of facility maternal deaths and contributed to changes in the notification and reporting of maternal deaths in medical records in both Uganda and Zambia. The SMGL initiative has also raised awareness about the importance of routine maternal death notifications and audits, and facility reporting of maternal deaths improved during Phase 1.
RAMOS and facility death reports provided data on case fatality rates and other estimates related to maternal deaths that are facility-related.

11Maternal and Perinatal Health Outcomes
2010 census. Projections of the population and number of births at endline were based on the population growth in each district.
Maternal Death Identification Similar to the efforts in Uganda, maternal deaths were identified in health facilities in Zambia through two sources: facility-based data and community-based data, which were then cross-checked with facility information. Data reports included deaths from direct and indirect obstetric causes that were captured in the routine monitoring of pregnancy outcomes (monthly or quarterly) in health facilities in SMGL-supported districts.
To verify the number of maternal deaths in facilities at baseline (before the SMGL intervention began), SMGL-supported staff used information on the place of death collected in a baseline mortality household census conducted during March – April 2012. (See the SMGL report on Maternal Mortality for more information about this survey.)
Maternal deaths reported to have occurred in facilities in SMGL-supported districts were cross-checked with facility monitoring reports of maternal deaths. If a facility death was reported in the household survey but was not recorded in the facility’s monthly monitoring statistics, the death was identified as facility-based.
Similarly, cross-checks were performed for deaths that occurred during SMGL Phase 1, but were limited to a smaller number of maternal deaths identified by community key informants. This information included 30 confirmed maternal deaths. Deaths reported to have occurred in facilities were cross-checked with the facility monitoring reports. As with the baseline data, unmatched deaths were added to the facility counts of maternal deaths.
ZambiaRoutine Program MonitoringSMGL implementing partners in Zambia conducted routine monthly or quarterly facility-level data collection, focusing on pregnancy outcomes in facilities in SMGL-supported districts. SMGL-supported staff and mentoring midwives were responsible for routinely collecting data from clinical registers.
The country also reviewed various indicators related to MCH and updated the recording registers. SMGL-supported headquarters staff trained the field staff and performed quality improvement exercises to strengthen the district’s data-collection system.
M&E teams in Zambia collected aggregated data on maternal and perinatal outcomes from all health facilities in SMGL-supported districts as part of the baseline HFA. Once the SMGL interventions were introduced, M&E data collection occurred monthly or quarterly. The data were used to calculate a standard set of core indicators, based on those recommended by the World Health Organization (WHO). Official Ministry of Health registers were the source of information for the number of
� Vaginal deliveries.
� C-section deliveries.
� Live births.
� Stillbirths.
� Neonatal deaths.
� Maternal and neonatal complications.
Population Data In Zambia, data from the 2010 census were used to calculate district populations. The total number of expected births was estimated by applying the crude birth rate of 40 live births per 1,000 population reported in the

12 Maternal and Perinatal Health Outcomes
Maternal and Perinatal Health Indicators To significantly reduce maternal mortality, women with delivery complications must have access to emergency obstetric care. As predicting which women will experience obstetric complications is nearly impossible, the SMGL model is designed to improve access to EmONC for all women in labor.
EmONC facilities include those with Basic (BEmONC) and Comprehensive (CEmONC) levels of care. Basic care interventions include administration of parenteral antibiotics, uterotonics, and anticonvulsants; manual removal of placenta; removal of retained products; assisted vaginal delivery; and basic neonatal resuscitation. Comprehensive care interventions include all basic functions, plus obstetric surgery and blood transfusion.
In both Uganda and Zambia, only a few middle-level health facilities provide full BEmONC services. Nearly all hospitals (and a few high-level health centers in Uganda) provided CEmONC.
Data for the indicators discussed in this section are summarized in Tables 1 and 2 (pages 27 – 28).
Institutional Delivery RateThe SMGL initiative increased the number of women delivering at health facilities in the pilot countries by encouraging communities to promote facility delivery, improving transportation, and preparing facilities for an increased demand in their services.
In Uganda, the proportion of deliveries that took place at any health facility increased by 62%, from 46% at baseline to 74% at endline (Figure 3). In Zambia, the proportion increased by 35%, from 63% at baseline to 84% at endline.
Most of this increase in the institutional delivery rate came from the higher use of middle-level and low-level health facilities staffed with
46
28
74
36
0
10
20
30
40
50
60
70
80
90
100
All Facilities EmONC Facilities
Perc
enta
ge
63
26
84
30
All Facilities EmONC Facilities
EmONC = Emergency Obstetric and Newborn Care; SMGL = Saving Mothers, Giving Life.
Figure 3. Percentage of Births That Take Place in Health Facilities in SMGL-Supported Districts in Uganda and Zambia, by Facility Type, Before and After SMGL
Uganda Baseline
Uganda Endline
Zambia Baseline
Zambia Endline
Uganda Zambia
Figure 3. Percentage of Births That Took Place in Health Facilities in SMGL-Supported Districts in Uganda and Zambia, by Facility Type, Before and After SMGL

13Maternal and Perinatal Health Outcomes
skilled birth attendants — that is, Level II and III health centers in Uganda and health centers and health posts in Zambia. This change in usage allows higher-level EmONC facilities to focus on providing better care for more complicated cases.
Ideally, all births should occur in an EmONC facility. However, a period of transition may be needed, during which women who want to deliver in a health facility receive care from a skilled birth attendant in a facility that may not be able to perform all seven BEmONC functions, but has transportation available in case of an emergency.
Proportion of All Births in EmONC FacilitiesThe proportion of all births that take place in an EmONC facility serves as a crude indicator of the capacity of a country’s health system to respond to obstetric and newborn emergencies. Because most complications are hard to predict, the goal of the SMGL initiative is for all women in labor to be able to access EmONC services within 2 hours. The proportion of births delivered in EmONC facilities increased from 28% at baseline to 36% at endline in Uganda and from 26% to 30% in Zambia (Figures 4 and 5).
Figure 4. Percentage of Births That Took Place in Health Facilities in SMGL-Supported Districts in Uganda, by Facility Type and Quarter
23 23 28 28 26 33 35 38 35 3728
36
12 1515 15 16
2843 41
34 33
17
38
35 3842 43 42
61
78 7869 70
46
74
0
10
20
30
40
50
60
70
80
90
100
Jan–Mar2011
Apr–Jun2011
Jul–Sept2011
Oct–Dec2011
Jan–Mar2012
Apr–Jun2012
Jul–Sept2012
Oct–Dec2012
Jan–Mar2013
Apr–Jun2013
Baseline Endline
Perc
enta
ge
EmONC Delivery Rate Non-EmONC Delivery Rate
EmONC = Emergency Obstetric and Newborn Care; SMGL = Saving Mothers, Giving Life.
Start of SMGL in June 2012
Figure 4. Percentage of Births That Take Place in Health Facilities in SMGL-Supported Districts in Uganda, by Facility Type and Quarter
62% Increase
14 Maternal and Perinatal Health Outcomes
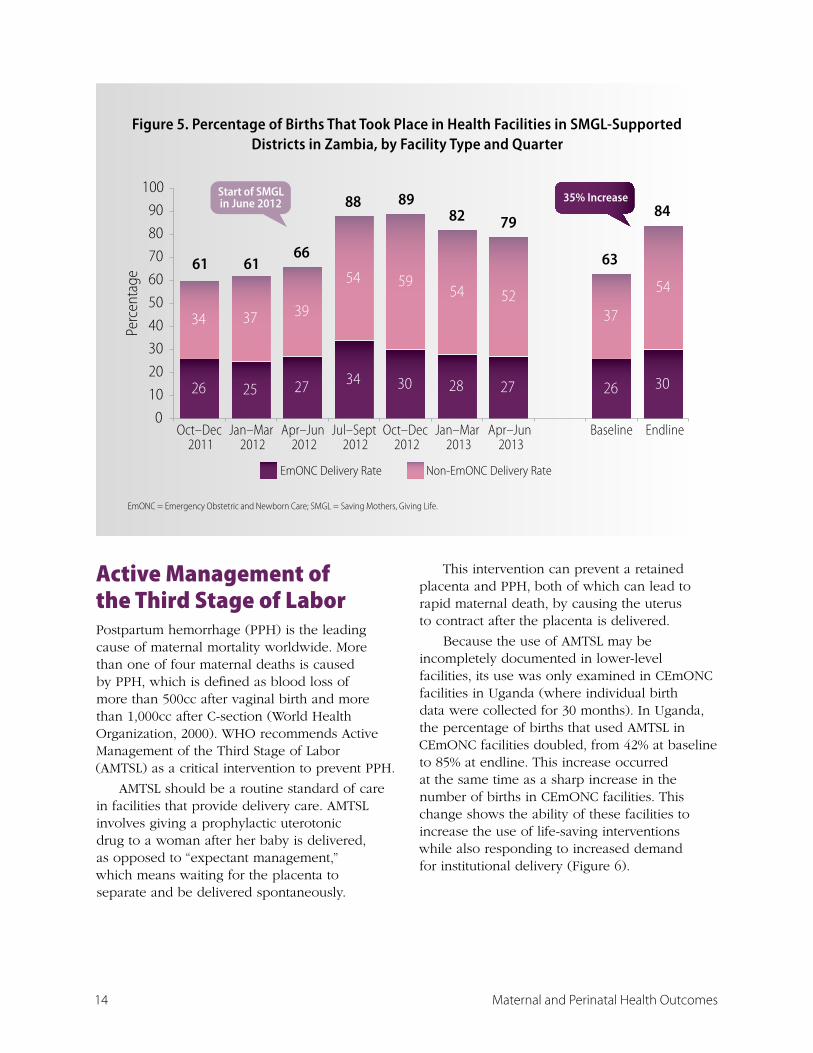
Figure 5. Percentage of Births That Took Place in Health Facilities in SMGL-Supported Districts in Zambia, by Facility Type and Quarter
EmONC = Emergency Obstetric and Newborn Care; SMGL = Saving Mothers, Giving Life.
26 25 27 34 30 28 27 26 30
34 37 39
54 5954 52
37
54
61 6166
88 8982 79
63
84
0
10
20
30
40
50
60
70
80
90
100
Oct–Dec 2011
Jan–Mar 2012
Apr–Jun 2012
Jul–Sept 2012
Oct–Dec 2012
Jan–Mar 2013
Apr–Jun 2013
Baseline Endline
EmONC Delivery Rate Non-EmONC Delivery Rate
Perc
enta
ge
35% IncreaseStart of SMGL in June 2012
Figure 5. Percentage of Births That Take Place in Health Facilities in SMGL-Supported Districts in Zambia, by Facility Type and Quarter
Active Management of the Third Stage of LaborPostpartum hemorrhage (PPH) is the leading cause of maternal mortality worldwide. More than one of four maternal deaths is caused by PPH, which is defined as blood loss of more than 500cc after vaginal birth and more than 1,000cc after C-section (World Health Organization, 2000). WHO recommends Active Management of the Third Stage of Labor (AMTSL) as a critical intervention to prevent PPH.
AMTSL should be a routine standard of care in facilities that provide delivery care. AMTSL involves giving a prophylactic uterotonic drug to a woman after her baby is delivered, as opposed to “expectant management,” which means waiting for the placenta to separate and be delivered spontaneously.
This intervention can prevent a retained placenta and PPH, both of which can lead to rapid maternal death, by causing the uterus to contract after the placenta is delivered.
Because the use of AMTSL may be incompletely documented in lower-level facilities, its use was only examined in CEmONC facilities in Uganda (where individual birth data were collected for 30 months). In Uganda, the percentage of births that used AMTSL in CEmONC facilities doubled, from 42% at baseline to 85% at endline. This increase occurred at the same time as a sharp increase in the number of births in CEmONC facilities. This change shows the ability of these facilities to increase the use of life-saving interventions while also responding to increased demand for institutional delivery (Figure 6).

15Maternal and Perinatal Health Outcomes
Figure 6. Number of Births in CEmONC Facilities and Percentage of Births with AMTSL in CEmONC Facilities in SMGL-Supported Districts in Uganda, by Quarter
Figure 6. Number of Births in CEmONC Facilities and Percentage of Births with AMTSL in CEmONC Facilities in SMGL-Supported Districts in Uganda, by Quarter
Births (in Thousands) Percentage of Births with AMTSL
26.3
30.1
26.0
24.6
53.4
74.6
77.5
87.6
89.4
89.8Apr−Jun 2013
Jan−Mar 2013
Oct−Dec 2012
Jul−Sep 2012
Apr−Jun 2012
Jan−Mar 2012
Oct−Dec 2011
Jul−Sep 2011
Apr−Jun 2011
Jan−Mar 20113.9
3.9
4.7
4.6
4.5
5.4
5.3
5.8
5.5
5.4
CEmONC = Comprehensive Emergency Obstetric and Newborn Care; AMTSL = Active Management of the Third Stage of Labor; SMGL = Saving Mothers, Giving Life.
Cesarean Sections as a Proportion of All BirthsCesarean sections (C-sections) can prevent both maternal and perinatal deaths, as well as severe maternal health complications such as obstetric fistula. The population-based C-section rate (number of C-sections performed as a proportion of all births) is an indicator of access to life-saving obstetric care. WHO recommends that C-sections make up 5% – 15% of all births (World Health Organization, 1985).
A C-section rate of less than 5% suggests that women in need of this life-saving procedure are not able to access it. Lack of access is an important contributor to high maternal and perinatal death rates in resource-limited settings.
C-section requires skilled staff and adequately supplied facilities, both of which increased and improved as a result of the SMGL interventions. The interventions that contributed to higher numbers of C-sections in Uganda and Zambia included
� More CEmONC facilities.
� Improved transportation.
� Improved emergency referrals from lower to higher levels of care for women with complications.
In Uganda’s SMGL-supported districts, the population-based C-section rate increased by 23%, from 5.3% at baseline to 6.5% at endline. In Zambia, the rate increased by 15%, from 2.7% at baseline to 3.1% at endline (Figure 7).
Although Uganda’s rates fall within the optimal 5% – 15% range, Zambia’s rates remain lower than 5%. One challenge in Zambia has been a shortage of clinicians with surgical skills. However, improvements in transport and referral capabilities as part of the SMGL initiative helped increase access to neighboring district hospitals with obstetric surgical care, particularly for women with complicated deliveries.
In addition, the C-section rate in Zambia may have been underestimated because of referrals from SMGL-supported districts to

16 Maternal and Perinatal Health Outcomes
Figure 7. C-Section Ratea as a Proportion of All Births in SMGL-Supported Districts in Uganda and Zambia, Before and After SMGL
5.3
2.7
6.5
3.1
0
1
2
3
4
5
6
7
8
9
10
C-Section = Cesarean section; SMGL = Saving Mothers, Giving Life.a Number of C-sections performed in health facilities divided by the expected number of live births in that area during the same period; expressed as a percentage.
Figure 7. C-Section Ratea as a Proportion of All Births in SMGL-Supported Districts in Uganda and Zambia, Before and After SMGL
Uganda Baseline
Uganda Endline
Uganda
Zambia Baseline
Zambia Endline
Zambia
C-Se
ctio
n Ra
te (%
)
neighboring non-SMGL-supported districts. For example, pregnant women living in the northern part of the SMGL-supported district of Kolomo, a rural region far from any CEmONC facility, are referred to Choma Regional Hospital in a neighboring non-SMGL-supported district. C-sections performed at this facility would not have been counted in the SMGL assessments.
In Uganda, the increase in C-sections during Phase 1 of the SMGL Initiative was primarily due to system upgrades that SMGL introduced in Level IV (high level) health centers (Figure 8). These included renovations and increased staffing, training, equipment, and supplies. Level IV health centers reported a 2.5-fold increase in the proportion of deliveries by C-section and, at endline, accounted for more than 40% of C-sections in SMGL-supported districts (Figure 8).
The most common reason reported for performing C-sections in Uganda was obstructed labor (more than 50%). This complication occurs when the fetus cannot enter or advance through the birth canal despite sustained
labor contractions. Without access to C-section, women with obstructed labor have a high risk of death at delivery, postpartum sepsis, or obstetric fistulas (one of the most devastating birth injuries). Lack of access to C-sections can also adversely affect perinatal outcomes.
Met Need for EmONCThe met need for EmONC is the proportion of all women with major obstetric complications who are treated in EmONC facilities. It is an indicator of whether the coverage and use of EmONC services are adequate. WHO recommends use of the met need indicator in two settings: all health facilities and EmONC facilities (World Health Organization, 2009).
The numerator for this indicator is women admitted with or who develop direct or major obstetric complications while delivering in a health facility. The denominator is the estimated number of women with severe obstetric complications in the same geographical area

17Maternal and Perinatal Health Outcomes
Figure 8. Percentage of Deliveries by C-Section in Hospitals and Level IV Health Centers and Population C-Section Rate in SMGL-Supported Districts in Uganda
25 26 27 3026
711
10
14
193.9
5.0
5.4
6.6 6.4
0
1
2
3
4
5
6
7
8
0
5
10
15
20
25
30
35
Jan–Jun 2011
July–Dec 2011
Jan–Jun 2012
July–Dec 2012
Jan–June 2013
Hospitals Level IV Health Centers C-Section Rate
CEmONC = Comprehensive Emergency Obstetric and Newborn Care; SMGL = Saving Mothers, Giving Life.a Includes hospitals and Level IV health centers.b The World Health Organization recommends that C-sections make up 5%–15% of all births.
Perc
enta
ge o
f Birt
hs w
ith C
-Sec
tion
in
CEm
ON
C Fa
cilit
iesa
Popu
latio
n C-
Sect
ion
Rate
per
100
Birt
hs
Figure 8. Percentage of Deliveries by C-Section in Hospitals and Level IV Health Centers and Population C-Section Rate in SMGL-Supported Districts in Uganda
WHO minimum
levelb
and time period. An estimated 15% of pregnant women will develop obstetric complications that require medical care to avoid death or disability (World Health Organization, 2009). Because the number of pregnant women may be difficult to ascertain, the number of live births is used as a proxy. Direct or major obstetric complications include
� Hemorrhage (antepartum, intrapartum, or postpartum).
� Prolonged or obstructed labor.
� Ruptured uterus.
� Postpartum sepsis.
� Complications of abortion.
� Preeclampsia or eclampsia.
� Ectopic pregnancy.
In both Uganda and Zambia, information on major complications is typically recorded
in facilities’ maternity registers or labor and delivery logbooks. To ensure completeness, the SMGL-supported staff working in EmONC facilities in Uganda gathered information on obstetric complications from maternity wards and from other hospital wards and registers (e.g., gynecology wards, surgical wards, morgues). To avoid double counting, only complications associated with the delivery and immediate postpartum periods were recorded.
Trends in met need reflect changes in access and use of EmONC services among women who need them the most. They are also typically correlated with changes in population-level maternal mortality.
Ideally, all women with obstetric complications should receive the medical care they need — that is, met need should be 100% — but this goal is hard to meet in low-resource settings. Progress toward this goal is

18 Maternal and Perinatal Health Outcomes
an important sign of improvements in the availability and accessibility of EmONC services. Estimating met need is an important way to monitor improvements in these services.
Experts recommend that the met need indicator be calculated with and without abortion complications. Abortion complications are not included in the calculation of met need data presented for Uganda. If they had been, the met need for EmONC would have been higher.
When all health facilities were examined, met need increased by 42% in Uganda (from 46% at baseline to 66% at endline) and by 31% in Zambia (from 34% to 45%) (Figure 9). When only EmONC facilities were examined, the increase was 25% in Uganda (from 39% to 49%) and 23% in Zambia (from 26% to 32%).
Figure 9. Percentage of Met Need for EmONCa in Health Facilities in SMGL-Supported Districts in Uganda and Zambia, by Facility Type, Before and After SMGL Figure 9. Percentage of Met Need for EmONCa in Health Facilities in SMGL-Supported
Districts in Uganda and Zambia, by Facility Type, Before and After SMGL
46
39
66
49
0
10
20
30
40
50
60
70
34
26
45
32
EmONC = Emergency Obstetric and Newborn Care; SMGL = Saving Mothers, Giving Life.a Per 100 expected complications.
All Facilities EmONC Facilities
Perc
enta
ge
All Facilities EmONC Facilities
Uganda Baseline
Uganda Endline
Zambia Baseline
Zambia Endline
Uganda Zambia

19Maternal and Perinatal Health Outcomes
Direct Obstetric Case Fatality RateThe direct obstetric case fatality rate (CFR) represents the proportion of women with direct obstetric complications admitted to delivering facilities who died. This rate serves as a quality of care indicator. A strong correlation generally exists between CFRs and rates for facility-based maternal mortality.
Researchers are particularly interested in whether patient case management in higher-level facilities improves over time. Typically, as transportation and referral systems improve, women with more severe complications are referred to higher-level facilities. Thus, CFRs were calculated for all health facilities in SMGL-supported districts, as well as for EmONC facilities. (For details on SMGL-assisted improvements in transportation and quality of care, see the Obstetric Care Services Access and Availability report.)
In both Uganda and Zambia, the direct obstetric CFR fell in all health facilities in SMGL-supported districts after SMGL interventions were implemented (Figure 10). This finding strongly suggests that the quality of care for direct obstetric complications improved.
In Uganda, the all-facility CFR decreased by 25%, from 2.6% at baseline to 2.0% at endline. The CFR for EmONC facilities (those providing either BEmONC or CEmONC) decreased by 18%, from 2.9% to 2.4%. In Zambia, the all-facility CFR decreased by 33%, from 3.0% at baseline to 2.0% at endline. The CFR for EmONC facilities decreased by 35%, from 3.4% to 2.2%.
The reduction of CFR in non-EmONC facilities was even higher, declining by 75% in Uganda (from 3.2% to 0.78%) and by 24% in Zambia (from 2% to 1.5%). (See Appendix on pages 31 – 35 for complete data.) The steep declines in non-EmONC facilities are likely due to improved transportation and emergency referrals, which led to more women with complications in lower-level facilities being
Figure 10. Direct Obstetric Case Fatality Ratea in Health Facilities in SMGL-Supported Districts in Uganda and Zambia, by Facility Type, Before and After SMGL
Figure 10. Direct Obstetric Case Fatality Ratea in Health Facilities in SMGL-Supported Districts in Uganda and Zambia, by Facility Type, Before and After SMGL
2.62.9
2.0
2.4
0
0.5
1
1.5
2
2.5
3
3.5
4
3.0
3.4
2.02.2
EmONC = Emergency Obstetric and Newborn Care; SMGL = Saving Mothers, Giving Life.a Per 100 complications treated.
All Facilities EmONC Facilities
Perc
enta
ge
All Facilities EmONC Facilities
Uganda Baseline
Uganda Endline
Zambia Baseline
Zambia Endline
Uganda Zambia

20 Maternal and Perinatal Health Outcomes
transferred to EmONC facilities for management of complications. Consequently, there were fewer deaths in non-EmONC facilities.
Maternal Deaths A maternal death is defined by WHO as the death of a woman while pregnant or within 42 days of the termination of pregnancy, irrespective of the duration or site of the pregnancy, for any cause related to or aggravated by the pregnancy or its management, but not from accidental or incidental causes. Maternal deaths can be due to direct or indirect obstetric causes of death (World Health Organization, 1992).
This report describes maternal mortality in health facilities only. Additional analyses that include maternal deaths in the community are presented in the SMGL report on Maternal Mortality.
SMGL-supported staff enhanced the ability of districts in Uganda and Zambia to conduct maternal death audits and reviews by
� Training health staff to identify maternal deaths in facilities.
� Making notification and review forms available in each facility.
� Implementing protocols and guidelines.
� Training district doctors how to certify and code the causes of maternal deaths onsite with the International Classification of Diseases, 10th Revision (World Health Organization, 2012). This practice is new in Uganda.
Direct obstetric causes include causes related to pregnancy and its management. The main direct obstetric causes are antepartum and postpartum hemorrhage, uterine rupture, obstructed labor, abortion, preeclampsia or eclampsia, and sepsis. Indirect obstetric causes include tuberculosis, malaria, HIV infection, and cardiovascular diseases that are aggravated by pregnancy, childbirth, or puerperium.
Figure 11. Maternal Mortality Ratioa in Health Facilities in SMGL-Supported Districts in Uganda and Zambia, by Facility Type, Before and After SMGL
534
829
345
634
0
100
200
300
400
500
600
700
800
900
310
629
203
453
EmONC = Emergency Obstetric and Newborn Care; SMGL = Saving Mothers, Giving Life.a Per 100,000 live births.
Figure 11. Maternal Mortality Ratioa in Health Facilities in SMGL-Supported Districts in Uganda and Zambia, by Facility Type, Before and After SMGL
All Facilities EmONC Facilities
Mat
erna
l Mor
talit
y Ra
tioa
All Facilities EmONC Facilities
Uganda Baseline
Uganda Endline
Zambia Baseline
Zambia Endline
Uganda Zambia

21Maternal and Perinatal Health Outcomes
The maternal mortality ratio (MMR) in facilities is defined as the number of all maternal deaths from direct and indirect obstetric causes in facilities per 100,000 live births delivered in the same facilities during a specific period.
The MMR is related to access to and the quality of obstetric services. It is the ultimate indicator of maternal health and whether interventions designed to improve maternal health have been successful. The facility-based MMR should generally not be viewed as representative of a larger area, such as SMGL-supported districts. It may be higher or lower than the general population-based ratio depending on the mix of patients (with more or fewer complications) and the timeliness of referrals. Further, women from other districts may seek care in SMGL-affiliated facilities.
In Uganda, the MMR for all health facilities in SMGL-supported districts declined by 35%, from 534 maternal deaths per 100,000 live births at baseline to 345 per 100,000 at endline. The
MMR for EmONC facilities declined by 24%, from 829 to 634 maternal deaths per 100,000 (Figure 11). In Zambia, the MMR for all health facilities in SMGL districts declined by 35%, from 310 maternal deaths per 100,000 live births at baseline to 202 per 100,000 at endline. The MMR for EmONC facilities declined by 28%, from 629 to 453 maternal deaths per 100,000.
The declines in MMR correlate with reductions in the all-facility CFR due to major obstetric complications (from 2.6% to 2.0% in Uganda and from 3.1% to 2.0% in Zambia), which indicates that facilities in SMGL-supported districts have improved their quality of care. Most of the declines could be attributed to the reduced risk of dying from direct obstetric complications. The SMGL initiative specifically seeks to reduce maternal deaths in the period around labor and delivery, when major obstetric complications are the most lethal.
Figure 12. Maternal Mortality Ratiosa for Direct Obstetric Causes in Health Facilities in SMGL-Supported Districts in Uganda, Before and After SMGL
32
35
32
46
30
94
30
63
75
45
72
131
0 20 40 60 80 100 120 140
Other direct causes
Complications of unsafe abortion
Maternal Mortality Ratio in Facilities
Postpartum sepsis
Preeclampsia and eclampsia
Obstructed labor and uterine rupture
Obstetric hemorrhage
SMGL = Saving Mothers, Giving Life.a Per 100,000 live births in facilities.
Baseline
Endline
Figure 12. Maternal Mortality Ratiosa for Direct Obstetric Causes in Health Facilities in SMGL-Supported Districts in Uganda, Before and After SMGL

22 Maternal and Perinatal Health Outcomes
Figure 13. Maternal Mortality Ratiosa for Direct Obstetric Causes in Health Facilities in SMGL-Supported Districts in Zambia, Before and After SMGL
82
13
72
91
59
110
0 20 40 60 80 100 120
Other direct causes
Obstructed labor anduterine rupture
Obstetric hemorrhage
Maternal Mortality Ratio in FacilitiesSMGL = Saving Mothers, Giving Life.a Per 100,000 live births in facilities.
Baseline
Endline
Figure 13. Maternal Mortality Ratiosa for Direct Obstetric Causes in Health Facilities in SMGL-Supported Districts in Zambia, Before and After SMGL
Obstetric hemorrhage was and continues to be the leading cause of maternal death in both Uganda and Zambia (Figures 12 and 13). However, deaths due to hemorrhage declined rapidly — by 29% in Uganda and by 34% in Zambia — during Phase 1 of the SMGL initiative. This finding suggests that the increased access to and availability of CEmONC and the routine practice of AMTSL were able to sharply improve maternal outcomes.
Obstructed labor and its most severe complication, rupture of the uterus, were the second most common contributors to MMRs
from direct obstetric causes in both countries. The MMRs for these causes also declined dramatically during Phase 1 — by 58% in Uganda and by 78% in Zambia. The increased use of CEmONC (particularly the availability of obstetric surgery and safe blood) and the provision of parenteral antibiotics most likely contributed to reductions in the number of deaths due to obstructed labor and postpartum infections.

23Maternal and Perinatal Health Outcomes
Perinatal Mortality Rate in Health Facilities The perinatal mortality rate (PMR) combines stillbirths and early neonatal deaths. It provides an overall understanding of what is happening to a fetus or newborn in the continuum from before labor, through labor and delivery, and after birth. The PMR is an overall measure of the antenatal and obstetric care provided during childbirth. It is defined in this report as the number of stillbirths and predischarge neonatal deaths divided by the total number of births in the same facilities. It is expressed as per 1,000 births.
The PMR is important for several reasons. In some settings, a baby that is born alive but dies soon after may be misclassified as a stillbirth, rather than being classified as a live birth resulting in a neonatal death. The PMR minimizes the effect of such
misclassification by capturing all deaths whether they happened before or after delivery.
The PMR can also help researchers understand the holistic effect of perinatal interventions. Rather than focusing on outcomes of stillbirths or neonatal deaths, the PMR integrates the natural continuum between them. This information can be used, for example, to identify perinatal interventions that are able to reduce stillbirths yet are not able to improve the neonatal survival of infants “saved” from being a stillbirth. The PMR captures this potential shift in the timing of the fetal or infant death.
In Uganda, the PMR in health facilities in SMGL-supported districts decreased by 17%, from 39.3 perinatal deaths per 1,000 births at baseline to 32.7 per 1,000 at endline. In Zambia, the PMR decreased by 14%, from 37.9 to 32.8 perinatal deaths per 1,000 (Figure 14).
Figure 14. Perinatal Mortality Rate in Health Facilities in SMGL-Supported Districts in Uganda and Zambia, Before and After SMGL
SMGL = Saving Mothers, Giving Life.
Uganda Zambia
Perin
atal
Dea
ths p
er 1
,000
Fac
ility
Birt
hs
Uganda Baseline
Uganda Endline
Zambia Baseline
Zambia Endline
Figure 14. Perinatal Mortality Rate in Health Facilities in SMGL-Supported Districts in Uganda and Zambia, Before and After SMGL
39.3 37.9
32.7 32.8
0
5
10
15
20
25
30
35
40
45
50

24 Maternal and Perinatal Health Outcomes
Stillbirth Rate in Health FacilitiesThe total stillbirth rate is the number of stillbirths in health facilities divided by the total number of births in the same facilities during the same period. It is expressed per 1,000 births. Stillbirths are divided into two categories, macerated or fresh, on the basis of their appearance. Macerated stillbirths are typically those that die before labor begins. Fresh stillbirths are those that die intrapartum (during childbirth).
Although not all stillbirths can be prevented, those that occur during labor and delivery are often related to the quality of delivery care and are largely preventable. High-quality obstetric care could prevent stillbirths. Both Uganda and Zambia showed comparable declines in total stillbirth rates in facilities (by 20% and 19%, respectively), which suggests important improvements in the quality of care in health facilities during Phase 1 of the SMGL initiative (Figure 15).
Figure 15. Total Stillbirth Rate in Health Facilities in SMGL-Supported Districts in Uganda and Zambia, Before and After SMGL
31.2 30.5
24.8 24.8
0
5
10
15
20
25
30
35
40
45
50
SMGL = Saving Mothers, Giving Life.
Uganda Zambia
Still
birt
hs p
er 1
,000
Fac
ility
Birt
hs
Uganda Baseline
Uganda Endline
Zambia Baseline
Zambia Endline
Figure 15. Total Stillbirth Rate in Health Facilities in SMGL-Supported Districts in Uganda and Zambia, Before and After SMGL

25Maternal and Perinatal Health Outcomes
Fresh stillbirth data were available for all SMGL-supported districts in Uganda, but in Zambia, macerated and fresh stillbirths were not differentiated. The fresh stillbirth rate in Uganda decreased by 28%, from 22.4
fresh stillbirths per 1,000 births at baseline to 16.0 per 1,000 at endline (Figure 16). This finding also suggests improvement in the quality of delivery care during Phase 1.
Figure 16. Fresh, Macerated, and Total Stillbirth Rate in Health Facilities in SMGL-Supported Districts in Uganda, Before and After SMGL
22.416.0
8.8
8.8
31.2
24.8
0
5
10
15
20
25
30
35
40
SMGL = Saving Mothers, Giving Life.
Still
birt
h pe
r 1,0
00 F
acili
ty B
irths
Macerated Stillbirth Rate
Fresh Stillbirth Rate
Figure 16. Fresh, Macerated, and Total Stillbirth Rate in Health Facilities in SMGL-Supported Districts in Uganda, Before and After SMGL
Baseline Endline

26 Maternal and Perinatal Health Outcomes
Figure 17. Predischarge Neonatal Mortality Ratea in Health Facilities in SMGL-Supported Districts in Uganda and Zambia, Before and After SMGL
Predischarge Neonatal Mortality Rate
Newborns are most vulnerable in their first hours of life. Even after a live birth, they may require stimulation or help breathing or staying warm. Essential newborn care includes various evidence-based interventions designed to keep newborns alive and healthy.
Although the neonatal period is defined as the first 28 days of life, neonatal outcomes presented in this report only cover the period from birth to the time of discharge from a health facility (usually within 24 hours of birth). The predischarge neonatal mortality rate (NMR) is the number of
predischarge neonatal deaths divided by the number of live births in the same facilities during the same period. It is expressed per 1,000 live births.
The NMR in Uganda and Zambia did not change significantly (Figure 17). Given that the overall PMR decreased, the lack of significant change in the predischarge NMR may be due to the poor survivability of infants saved from being stillbirths. Another possibility is that, because of increased training on neonatal resuscitation conducted as part of the SMGL initiative, infants previously classified as stillbirths were being correctly classified as neonatal deaths.
8.47.78.1 8.2
0
2
4
6
8
10
12
14
SMGL = Saving Mothers, Giving Life.a Neonatal deaths that occurred before discharge from a health facility; length of stay after delivery is 24 hours, on average.
Uganda Zambia
Neo
nata
l Dea
ths p
er 1
,000
Liv
e Bi
rths
Uganda Baseline
Uganda Endline
Zambia Baseline
Zambia Endline
Figure 17. Predischarge Neonatal Mortality Ratea in Health Facilities in SMGL-Supported Districts in Uganda and Zambia, Before and After SMGL

27Maternal and Perinatal Health Outcomes
Table 1. Summary of Maternal and Perinatal Outcome Indicators for Health Facilities in SMGL-Supported Districts in Uganda
Indicator and Definition1 Facility Type
Baseline Endline%
Change2Significance
Level3
Institutional Delivery Rate Proportion of all births occurring in health facilities over a specified time period
All facilities
46% 74% 62% ***
EmONC facilities
28% 36% 28% ***
Active Management of the Third Stageof Labor (AMTSL) Rate Proportion of all delivering women who received AMTSL in CEmONC facilities over a specified time period
CEmONC facilities
42% 85% 100% ***
Cesarean Sections as a Proportion of All BirthsProportion of all births delivered by Cesarean section over a specified time period
All facilities
5.3% 6.5% 23% ***
Met Need for EmONCProportion of women with major direct obstetric complications treated in health facilities over a specified time period
All facilities
46% 66% 42% ***
EmONC facilities
39% 49% 25% ***
Direct Obstetric Case Fatality Rate4
Proportion of women with major direct obstetric complications who die in health facilities over a specified time period
All facilities
2.6% 2.0% -25% **
EmONC facilities
2.9% 2.4% -18% NS
Maternal Mortality Ratio4
Number of women who deliver and die in health facilities per 100,000 live births in health facilities
All facilities
534 345 -35% ***
EmONC facilities
829 634 -24% **
Perinatal Mortality RateNumber of stillbirths and predischarge neonatal deaths (usually within the first 24 hours) in health facilities per 1,000 births in health facilities
All facilities
39.3 32.7 -17% ***
Stillbirth RateNumber of stillbirths in health facilities per 1,000 births in health facilities
All facilities
31.2 24.8 -20% ***
Predischarge Neonatal Mortality RateNumber of births that result in a predischarge neonatal death (usually within the first 24 hours) in health facilities per 1,000 live births in health facilities
All facilities
8.4 8.1 -4% NS
CEmONC = Comprehensive Emergency Obstetric and Newborn Care, EmONC = Emergency Obstetric and Newborn Care. 1. Definitions are from World Health Organization resources, including Monitoring Emergency Obstetric Care: A Handbook.2. Percentage change calculations are based on unrounded numbers.3. Asterisks indicate significance levels calculated with a z-statistic as follows: *** = P < .01, ** = P < .05, * = P < .1, NS = not significant.4. Baseline maternal deaths in facilities were cross-checked with maternal deaths identified by a Reproductive Age Mortality Study at baseline and at endline.

28 Maternal and Perinatal Health Outcomes
Table 2. Summary of Maternal and Perinatal Outcomes Indicators for Health Facilities in SMGL-Supported Districts in Zambia
Indicator and Definition1 Facility Type
Baseline Endline%
Change2Significance
Level3
Institutional Delivery Rate Proportion of all births occurring in health facilities over a specified time period
All facilities
63% 84% 35% ***
EmONC facilities
26% 30% 17% ***
Cesarean Sections as a Proportion of All BirthsProportion of all births delivered by Cesarean section over a specified time period
All facilities
2.7% 3.1% 15% ***
Met Need for EmONCProportion of women with major direct obstetric complications treated in health facilities over a specified time period
All facilities
34% 45% 31% ***
EmONC facilities
26% 32% 23% ***
Direct Obstetric Case Fatality Rate4
Proportion of women with major direct obstetric complications who die in health facilities over a specified time period
All facilities
3.0% 2.0% -33% **
EmONC facilities
3.4% 2.2% -35% **
Maternal Mortality Ratio4
Number of women who deliver and die in health facilities per 100,000 live births in health facilities
All facilities
310 202 -35% **
EmONC facilities
629 453 -28% *
Perinatal Mortality RateNumber of stillbirths and predischarge neonatal deaths (usually within the first 24 hours) in health facilities per 1,000 births in health facilities
All facilities
37.9 32.8 -14% ***
Stillbirth RateNumber of stillbirths in health facilities per 1,000 births in health facilities
All facilities
30.5 24.8 -19% ***
Predischarge Neonatal Mortality RateNumber of births that result in a predischarge neonatal death (usually within the first 24 hours) in health facilities per 1,000 live births in health facilities
All facilities
7.7 8.2 7% NS
CEmONC = Comprehensive Emergency Obstetric and Newborn Care, EmONC = Emergency Obstetric and Newborn Care. 5. Definitions are from World Health Organization resources, including Monitoring Emergency Obstetric Care: A Handbook.6. Percentage change calculations are based on unrounded numbers.7. Asterisks indicate significance levels calculated with a z-statistic as follows: *** = P < .01, ** = P < .05, * = P < .1, NS = not significant.8. Baseline maternal deaths in facilities were cross-checked with maternal deaths identified by the 2012 community census. Endline maternal deaths in
facilities were cross-checked with community maternal deaths identified by community key informants.

29Maternal and Perinatal Health Outcomes
Conclusions The first year of the SMGL initiative (Phase 1) resulted in dramatic reductions in maternal deaths and improved maternal and perinatal health outcomes in SMGL-affiliated facilities in both Uganda and Zambia.
In both countries, important gains were reported in the following areas:
� Numbers and proportions of deliveries taking place in health facilities, including the proportion of births in EmONC facilities.
� Routine use of AMTSL at delivery in facilities.
� Met need for EmONC services for direct obstetric complications.
� C-section rates.
� Survival of mothers who were treated for direct obstetric complications (declines in CFRs).
� Maternal survival and reduced MMRs.
� Overall perinatal survival and reduced PMRs.
The magnitude of the change in these key usage and quality of care indicators, which in turn led to a significant reduction in maternal mortality, lead to the conclusion that the SMGL initiative was successful. The findings also demonstrate that
� Obstetric care in health facilities, particularly EmONC facilities, in Uganda and Zambia has improved.
� An increasing number of women with obstetric complications are seeking care in health facilities. Thus, the met need for EmONC is increasing.
� At the same time, the CFR from direct obstetric complications has decreased, contributing to substantial declines in MMRs in health facilities.
� Improvements in quality of care, as reflected by greater use of AMTSL and higher C-section rates, likely contributed to the decreased CFR and MMR.
The SMGL initiative also led to improvements in perinatal outcomes. The PMR decreased in both countries, suggesting improvements in the quality of obstetric care at delivery. This conclusion was further substantiated in Uganda, where the fresh stillbirth rate decreased by 27%.
Perinatal data for both Uganda and Zambia showed
� Decreases in overall rates of perinatal mortality.
� Decreases in total stillbirth mortality.
Another achievement was improved processes for identification, notification, and review of maternal deaths at the district level. This change helped local decision makers understand the underlying causes of these deaths so they can find ways to prevent them. By increasing awareness among health care providers and policy makers, this change could also lead to the development of maternal death surveillance and response systems.

30 Maternal and Perinatal Health Outcomes
References Averting Maternal Death and Disability Program. Needs Assessment of Emergency Obstetric and Newborn Care: Data Collection Modules. New York, NY: Averting Maternal Death and Disability Program, Columbia University; 2010. http://staging.amddprogram.org/content/resources-overview. Accessed March 12, 2014.
Immpact. Rapid ascertainment process for institutional deaths (RAPID). Module 4, Tool 2. In: Immpact Toolkit: A Guide and Tools for Maternal Mortality Program Assessment. Aberdeen, Scotland: University of Aberdeen; 2007.
Uganda Bureau of Statistics and ICF International Inc. Uganda Demographic and Health Survey 2011. Preliminary Report. Kampala, Uganda: Uganda Bureau of Statistics and Calverton, MD: ICF International Inc.; 2012.
World Health Organization. Appropriate technology for birth. Lancet. 1985;2:436-437.
World Health Organization. International Classification of Diseases, 10th Revision. Geneva, Switzerland: World Health Organization; 1992.
World Health Organization. Managing Complications in Pregnancy and Childbirth: A Guide for Midwives and Doctors. World Health Organization; Geneva, Switzerland; 2000.
World Health Organization. The WHO Application of ICD-10 to Deaths During Pregnancy, Childbirth and the Puerperium: ICD-MM. Geneva, Switzerland: World Health Organization; 2012.
World Health Organization, United Nations Population Fund, UNICEF, Averting Maternal Death and Disability Program. Monitoring Emergency Obstetric Care: A Handbook. Geneva, Switzerland: World Health Organization; 2009. http://www.who.int/reproductivehealth/publications/monitoring/9789241547734/en/index.html. Accessed March 12, 2014.

Appendix: Maternal and Perinatal Outcomes and
Indicators for All SMGL-Supported Facilities

32 Maternal and Perinatal Health Outcomes
Table A. Maternal and Perinatal Outcomes and Indicators for Health Facilities in SMGL-Supported Districts in Uganda, by Facility Type and Assessment Period (Baseline and Endline)
Facility Type
All Facilities (N = 128)
EmONC (N = 25)
CEmONC (N = 16)
BEmONC (N = 9)a
Non-EmONC (N = 103)a
Baseline Endline%
Change Baseline Endline%
Change Baseline Endline%
Change Baseline Endline%
Change Baseline Endline%
Change
OUTC
OMES
: Mat
erna
l
No. of Facility Deliveries1 34,460 57,781 21,310 28,100 18,700 21,731 2,610 6,369 13,150 29,681
No. of Direct Obstetric Complications 5,256 7,705 4,455 5,739 4,357 5,479 98 260 801 1,966
No. of Cesarean Sections 3,981 5,084
No. of Maternal Deaths from Direct Obstetric Causes
139 152 131 139 130 132 1 7 8 13
No. of Maternal Deaths from Indirect Obstetric Causes
40 43 39 34 37 33 2 1 1 9
No. of Maternal Deaths from All Causes 179 195 170 173 167 165 3 8 9 22
No. of Maternal Patients with AMTSL 7,913 18,418
OUTC
OMES
: Per
inat
al
No. of Total Births (Stillbirths and Live Births) Delivered
34,569 58,011 21,419 28,330 18,808 21,961 2,611 6,369 13,150 29,681
No. of Live Births 33,492 56,571 20,516 27,299 17,949 21,011 2,567 6,288 12,976 29,272
No. of Fresh Stillbirths 773 928 645 668 612 611 33 57 128 260
No. of Total Stillbirths (Macerated and Fresh)
1,077 1,440 903 1,031 859 950 44 81 174 409
No. of Predischarge Neonatal Deaths 283 458 210 334 181 306 29 28 73 124
INDI
CATO
RS: M
ater
nal
Proportion of All Births in All Facilities2 45.5% 73.8% 62% 28.2% 35.9% 28%
Population Met Need for EmONC3 46.3% 65.6% 42% 39.2% 48.9% 25%
Population Cesarean Section Rate4 5.3% 6.5% 23%
Direct Obstetric Case Fatality Rate5 2.6% 2.0% -25% 2.9% 2.4% -18% 3.0% 2.4% -19% 1.0% 2.7% 164% 1.0% 0.7% -34%
Maternal Mortality Ratio (per 100,000 Live Births) from All Causes6 534.4 344.7 -35% 828.6 633.7 -24% 930.4 785.3 -16% 116.9 127.2 9% 69.4 75.2 8%
AMTSL7 42.3% 84.8% 100%
INDI
CATO
RS: P
erin
atal Perinatal Mortality Rate
(per 1,000 Births)8 39.3 32.7 -17% 52.0 48.2 -7% 55.3 57.2 3% 28.0 17.1 -39% 18.8 18.0 -4%
Fresh Stillbirth Rate (per 1,000 Births)922.4 16.0 -28% 30.1 23.6 -22% 32.5 27.8 -14% 12.6 8.9 -29% 9.7 8.8 -10%
Total Stillbirth Rate (per 1,000 Births)1031.2 24.8 -20% 42.2 36.4 -14% 45.7 43.3 -5% 16.9 12.7 -25% 13.2 13.8 4%
Predischarge Neonatal Mortality Rate (per 1,000 Live Births)11 8.4 8.1 -4% 10.2 12.2 20% 10.1 14.6 44% 11.3 4.5 -61% 5.6 4.2 -25%
Note: Table footnotes are continued on next page.
SMGL = Saving Mothers, Giving Life; AMTSL = Active Management of the Third Stage of Labor; EmONC = Emergency Obstetric and Newborn Care; CEmONC = Comprehensive Emergency Obstetric and Newborn Care; BEmONC = Basic Emergency Obstetric and Newborn Care.

33Maternal and Perinatal Health Outcomes
Adjustmenta Indicator data for these facilities should be interpreted with caution because they were calculated with low numerator counts.
Definitions1. The number of women who delivered in health facilities. “All Facilities” includes both EmONC and non-EmONC facilities. “EmONC facilities” includes both
BEmONC and CEmONC facilities.
2. The number of women who delivered in health facilities divided by the expected number of live births in a specific area, regardless of where the delivery occurred, during the same time period; expressed as a percentage.
3. The number of women who delivered in health facilities and were treated for direct obstetric complications divided by the expected number of women with direct obstetric complications or 15% of expected live births in a specific area during the same time period; expressed as a percentage.
4. The number of Cesarean sections performed in health facilities for any reason divided by the expected number of live births in that area during the same time period; expressed as a percentage.
5. The number of women in health facilities who died of direct obstetric complications divided by the number of women with direct obstetric complications who were treated or diagnosed in the same facilities during the same time period; expressed as a percentage.
6. The number of maternal deaths (direct, indirect, or all causes) in health facilities divided by the number of all live births in the same facilities during the same time period; expressed per 100,000 live births.
7. The number of women in health facilities who received Active Management of the Third Stage of Labor (AMTSL) divided by the number of women who delivered in the same facilities during the same time period; expressed as a percentage.
8. The number of stillbirths and predischarge neonatal deaths in health facilities divided by the number of total births in the same facilities during the same time period; expressed per 1,000 births.
9. The number of fresh stillbirths in health facilities divided by the number of total births in the same facilities during the same time period; expressed per 1,000 births.
10. The number of stillbirths in health facilities divided by the number of total births in the same facilities during the same time period; expressed per 1,000 births.
11. The number of predischarge neonatal deaths in health facilities divided by the number of total live births in the same facilities during the same time period; expressed per 1,000 live births.
12. The number of live births in health facilities weighing <2,500 grams divided by the number of total live births in the same facilities during the same time period; expressed as a percentage.

34 Maternal and Perinatal Health Outcomes
Table B. Maternal and Perinatal Outcomes and Indicators for Health Facilities in SMGL-Supported Districts in Zambia, by Facility Type and Assessment Period (Baseline and Endline)
Facility Type
All Facilities (N = 120)
EmONC (N = 11)
Non-EmONC (N = 120)
Baseline Endline % Change Baseline Endline % Change Baseline Endline % Change
OUTC
OMES
: Mat
erna
l
No. of Facility Deliveriesa,1 22,604 31,398 9,372 11,308 13,232 20,090
No. of Direct Obstetric Complications 1,844 2,499 1,398 1,781 446 718
No. of Cesarean Sections 973 1,158
No. of Maternal Deaths from Direct Obstetric Causesb 56 51 47 40 9 11
No. of Maternal Deaths from Indirect Obstetric Causes 12 11 9 9 3 2
No. of Maternal Deaths from All Causes 68 62 56 49 12 13
OUTC
OMES
: Per
inat
al No. of Total Births (Stillbirths and Live Births)a 22,604 31,398 9,372 11,308 13,232 20,090
No. of Live Birthsc 21,915 30,619 8,897 10,815 13,018 19,804
No. of Total Stillbirths (Macerated and Fresh) 689 779 475 493 214 286
No. of Predischarge Neonatal Deathsd 168 251 143 184 26 67
INDI
CATO
RS: M
ater
nal
Proportion of All Births in All Facilities2 62.6% 84.3% 35% 26.0% 30.3% 17% 36.7% 53.9% 47%
Population Met Need for EmONC3 34.1% 44.7% 31% 25.8% 31.9% 23% 8.2% 12.8% 56%
Population Cesarean Section Rate4 2.7% 3.1% 15%
Direct Obstetric Case Fatality Rate5 3.1% 2.0% -34% 3.4% 2.2% -35% 2.0% 1.5% -24%
Maternal Mortality Ratio (per 100,000 Live Births)6 310.3 202.5 -35% 629.4 453.1 -28% 92.2 65.6 -29%
INDI
CATO
RS: P
erin
atal
Perinatal Mortality Rate (per 1,000 Births)8 37.9 32.8 -14% 65.9 59.9 -9% 18.1 17.6 -3%
Total Stillbirth Rate (Per 1,000 Births)10 30.5 24.8 -19% 50.7 43.6 -14% 16.2 14.2 -12%
Predischarge Neonatal Mortality Rate (per 1,000 Live Births)11 7.7 8.2 7% 16.0 17.0 6% 2.0 3.4 73%
Note: Table footnotes are continued on next page.
SMGL = Saving Mothers, Giving Life; AMTSL = Active Management of the Third Stage of Labor; EmONC = Emergency Obstetric and Newborn Care.

35Maternal and Perinatal Health Outcomes
Adjustments a When data for “Facility Deliveries” were missing for a specific district, data for “Total Births” were used as a proxy and vice versa.b The World Health Organization (2012) lists direct causes of maternal death as hemorrhage, hypertensive diseases, abortion, sepsis or infections, obstructed
labor, ectopic pregnancy, embolism, and anesthesia-related death. Not all causes were captured consistently by the four SMGL-supported districts.c When data for “Live Births” (and commonly “Total Births”) were missing for a specific district, data for “Stillbirths” were subtracted from “Total Deliveries” and
used as a proxy.d Use these data with caution. Predischarge neonatal status is commonly correlated with the very early neonatal period, but early or late neonatal deaths may
also be included. Standards for neonatal death reporting differed by district. Data were aggregated from routine data-collection systems used by three SMGL partners.
Definitions13. The number of women who delivered in health facilities. “All Facilities” includes both EmONC and non-EmONC facilities. “EmONC facilities” includes both
BEmONC and CEmONC facilities.
14. The number of women who delivered in health facilities divided by the expected number of live births in a specific area, regardless of where the delivery occurred, during the same time period; expressed as a percentage.
15. The number of women who delivered in health facilities and were treated for direct obstetric complications divided by the expected number of women with direct obstetric complications or 15% of expected live births in a specific area during the same time period; expressed as a percentage.
16. The number of Cesarean sections performed in health facilities for any reason divided by the expected number of live births in that area during the same time period; expressed as a percentage.
17. The number of women in health facilities who died of direct obstetric complications divided by the number of women with direct obstetric complications who were treated or diagnosed in the same facilities during the same time period; expressed as a percentage.
18. The number of maternal deaths (direct, indirect, or all causes) in health facilities divided by the number of all live births in the same facilities during the same time period; expressed per 100,000 live births.
19. The number of women in health facilities who received Active Management of the Third Stage of Labor (AMTSL) divided by the number of women who delivered in the same facilities during the same time period; expressed as a percentage.
20. The number of stillbirths and predischarge neonatal deaths in health facilities divided by the number of total births in the same facilities during the same time period; expressed per 1,000 births.
21. The number of fresh stillbirths in health facilities divided by the number of total births in the same facilities during the same time period; expressed per 1,000 births.
22. The number of stillbirths in health facilities divided by the number of total births in the same facilities during the same time period; per 1,000 births.
23. The number of predischarge neonatal deaths in health facilities divided by the number of total live births in the same facilities during the same time period; expressed per 1,000 live births.
24. The number of live births in health facilities weighing <2,500 grams divided by the number of total live births in the same facilities during the same time period; expressed as a percentage.

Notes:


For more information please contact:Centers for Disease Control and Prevention
Division of Reproductive Health, Mailstop F-741600 Clifton Road NE, Atlanta, GA 30329-4027
Telephone: 1-800-CDC-INFO (232-4636) / TTY: 1-888-232-6348E-mail: [email protected]
Web: http://www.cdc.gov
Photographs by Riccardo Gangale, 2013


![Maternal and Perinatal Death Surveillance and Response [MPDSR]](https://static.fdocuments.in/doc/165x107/61d8730052e6b73bbd1853b3/maternal-and-perinatal-death-surveillance-and-response-mpdsr.jpg)


