APM 09 Financing Transit Usage with Podcars in 59 Swedish
47
1 Paper to presented at 12 th International Conference on Automated People Movers, Atlanta, 31 May – 3 June, 2009 Financing Transit Usage with Podcars in 59 Swedish Cities Göran Tegnér 1 , WSP Group Sweden AB Abstract The main question that will be addressed and answered by this paper is how a doubled transit ridership by podcars could be financed? This paper summarizes a Swedish research project financed by Vinnova, the Swedish Agency for Innovations and by the Swedish Road and Rail Administrations. It deals with several analytical comparisons between bus, LRT and podcars, based on a city data base with 59 Swedish cities, and four more in-depth case studies, the cities of Kiruna, Södertälje, Linköping and the Commercial Area of Kungens Kurva in Stockholm and Huddinge cities. The comparisons comprise the following aspects: 1. Generalized travel times for the bus and the podcar modes for 59 cities 2. Market shares and total transit ridership with bus and podcars for 59 cities 3. Financial costs (investment, operational & maintenance costs) and ticket revenues with bus and podcars for 59 cities 4. Various financial solutions will be discussed. Calculations for the case study cities for podcars will be presented with the (Public Private Partnership) solution. The analyses show that it would be possible to double the transit ridership in cities with bus or LRT traffic when shifting to podcars. The cost per trip is showed to be lower by podcar than with LRT and - in some cases - than with bus. 1 Göran Tegnér, M Pol. Sc., WSP Group, Arenavägen 7, SE-121 88 Stockholm-Globen, Sweden. Phone:+46-8-688 76 77; Fax: +46-8-688 77 32; E-mail: [email protected]
Transcript of APM 09 Financing Transit Usage with Podcars in 59 Swedish

1
Paper to presented at 12th International Conference on Automated People Movers, Atlanta, 31 May – 3 June, 2009
Financing Transit Usage with Podcars in 59 Swedish Cities
Göran Tegnér1, WSP Group Sweden AB
Abstract
The main question that will be addressed and answered by this paper is how a doubled transit ridership by podcars could be financed? This paper summarizes a Swedish research project financed by Vinnova, the Swedish Agency for Innovations and by the Swedish Road and Rail Administrations. It deals with several analytical comparisons between bus, LRT and podcars, based on a city data base with 59 Swedish cities, and four more in-depth case studies, the cities of Kiruna, Södertälje, Linköping and the Commercial Area of Kungens Kurva in Stockholm and Huddinge cities. The comparisons comprise the following aspects:
1. Generalized travel times for the bus and the podcar modes for 59 cities 2. Market shares and total transit ridership with bus and podcars for 59 cities 3. Financial costs (investment, operational & maintenance costs) and ticket
revenues with bus and podcars for 59 cities 4. Various financial solutions will be discussed. Calculations for the case study
cities for podcars will be presented with the (Public Private Partnership) solution.
The analyses show that it would be possible to double the transit ridership in cities with bus or LRT traffic when shifting to podcars. The cost per trip is showed to be lower by podcar than with LRT and - in some cases - than with bus.
1 Göran Tegnér, M Pol. Sc., WSP Group, Arenavägen 7, SE-121 88 Stockholm-Globen, Sweden. Phone:+46-8-688 76 77; Fax: +46-8-688 77 32; E-mail: [email protected]
2
1 Transit Market Shares – Goals and Reality 1.1 Swedish goals - double transit share The public transport mode share is one of the key indicators used in transit planning but also at the political level, when setting goals for transit investments and operations. In many cities and regions in Sweden the political goal is formulated to double the transit mode share, with the main reason to reduce greenhouse gases from the car traffic. 1.2 Swedish transit mode share Swedish transit mode shares is usually and officially measured in terms of the number of trips by the car, the transit and by the walk and bicycle modes. However, as trip distances vary across these modes, a better measure would be in terms of passenger-kilometers. On average, the transit mode share is 10 % in all Sweden. In the metropolitan Stockholm is has dropped from 22 % in 1999 to 20 % in 2006. In the rest of the other 59 largest cities it is around 16 %. Figure 1. Transit market shares in Sweden 1999-2007
Transit market share in passenger-kilometers of car plus transit modes in all Sweden 1999-2007
9,2% 9,2% 9,3% 9,6% 9,9% 9,9% 10,3% 10,4% 10,6%
0%
10%
20%
30%
40%
50%
60%
70%
80%
90%
100%
1999 2000 2001 2002 2003 2004 2005 2006 2007
In spite of an impressive extension of transit supply (in terms of vehicle-kilometers) during the latest 20 years, transit ridership per inhabitant has dropped by 1 %, while transit supply has increased by 13 %. At the same time car ownership has increased by 26 %, see Figure 2 below: Figure 2. Development of car and transit trips 1985-2007 in Sweden

3
Development of car and transit trips 1985-2007 in Sweden
-1%
13%
26%
-5% 0% 5% 10% 15% 20% 25% 30%
Trips/inhabitant
Veh.kms/inhabitant
Cars/1000 inhabitant
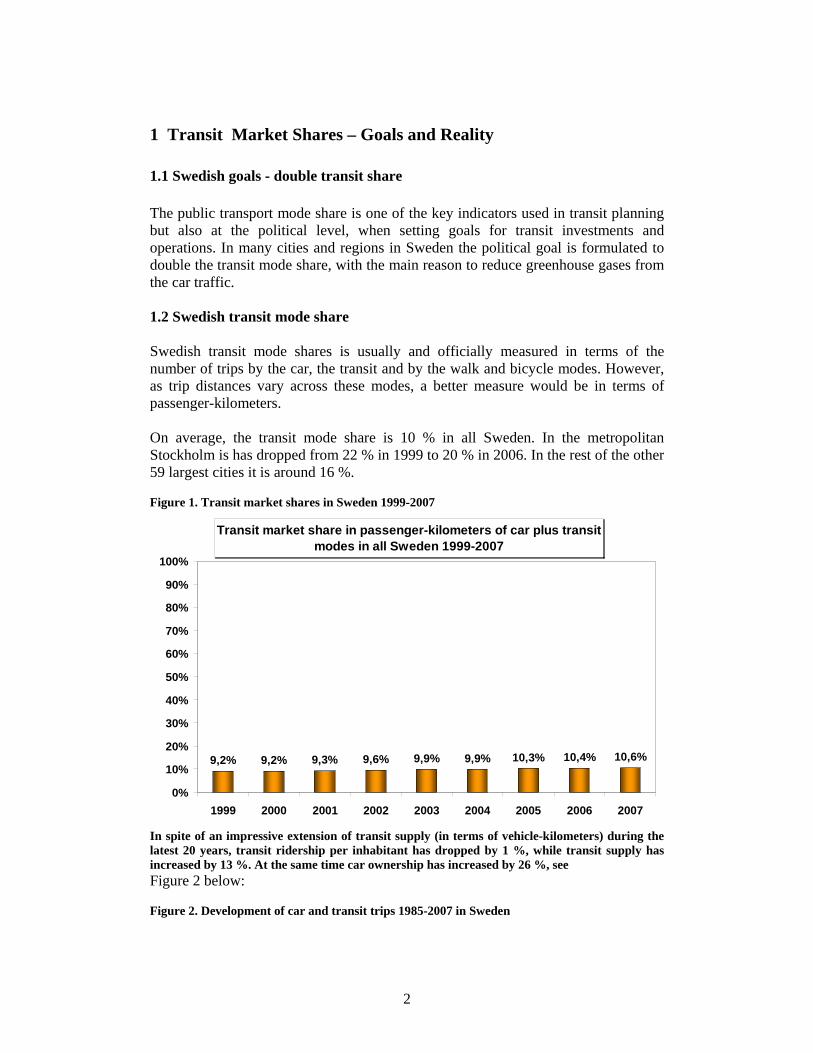
1.3 International transit mode shares From the UITP Millenium 52 cities data base the figure below is derived. It plots the transit market share against the city density (in terms of population plus employment. Hong Kong and Singapore are outstanding in both high density and high transit market shares, well above 40 %. Also four eastern European cities, Moscow, Warsaw, Prague, and Budapest show higher market shares than 40 %. Of all other 46 cities, only Vienna shows a higher market share than 30 %.
4
Figure 3. Transit market shares in 52 cities as a function of city density (jobs and inhabitants)
Public transport market share vs. Pop+job densities
Publ trp market share = 1,1478*(pop+job)Density0,6299
R2 = 0,2936
05
10152025303540455055
0 50 100 150 200 250 300 350 400 450Pop+job density
Publ
.trp.
mar
ket s
hare
Hong Kong
Moscow
Singapore
Warzaw
Budapest & Prague
Vienna
Stockholm
Most western European cities are not that densely populated, and partly due to this fact, also show rather low transit market shares. Stockholm, in an international comparison, has a low transit market share, also being rather sparsely populated. 1.4 A better transit system is needed In Sweden, transit supply has increased both absolutely and per inhabitant, while, at the same time, transit demand has stagnated absolutely and dropped per inhabitant. My conclusion is that the transit industry faces some fundamental problems as regards Transit supply has increased both absolutely and per inhabitant, while, at the same time, transit demand has stagnated absolutely and dropped per inhabitant. My conclusion is that the transit industry faces some fundamental problems with and its service attractiveness. A better transit system will be needed if the goal to double the transit mode share should be achieved. 1.5 Meta-analysis of modal split with podcars: 15 %-units higher than with bus A common experience from many urban podcar studies, in which travel demand models have been applied, is that bringing podcars to the customers in the cities, would affect the modal split in favour of more public transport trips in a substantial way.

5
Figure 4 summarizes 10 cases with the modal split without podcar networks as compared to a forecasted situation with podcar networks:

6
Figure 4. Public Transport Modal split without and with PRT (Podcars). Results from British and Swedish Case studies in which travel demand models have been adopted
Transit mode share with Podcars - as a function of mode share without Podcars (relationship based on 10 case studies with demand models)
0,09
0,193
0,22
0,33
0,25
0,19
0,32
0,34
0,52
0,75
0,04
0,04
0,055
0,18
0,19
0,46
0,63
8%
1,4%
1%
0 0,1 0,2 0,3 0,4 0,5 0,6 0,7 0,8
Cardiff Bay
Corby New Town, 2027
Daventry-1 (comf. Value as bus)
Daventry-2 (comf. value as car)
Skärholmen-Kungens Kurva, 2002
Södertälje Town, 2008
Skärholmen-Kungens Kurva, 2020
Central Gothenburg, other trips
Stockholm Metropolitan area, 2010
Central Gothenburg, work trips
with Podcarswithout Podcars
The result is also presented in Table 1 below: Table 1. Public transport Modal split without and with PRT (podcars). Results from British and Swedish Case studies in which travel demand models have been adopted: Marked asssessment Public Transport Public Transport Higher modal splitbased on demand models Modal split Modal split By PRTof PRT ridership without Podcars with Podcars number of timesCardiff Bay 1% 9% 9,0Corby New Town, 2027 1,4% 19,3% 14Daventry-1 (comf. Value as bus) 4% 22% 5,5Daventry-2 (comf. value as car) 4% 33% 8,3Skärholmen-Kungens Kurva, 2002 5,5% 25% 4,5Södertälje Town, 2008 8,0% 19% 2,4Skärholmen-Kungens Kurva, 2020 18% 32% 1,8Central Gothenburg, other trips 19% 34% 1,8Stockholm Metropolitan area, 2010 46% 52% 1,1Central Gothenburg, work trips 63% 75% 1,2
As can be seen (also from Figure 5 below) the augmentation in modal split is substantial. On average it might increase by 15 percentage units, when podcars will be introduced. The improvement in the modals split is higher when the modal split is lower without podcar networks. This relationship between the transit mode share without and with podcars can also be illustrated by the figure 2 below:

7
Figure 2. Relationship between transit mode share without and with podcar networks in 10 case studies, in which travel demand models have been used
Transit mode share with Podcars - as a function of mode share without Podcars (relationship based on 10 case studies with demand models)
0%
10%
20%
30%
40%
50%
60%
70%
80%
0% 10% 20% 30% 40% 50% 60% 70% 80%Modal split WITHOUT Podcars
Mod
al s
plit
WIT
H P
odca
rs
Modal split with Podcars =0.86* Modal split without Podcars
+ 17,5 %R2 = 0,91
Skärholmen-Kungens kurva 2010
Central GothenburgStockholm 2010
Central Gothenburg;work trips
SödertäljeCardiff Bay
Daventry
Corby New Town
To our knowledge, very few other urban public transport projects yield the same magnitude in increasing the public transport modal split as podcars tend to do. 2 The Swedish 59 Cities Data Base A Swedish Company, Stadsbuss & Qompany, has collected bench-marking data from some 60 Swedish city transit companies. For the year 2006 the following variables were reported:
1. Line length 2. Vehicle-kilometers 3. Annual trips (boardings) 4. Annual costs 5. Annual ticket revenues 6. Subsidies 7. Population 8. Population density
The data base was completed by us at WSP with the following variables:
9. City area 10. Street length 11. Annual operating costs for the street network

8
This data base allows us also to calculate: 12. Transit network density (i.e. line length per street length) 13. Population density 14. Frequency of transit service (vehicle-kilometers per line-kilometers,
assuming 18 hours transit service) 15. Average walking distance to stops (by combining line length and city area
data) The average bus speed has been assumed to be 24 km/hour (data from the transit industry), which yields the bus travel time, once the average trip length is known. Trip length and market share data was obtained from the national travel survey data for the various cities. 3 Podcar networks in 59 cities To be ale to compare today’s bus network (and partly, in Göteborg and Norrköping, tramway network) with a podcar network, a “synthetic” podcar network has been suggested, designed as a grid network with 250 meters walking distance in the origin and in the destination area, respectively. The size of the podcar network depends on the city size and population density, see Figure 6 below: Figure 6. A structure of a podcar track system
The present bus network is very dense, with an average walk time of 4 minutes, but with very low service frequency – over the day with an average waiting time of 18 minutes. The podcar network provides very short waiting times, between 0 and 1 minute for the vast majority of riders, but the average walking time will be 6 minutes (3 minutes at each of the origin and destination station).

9
Figure 7. Network length of the bus and the podcar networks in 59 Swedish cities
Length of bus and podcar networks in 59 swedish cities
0
200
400
600
800
1 000
1 200
1 400
Götebo
rg
Jönk
öping
Örebro
UmeåGäv
le
Karlsta
d
Halmsta
d
Mölnda
l
Kristia
nstad
Motala
Karlsk
oga
Piteå
Alings
ås
Boden
Oskars
hamn
Hässle
holm
Ystad
Gälliva
re
Sträng
näs
Stenun
gsun
d
Podcar track lengthBus line length
Bus line and podcar track-kilometers
The average network size will be 80 km for the podcar network, compared to 144 km for the bus network in the 59 cities. The total bus network length is 8,162 km and the total podcar network is 2,835 km long. 4 Generalized Time and the Demand for Podcars To calculate the future demand for podcars in 59 Swedish cities, we need first to calculate the generalized time and cost. This was done for each of the 59 cities with the database described above for the bus/tram mode. For podcars the following assumptions were made:
• Walk speed: 5 km/hour • Wait time: 0,5 minutes • In-vehicle speed: 40 km/hour • Number of transfers: 0 within the city-wide system • Podcar fare: the same as for bus/tram, i.e. 0,78 €
per boarding on average In calendar time the total door-to-door travel time is 32-33 minutes by bus or tram, but would be 11-12 minutes by podcar, which is one third of the bus/tram travel time. The generalized time will be 44 minutes by bus/tram and 18 minutes by podcar, i.e. less than half the travel time. These figures are averages for the 59 Swedish cities, see

10
Table 2 below:

11
Table 2. Travel time component comparison between bus/tram and podcar. Averages for 59 Swedish cities Minutes of travel timecomponents Bus/tram PodcarWalk time 4 6Wait time 18 0,5Transfer time 2,5 -In-vehicle time 8 5Total calendar time 32,5 11,5Generalized time 44 18 The generalized time for the bus/tram and the podcar modes is shown in Figure 9 below: Figure 8. Generalized travel time with bus/tram and podcar in 59 Swedish cities
Generalized travel time with bus/tram and with podcars in 59 Swedish cities
0
15
30
45
60
75
90
105
120
Göteborg
Uppsala
Västerås
Örebro
Norrköpin
gLund
Gävle
Troll
hätta
n+Vän
ersbor
g
Borås
Halmsta
d
Kalmar
Skövd
e
Kristia
nstad
Uddevall
a
Örnskö
ldsvik
Karlsk
oga
Trell
ebor
g
Lidkö
ping
Alingså
s
Katrineh
olm
Västervi
k
Oskarsha
mn
Härnösa
nd
Köping
Ystad
Falköp
ing
Mariesta
d
Strängnäs Sala
Fage
rsta
Bus/tramPodcar
Weighted travel time in minutes per single trip
Average: Bus/tram: 44 minutesPodcar: 18 minutes
As can be seen, the variation in (weighted) travel time between cities would drop from a range of 25-120 minutes to a range of 15-29 minutes. A simplified demand model, called ELMA, has been used to derive the new demand for transit trips by podcars. The model is an elasticity model, with variable elasticities (such as the logit model). The model is based on the generalized cost (thus including not only the above mentioned travel time components, but also the fare), and also the original market share for transit. In most demand model applications, the podcar mode is treated as a public transport mode, with “a mode specific constant term” that resembles the negative mode specific perception of the bus mode. As most stated preference studies and the pilot

12
tests in Cardiff Bay with the ULTra system clearly has shown, the podcar travelers regard the comfort and convenience in riding the podcar is much more like going by taxi. Therefore we have tested to treat the podcar journey as something in between going by bus and going by the private car. This has been achieved by inserting “a half car mode specific constant” into the demand model. In Daventry, a similar approach has been carried out, shown in Table 3 below: Table 3. Car, transit trips and modes shares in Daventry, UK, at varios PRT penalties Option Highway trips PT Trips Highway mode share (%) PT Modes share (%)Base 2004 3 617 157 96% 4%DDC Preferred Bus option 2021 8 023 911 90% 10%PRT – modal penalty as car 6 354 3 110 67% 33%PRT – modal penalty as bus 7 214 1 978 78% 22%PRT – modal penalty as car £1.60 fare 7 186 2 014 78% 22%
Source: Daventry Development Transport Study. Draft Stage 1B and 2 Report. Daventry District Council; November 2006, By Malcolm Buchanan, Colin Buchanan.
The Daventry study shows that using the “car constant” instead of the “bus constant” increases the share of PRT trips from 22 % to 33 % or by 50 percent. Our similar tests refer to the City of Linköping, where bus traffic has a market share of 12 %. The walk and bike modes make up 40 % and car traffic 48 %. With a podcar network for the city of Linköping, the transit market share would double to 23 %, assuming a bus constant. With a “half car constant” it would augment up to 28 % and up to 41 % if we apply “a full car constant”. According to the Kungens Kurva site assessment study of the EDICT project, a podcar system would generate some 17 % new transit trips, besides from the diversion from previous trips made by car and walk/bike. Both options as regards the choice of constant terms are presented below in terms of transit market shares for the bus/tram mode, and the podcar mode: Figure 9. Transit market shares in 59 Swedish cities with bus/tram and with podcars

13
Transit market shares in 59 Swedish cities by bus/tram and by podcar - two alernatives according to "bus and car constants"
0%
10%
20%
30%
40%
50%
60%
Göteborg
Uppsala
Väster
ås
Örebro
Norrköping Lu
nd
Gävle
Troll
hättan
+Vän
ersborg
Borås
Halmsta
d
Kalmar
Skövd
e
Kristia
nstad
Uddevall
a
Örnsk
öldsvik
Karlsk
oga
Trell
ebor
g
Lidköping
Alingså
s
Katrine
holm
Väster
vik
Oskars
hamn
Härnösan
d
Köping
Ystad
Falköpin
g
Maries
tad
Strängnäs Sala
Fagerst
a
Podcar: bus constantPodcar: ½ car constantBus/tram
On average over the 59 cities the market share might double from 17 %, with the present day bus/tram networks up to 32 % transit trips by podcar (high estimate), or to 23 % (low estimate), see Figure 10 below: Figure 10. Average transit market shares in 59 Swedish cities with bus/tram and with podcars at various assumptions
Transit market shares without and with podcars - average for 59 Swedish cities
17%
23%
32%
0%
5%
10%
15%
20%
25%
30%
35%
bus network Podcar: bus constant Podcar: ½ car constant
5 Cost and Revenue Comparisons between Bus, LRT and Podcars
14
In a previous paper, the costs per trip for bus, LRT, PRT, metro and commuter rail were presented (see: “PRT Costs Compared to Bus, LRT and Heavy Rail –Some Recent Findings”2). In this project a different approach was taken. The starting point has been the actual annual costs for the existing bus network in the 59 cities (in Göteborg and in Norrköping, part of the transit network is provided by tramway). Then these costs have been compared with the costs for a 100 % percent tramway network in the 10 biggest cities and for a 100 % podcar network in all 59 cities. For the 10 biggest cities, we can, therefore, compare bus, LRT and Podcar networks, and - for all 59 cities, we can compare the bus and Podcar costs. 5.1 Bus costs Traditionally, bus costs include capital costs for the vehicle, and operating and maintenance costs (vehicle-hour and vehicle-kilometer costs). But very seldom the road/street infrastructure cost will be included, unless we speak about BRT, Bus Rapid Transit or dedicated bus only lanes. Assume a new car free city (such as Masdar City in Abu Dhabi). Then, if one wants to introduce a bus network, all the street infrastructure costs should be accrued to the bus cost. We have calculated the replacement costs for all city streets in the 59 Swedish cities, and then calculated the annual installment costs for this. For the 59 cities with 163,420 km of street length this replacement cost amounts 634 billion €. The corresponding annual installment cost would be 32 billion €. But what would the fair share for the bus network be? A starting point could be the bus share in terms of the number of line-kilometers per street-kilometer in the city. This amount is - on average for the 59 cities - about 5 %, with a variation of 1.3 % and 12.7 % between smaller and bigger cities. But the share of vehicle-kilometers differs, with only 0.7 % bus-kilometers of the total bus plus car-kilometers. Finally we have considered buses as corresponding to 3 to 3.5 vehicle-equivalents as big as the private car. Therefore, our suggestion is to accrue a share of 2.5 % of the annual total street costs (both investment and operating street costs) as a fair share for the bus network. The official annual Swedish cost for the bus network amounts to 428 million €. (with 3,835 line-kilometers) in the 59 cities An estimate from bus operators’ show that some 89 % of these costs are operating costs and only 11 % is capital costs for the vehicles. Adding the infrastructure cost for the road network (with the transit share of 2.5 %) adds another 229 million € to the total bus cost, thus amounting 726 million €. We have also considered the infrastructure costs for the bus network in terms of bus stops, bus terminals and bus depots. These bus infra costs adds another 69 million € per annum, which corresponds to 14 % of the total annual official bus costs of 428 million €. Even when we include the more un-traditional street infrastructure costs
2 Paper presented at the AATS European Conference in Bologna 7-8 Nov, 2005: ”Advanced automated transit system designed to out-perform the car”, by Göran Tegnér, TRANSEK Consultants

15
for the bus system, these bus stop, bus terminal and bus depot costs add another 9 % to the total annual costs of 726 million €. Per trip these costs can be compared to the ticket revenue and the corresponding subsidy rates: Table 4. Bus cost, ticket revenue and subsidy in € per trip
Bus cost alternative Cost in €/trip Ticket price in €/trip Subsidy in €/trip Subsidy rateOfficial € 1,46 € 0,78 € 0,68 47%Incl stops, term's, depots € 1,70 € 0,78 € 0,92 54%Incl. also street costs € 2,48 € 0,78 € 1,70 69%(bus share of cap.& Oper costs) Therefore, the official subsidy rate of 47 % can be regarded as low, when we also include the full infrastructure costs for the bus system. With all such infrastgructure costs the subsidy rate is estimated to be 69 %, and the corresponding cost to be 2.48 € per trip for bus.

16
5.2 Light Rail Transit costs varies substantially In the HiTrans-report3 an international comparison of 37 Light Rail Transit (LRT) projects has been made. The LRT cost per double-track (all infrastructure costs included) vary between 6 and 101 million €, and with an average of 23 m€ per track-km. This is indeed a substantial variation in the unit costs. Figure 11. Light Rail Transit (LRT) cost per track-kilometer in m€
LRT Cost per track- km, m€
0 10 20 30 40 50 60 70 80 90 100 110
Karlsruhe-Bretten TramTrain
Saarbrücken
Manchester phase 1
Sacramento Initial Line
Amsterdam ring line
Croydon
Bursa
Baltimore Central Line
Midland Metro
Salt Lake City
S:t Louis Metrolink
Barcelona
Stockholm
Caen (guided light transit)
Sheffield
Orleans
Dallas, S&W Oak Cliff
San Diego Orange Line
Lyon
Portland Barnsfield Route
Adana
Nantes line 3
Bordeaux
Nottingham
Strasbourg, routes B och C
Montpellier
Manila LRT (light metro)
Los Angeles Green Line
Los Angeles Blue Line
San Diego Blue Line
Strasbourg, routes A och D
Manchester phase 2
Kuala Lumpar
Izmir
Rouen
Hudson-Bergen
Buffalo
Average cost for LRT: 23 m€/km
Source: HiTrans Best Practice Guide: Public transpoprt - Mode options and Technical Solutions, Intereg North Sea
3 HiTrans Best Practice Guide: Public Transport – Mode options and technical Solutions.

17
The tangential LRT line built in Stockholm around year 2000 had a cost of 21 million € per double track-kilometer, while extensions of existing tramway lines in Göteborg and in Norrköping are much cheaper, with costs around 3 to 5 million € per double track-kilometer. Newly planned LRT lines in Northern Stockholm now show cost estimates in the range from 13 -76 million € per double track-kilometer. Since 1994, building cost index has increased by 46 % in Sweden. Thus, it is a substantial variation in unit costs for LRT. 5.3 Podcar costs lower than LRT costs Also the unit cost for podcar network per track-kilometer varies between different studies by various suppliers. A natural starting point is to refer to ATRA’s Status Report from 20024. In a summary table they summarized the unit costs as follows: Table 5. Podcar (PRT) cost components, according to ATRA in US 2002 k$
Component Unit Cost Number Total (k$) Guideway – straight 2,300 k$/km 8 18,400 Guideway – curved 3,400 k$/km 2 6,800 Vehicle 38 k$ each 100 3,800 Stations @ 2/km 250 k$ each 20 5,000 TOTAL 34,000
In US 2002 $, the costs were estimated to amount 34 m$ for a 10 kilometer long podcar system (single track). I have collected information from 18 various sources regarding investment cost estimates for Podcar systems. They do by no means reflect all possible PRT systems costs that might be available after a much deeper research, but only what has been known to the author. The cost estimates have been adjusted to the 2007 year price level, with the following results:
4 ”Personal automated Transport – Status and Potential of Personal Transit – Technology Evaluation, By Advanced transit Association (ATRA), September 2002
18
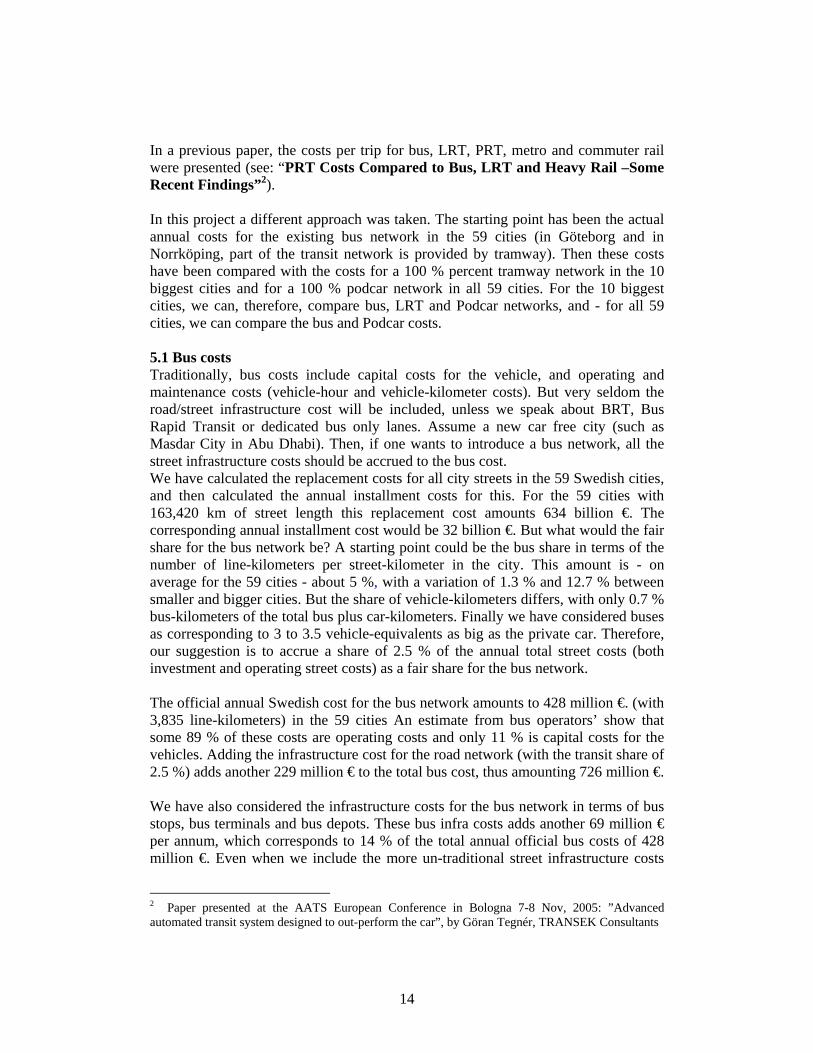
Figure 12. Investment costs for podcars (PRT) per track-km from 18 studies 1998 -2 008
Investment cost for PRT per track-km:18 different studies during 1998-2008
Costs re-calculated to perice level 2007
0
2
4
6
8
10
12
Taxi20
00, 1
998
SkyCab
, Kist
a, 19
98, m
v
FlyWay
, Kist
a, 19
98, a
verag
e
SkyCab
, Linkö
ping, 199
9
Taxi20
00
ATRA, 200
2
Ultra,
Cardiff,
2003
Ultra (
Edict), 2
003
Austran
s (9 p
ass.)
, 200
3
Corby N
ew Town, 2
003
Daven
try , 2
006
ULTra, lo
w 2006
ULTra, av
erage 2
006
ULTra, high 20
06
Skyweb
Expres
s, 20
06, lo
w
Skyweb
Expres
s, 20
06, a
verag
e
Skyweb
Expres
s, 20
06, h
igh
ULTra, H
eathro
w, dec
2007
m€ per singel track-kilometer
Average: 6.1 m€std.dev. 2.4 m€
As can be seen, there is a substantial variation in Podcar cost. The costs vary between 2.1 and 10.6 m€ per track-kilometer. The average is 6.1 m$, and the standard devia-tion is 2.4 €/km. as the observations area arranged along a time scale, one can calcu-late if there is a time trend in costs. There is such a tendency, with an annual increase of 0.24 m€/km and year. In a study by Booz Allen Hamilton for New Jersey in the US, Paul Hoffman argues for much higher PRT costs, in the range 6.5 m€ to 21.8 m€ per track-km. His lowest estimate corresponds well with my own findings. However, his higher estimates refer to large scale systems in dense and complex large cities, such as New York. The ULTra Heathrow podcar system, with 4 km, 5 stations and 18 vehicles, is estimated to cost 25 m£, or 8.5 m€ per track-kilometer5.
5 In a recent study: ”The Viability of Personal Rapid Transit in Virginia: Update” Virginia, 18th Dec. 2008 , the ULTRa cost is lowered to 20 m£, or to 6 m€ per track-kilometer

19
ULTra Picture Vectus, with its Podcar test track in Uppsala, Sweden, has recently confirmed that it is a tricky task to give accurate and general costs estimates, But, for 10-20 kilometer long Podcar network an estimate between 7.5 m€ to 10 m€ might be realistic. This cost level corresponds well with the ULTra cost for the Heathrow installation.
Vectus picture

20
5.4 Three cost estimates for Bus, Podcar and LRT As costs vary substantially both in Sweden, and on the international scene, we have decided to present three cost estimates, one low, one high and one average cost estimate for both LRT and for Podcars. The cost estimates have been chosen according to reflect the substantial variation in costs per track-km for the LRT and the podcar modes. The high cost estimate for podcar reflects the ULTra Heathrow cost level, which also is the average Vectus’ cost estimate. The low podcar cost estimate corresponds to ULTRa’s cost estimate at a lower utilization rate (i.e. 100,000 annual trips per track-km) from 2002, adjusted to the 2007 price level. Figure 13. Investment cost for Buss, Podcar and LRT in m€ per track-km at three cost alternatives
Investment Cost for Bus, Podcar & LRT in m€/track-kilometer at three cost estimates
0,2 0,21,5
7,28,1
9,08,5
13,7
18,8
0
2
4
6
8
10
12
14
16
18
20
Low Cost estimate Average Cost estimate High Cost estimate
BusPRTLRT
m€/track-km
For the high cost estimate, the full annual transit share of the street replacement cost (including also the corresponding transit share of the street operating cost) has been accrued as the bus infrastructure cost. For the average and for the low cost estimate, these street infrastructure costs are not included, but only the infrastructure costs for bus stops, terminals and depots. In

21
Figure 14 below the corresponding unit costs per trip is shown:

22
Figure 14. Unit cost (capital and operating) in € per trip for bus, podcar and LRT: average for 10 cities in Sweden at three cost levels
Unit cost including infrastructure per trip. Average for the 10 largest cities in Sweden (not Stockholm) 'for Bus, Podcar and LRT;
three cost estimates
1,8 € 1,8 €2,6 €3,1 €
3,7 €
5,1 €
6,9 €
10,2 €
13,4 €
0,0 €
2,0 €
4,0 €
6,0 €
8,0 €
10,0 €
12,0 €
14,0 €
16,0 €
Low Cost estimate Average Cost estimate High Cost estimate
BusPodcarLRT
At the average cost estimate level, an average Swedish city bus trip (with a weighted n average trips distance of 7.8 kilometer) costs 1.8 € by bus, 3.7 € by podcar and 10.2 € by LRT. The relationship between bus, podcar and LRT does not change when the cost levels shift from low to high. Thus, podcars can be regarded as less costly than LRT-systems. However, the bus network is cheaper than the podcar network, when all infrastructure costs are included (even for the bus network). 5.5 Double ticket revenues with podcars yields lowest operating deficit As the podcar mode will yield up to twice as many transit trips as the traditional bus an tramway modes, even the ticket revenues will augment by a factor proportional to the number of trips, provided we adopt the same pricing policy for podcar trips. 5.6 Comparison of operating results The operating deficit (or surplus) is defined as the difference between the ticket revenue minus the operating cost. This deficit can be calculated in totals and per trip.

23
Figure 15. Operating deficit/surplus in € per trip for bus, podcar and LRT: Average for 10 Swedish cities at three cost levels
Operating deficit / surplus (tiucket revenue - operting cost) per trip. Average for 10 Swedish cities, for Bus, LRT and Podcar;
three cost levels
-0,5 € -0,5 € -0,6 €-0,7 € -0,7 € -0,7 €
0,2 €
-0,2 €
-1,3 €
-2,0 €
-1,5 €
-1,0 €
-0,5 €
0,0 €
0,5 €
1,0 €
Low Cost estimate Average Cost estimate High Cost estimate
BusLRTPodcar

24
Figure 15 shows the operating deficit per trip for the bus, the LRT and the Podcar modes. AT the average cost estimate, the bus and the LRT modes show an operating deficit of 50 and 70 cents, respectively, while the deficit by podcar will be only 20 cents. At the low cost estimate the podcar mode even show a positive operating surplus by 20 cents per trip. At the high cost estimate level, the deficit will be highest for the podcar mode, -1.3 5 per trip.
The uncertainty as regards the “true costs” for Podcars, explains the bif difference in these operating results.
However, an average for the ten cities hides the details. As a matter of fact, the podcar mode shows a negative operating deficit only for a few large cities. Only eight bigger cities out of the 59 Swedish cities show a negative deficit, while the rest, the 51 cities yield a positive operating surplus by Podcar. For the bus mode there is a negative deficit in all 59 cities, se Figure 16 below:

25
Figure 16. Operating deficit/surplus in € per trip for bus, podcar and the difference between podcar and bus for 59 Swedish cities
Opertating deficit/surplus per trip for bus and podcar in 59 Swedish cities; and difference in the deficit
-8 €
-6 €
-4 €
-2 €
0 €
2 €
4 €
6 €
8 €
Götebor
g
Uppsala
Väster
ås
Örebro
Norrköping
Lund
Gävle
Trollh
ättan
+Väner
sborg
Borås
Halmsta
d
Kalmar
Skövd
e
Kristia
nstad
Uddeva
lla
Landsk
rona
Ängelholm Pite
å
Varbe
rg
Sandv
iken
Boden
Kiruna
Falken
berg
Hässle
holmNäs
sjöEslö
v
Gälliva
re
Hudiksv
all
Bollnäs
Stenungs
und
Difference Podcar-Bus
Oper deficit Bus
Oper deficit Podcar
The bars in Figure 16 above show the difference in the operating deficit between the podcar and the bus mode. 6 Cost-Benefit Analysis and Environmental Impacts of Podcars 6.1 60 % higher benefits than cost with podcars in 59 Swedish cities and towns A cost –benefit analysis as seen carried out for the 59 cities and towns, with podcar networks replacing the existing bus/tram networks. On the benefit side the following aspects are considered:
• Travel time gains • Ticket revenues • Traffic safety gains • Environmental gains (reduced CO2 exhausts from private cars and from buses
The extra comfort and convenience by podcars is not considered And on the cost side the following aspects are considered:
• Investment costs • Operating and maintenance costs • Reduced gasoline tax revenue from less car traffic
The main result is that the overall benefits amount 2.85 billion €, while the total costs amount 2.24 billon € in present value. The net benefits amount 0.61 billion € and the benefit-cost ratio is 1.27. This means that one € spent on podcars yield 1.27 € in return in terms of benefits to the society.

26
Figure 17. Source of social benefits and costs for Podcar networks compared to bus networks. Annualized present values ocer a 40 year period (at 4 % discount rate) in billion €
Benefits & costs with podcars in 59 Sweedish cities and towns; annualized net present values in billion €
2610
120 70 50
-1750
-430-60
-2000
-1500
-1000
-500
0
500
1000
1500
2000
2500
3000
Benefit Cost
Travel timeTicket revenueTraffic safetyCO2 emissionsCapitalO & MReduced gas tax
Benefi: 2.85 billion €Cost: 2,24 billion €
Benefit-cost ratio: 1.27
Travel time gains make up more than 90 percent of the total benefits. Increased ticket revenues, traffic safety and environmental gain add up to the rest. Podcar networks are clearly worth any cent. But in how many cities and towns will a podcar network be economically justified from the social surplus point-of-view? To answer this question, I have calculated costs and benefits for each of the 59 cities and towns, with the following result: Figure 18. Relationship between benefit-cost ration and city population size. Statistics for 59 Swedish cities, at podcar capital cost of 8 m$ per track-km
Relationship between Benefit-Cost Ratio and the City/town size
Benefit-cost ratio = 0,3264*Ln(Inhabitant) - 2,8039R2 = 0,4368
0,0
0,2
0,4
0,6
0,8
1,0
1,2
1,4
1,6
1,8
0 40 000 80 000 120 000 160 000 200 000 240 000 280 000 320 000 360 000 400 000 440 000 480 000 520 000
Inhabitants
Ben
efit-
Cos
t Rat
io
Alingsås
UddevallaKarlstad
Uppsala
MalmöGöteborg

27
On average smaller towns are less suited for introducing podcar networks compared to the larger towns and cities. Even if there is certain variation from the regression line, on average, one might conclude, that podcar networks seem to be suitable to introduce in cities and towns down to a size of approximately 100,000 inhabitants. From the Figure 18 above it can be seen that at least seven smaller cities than 100,000 inhabitants still show a positive benefit-cost ratio for podcars. The social profitability (i.e. when the social benefit-cost ratio is greater than 1.0) is highly sensitive to the capital cost per track-km for the podcar system. A sensitivity analysis has been carried out, for the capital cost per track-kilometer in the range between 4 – 8 m€ per km, with the following results fro the 59 cities Swedish data base: Table 6. Benefit cost ratio, city size, share of profitable cities, total benefits and cost in m€: Results from 59 Swedish at capital costs of 4 – 8 m€ per track-km
Podcar capital cost/track-km, in m€/km
B/C ratio, all 59
cities/towns
City size limit in no. of
inhabitants for profitability
No of profitable
cities
Share of profitable
cities
Total annual benefits in
m€Total annual costs in m€
Share of total population in
profitable cities
4 m€/km 2,15 20 000 31 53% 2 036 946 82%5 m€/km 1,67 30 000 27 46% 2 036 1 218 76%6 m€/km 1,32 45 000 22 37% 2 036 1 547 68%7 m€/km 1,03 70 000 15 25% 2 036 1 972 59%8 m€/km 0,9 100 000 10 17% 2 036 2 220 43% At 8 m€ per track-km the city size limit for profitability is around 100,000 inhabitants. At this cost level only 10 out of the 59 cities are profitable, but they carry 43 % of all citizens in the 59 cities group of Swedish cities. Figure 19. Relationship between City size and Social profitablity (B/C ratio > 1.0)
Minimum city size in no. of inhabitants for social profitability(benefit-cost ratio > 1.0)
010 00020 00030 00040 00050 00060 00070 00080 00090 000
100 000
4 m€/km 5 m€/km 6 m€/km 7 m€/km 8 m€/km
Capital cost for Podcars in m€ per track-km
Min
imun
City
siz
e fo
r so
cial
pr
ofita
bilii
ty

28
At 6 m€ per track-km, the overall benefit/cost ration becomes 1.32, i.e. benefits are 32 percent higher than the costs. The minimum city size for a podcar network, that covers the whole city drops to 45,000 inhabitants. Approximately one third of all 59 cities fulfill this criterion, and these 22 profitable cities carry two-thirds of all citizens (3.2 million) in all the 59 cities. If the podcar capital could be reduced to 4m€ per kilometer, then the benefits would be more than twice as high as the costs, and podcars would be profitable down to a town size of only 20,000 inhabitants. Of all 59 Swedish cities and town, 31 cities and towns fulfill this criterion, and they make up more than 80 of all inhabitants. Thus, the conclusion is that costs matters and that the profitability of podcars in cities is highly dependent on the unit costs. In reality, I recommend to carry out detailed cost-benefit analysis for each town and podcar case in order to draw the correct conclusion if the podcar project will be economically justified in terms of benefits and costs. 6.2 Reduction in carbon-dioxide emissions by 25 % with podcars If a system of podcars would replace the urban diesel bus, then the local exhausts from diesel buses would be eliminated. Also, the modal shift from trips made by the private car to podcar trips would contribute to reduce the local air pollutions exhausts substantially. In the

29
Figure 20 below the carbon dioxide emissions per vehicle-.kilometers is presented according to Swedish calculations for nine modes. The figures refer to urban traffic conditions; and for the electric modes, LRT, Metro and rail as well as PRT (podcars) we have based lour figures on the average Swedish electricity production system (with high proportions of hydro and nuclear electric power). For the podcar mode the energy consumption (as the basis for CO2 emissions) are derived from the Ultra and Vectus podcar systems.

30
Figure 20. Estimated carbon dioxide emissions per vehicle-kilometer for 8 transit modes and for car
Gram CO2 per vehicle-kilometer
1524
916
697570 533 456
260162
70
200400600800
10001200140016001800
Diesel
bus
Etanol b
usMetr
o
Inter-ci
ty tra
in
Commuter tr
ain LRT
Private
car
Biogas bus
PRT
The diesel and ethanol bus modes show high CO2 emissions per vehicle-kilometer. Also the rail modes show higher exhausts then the private car, partly due to the bigger size of the vehicles. The podcar mode is estimated to produce 7 grams of carbon dioxide per vehicle-km. Adopting average passenger loads per vehicle type, gives us the following carbon dioxide emissions per passenger-kilometer. Figure 21. Estimated carbon dioxide emissions per passenger-kilometer for 8 transit modes and for car, at average vehicle occupancy
Carbon dioxide emissions per passenger-kilometer at average vehicle loads
1,547101113
61
102
153
020406080
100120140160180
Private
car
Diesel
bus
Etanol b
usLRT
Biogas bus
PRTMetr
o
Inter-ci
ty tra
in
Commuter tr
ain
grammes per passanger-km
31
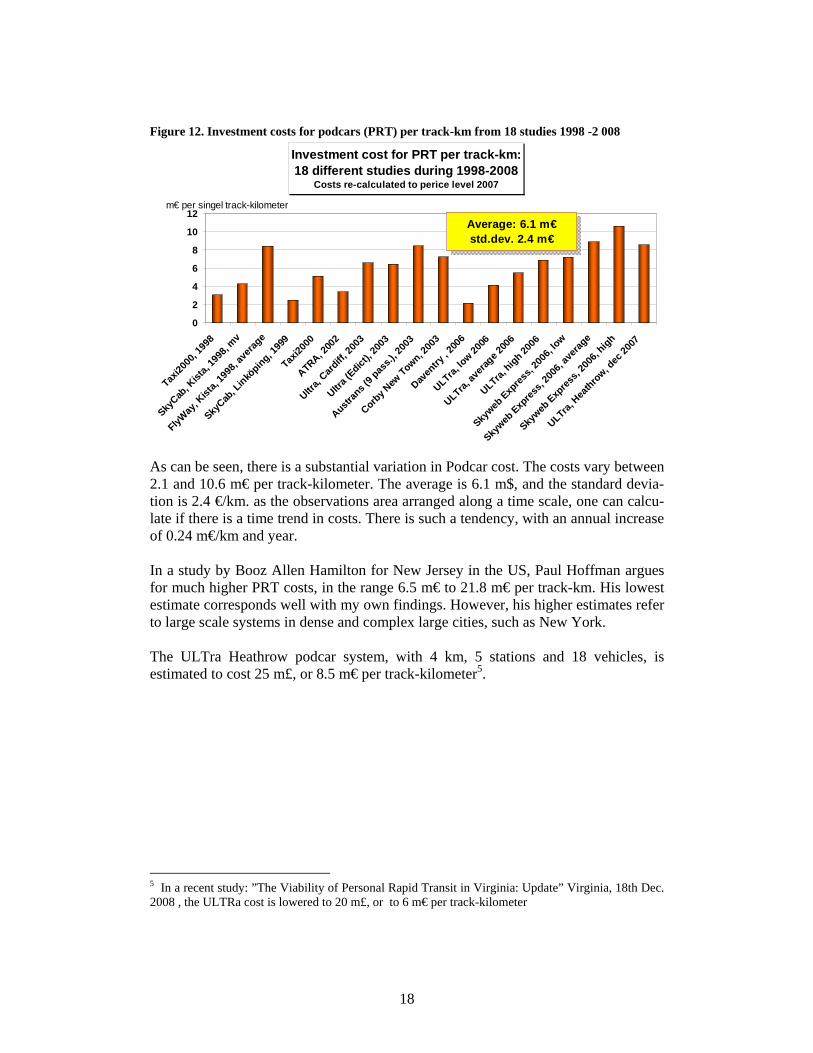
Now, when considering the average vehicle occupancy, the private car becomes the highest emitter of CO2 gases, followed by the diesel bus. The podcar mode has 10 grams of CO2 gas per passenger-km, which is of the same magnitude as by biogas bus, and a little more than by metro (however, the energy consumption in the building process of each transport mode has not been estimated here).The resulting impact on carbon dioxide is presented in the figure below: Figure 22. Impacts on carbon dioxide emissions in kiloton per annum from replacing bus networks into podcar networks in 59 Swedish cities
Impacts on carbon dioxide in kiloton per annum from the estimtated change in modal split from bus/tram to podcars for 59 Swedish
cities
940
160
0
1 100
770
0
30
800
-170
-160
30
-300
-400 -200 0 200 400 600 800 1 000 1 200 1 400 1 600
Car
Bus
Podcar
All modes
Total change in kilo-tonKilo-ton CO2 with PodcarKilo-ton CO2 with bus/tram
Car: -18
Total: -27 %Public Transport:-81 %
Exhausts from the car traffic would be reduced by 18 % when podcars compete as the local public transport system for these 59 Swedish cities. Exhausts from diesel buses will then be eliminated, and replaced by a much smaller exhaust from the new podcar mode (only 19 %). The overall reduction in carbon dioxide is estimated to become 27 % or 300,000 tons per annum. The CO2 exhausts from the public transport system will be reduced by 81 %.The total carbon dioxide emission from road traffic in Sweden amounts 13.2 million tons annually. Therefore, a replacement of bus networks for podcar networks in 59 Swedish cities would reduce the CO2 road emissions by 2.3 percent. Even if this is positive, there are other cheaper ways of reducing CO2 gases.

32
7 PPP Solutions for Financing Podcar Systems - Case Studies In Sweden several pre-feasibility studies have been undertaken lately. In cities and towns like Värmdö, Kiruna, Linköping, Östersund, Eskilstuna, Södertälje and Uppsala local podcar networks have been assessed. Also the Kungens Kurva Area in the Municipality of Huddinge was analyzed within the EDICT-project6. 7.1 City of Linköping Case Study The PRT double track network for Linköping (104,000 inhabitants) was designed by Beamways AB.
Beamways has simulated the demand for podcar trips on double track network with 500 meters of station spacing and assuming 1.5 podcar trips per person and day. The average vehicle occupancy is assumed to be 1.5 persons. The estimated impacts of an area-wide podcar network in Linköping would be:
• The transit mode share would increase from 12 % to 28 % (assuming a bus constant in the mode choice model) or 40 % (assuming a “half car constant” in the mode choice model)
• The annual costs are estimated to increase from 14.4 to 45.3 m€. • The ticket revenues are estimated to increase from 6 to 33.6 m€, i.e. more
than five times. • The Annual ticket revenues will exceed the operating costs with the podcar
system by 9.4 m€, which corresponds to 44 % of the annualized capital costs. • The net cost (total cost – ticket revenue) per boarding will be reduced from
1.14 € by bus to 0.35 € by podcar.
6 EDICT is an acronym for European Demonstration of Innovative City Transport
Podcar net from Beamways =>
90 km track
118 stations
1 700 vehicles
101 800 boardings/day
4.5 times more trips than by bus
<= Today’s bus network in Linköping:
325 line-km
12 % transit market share
22 600 boardings/day

33
7.2 Södertälje An area-wide podcar network has been designed for Södertälje (82,000 inhabitants) and analyzed by LogistikCentrum and WSP in 2008. A regional nested logit travel demand model for the entire Metropolitan Stockholm area was used to calculate the regional podcar demand, for the year 2030; that was later simulated into more detail by the PRTsim model, in order to calculate the waiting and travel times within the podcar network, but also to estimate the size of the vehicle fleet. At present a first phase of a podcar network is assessed by an engineering design. No decision is yet taken to start building a podcar system
The estimated impacts of an area-wide podcar network in Södertälje would be:
• Transit demand would increase from today’s 25,000 trips by bus to 69,500 trips in 2030 by podcar
• The transit mode share is estimated from 14 % to 18 %. • The annual ticket revenues would balance the annual operating costs, if the
same ticket price would be adopted. • The net cost ((total cost – ticket revenue) per boarding would increase from
0.6 € to 1.0 € per boarding by podcar. • The social benefit-cost ratio for the first phase is calculated to be betrween
1,45 – 2.00.
<=Today’s bus net in Södertälje:
162 line-km
14 % transit mode share
41 000 boardings/day
Proposed podcar net for 2030:
43 km track
55 stations
650 vehicles
67 500 boardings/day
65 % more transit trip than by
bus

34
7.3 Kungens Kurva In 2002 Kungens Kurva Shopping Mall had 42,000 daily visitors. Around 2015 this number is estimated to increase to 63,500 visitors. The proposed podcar network was designed by Transek and LogistikCentrum in collaboration with the municipality of Huddinge, to be connected to the metro station at Skärholmen, in the city of Stockholm. Also two remote parking houses in each of the two entrances to the area was proposed to carry a podcar station inside the parking area. A regional nested logit travel demand model for the entire Metropolitan Stockholm area was used to calculate the regional podcar demand, for the year 2030; that was later simulated into more detail by the PRTsim model, in order to calculate the waiting and travel times within the podcar network, but also to estimate the size of the vehicle fleet.
The estimated impacts of an area-wide podcar network at Kungens Kurva, Huddinge, would be:
• The number of transit trips would augment almost fivefold • The operating costs would increase three times • The ticket revenues would increase by a factor of ten, as the ticket price was
proposed to double. The tax subsidy could then be reduced from 61 % to 24 %.
• The operating cost per boarding could be reduced from 1.06 € to 0.7 € by the podcar system.
<= Today’s bus network at
Kungens Kurva
17 line-km (within area)
5.5 % transit mode share
2 350 boardings/day
Propoded podcar network for
2015:
12 km track
18 stations
85 vehicles
11 000 boardings/day
4,7 times more transit trips than
by bus

35
7.4 The City of Kiruna The city of Kiruna (23,000 inhabitants) is a fairly small town with a very low transit mode share. A pre-feasibility study was made by WSP in 2006 for a podcar network. The reason for this study is that the entire city has to be moved from its present position within the next two decades, due to the fact the iron ore, on which the town is based, causes cracks in the soil. The demand for podcar trips is based on a meta analysis of the transit modes share for bus and podcar networks (based on previous Swedish and British PRT demand model studies7 .
The estimated impacts of an area-wide podcar network in the town of Kiruna would be:
• The number of transit trips would increase from 600 to between 7,000 and 15,000 daily boardings by the podcar network
• The transit mode share would increase from 2 % to between 12 and 24 %. • The annual costs would increase from 0.8 m€ to 19.5 m€. • The ticket revenues would increase from 0.14 m€ to 2.5 m€, or by a factor of
18 • The annual ticket revenues will exceed the annual operating costs by some 1
m€ • The net cost ((total cost – ticket revenue) per boarding would be reduced
from 5.2 € by bus to 3.2 € by podcar in Kiruna.
7 See section 1.5 above about the meta analysis
<= Today’s bus network in Kiruna
97 line-km
2 % transit mode share
600 boardings/day
Proposed podcar network =>
30 km track
26 stations
100 vehicles
11 000 boardings/day
18 times more transit trips than by bus

36
7.5 Conclusions from four case studies The following conclusions can be drawn from the podcar case studies in Linköping, Södertälje, Kungens Kurva (Huddinge) and Kiruna:
• Four to five times more trips with podcars compared to bus Compared to bus, with podcars transit ridership will increase by four to five times in Linköping and at Kungens Kurva. At Kiruna the effect is even greater, but in that town the analysis is more coarse
• 3,5 times higher transit mode share with podcars
The transit mode share augments by 3.5 times in Linköping and at Kungens Kurva. In Södertälje the impact is estimated to be smaller, or from 14 % to 18 % with a podcar network for the built up area.
• Increased annual costs, but a positive operating surplus with podcars
The total annual costs will increase with podcars, and they vary with the size of the city and the podcar network. The ticket revenues exceed the operating and maintenance costs in Linköping, Kiruna and at Kungens Kurva. This is explained by the substantial increase in ridership. In Linköping and at Kungens Kurva we have also assumed a higher ticket price with podcars.
8 Public-Private Partnership – a recommended financial solution
with examples from six Swedish case studies Public transport has since long been a case for various public private partnerahip solutions. And there is still room for further improvements towards an even better collaboration for the local, urban and regional public transport sector. Investments in podcar systems would mean any exception from such collaborations. A closer Public Private Partnership (PPP) solution might not change the financial burden dramatically, but it can bring other advantages, e.g. in terms of a more efficient transport system. A negotiated annual fee from the service provider could also ease the planning of the annual budget for the system. BOT stands for Build-Operate-Transfer and is a form of public-private partnership. In its most common form, a BOT project implies that a private actor receives a concession from the public sector to finance, design, construct, and operate a facility for a specified period of time, normally between 20 and 30 years. After the concession period ends, ownership is transferred back to the public sector. Within the transportation sector, large road investments have so far been the most common and talked-about BOT projects. However, it can also be used for implementing investments in podcar systems. There are several advantages to the public actor:
37
• Costs are spread out over the concession period. • The risks are divided between the private and public actors and thus lower for
the public sector. • The project has good chances to be cost effective, since the private actor is
forced to optimize maintenance. • An advantage to the private actor is that so far, only a few actors are strong
enough to offer such long-term commitment. The financial means are usually gathered through borrowing on the international financial market. Revenues normally come from ticket sales, and/or a yearly payment from the public actor. BOT is suitable for podcar investments, since they are characterised by relatively large initial investments but rather low operating and maintenance costs. Podcar systems are compared to other public transport, such as bus with no or low investments costs and high operating and maintenance costs. The comparison is made easier through BOT, since both alternatives seem to have only ”operating and maintenance costs” in the eyes of the public actor. A podcar system may be a private transportation alternative comparable to taxis and may be financed through tickets sales. In that case, the private actor will want to be free to set the ticket price that he chooses. In such an alternative, a public actor will most likely keep the existing public transportation, seeing the podcar system as a separate alternative. In Sweden it is more suitable to see podcars as a part of the existing public transportation system. In that case, the municipality is in charge of planning, procurement, and ticket sales. A podcar system may transfer travellers to and from other public transport and can in some cases replace this locally. The same ticket is supposed to be valid on different types of public transport. The private actor’s revenues will in this case be fees from the public actor. A BOT consortium may include the following parties:
• Podcar system supplier • Property developer • Public transport operator • Host municipality

38
Below we show illustrative examples of what a yearly fee and fee per trip may be for six different podcar investments organised as BOT. We assume a rate of interest of 5 %, that the concession period is 30 years, that there are no subsidies, and the unit costs shown below. The examples are simplified compared to reality. In real projects, the design of the project is an important cost. Table 7. Assumed unit costs for different parts in a podcar system Unit cost in m€* Track per km 4.0 Station 0.3 Vehicle 0,075 Control system 1,0 Depot* 3 – 6
* Depending on system size and localization. Source: LogistikCentrum The total investment cost per system km is dependent on the size that control system and depot are distributed over, as well as on the number of stations and vehicles per track km. In the case studies, the total investment cost varies between 5.8 and 8.7 m€ per km, with an average value of 7.5 m€. Operating and maintenance costs include salaries for employees, and costs for spare parts, maintenance, and power supply. The number of employees is varied depending on system size. The energy consumption per vehicle is assumed at 7 kW (incl. AC), 9 hours per day, 300 days per year. The energy cost is assumed to be 0.1 € per kWh. The operating costs might probably by underestimated somewhat, since no real wage increases have been included. Also, costs for land and encroachment compensations have not been included. However, a 20 % cost increase have been made to cover project management, unforeseen costs, and profit. The result is seen in Table 2 below:

39
Table 8. Example of six different podcar investments organised as BOT and where the private actor is responsible for initial investment. The rate of interest used is 5 %, and the systems are to be repaid after 30 years.
Kungens Södertälje SödertäljeAlt. without any subsidy Linköping Kiruna Kurva 1st phase areawide ÖstersundTrack lenth (km) 90 30 8,3 11 43 25No of stations 118 26 15 18 55 11No of vehicles 1 700 100 85 140 731 150Trips per annum (million) 33.1 3.3 4.0 4.1 22.2 4.2Capital cost (m€)* 780 175 65 89 361 161Capital cost per track-km 9 6 8 8 8 6O & M Cost (m€) 16 2 2 2 8 2
Annual BOT Fee (m€)** 69 14 6 8 33 13BOT Fee per podcar trip (€) 2,1 4,2 1,5 1,9 1,5 3,0Corresponding Cost by bus (€) 1,4 3,8 1,8 2,2 2,2 5,8Cost difference podcar - bus in % 53% 10% -14% -14% -34% -48% * Including reinvestment for vehicles year 11 and 21. ** Including 20 % for project management, and profit. The podcar systems in Södertälje and Kungens Kurva are the cheapest per trip with: 1.5 € per trip. The podcar cost per trip is lower than for bus in four of the six case study areas, namely in Kungens Kurva, Södertälje (both alternatives), and in Östersund. In Kiruna, a podcar trip would be 10 % more expensive than a bus trip, while it would be 53 % more expensive than a bus trip in Linköping. The primary reason for this in Linköping is that the study included double tracks for the podcar system, which would not be necessary. In the figure below, costs per trip are compared between podcar and bus.

40
Figure 23. Costs per trip with podcar in a BOT solution with (dark green) and without (light green) 50 % state subsidies as well as with bus (red).
Cost per trip with Podcar with BOT financing and by bus today
1,4 €
2,1 €
4,2 €
1,5 € 1,5 €
3,0 €
1,9 €
5,8 €
3,8 €
2,2 €2,2 €1,8 €
1,3 € 1,7 €2,5 €
1,2 €0,9 €1,0 €0 €
1 €
2 €
3 €
4 €
5 €
6 €
7 €
Linköping KungensKurva
Södertäljeareawide
Södertälje1st phase
Kiruna Östersund
BOT Fee/trip without capital grant
BOT Fee/trip with 50 % Capital grant
Corresponding bus cost/trip

41
Figure 23 shows that BOT solutions for podcar investments in all five case study cities would imply lower costs per trip, provided that 50 % of investment costs are paid by state grants. Also without grants, the cost per podcar trip is lower than per bus trip in four of the six cities. 9 Other ways of financing Podcar networks When public funds are scarce, there are a number of possibilities for financing public transport. Successful alternatives are distinguished by the following criteria:
• high socio-economic efficiency • large flows of revenue • small demands on the judicial system • low administration and system costs • political acceptance • public acceptance
Unfortunately, few sources of finance combine all of this, but some are nevertheless well suited for podcar systems. Agreements on co-financing with the private sector Agreements on co-financing is a politically attractive solution that may give positive external effects through strengthening the feeling of cohesion between public and private in a municipality. However, agreements presuppose that the concerned private actors appreciate the benefits they would get, enabled by the public transit investment in question, and that they accept that the municipality or trafikhuvudman cannot finance the investment by itself. When many private actors are involved, the transaction costs may become large. Local fees or taxes If the interest in co-financing is not large enough among local and regional private actors, local or regional fees or taxes may offer alternatives. The fees can be regarded as compensation for increased accessibility. In already developed areas, they can be implemented in the form of temporary supplements to the ordinary corporate taxation or as supplements to the existing employment tax. In expanding areas, it can be implemented as an earmarked exploitation fee imposed on developers. A local fee or tax may be unusually well suited for investments in podcar systems since
• the investment offers something entirely new, rather than an upgrading of a (possibly neglected) public transportation system.
• the investment offers a higher standard of service in the local public transportation.

42
• the prospect of decreasing local levels of combustion, increasing traffic safety, improving accessibility for some groups and in the long run increasing land supply, all with one investment, is likely to be interesting to many.
• making stations elevated and putting them on side tracks makes it possible to integrate them with buildings, such as hospitals and malls, which increases benefits and probably also public acceptance.
• while the initial investment need of a podcar system is large, operation costs are low, making single payments sufficient.
Congestion and environmental charges Congestion and environmental charges may be considered for several reasons, not the least because they may at the same time guide car traffic and finance public transportation. But while they may be implemented as a long-term strategy for finan-cing public transit, they are not well suited for financing single investments. Services connected to public transportation Other alternative sources of finance that are already used today are revenues from various services that may be connected with the supply of public transportation, such as revenues from commercial advertising, and services connected to the public trans-portation payment system. The potential for this type of financing is estimated to be far from exhausted, although the single revenues are usually small. However, in-comes from these types of services should be seen as a possible addition to public transportation funds in general, rather than to single investments. As an alternative, the municipality – as planned by the consortium behind the railroad Norrbotniabanan in northern Sweden – build tracks and sell station rights and vehicle kilometers to private companies that want to supply the traffic.

43
Government subsidies and EU-funds The Swedish government subsidies’ programme for local and regional public trans-portation is applicable to local podcar systems, but not easily so. The investment should either be very small, or exist in the long-term planning schemes of the national road or rail agency. These are normally updated every four years, meaning that it may take four years before an application is considered. In other countries, other rules apply, for better or for worse. Within the European Union, EU’s regional funds, as well as the Seventh Framework Programme, seem to fit very well with investments in podcar systems. However, when applying for an EU subsidy one must be aware of the large load of administra-tive work that an application implies. The Seventh Framework Programme is aimed at funding research programmes, rather than ordinary investment projects. Conside-ring the relative novelty of podcar systems, however, there is most likely research to be done, related to system implementation that may fit within the Programme. 10 Conclusions and recommendations 10.1 Conclusions about demand and mode share The basis for this paper has been a data base over public transport in 59 Swedish cities. Two of the cities (Göteborg and Norrköping) have LRT as a backbone as a complement to the traditional line-haul scheduled bus system. A synthetical podcar network has been assumed for the 59 cities with the typical podcar (PRT) features (less than 1 minute waiting time, 45 km/hour in cruising time, no intermediate stops etc). The main conclusions as regards the podcar performance, mode shares and travel demand compared to line-haul bus service for the 59 cities are:
• Generalized time: reduction from 44 to 18 minutes (- 59%) on average • Mode share: increase from 17 to 32 % • Number of trips: Up by 94 % • Benefit and costs: Net present value of benefits are 27 % higher than the costs • Environmental impacts: Carbon dioxide emission down by 27 % by replacing
diesel bus traffic to podcar traffic 10.2 Conclusions about the economy with podcars compared to bus and LRT
• As regards capital costs, podcar is cheaper than LRT, but more expensive than an urban bus system. This is true even when we include the fair share for the bus mode for the infrastructure costs for the street network that the busses use. This holds true for all the three costs levels adopted in this study.
• As regards operating and maintenance costs the picture becomes less
evident, at the cost levels we have found. There is a substantial variation not

44
only for capital costs, but also among various studies about the O & M costs. At our Average cost level, podcars have the lowest O & M costs compared to both bus and LRT, while LRT show the highest O & M costs per passenger-kilometer. This is also true at the Low cost level alternative, except for the City of Göteborg (because of a large podcar network there, with a very high utilization). However, the cost comparison results are highly sensitive to variations in the unit cost assumptions. For podcar networks one might argue that the O & M costs should vary either according to the number of passenger-kilometers (demand) or to the number of track-kilometers (supply), or to both. In this study we have assumed dependence on the demand only, and not to the supply side.
• The operating deficit or surplus is defined as the difference between ticket
revenues and the O & M costs. For bus and LRT there is an operating deficit throughout all 59 Swedish cities, which means that the O &M costs always are larger than the ticket revenue at the present low price levels. At the Low cost level, the podcar networks yield a positive operating surplus (except for the two largest cities in the data base, Göteborg ands Malmö). At the both other cost levels, the Average and the High cost levels, podcars yield a negative operating deficit than by bus for the 11 largest cities. At the Average cost level the podcar operating deficit will be much lower than by bus. Podcar networks yield an operating deficit only in some 8 larger cities, while it yields a positive operating surplus in the other 51 cities.
• If one wishes to further reduce the uncertainty as regards the capital and O &
M costs that are accrued to podcar networks, we recommend to carry out more detailed civil engineering studies and also to let build pilot podcar networks in various areas in order to gain experiences both about the demand for podcar service and about capital and operating costs.
10.3 Conclusions about financing Podcar networks This study summarizes a variety of financial solutions, among the most inportant I would like to mention:
• Agreements on co-financing with the private sector • Local fees or taxes • Congestion and environmental charges • Services connected to public transportation • Government subsidies (grants) and EU Funds
The method recommended in this report is a specific form of agreements on co-financing with the private sector, called PPP: Public Private Partnership. And even more specific: the BOT method, Build, Operate and Transfer. At reasonable assumptions, based on six Swedish Case Studies, we have show that a BOT Fee per trip for an area-wide podcar network might be even lower than the actual bus cost per trips in four of the six cases. With a traditional Swedish Governmental capital grant

45
at 50 % of the capital cost, a BOT podcar fee would be cheaper than the actual bus cost per trip in all of the six case studies. 10.4 Recommendations - an Action Plan For a local town or city interested in implementing a podcar network, we recommend the following action plan:
1 Delimit a dense settlement area with multi-storey housing, work-places, commercial areas and major transit hubs
2 Undertake out a feasibility study for a potential podcar network, containing level-of-service, trip forecasts, benefits and costs as well as comparisons with today’s public transportation and with a step-by step development.
3 If there is still an interest for a podcar network , the next step would be to undertake an engineering design phase that answers the questions about the feasibility and the economy
4 Seek public acceptance with inhabitants, land owners and with local transport authorities.
5 Negotiate about co-financing with developers, landlords and with relevant authorities and (in Europe) with EU Regional Funds,
6 Invite potential suppliers together with the responsible transportation authority to offer the remaining financial capital, installment and operations of a first phase for a podcar system at a fixed annual BOT Fee.
7 Demand a safety certification from the relevant public authority and financial guarantees from the consortium of suppliers.
8 An agreement with the consortium of suppliers ought to contain payment conditions for operations and service levels with a specified accessibility during the entire period of operations.
9 Later developments of the podcar network ought to be procured under competition, based ion specifications from the first supplier.
10 Include the podcar project in the relevant local and regional planning process and undertake the necessary political decisions.

46
References 1 Andréasson, I., et al., Research and development in advanced transit systems -
Survey of academic and industry efforts, Rapport Chalmers Industriteknik. 1996
2 Andréasson, I. ” Innovative Transit Systems – Survey of Current Developments”. Vinnova Report VR 2001:3.
3 Badger, Charles, M.: “The Viabiliuty of Personal Rapid Transit in Virginia: Update”: Commonwealth of Virginia; 18 Dec. 2008
4 Buchanan, M: “Daventry Development Transport Study – Draft Stage 1B & 2 Report”. Daventry District Council, Nov. 2006. By Malcolm Buchanan, Colin Buchanan consultants.
5 Dahlström, K, et al, 2005, A General Transport System – A Case Study within the project: The Value of Alternative Transport systems. SIKA Report 2006:1 (including two reports in Swedish)
6 Daventry District Council: “Daventry PRT Scoping Study”. Febr. 2008 7 EDICT, European Commission, 2004, DG Research, 5th Framework
Programme, Key Action: “City of Tomorrow and Cultural Heritage”, EDICT Final Report, Deliverable 10, December 2004.
8 Hoffman, P.: “Personal Rapid Transit - Innovative Transportation Technology; Overview and State-of-the Industry: Boos Allen & Hamilton, Febr, 2006.
9 Hoffman, P.: “Personal Rapid Transit - Strategies for advancing the state of the industry. Transportation Research Board; and Boos Allen & Hamilton, January 23rd, 2007.
10 Hoffman, P. and Carnegie, Jon A: “Viability of Personal Rapid Transit Study in New Jersey - Final Report". By Jon A Carnegie, Alan Vorhees Transportation Center, Rutgers, The State University of New Jersey and Paul.S.Hoffman, Booz Allen Hamilton, Inc., Febr 2007
11 Johansson, O. Are PRT systems socially profitable? Göteborgs Universitet Nationalekonomi. 1997
12 Lowson, Martin, Advanced Transport Systems Ltd and University of Bristol: “Service Effectiveness of PRT vs Collective – Corridor Transport”, in Journal of Advanced Transportation - Vol. 37. No 3 Sep 2003.
13 Poskey, J: ”Report on the Feasibility of Personal Rapid Transit in Santa Cruz, California”, Draft Report prepared for the City of Santa Cruz, by Jeral Poskey, Da Vinci Global Services.
14 Raney, S. & Young, S.: “Morgantown People Mover - an updated Description”. http://www.cities21.org/morgantown_TRB_111504.pdf
15 SIKA: ”Utvärdering av spårbilssystem”. Rapport 2008:5 (in Swedish) 16 SIKA: ”Infrastrukturplanering för ökad transportpolitisk måluppfyllelse i
storstäder”. Rapport 2008:6 (in Swedish) 17 Tegnér, G., “Market Demand and Socia Benefits of a PRT System: A Model
Evaluation for the City of Umeå, Sweden”. Infrastructure, Vol. 2, No. 3, pp. 27-32, 1997, John Wiley & Sons, Inc.
18 Tegnér, G.: Benefits and Costs of a PRT system for Stockholm. 7th APM Conference. Copenhagen, May 1999.

47
19 Tegnér, G and Fabian, L.: Comparison of Transit Modes for Kungens Kurva, Huddinge, Sweden; 8th APM Conference in San Francisco, July 2001.
20 Tegnér, G. and Andréasson, I: Personal Automated Transit for Kungens Kurva, Sweden - a PRT system evaluation within the EDICT project. 9th APM 2003 Conference, Singapore, Sept. 2003
21 Tegnér, G.: EDICT – Comparison of costs between bus, PRT, LRT and metro/rail. Transek, February 2003
22 Tegnér, G.: PRT Ridership Analysis; in: Personal Automated Transportation- Status and Potential of Personal Rapid Transit. The Advanced Transit Association, January 2003. (ATRA). http://www.advancedtransit.org/doc.aspx?i=1015
23 European Commission, 2004, DG Research, 5th Framework Programme, Key Action: “City of Tomorrow and Cultural Heritage”, EDICT Final Report, Deliverable 10, December 2004
24 European Commission, 2004, DG Research, 5th Framework Programme, Key Action: “City of Tomorrow and Cultural Heritage”, EDICT Huddinge Site Assessment Report, June 2004 (Ed: G Tegnér, I. Andréasson, N.E. Selin)
25 Tegnér, G., 2005, PRT Costs compared to Bus, LRT and Heavy Rail, Some Recent Findings. Paper to be presented at: AATS European Conference in Bologna 7-8 Nov, 2005”Advanced automated transit systems designed to out-perform the car”
26 Tegnér, G, et.al. “PRT in Sweden - From Feasibility Studies to Public Aware- ness”; Paper presented at 11th International Conference on Automated People Movers, Vienna, 22-25 April 2007.
27 Tegnér, G, et.al. “Hur kan spårtaxi finansieras? En jämförelse mellan buss, spårväg och spårtaxi” (in Swedish), i.e. “How can PRT be financed? A comparison between buss, LRT and PRT”, report to the Swedish Road and Rail Administrations, the Swedish Agency for Innovations and to SIKA, the Swedish Institute for Communication Analysis. December 2008
28 UITP: ”Ridership and Market Share”. : www.uitp.org