AnSci 3085 Sec 4 Marketing Dennis Fennewald, M.S. 573-882-1833 [email protected] Room S-133B.
Upload
marcellus-drilling-newsCategory
view
300download
2
© Wood Mackenzie 1
June 22nd 2015
Strategy with substance www.woodmac.com
A Comparison of US Oil and
Natural Gas Policies Pro-development Policies vs.
Proposed Regulatory Constraints

© Wood Mackenzie 2
Key findings: Potential impacts of US oil and natural gas regulatory policies
*Incremental impacts assessed versus a Baseline scenario
**MMboed is million barrel oil equivalent per day
***All dollar numbers are in 2015 real US dollars
Impact on US* Pro-development Policies Regulatory Constraints
2025 2035 2025 2035
Oil and Natural Gas
Production +2.8 MMboed** +8.0 MMboed -2.6 MMboed -3.4 MMboed
Total Jobs Supported +1.0 million +2.3 million -800 thousand -830 thousand
GDP / Year*** +$163 billion +$443 billion -$138 billion -$133 billion
Total Government
Revenue / Year +$38 billion +$122 billion -$33 billion -$18 billion
Cumulative Gov't
Revenue (2016 - 2035) +$111 billion +$1078 billion -$260 billion -$500 billion
Total Household
Income / Year +$52 billion +$118 billion -$40 billion -$43 billion
Average Household
Energy Expense -$169/year -$360/year +$255/year +$242/year

© Wood Mackenzie 3
Glossary (1 of 2)
Term Definition
ANWR Arctic National Wildlife Refuge
bbl Barrel
bcfd Billion cubic feet per day
BLM Bureau of Land Management
BSEE Bureau of Safety and Environmental Enforcement
CEQ Council on Environmental Quality
DOE Department of Energy
E15 Gasoline blends containing 15% ethanol by volume
EPA Environmental Protection Agency
FERC Federal Energy Regulatory Commission
FOB Free On Board
FWS Fish and Wildlife Service
GDP Gross Domestic Product
GOM Gulf of Mexico
HH Henry Hub
IMPLAN A data and software program for economic analytics published by MIG Inc.

© Wood Mackenzie 4
Glossary (2 of 2)
Term Definition
kbd Thousand barrels per day
kboed Thousand barrels of oil equivalent per day
KXL Keystone XL pipeline
LNG Liquefied Natural Gas
MMbbld Million barrels per day
MMboed Million barrels of oil equivalent per day
MMbtu Million British thermal units
MMTPA Million metric tonnes per day
NEPA National Environmental Policy Act
NGLs Natural Gas Liquids
NPRA National Petroleum Reserve in Alaska
PHMSA Pipeline and Hazardous Materials Safety Administration
ppb Parts per billion
ULSD Ultra low sulfur diesel
WM Wood Mackenzie
WTI West Texas Intermediate crude oil

© Wood Mackenzie 5
Contents
2. Methodology
Executive summary
5. Refining implications
3. Supply implications
4. Midstream implications
6. Impacts on taxes, GDP, and US employment
1. Regulations overview and implications
Appendices
8. Study conclusions
7. Impacts on household consumption

© Wood Mackenzie 6
Wood Mackenzie has evaluated the impact on the US economy of various pro-
development policies and regulatory constraints in the oil and natural gas sectors
EXECUTIVE SUMMARY
API has requested Wood Mackenzie to investigate the impact of potential changes to
various oil and natural gas-related policies at both a federal and state level
The positive impacts of a series of pro-development policies have been evaluated,
alongside the detrimental impacts of a number of proposed and recently enacted
regulatory constraints
The impacts are characterized in terms of jobs, GDP, government revenues, and household
income and energy expenditure
Both upside and downside scenarios have been compared to a Baseline forecast that
excludes the listed pro-development policies and the regulatory constraints
Background

© Wood Mackenzie 7
Potential oil and natural gas pro-development policies
Policy Assumption* Pro-development Baseline Reg Constraints
Increase Federal Permitting Rates
Onshore federal lands
Gulf of Mexico
New areas for exploration and development
Atlantic offshore
Pacific offshore
Eastern Gulf of Mexico
Alaska (ANWR, NPRA and offshore)
Remove restrictions in Federal Rockies
Repeal New York State hydraulic fracturing ban
Approve Canadian oil pipelines
Repeal crude oil export ban
Market level of Condensate exports
Market level of LNG exports
EXECUTIVE SUMMARY
Prohibited / enforced Inhibited Supported / not enforced
*Further details of policy assumptions are provided in section 1 and the appendices.
**All scenarios in this study do not include the Clean Power Plan.

© Wood Mackenzie 8
Policy Assumption* Pro-development Baseline Reg Constraints
Emissions regulations
Ozone regulations (EPA)
Methane emissions restrictions (EPA)
Refinery emissions restrictions and measurements (EPA)
Definition of Waters of the USA (EPA)
Sage grouse listed under Endangered Species Act (FWS)
Standards and technical regulations
Hydraulic fracking standards on federal lands (BLM)
Blow out preventer design and testing standards (BSEE)
NEPA programmatic reviews (CEQ)
Rail car tank standards (PHMSA)
Renewable Fuel Standards (EPA)
EXECUTIVE SUMMARY
Recent and proposed regulatory constraints
Prohibited / enforced Inhibited Supported / not enforced
*Further details of policy assumptions are provided in section 1 and the appendices.
**All scenarios in this study do not include the Clean Power Plan.
© Wood Mackenzie 9
Pro-development policies could increase oil and gas production by 8 MMboed
whereas regulatory constraints could reduce it by 3.4 MMboed by 2035
EXECUTIVE SUMMARY
Total Supply Implications for the US
MMboed 2025 2035
Baseline production
35.0 36.5
Pro-development
production
37.8 44.5
Regulatory constraints
production
32.4 33.1
Pro-development
change from Baseline
+2.8 +8.0
Regulatory constraints
change from Baseline
-2.6 -3.4
2015 2020 2025 2030 2035
25
35
20
40
30
45
MM
bb
ld
Baseline Pro-development Regulatory constraints
Increases in US oil and natural gas
production is expected in all scenarios,
but the regulatory environment is
expected to have a very material impact
on the pace of growth and the peak level
achieved

© Wood Mackenzie 10
Baseline Pro-development Regulatory constraints
Pro-development policies could support an additional +2.3 million US jobs*,
whereas regulatory constraints could cost 0.8 million US jobs
EXECUTIVE SUMMARY
Total Job Creation Implications for the US
Millions 2025 2035
Baseline jobs
supported
8.0 7.9
Pro-development jobs
supported
9.0 10.2
Regulatory constraints
jobs supported
7.2 7.1
Pro-development
change from Baseline
+1.0 +2.3
Regulatory constraints
change from Baseline
-0.8 -0.8
2015 2020 2025 2030 2035
7
10
11
9
6
4
8
5
3
Millio
n
The ultimate level of supported direct,
indirect and induced jobs is strongly
influenced by US oil and natural gas
production rates**
* Total jobs supported include direct, indirect, and induced jobs in the upstream, midstream and refining sectors. Excludes some wholesale and distribution sectors.
** Short-term growth in supported jobs is expected in all three scenarios, driven by projected oil price recovery.

© Wood Mackenzie 11
Baseline Pro-development Regulatory constraints
Pro-development policies could contribute an additional $443 billion/yr to US
GDP, whereas regulatory constraints could reduce US GDP by $138 billion/yr
EXECUTIVE SUMMARY
Total GDP Contribution Implications for the US
$ Billions, Real 2015 2025 2035
Baseline GDP
contribution
1,339 1,312
Pro-development
GDP contribution
1,502 1,755
Regulatory constraints
GDP contribution
1,200 1,178
Pro-development
change from Baseline
+163 +443
Regulatory constraints
change from Baseline
-138 -133
2015 2020 2025 2030 2035
1,200
1,800
1,500
900
600
$ B
illi
on
s, R
ea
l 2
01
5
GDP contribution from oil and natural gas
development follows a similar trend, with
$576 billion/year at stake by 2035,
depending on the regulatory environment
© Wood Mackenzie 12
Baseline Pro-development Regulatory constraints
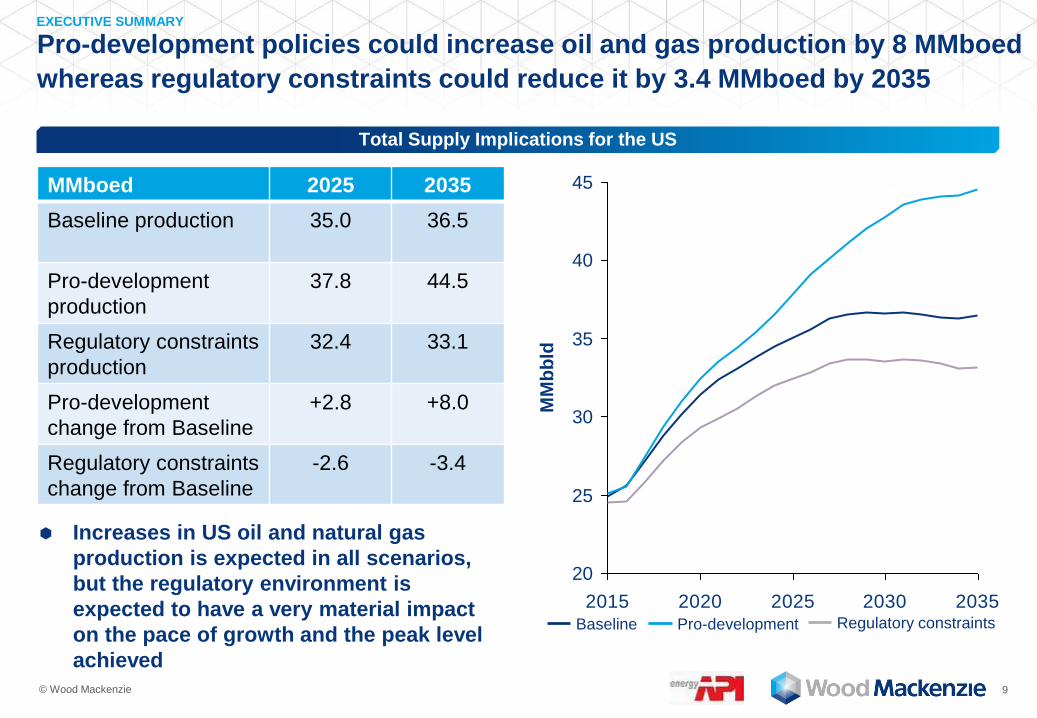
Pro-development policies could increase tax revenues by $122 billion/yr,
whereas regulatory constraints could reduce tax revenues by $33 billion/yr
EXECUTIVE SUMMARY
Total Tax Revenue* Implications for the US
$ Billions, Real 2015 2025 2035
Baseline Tax Revenue
257 250
Pro-development Tax
Revenue
295 373
Regulatory constraints
Tax Revenue
224 232
Pro-development
change from Baseline
+38 +122
Regulatory constraints
change from Baseline
-33 -18
2015 2020 2025 2030 2035
350
400
300
250
200
100
150
$ B
illi
on
s, R
ea
l 2
01
5
Cumulative local, state, and federal taxes
at risk to 2035 is estimated at $1.6 trillion » Pro-development policies scenario upside, $1.1
trillion
» Regulatory constraints scenario downside, -$500
billion
* Total taxes includes government lease royalties, rents and bonus payments.

© Wood Mackenzie 13
Baseline Pro-development Regulatory constraints
Pro-development policies could reduce household energy bills by $360/yr*,
whereas regulatory constraints could increase these by $255/yr
EXECUTIVE SUMMARY
US Household Energy Cost per Household
$ Real 2015 2025 2035
Baseline energy cost
4,144 4,113
Pro-development
energy cost
3,975 3,753
Regulatory constraints
energy cost
4,369 4,355
Pro-development
change from Baseline
-169 -360
Regulatory constraints
change from Baseline
+255 +242
3,400
3,500
3,600
3,700
3,800
3,900
4,000
4,100
4,200
4,300
4,400
4,500
4,600
2015 2020 2025 2030 2035
$ R
ea
l 2
01
5
Pro-development policies could save the
average consumer household over 8 ½
percent a year in energy costs
Regulatory constraints could drive up the
average consumer household’s energy
costs by nearly 6 percent a year * Household energy costs include gasoline, electricity and natural gas.

© Wood Mackenzie 14
US policies and regulations are expected to have significant impacts on oil and
natural gas production, jobs, GDP, government revenue and consumer energy costs
If enacted, Pro-development policies could have the following impact by 2035*
» increase US energy security by increasing US oil and natural gas production by an additional 8
MMboed
» support US employment by an additional 2.3 million US jobs throughout the economy
» contribute to US GDP by an additional $443 billion /year
» increase total local, state, and federal government revenue by $122 billion / year, a cumulative
increase of $1.1 trillion from 2015 to 2035
» save the average US household $360 / year on energy expenses
Recent and proposed regulatory constraints are projected to by 2035*
» decrease US energy security by reducing US oil and natural gas production by 3.4 MMboed
» reduce the total employment supported by the oil and natural gas industry by 830 thousand jobs
» reduce contributions to the US economy by $133 billion / year (-$138 billion in 2025)
» decrease total local, state, and federal government revenue by $18 billion / year (-$33 billion in
2015), a cumulative reduction of $500 billion from 2016 to 2035
» increase average US household energy expenses by $255 / year
EXECUTIVE SUMMARY
Study Conclusions
* Relative to a Baseline forecast without these policies.

© Wood Mackenzie 15
Contents
2. Methodology
Executive summary
5. Refining implications
3. Supply implications
4. Midstream implications
6. Impacts on taxes, GDP, and US employment
1. Regulations overview and implications
Appendices
8. Study conclusions
7. Impacts on household consumption

© Wood Mackenzie 16
This study evaluates the positive impacts of pro-development policies and
the detrimental impacts of regulatory constraints
A ‘Pro-development’ upside scenario considers various policy measures to support growth
in oil and natural gas development and transportation
» This is intended to show the full potential of the US hydrocarbon reserves to contribute positively to
the growth of the US economy
A ‘Regulatory Constraints’ downside scenario reflects a combination of recently enacted
and proposed policy and regulatory changes which could inhibit oil and natural gas
development, transportation, and refining
» This is intended to illustrate the potential costs to the US economy associated with pursuing ever
more stringent regulation of the US oil and natural gas industries
Both upside and downside scenarios are compared to a Baseline forecast without these
policies
SCENARIO DEFINITION
Scenario Definition

© Wood Mackenzie 17
Pro-development oil and natural gas policies considered in each scenario
(1 of 2)
Policy / Regulation Pro Oil and Natural Gas
Development Policies Baseline
Recent and Proposed
Regulatory Constraints
Federal permitting rates and
policies in current
production areas
Permit and regulatory
policies encourage
accelerated development of
resources
State-level regulation of
resources and permitting
processes remain at current
levels
Current permitting process
remains in place, but future
developments subject to
various additional
regulations (see next
pages)
Access to new production
areas
Eastern Gulf of Mexico,
portions of the Rocky
Mountains, Atlantic OCS,
Pacific OCS, ANWR,
NPRA, Alaska offshore &
New York state all opened
up for leasing, drilling and
development activity
Various onshore and
offshore resources remain
closed to oil and gas
extraction
Same as Baseline
Cross-border Canadian oil
pipelines
Implementation of both
Keystone XL and Alberta
Clipper pipelines is
completed by 2018
No further cross-border
pipelines permitted
Same as Baseline
SCENARIO DEFINITION
Scenario

© Wood Mackenzie 18
Pro-development oil and natural gas policies considered in each scenario
(2 of 2)
Policy / Regulation Pro Oil and Natural Gas
Development Policies Baseline
Recent and Proposed
Regulatory Constraints
Crude exports – prohibited
except to Canada and other
limited exceptions
Export ban repealed 2016,
exports determined by the
market
Current restrictions remain
in place
Same as Baseline
Condensate exports –
restricted to processed
condensates only
No restrictions on exports
from 2016, which are
determined by the market
Current restrictions remain
in place
Same as Baseline
LNG exports – process
slowed by Dept. of Energy
approvals
All LNG terminals DOE
approved – exports
determined by market
LNG export capacity limited
to a maximum of 6 bcfd by
DOE/FERC approval
process
Same as Baseline
SCENARIO DEFINITION
Scenario

© Wood Mackenzie 19
Regulatory constraints considered in each scenario (1 of 3)
Policy / Regulation Pro Oil and Natural Gas
Development Policies Baseline
Recent and Proposed
Regulatory Constraints
Ozone Standards (EPA) Same as Baseline Ground-level ozone limits
remain at 75ppb level
Ground-level ozone limits
reduced to 65ppb
Enhanced Tank Car
Standards and Operational
Controls (PHMSA)
Same as Baseline 2014 standards for
transportation by rail of
flammable liquids are
retained
Implementation of finalized
rules for tighter standards
for transportation by rail of
flammable liquids
Methane emission
restrictions (EPA)
Same as Baseline Air emissions regulations
which restrict methane
emissions are applied only
to new unconventional gas
wells
Extension of air emissions
regulations to include all
new and existing
(producing) wells
Refining sector technology
and performance standards
(EPA)
Same as Baseline Current emissions
standards for hazardous air
pollutants from petroleum
refineries are retained
Implementation of proposed
amendments (40 CFR
Parts 60 and 63) to the
emission standards for
hazardous air pollutants for
petroleum refineries
SCENARIO DEFINITION
Scenario

© Wood Mackenzie 20
Regulatory constraints considered in each scenario (2 of 3)
Policy / Regulation Pro Oil and Natural Gas
Development Policies Baseline
Recent and Proposed
Regulatory Constraints
Renewable Fuel Standard
(EPA) Same as Baseline Blend composition of
biofuels in gasoline and
diesel remains constant
after 2015
E15 grows to 50% of the
market by 2020 and 100%
by 2030,
biodiesel increases to 5%
of ULSD pool*
New definition of Waters of
the USA (EPA) Same as Baseline No amendments to the
clean water act - EPA’s
current definition of the
Waters of the USA is
retained
Implementation of EPA’s
proposed introduction of the
‘significant nexus’ concept
to the definition of Waters of
the USA in the Clean Water
Act
Methane emission
restrictions (EPA)
Same as Baseline Air emissions regulations
which restrict methane
emissions are applied only
to new unconventional gas
wells
Extension of air emissions
regulations to include all
new and existing
(producing) wells
Hydraulic fracking standards
(BLM) - currently regulated
by states
Same as Baseline Continuation of 2014 state
regulations which restrict,
but do not inhibit hydraulic
fracturing on Federal and
Indian lands
Implementation of BLM’s
further regulation of
hydraulic fracturing on
Federal and Indian lands
(BLM – 43 CFR part 3160)
SCENARIO DEFINITION
* Volumes are below legislated targets.
Scenario

© Wood Mackenzie 21
Regulatory constraints considered in each scenario (3 of 3)
Policy / Regulation Pro Oil and Natural Gas
Development Policies Baseline
Recent and Proposed
Regulatory Constraints
Offshore Well Control Rule
(BSEE)
Same as Baseline Continuation of current
regulations governing new
offshore oil and gas
extraction
Implementation reforms to
blowout preventer
requirements, well design,
control and monitoring in
accordance with BSEE
NPRM 2015
Sage grouse listed under
Endangered Species Act
(FWS)
Same as Baseline No additions to the current
list of endangered species
and threatened wildlife
Addition of the greater
sage-grouse to the list of
endangered and threatened
wildlife
NEPA programmatic review
(CEQ)
Same as Baseline No changes to current
environmental permitting
requirements
Enforced use of
programmatic reviews for
all proposed new oil and
gas developments in
accordance with the
Memorandum for Heads of
Federal Departments and
Agencies, dated December
18, 2014
SCENARIO DEFINITION
Scenario

© Wood Mackenzie 22
Pro development policies have been assessed for their enabling impact
on key industry parameters
Policy Assumption Increases Acreage
Available
Reduces
Schedule
Reduces
Operator Costs
Creates new
markets
Increase Federal Permitting Rates
Onshore federal lands
Gulf of Mexico
New areas for exploration and development
Atlantic offshore
Pacific offshore
Eastern Gulf of Mexico
Alaska (ANWR, NPRA and offshore)
Remove restrictions in Federal Rockies
Repeal New York State hydraulic fracturing
ban
Approve Canadian oil pipelines
Repeal crude oil export ban
Market level of Condensate exports
Market level of LNG exports
IMPACT OF POLICIES AND REGULATIONS
*Refer to the Appendix for a detailed overview of the various policies and regulations and implications. Inhibiting resource development Enabling resource development

© Wood Mackenzie 23
With new regulatory constraints inhibiting resource development and
resulting in schedule and cost implications
Policy Assumption Reduces Acreage
Available
Increases
Schedule
Increases
Operator Costs
Increases
Consumer costs
Emissions regulations
Ozone regulations (EPA) X X X
Methane emissions restrictions (EPA) X
Refinery emissions restrictions and
measurements (EPA) X
Definition of Waters of the USA (EPA) X X
Sage grouse listed under Endangered
Species Act (FWS) X
Standards and technical regulations
Hydraulic fracking standards on federal lands
(BLM) X
Blow out preventer design and testing
standards (BSEE) X X
NEPA programmatic reviews (CEQ) X X
Rail car tank standards (PHMSA) X
Renewable Fuel Standards (EPA) X
IMPACT OF POLICIES AND REGULATIONS
*Refer to the Appendix for a detailed overview of the various policies and regulations and implications. Inhibiting resource development Enabling resource development

© Wood Mackenzie 24
Contents
2. Methodology
Executive summary
5. Refining implications
3. Supply implications
4. Midstream implications
6. Impacts on taxes, GDP, and US employment
1. Regulations overview and implications
Appendices
8. Study conclusions
7. Impacts on household consumption

© Wood Mackenzie 25
Each US and Canada oil and gas source is grouped into gas plays, oil plays
and other sources, and is projected in three sequential models
METHODOLOGY OVERVIEW
Offshore and Alaska supplies
are driven by long-term oil price
due to its long cycle time nature
Wood Mackenzie forecasts
supply level by each field in
current western and eastern
Gulf of Mexico and Alaska
Wood Mackenzie developed a
model to project oil and gas
production in new areas with
reserves assumptions from
other studies
Gas plays are mostly shale gas
plays with economics driven by
Henry Hub (HH) gas price, e.g.
Marcellus, Barnett, Haynesville
Play level gas supply is
forecasted based on each play’s
type curve, breakeven price,
well count, acreage, basis
assumptions
Gas model adjusts HH gas price
to balance North America gas
supply and demand, which
includes new LNG export
projects
Oil plays are mostly tight oil
plays with economics driven by
WTI oil price, e.g.
Bakken/Three Forks, Permian
unconventionals, Eagle Ford,
Niobrara
Play level oil supply is modeled
in the same methodology as
gas, based on assumed Brent
oil price outlook as defined in
Appendix A1
Offshore & Alaska Model Oil Model Gas Model
*Canadian oil supply is not forecasted in the model.
Conceptual Overview of Supply Modelling Approach

© Wood Mackenzie 26
HH Gas
Prices
WM’s integrated
O&G Supply Model
• Determine
lowest cost
future gas
supply sources
to meet gas
demand in
power (and
other sectors
Power sector
gas demand
WM’s Aurora*
Model
• Determine least
cost generation
mix to meet
future power
demand
METHODOLOGY OVERVIEW
Wood Mackenzie employs a series of proprietary optimization models to
determine impacts of costs in the power sector on natural gas prices
Illustrative Approach to Making Maximum Use of 3rd Party Studies
Future coal-
fired capacity
WM’s Prism
Model
• Determine
lowest cost of
compliance via
combination of
retrofit and
retirement
Compliance costs from
NERA study
* WM’s Aurora model combines 3rd party dispatch algorithms with our own proprietary data on the installed fleet of power generation capacity.

© Wood Mackenzie 27
Wood Mackenzie has assessed the impact of a number of opportunities
where changes to Baseline could support US oil and gas production growth
Policy Assumption Baseline Pro-development Comments re pro-development
Current production areas
Onshore federal lands No changes to current BLM hydraulic fracking regulation
Gulf of Mexico Permit and regulatory policies allow for faster development
New areas for expl. & devt.
Atlantic offshore Leasing, drilling and devt activity starts in 2016
Pacific offshore Leasing, drilling and devt activity starts in 2016
Eastern Gulf of Mexico Leasing, drilling and devt activity starts in 2016
Alaska Leasing, drilling and devt activity starts in 2016
Federal Rockies Current regulatory hurdles removed in 2016
New York State Leasing, drilling and devt activity starts in 2016
Canadian oil pipelines KXL passed in 2016 - Canadian production grows faster
Crude oil exports Full lifting of the export ban in 2016
Condensate exports Full lifting of the export ban in 2016
LNG exports Faster permitting encourages >6 bcfd of LNG exports
PRO-DEVELOPMENT SCENARIO - POLICY ASSUMPTIONS
prohibited inhibited supported * More detailed assumptions provided in the Appendix.

© Wood Mackenzie 28
Reduces
acreage
available
Sage grouse listed under
Endangered Species Act (FWS)
Severely restricts potential acreage available for drilling in Colorado, Utah, and
Wyoming
Ozone regulations (EPA)
– Upstream
Operators are unlikely to be able to buy credits from other industries in some
remote areas (e.g. West Texas, Oklahoma), effectively restricting acreage
Definition of Waters of the USA
(EPA)
Higher hydraulic fracking costs in some areas inhibit drilling, effectively
restricting available acreage
Hydraulic fracking standards on
federal lands (BLM)
Inhibits ability to economically drill on federal lands, effectively restricting
available acreage
Blow out preventer design and
testing standards (BSEE)
Lower development drilling for under development fields and probable
development fields, lower exploration drilling for all Yet-to-Find reserves
Increases
schedule
NEPA programmatic reviews (CEQ)
– Onshore Onshore play reaching peak activity is delayed by 2 years
NEPA programmatic reviews (CEQ)
– Offshore Current probable fields in Gulf of Mexico start-up are delayed by 2 years
Blow out preventer design and
testing standards (BSEE)
Some otherwise attractive technical fields in Gulf of Mexico become
uneconomic to develop
Increases
operator
costs
Ozone regulations (EPA)
– Upstream
Upstream companies either have to invest in mitigation equipment or buy
credit from other industries in the same area
Ozone regulations (EPA)
– Midstream
Midstream companies have to invest in mitigation equipment, which results in
higher pipeline tariff for upstream operators
Rail car tank standards (PHMSA) Higher transportation cost for Bakken/Three Forks plays
Each regulatory constraint is assessed separately on its impact on
investment timing, acreages, cost and upstream activity
METHODOLOGY OVERVIEW

© Wood Mackenzie 29
Wood Mackenzie used IMPLAN to assess potential economic impacts of
different activity, capex, and revenue levels throughout the energy value chain
METHODOLOGY OVERVIEW
Upstream Midstream Downstream
Wood Mackenzie proprietary data on
production revenues, opex and capex
Customized IMPLAN models
GDP State and
Federal Tax Employment
Wood Mackenzie’s proprietary data is
entered into models using the IMPLAN
framework. These US models cover all 50
states and are highly customized to reflect
Wood Mackenzie’s industry cost data. Then
jobs, GDP and tax impacts are estimated
by state
The IMPLAN approach is the industry
standard for economic impact assessments
» Extensive datasets
» Customizable models
Modelling outputs are split into:
» Direct – impacts from development
and production in upstream,
midstream and downstream
» Indirect – impacts from the supply
chain for the direct industries
» Induced – impacts from spending of
those employed directly and indirectly

© Wood Mackenzie 30
Contents
2. Methodology
Executive summary
5. Refining implications
3. Supply implications
4. Midstream implications
6. Impacts on taxes, GDP, and US employment
1. Regulations overview and implications
Appendices
8. Study conclusions
7. Impacts on household consumption

© Wood Mackenzie 31
Pro-development policies could increase oil production by 5.7 MMbbld* by
2035, while production loss from regulatory constraints peaks at 2 MMbbld
SUPPLY IMPLICATIONS
Oil Supply, Baseline, Pro-development Policies, Regulatory Constraints Scenarios
9.2010.18
7.58
1.50
1.80
1.46
0
2
4
6
8
10
12
14
16
18
Base Reg.
Cons.
Pro-
dev.
Base
0.29
Reg.
Cons.
Pro-
dev.
0.35
0.41
Base
MM
bb
ld
+0.75
+1.12
+1.90
+1.94
2035
+5.71
*MMbbld is million barrels per day
2025
+0.83
+0.38
+0.51
+2.16
0
2
4
6
8
10
12
14
16
18
2015 2020 2025 2030 2035M
Mb
bld
-1.57
-0.39
-1.95
-0.75
-0.27
-1.02
Baseline Pro-development Regulatory constraints Onshore US Lower 48 Gulf of Mexico
Offshore (East &West Coast) Alaska
2015
9.46 12.32 14.48 10.37 9.98 16.71 11.00
Access to new development
areas could allow US oil
production to continue to
increase through 2035
Regulatory constraints could
restrict oil production to
near current level

© Wood Mackenzie 32
Gas production growth in the future is expected to continued to be driven
by onshore lower 48 shale gas supply
SUPPLY IMPLICATIONS
Gas Supply, Pro-development Policies, Regulatory Constraints Scenarios
99.02
67.18
3.31
0.88
0.88
0.92
0
10
20
30
40
50
60
70
80
90
100
110
120
130
140
bcfd
*
3.56
Reg.
Cons.
Pro-
dev.
Base
111.73
Reg.
Cons.
Pro-
dev.
Base Base
2.47
*bcfd is billion cubic feet per day
+1.62
+3.08
2025
+1.30
+2.51 +4.96
+11.59
2035
0
10
20
30
40
50
60
70
80
90
100
110
120
130
140
2015 2020 2025 2030 2035b
cfd
-2.75
-0.47 -3.22
-10.61
-11.30
Anticipated coal-fired generation retirements
due to the proposed Ozone Rule are expected
to increase demand for natural gas and
partially offset potential production reductions
in the regulatory constrained scenario
Baseline Pro-development Regulatory constraints Onshore US Lower 48 Gulf of Mexico
Offshore (East &West Coast) Alaska
2015
+2.82
71.66 102.37 104.93 99.15 104.62 124.69 115.92 Us natural gas production is
anticipated to grow in all
scenarios

© Wood Mackenzie 33
Pro-development policies could increase NGL production by 0.3 MMbbld in
2035, while regulatory constraints could reduce NGLs by nearly 0.4 MMbbld
SUPPLY IMPLICATIONS
NGLs Supply, Pro-development Policies, Regulatory Constraints Scenarios
6.0
5.5
5.0
4.5
4.0
3.5
3.0
2.5
2.0
1.5
1.0
0.5
0.0
7.0
6.5
MM
bb
ld
Base Pro-
dev.
Reg.
Cons.
Base Pro-
dev.
Reg.
Cons.
Base
*MMbbld is million barrels per day
-0.11 -0.38
2015 2020 2025 2030 2035
6.0
5.5
5.0
4.5
4.0
3.5
3.0
2.5
2.0
1.5
1.0
0.5
0.0
7.0
6.5
MM
bb
ld
Baseline Pro-development Regulatory constraints
3.13 5.05 5.17 4.94 5.09 5.78 5.47
+0.12
2025
+0.31
2035 2015
NGL production increases in all scenarios
but by 2035 it is anticipated to be 6% higher
than the Baseline forecast with pro-
development policies or 7% lower with
regulatory constraints

© Wood Mackenzie 34
Pro-development policies could increase production by 8.0 MMboed by 2035,
while production loss from regulatory constraints peaks at 3.4 MMboed
SUPPLY IMPLICATIONS
Combined Oil, Gas and NGLs Supply, Baseline, Pro-development, Regulatory constraints Scenarios
0
5
10
15
20
25
30
35
40
45
Reg.
Cons.
Pro-
dev.
Base Base Reg.
Cons.
Pro-
dev.
Base
MM
bb
ld
2035
+8.02
*MMboed is million barrels of oil equivalent per day
2025
+2.81
2015 2020 2025 2030 2035
0
5
35
30
20
40
15
45
25
10
MM
bo
ed
-2.61
-3.35
Baseline Pro-development Regulatory constraints
2015
24.93 35.02 37.83 32.41 33.11 44.47 36.46

© Wood Mackenzie 35
To bring projected production onstream in new areas, significant
investment could be required for exploration and development expenditure
SUPPLY IMPLICATIONS
260
204
112
17
11
$400
$350
$300
$250
$200
$150
$100
$50
0
3
Base
$ B
illio
ns, R
eal 2015
Reg.
Cons.
Pro-
dev.
Base
2 1
Reg.
Cons.
Pro-
dev.
Base
11
2015 2020 2025 2030 2035
$300
$250
$200
$150
$100
$50
0
$400
$350
$ B
illio
ns, R
eal 2015
+23
+13
+26
+36
+36
+112
-16
-5
-21
-21
-1
-22
Upstream Capital Expenditures, Basline, Pro-development Policies, Regulatory Constraints Scenarios
*Alaska upstream capex in the pro-development policies scenario includes the pipeline investments required to monetize the gas supply upside, and Alaska is not directly affected
by regulatory constraints specified in this study.
Baseline Pro-development Regulatory constraints Onshore US Lower 48 Gulf of Mexico
Offshore (East &West Coast) Alaska
+19
+8
+10 +60
+22
2025 2035
132 225 285 207 241 349 263
2015

© Wood Mackenzie 36
Contents
2. Methodology
Executive summary
5. Refining implications
3. Supply implications
4. Midstream implications
6. Impacts on taxes, GDP, and US employment
1. Regulations overview and implications
Appendices
8. Study conclusions
7. Impacts on household consumption

© Wood Mackenzie 37
Midstream investment requirements are expected to be significantly
impacted by the future regulatory environment
Midstream Sector Pro-development
policies Baseline Regulatory constraints
Crude oil pipelines Includes Keystone XL and
Alberta Clipper plus all
pipeline projects in Wood
Mackenzie base case
Includes pipeline projects in
Wood Mackenzie base case
that do not cross
international borders
Includes pipeline projects in
Wood Mackenzie base case
that do not cross international
borders
Natural gas pipelines Includes all projects in Wood
Mackenzie base case plus
required capacity to support
new production areas
Includes all announced
projects in Wood Mackenzie
base case
Excludes pipelines originating
in the midcontinent that are
no longer required
LNG export facilities Includes all announced
projects
Includes only projects
currently approved
Same as Baseline
Storage Built as needed to support
production and transportation
growth
Built as needed to support
production and transportation
growth
Built as needed to support
production and transportation
growth
Gathering and
processing
Built as needed to support
production growth
Built as needed to support
production growth
Built as needed to support
production growth
Rail Same as Baseline PHMSA’s current standards
for transportation by rail of
flammable liquids are
retained
Implementation of PHMSA’s
proposals for tighter
standards for transportation
by rail of flammable liquids
MIDSTREAM IMPLICATIONS

© Wood Mackenzie 38
The development of new offshore areas could require capex of more than
$500 billion by 2035 for gathering, processing, trunk-lines, and storage
MIDSTREAM IMPLICATIONS – PRO-DEVELOPMENT POLICY IMPACTS
North Atlantic
Atlantic
SouthAtlantic
Gulf
SouthernCalifornia
CentralCalifornia
NorthernCalifornia
Washington /
Straits of Florida
UNITED STATES OF AMERICA
CANADA
MEXICO
Atlantic OCS
Pacific OCS
Oregon
GulfEastern
Western
Mid-
GulfCentral
Rockies Region New York State
Enbridge Northern Gate
way
TMX E
xpan
sion
TMX
Northern Leg
Ke
ysto
ne
Cushing
Edmonton
Hardisty
60°W
75°W
75°W
90°W
90°W
105°W
105°W
120°W
120°W135°W
45°N
45°N
30°N 30°N
15°N
15°N
0 500 1,000250km
Source: Wood Mackenzie
AlaskaC
AN
AD
A
NPRA
ANWR
BeaufortChukchi
Alaska Planning Areas
Development in the
South and Mid
Atlantic will require
>$100 billion of
capex to support
0.9 MMboed
production by 2035
Development in the
Pacific coastal
areas will require
>$200 billion of
capex over the next
20 years to support
1.6 MMboed
production by 2035
Development of the
Eastern GOM will
require >$200
billion of capex to
achieve 1.4
MMboed support
GOM production by
2035
Offshore Developments and Corresponding Infrastructure Requirements

© Wood Mackenzie 39
Approval of TransCanada’s and Enbridge’s crude oil trunkline projects
could result in significant additional capital expenditures in the US
MIDSTREAM IMPLICATIONS – PRO-DEVELOPMENT POLICY IMPACTS
Once construction is complete,
revenue from throughput, ongoing
operating expenses, and operational
jobs contribute to economic benefits
both locally and nation-wide
Hardisty
Cushing
Flanagan
Routing of Proposed Crude Oil Pipeline from Canada
Increasing capacity of
the Enbridge mainlines
via the Alberta Clipper
project is expected by
Wood Mackenzie to
result in $0.5 billion
additional capex spend
in the United States
Wood Mackenzie
estimates that
construction of the
northern portion of the
Keystone XL pipeline
could result in up to $3.4
billion of direct capex
spending in the US*
*TransCanada and Enbridge company websites

© Wood Mackenzie 40
More than 30 bcfd of LNG exports have been proposed – of this we assume
16 bcfd comes to fruition, beating competing international projects to market
MIDSTREAM IMPLICATIONS – PRO-DEVELOPMENT POLICY IMPACTS
LNG Exports FERC Approval Queue
0
50
100
150
200
250
300
Approved H1 15 H2 15 2016 Post 2016
12 bcfd
20 bcfd
FERC
received
FERC main
filed**
FERC pre-
filed
No FERC
filing
0
2
4
6
8
10
12
14
16
18
2015 2020 2025 2030 2035
bc
fd
Baseline Pro-development Policies
The pro-development
case includes almost
10 bcfd incremental
LNG exports; pushing
out less competitive
projects in East Africa
and Australia MM
TP
A*
*MMTPA is million metric tonne per annum
**Proposed LNG export projects include
FERC main filed: Jordan Cove, Sabine Pass 3, Oregon, Lacaca, Elba Island, Lake Charles, Magnolia, Golden Pass;
FERC pre-filed: Louisiana, Gulf, Alaska, Downeast, CE, Venture, Cameron Expansion
No FERC filling: Annova, Barca, Delfin, Eos, Gasfin, Gulf Coast, MPEH*, South Texas, Texas, Waller Point, SCT&E, Alturas, Live Oak, Pelican, Cameron exp.

© Wood Mackenzie 41
Regulations impacting railcar transportation could dramatically increase
the cost of railing inland crude production to coastal refining centers
MIDSTREAM IMPLICATIONS – REGULATORY CONSTRAINTS IMPACTS
Bakken
St. James Houston
Crude by Rail Costs* Bakken vs. Baseline, 2025 ($2015 real)
+$3/bbl
+$3.5/bbl
+$4/bbl
+$4/bbl
Railcar modifications will
increase the cost of leasing or
purchasing railcars, while
speed restrictions will result in
a longer transit time to market
Requirement Impact
Retrofitting of
existing rail car fleet
Additional cost to railcar
owners
Equipping qualifying
trains with ECP
brake systems
Additional cost to rail car
owners and railroads
(locomotives must be modified
in addition to rail cars
Speed limit
restrictions
Longer transit times and higher
cost to railroad companies to
transport crude
*Includes railroad tariffs and tank car leasing costs; excludes terminalling.

© Wood Mackenzie 42
Existing and planned inter-state crude oil trunklines are expected to be
sufficient in all three scenarios for the Bakken and Eagle Ford
Key tight oil
play Takeaway Options
Pro-development
policies Baseline
Regulatory
constraints
Bakken Average pipeline takeaway
volumes, 2015-2025 758 kbd 725 kbd 757 kbd
Average rail takeaway
volumes, 2015-2025 1,085 kbd 1,016 kbd 931 kbd
Maximum pipeline takeaway
volumes 930 kbd 819 kbd 823 kbd
Maximum rail takeaway
volumes 1394 kbd 1,302 kbd 1,130 kbd
2015 pipeline and local
refinery takeaway capacity - 827 kbd -
2015 rail takeaway capacity - 1,490 kbd -
Takeaway capacity added Sandpiper + 100 kbd of
Keystone XL
Sandpiper pipeline, 225
kbd in 2018 Same as Baseline
Eagle Ford Average pipeline takeaway
volumes, 2015-2025 1,925 kbd 1,689 kbd 1,685 kbd
Maximum pipeline takeaway
volumes 2,227 kbd 1,971 kbd 1,941 kbd
2015 pipeline and local
refinery takeaway capacity - 2,010 kbd -
Takeaway capacity added Rio Bravo + expansion
(100 kbd total, Victoria
express expansion (50
kbd), call on additional pipe
Rio Bravo 50 kbd in 2016 Same as Baseline
MIDSTREAM IMPLICATIONS

© Wood Mackenzie 43
The Permian is expected to need new takeaway capacity by 2021 with pro-
development policies; regulatory constraints could delay this until 2030
Key tight oil
play Takeaway options
Pro-development
policies Baseline
Regulatory
constraints
Niobrara Average pipeline takeaway
volumes, 2015-2025 206 kbd 205 kbd 54 kbd
Average rail takeaway
volumes, 2015-2025 110 kbd 59 kbd 2 kbd
Maximum pipeline takeaway
volumes 210 kbd 210 kbd 152 kbd
Maximum rail takeaway
volumes 161 kbd 80 kbd 38 kbd
2015 pipeline and local
refinery takeaway capacity - 460 kbd* -
2015 rail takeaway capacity - 180 kbd -
Takeaway capacity added Same as Baseline
Saddlehorn pipeline, 200
kbd 2017 Same as Baseline
Permian Average pipeline takeaway
volumes, 2015-2025 2,654 kbd 2,606 kbd 2,318 kbd
Maximum pipeline takeaway
volumes 2,918 kbd 2,818 kbd 3,010 kbd
2015 pipeline and local
refinery takeaway capacity - 2,265 kbd -
Takeaway capacity added
Same as Baseline, new
capacity required by 2021
Permian Exp. Phase 2,
250 kbd 2016, Cactus
expansion +80 2018, new
capacity required by 2023
Same as Baseline, new
capacity required by 2030
MIDSTREAM IMPLICATIONS
*Includes pipelines carrying non-Niobrara crude.

© Wood Mackenzie 44
Required investments in inter-state natural gas pipelines are substantial in all scenarios but are higher in the pro-development scenario and lower with regulatory constraints
MIDSTREAM IMPLICATIONS
Announced Nat. Gas Pipeline Projects, Cumulative* Implied natural gas pipeline projects
Wood Mackenzie’s expectations for the timing,
likelihood, and capacity of announced natural gas
pipelines did not change across scenarios
60
50
40
30
20
10
0
80
70
2035 2030 2025 2020 2015
bc
fd
Takeaway
options
Pro-
development
policies
Baseline Regulatory
constraints
Marcellus
Southwest &
Utica Supply
Same as
Baseline
20.1 bcfd by
2026
Same as
Baseline
Marcellus
Northeast
5.2 bcfd by
2019
8.2 bcfd by
2022
Same as
Baseline
US Gulf Coast
LNG Exports
11.6 bcfd by
2033
7.1 bcfd by
2018
Same as
Baseline
Mid-Continent
Supply
2.6 bcfd by
2028
1.6 bcfd by
2028 1 bcfd by 2028
Rockies Supply 5.8 bcfd by
2033
5.0 bcfd by
2033 Not required
Gulf Coast
Markets
Same as
Baseline
0.2 bcfd by
2023
3.7 bcfd by
2033
US Northeast
LNG Exports
0.7 bcfd by
2019 Not required Not required
US West Coast
LNG Exports
1.7 bcfd by
2022 Not required Not required
*Includes expected pipelines projects assumed my Wood Mackenzie.

© Wood Mackenzie 45
Cumulative midstream capex is expected to be $118 billion higher through 2035 in
the pro-development scenario and $171 billion lower under regulatory constraints
MIDSTREAM IMPLICATIONS
0
5
10
15
20
25
30
35
40
45
50
55
60
$ B
illio
ns, R
eal 2015
Pro-
dev.
Pro-
dev.
Base Base Reg.
Cons.
Reg.
Cons.
20
25
30
35
40
45
50
55
60
2015 2020 2025 2030 2035$ B
illio
ns, R
eal 2015
Baseline Pro-development Regulatory constraints
+5 +4 -8 -12
The peaks and troughs across the
projection period are caused by pipeline
and LNG projects additions and
cancellations in two alternative scenarios
2015 2025 2035
38 45 50 37 38 54 50
Midstream (incl. LNG) Capital Expenditures, Baseline, Pro-development Policies, Regulatory Constraints Scenarios

© Wood Mackenzie 46
Contents
2. Methodology
Executive summary
5. Refining implications
3. Supply implications
4. Midstream implications
6. Impacts on taxes, GDP, and US employment
1. Regulations overview and implications
Appendices
8. Study conclusions
7. Impacts on household consumption

© Wood Mackenzie 47
Policies impacting the refining sector
Downstream drivers Pro-development
implications
Baseline
implications
Regulatory
constraints
implications
Renewable Fuels Standard Same as Baseline No further destruction of
refinery-produced
transportation fuel
demand
Aggressive enforcement
increases refiner
compliance costs and
decreases product
demand
Emissions monitoring
(Refinery Sector Rule,
Ozone Regulations,
Methane Emission
Restrictions)
Same as Baseline No impact – not under
enforcement
Lowers achievable
throughput to maintain
compliance
Natural gas, power and
crude oil prices
Lower natural gas and
power prices decrease
refinery operating costs
vs Baseline. Modest
impacts to refinery
margins
Gradually rising natural
gas and power prices
increase refinery
operating costs over time
Higher natural gas and
power prices increase
refinery operating costs
vs. Baseline
REFINING IMPLICATIONS
© Wood Mackenzie 48
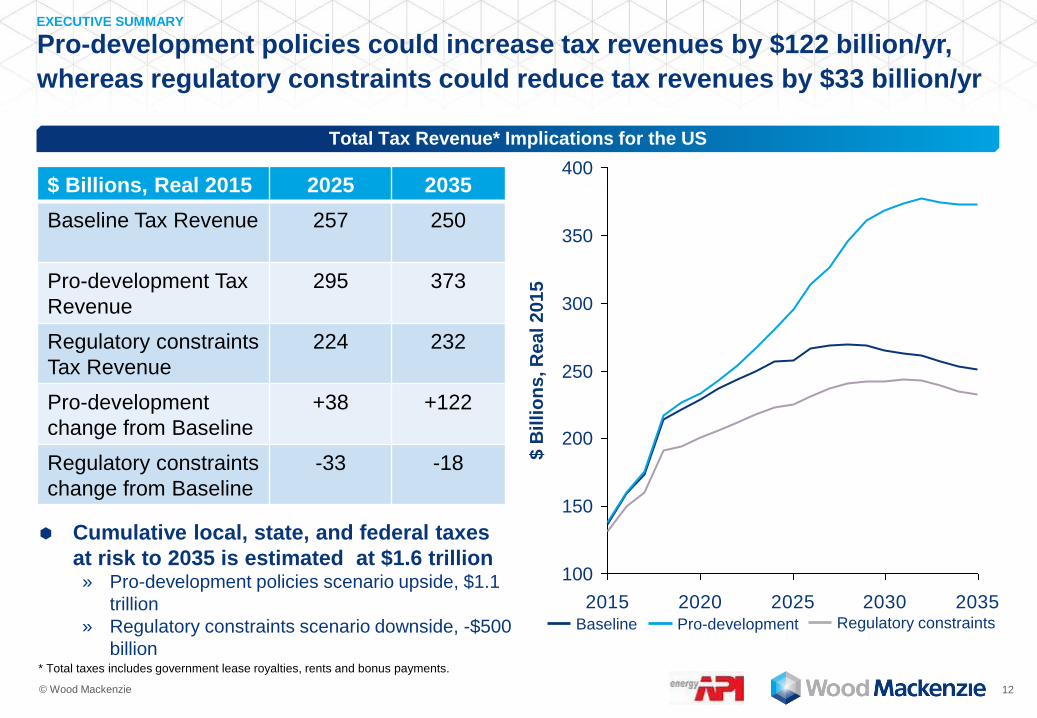
In the regulatory constraints case, refiners are negatively impacted by
lowered demand, increased compliance costs, and narrower differentials
REFINING IMPLICATIONS
2025 Utilization Forecast
81
9090
83
92
77
858687
79
0
10
20
30
40
50
60
70
80
90
100
Cale
nd
ar
day u
tili
za
tio
n (
%)
PADD 5 PADD 4 PADD 3 PADD 2 PADD 1
Baseline utilization Regulatory constraints utilization

© Wood Mackenzie 49
Regulatory constraints decrease refinery production of finished products in
all PADDs relative to the Baseline case
REFINING IMPLICATIONS
Change in 2025 Production of Gasoline and Diesel* Regulatory Constraints vs. Baseline
PADD 3
PADD 1
PADD 2
-7
-11-12
-10
-8
-6
-4
-2
0kb
d
Diesel Gasoline
PADD 4
-111
-156
-200
-150
-100
-50
0
Diesel Gasoline
kb
d
-42
-72
-100
-80
-60
-40
-20
0
kb
d
Diesel Gasoline
-13
-21-25
-20
-15
-10
-5
0
Gasoline Diesel
kb
d
-24
-49-50
-40
-30
-20
-10
0
Diesel Gasoline
kb
d
PADD 5
*kbd is thousand barrels per day
**includes gasoil
Baseline: 541 kbd 349 kbd
Baseline: 1894 kbd 1098 kbd
Baseline: 4075 kbd 2890 kbd
Baseline: 296 kbd 194 kbd
Baseline: 1282 kbd 624 kbd

© Wood Mackenzie 50
Contents
2. Methodology
Executive summary
5. Refining implications
3. Supply implications
4. Midstream implications
6. Impacts on taxes, GDP, and US employment
1. Regulations overview and implications
Appendices
8. Study conclusions
7. Impacts on household consumption

© Wood Mackenzie 51
Pro-development policies could support an additional +2.3 million US jobs
by 2035
IMPACTS ON TAXES, GDP, AND US EMPLOYMENT
Jobs Impacts Pro-development policies result in
average of 1.1 million jobs more per
year relative to the Baseline (2016-
2035)* This includes direct, indirect
and induced jobs
Additional jobs are concentrated in the
2nd half of the forecast period, as
offshore production ramps up in “new
areas” and Alaska
Jobs (Millions)
11
10
9
8
7
6
5
4
3
2
1
0
Millio
ns
2035 2030 2025 2020 2015
2025 2035 Max differential in
2035
Pro-
development 9.02 10.22 10.22
Baseline 8.03 7.94 7.94
Difference 0.99 2.28 2.28
Baseline Upstream Midstream Refining
*Refer to Appendix for direct, indirect and induced jobs breakout.

© Wood Mackenzie 52
Pro-development policies could contribute an additional $440 billion per
year to US GDP
IMPACTS ON TAXES, GDP, AND US EMPLOYMENT
GDP Impact Annual GDP is approx. $198 billion
higher on average (2016 – 2035) under
the pro-development policies
Towards the end of the forecast period,
national GDP supported by the oil and
gas industry is about $440 billion
higher
$1,800
$1,000
$1,600
$1,400
$1,200
$800
$600
$400
$200
0
$ B
illi
on
s, R
eal 2015
2035 2030 2025 2020 2015
GDP ($ Billions, Real 2015)
2025 2035 Max differential in
2035
Pro-
development 1,502 1,755 1,755
Baseline 1,339 1,312 1,312
Difference 163 443 443
Baseline Upstream Midstream Refining
© Wood Mackenzie 53
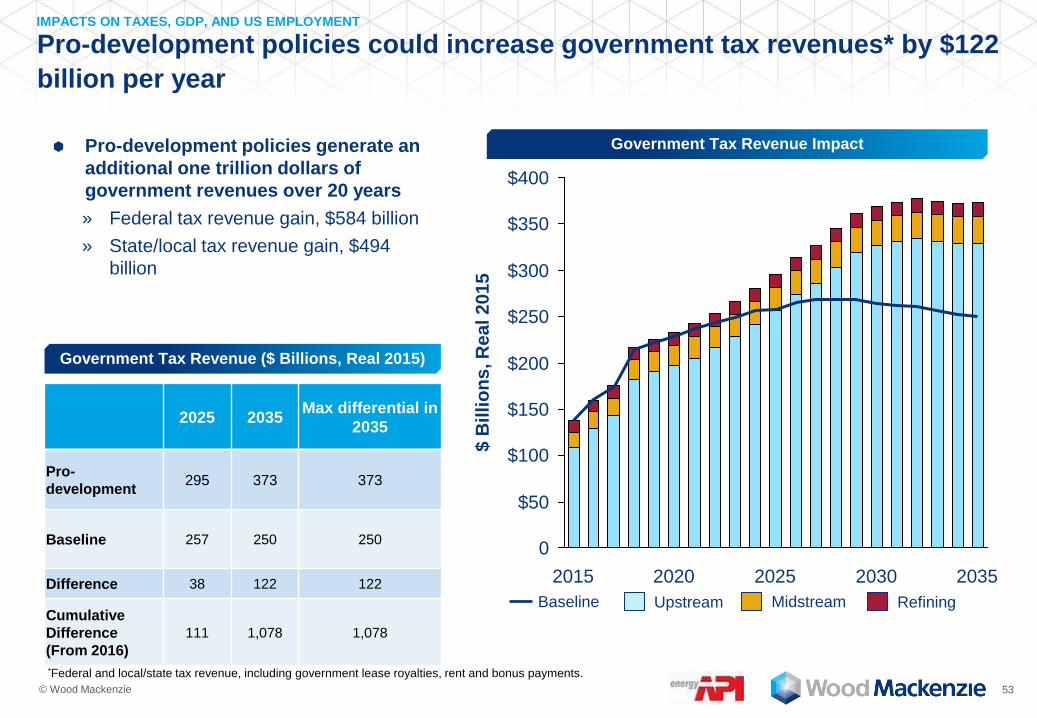
Pro-development policies could increase government tax revenues* by $122
billion per year
IMPACTS ON TAXES, GDP, AND US EMPLOYMENT
Government Tax Revenue Impact Pro-development policies generate an
additional one trillion dollars of
government revenues over 20 years
» Federal tax revenue gain, $584 billion
» State/local tax revenue gain, $494
billion
$400
$350
$300
$250
$200
$150
$100
$50
0
$ B
illi
on
s, R
ea
l 2
01
5
2035 2030 2025 2020 2015
*Federal and local/state tax revenue, including government lease royalties, rent and bonus payments.
Government Tax Revenue ($ Billions, Real 2015)
2025 2035 Max differential in
2035
Pro-
development 295 373 373
Baseline 257 250 250
Difference 38 122 122
Cumulative
Difference
(From 2016)
111 1,078 1,078
Baseline Upstream Midstream Refining

© Wood Mackenzie 54
Economic benefits of pro-development policies are expected to be
concentrated in areas close to new offshore fields
IMPACTS ON TAXES, GDP, AND US EMPLOYMENT
Incremental Jobs vs Baseline Incremental GDP vs Baseline
East Coast North Central South Central Rockies West Coast Alaska
0.0
0.5
1.0
1.5
2.0
2.5
2015 2020 2025 2030 2035
Mil
lio
n
$0
$50
$100
$150
$200
$250
$300
$350
$400
$450
$500
2015 2020 2025 2030 2035
$ B
illi
on
, R
ea
l 2
01
5
East Coast: ME, NH, VT, MA, CT, RI, NY, PA, NJ, MD, DC, DE, VA, WV, NC, SC, GA, FL; North Central: ND, SD, NE, KS, MN, IA, MO, WI, IL, MI, IN, OH;
South Central: TX, OK, AR, LA, KY, TN, MS, AL; Rockies: MT, ID, WY, NV, UT, CO, AZ, NM; West Coast: WA, OR, CA

© Wood Mackenzie 55
Regulatory constraints could cost up to 900,000 US jobs IMPACTS ON TAXES, GDP, AND US EMPLOYMENT
Jobs Impacts Regulatory constraints result in
average 720 thousand fewer jobs per
year (2016-2035) than in the Baseline.
This includes direct, indirect and
induced jobs
Reduced employment is significant
across the forecast period, primarily
reflecting lower oil production
11
10
6
9
7
8
3
1
2
5
4
0
Millio
ns
2035 2030 2025 2020 2015
Jobs (Millions)
2025 2035 Max differential in
2027
Regulatory
constraints 7.23 7.11 7.21
Baseline 8.03 7.94 8.12
Difference -0.80 -0.83 -0.91
Baseline Upstream Midstream Refining
*Refer to Appendix for direct, indirect and induced jobs breakout.
© Wood Mackenzie 56
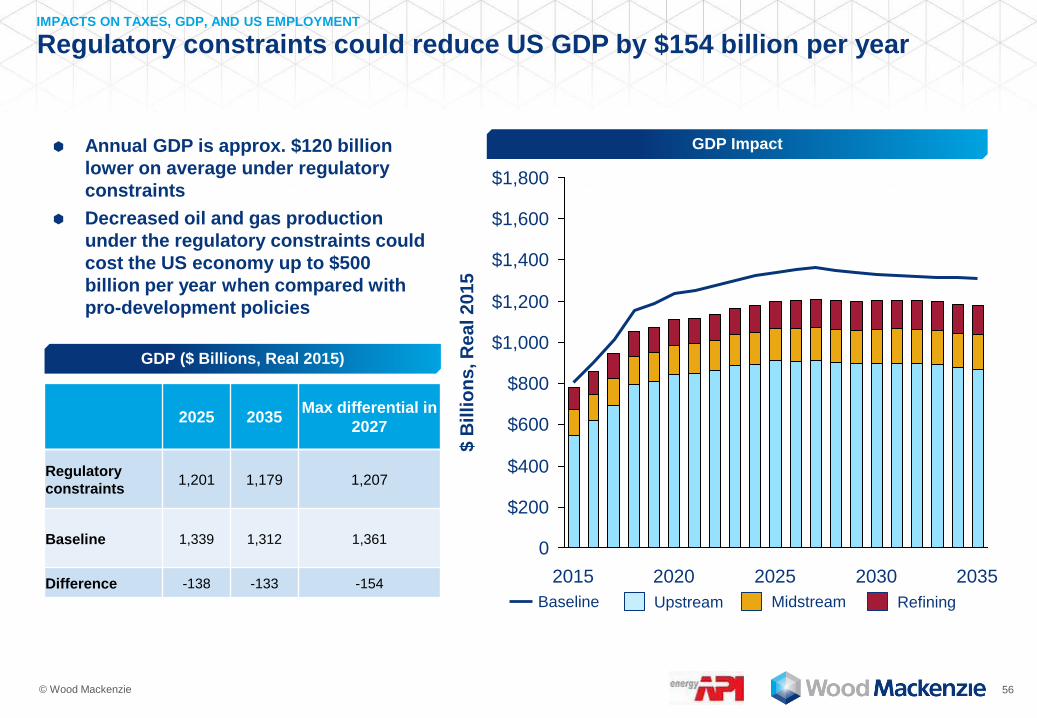
Regulatory constraints could reduce US GDP by $154 billion per year IMPACTS ON TAXES, GDP, AND US EMPLOYMENT
GDP Impact Annual GDP is approx. $120 billion
lower on average under regulatory
constraints
Decreased oil and gas production
under the regulatory constraints could
cost the US economy up to $500
billion per year when compared with
pro-development policies
$1,800
$1,600
$1,400
$1,200
$1,000
$800
$600
$400
$200
0
2035 2030 2025
$ B
illi
on
s, R
eal 2015
2020 2015
GDP ($ Billions, Real 2015)
2025 2035 Max differential in
2027
Regulatory
constraints 1,201 1,179 1,207
Baseline 1,339 1,312 1,361
Difference -138 -133 -154
Baseline Upstream Midstream Refining

© Wood Mackenzie 57
Regulatory constraints could reduce tax revenues by $500 billion over the
next 20 years
IMPACTS ON TAXES, GDP, AND US EMPLOYMENT
Government Tax Revenue Impact Regulatory constraints could costs the
government almost $500 billion in lost
revenues over 20 years when
compared with the Baseline
» Federal tax revenue loss, $262 billion
» State/local tax revenue loss, $236
billion
$50
0
$100
$150
$250
$200
$300
$350
$400
2020 2015 2025 2030 2035
$ B
illi
on
s, R
ea
l 2
01
5
Government Tax Revenue ($ Billions, Real 2015)
2025 2035 Max differential*
in 2026
Regulatory
constraints 224 232 231
Baseline 257 250 266
Difference -33 -18 -35
Cumulative
Difference
(From 2016)
-262 -499 -297
Baseline Upstream Midstream Refining

© Wood Mackenzie 58
Regulatory constraints are expected to be felt most heavily in the Rockies
and Gulf Coast
IMPACTS ON TAXES, GDP, AND US EMPLOYMENT
Incremental Jobs vs Baseline Incremental GDP vs Baseline
East Coast North Central South Central Rockies West Coast Alaska
-1.0
-0.9
-0.8
-0.7
-0.6
-0.5
-0.4
-0.3
-0.2
-0.1
0.0
2015 2020 2025 2030 2035
Mil
lio
n
-$180
-$160
-$140
-$120
-$100
-$80
-$60
-$40
-$20
$0
2015 2020 2025 2030 2035
$ B
illi
on
, R
ea
l 2
01
5
East Coast: ME, NH, VT, MA, CT, RI, NY, PA, NJ, MD, DC, DE, VA, WV, NC, SC, GA, FL; North Central: ND, SD, NE, KS, MN, IA, MO, WI, IL, MI, IN, OH;
South Central: TX, OK, AR, LA, KY, TN, MS, AL; Rockies: MT, ID, WY, NV, UT, CO, AZ, NM; West Coast: WA, OR, CA

© Wood Mackenzie 59
Contents
2. Methodology
Executive summary
5. Refining implications
3. Supply implications
4. Midstream implications
6. Impacts on taxes, GDP, and US employment
1. Regulations overview and implications
Appendices
8. Study conclusions
7. Impacts on household consumption

© Wood Mackenzie 60
Wood Mackenzie assessed direct impacts of gasoline, electricity and natural
gas price changes on household consumption of other goods and services
IMPACTS ON HOUSEHOLD CONSUMPTION
Net savings/ gains on energy and fuel
expenditure assumed to be spent on other
goods and services. No impact on
household savings rate
Modelling of
the
downstream
impacts
Household
energy / fuel
expenditure
Demand
assumed to be
insensitive to
price in all three
cases
Gasoline price
Electricity
price
Natural gas
price
Household
gasoline
demand
Household
electricity
demand
Household
natural gas
demand
X
X
X
Household
consumption
of all other
goods and
services
Assumptions
Methodology
repeated for Pro-
development,
Baseline and
Regulatory
constraints
Henry Hub gas
price converted
to residential
delivered price
Approach to Determining Direct Impacts on Household Consumption

© Wood Mackenzie 61
Illustrative Approach to Evaluating impacts on Brent Price
75
85
95
105
115
125
90 91 92 93 94 95 96 97 98 99 100
$/b
bl,
Re
al 2
01
5
MMbbld
Non-OPEC base case supply stack Non-OPEC oil demand US Tight Oil Export
Wood Mackenzie used an assessment of marginal supply economics to
estimate Brent price impacts of incremental US oil supply
IMPACTS ON HOUSEHOLD CONSUMPTION
Impact of higher US supply
Reduction in
fundamentals-
based oil prices
Global Oil Supply
© Wood Mackenzie 62
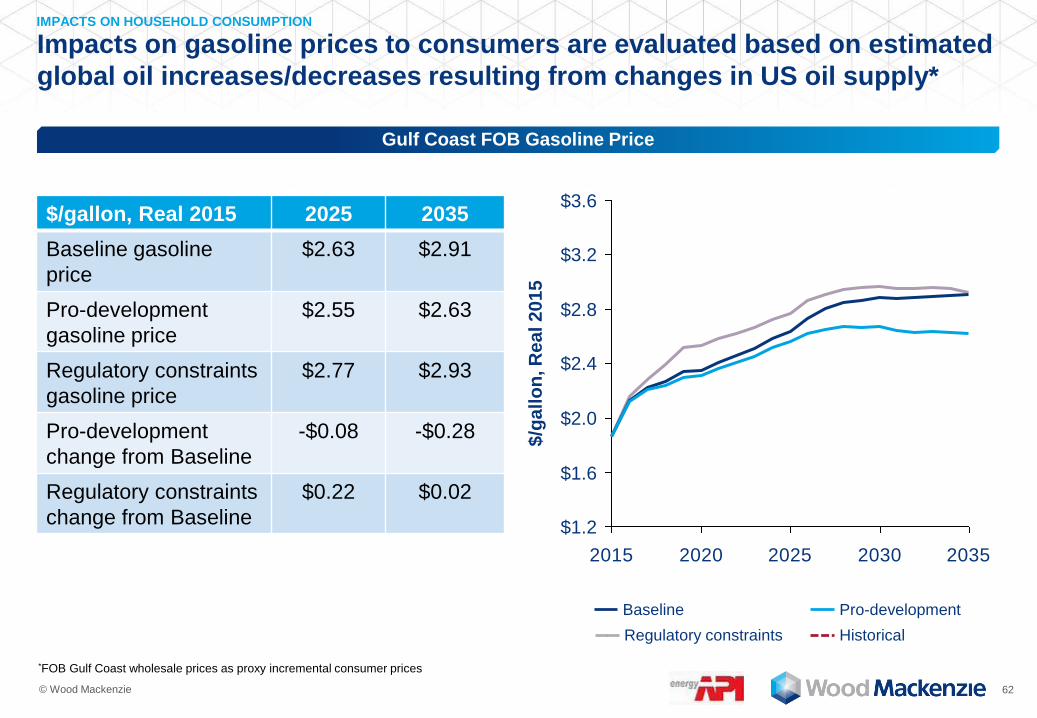
Impacts on gasoline prices to consumers are evaluated based on estimated
global oil increases/decreases resulting from changes in US oil supply*
IMPACTS ON HOUSEHOLD CONSUMPTION
2015 2020 2025 2030 2035
$2.4
$1.6
$1.2
$3.6
$3.2
$2.0
$2.8
$/g
all
on
, R
ea
l 2
01
5
Gulf Coast FOB Gasoline Price
Diff. =
$7.74
$/gallon, Real 2015 2025 2035
Baseline gasoline
price
$2.63 $2.91
Pro-development
gasoline price
$2.55 $2.63
Regulatory constraints
gasoline price
$2.77 $2.93
Pro-development
change from Baseline
-$0.08 -$0.28
Regulatory constraints
change from Baseline
$0.22 $0.02
*FOB Gulf Coast wholesale prices as proxy incremental consumer prices
Baseline Pro-development
Regulatory constraints Historical
© Wood Mackenzie 63
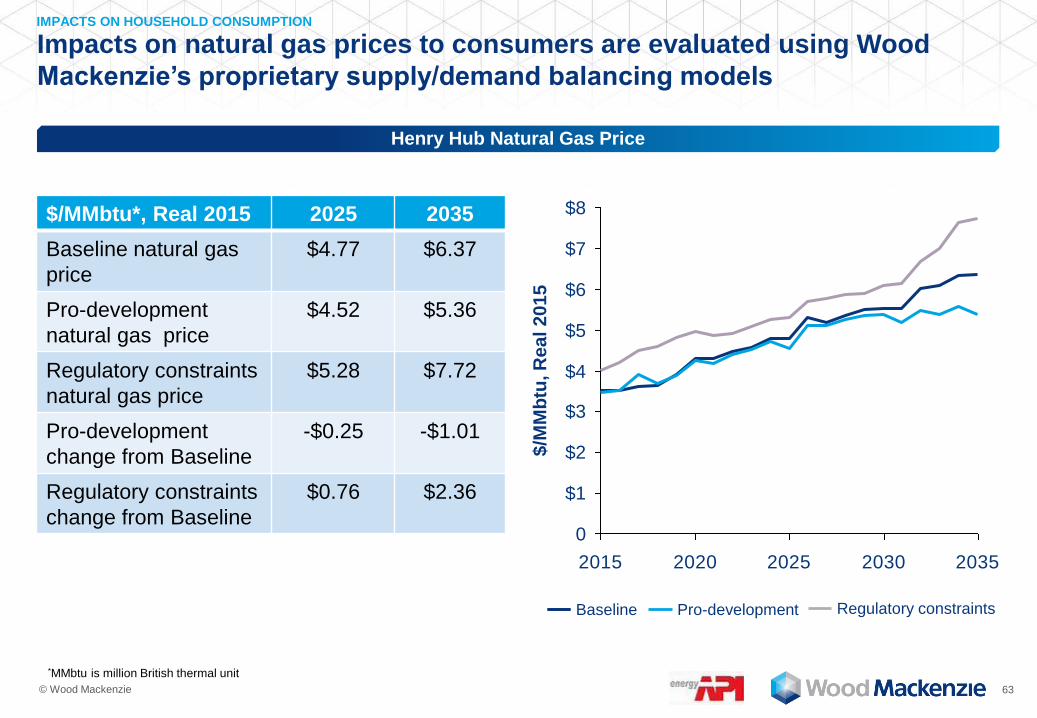
Impacts on natural gas prices to consumers are evaluated using Wood
Mackenzie’s proprietary supply/demand balancing models
IMPACTS ON HOUSEHOLD CONSUMPTION
2015 2020 2025 2030 2035
$8
$7
$6
$5
$4
$3
$2
$1
0 $
/MM
btu
, R
ea
l 2
01
5
Henry Hub Natural Gas Price
$/MMbtu*, Real 2015 2025 2035
Baseline natural gas
price
$4.77 $6.37
Pro-development
natural gas price
$4.52 $5.36
Regulatory constraints
natural gas price
$5.28 $7.72
Pro-development
change from Baseline
-$0.25 -$1.01
Regulatory constraints
change from Baseline
$0.76 $2.36
Baseline Pro-development Regulatory constraints
*MMbtu is million British thermal unit
© Wood Mackenzie 64
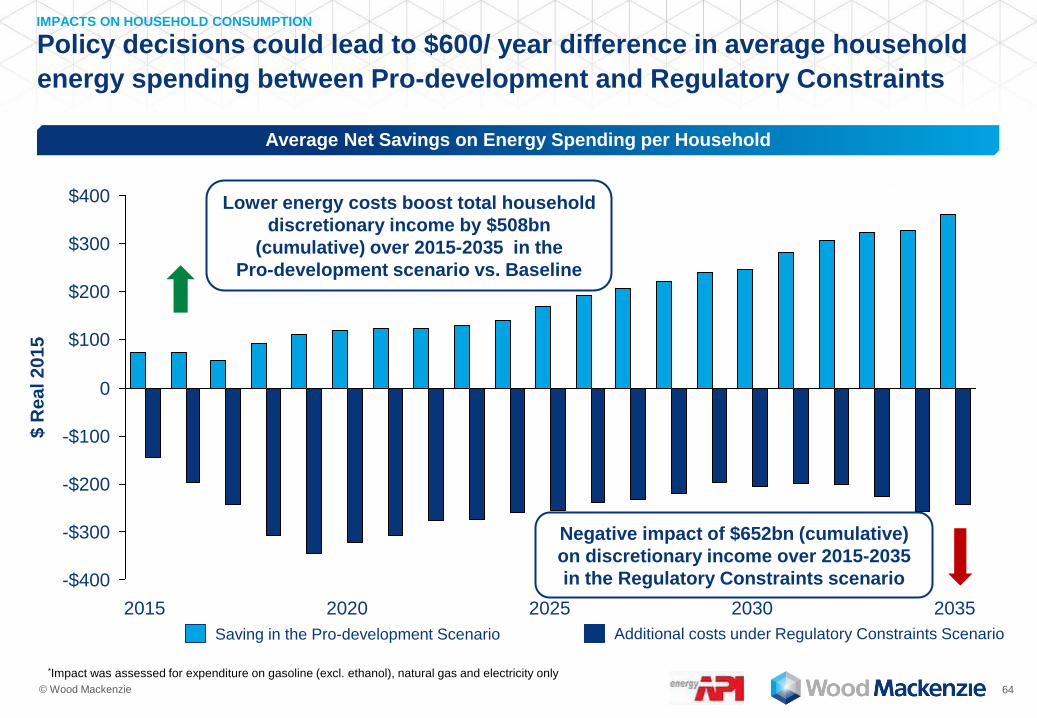
Policy decisions could lead to $600/ year difference in average household
energy spending between Pro-development and Regulatory Constraints
IMPACTS ON HOUSEHOLD CONSUMPTION
Average Net Savings on Energy Spending per Household
Lower energy costs boost total household
discretionary income by $508bn
(cumulative) over 2015-2035 in the
Pro-development scenario vs. Baseline
Negative impact of $652bn (cumulative)
on discretionary income over 2015-2035
in the Regulatory Constraints scenario
$300
$200
$100
0
-$100
-$200
-$300
-$400
$400
2015 2020 2025 2030 2035
$ R
ea
l 2
01
5
Saving in the Pro-development Scenario Additional costs under Regulatory Constraints Scenario
*Impact was assessed for expenditure on gasoline (excl. ethanol), natural gas and electricity only
© Wood Mackenzie 65
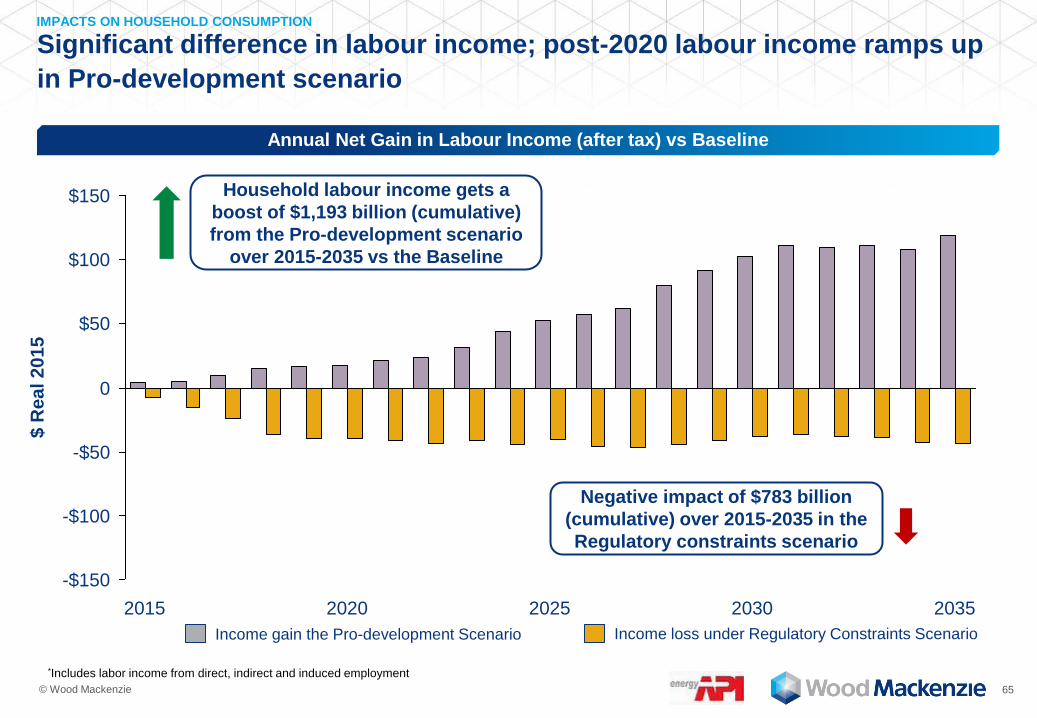
Significant difference in labour income; post-2020 labour income ramps up
in Pro-development scenario
IMPACTS ON HOUSEHOLD CONSUMPTION
Annual Net Gain in Labour Income (after tax) vs Baseline
Household labour income gets a
boost of $1,193 billion (cumulative)
from the Pro-development scenario
over 2015-2035 vs the Baseline $100
-$150
-$50
$150
$50
0
-$100
$ R
ea
l 2
01
5
2035 2030 2025 2020 2015
Negative impact of $783 billion
(cumulative) over 2015-2035 in the
Regulatory constraints scenario
*Includes labor income from direct, indirect and induced employment
Income gain the Pro-development Scenario Income loss under Regulatory Constraints Scenario

© Wood Mackenzie 66
Contents
2. Methodology
Executive summary
5. Refining implications
3. Supply implications
4. Midstream implications
6. Impacts on taxes, GDP, and US employment
1. Regulations overview and implications
Appendices
8. Study conclusions
7. Impacts on household consumption

© Wood Mackenzie 67
US policies and regulations are expected to have significant impacts on oil and
natural gas production, jobs, GDP, government revenue and consumer energy costs
If enacted, Pro-development policies could have the following impact by 2035*
» increase US energy security by increasing US oil and natural gas production by an additional 8
MMboed
» support US employment by an additional 2.3 million US jobs throughout the economy
» contribute to US GDP by an additional $443 billion /year
» increase total local, state, and federal government revenue by $122 billion / year, a cumulative
increase of $1.1 trillion from 2015 to 2035
» save the average US household $360 / year on energy expenses
Recent and proposed regulatory constraints are projected to by 2035*
» decrease US energy security by reducing US oil and natural gas production by 3.4 MMboed
» reduce the total employment supported by the oil and natural gas industry by 830 thousand jobs
» reduce contributions to the US economy by $133 billion / year (-$138 billion in 2025)
» decrease total local, state, and federal government revenue by $18 billion / year (-$33 billion in
2015), a cumulative reduction of $500 billion from 2016 to 2035
» increase average US household energy expenses by $255 / year
STUDY CONCLUSIONS
Study Conclusions
* Relative to a Baseline forecast without these policies

© Wood Mackenzie 68
Contents
2. Methodology
Executive summary
5. Refining implications
3. Supply implications
4. Midstream implications
6. Impacts on taxes, GDP, and US employment
1. Regulations overview and implications
Appendices
8. Study conclusions
7. Impacts on household consumption

© Wood Mackenzie 69
Appendices
A2. Pro-development scenario assumptions
A3. Regulatory constraints assumptions
A1. Baseline assumptions
A4. Summary job impacts
A5. State-level impacts
A6. Data for key charts
© Wood Mackenzie 70
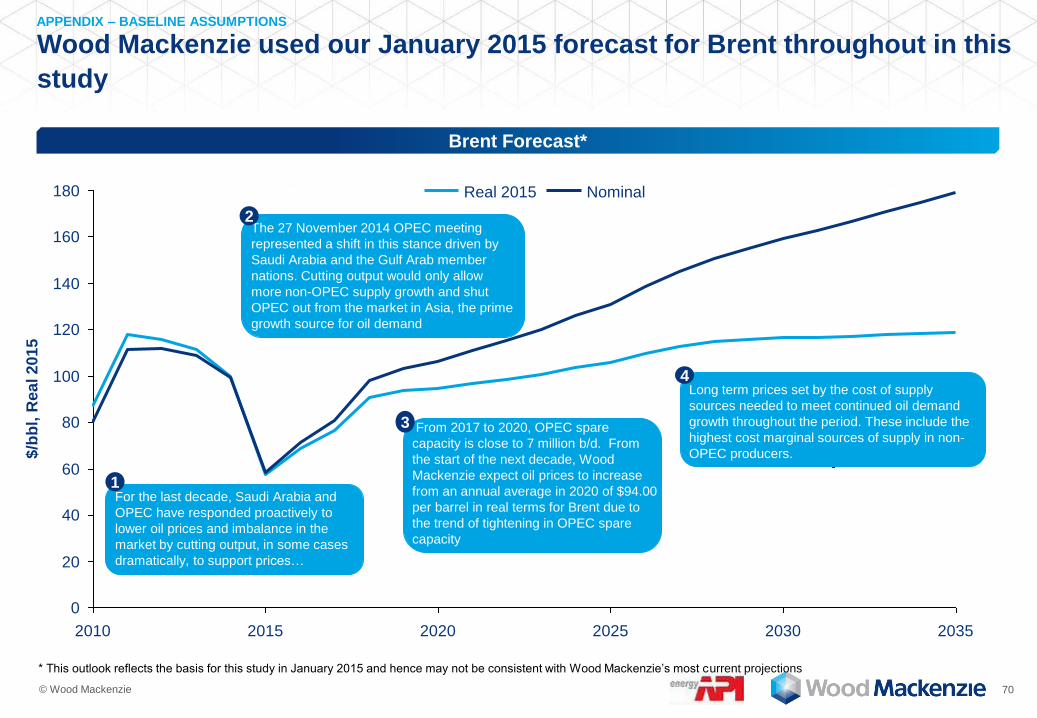
Brent Forecast*
Wood Mackenzie used our January 2015 forecast for Brent throughout in this
study
APPENDIX – BASELINE ASSUMPTIONS
0
20
40
60
80
100
120
140
160
180
2010 2015 2020 2025 2030 2035
$/b
bl,
Rea
l 2
01
5
Real 2015 Nominal
* This outlook reflects the basis for this study in January 2015 and hence may not be consistent with Wood Mackenzie’s most current projections
For the last decade, Saudi Arabia and
OPEC have responded proactively to
lower oil prices and imbalance in the
market by cutting output, in some cases
dramatically, to support prices…
The 27 November 2014 OPEC meeting
represented a shift in this stance driven by
Saudi Arabia and the Gulf Arab member
nations. Cutting output would only allow
more non-OPEC supply growth and shut
OPEC out from the market in Asia, the prime
growth source for oil demand
Long term prices set by the cost of supply
sources needed to meet continued oil demand
growth throughout the period. These include the
highest cost marginal sources of supply in non-
OPEC producers.
1
2
4
From 2017 to 2020, OPEC spare
capacity is close to 7 million b/d. From
the start of the next decade, Wood
Mackenzie expect oil prices to increase
from an annual average in 2020 of $94.00
per barrel in real terms for Brent due to
the trend of tightening in OPEC spare
capacity
3

© Wood Mackenzie 71
The Baseline case assumes the following policy and regulatory initiatives
APPENDIX – BASELINE ASSUMPTIONS
The US DOE has a “sweet spot” of US LNG export of 6 bcfd
» Once 6 bcfd of US LNG export capacity has been sanctioned all future approvals for US LNG
export facilities are expected to be denied. This is expected to lead to a reduction in gas
development and pricing
Oil pricing declines have been factored in to reduced 2015-17 capital spending plans but Wood
Mackenzie assumes will recover to prior levels by 2018
No lifting of the current crude ban on crude exports
No opening of new areas for exploration and development
» No new exploration and development in frontier areas of Alaska, Eastern Gulf of Mexico,
Atlantic and Pacific offshore, and Federal Rockies
Restrictions on new pipeline development from Canada
» Curtailment of oil sands pipeline infrastructure into the U.S. means no development of the
Keystone XL pipeline or other future Canada to U.S. pipelines
Baseline – Detailed Assumptions

© Wood Mackenzie 72
The resultant detailed assumptions are our application of the Baseline case APPENDIX – BASELINE ASSUMPTIONS
Onshore U.S.
» No federal level regulations limiting the use of hydraulic fracturing and water disposal on private or state lands.
» Wood Mackenzie assume the BLM will institute additional regulations for hydraulic fracturing on federal lands. This is
expected to add additional delays to development of federal lands and additional cost increases above current levels
» Due to regulatory costs and in-action, Wood Mackenzie assume that no new major Federal lands oil & gas
developments will be sanctioned by firms before 2020. Regulatory delays and additional permitting requirements are
expected to add an expected $20/mcf to play development on federal lands
» No lifting of moratorium on unconventional oil & gas development in New York as well as limited local bans from
municipalities for unconventional gas development. This is expected to limit development in these select areas, but is
not expected to lower overall onshore US unconventional oil & gas development
Gulf of Mexico
» Development and exploration activity remains at current levels and is expected to be dictated by commodity prices
and available opportunities for companies. Wood Mackenzie assume that no new areas of offshore lands are opened
for exploration or development
Alaska
» No drilling activity offshore Alaska, ANWR or the NPRA
» No future development activity in the currently closed areas
Baseline Assumptions – Detailed Assumptions

© Wood Mackenzie 73
Our US liquids supply Baseline forecast peaks in the late 2020s as oil
supply begins to decline while NGLs continue to grow through the forecast
APPENDIX – BASELINE ASSUMPTIONS
US Liquids Outlook by Area
Following recent price declines, the US liquids
production is expected to increase by 0.53 and 0.79
MMbbld in 2016 and 2017
While the Gulf of Mexico deepwater remains a higher
cost operating area, Wood Mackenzie expects oil
production to increase to 1.8 MMbbld in 2025, as the
province remains an attractive deepwater investment
relative to other provinces globally due to a favorable
fiscal regime and stable regulatory environments
Peak US oil production has been pushed out several
years following an expansion of US tight oil reserves
with oil production reaching 12.3 MMbbld in 2025
10
12
8
6
4
14
18
16
0
2
MM
bb
ld
2035 2015 2020 2025 2030
Onshore US Lower 48 Gulf of Mexico
Alaska NGLs

© Wood Mackenzie 74
Our US gas supply Baseline outlook expects production to accelerate over
the next 5 years then continue to grow throughout the forecast period
APPENDIX – BASELINE ASSUMPTIONS
US Gas Production Outlook by Region
Future US gas production is expected to be driven
primarily by low-cost shale gas resources and
increases to associated gas from oil production
The Northeast has become the largest producing
region and is expected to continue to grow supported
by low-cost resources in the Marcellus and Utica
shales
The US is expected to remain one of the lowest cost
sources of gas globally, even as low gas prices lead
to a dramatic increase in gas demand from sources
like LNG exports, growing industrial demand, and gas
exports to Mexico
Cheap US gas is well served to play a larger role in
power markets as the industry copes with increasing
federal regulations of power plant emissions
0
10
20
30
40
50
60
70
80
90
100
110
120
2035
bc
fd
2030 2025 2020 2015
Rockies San Juan
Mid-Continent Permian
Gulf Coast
Fort Worth
Gulf Coast
Northeast
West Coast Alaska

© Wood Mackenzie 75
Appendices
A2. Pro-development scenario assumptions
A3. Regulatory constraints assumptions
A1. Baseline assumptions
A4. Summary job impacts
A5. State-level impacts
A6. Data for key charts
© Wood Mackenzie 76
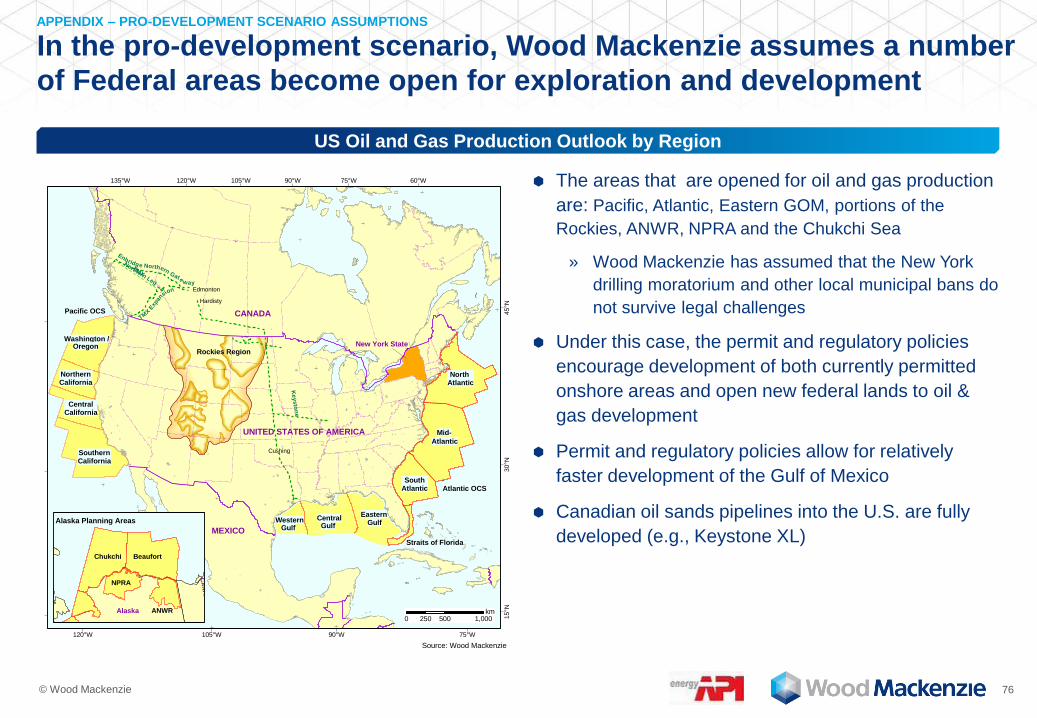
In the pro-development scenario, Wood Mackenzie assumes a number
of Federal areas become open for exploration and development
North Atlantic
Atlantic
SouthAtlantic
Gulf
SouthernCalifornia
CentralCalifornia
NorthernCalifornia
Washington /
Straits of Florida
UNITED STATES OF AMERICA
CANADA
MEXICO
Atlantic OCS
Pacific OCS
Oregon
GulfEastern
Western
Mid-
GulfCentral
Rockies Region New York State
Enbridge Northern Gate
way
TMX E
xpan
sion
TMX
Northern Leg
Ke
ysto
ne
Cushing
Edmonton
Hardisty
60°W
75°W
75°W
90°W
90°W
105°W
105°W
120°W
120°W135°W
45°N
45°N
30°N 30°N
15°N
15°N
0 500 1,000250km
Source: Wood Mackenzie
Alaska
CA
NA
DA
NPRA
ANWR
BeaufortChukchi
Alaska Planning Areas
APPENDIX – PRO-DEVELOPMENT SCENARIO ASSUMPTIONS
The areas that are opened for oil and gas production
are: Pacific, Atlantic, Eastern GOM, portions of the
Rockies, ANWR, NPRA and the Chukchi Sea
» Wood Mackenzie has assumed that the New York
drilling moratorium and other local municipal bans do
not survive legal challenges
Under this case, the permit and regulatory policies
encourage development of both currently permitted
onshore areas and open new federal lands to oil &
gas development
Permit and regulatory policies allow for relatively
faster development of the Gulf of Mexico
Canadian oil sands pipelines into the U.S. are fully
developed (e.g., Keystone XL)
US Oil and Gas Production Outlook by Region

© Wood Mackenzie 77
The pro-development scenario assumes the following policy and regulatory
initiatives
APPENDIX – PRO-DEVELOPMENT SCENARIO ASSUMPTIONS
Opening of Offshore Federal areas that are currently “off limits” to exploration and development
» Commencement of leasing, drilling and development activity in currently closed regions. Regions to be
opened include: Eastern Gulf of Mexico, portions of the Rocky Mountains, Atlantic OCS, Pacific OCS, Alaska
National Wildlife Refuge (ANWR) – 1002 Area, National Petroleum Reserve, Alaska (NPRA) and Alaska
offshore
Lifting of drilling moratorium in New York State
» Commencement of drilling and development of Marcellus shale in New York State
Approval of the Keystone XL and other future Canada to U.S. oil pipelines
» Facilitates additional Canadian oil sands development, thereby increasing the demand for U.S. supplied
equipment and infrastructure
Regulation of unconventional oil & gas resources remains predominately at the state level
» Environmental regulation of shale gas and tight oil plays are not duplicative or unduly burdensome permitting
levels are at sufficient rates to develop resources in a timely manner
Pro-development Scenario – Detailed Assumptions

© Wood Mackenzie 78
The following detailed assumptions are our suggested application of the
pro-development case
APPENDIX – PRO-DEVELOPMENT SCENARIO ASSUMPTIONS
Onshore U.S.
» Ongoing development of state and federal lands with development dictated by company plans and commodity prices
» Leasing and permitting rates do not significantly hinder current company plans
» No restrictions of shale development in New York state
» New federal lands are opened for oil & gas developments with a pro-development approach from the regulatory
agencies
Gulf of Mexico
» Leasing of deep water acreage returns to pre-Moratorium rates
» Exploration activity recovers to pre-Moratorium drilling rates, approximately 40 wildcat wells per year
Alaska
» Resources offshore Alaska and NPRA are developed
» Access is allowed in current and previously restricted areas
Atlantic Coast – activity begins 2016
Pacific Coast – activity begins 2016
Eastern Gulf of Mexico – activity begins 2016
ANWR – activity begins 2016
Portions of the Rocky Mountains – activity begins 2016
Pro-development Scenario – Detailed Assumptions

© Wood Mackenzie 79
Appendices
A2. Pro-development scenario assumptions
A3. Regulatory constraints assumptions
A1. Baseline assumptions
A4. Summary job impacts
A5. State-level impacts
A6. Data for key charts

© Wood Mackenzie 80
EPA's proposal to update the air quality standards to reduce the limit on ground-level ozone from
75ppm to between 65-70 ppb*
The proposed Ozone legislation is expected to have far-reaching
implications on the US energy industries
APPENDIX – REGULATORY CONSTRAINTS ASSUMPTIONS
1
Improve public health protection by providing a greater margin between future air quality and recognized safe levels of ozone
exposure
Overall Objective
Retrofitting of combustion equipment with ‘clean burn’ technologies
Retirement of aged combustion equipment where uneconomic to retrofit
Anticipated Means of Compliance
Increased demand for natural gas in power generation as proportion of current coal-fired capacity is retired
Reduced acreage available for natural gas production as nonattainment expands into rural areas where shortage of potential
offsets may translate into a significant barrier to obtaining permits for the new wells
Increased pipeline tariffs to recover control costs for reductions in NOx emissions in the pipeline system
Increased natural gas prices resulting from need to exploit higher cost reserves with higher costs to market
Increased gas supply required to meet increased demand from the power sector
Higher costs to US utility consumers as both natural gas and electrical power costs rise
Potential for reduced competitiveness of US LNG export projects
Implications Considered in this Study
Ozone Legislation 1
* Federal Register / Vol. 79, No. 242 / Wednesday, December 17, 2014 / Proposed Rules

© Wood Mackenzie 81
The Pipeline Hazardous Materials Safety Administration has proposed a tighter set of standards for
transportation by rail of flammable liquids, including crude oil and ethanol
The proposed Rail legislation is expected to increase the cost of
transporting crude oil and ethanol by rail
APPENDIX – REGULATORY CONSTRAINTS ASSUMPTIONS
2
Address the safety concerns associated with growing volumes of crude oil transported by rail
Overall Objective
Retrofitting of existing railcar fleet to meet new specifications
Carriers will be required to perform a safety and security analysis to select “high-hazard flammable train” (HHFT) routes
Operating speeds will be reduced and all HHFT trains will be required to be equipped with enhanced braking systems
Anticipated Means of Compliance
Increased cost of railcar leasing and purchasing adding to cost of transportation by rail
Constraints on railcars available based on ability of existing facilities to retrofit before standards are in effect
Increased transit time adding to cost of transportation by rail
Total increases in transportation cost reducing the netbacks to producers and impacting production
Limitations in railcar availability requiring trucking to fill the gap, potentially further constraining production
Increase in cost of transportation of ethanol adding to cost and ultimately impacting consumers at the pump
Implications Considered in this Study
Tighter Specifications
for Rail Tank Car Fleet 2
*PMHSA: Hazardous Materials: Enhanced Tank Car Standards and Operational Controls for High-Hazard Flammable Trains

© Wood Mackenzie 82
Amendments to the emission standards for hazardous air pollutants for petroleum refineries
including new monitoring, recordkeeping and reporting requirements*
The proposed Refining Sector legislation is expected to increase cost of
compliance for domestic refineries and may result in activity reductions
APPENDIX – REGULATORY CONSTRAINTS ASSUMPTIONS
3
Reductions of 1,760 tons per year of hazardous air pollutions are projected which will reduce cancer risk and chronic health effects
Overall Objective
Anticipated Means of Compliance
Total capital costs nationwide are estimated at approx. $240MM
Total annualized costs are estimated at approx. $57MM per annum
These increased costs may be mitigated through or result in capacity reductions
Competitive position of marginal refineries competing in the Atlantic basis may be affected
Implications Considered in this Study
Refining Sector Review 3
* Environmental Protection Agency 40 CFR Parts 60 and 63
Emissions reductions from delayed coking units venting
Emission limits to CRU depressurizing procedures
Amended operating and monitoring requirements for refinery flares
Amended classification of storage vessels and reduced equipment and connector leaks
Fenceline monitoring on a continuous basis

© Wood Mackenzie 83
The renewable fuels standard in its current form was the result of the Energy Independence and
Security Act, which was passed in 2007
The RFS is expected to impact both refiners and consumers as refinery-
produced transportation fuels are replaced by higher cost biofuels
APPENDIX – REGULATORY CONSTRAINTS ASSUMPTIONS
4
Encourage North American energy independence, reduce greenhouse gas emissions, and support the renewable fuel industry
Overall Objective
Increasing volumes of biofuel (conventional ethanol, biodiesel, cellulosic) to be used in the transportation sector in replacement of
petroleum-based fuels
Anticipated Means of Compliance
Impact on demand for refinery production of gasoline and diesel
Decreases in margin and utilization for US refiners as result of lower demand for US gasoline
Decreases in margin and utilization for US refiners as a result of RFS compliance costs
Increased requirement for export capability as a result of lowered demand and resultant cost to US refiners
Pump price impacts to consumers
Implications Considered in this Study
Renewable Fuels
Standard 4

© Wood Mackenzie 84
Definition of “Water of the United States” under the Clean Water Act*
Amended classification of ‘Waters of the USA’ is expected to have far reaching
impacts on availability and costs associated with the use/disposal of water
APPENDIX – REGULATORY CONSTRAINTS ASSUMPTIONS
5
Enhance protection for the nation’s public health and aquatic resources and increase CWA program predictability and consistency
Overall Objective
Amended definitions for ‘waters of the United States’ and ‘other waters’
Introduction of a concept called ‘significant nexus’ to classify certain water resources under ‘waters of the United States’
Anticipated Means of Compliance
Large water resources currently regulated by the individual states could fall under federal regulations
The broadening of the definition of waters of the United States and the application of the ‘significant nexus’ concept will result in
regulatory restrictions and costs associated with the use of water resources not currently covered by the Clean Water Act
Disposal of used process water may be severely restricted by the broadening proposed by the EPA rule
Permitting will require an increased federal oversight resulting in delays, cost increases and perhaps even outright cancellations of
projects requiring substantial amounts of local water resources or disposal thereof
Sectors most exposed may included power generation and oil and gas production and processing, including hydraulic fracturing
Implications Considered in this Study
Waters of the USA 5
* EPA 40 CFR Parts 110, 112, 116, et al.

© Wood Mackenzie 85
Extend current air emissions regulations for new unconventional gas wells to include all new and
existing (producing) wells
The proposed methane regulations is expected to introduce a significant
cost burden on both newly drilled and existing wells
APPENDIX – REGULATORY CONSTRAINTS ASSUMPTIONS
6
Address climate change and help ensure a cleaner, more stable environment for future generations by implementing a set of
actions to cut methane emissions from the oil and gas sector by 40 – 45 percent from 2012 levels by 2025
Overall Objective
Expansion of current leak detection and repair methods currently used at gas processing plant to all production sites (from well
sites to compressor stations)
Prevent of venting to atmosphere, including cessation of blowdowns during equipment maintenance
More stringent leak detection and controls on storage vessels, pneumatic controllers, compressors, and liquids unloading facilities
Anticipated Means of Compliance
Incremental upfront capex of between $100,000-200,000 for new wells, depending on the type of well and producing region
Incremental gas capture to partly offset incremental costs
Incremental cost to existing wells of between $50,000-150,000 depending on the type of well and producing region
Potential for equipment bottlenecks at some producing sites to result in some wells being shut-in
Potential for compliance costs to retrofit some older, lower volume wells to be to exceed future value of production, resulting in
wells being shut-in
Implications Considered in this Study
Methane Regulations 6

© Wood Mackenzie 86
The Bureau of Land Management published a proposed rule in the Federal Register to further
regulate hydraulic fracturing on Federal and Indian lands
The proposed Hydraulic Fracturing on Federal and Indian Lands rule is
expected to increase the cost of drilling and completion in impacted areas
APPENDIX – REGULATORY CONSTRAINTS ASSUMPTIONS
7
To ensure the environmentally responsible development of oil and gas resources on Federal and Indian lands through
requirements for environmentally responsible behaviour and public disclosure.
Overall Objective
Requirements for well construction that protects water supplies
Requirements for environmentally responsible management of chemicals in flow back fluids from hydraulic fracturing
Public disclosure requirements for chemicals used in hydraulic fracturing fluids and other information on hydraulic fracturing activity
Anticipated Means of Compliance
Increased costs for well drilling and completion
Increased cost for management and storage of chemicals in flow back fluids
Potential ramifications for increased reporting of hydraulic fracturing chemicals and activity
Alignment of requirements with state and tribal authorities regarding protected water zones
Increased coordination of standards and processes with individual states and tribes, which could result in more stringent standards
by state and tribal governments
Implications Considered in this Study
7
* Bureau of Land Management – 43 CFR part 3160
BLM Hydraulic
Fracking Rule 7

© Wood Mackenzie 87
Blowout preventer requirements and reforms in the area of well design, control and monitoring*
New standards for blowout preventers and well design and control is expected to
result in cost and schedule increases offset by changes in testing schedule
APPENDIX – REGULATORY CONSTRAINTS ASSUMPTIONS
8
Enhance well-control best practices to advance safety and protection of the environment
Overall Objective
Incorporate various industry standards and revised requirements for blowout preventers and deepwater operations
Revised design requirements for well completion, work-over and decommissioning activities
Harmonization of the testing requirements for BOP systems with drilling and completion operations
Anticipated Means of Compliance
Increased costs for the design, construction, installation and testing and monitoring of blowout preventers
Increased reporting requirements resulting in additional time and resource requirements
Reduced risk of blowouts with associated environmental impact and possible loss of life
A number of technical standards are expected to reduce the number of feasible wells by 30%
Implications Considered in this Study
OCS Blowout Rules 8
* BSEE NPRM 2015

© Wood Mackenzie 88
The U.S. Fish and Wildlife Service has added the Gunnison sage-grouse to the list of endangered
and threatened wildlife*
Addition of the Greater sage-grouse to the list of endangered species is
expected to have a material impact on oil and gas production
APPENDIX – REGULATORY CONSTRAINTS ASSUMPTIONS
9
Address the most substantial threats to Greater sage-grouse including habitat decline due to human disturbance, small population
size, drought, climate change and disease
Overall Objective
Protection of habitat that is currently occupied or through future expansion
4 mile restrictions on surface disturbance around a lake
Measures to minimize the impact of existing disturbances, disruptive activities and valid mineral rights
Anticipated Means of Compliance
Temporary road closures and / or timing restrictions during the breeding season
Listing to include the Greater Sage-Grouse species could have a very material impact on the oil and gas industry
Drilling could become severely restricted in a number of states which could otherwise deliver substantial supply growth
Implications Considered in this Study
Greater Sage-Grouse
on the Endangered list 9
* Fish and Wildlife Service 50 CFR Part 17

© Wood Mackenzie 89
Clarification on when and how Federal agencies should use programmatic NEPA reviews
CEQ’s final guidance has potential to defer investment in oil and gas
developments in new areas
APPENDIX – REGULATORY CONSTRAINTS ASSUMPTIONS
To enforce use of programmatic (i.e. broad strategic level) reviews of any proposed development which could potentially affect the
quality of the human environment before conducting project- or site-specific impact reviews
Overall Objective
Requirement to consider alternatives to the proposed development as part of the programmatic review
Proactive and robust public participation is encouraged and comment periods can be extended to ensure meaningful involvement
of all stakeholders (including Federal and state agencies, tribes, local governments, private organizations, and individual citizens)
Anticipated Means of Compliance
Potential for delays to proposed developments in new areas
For the GOM, it is expected that unsanctioned projects will be delayed by on average 2 years
For onshore production, new developments are expected to ramp up more slowly with a 2 year delay in the maximum well count
Implications Considered in this Study
CEQ and NEPA
Guidance
* Memorandum for Heads of Federal Departments and Agencies, dated December 18, 2014
10
10

© Wood Mackenzie 90
Appendices
A2. Pro-development scenario assumptions
A3. Regulatory constraints assumptions
A1. Baseline assumptions
A4. Summary job impacts
A5. State-level impacts
A6. Data for key charts

© Wood Mackenzie 91
Total supported job projections include indirect and induced jobs at an average ~4x
multiple on direct jobs through the upstream, midstream and refining sectors
APPENDIX – SUMMARY JOB IMPACTS
Total Jobs Supported, Baseline, Pro-development Policies, Regulatory Constraints Scenarios
0
8
9
7
6
4
5
1
10
2
3
11
Reg.
Cons.
Mil
lio
n
Pro-
dev.
Base Reg.
Cons.
Pro-
dev.
Base Base Reg.
Cons.
Pro-
dev.
Base Base Reg.
Cons.
Pro-
dev.
5.07 7.52 7.92 6.74 7.23 9.02 9.02
2015 2020 2025 2030 2035
7.19 9.87 7.93 7.11 10.22 7.94
Direct Jobs Indirect Jobs Induced Jobs

© Wood Mackenzie 92
Appendices
A2. Pro-development scenario assumptions
A3. Regulatory constraints assumptions
A1. Baseline assumptions
A4. Summary job impacts
A5. State-level impacts
A6. Data for key charts

© Wood Mackenzie 93
Top 10 states with the largest incremental gains under pro-development
policies
APPENDIX – STATE-LEVEL IMPACTS
Rank Jobs Supported in
2035 thousand
Cumulative GDP
(2016-2035) $ billion
Cumulative State Tax
Revenue (2016-2035) $ billion
1 Texas +733 Texas +$1167 Alaska +$212
2 Alaska +387 Alaska +$953 California +$94
3 California +252 California +$591 Florida +$53
4 Florida +183 Florida +$440 Texas +$52
5 Oklahoma +118 Oklahoma +$186 North Carolina +$11
6 Colorado +87 Louisiana +$175 Colorado +$11
7 Louisiana +86 Colorado +$120 Oklahoma +$9
8 North Carolina +46 North Carolina +$84 Louisiana +$9
9 West Virginia +34 South Carolina +$49 New Jersey +$8
10 Pennsylvania +31 New Jersey +$41 South Carolina +$7

© Wood Mackenzie 94
Top 10 states with the largest incremental reductions under regulatory
constraints
APPENDIX – STATE-LEVEL IMPACTS
Rank Jobs Supported in
2035 thousand
Cumulative GDP
(2016-2035) $ billion
Cumulative State Tax
Revenue (2016-2035) $ billion
1 Colorado -226 Texas -$818 Wyoming -$86
2 Texas -155 Colorado -$598 Colorado -$65
3 Wyoming -91 Wyoming -$314 Texas -$24
4 Utah -70 Utah -$149 North Dakota -$19
5 California -49 Oklahoma -$143 Utah -$19
6 Oklahoma -40 New Mexico -$125 New Mexico -$18
7 Pennsylvania -27 California -$112 California -$9
8 West Virginia -19 North Dakota -$90 West Virginia -$9
9 Kansas -16 Kansas -$32 Oklahoma -$9
10 Ohio -15 Illinois -$24 Kansas -$3

© Wood Mackenzie 95
Alabama – Impacts Summary APPENDIX – STATE-LEVEL IMPACTS
Impact on
Alabama
Pro-development Policies (incremental) Baseline (absolute) Regulatory Constraints (incremental)
2020 2025 2030 2035 2020 2025 2030 2035 2020 2025 2030 2035
Oil and Natural
Gas Production
-0
kboed
+2
kboed
-0
kboed
-1
kboed
59
kboed
47
kboed
40
kboed
36
kboed
+1
kboed
-1
kboed
-3
kboed
-4
kboed
Total Jobs
Supported*
+2
thousand
+2
thousand
+3
thousand
+3
thousand
24
thousand
24
thousand
24
thousand
24
thousand
-1
thousand
-1
thousand
-2
thousand
-2
thousand
GDP / Year +$0.44
billion
+$0.43
billion
+$0.47
billion
+$0.43
billion
$3.23
billion
$3.23
billion
$3.20
billion
$3.15
billion
-$0.14
billion
-$0.17
billion
-$0.2
billion
-$0.26
billion
Government
Revenue** / Year
+$0.03
billion
+$0.03
billion
+$0.03
billion
+$0.03
billion
$0.29
billion
$0.26
billion
$0.23
billion
$0.21
billion
-$0.01
billion
-$0.01
billion
-$0.01
billion
-$0.03
billion
Cumulative
Gov't Revenue**
(from 2016)
+$0.16
billion
+$0.32
billion
+$0.46
billion
+$0.6
billion
$1.43
billion
$2.82
billion
$4.03
billion
$5.10
billion
-$0.02
billion
-$0.05
billion
-$0.09
billion
-$0.15
billion
*Jobs supported include direct, indirect and induced job creation
**Does not include federal government tax revenue

© Wood Mackenzie 96
Alaska – Impacts Summary APPENDIX – STATE-LEVEL IMPACTS
Impact on
Alaska
Pro-development Policies (incremental) Baseline (absolute) Regulatory Constraints (incremental)
2020 2025 2030 2035 2020 2025 2030 2035 2020 2025 2030 2035
Oil and Natural
Gas Production
+8
kboed
+570
kboed
+2117
kboed
+2751
kboed
538
kboed
501
kboed
470
kboed
447
kboed
+0
kboed
+0
kboed
+0
kboed
+0
kboed
Total Jobs
Supported*
+5
thousand
+188
thousand
+396
thousand
+387
thousand
120
thousand
168
thousand
137
thousand
115
thousand
-5
thousand
-5
thousand
-4
thousand
-4
thousand
GDP / Year +$1
billion
+$38
billion
+$96
billion
+$110
billion
$29
billion
$40
billion
$39
billion
$32
billion
-$1
billion
-$1
billion
-$0
billion
-$1
Billion
Government
Revenue** / Year
+$0
Billion
+$7
billion
+$21
billion
+$27
billion
$7
billion
$9
billion
$9
billion
$8
billion
-$0
billion
-$0
billion
-$0
billion
-$0
billion
Cumulative
Gov't Revenue**
(from 2016)
+$0
billion
+$15
billion
+$86
billion
+$212
billion
$30
billion
$71
billion
$120
billion
$163
billion
-$0
billion
-$0
billion
-$1
billion
-$1
billion
*Jobs supported include direct, indirect and induced job creation
**Does not include federal government tax revenue
***Alaska is expected to benefit from new development from Alaska ANWR, Alaska NPRA, Alaska Beaufort Sea and Alaska Chuckihi Sea under pro-development policies scenario

© Wood Mackenzie 97
Arizona – Impacts Summary APPENDIX – STATE-LEVEL IMPACTS
Impact on
Arizona
Pro-development Policies (incremental) Baseline (absolute) Regulatory Constraints (incremental)
2020 2025 2030 2035 2020 2025 2030 2035 2020 2025 2030 2035
Oil and Natural
Gas Production
+0
kboed
+0
kboed
+0
kboed
+0
kboed
0
kboed
0
kboed
0
kboed
0
kboed
+0
kboed
+0
kboed
+0
kboed
+0
kboed
Total Jobs
Supported*
-2
thousand
-1
thousand
+3
thousand
+4
thousand
27
thousand
31
thousand
31
thousand
30
thousand
-2
thousand
-4
thousand
-3
thousand
-3
thousand
GDP / Year -$0.13
billion
+$0.15
billion
+$0.77
billion
+$0.88
billion
$3.79
billion
$4.18
billion
$4.19
billion
$4.20
billion
-$0.44
billion
-$0.51
billion
-$0.36
billion
-$0.53
billion
Government
Revenue** / Year
-$0.01
billion
+$0
Billion
+$0.02
billion
+$0.03
billion
$0.15
billion
$0.17
billion
$0.18
billion
$0.17
billion
-$0.01
billion
-$0.02
billion
-$0.02
billion
-$0.06
billion
Cumulative
Gov't Revenue**
(from 2016)
-$0.01
billion
+$0
billion
+$0.08
billion
+$0.23
billion
$0.66
billion
$1.49
billion
$2.38
billion
$3.25
billion
-$0.05
billion
-$0.13
billion
-$0.21
billion
-$0.3
billion
*Jobs supported include direct, indirect and induced job creation
**Does not include federal government tax revenue
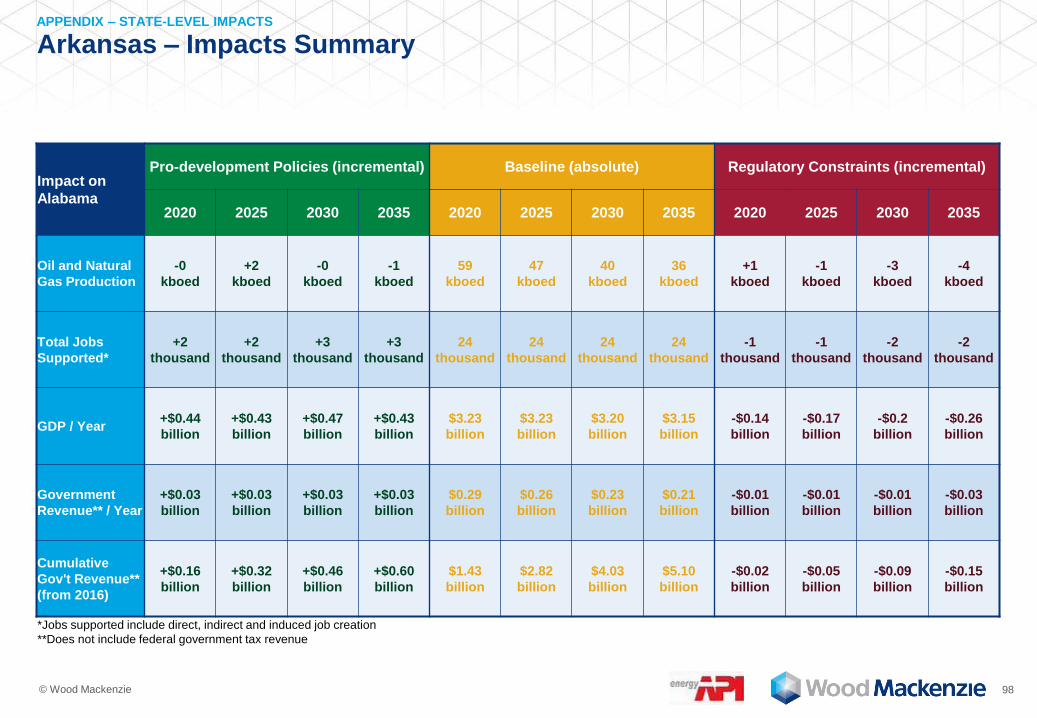
© Wood Mackenzie 98
Arkansas – Impacts Summary APPENDIX – STATE-LEVEL IMPACTS
Impact on
Alabama
Pro-development Policies (incremental) Baseline (absolute) Regulatory Constraints (incremental)
2020 2025 2030 2035 2020 2025 2030 2035 2020 2025 2030 2035
Oil and Natural
Gas Production
-0
kboed
+2
kboed
-0
kboed
-1
kboed
59
kboed
47
kboed
40
kboed
36
kboed
+1
kboed
-1
kboed
-3
kboed
-4
kboed
Total Jobs
Supported*
+2
thousand
+2
thousand
+3
thousand
+3
thousand
24
thousand
24
thousand
24
thousand
24
thousand
-1
thousand
-1
thousand
-2
thousand
-2
thousand
GDP / Year +$0.44
billion
+$0.43
billion
+$0.47
billion
+$0.43
billion
$3.23
billion
$3.23
billion
$3.20
billion
$3.15
billion
-$0.14
billion
-$0.17
billion
-$0.2
billion
-$0.26
billion
Government
Revenue** / Year
+$0.03
billion
+$0.03
billion
+$0.03
billion
+$0.03
billion
$0.29
billion
$0.26
billion
$0.23
billion
$0.21
billion
-$0.01
billion
-$0.01
billion
-$0.01
billion
-$0.03
billion
Cumulative
Gov't Revenue**
(from 2016)
+$0.16
billion
+$0.32
billion
+$0.46
billion
+$0.60
billion
$1.43
billion
$2.82
billion
$4.03
billion
$5.10
billion
-$0.02
billion
-$0.05
billion
-$0.09
billion
-$0.15
billion
*Jobs supported include direct, indirect and induced job creation
**Does not include federal government tax revenue

© Wood Mackenzie 99
California – Impacts Summary APPENDIX – STATE-LEVEL IMPACTS
*Jobs supported include direct, indirect and induced job creation
**Does not include federal government tax revenue
***California is expected to benefit from Pacific coastal area offshore development under pro-development policies scenario
Impact on
California
Pro-development Policies (incremental) Baseline (absolute) Regulatory Constraints (incremental)
2020 2025 2030 2035 2020 2025 2030 2035 2020 2025 2030 2035
Oil and Natural
Gas Production
+28
kboed
+573
kboed
+1216
kboed
+1677
kboed
734
kboed
755
kboed
763
kboed
775
kboed
-54
kboed
-93
kboed
-104
kboed
-113
kboed
Total Jobs
Supported*
+10
thousand
+81
thousand
+190
thousand
+252
thousand
402
thousand
426
thousand
435
thousand
440
thousand
-33
thousand
-44
thousand
-42
thousand
-49
thousand
GDP / Year +$1
billion
+$22
billion
+$53
billion
+$73
billion
$57
billion
$61
billion
$62
billion
$63
billion
-$5
billion
-$6
billion
-$6
billion
-$7
billion
Government
Revenue** / Year
+$0
billion
+$4
billion
+$9
billion
+$11
billion
$5
billion
$5
billion
$5
billion
$5
billion
-$0
billion
-$0
billion
-$1
billion
-$1
billion
Cumulative
Gov't Revenue**
(from 2016)
-$0
billion
+$8
billion
+$42
billion
+$94
billion
$24
billion
$50
billion
$77
billion
$102
billion
-$1
billion
-$4
billion
-$6
billion
-$9
billion

© Wood Mackenzie 100
Colorado – Impacts Summary APPENDIX – STATE-LEVEL IMPACTS
*Jobs supported include direct, indirect and induced job creation
**Does not include federal government tax revenue
***Listing sage grouse under Endangered Species Act (FWS) could severely restrict potential drilling in Colorado under regulatory constraints scenario
Impact on
Colorado
Pro-development Policies (incremental) Baseline (absolute) Regulatory Constraints (incremental)
2020 2025 2030 2035 2020 2025 2030 2035 2020 2025 2030 2035
Oil and Natural
Gas Production
+114
kboed
+221
kboed
+204
kboed
+122
kboed
1330
kboed
1410
kboed
1551
kboed
1731
kboed
-1125
kboed
-1244
kboed
-1411
kboed
-1428
kboed
Total Jobs
Supported*
+22
thousand
+51
thousand
+63
thousand
+87
thousand
267
thousand
260
thousand
288
thousand
302
thousand
-186
thousand
-179
thousand
-210
thousand
-226
thousand
GDP / Year +$3
billion
+$6
billion
+$7
billion
+$11
billion
$43
billion
$42
billion
$46
billion
$49
billion
-$30
billion
-$30
billion
-$35
billion
-$37
billion
Government
Revenue** / Year
+$0
billion
+$1
billion
+$1
billion
+$1
billion
$4
billion
$4
billion
$5
billion
$5
billion
-$3
billion
-$3
billion
-$4
billion
-$7
billion
Cumulative
Gov't Revenue**
(from 2016)
+$0
billion
+$3
billion
+$6
billion
+$11
billion
$18
billion
$39
billion
$61
billion
$85
billion
-$9
billion
-$26
billion
-$44
billion
-$65
billion

© Wood Mackenzie 101
Connecticut – Impacts Summary APPENDIX – STATE-LEVEL IMPACTS
Impact on
Connecticut
Pro-development Policies (incremental) Baseline (absolute) Regulatory Constraints (incremental)
2020 2025 2030 2035 2020 2025 2030 2035 2020 2025 2030 2035
Oil and Natural
Gas Production
+0
kboed
+0
kboed
+0
kboed
+0
kboed
0
kboed
0
kboed
0
kboed
0
kboed
+0
kboed
+0
kboed
+0
kboed
+0
kboed
Total Jobs
Supported*
+0
thousand
+1
thousand
+1
thousand
+2
thousand
7
thousand
8
thousand
8
thousand
8
thousand
-1
thousand
-1
thousand
-1
thousand
-1
thousand
GDP / Year +$0.05
billion
+$0.09
billion
+$0.16
billion
+$0.18
billion
$0.81
billion
$0.91
billion
$0.95
billion
$0.97
billion
-$0.11
billion
-$0.11
billion
-$0.13
billion
-$0.16
billion
Government
Revenue** / Year
+$0
billion
+$0
billion
+$0.01
billion
+$0.01
billion
$0.05
billion
$0.06
billion
$0.06
billion
$0.06
billion
-$0.01
billion
-$0.01
billion
-$0.01
billion
-$0.02
billion
Cumulative
Gov't Revenue**
(from 2016)
+$0.01
billion
+$0.03
billion
+$0.06
billion
+$0.1
billion
$0.23
billion
$0.50
billion
$0.80
billion
$1.11
billion
-$0.02
billion
-$0.06
billion
-$0.11
billion
-$0.16
billion
*Jobs supported include direct, indirect and induced job creation
**Does not include federal government tax revenue

© Wood Mackenzie 102
Delaware – Impacts Summary APPENDIX – STATE-LEVEL IMPACTS
Impact on
Delaware
Pro-development Policies (incremental) Baseline (absolute) Regulatory Constraints (incremental)
2020 2025 2030 2035 2020 2025 2030 2035 2020 2025 2030 2035
Oil and Natural
Gas Production
+0
kboed
+0
kboed
+24
kboed
+31
kboed
0
kboed
0
kboed
0
kboed
0
kboed
+0
kboed
+0
kboed
+0
kboed
+0
kboed
Total Jobs
Supported*
+0
thousand
+0
thousand
+3
thousand
+4
thousand
4
thousand
5
thousand
5
thousand
5
thousand
-0
thousand
-0
thousand
-0
thousand
-0
thousand
GDP / Year +$0.01
billion
+$0.02
billion
+$0.87
billion
+$1.16
billion
$0.67
billion
$0.73
billion
$0.76
billion
$0.77
billion
-$0.04
billion
-$0.05
billion
-$0.06
billion
-$0.07
billion
Government
Revenue** / Year
+$0
billion
+$0
Billion
+$0.16
billion
+$0.19
billion
$0.04
billion
$0.04
billion
$0.05
billion
$0.05
billion
-$0
billion
-$0
billion
-$0
billion
-$0.01
billion
Cumulative
Gov't Revenue**
(from 2016)
+$0
billion
+$0.01
billion
+$0.41
billion
+$1.4
billion
$0.19
billion
$0.41
billion
$0.63
billion
$0.86
billion
-$0.01
billion
-$0.02
billion
-$0.03
billion
-$0.04
billion
*Jobs supported include direct, indirect and induced job creation
**Does not include federal government tax revenue
***Delaware is expected to benefit from Atlantic coastal area offshore development under pro-development policies scenario

© Wood Mackenzie 103
Florida – Impacts Summary APPENDIX – STATE-LEVEL IMPACTS
Impact on
Florida
Pro-development Policies (incremental) Baseline (absolute) Regulatory Constraints (incremental)
2020 2025 2030 2035 2020 2025 2030 2035 2020 2025 2030 2035
Oil and Natural
Gas Production
+0
kboed
+327
kboed
+1196
kboed
+1505
kboed
6
kboed
6
kboed
6
kboed
6
kboed
+0
kboed
+0
kboed
+0
kboed
+0
kboed
Total Jobs
Supported*
+3
thousand
+40
thousand
+153
thousand
+183
thousand
27
thousand
30
thousand
32
thousand
32
thousand
-3
thousand
-3
thousand
-4
thousand
-5
thousand
GDP / Year +$0.35
billion
+$10.62
billion
+$42.34
billion
+$53.12
billion
$2.99
billion
$3.32
billion
$3.47
billion
$3.51
billion
-$0.31
billion
-$0.33
billion
-$0.41
billion
-$0.48
billion
Government
Revenue** / Year
+$0.03
billion
+$1.35
billion
+$5.1
billion
+$6.18
billion
$0.18
billion
$0.2
Billion
$0.2
billion
$0.2
billion
-$0.02
billion
-$0.02
billion
-$0.02
billion
-$0.06
billion
Cumulative
Gov't Revenue**
(from 2016)
+$0.15
billion
+$2.82
billion
+$22.58
billion
+$53
billion
$0.8
billion
$1.73
billion
$2.75
billion
$3.76
billion
-$0.05
billion
-$0.13
billion
-$0.23
billion
-$0.34
billion
*Jobs supported include direct, indirect and induced job creation
**Does not include federal government tax revenue
***Florida is expected to benefit from Eastern GoM coastal area offshore development under pro-development policies scenario

© Wood Mackenzie 104
Georgia – Impacts Summary APPENDIX – STATE-LEVEL IMPACTS
Impact on
Georgia
Pro-development Policies (incremental) Baseline (absolute) Regulatory Constraints (incremental)
2020 2025 2030 2035 2020 2025 2030 2035 2020 2025 2030 2035
Oil and Natural
Gas Production
+0
kboed
+1
kboed
+86
kboed
+109
kboed
0
kboed
0
kboed
0
kboed
0
kboed
+0
kboed
+0
kboed
+0
kboed
+0
kboed
Total Jobs
Supported*
+1
thousand
+2
thousand
+12
thousand
+16
thousand
14
thousand
16
thousand
17
thousand
17
thousand
-1
thousand
-2
thousand
-2
thousand
-2
thousand
GDP / Year +$0.12
billion
+$0.19
billion
+$3.15
billion
+$4.16
billion
$1.54
billion
$1.75
billion
$1.83
billion
$1.87
billion
-$0.15
billion
-$0.17
billion
-$0.2
billion
-$0.24
billion
Government
Revenue** / Year
+$0.01
billion
+$0.01
billion
+$0.46
billion
+$0.56
billion
$0.09
billion
$0.1
billion
$0.1
Billion
$0.11
billion
-$0.01
billion
-$0.01
billion
-$0.01
billion
-$0.03
billion
Cumulative
Gov't Revenue**
(from 2016)
+$0.02
billion
+$0.06
billion
+$1.25
billion
+$4.1
billion
$0.41
billion
$0.89
billion
$1.4
\billion
$1.93
billion
-$0.02
billion
-$0.06
billion
-$0.11
billion
-$0.17
billion
*Jobs supported include direct, indirect and induced job creation
**Does not include federal government tax revenue
***Georgia is expected to benefit from Atlantic coastal area offshore development under pro-development policies scenario

© Wood Mackenzie 105
Hawaii – Impacts Summary APPENDIX – STATE-LEVEL IMPACTS
Impact on
Hawaii
Pro-development Policies (incremental) Baseline (absolute) Regulatory Constraints (incremental)
2020 2025 2030 2035 2020 2025 2030 2035 2020 2025 2030 2035
Oil and Natural
Gas Production
+0
kboed
+0
kboed
+0
kboed
+0
kboed
0
kboed
0
kboed
0
kboed
0
kboed
+0
kboed
+0
kboed
+0
kboed
+0
kboed
Total Jobs
Supported*
+0
thousand
+1
thousand
+1
thousand
+1
thousand
7
thousand
8
thousand
8
thousand
8
thousand
-1
thousand
-1
thousand
-1
thousand
-1
thousand
GDP / Year +$0.03
billion
+$0.07
billion
+$0.15
billion
+$0.17
billion
$1.12
billion
$1.2
billion
$1.23
billion
$1.24
billion
-$0.12
billion
-$0.13
billion
-$0.13
billion
-$0.15
billion
Government
Revenue** / Year
+$0
billion
+$0
billion
+$0.01
billion
+$0.01
billion
$0.04
billion
$0.04
billion
$0.04
billion
$0.04
billion
-$0
billion
-$0
billion
-$0
billion
-$0.01
billion
Cumulative
Gov't Revenue**
(from 2016)
+$0.01
billion
+$0.02
billion
+$0.04
billion
+$0.1
billion
$0.16
billion
$0.35
billion
$0.54
billion
$0.74
billion
-$0.01
billion
-$0.03
billion
-$0.04
billion
-$0.06
billion
*Jobs supported include direct, indirect and induced job creation
**Does not include federal government tax revenue

© Wood Mackenzie 106
Idaho – Impacts Summary APPENDIX – STATE-LEVEL IMPACTS
Impact on
Idaho
Pro-development Policies (incremental) Baseline (absolute) Regulatory Constraints (incremental)
2020 2025 2030 2035 2020 2025 2030 2035 2020 2025 2030 2035
Oil and Natural
Gas Production
+0
kboed
+0
kboed
+0
kboed
+0
kboed
0
kboed
0
kboed
0
kboed
0
kboed
+0
kboed
+0
kboed
+0
kboed
+0
kboed
Total Jobs
Supported*
+0
thousand
+0
thousand
+1
thousand
+1
thousand
3
thousand
3
thousand
3
thousand
4
thousand
-0
thousand
-0
thousand
-0
thousand
-1
thousand
GDP / Year +$0.02
billion
+$0.03
billion
+$0.06
billion
+$0.07
billion
$0.31
billion
$0.34
billion
$0.36
billion
$0.36
billion
-$0.04
billion
-$0.04
billion
-$0.05
billion
-$0.05
billion
Government
Revenue** / Year
+$0
billion
+$0
billion
+$0
billion
+$0
billion
$0.02
billion
$0.02
billion
$0.02
billion
$0.02
billion
-$0
billion
-$0
billion
-$0
billion
-$0.01
billion
Cumulative
Gov't Revenue**
(from 2016)
+$0
billion
+$0.01
billion
+$0.02
billion
+$0
billion
$0.07
billion
$0.16
billion
$0.25
billion
$0.35
billion
-$0.01
billion
-$0.02
billion
-$0.03
billion
-$0.04
billion
*Jobs supported include direct, indirect and induced job creation
**Does not include federal government tax revenue

© Wood Mackenzie 107
Illinois – Impacts Summary APPENDIX – STATE-LEVEL IMPACTS
Impact on
Illinois
Pro-development Policies (incremental) Baseline (absolute) Regulatory Constraints (incremental)
2020 2025 2030 2035 2020 2025 2030 2035 2020 2025 2030 2035
Oil and Natural
Gas Production
+0
kboed
+0
kboed
+0
kboed
-0
kboed
21
kboed
24
kboed
27
kboed
30
kboed
-1
kboed
-2
kboed
-3
kboed
-4
kboed
Total Jobs
Supported*
+4
thousand
+7
thousand
+12
thousand
+13
thousand
67
thousand
72
thousand
74
thousand
74
thousand
-6
thousand
-7
thousand
-6
thousand
-7
thousand
GDP / Year +$0.09
billion
+$0.31
billion
+$1
billion
+$1.15
billion
$13.05
billion
$14.45
billion
$15.51
billion
$15.69
billion
-$1.09
billion
-$1.33
billion
-$1.24
billion
-$1.55
billion
Government
Revenue** / Year
+$0.01
billion
+$0.03
billion
+$0.08
billion
+$0.08
billion
$0.66
billion
$0.72
billion
$0.75
billion
$0.76
billion
-$0.06
billion
-$0.07
billion
-$0.06
billion
-$0.16
billion
Cumulative
Gov't Revenue**
(from 2016)
+$0.02
billion
+$0.16
billion
+$0.43
billion
+$0.8
billion
$3.03
billion
$6.44
billion
$10.19
billion
$13.98
billion
-$0.18
billion
-$0.49
billion
-$0.83
billion
-$1.16
billion
*Jobs supported include direct, indirect and induced job creation
**Does not include federal government tax revenue

© Wood Mackenzie 108
Indiana – Impacts Summary APPENDIX – STATE-LEVEL IMPACTS
Impact on
Indiana
Pro-development Policies (incremental) Baseline (absolute) Regulatory Constraints (incremental)
2020 2025 2030 2035 2020 2025 2030 2035 2020 2025 2030 2035
Oil and Natural
Gas Production
-0
kboed
-0
kboed
-0
kboed
-0
kboed
12
kboed
12
kboed
12
kboed
12
kboed
+0
kboed
+0
kboed
-0
kboed
+0
kboed
Total Jobs
Supported*
+1
thousand
+2
thousand
+4
thousand
+5
thousand
38
thousand
40
thousand
41
thousand
42
thousand
-2
thousand
-3
thousand
-3
thousand
-4
thousand
GDP / Year -$0.02
billion
+$0.12
billion
+$0.38
billion
+$0.43
billion
$6.61
billion
$7.17
billion
$7.58
billion
$7.65
billion
-$0.42
billion
-$0.47
billion
-$0.51
billion
-$0.65
billion
Government
Revenue** / Year
+$0
billion
+$0.01
billion
+$0.03
billion
+$0.03
billion
$0.26
billion
$0.28
billion
$0.29
billion
$0.29
billion
-$0.02
billion
-$0.02
billion
-$0.02
billion
-$0.06
billion
Cumulative
Gov't Revenue**
(from 2016)
+$0.01
billion
+$0.05
billion
+$0.15
billion
+$0.3
billion
$1.2
billion
$2.55
billion
$3.97
billion
$5.42
billion
-$0.06
billion
-$0.15
billion
-$0.26
billion
-$0.38
billion
*Jobs supported include direct, indirect and induced job creation
**Does not include federal government tax revenue

© Wood Mackenzie 109
Iowa – Impacts Summary APPENDIX – STATE-LEVEL IMPACTS
Impact on
Iowa
Pro-development Policies (incremental) Baseline (absolute) Regulatory Constraints (incremental)
2020 2025 2030 2035 2020 2025 2030 2035 2020 2025 2030 2035
Oil and Natural
Gas Production
+0
kboed
+0
kboed
+0
kboed
+0
kboed
0
kboed
0
kboed
0
kboed
0
kboed
+0
kboed
+0
kboed
+0
kboed
+0
kboed
Total Jobs
Supported*
+0
thousand
+1
thousand
+1
thousand
+2
thousand
9
thousand
10
thousand
10
thousand
10
thousand
-1
thousand
-1
thousand
-1
thousand
-1
thousand
GDP / Year +$0.05
billion
+$0.08
billion
+$0.16
billion
+$0.18
billion
$0.9
billion
$1.02
billion
$1.07
billion
$1.08
billion
-$0.09
billion
-$0.1
billion
-$0.11
billion
-$0.13
billion
Government
Revenue** / Year
+$0
billion
+$0
billion
+$0.01
billion
+$0.01
billion
$0.05
billion
$0.06
billion
$0.06
billion
$0.06
billion
-$0
billion
-$0
billion
-$0.01
billion
-$0.02
billion
Cumulative
Gov't Revenue**
(from 2016)
+$0.01
billion
+$0.03
billion
+$0.06
billion
+$0.1
billion
$0.24
billion
$0.53
billion
$0.84
billion
$1.16
billion
-$0.01
billion
-$0.04
billion
-$0.06
billion
-$0.09
billion
*Jobs supported include direct, indirect and induced job creation
**Does not include federal government tax revenue

© Wood Mackenzie 110
Kansas – Impacts Summary APPENDIX – STATE-LEVEL IMPACTS
Impact on
Kansas
Pro-development Policies (incremental) Baseline (absolute) Regulatory Constraints (incremental)
2020 2025 2030 2035 2020 2025 2030 2035 2020 2025 2030 2035
Oil and Natural
Gas Production
-32
kboed
-27
kboed
-25
kboed
-26
kboed
227
kboed
207
kboed
205
kboed
207
kboed
-18
kboed
-33
kboed
-49
kboed
-63
kboed
Total Jobs
Supported*
-4
thousand
+1
thousand
+8
thousand
+9
thousand
75
thousand
79
thousand
85
thousand
89
thousand
-9
thousand
-11
thousand
-13
thousand
-16
thousand
GDP / Year -$1.14
billion
-$0.72
billion
-$0.07
billion
+$0.07
billion
$11.56
billion
$11.97
billion
$12.63
billion
$13.04
billion
-$1.15
billion
-$1.54
billion
-$1.93
billion
-$2.4
billion
Government
Revenue** / Year
-$0.11
billion
-$0.08
billion
-$0.04
billion
-$0.03
billion
$1.14
billion
$1.14
billion
$1.17
billion
$1.14
billion
-$0.09
billion
-$0.13
billion
-$0.17
billion
-$0.39
billion
Cumulative
Gov't Revenue**
(from 2016)
-$0.54
billion
-$0.96
billion
-$1.21
billion
-$1.3
billion
$5.47
billion
$11.16
billion
$16.97
billion
$22.88
billion
-$0.32
billion
-$0.89
billion
-$1.68
billion
-$2.71
billion
*Jobs supported include direct, indirect and induced job creation
**Does not include federal government tax revenue

© Wood Mackenzie 111
Kentucky – Impacts Summary APPENDIX – STATE-LEVEL IMPACTS
Impact on
Kentucky
Pro-development Policies (incremental) Baseline (absolute) Regulatory Constraints (incremental)
2020 2025 2030 2035 2020 2025 2030 2035 2020 2025 2030 2035
Oil and Natural
Gas Production
-0
kboed
-0
kboed
-0
kboed
-0
kboed
64
kboed
65
kboed
64
kboed
64
kboed
+1
kboed
+0
kboed
-0
kboed
+0
kboed
Total Jobs
Supported*
+1
thousand
+1
thousand
+3
thousand
+3
thousand
24
thousand
26
thousand
26
thousand
27
thousand
-2
thousand
-2
thousand
-2
thousand
-3
thousand
GDP / Year +$0.03
billion
+$0.1
billion
+$0.26
billion
+$0.27
billion
$3.33
billion
$3.59
billion
$3.76
billion
$3.78
billion
-$0.23
billion
-$0.24
billion
-$0.3
billion
-$0.38
billion
Government
Revenue** / Year
+$0
billion
+$0.01
billion
+$0.01
billion
+$0.01
billion
$0.23
billion
$0.24
billion
$0.24
billion
$0.24
billion
-$0.01
billion
-$0.01
billion
-$0.02
billion
-$0.06
billion
Cumulative
Gov't Revenue**
(from 2016)
+$0.01
billion
+$0.03
billion
+$0.08
billion
+$0.2
billion
$1.03
billion
$2.2
billion
$3.42
billion
$4.63
billion
-$0.04
billion
-$0.11
billion
-$0.21
billion
-$0.32
billion
*Jobs supported include direct, indirect and induced job creation
**Does not include federal government tax revenue

© Wood Mackenzie 112
Louisiana – Impacts Summary APPENDIX – STATE-LEVEL IMPACTS
*Jobs supported include direct, indirect and induced job creation
**Does not include federal government tax revenue
***Total production decline under pro-development policies scenario is driven by expected lower natural gas production as more economic sources of supply become available in
Eastern GOM. Economic impact upsides are driven by expected sustained increases in oil production. Gas production increase under regulatory constraints scenario is caused by
expected rocky mountain region gas supply loss
Impact on
Louisiana
Pro-development Policies (incremental) Baseline (absolute) Regulatory Constraints (incremental)
2020 2025 2030 2035 2020 2025 2030 2035 2020 2025 2030 2035
Oil and Natural
Gas Production
+44
kboed
+10
kboed
-365
kboed
-204
kboed
2046
kboed
2575
kboed
3336
kboed
3430
kboed
+718
kboed
+436
kboed
+160
kboed
+161
kboed
Total Jobs
Supported*
+27
thousand
+81
thousand
+107
thousand
+86
thousand
499
thousand
566
thousand
565
thousand
548
thousand
+41
thousand
+37
thousand
+12
thousand
+10
thousand
GDP / Year +$5
billion
+$13
billion
+$15
billion
+$12
billion
$87
billion
$101
billion
$98
billion
$91
billion
+$7
billion
+$4
billion
+$1
billion
+1
Billion
Government
Revenue** / Year
+$0
billion
+$1
billion
+$1
billion
+$1
billion
$5
billion
$7
billion
$7
billion
$6
Billion
+$1
billion
+$1
billion
+$1
billion
+$3
billion
Cumulative
Gov't Revenue**
(from 2016)
+$1
billion
+$3
billion
+$6
billion
+$9
billion
$25
billion
$57
billion
$90
billion
$122
billion
+$2
billion
+$5
billion
+$9
billion
+$12
billion

© Wood Mackenzie 113
Maine – Impacts Summary APPENDIX – STATE-LEVEL IMPACTS
Impact on
Maine
Pro-development Policies (incremental) Baseline (absolute) Regulatory Constraints (incremental)
2020 2025 2030 2035 2020 2025 2030 2035 2020 2025 2030 2035
Oil and Natural
Gas Production
+0
kboed
+0
kboed
+0
kboed
+0
kboed
0
kboed
0
kboed
0
kboed
0
kboed
+0
kboed
+0
kboed
+0
kboed
+0
kboed
Total Jobs
Supported*
+0
thousand
+0
thousand
+1
thousand
+1
thousand
4
thousand
4
thousand
4
thousand
4
thousand
-0
thousand
-0
thousand
-0
thousand
-1
thousand
GDP / Year +$0.02
billion
+$0.06
billion
+$0.14
billion
+$0.14
billion
$0.54
billion
$0.6
billion
$0.61
billion
$0.62
billion
-$0.07
billion
-$0.06
billion
-$0.06
billion
-$0.09
billion
Government
Revenue** / Year
+$0
billion
+$0
billion
+$0
billion
+$0.01
billion
$0.03
billion
$0.03
billion
$0.03
billion
$0.03
billion
-$0
billion
-$0
billion
-$0
billion
-$0.01
billion
Cumulative
Gov't Revenue**
(from 2016)
+$0
billion
+$0.01
billion
+$0.03
billion
+$0.1
billion
$0.12
billion
$0.27
billion
$0.43
billion
$0.59
billion
-$0.01
billion
-$0.02
billion
-$0.03
billion
-$0.05
billion
*Jobs supported include direct, indirect and induced job creation
**Does not include federal government tax revenue

© Wood Mackenzie 114
Maryland – Impacts Summary APPENDIX – STATE-LEVEL IMPACTS
Impact on
Maryland
Pro-development Policies (incremental) Baseline (absolute) Regulatory Constraints (incremental)
2020 2025 2030 2035 2020 2025 2030 2035 2020 2025 2030 2035
Oil and Natural
Gas Production
+0
kboed
+0
kboed
+0
kboed
+0
kboed
0
kboed
0
kboed
0
kboed
0
kboed
+0
kboed
+0
kboed
+0
kboed
+0
kboed
Total Jobs
Supported*
+2
thousand
+3
thousand
+4
thousand
+4
thousand
10
thousand
11
thousand
11
thousand
12
thousand
-1
thousand
-1
thousand
-2
thousand
-2
thousand
GDP / Year +$0.28
billion
+$0.41
billion
+$0.52
billion
+$0.56
billion
$1.04
billion
$1.17
billion
$1.22
billion
$1.24
billion
-$0.14
billion
-$0.15
billion
-$0.19
billion
-$0.22
billion
Government
Revenue** / Year
+$0.02
billion
+$0.03
billion
+$0.03
billion
+$0.04
billion
$0.06
billion
$0.06
billion
$0.07
billion
$0.07
billion
-$0.01
billion
-$0.01
billion
-$0.01
billion
-$0.03
billion
Cumulative
Gov't Revenue**
(from 2016)
+$0.17
billion
+$0.29
billion
+$0.45
billion
+$0.6
billion
$0.25
billion
$0.55
billion
$0.87
billion
$1.2
billion
-$0.02
billion
-$0.06
billion
-$0.11
billion
-$0.16
billion
*Jobs supported include direct, indirect and induced job creation
**Does not include federal government tax revenue
***Maryland is expected to benefit from Cove Point LNG project under pro-development policies scenario

© Wood Mackenzie 115
Massachusetts – Impacts Summary APPENDIX – STATE-LEVEL IMPACTS
Impact on
Massachusetts
Pro-development Policies (incremental) Baseline (absolute) Regulatory Constraints (incremental)
2020 2025 2030 2035 2020 2025 2030 2035 2020 2025 2030 2035
Oil and Natural
Gas Production
+0
kboed
+0
kboed
+0
kboed
+0
kboed
0
kboed
0
kboed
0
kboed
0
kboed
+0
kboed
+0
kboed
+0
kboed
+0
kboed
Total Jobs
Supported*
-2
thousand
-1
thousand
+0
thousand
+1
thousand
15
thousand
16
thousand
17
thousand
17
thousand
-1
thousand
-2
thousand
-2
thousand
-2
thousand
GDP / Year -$0.11
billion
-$0.02
billion
+$0.14
billion
+$0.2
billion
$1.75
billion
$1.91
billion
$1.97
billion
$1.98
billion
-$0.17
billion
-$0.18
billion
-$0.21
billion
-$0.25
billion
Government
Revenue** / Year
-$0.01
billion
-$0
billion
+$0.01
billion
+$0.01
billion
$0.09
billion
$0.1
billion
$0.11
billion
$0.11
billion
-$0.01
billion
-$0.01
billion
-$0.01
billion
-$0.03
billion
Cumulative
Gov't Revenue**
(from 2016)
-$0.03
billion
-$0.05
billion
-$0.03
billion
+$0
billion
$0.43
billion
$0.93
billion
$1.46
billion
$2
billion
-$0.03
billion
-$0.08
billion
-$0.13
billion
-$0.19
billion
*Jobs supported include direct, indirect and induced job creation
**Does not include federal government tax revenue

© Wood Mackenzie 116
Michigan – Impacts Summary APPENDIX – STATE-LEVEL IMPACTS
Impact on
Michigan
Pro-development Policies (incremental) Baseline (absolute) Regulatory Constraints (incremental)
2020 2025 2030 2035 2020 2025 2030 2035 2020 2025 2030 2035
Oil and Natural
Gas Production
+0
kboed
+4
kboed
+2
kboed
+3
kboed
71
kboed
101
kboed
125
kboed
157
kboed
-1
kboed
-8
kboed
-14
kboed
-20
kboed
Total Jobs
Supported*
+1
thousand
+4
thousand
+7
thousand
+7
thousand
36
thousand
43
thousand
48
thousand
53
thousand
-3
thousand
-4
thousand
-5
thousand
-7
thousand
GDP / Year +$0.1
billion
+$0.38
billion
+$0.68
billion
+$0.74
billion
$5.03
billion
$5.98
billion
$6.71
billion
$7.37
billion
-$0.44
billion
-$0.55
billion
-$0.71
billion
-$0.94
billion
Government
Revenue** / Year
+$0.01
billion
+$0.03
billion
+$0.05
billion
+$0.05
billion
$0.32
billion
$0.39
billion
$0.45
billion
$0.5
billion
-$0.02
billion
-$0.03
billion
-$0.04
billion
-$0.11
billion
Cumulative
Gov't Revenue**
(from 2016)
+$0.02
billion
+$0.1
billion
+$0.28
billion
+$0.6
billion
$1.46
billion
$3.27
billion
$5.39
billion
$7.82
billion
-$0.09
billion
-$0.23
billion
-$0.42
billion
-$0.66
billion
*Jobs supported include direct, indirect and induced job creation
**Does not include federal government tax revenue

© Wood Mackenzie 117
Minnesota – Impacts Summary APPENDIX – STATE-LEVEL IMPACTS
Impact on
Minnesota
Pro-development Policies (incremental) Baseline (absolute) Regulatory Constraints (incremental)
2020 2025 2030 2035 2020 2025 2030 2035 2020 2025 2030 2035
Oil and Natural
Gas Production
+0
kboed
+0
kboed
+0
kboed
+0
kboed
0
kboed
0
kboed
0
kboed
0
kboed
+0
kboed
+0
kboed
+0
kboed
+0
kboed
Total Jobs
Supported*
+1
thousand
+2
thousand
+3
thousand
+3
thousand
36
thousand
39
thousand
41
thousand
41
thousand
-4
thousand
-4
thousand
-5
thousand
-6
thousand
GDP / Year +$0.09
billion
+$0.17
billion
+$0.28
billion
+$0.31
billion
$6.69
billion
$7.35
billion
$7.88
billion
$7.99
billion
-$0.56
billion
-$0.66
billion
-$0.72
billion
-$0.88
billion
Government
Revenue** / Year
+$0
billion
+$0.01
billion
+$0.01
billion
+$0.02
billion
$0.27
billion
$0.29
billion
$0.3
billion
$0.31
billion
-$0.02
billion
-$0.03
billion
-$0.03
billion
-$0.09
billion
Cumulative
Gov't Revenue**
(from 2016)
+$0.03
billion
+$0.07
billion
+$0.13
billion
+$0.2
billion
$1.24
billion
$2.64
billion
$4.13
billion
$5.64
billion
-$0.08
billion
-$0.21
billion
-$0.36
billion
-$0.53
billion
*Jobs supported include direct, indirect and induced job creation
**Does not include federal government tax revenue

© Wood Mackenzie 118
Mississippi – Impacts Summary APPENDIX – STATE-LEVEL IMPACTS
Impact on
Mississippi
Pro-development Policies (incremental) Baseline (absolute) Regulatory Constraints (incremental)
2020 2025 2030 2035 2020 2025 2030 2035 2020 2025 2030 2035
Oil and Natural
Gas Production
-3
kboed
+6
kboed
+34
kboed
+43
kboed
151
kboed
251
kboed
286
kboed
312
kboed
-18
kboed
-40
kboed
-48
kboed
-52
kboed
Total Jobs
Supported*
-2
thousand
+1
thousand
+10
thousand
+10
thousand
57
thousand
72
thousand
77
thousand
80
thousand
-5
thousand
-7
thousand
-9
thousand
-10
thousand
GDP / Year -$0.29
billion
+$0.1
billion
+$1.18
billion
+$1.23
billion
$8.58
billion
$10.9
billion
$11.91
billion
$12.2
billion
-$0.68
billion
-$1.1
billion
-$1.29
billion
-$1.46
billion
Government
Revenue** / Year
+$0.02
billion
+$0.08
billion
+$0.18
billion
+$0.21
billion
$0.78
billion
$1.1
billion
$1.24
billion
$1.28
billion
-$0.05
billion
-$0.09
billion
-$0.12
billion
-$0.28
billion
Cumulative
Gov't Revenue**
(from 2016)
+$0.06
billion
+$0.31
billion
+$1.03
billion
+$2.1
billion
$3.25
billion
$8.18
billion
$14.17
billion
$20.52
billion
-$0.18
billion
-$0.57
billion
-$1.12
billion
-$1.76
billion
*Jobs supported include direct, indirect and induced job creation
**Does not include federal government tax revenue
***Mississippi is expected to benefit from Eastern GoM coastal area offshore development under pro-development policies scenario

© Wood Mackenzie 119
Missouri – Impacts Summary APPENDIX – STATE-LEVEL IMPACTS
Impact on
Missouri
Pro-development Policies (incremental) Baseline (absolute) Regulatory Constraints (incremental)
2020 2025 2030 2035 2020 2025 2030 2035 2020 2025 2030 2035
Oil and Natural
Gas Production
+0
kboed
+0
kboed
+0
kboed
+0
kboed
1
kboed
1
kboed
1
kboed
1
kboed
+0
kboed
+0
kboed
+0
kboed
+0
kboed
Total Jobs
Supported*
+1
thousand
+1
thousand
+2
thousand
+2
thousand
10
thousand
11
thousand
12
thousand
12
thousand
-1
thousand
-1
thousand
-1
thousand
-2
thousand
GDP / Year +$0.07
billion
+$0.11
billion
+$0.19
billion
+$0.22
billion
$1.03
billion
$1.15
billion
$1.21
billion
$1.23
billion
-$0.11
billion
-$0.12
billion
-$0.15
billion
-$0.18
billion
Government
Revenue** / Year
+$0
billion
+$0.01
billion
+$0.01
billion
+$0.01
billion
$0.06
billion
$0.07
billion
$0.07
billion
$0.07
billion
-$0.01
billion
-$0.01
billion
-$0.01
billion
-$0.02
billion
Cumulative
Gov't Revenue**
(from 2016)
+$0.02
billion
+$0.04
billion
+$0.08
billion
+$0.1
billion
$0.27
billion
$0.59
billion
$0.93
billion
$1.28
billion
-$0.02
billion
-$0.05
billion
-$0.08
billion
-$0.13
billion
*Jobs supported include direct, indirect and induced job creation
**Does not include federal government tax revenue

© Wood Mackenzie 120
Montana – Impacts Summary APPENDIX – STATE-LEVEL IMPACTS
Impact on
Montana
Pro-development Policies (incremental) Baseline (absolute) Regulatory Constraints (incremental)
2020 2025 2030 2035 2020 2025 2030 2035 2020 2025 2030 2035
Oil and Natural
Gas Production
+0
kboed
+1
kboed
+0
kboed
+0
kboed
91
kboed
108
kboed
118
kboed
120
kboed
-3
kboed
-3
kboed
-2
kboed
-1
kboed
Total Jobs
Supported*
+1
thousand
+3
thousand
+5
thousand
+5
thousand
34
thousand
38
thousand
40
thousand
41
thousand
-3
thousand
-3
thousand
-2
thousand
-2
thousand
GDP / Year +$0.02
billion
+$0.17
billion
+$0.48
billion
+$0.5
billion
$6.41
billion
$7.25
billion
$7.76
billion
$7.94
billion
-$0.42
billion
-$0.42
billion
-$0.35
billion
-$0.39
billion
Government
Revenue** / Year
+$0.01
billion
+$0.02
billion
+$0.05
billion
+$0.04
billion
$0.72
billion
$0.89
billion
$0.99
billion
$1.04
billion
-$0.05
billion
-$0.05
billion
-$0.04
billion
-$0.06
billion
Cumulative
Gov't Revenue**
(from 2016)
+$0.04
billion
+$0.11
billion
+$0.28
billion
+$0.5
billion
$3.11
billion
$7.23
billion
$11.99
billion
$17.11
billion
-$0.15
billion
-$0.41
billion
-$0.64
billion
-$0.82
billion
*Jobs supported include direct, indirect and induced job creation
**Does not include federal government tax revenue

© Wood Mackenzie 121
Nebraska – Impacts Summary APPENDIX – STATE-LEVEL IMPACTS
Impact on
Nebraska
Pro-development Policies (incremental) Baseline (absolute) Regulatory Constraints (incremental)
2020 2025 2030 2035 2020 2025 2030 2035 2020 2025 2030 2035
Oil and Natural
Gas Production
+3
kboed
+3
kboed
+3
kboed
+3
kboed
19
kboed
23
kboed
20
kboed
17
kboed
-2
kboed
-3
kboed
-1
kboed
-0
kboed
Total Jobs
Supported*
+1
thousand
+1
thousand
+2
thousand
+2
thousand
17
thousand
20
thousand
21
thousand
20
thousand
-1
thousand
-2
thousand
-2
thousand
-2
thousand
GDP / Year +$0.14
billion
+$0.19
billion
+$0.26
billion
+$0.26
billion
$2.32
billion
$2.68
billion
$2.71
billion
$2.64
billion
-$0.2
billion
-$0.26
billion
-$0.23
billion
-$0.23
billion
Government
Revenue** / Year
+$0.01
billion
+$0.02
billion
+$0.02
billion
+$0.02
billion
$0.2
billion
$0.24
billion
$0.22
billion
$0.19
billion
-$0.01
billion
-$0.02
billion
-$0.01
billion
-$0.03
billion
Cumulative
Gov't Revenue**
(from 2016)
+$0.08
billion
+$0.16
billion
+$0.24
billion
+$0.3
billion
$0.81
billion
$1.96
billion
$3.12
billion
$4.15
billion
-$0.04
billion
-$0.12
billion
-$0.2
billion
-$0.25
billion
*Jobs supported include direct, indirect and induced job creation
**Does not include federal government tax revenue

© Wood Mackenzie 122
Nevada – Impacts Summary APPENDIX – STATE-LEVEL IMPACTS
Impact on
Nevada
Pro-development Policies (incremental) Baseline (absolute) Regulatory Constraints (incremental)
2020 2025 2030 2035 2020 2025 2030 2035 2020 2025 2030 2035
Oil and Natural
Gas Production
+0
kboed
+0
kboed
+0
kboed
+0
kboed
0
kboed
0
kboed
0
kboed
0
kboed
+0
kboed
+0
kboed
+0
kboed
+0
kboed
Total Jobs
Supported*
+0
thousand
+1
thousand
+2
thousand
+2
thousand
7
thousand
8
thousand
8
thousand
8
thousand
-1
thousand
-1
thousand
-1
thousand
-1
thousand
GDP / Year +$0.04
billion
+$0.09
billion
+$0.18
billion
+$0.2
billion
$0.82
billion
$0.91
billion
$0.94
billion
$0.95
billion
-$0.09
billion
-$0.1
billion
-$0.1
billion
-$0.13
billion
Government
Revenue** / Year
+$0
billion
+$0
billion
+$0.01
billion
+$0.01
billion
$0.04
billion
$0.04
billion
$0.04
billion
$0.04
billion
-$0
billion
-$0
billion
-$0.01
billion
-$0.02
billion
Cumulative
Gov't Revenue**
(from 2016)
+$0.01
billion
+$0.02
billion
+$0.06
billion
+$0.1
billion
$0.17
billion
$0.38
billion
$0.6
billion
$0.83
billion
-$0.01
billion
-$0.04
billion
-$0.06
billion
-$0.09
billion
*Jobs supported include direct, indirect and induced job creation
**Does not include federal government tax revenue

© Wood Mackenzie 123
New Hampshire – Impacts Summary APPENDIX – STATE-LEVEL IMPACTS
Impact on New
Hampshire
Pro-development Policies (incremental) Baseline (absolute) Regulatory Constraints (incremental)
2020 2025 2030 2035 2020 2025 2030 2035 2020 2025 2030 2035
Oil and Natural
Gas Production
+0
kboed
+0
kboed
+0
kboed
+0
kboed
0
kboed
0
kboed
0
kboed
0
kboed
+0
kboed
+0
kboed
+0
kboed
+0
kboed
Total Jobs
Supported*
+0
thousand
+0
thousand
+1
thousand
+1
thousand
4
thousand
4
thousand
4
thousand
4
thousand
-0
thousand
-1
thousand
-1
thousand
-1
thousand
GDP / Year +$0.03
billion
+$0.04
billion
+$0.06
billion
+$0.07
billion
$0.42
billion
$0.47
billion
$0.5
billion
$0.51
billion
-$0.05
billion
-$0.06
billion
-$0.07
billion
-$0.08
billion
Government
Revenue** / Year
+$0
billion
+$0
billion
+$0
billion
+$0
billion
$0.02
billion
$0.02
billion
$0.02
billion
$0.03
billion
-$0
billion
-$0
billion
-$0
billion
-$0.01
billion
Cumulative
Gov't Revenue**
(from 2016)
+$0.01
billion
+$0.02
billion
+$0.03
billion
+$0
billion
$0.09
billion
$0.2
billion
$0.32
billion
$0.45
billion
-$0.01
billion
-$0.02
billion
-$0.04
billion
-$0.06
billion
*Jobs supported include direct, indirect and induced job creation
**Does not include federal government tax revenue

© Wood Mackenzie 124
New Jersey – Impacts Summary APPENDIX – STATE-LEVEL IMPACTS
Impact on
New Jersey
Pro-development Policies (incremental) Baseline (absolute) Regulatory Constraints (incremental)
2020 2025 2030 2035 2020 2025 2030 2035 2020 2025 2030 2035
Oil and Natural
Gas Production
+0
kboed
+2
kboed
+112
kboed
+142
kboed
0
kboed
0
kboed
0
kboed
0
kboed
+0
kboed
+0
kboed
+0
kboed
+0
kboed
Total Jobs
Supported*
+1
thousand
+2
thousand
+16
thousand
+21
thousand
33
thousand
35
thousand
36
thousand
36
thousand
-2
thousand
-2
thousand
-3
thousand
-3
thousand
GDP / Year +$0.1
billion
+$0.24
billion
+$4.34
billion
+$5.74
billion
$4.07
billion
$4.44
billion
$4.61
billion
$4.64
billion
-$0.34
billion
-$0.36
billion
-$0.4
billion
-$0.48
billion
Government
Revenue** / Year
+$0.01
billion
+$0.01
billion
+$0.9
billion
+$1.11
billion
$0.32
billion
$0.35
billion
$0.37
billion
$0.37
billion
-$0.02
billion
-$0.02
billion
-$0.02
billion
-$0.05
billion
Cumulative
Gov't Revenue**
(from 2016)
+$0.02
billion
+$0.07
billion
+$2.39
billion
+$8
billion
$1.5
billion
$3.2
billion
$5.01
billion
$6.85
billion
-$0.06
billion
-$0.14
billion
-$0.24
billion
-$0.35
billion
*Jobs supported include direct, indirect and induced job creation
**Does not include federal government tax revenue
***New Jersey is expected to benefit from Atlantic coastal area offshore development under pro-development policies scenario

© Wood Mackenzie 125
New Mexico – Impacts Summary APPENDIX – STATE-LEVEL IMPACTS
Impact on
New Mexico
Pro-development Policies (incremental) Baseline (absolute) Regulatory Constraints (incremental)
2020 2025 2030 2035 2020 2025 2030 2035 2020 2025 2030 2035
Oil and Natural
Gas Production
+21
kboed
+104
kboed
+122
kboed
+89
kboed
1154
kboed
1203
kboed
1218
kboed
1216
kboed
-276
kboed
-428
kboed
-389
kboed
-302
kboed
Total Jobs
Supported*
+3
thousand
+14
thousand
+23
thousand
+18
thousand
175
thousand
183
thousand
180
thousand
182
thousand
-49
thousand
-56
thousand
-20
thousand
-12
thousand
GDP / Year +$0
billion
+$2
billion
+$3
billion
+$2
billion
$29
billion
$31
billion
$31
billion
$31
billion
-$8
billion
-$10
billion
-$5
billion
-$2
Billion
Government
Revenue** / Year
-$0
billion
+$0
billion
+$0
billion
+$0
Billion
$4
billion
$5
billion
$5
billion
$5
billion
-$1
billion
-$2
billion
-$1
billion
-$0
billion
Cumulative
Gov't Revenue**
(from 2016)
-$0
billion
-$0
billion
+$1
billion
+$1
billion
$19
billion
$41
billion
$65
billion
$89
billion
-$3
billion
-$11
billion
-$18
billion
-$18
billion
*Jobs supported include direct, indirect and induced job creation
**Does not include federal government tax revenue

© Wood Mackenzie 126
New York – Impacts Summary APPENDIX – STATE-LEVEL IMPACTS
Impact on
New York
Pro-development Policies (incremental) Baseline (absolute) Regulatory Constraints (incremental)
2020 2025 2030 2035 2020 2025 2030 2035 2020 2025 2030 2035
Oil and Natural
Gas Production
+14
kboed
+26
kboed
+29
kboed
+30
kboed
12
kboed
10
kboed
8
kboed
5
kboed
+0
kboed
+0
kboed
-0
kboed
+0
kboed
Total Jobs
Supported*
+2
thousand
+5
thousand
+9
thousand
+12
thousand
42
thousand
47
thousand
49
thousand
49
thousand
-5
thousand
-6
thousand
-7
thousand
-8
thousand
GDP / Year +$0.25
billion
+$0.5
billion
+$1.03
billion
+$1.3
billion
$4.72
billion
$5.28
billion
$5.44
billion
$5.43
billion
-$0.59
billion
-$0.64
billion
-$0.75
billion
-$0.91
billion
Government
Revenue** / Year
+$0.02
billion
+$0.03
billion
+$0.06
billion
+$0.07
billion
$0.28
billion
$0.31
billion
$0.32
billion
$0.32
billion
-$0.04
billion
-$0.04
billion
-$0.05
billion
-$0.12
billion
Cumulative
Gov't Revenue**
(from 2016)
+$0.05
billion
+$0.18
billion
+$0.43
billion
+$0.8
billion
$1.27
billion
$2.78
billion
$4.38
billion
$5.97
billion
-$0.13
billion
-$0.34
billion
-$0.58
billion
-$0.86
billion
*Jobs supported include direct, indirect and induced job creation
**Does not include federal government tax revenue
***New York is expected to benefit from repealing New York State hydraulic fracturing ban

© Wood Mackenzie 127
North Carolina – Impacts Summary APPENDIX – STATE-LEVEL IMPACTS
Impact on
North Carolina
Pro-development Policies (incremental) Baseline (absolute) Regulatory Constraints (incremental)
2020 2025 2030 2035 2020 2025 2030 2035 2020 2025 2030 2035
Oil and Natural
Gas Production
+0
kboed
+4
kboed
+258
kboed
+330
kboed
0
kboed
0
kboed
0
kboed
0
kboed
+0
kboed
+0
kboed
+0
kboed
+0
kboed
Total Jobs
Supported*
+1
thousand
+2
thousand
+34
thousand
+46
thousand
14
thousand
16
thousand
16
thousand
17
thousand
-2
thousand
-2
thousand
-2
thousand
-3
thousand
GDP / Year +$0.08
billion
+$0.17
billion
+$9.15
billion
+$12.27
billion
$1.45
billion
$1.64
billion
$1.71
billion
$1.73
billion
-$0.18
billion
-$0.19
billion
-$0.23
billion
-$0.27
billion
Government
Revenue** / Year
+$0
billion
+$0.01
billion
+$1.29
billion
+$1.58
billion
$0.08
billion
$0.09
billion
$0.09
billion
$0.09
billion
-$0.01
billion
-$0.01
billion
-$0.01
billion
-$0.03
billion
Cumulative
Gov't Revenue**
(from 2016)
+$0.02
billion
+$0.05
billion
+$3.35
billion
+$11.4
billion
$0.35
billion
$0.77
billion
$1.22
billion
$1.68
billion
-$0.03
billion
-$0.08
billion
-$0.13
billion
-$0.2
billion
*Jobs supported include direct, indirect and induced job creation
**Does not include federal government tax revenue
***North Carolina is expected to benefit from Atlantic coastal area offshore development under pro-development policies scenario
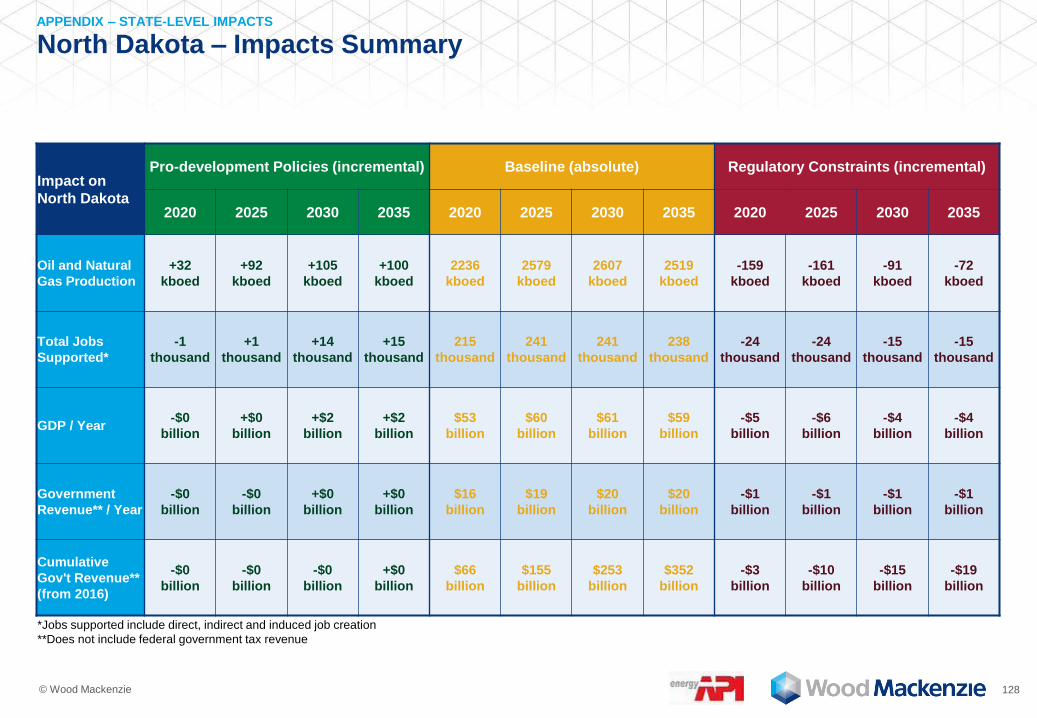
© Wood Mackenzie 128
North Dakota – Impacts Summary APPENDIX – STATE-LEVEL IMPACTS
Impact on
North Dakota
Pro-development Policies (incremental) Baseline (absolute) Regulatory Constraints (incremental)
2020 2025 2030 2035 2020 2025 2030 2035 2020 2025 2030 2035
Oil and Natural
Gas Production
+32
kboed
+92
kboed
+105
kboed
+100
kboed
2236
kboed
2579
kboed
2607
kboed
2519
kboed
-159
kboed
-161
kboed
-91
kboed
-72
kboed
Total Jobs
Supported*
-1
thousand
+1
thousand
+14
thousand
+15
thousand
215
thousand
241
thousand
241
thousand
238
thousand
-24
thousand
-24
thousand
-15
thousand
-15
thousand
GDP / Year -$0
billion
+$0
billion
+$2
billion
+$2
billion
$53
billion
$60
billion
$61
billion
$59
billion
-$5
billion
-$6
billion
-$4
billion
-$4
billion
Government
Revenue** / Year
-$0
billion
-$0
billion
+$0
billion
+$0
billion
$16
billion
$19
billion
$20
billion
$20
billion
-$1
billion
-$1
billion
-$1
billion
-$1
billion
Cumulative
Gov't Revenue**
(from 2016)
-$0
billion
-$0
billion
-$0
billion
+$0
billion
$66
billion
$155
billion
$253
billion
$352
billion
-$3
billion
-$10
billion
-$15
billion
-$19
billion
*Jobs supported include direct, indirect and induced job creation
**Does not include federal government tax revenue

© Wood Mackenzie 129
Ohio – Impacts Summary APPENDIX – STATE-LEVEL IMPACTS
Impact on
Ohio
Pro-development Policies (incremental) Baseline (absolute) Regulatory Constraints (incremental)
2020 2025 2030 2035 2020 2025 2030 2035 2020 2025 2030 2035
Oil and Natural
Gas Production
-8
kboed
-11
kboed
-9
kboed
-48
kboed
1684
kboed
2030
kboed
2089
kboed
2330
kboed
+197
kboed
+347
kboed
+524
kboed
+92
kboed
Total Jobs
Supported*
-0
thousand
+3
thousand
+10
thousand
+25
thousand
198
thousand
226
thousand
222
thousand
243
thousand
+2
thousand
+26
thousand
+38
thousand
-15
thousand
GDP / Year -$0
billion
+$0
billion
+$1
billion
+$3
billion
$30
billion
$34
billion
$34
billion
$37
billion
+$0
billion
+$4
billion
+$6
billion
-$3
billion
Government
Revenue** / Year
-$0
billion
+$0
\billion
+$0
billion
+$0
billion
$3
billion
$4
billion
$4
billion
$4
billion
+$0
billion
+$1
billion
+$2
billion
+$3
billion
Cumulative
Gov't Revenue**
(from 2016)
-$0
billion
-$0
billion
+$0
billion
+$0
billion
$13
billion
$29
billion
$48
billion
$67
billion
-$0
billion
+$5
billion
+$14
billion
+$25
billion
*Jobs supported include direct, indirect and induced job creation
**Does not include federal government tax revenue
***Gas production increase under regulatory constraints scenario is caused by expected rocky mountain region gas supply loss

© Wood Mackenzie 130
Oklahoma – Impacts Summary APPENDIX – STATE-LEVEL IMPACTS
Impact on
Oklahoma
Pro-development Policies (incremental) Baseline (absolute) Regulatory Constraints (incremental)
2020 2025 2030 2035 2020 2025 2030 2035 2020 2025 2030 2035
Oil and Natural
Gas Production
+289
kboed
+426
kboed
+419
kboed
+331
kboed
2147
kboed
2437
kboed
2121
kboed
1794
kboed
-26
kboed
-231
kboed
-140
kboed
-68
kboed
Total Jobs
Supported*
+32
thousand
+63
thousand
+95
thousand
+118
thousand
586
thousand
586
thousand
499
thousand
470
thousand
-37
thousand
-80
thousand
-48
thousand
-40
thousand
GDP / Year +$5
billion
+$9
billion
+$13
billion
+$15
billion
$84
billion
$87
billion
$75
billion
$69
billion
-$5
billion
-$11
billion
-$7
billion
-$6
billion
Government
Revenue** / Year
+$0
billion
+$0
billion
+$1
billion
+$1
billion
$6
billion
$7
billion
$7
billion
$6
billion
-$0
billion
-$1
billion
-$1
billion
-$1
billion
Cumulative
Gov't Revenue**
(from 2016)
+$1
billion
+$3
billion
+$6
billion
+$9
billion
$24
billion
$59
billion
$95
billion
$127
billion
-$1
billion
-$4
billion
-$7
billion
-$9
billion
*Jobs supported include direct, indirect and induced job creation
**Does not include federal government tax revenue

© Wood Mackenzie 131
Oregon – Impacts Summary APPENDIX – STATE-LEVEL IMPACTS
Impact on
Oregon
Pro-development Policies (incremental) Baseline (absolute) Regulatory Constraints (incremental)
2020 2025 2030 2035 2020 2025 2030 2035 2020 2025 2030 2035
Oil and Natural
Gas Production
-0
kboed
-0
kboed
-0
kboed
-0
kboed
0
kboed
0
kboed
0
kboed
0
kboed
+0
kboed
-0
kboed
+0
kboed
+0
kboed
Total Jobs
Supported*
+0
thousand
+1
thousand
+6
thousand
+6
thousand
9
thousand
10
thousand
10
thousand
11
thousand
-1
thousand
-1
thousand
-1
thousand
-2
thousand
GDP / Year +$0.07
billion
+$0.22
billion
+$1.02
billion
+$1.08
billion
$1.26
billion
$1.39
billion
$1.42
billion
$1.43
billion
-$0.17
billion
-$0.15
billion
-$0.15
billion
-$0.21
billion
Government
Revenue** / Year
+$0
billion
+$0.01
billion
+$0.1
billion
+$0.1
billion
$0.07
billion
$0.08
billion
$0.08
billion
$0.08
billion
-$0.01
billion
-$0.01
billion
-$0.01
billion
-$0.02
billion
Cumulative
Gov't Revenue**
(from 2016)
+$0.01
billion
+$0.65
billion
+$1.14
billion
+$1.7
billion
$0.31
billion
$0.67
billion
$1.06
billion
$1.45
billion
-$0.03
billion
-$0.07
billion
-$0.12
billion
-$0.16
billion
*Jobs supported include direct, indirect and induced job creation
**Does not include federal government tax revenue
***Oregon is expected to benefit from Oregon LNG project under pro-development policies scenario

© Wood Mackenzie 132
Pennsylvania – Impacts Summary APPENDIX – STATE-LEVEL IMPACTS
Impact on
Pennsylvania
Pro-development Policies (incremental) Baseline (absolute) Regulatory Constraints (incremental)
2020 2025 2030 2035 2020 2025 2030 2035 2020 2025 2030 2035
Oil and Natural
Gas Production
-20
kboed
-229
kboed
-403
kboed
-294
kboed
5084
kboed
5696
kboed
5837
kboed
5411
kboed
-196
kboed
+701
kboed
+422
kboed
+57
kboed
Total Jobs
Supported*
+0
thousand
-1
thousand
+0
thousand
+31
thousand
504
thousand
521
thousand
519
thousand
509
thousand
-37
thousand
+44
thousand
+6
thousand
-27
thousand
GDP / Year +$0
billion
-$1
billion
-$1
billion
+$3
billion
$83
billion
$87
billion
$87
billion
$84
billion
-$6
billion
+$7
billion
+$2
billion
-$4
billion
Government
Revenue** / Year
+$0
billion
-$0
billion
-$0
billion
+$0
billion
$5
billion
$6
billion
$6
billion
$5
billion
-$0
billion
+$0
billion
-$0
billion
+$1
Billion
Cumulative
Gov't Revenue**
(from 2016)
+$0
billion
-$0
billion
-$1
billion
-$1
billion
$20
billion
$48
billion
$76
billion
$103
billion
-$2
billion
-$2
billion
-$2
billion
-$2
billion
*Jobs supported include direct, indirect and induced job creation
**Does not include federal government tax revenue
***Gas production increase under regulatory constraints scenario is caused by expected rocky mountain region gas supply loss

© Wood Mackenzie 133
Rhode Island – Impacts Summary APPENDIX – STATE-LEVEL IMPACTS
Impact on
Rhode Island
Pro-development Policies (incremental) Baseline (absolute) Regulatory Constraints (incremental)
2020 2025 2030 2035 2020 2025 2030 2035 2020 2025 2030 2035
Oil and Natural
Gas Production
+0
kboed
+0
kboed
+0
kboed
+0
kboed
0
kboed
0
kboed
0
kboed
0
kboed
+0
kboed
+0
kboed
+0
kboed
+0
kboed
Total Jobs
Supported*
+0
thousand
+0
thousand
+0
thousand
+0
thousand
1
thousand
2
thousand
2
thousand
2
thousand
-0
thousand
-0
thousand
-0
thousand
-0
thousand
GDP / Year +$0.01
billion
+$0.01
billion
+$0.03
billion
+$0.03
billion
$0.16
billion
$0.18
billion
$0.19
billion
$0.19
billion
-$0.02
billion
-$0.02
billion
-$0.03
billion
-$0.03
billion
Government
Revenue** / Year
+$0
billion
+$0
billion
+$0
billion
+$0
billion
$0.01
billion
$0.01
billion
$0.01
billion
$0.01
billion
-$0
billion
-$0
billion
-$0
billion
-$0
billion
Cumulative
Gov't Revenue**
(from 2016)
+$0
billion
+$0
billion
+$0.01
billion
+$0
billion
$0.04
billion
$0.08
billion
$0.13
billion
$0.18
billion
-$0
billion
-$0.01
billion
-$0.01
billion
-$0.02
billion
*Jobs supported include direct, indirect and induced job creation
**Does not include federal government tax revenue
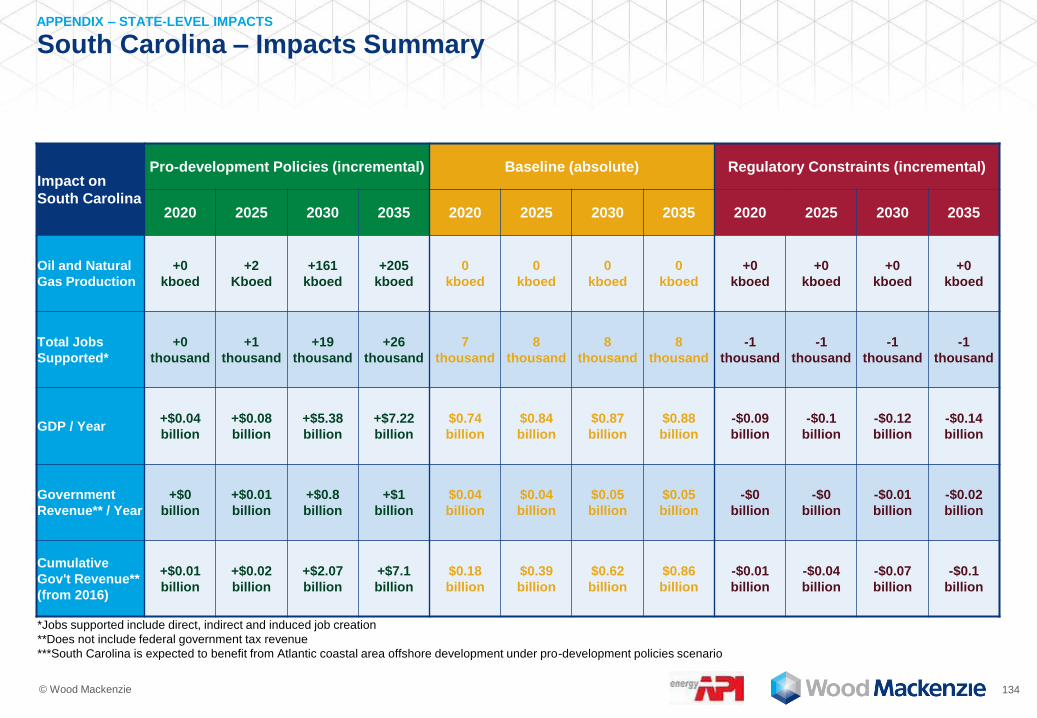
© Wood Mackenzie 134
South Carolina – Impacts Summary APPENDIX – STATE-LEVEL IMPACTS
Impact on
South Carolina
Pro-development Policies (incremental) Baseline (absolute) Regulatory Constraints (incremental)
2020 2025 2030 2035 2020 2025 2030 2035 2020 2025 2030 2035
Oil and Natural
Gas Production
+0
kboed
+2
Kboed
+161
kboed
+205
kboed
0
kboed
0
kboed
0
kboed
0
kboed
+0
kboed
+0
kboed
+0
kboed
+0
kboed
Total Jobs
Supported*
+0
thousand
+1
thousand
+19
thousand
+26
thousand
7
thousand
8
thousand
8
thousand
8
thousand
-1
thousand
-1
thousand
-1
thousand
-1
thousand
GDP / Year +$0.04
billion
+$0.08
billion
+$5.38
billion
+$7.22
billion
$0.74
billion
$0.84
billion
$0.87
billion
$0.88
billion
-$0.09
billion
-$0.1
billion
-$0.12
billion
-$0.14
billion
Government
Revenue** / Year
+$0
billion
+$0.01
billion
+$0.8
billion
+$1
billion
$0.04
billion
$0.04
billion
$0.05
billion
$0.05
billion
-$0
billion
-$0
billion
-$0.01
billion
-$0.02
billion
Cumulative
Gov't Revenue**
(from 2016)
+$0.01
billion
+$0.02
billion
+$2.07
billion
+$7.1
billion
$0.18
billion
$0.39
billion
$0.62
billion
$0.86
billion
-$0.01
billion
-$0.04
billion
-$0.07
billion
-$0.1
billion
*Jobs supported include direct, indirect and induced job creation
**Does not include federal government tax revenue
***South Carolina is expected to benefit from Atlantic coastal area offshore development under pro-development policies scenario

© Wood Mackenzie 135
South Dakota – Impacts Summary APPENDIX – STATE-LEVEL IMPACTS
Impact on
South Dakota
Pro-development Policies (incremental) Baseline (absolute) Regulatory Constraints (incremental)
2020 2025 2030 2035 2020 2025 2030 2035 2020 2025 2030 2035
Oil and Natural
Gas Production
-0
kboed
-0
kboed
-0
kboed
-0
kboed
10
kboed
10
kboed
10
kboed
10
kboed
+0
kboed
+0
kboed
-0
kboed
+0
kboed
Total Jobs
Supported*
+0
thousand
+0
thousand
+0
thousand
+0
thousand
4
thousand
4
thousand
5
thousand
5
thousand
-0
thousand
-0
thousand
-0
thousand
-1
thousand
GDP / Year +$0.01
billion
+$0.04
billion
+$0.09
billion
+$0.08
billion
$0.67
billion
$0.72
billion
$0.73
billion
$0.75
billion
-$0.08
billion
-$0.07
billion
-$0.06
billion
-$0.09
billion
Government
Revenue** / Year
+$0
billion
+$0
billion
+$0
billion
+$0
billion
$0.04
billion
$0.05
billion
$0.05
billion
$0.05
billion
-$0
billion
-$0
billion
-$0
billion
-$0.01
billion
Cumulative
Gov't Revenue**
(from 2016)
+$0.02
billion
+$0.02
billion
+$0.04
billion
+$0.1
billion
$0.19
billion
$0.4
billion
$0.64
billion
$0.89
billion
-$0.01
billion
-$0.02
billion
-$0.03
billion
-$0.04
billion
*Jobs supported include direct, indirect and induced job creation
**Does not include federal government tax revenue

© Wood Mackenzie 136
Tennessee – Impacts Summary APPENDIX – STATE-LEVEL IMPACTS
Impact on
Tennessee
Pro-development Policies (incremental) Baseline (absolute) Regulatory Constraints (incremental)
2020 2025 2030 2035 2020 2025 2030 2035 2020 2025 2030 2035
Oil and Natural
Gas Production
+1
kboed
+1
kboed
+2
kboed
+2
kboed
4
kboed
7
kboed
10
kboed
14
kboed
-0
kboed
-1
kboed
-2
kboed
-2
kboed
Total Jobs
Supported*
+1
thousand
+1
thousand
+3
thousand
+3
thousand
17
thousand
19
thousand
20
thousand
20
thousand
-2
thousand
-2
thousand
-3
thousand
-3
thousand
GDP / Year +$0.1
billion
+$0.14
billion
+$0.29
billion
+$0.37
billion
$2
billion
$2.21
billion
$2.31
billion
$2.38
billion
-$0.19
billion
-$0.21
billion
-$0.27
billion
-$0.32
billion
Government
Revenue** / Year
+$0.01
billion
+$0.01
billion
+$0.01
billion
+$0.02
billion
$0.1
billion
$0.11
billion
$0.11
billion
$0.12
billion
-$0.01
billion
-$0.01
billion
-$0.01
billion
-$0.04
billion
Cumulative
Gov't Revenue**
(from 2016)
+$0.03
billion
+$0.06
billion
+$0.12
billion
+$0.2
billion
$0.43
billion
$0.95
billion
$1.51
billion
$2.1
billion
-$0.03
billion
-$0.08
billion
-$0.15
billion
-$0.23
billion
*Jobs supported include direct, indirect and induced job creation
**Does not include federal government tax revenue

© Wood Mackenzie 137
Texas – Impacts Summary APPENDIX – STATE-LEVEL IMPACTS
Impact on
Texas
Pro-development Policies (incremental) Baseline (absolute) Regulatory Constraints (incremental)
2020 2025 2030 2035 2020 2025 2030 2035 2020 2025 2030 2035
Oil and Natural
Gas Production
+478
kboed
+485
kboed
+586
kboed
+513
kboed
10407
kboed
11144
kboed
11440
kboed
11739
kboed
+72
kboed
-186
kboed
-64
kboed
+506
kboed
Total Jobs
Supported*
+273
thousand
+383
thousand
+650
thousand
+733
thousand
3461
thousand
3645
thousand
3552
thousand
3589
thousand
-281
thousand
-307
thousand
-212
thousand
-155
thousand
GDP / Year +$36
billion
+$54
billion
+$88
billion
+$98
billion
$576
billion
$613
billion
$599
billion
$599
billion
-$46
billion
-$54
billion
-$37
billion
-$23
Billion
Government
Revenue** / Year
+$2
billion
+$2
billion
+$4
billion
+$4
billion
$41
Billion
$45
billion
$45
billion
$46
billion
-$2
billion
-$2
billion
-$0
billion
+$2
billion
Cumulative
Gov't Revenue**
(from 2016)
+$6
billion
+$15
billion
+$32
billion
+$52
billion
$179
billion
$394
billion
$621
billion
$848
billion
-$9
billion
-$21
billion
-$30
billion
-$24
billion
*Jobs supported include direct, indirect and induced job creation
**Does not include federal government tax revenue
***Gas production increase under regulatory constraints scenario is caused by expected rocky mountain region gas supply loss. However, Texas could be adversely affected
economically under regulatory constraints

© Wood Mackenzie 138
Utah – Impacts Summary APPENDIX – STATE-LEVEL IMPACTS
Impact on
Utah
Pro-development Policies (incremental) Baseline (absolute) Regulatory Constraints (incremental)
2020 2025 2030 2035 2020 2025 2030 2035 2020 2025 2030 2035
Oil and Natural
Gas Production
-1
kboed
+114
kboed
+82
kboed
+57
kboed
319
kboed
334
kboed
477
kboed
530
kboed
-243
kboed
-286
kboed
-433
kboed
-493
Kboed
Total Jobs
Supported*
-1
thousand
+19
thousand
+20
thousand
+23
thousand
68
thousand
75
thousand
95
thousand
98
thousand
-39
thousand
-47
thousand
-66
thousand
-70
thousand
GDP / Year -$0
billion
+$3
billion
+$3
billion
+$3
billion
$11
billion
$12
billion
$15
billion
$16
billion
-$6
billion
-$7
billion
-$10
billion
-$10
billion
Government
Revenue** / Year
-$0
billion
+$0
billion
+$0
billion
+$0
billion
$1
billion
$1
billion
$2
billion
$2
billion
-$1
billion
-$1
billion
-$1
billion
-$3
Billion
Cumulative
Gov't Revenue**
(from 2016)
-$0
billion
+$1
billion
+$3
billion
+$5
billion
$5
billion
$11
billion
$18
billion
$26
billion
-$2
billion
-$7
billion
-$12
billion
-$19
billion
*Jobs supported include direct, indirect and induced job creation
**Does not include federal government tax revenue
***Listing sage grouse listed under Endangered Species Act (FWS) could severely restrict potential drilling in Utah under regulatory constraints scenario

© Wood Mackenzie 139
Vermont – Impacts Summary APPENDIX – STATE-LEVEL IMPACTS
Impact on
Vermont
Pro-development Policies (incremental) Baseline (absolute) Regulatory Constraints (incremental)
2020 2025 2030 2035 2020 2025 2030 2035 2020 2025 2030 2035
Oil and Natural
Gas Production
+0
kboed
+0
kboed
+0
kboed
+0
kboed
0
kboed
0
kboed
0
kboed
0
kboed
+0
kboed
+0
kboed
+0
kboed
+0
kboed
Total Jobs
Supported*
+0
thousand
+0
thousand
+0
thousand
+0
thousand
1
thousand
2
thousand
2
thousand
2
thousand
-0
thousand
-0
thousand
-0
thousand
-0
thousand
GDP / Year +$0.01
billion
+$0.01
billion
+$0.03
billion
+$0.03
billion
$0.16
billion
$0.18
billion
$0.19
billion
$0.19
billion
-$0.02
billion
-$0.02
billion
-$0.03
billion
-$0.04
billion
Government
Revenue** / Year
+$0
billion
+$0
billion
+$0
billion
+$0
billion
$0.01
billion
$0.01
billion
$0.01
billion
$0.01
billion
-$0
billion
-$0
billion
-$0
billion
-$0
billion
Cumulative
Gov't Revenue**
(from 2016)
+$0
billion
+$0.01
billion
+$0.01
billion
+$0
billion
$0.04
billion
$0.08
billion
$0.13
billion
$0.18
billion
-$0
billion
-$0.01
billion
-$0.02
billion
-$0.02
billion
*Jobs supported include direct, indirect and induced job creation
**Does not include federal government tax revenue

© Wood Mackenzie 140
Virginia – Impacts Summary APPENDIX – STATE-LEVEL IMPACTS
Impact on
Virginia
Pro-development Policies (incremental) Baseline (absolute) Regulatory Constraints (incremental)
2020 2025 2030 2035 2020 2025 2030 2035 2020 2025 2030 2035
Oil and Natural
Gas Production
-0
kboed
+1
kboed
+96
kboed
+123
kboed
33
kboed
21
kboed
13
kboed
8
kboed
+1
kboed
+0
kboed
-0
kboed
+0
kboed
Total Jobs
Supported*
+1
thousand
+3
thousand
+14
thousand
+18
thousand
20
thousand
22
thousand
23
thousand
23
thousand
-3
thousand
-3
thousand
-4
thousand
-5
thousand
GDP / Year +$0.12
billion
+$0.28
billion
+$3.54
billion
+$4.61
billion
$2.25
billion
$2.35
billion
$2.38
billion
$2.37
billion
-$0.29
billion
-$0.3
billion
-$0.42
billion
-$0.52
billion
Government
Revenue** / Year
+$0.01
billion
+$0.02
billion
+$0.51
billion
+$0.62
billion
$0.17
billion
$0.16
billion
$0.15
billion
$0.15
billion
-$0.02
billion
-$0.02
billion
-$0.03
billion
-$0.07
billion
Cumulative
Gov't Revenue**
(from 2016)
+$0.04
billion
+$0.11
billion
+$1.48
billion
+$4.7
billion
$0.79
billion
$1.6
billion
$2.38
billion
$3.13
billion
-$0.07
billion
-$0.17
billion
-$0.29
billion
-$0.44
billion
*Jobs supported include direct, indirect and induced job creation
**Does not include federal government tax revenue
***Virginia is expected to benefit from Atlantic coastal area offshore development under pro-development policies scenario

© Wood Mackenzie 141
Washington – Impacts Summary APPENDIX – STATE-LEVEL IMPACTS
Impact on
Washington
Pro-development Policies (incremental) Baseline (absolute) Regulatory Constraints (incremental)
2020 2025 2030 2035 2020 2025 2030 2035 2020 2025 2030 2035
Oil and Natural
Gas Production
+0
kboed
+0
kboed
+0
kboed
+0
kboed
0
kboed
0
kboed
0
kboed
0
kboed
+0
kboed
+0
kboed
+0
kboed
+0
kboed
Total Jobs
Supported*
+1
thousand
+1
thousand
+2
thousand
+3
thousand
26
thousand
28
thousand
28
thousand
29
thousand
-1
thousand
-2
thousand
-2
thousand
-2
thousand
GDP / Year +$0.09
billion
+$0.12
billion
+$0.24
billion
+$0.3
billion
$3.4
billion
$3.7
billion
$3.89
billion
$3.94
billion
-$0.25
billion
-$0.27
billion
-$0.32
billion
-$0.37
billion
Government
Revenue** / Year
+$0
billion
+$0.01
billion
+$0.01
billion
+$0.01
billion
$0.14
billion
$0.15
billion
$0.16
billion
$0.16
billion
-$0.01
billion
-$0.01
billion
-$0.01
billion
-$0.03
billion
Cumulative
Gov't Revenue**
(from 2016)
+$0.02
billion
+$0.05
billion
+$0.09
billion
+$0.2
billion
$0.65
billion
$1.38
billion
$2.15
billion
$2.94
billion
-$0.03
billion
-$0.07
billion
-$0.13
billion
-$0.19
billion
*Jobs supported include direct, indirect and induced job creation
**Does not include federal government tax revenue

© Wood Mackenzie 142
West Virginia – Impacts Summary APPENDIX – STATE-LEVEL IMPACTS
Impact on
West Virginia
Pro-development Policies (incremental) Baseline (absolute) Regulatory Constraints (incremental)
2020 2025 2030 2035 2020 2025 2030 2035 2020 2025 2030 2035
Oil and Natural
Gas Production
-87
kboed
-155
kboed
-261
kboed
+200
kboed
928
kboed
1059
kboed
1121
kboed
783
kboed
-180
kboed
-175
kboed
+2
kboed
-33
kboed
Total Jobs
Supported*
-3
thousand
-7
thousand
-4
thousand
+34
thousand
106
thousand
103
thousand
115
thousand
102
thousand
-10
thousand
-6
thousand
+5
thousand
-19
thousand
GDP / Year -$1
billion
-$2
billion
-$1
billion
+$4
billion
$14
billion
$14
billion
$16
billion
$13
billion
-$2
billion
-$1
billion
+$1
billion
-$2
billion
Government
Revenue** / Year
-$0
billion
-$0
billion
+$0
billion
+$0
billion
$2
billion
$2
billion
$2
billion
$2
billion
-$0
billion
-$1
billion
-$0
billion
-$1
billion
Cumulative
Gov't Revenue**
(from 2016)
-$0
billion
-$1
billion
-$2
billion
-$0
billion
$7
billion
$17
billion
$27
billion
$36
billion
-$1
billion
-$4
billion
-$6
billion
-$9
billion
*Jobs supported include direct, indirect and induced job creation
**Does not include federal government tax revenue

© Wood Mackenzie 143
Wisconsin – Impacts Summary APPENDIX – STATE-LEVEL IMPACTS
Impact on
Wisconsin
Pro-development Policies (incremental) Baseline (absolute) Regulatory Constraints (incremental)
2020 2025 2030 2035 2020 2025 2030 2035 2020 2025 2030 2035
Oil and Natural
Gas Production
+0
kboed
+0
kboed
+0
kboed
+0
kboed
0
kboed
0
kboed
0
kboed
0
kboed
+0
kboed
+0
kboed
+0
kboed
+0
kboed
Total Jobs
Supported*
+1
thousand
+1
thousand
+2
thousand
+2
thousand
12
thousand
13
thousand
14
thousand
14
thousand
-1
thousand
-1
thousand
-1
thousand
-2
thousand
GDP / Year +$0.08
billion
+$0.11
billion
+$0.21
billion
+$0.26
billion
$1.41
billion
$1.57
billion
$1.66
billion
$1.68
billion
-$0.12
billion
-$0.14
billion
-$0.16
billion
-$0.19
billion
Government
Revenue** / Year
+$0.01
billion
+$0.01
billion
+$0.01
billion
+$0.02
billion
$0.08
billion
$0.09
billion
$0.1
billion
$0.1
billion
-$0.01
billion
-$0.01
billion
-$0.01
billion
-$0.02
billion
Cumulative
Gov't Revenue**
(from 2016)
+$0.03
billion
+$0.07
billion
+$0.13
billion
+$0.2
billion
$0.38
billion
$0.84
billion
$1.33
billion
$1.83
billion
-$0.02
billion
-$0.05
billion
-$0.09
billion
-$0.13
billion
*Jobs supported include direct, indirect and induced job creation
**Does not include federal government tax revenue

© Wood Mackenzie 144
Wyoming – Impacts Summary APPENDIX – STATE-LEVEL IMPACTS
Impact on
Wyoming
Pro-development Policies (incremental) Baseline (absolute) Regulatory Constraints (incremental)
2020 2025 2030 2035 2020 2025 2030 2035 2020 2025 2030 2035
Oil and Natural
Gas Production
+32
kboed
+118
kboed
+173
kboed
+50
kboed
1400
kboed
1689
kboed
1806
kboed
1868
kboed
-877
kboed
-1245
kboed
-1461
kboed
-1581
kboed
Total Jobs
Supported*
+5
thousand
+11
thousand
+22
thousand
+25
thousand
112
thousand
126
thousand
132
thousand
135
thousand
-57
thousand
-72
thousand
-82
thousand
-91
thousand
GDP / Year +$0
billion
+$1
billion
+$3
billion
+$3
billion
$24
billion
$27
billion
$28
billion
$29
billion
-$12
billion
-$16
billion
-$19
billion
-$21
billion
Government
Revenue** / Year
+$0
billion
+$0
billion
+$0
billion
-$0
billion
$5
billion
$6
billion
$6
billion
$7
billion
-$3
billion
-$5
billion
-$5
billion
-$12
billion
Cumulative
Gov't Revenue**
(from 2016)
+$0
billion
+$1
billion
+$1
billion
+$1
billion
$21
billion
$48
billion
$79
billion
$113
billion
-$11
billion
-$31
billion
-$57
billion
-$86
billion
*Jobs supported include direct, indirect and induced job creation
**Does not include federal government tax revenue
***Listing sage grouse listed under Endangered Species Act (FWS) could severely restrict potential drilling in Wyoming under regulatory constraints scenario

© Wood Mackenzie 145
Appendices
A2. Pro-development scenario assumptions
A3. Regulatory constraints assumptions
A1. Baseline assumptions
A4. Summary job impacts
A5. State-level impacts
A6. Data for key charts
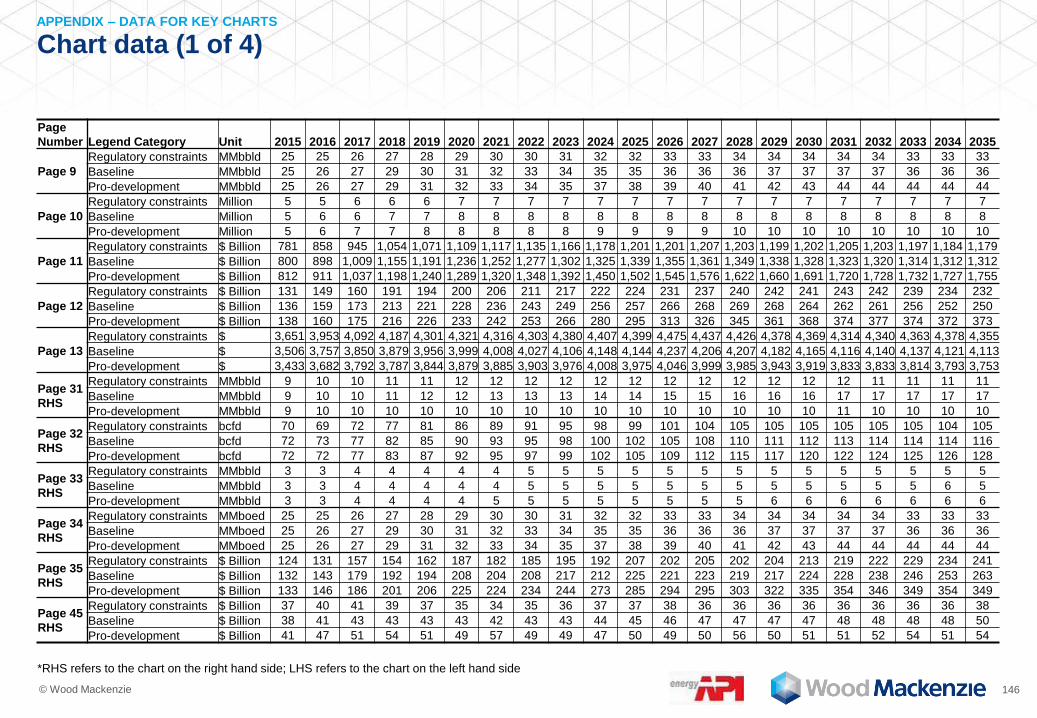
© Wood Mackenzie 146
Chart data (1 of 4) APPENDIX – DATA FOR KEY CHARTS
Page
Number Legend Category Unit 2015 2016 2017 2018 2019 2020 2021 2022 2023 2024 2025 2026 2027 2028 2029 2030 2031 2032 2033 2034 2035
Page 9
Regulatory constraints MMbbld 25 25 26 27 28 29 30 30 31 32 32 33 33 34 34 34 34 34 33 33 33
Baseline MMbbld 25 26 27 29 30 31 32 33 34 35 35 36 36 36 37 37 37 37 36 36 36
Pro-development MMbbld 25 26 27 29 31 32 33 34 35 37 38 39 40 41 42 43 44 44 44 44 44
Page 10
Regulatory constraints Million 5 5 6 6 6 7 7 7 7 7 7 7 7 7 7 7 7 7 7 7 7
Baseline Million 5 6 6 7 7 8 8 8 8 8 8 8 8 8 8 8 8 8 8 8 8
Pro-development Million 5 6 7 7 8 8 8 8 8 9 9 9 9 10 10 10 10 10 10 10 10
Page 11
Regulatory constraints $ Billion 781 858 945 1,054 1,071 1,109 1,117 1,135 1,166 1,178 1,201 1,201 1,207 1,203 1,199 1,202 1,205 1,203 1,197 1,184 1,179
Baseline $ Billion 800 898 1,009 1,155 1,191 1,236 1,252 1,277 1,302 1,325 1,339 1,355 1,361 1,349 1,338 1,328 1,323 1,320 1,314 1,312 1,312
Pro-development $ Billion 812 911 1,037 1,198 1,240 1,289 1,320 1,348 1,392 1,450 1,502 1,545 1,576 1,622 1,660 1,691 1,720 1,728 1,732 1,727 1,755
Page 12
Regulatory constraints $ Billion 131 149 160 191 194 200 206 211 217 222 224 231 237 240 242 241 243 242 239 234 232
Baseline $ Billion 136 159 173 213 221 228 236 243 249 256 257 266 268 269 268 264 262 261 256 252 250
Pro-development $ Billion 138 160 175 216 226 233 242 253 266 280 295 313 326 345 361 368 374 377 374 372 373
Page 13
Regulatory constraints $ 3,651 3,953 4,092 4,187 4,301 4,321 4,316 4,303 4,380 4,407 4,399 4,475 4,437 4,426 4,378 4,369 4,314 4,340 4,363 4,378 4,355
Baseline $ 3,506 3,757 3,850 3,879 3,956 3,999 4,008 4,027 4,106 4,148 4,144 4,237 4,206 4,207 4,182 4,165 4,116 4,140 4,137 4,121 4,113
Pro-development $ 3,433 3,682 3,792 3,787 3,844 3,879 3,885 3,903 3,976 4,008 3,975 4,046 3,999 3,985 3,943 3,919 3,833 3,833 3,814 3,793 3,753
Page 31
RHS
Regulatory constraints MMbbld 9 10 10 11 11 12 12 12 12 12 12 12 12 12 12 12 12 11 11 11 11
Baseline MMbbld 9 10 10 11 12 12 13 13 13 14 14 15 15 16 16 16 17 17 17 17 17
Pro-development MMbbld 9 10 10 10 10 10 10 10 10 10 10 10 10 10 10 10 11 10 10 10 10
Page 32
RHS
Regulatory constraints bcfd 70 69 72 77 81 86 89 91 95 98 99 101 104 105 105 105 105 105 105 104 105
Baseline bcfd 72 73 77 82 85 90 93 95 98 100 102 105 108 110 111 112 113 114 114 114 116
Pro-development bcfd 72 72 77 83 87 92 95 97 99 102 105 109 112 115 117 120 122 124 125 126 128
Page 33
RHS
Regulatory constraints MMbbld 3 3 4 4 4 4 4 5 5 5 5 5 5 5 5 5 5 5 5 5 5
Baseline MMbbld 3 3 4 4 4 4 4 5 5 5 5 5 5 5 5 5 5 5 5 6 5
Pro-development MMbbld 3 3 4 4 4 4 5 5 5 5 5 5 5 5 6 6 6 6 6 6 6
Page 34
RHS
Regulatory constraints MMboed 25 25 26 27 28 29 30 30 31 32 32 33 33 34 34 34 34 34 33 33 33
Baseline MMboed 25 26 27 29 30 31 32 33 34 35 35 36 36 36 37 37 37 37 36 36 36
Pro-development MMboed 25 26 27 29 31 32 33 34 35 37 38 39 40 41 42 43 44 44 44 44 44
Page 35
RHS
Regulatory constraints $ Billion 124 131 157 154 162 187 182 185 195 192 207 202 205 202 204 213 219 222 229 234 241
Baseline $ Billion 132 143 179 192 194 208 204 208 217 212 225 221 223 219 217 224 228 238 246 253 263
Pro-development $ Billion 133 146 186 201 206 225 224 234 244 273 285 294 295 303 322 335 354 346 349 354 349
Page 45
RHS
Regulatory constraints $ Billion 37 40 41 39 37 35 34 35 36 37 37 38 36 36 36 36 36 36 36 36 38
Baseline $ Billion 38 41 43 43 43 43 42 43 43 44 45 46 47 47 47 47 48 48 48 48 50
Pro-development $ Billion 41 47 51 54 51 49 57 49 49 47 50 49 50 56 50 51 51 52 54 51 54
*RHS refers to the chart on the right hand side; LHS refers to the chart on the left hand side

© Wood Mackenzie 147
Chart data (2 of 4) APPENDIX – DATA FOR KEY CHARTS
Page Number Legend Category Unit 2015 2025 2035
Baseline Baseline Pro-dev. Reg. Cons. Baseline Pro-dev. Reg. Cons.
Page 31 LHS
Offshore (East & West Coast) MMbbld 0.00 0.00 0.43 0.00 1.95
Alaska MMbbld 0.41 0.35 0.86 0.35 0.29 2.19 0.29
Gulf of Mexico MMbbld 1.46 1.80 2.18 1.41 1.50 2.62 1.23
Onshore US lower 48 MMbbld 7.58 10.18 11.01 8.61 9.20 9.95 8.45
Page 32 LHS
Offshore (East & West Coast) bcfd 0.00 0.53 0.00 2.82
Alaska bcfd 0.92 0.88 1.21 0.88 0.88 5.84 0.88
Gulf of Mexico bcfd 3.56 2.47 3.07 2.00 3.31 5.82 2.62
Onshore US lower 48 bcfd 67.18 99.02 100.64 96.27 111.73 113.02 101.12
Page 33 LHS MMbbld 3.12 5.05 5.17 4.94 5.47 5.78 5.09
Page 34 LHS MMboed 24.93 35.02 37.83 32.41 36.46 44.47 33.11
Page 35 LHS
Offshore (East & West Coast) $ Billion 0 0 10 0 28
Alaska $ Billion 3 11 33 11 1 25 1
Gulf of Mexico $ Billion 17 11 19 8 2 17 1
Onshore US lower 48 $ Billion 112 204 223 188 260 279 239
Page 45 LHS $ Billion 38 45 50 37 50 54 38
*RHS refers to the chart on the right hand side; LHS refers to the chart on the left hand side

© Wood Mackenzie 148
Chart data (3 of 4) APPENDIX – DATA FOR KEY CHARTS
Page
Number Legend Category Unit 2015 2016 2017 2018 2019 2020 2021 2022 2023 2024 2025 2026 2027 2028 2029 2030 2031 2032 2033 2034 2035
Page 51
Baseline Million 5.1 5.6 6.3 7.1 7.2 7.5 7.6 7.7 7.8 8.0 8.0 8.1 8.1 8.0 8.0 7.9 7.9 7.9 7.9 7.9 7.9
Upstream Million 3.3 3.8 4.5 5.3 5.5 5.8 5.8 6.0 6.2 6.5 6.7 6.8 6.9 7.0 7.3 7.4 7.6 7.5 7.5 7.5 7.7
Midstream Million 1.2 1.3 1.4 1.5 1.5 1.6 1.7 1.6 1.7 1.6 1.7 1.7 1.8 1.9 1.8 1.9 1.8 1.9 1.9 1.9 1.9
Refining Million 0.6 0.6 0.6 0.6 0.6 0.6 0.6 0.6 0.6 0.6 0.6 0.6 0.6 0.6 0.6 0.6 0.6 0.6 0.6 0.6 0.6
Page 52
Baseline $ Billion 800 898 1,009 1,155 1,191 1,236 1,252 1,277 1,302 1,325 1,339 1,355 1,361 1,349 1,338 1,328 1,323 1,320 1,314 1,312 1,312
Upstream $ Billion 562 647 751 897 933 975 992 1,023 1,059 1,114 1,154 1,191 1,213 1,244 1,287 1,313 1,342 1,346 1,346 1,344 1,369
Midstream $ Billion 141 149 162 176 180 186 199 194 200 202 212 215 221 235 229 232 232 235 240 237 240
Refining $ Billion 109 115 124 125 127 128 129 131 133 134 136 139 142 144 145 145 145 146 146 146 147
Page 53
Baseline $ Billion 136 159 173 213 221 228 236 243 249 256 257 266 268 269 268 264 262 261 256 252 250
Upstream $ Billion 109 130 143 183 191 197 205 216 229 242 256 274 286 303 319 326 331 334 331 329 329
Midstream $ Billion 17 18 19 21 21 22 23 23 24 24 25 25 26 28 27 28 28 28 29 28 29
Refining $ Billion 12 12 13 13 13 13 14 14 14 14 14 14 14 15 15 15 15 15 15 15 15
Page 55
Baseline Million 5.1 5.6 6.3 7.1 7.2 7.5 7.6 7.7 7.8 8.0 8.0 8.1 8.1 8.0 8.0 7.9 7.9 7.9 7.9 7.9 7.9
Upstream Million 3.2 3.6 4.1 4.6 4.7 5.0 5.0 5.0 5.2 5.2 5.3 5.3 5.3 5.2 5.2 5.2 5.3 5.2 5.2 5.2 5.1
Midstream Million 1.1 1.1 1.2 1.2 1.1 1.2 1.2 1.2 1.2 1.3 1.3 1.3 1.3 1.3 1.3 1.3 1.3 1.3 1.3 1.3 1.4
Refining Million 0.6 0.6 0.6 0.6 0.6 0.6 0.6 0.6 0.6 0.6 0.6 0.6 0.6 0.6 0.6 0.6 0.6 0.6 0.6 0.6 0.6
Page 56
Baseline $ Billion 800 898 1,009 1,155 1,191 1,236 1,252 1,277 1,302 1,325 1,339 1,355 1,361 1,349 1,338 1,328 1,323 1,320 1,314 1,312 1,312
Upstream $ Billion 548 619 692 796 811 845 849 862 886 894 912 908 911 902 896 897 900 896 890 878 869
Midstream $ Billion 127 128 134 137 138 141 143 146 151 155 157 159 160 163 164 166 166 167 166 166 170
Refining $ Billion 107 111 119 121 122 124 125 127 128 130 132 134 136 139 139 140 139 140 140 140 140
Page 57
Baseline $ Billion 136 159 173 213 221 228 236 243 249 256 257 266 268 269 268 264 262 261 256 252 250
Upstream $ Billion 104 121 131 161 164 170 175 180 185 190 191 197 203 206 207 207 209 207 204 200 197
Midstream $ Billion 15 15 16 16 17 17 17 18 18 19 19 19 19 20 20 20 20 20 20 20 20
Refining $ Billion 12 12 13 13 13 13 13 14 14 14 14 14 14 14 14 14 14 14 14 14 14
*RHS refers to the chart on the right hand side; LHS refers to the chart on the left hand side

© Wood Mackenzie 149
Chart data (4 of 4) APPENDIX – DATA FOR KEY CHARTS
Page
Number Legend Category Unit 2015 2016 2017 2018 2019 2020 2021 2022 2023 2024 2025 2026 2027 2028 2029 2030 2031 2032 2033 2034 2035
Page 54
LHS
East Coast Million 0.0 0.0 0.0 0.0 0.0 0.0 0.0 0.0 0.0 0.0 0.0 0.1 0.1 0.2 0.2 0.3 0.3 0.4 0.4 0.4 0.4
North Central Million 0.0 0.0 0.0 0.0 0.0 0.0 0.0 0.0 0.0 0.0 0.0 0.0 0.0 0.1 0.1 0.1 0.1 0.1 0.1 0.1 0.1
South Central Million 0.1 0.1 0.2 0.3 0.3 0.3 0.4 0.4 0.4 0.5 0.5 0.6 0.6 0.7 0.8 0.9 0.9 0.9 0.9 0.9 1.0
Rockies Million 0.0 0.0 0.0 0.0 0.0 0.0 0.1 0.1 0.1 0.1 0.1 0.1 0.1 0.1 0.1 0.1 0.2 0.1 0.1 0.1 0.2
West Coast Million 0.0 0.0 0.0 0.0 0.0 0.0 0.1 0.0 0.0 0.1 0.1 0.1 0.1 0.2 0.2 0.2 0.2 0.2 0.2 0.3 0.3
Alaska Million 0.0 0.0 0.0 0.0 0.0 0.0 0.0 0.0 0.0 0.1 0.2 0.2 0.2 0.3 0.3 0.4 0.4 0.4 0.4 0.4 0.4
Page 54
RHS
East Coast $ Billion 0 0 1 2 1 1 2 2 4 6 10 20 27 45 60 69 84 91 95 94 98
North Central $ Billion -1 -2 -1 0 -1 -1 0 -1 1 1 1 2 2 5 5 6 7 6 7 6 9
South Central $ Billion 13 15 27 38 44 48 51 51 55 67 79 81 86 101 111 120 122 122 122 116 130
Rockies $ Billion -1 -1 0 2 3 3 7 8 12 11 12 12 13 16 17 17 20 18 18 17 21
West Coast $ Billion 0 0 0 1 1 1 6 5 9 15 22 31 37 45 49 55 59 64 68 71 75
Alaska $ Billion 0 0 0 1 0 1 2 6 11 26 38 44 49 61 80 96 104 106 108 111 110
Page 58
LHS
East Coast Million 0.0 0.0 0.0 -0.1 -0.1 -0.1 0.0 0.0 0.0 0.0 0.0 0.0 0.0 0.0 0.0 0.0 0.0 0.0 0.0 -0.1 -0.1
North Central Million 0.0 0.0 0.0 0.0 0.0 0.0 0.0 0.0 0.0 0.0 0.0 0.0 0.0 0.0 0.0 0.0 0.0 0.0 -0.1 -0.1 -0.1
South Central Million -0.1 -0.1 -0.2 -0.2 -0.3 -0.3 -0.3 -0.4 -0.4 -0.4 -0.4 -0.4 -0.4 -0.4 -0.3 -0.3 -0.2 -0.2 -0.2 -0.2 -0.2
Rockies Million 0.0 -0.1 -0.2 -0.3 -0.3 -0.3 -0.3 -0.4 -0.4 -0.4 -0.4 -0.4 -0.4 -0.4 -0.4 -0.4 -0.4 -0.4 -0.4 -0.4 -0.4
West Coast Million 0.0 0.0 0.0 0.0 0.0 0.0 0.0 0.0 0.0 0.0 0.0 0.0 0.0 0.0 0.0 0.0 0.0 0.0 -0.1 -0.1 -0.1
Alaska Million 0.0 0.0 0.0 0.0 0.0 0.0 0.0 0.0 0.0 0.0 0.0 0.0 0.0 0.0 0.0 0.0 0.0 0.0 0.0 0.0 0.0
Page 58
RHS
East Coast $ Billion -2 -4 -6 -17 -16 -11 -6 -4 3 1 3 -1 -1 -1 -2 -1 -1 -2 -3 -7 -9
North Central $ Billion -2 -3 -4 -7 -8 -9 -9 -8 -5 -6 -7 -9 -8 -4 -2 -4 -6 -8 -10 -12 -14
South Central $ Billion -6 -16 -22 -30 -39 -44 -52 -60 -65 -70 -63 -69 -67 -64 -57 -44 -36 -30 -28 -30 -30
Rockies $ Billion -8 -15 -28 -42 -51 -57 -60 -63 -62 -64 -64 -67 -70 -71 -70 -69 -68 -70 -69 -71 -72
West Coast $ Billion -2 -2 -3 -4 -5 -5 -6 -6 -6 -6 -7 -7 -7 -7 -7 -7 -7 -7 -8 -8 -8
Alaska $ Billion 0 0 0 0 -1 -1 -1 -1 -1 -1 -1 -1 -1 -1 -1 0 0 -1 -1 -1 -1
*RHS refers to the chart on the right hand side; LHS refers to the chart on the left hand side

© Wood Mackenzie 150
Disclaimer
This report has been prepared for the American Petroleum Institute (API) by Wood
Mackenzie Inc.
The information upon which this report is based has either been supplied to us by API or
comes from our own experience, knowledge and databases
The opinions expressed in this report are those of Wood Mackenzie
They have been arrived at following careful consideration and enquiry but Wood Mackenzie
does not guarantee their fairness, completeness or accuracy
The opinions, as of this date, are subject to change
Wood Mackenzie does not accept any liability for your reliance upon them
Strictly Private & Confidential

Europe +44 131 243 4400
Americas +1 713 470 1600
Asia Pacific +65 6518 0800
Email [email protected]
Website www.woodmac.com
Wood Mackenzie* is a global leader in commercial intelligence for the energy, metals and mining industries.
We provide objective analysis and advice on assets, companies and markets, giving clients the insight they
need to make better strategic decisions. For more information visit: www.woodmac.com
*WOOD MACKENZIE is a Registered Trade Mark of Wood Mackenzie Limited