Apa sustainability
71
Sustainability: A Geographic Perspective Mr. Terrence D. Martin Esri Defense Team Rochester, New York Urban Planning and Design Urban Forestry Holland, Michigan
-
Upload
terry-martin -
Category
Science
-
view
32 -
download
0
Transcript of Apa sustainability

Sustainability:
A Geographic Perspective
Mr. Terrence D. Martin
Esri Defense Team
Rochester, New York
Urban Planning and Design
Urban Forestry
Holland, Michigan

Greetings From Jack Dangermond,
Dawn Wright,
Lawrie Jordan
Thank you for your work!
Corporate Headquarters, President: Jack
The Scientific Community, Chief Scientist, Director: Dawn
And the Imagery Community, Director of Imagery: Lawrie
Chris Thomas and Shannon McElvaney
We at Esri are working hard to create the tools that you need to plan, design,
And build the world of tomorrow.
Your work is essential and indispensable if we are to plan a sustainable
future for our communities, our states, our nation, and the planet
Alberta, Canada
Natural Resources
Assessment
Land Use Management
Singapore
France
Demographic Segmentation
Predicting Storm Surge Web-Based Community Planning
Norway
Illinois
Flood Assessment

Dependence on non-renewable resources
Population Growth
Climate Disruption
Sea Level Rise
Inequities in Resource Distribution
Socially Destructive Development Patterns
Today Growing Instability
In 2000 APA defined
Global Indicators of
Unsustainability
We saw something else at the UC this summer…
something’s changed…
there is a sense of urgency,
things need to happen

August 16, 2000
Policy Guide on Planning for Sustainability
Sustainable Communities Division of APA • A place to tackle deep sustainability
challenges through planning by connecting
with peers to discuss, organize, and
collaborate
• Something is happening here…
• Only you can do this.
• You are the Architects of the Future.
APA is a leader:

Standards (Data Models)
Quantitative Reporting (Verifiable)
Temporal Integration (3D and 4D)
Comparable Plans (Compatible)
Scalable (Community-Global)
Collaborative (Cloud and Role Based)
Policy Considerations
Today (its not 2000)
You couldn’t do this in 2000
Information is now available
Tools you need are coming out now
Collaboration is more important, and easier

Geography Is Now
More Important Than Ever
Providing the Content and Context
for Understanding Everything

The Problem Planning a sustainable future
Sustainability APA Policy Guide on Planning for Sustainability
Sustainability is the capability to equitably meet the vital human needs of the present without
compromising the ability of future generations to meet their own needs by preserving and
protecting the area’s ecosystems and natural resources.
Creating Our Future
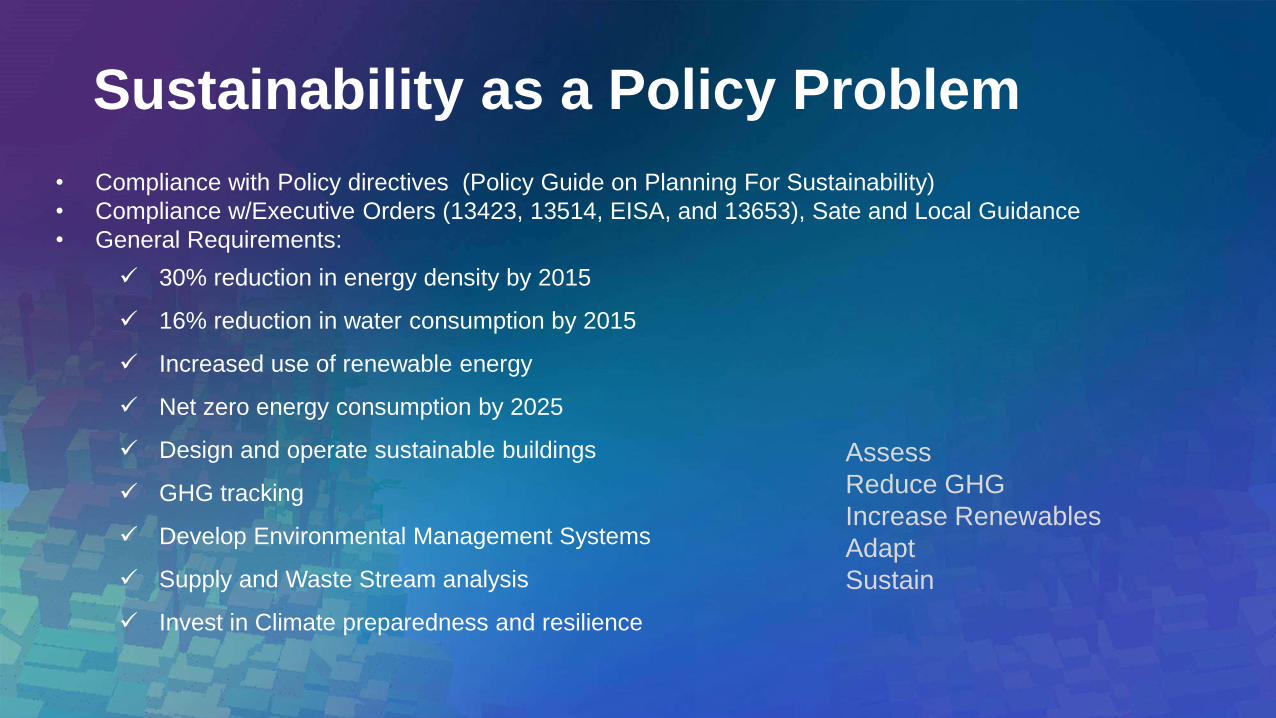
Sustainability as a Policy Problem
• Compliance with Policy directives (Policy Guide on Planning For Sustainability)
• Compliance w/Executive Orders (13423, 13514, EISA, and 13653), Sate and Local Guidance
• General Requirements:
30% reduction in energy density by 2015
16% reduction in water consumption by 2015
Increased use of renewable energy
Net zero energy consumption by 2025
Design and operate sustainable buildings
GHG tracking
Develop Environmental Management Systems
Supply and Waste Stream analysis
Invest in Climate preparedness and resilience
Assess
Reduce GHG
Increase Renewables
Adapt
Sustain

Sustainability from a geographic perspective:
Geography determines:
• Energy Requirements
• Energy Alternatives
• Effects of Climate Change
• Requirements for Adaptation
• Patterns for persistence
Geography organizes the content and provides
context for understanding and action

Details: Geography drives energy
requirements and costs…everywhere…
Cooling
Heating
Lighting
Water
Transportation
80% of facilities energy
costs are in these areas

Details: Geography drives site
suitability for alternative energy Geographic information:
• solar density
• land ownership
• ecosystem fragility
• proximity to grid
• grid ownership
Geography helps
to determine
site suitability for
alternative energy:
…solar
…wind
…geothermal
…tidal
…even green roofs

Details: Geography determines Climate
induced change and adaptation
Sea Level Rise Honolulu
Frequency and Intensity
Of Storms
What you have to adapt to
depends on where you are…
United States
Polar Vortex Impact
Amazon
Fire Prediction Wildfire Progression
Oregon
San Diego
Fire Incident Reporting
Social Impact of
Sea Level Rise

Details:
Geography Drives
sustainable design
Repatable process

The Approach Geographically defined problems
Geographic Approach

For Geographically Organized Problems
A Geographic Approach: A Framework for Understanding and Planning
Integrating Geographic Knowledge Into How We Behave
Holistic
Comprehensive
Systematic
Analytic
Visual
Creating, Measuring, Organizing, Analyzing, Modeling
Applying
Planning
Designing
Deciding
Managing
Acting
Geographic
Knowledge Data
Maps
Models

Facilities, Sites, Assets
Policy Guide on Planning for Sustainability Gives us Direction Geographic Information Systems give us tools to model and choose
the reality we need…
Imagery, panchromatic, IR,
Oblique Groundwater Land and Water Features
Terrain and natural resources
Parcels and Zoning
Transit Plan
Current
Historical
Modeled
Predicted
Comparative Planning actions toward sustainability
Indicators of unsustainability

… and store the geographic information in a database, locally or cloud based, and accessible from any device
Feature Classes representing Global and US Indicators of Unsustainability,
Policy Positions for Sustainability (Renewables, Adaptations, Alternatives)
Actions taken (plannned, projected, accomplished, effects)
Organized and integrated thematic layers of spatial data to model the world as it is, or was, or could be…
On a computer
On a network
Or in a cloud

Modern and practical system for problem solving
Facilitating
communication
and collaboration
Breaking down barriers
between institutions,
disciplines, and cultures
Integrating and
synthesizing information
from many sources
Supporting individuals, groups, and organizations
GIS is a toolset for managing anything
distributed in space and time
organized by geography
displayed to support communication
and collaboration:
tools for solving global problems

Now: A Platform for planning for Climate Change
Online
Cloud
Enterprise Mobile
Desktop
Web
Scales locally to globally
Intelligent maps
Services
and data

• Scalable
• Easier access to information.
• Multiple platforms.
• Easier to create and share intelligent maps.
• Less expensive.
• Integration of location and spatial analysis into
workflows.
• Better decisions.
- Decision justification.
Not your old GIS!
Big capabilities looking for BIG problems
Your problems…
Desktop
Tablets
Smartphones
Websites
Browsers
Social
media
Share Data, Maps, Apps
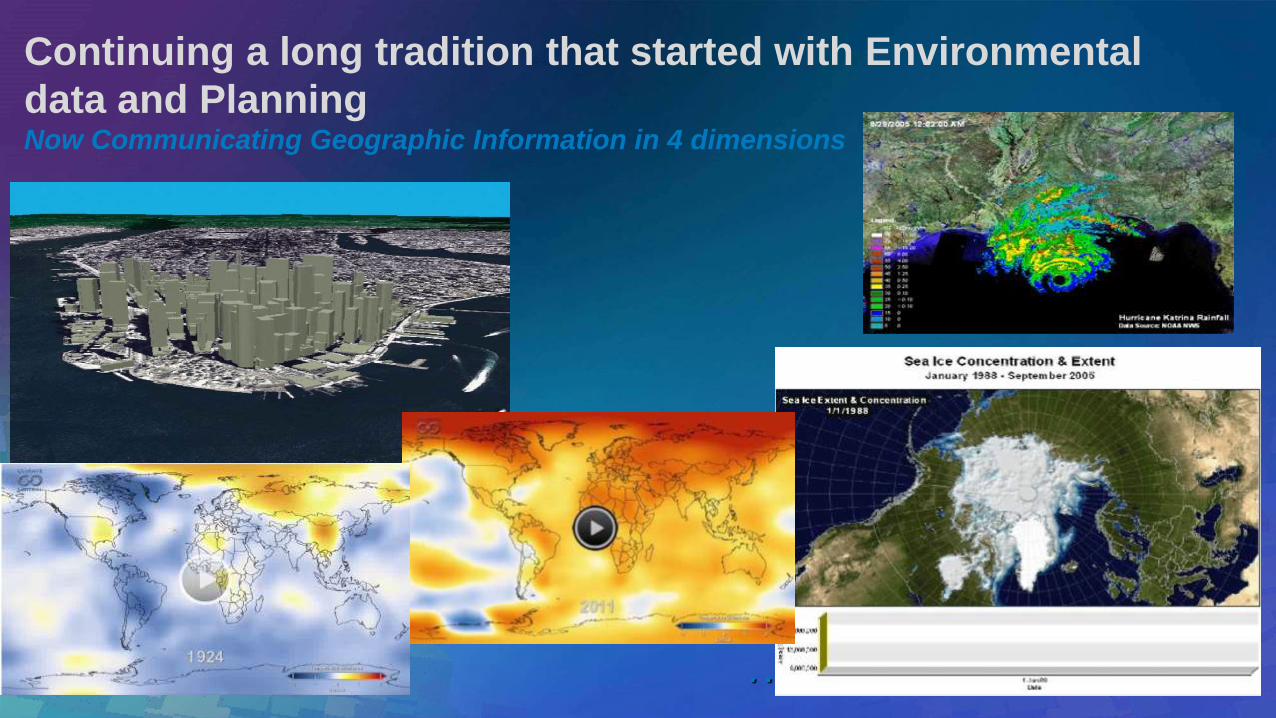
Continuing a long tradition that started with Environmental
data and Planning Now Communicating Geographic Information in 4 dimensions
. . . Creating Greater Understanding
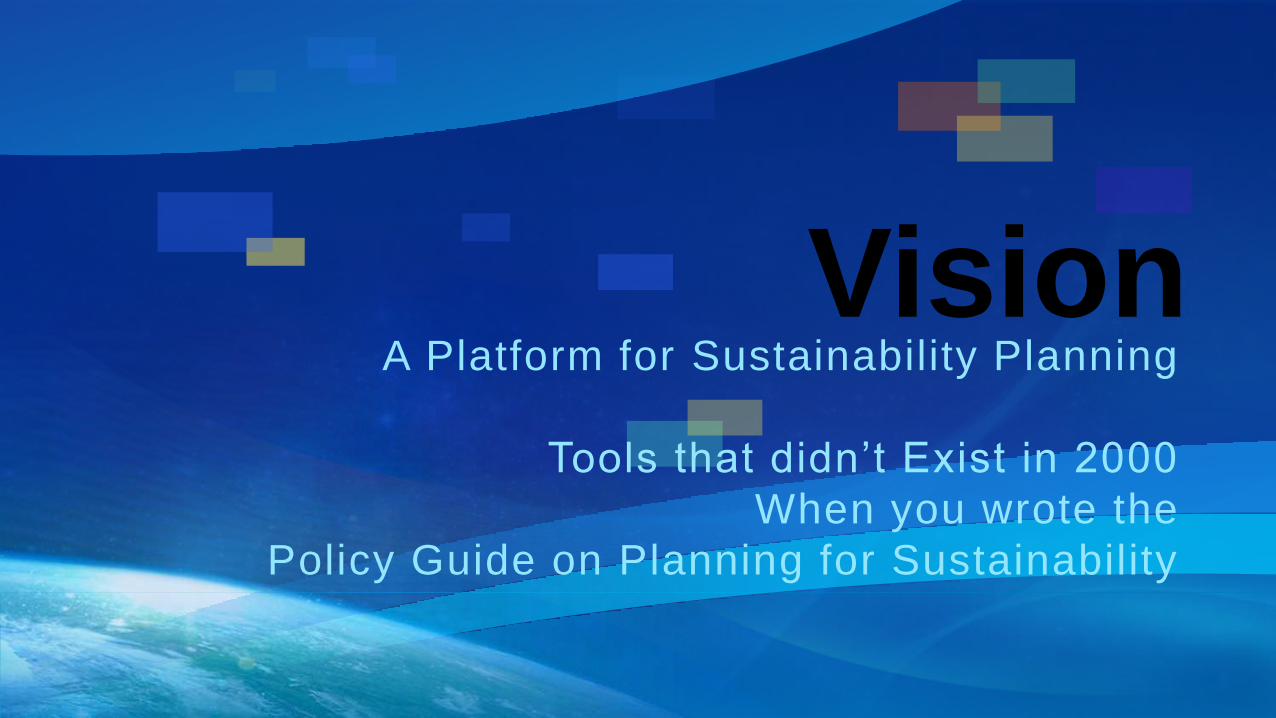
Vision A Platform for Sustainability Planning
Tools that didn’t Exist in 2000
When you wrote the
Policy Guide on Planning for Sustainability

Sustainability Planning
Tools
...
Energy Atlas
Example:http://atlas.esri.com/Atlas/Energy_Atlas.html
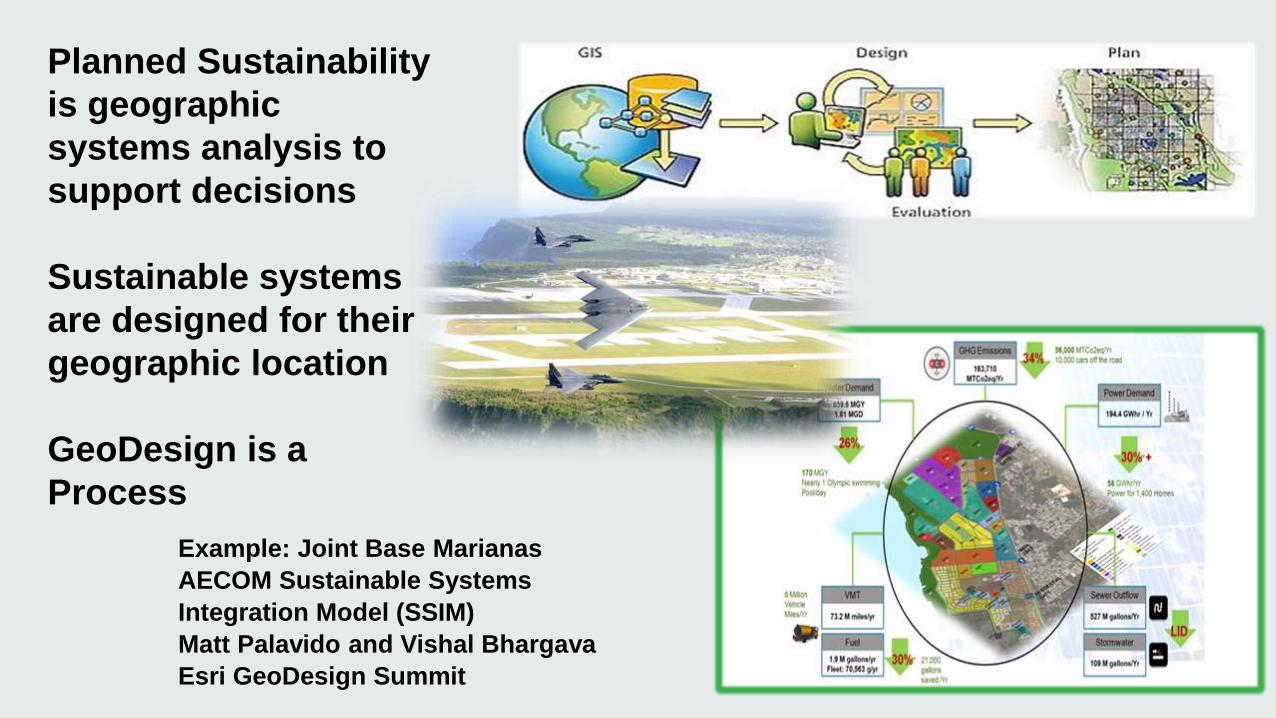
Planned Sustainability
is geographic
systems analysis to
support decisions
Sustainable systems
are designed for their
geographic location
GeoDesign is a
Process
Example: Joint Base Marianas
AECOM Sustainable Systems
Integration Model (SSIM)
Matt Palavido and Vishal Bhargava
Esri GeoDesign Summit

26
Sustainability is
a Lifecycle Planning
Process
Interpretation
Creation
Assess Present Energy & Water Use
Evaluate Alternatives
Plan for an Uncertain Future
Adapt and Maintain
Collaborate, Manage & Report
Decision
GIS Technology
Reprocessing tools
& Model Builder
Collection Geographic
Database
GeoPlanner Sketch/design
EIS/EIR Mitigation/Adaptation
Audit/report
Eco-accounting
We can apply a GIS Sustainability
Toolkit everywhere in the life cycle…

Sustainability Planning with Geographic
Information Systems (uniquely) offers:
• Scaleable data models, data management, and security
• Standards and quality assurance tools
• Quantitative query and analysis
• Comparative interoperable geospatial knowledge for decision support
• Audit and reporting capabilities
• Collaborative Visualization (in 2D, 3D, and 4D) dashboards and portals
• Temporal analysis, real time reporting and tracking, intervention, lessons learned
• Alternatives analysis (iterative modeling), site suitability, site vulnerability, comparison
• All within a cloud based architecture providing mapping and analysis across the organization.
Desktop, mobile, enterprise, cloud…

Sustainability and Geography go together
Mapping Base Energy
Monitoring
Sea Ice
Tidal Energy
Planning
Conservation Management
Coastal Zone
Management
Snowfall and Wind
NOAA
NOAA
National Ice Center Space and Energy
Management

Sustainability Planner’s Toolset
Geographic sustainability tools
• Planning Tools • Data Models • Assessment/Analysis Tools • Site Suitability Modeling • Alternative Scenario Modeling • Collaboration Tools (work/public) • 4D Visualization Tools
• Operational View Dashboards • A “cockpit” view of Virtual Earths • Management/Reporting Tools

Assessment Tools Core tools for planning

Assessment: Current Energy Requirements and use
• Rapid start “road map”
• Integrate with other data models
• Energy sources, sinks, and meters
• Imagery
• Extensible
CEQA/NEPA/EPA
Energy Star Portfolio

Thermal Imagery Plus Building Footprint = Energy Audit
and Carbon Footprint
UAV, aerial, oblique, and
Ground level thermal IR
imagery yields insulation,
glazing, doors, and leaks.
Building footprint (and the
GIS) tie them together for
analysis, budgeting, work
orders, results,
assessment, and reporting.
Thermal IR yields
Vegetative Index and
calculated Carbon
Sequestration.
Collectively this equals a
rapid Carbon Footprint
assessment.
Analysis, Collaboration, Coordination, Adaptation for buildings
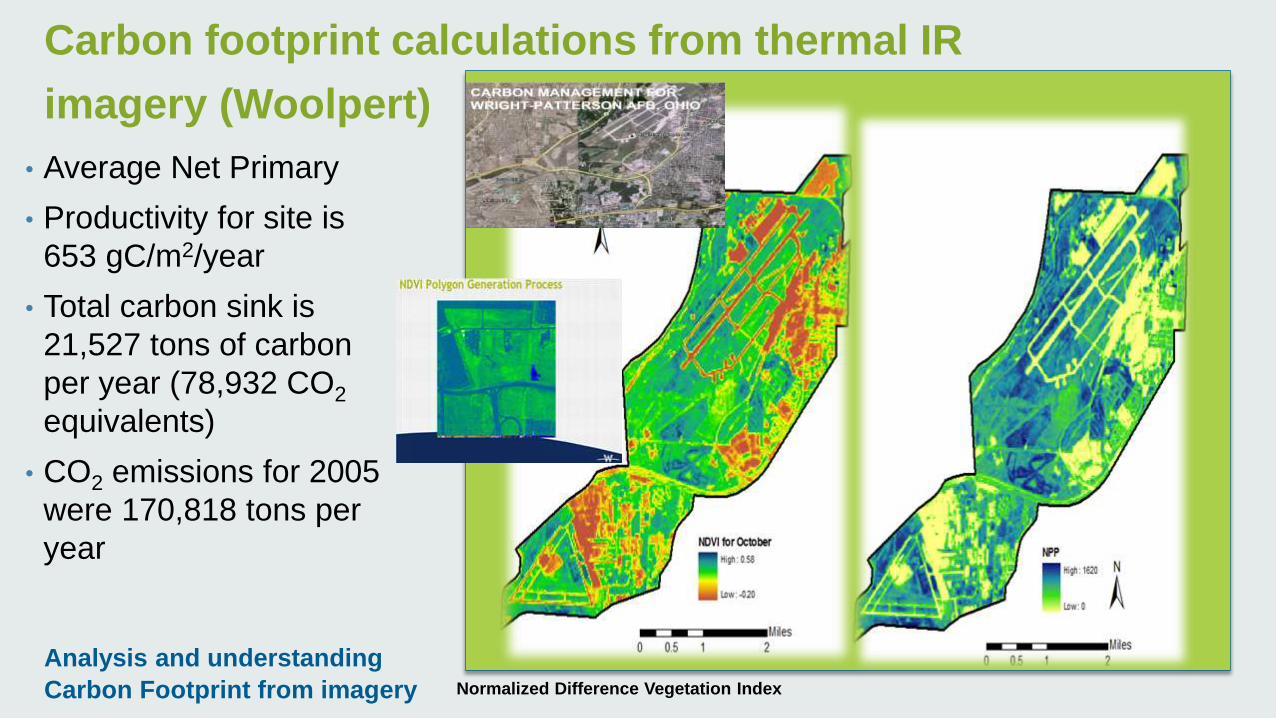
• Average Net Primary
• Productivity for site is
653 gC/m2/year
• Total carbon sink is
21,527 tons of carbon
per year (78,932 CO2
equivalents)
• CO2 emissions for 2005
were 170,818 tons per
year
Carbon footprint calculations from thermal IR imagery (Woolpert)
Analysis and understanding
Carbon Footprint from imagery Normalized Difference Vegetation Index

Really…Geospatial Accounting
Sustainability
Management
Individual
features
Vegetation
Cities

Analysis A Platform for Sustainability Planning

Leaking Steam
Leaking Steam Signature on Road
Crossing
Leaking Steam
Leaking Steam
Analysis and Understanding

What can you do with analyzed data?
Visualize and compare, relate, understand!
Comparing total carbon footprint of
Long Beach vs Torrance
Spatial and temporal comparison Emerging tools for better
Comparison and understanding
Configurable
Dashboards
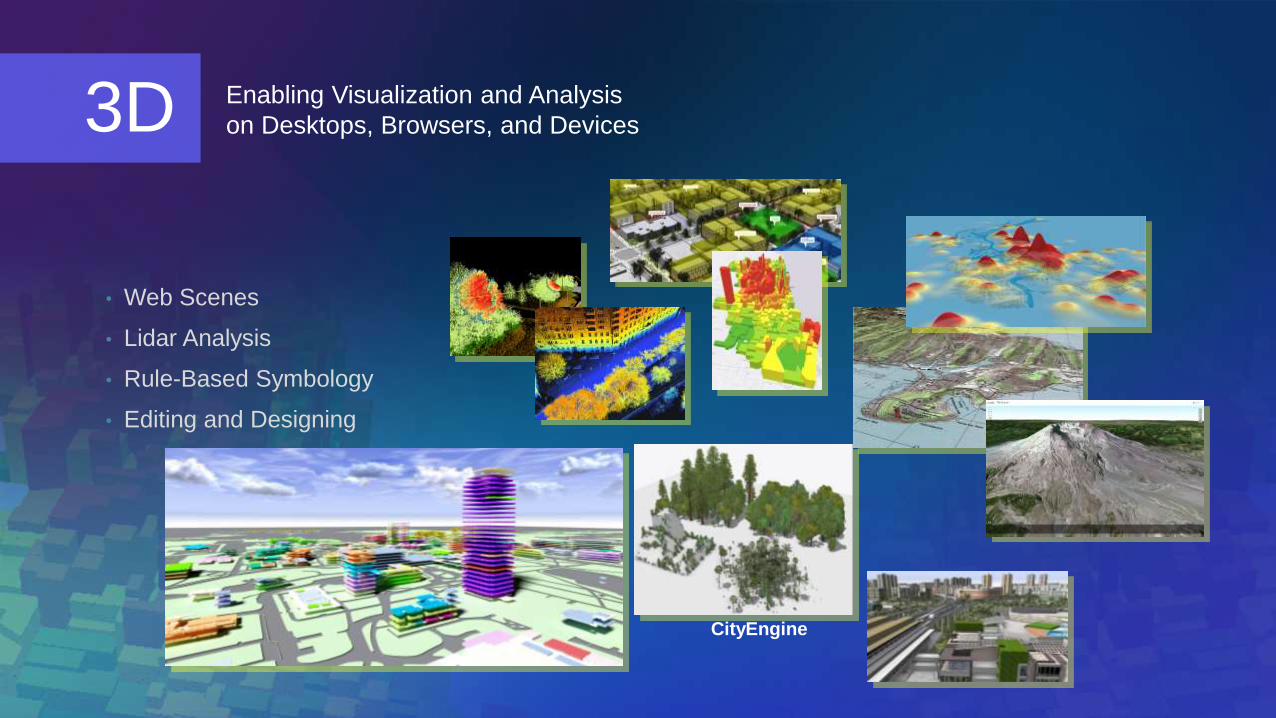
• Web Scenes
• Lidar Analysis
• Rule-Based Symbology
• Editing and Designing
CityEngine
Enabling Visualization and Analysis
on Desktops, Browsers, and Devices 3D

Visualizing 3D Geographic Information with Animation
means: Understanding Geographic Information in 4 dimensions
Iterative model building
Lessons Learned
. . . Creating Greater Understanding
• New York
• Katrina
• Sea Ice

Alternatives
Planning Platform for Sustainable Decisions
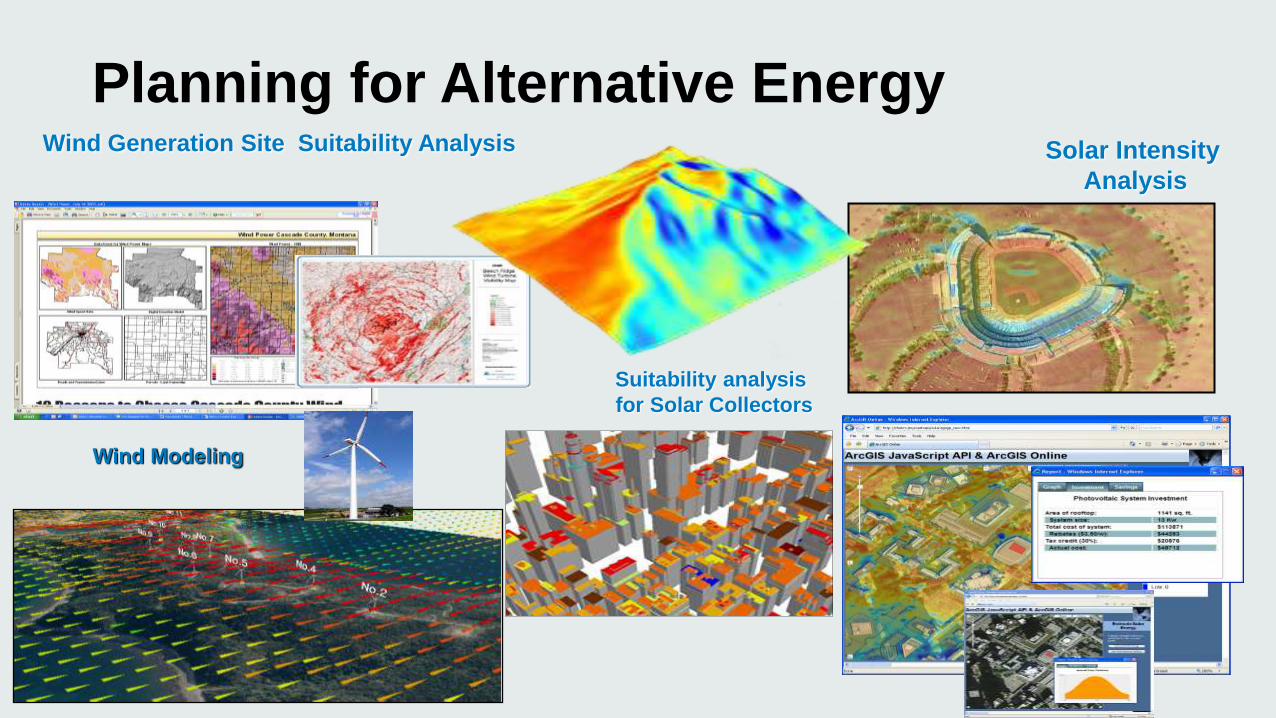
Planning for Alternative Energy
Wind Generation Site Suitability Analysis
Suitability analysis
for Solar Collectors
Solar Intensity
Analysis
Wind Modeling

Site suitability analysis for solar panels
Photovoltaic site suitability
a Model Builder application disseminated as a web service
housed in a discoverable Portal or Online
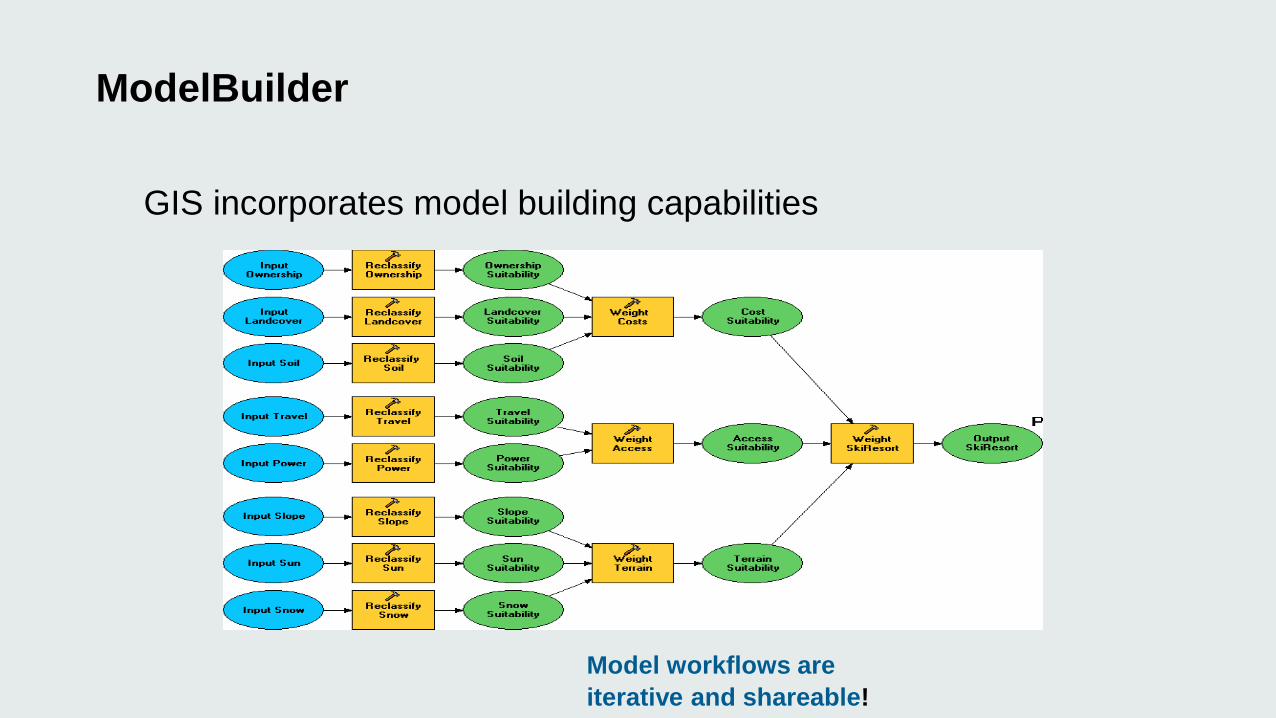
ModelBuilder
GIS incorporates model building capabilities
Model workflows are
iterative and shareable!

Models and sub-models break up big problems
Helps to clarify relationships, simplifies problems
Terrain
Sub-model
Input Data
(many)
Development
Cost Sub-model
Input Data
(many)
Accessibility
Sub-model
Solar Suitability
Model
Best Solar
Sites
Input Data
(many)
Process Mapping and understanding
Transformation

Example: Wind Turbine Site Suitability
analysis, an air operations perspective:
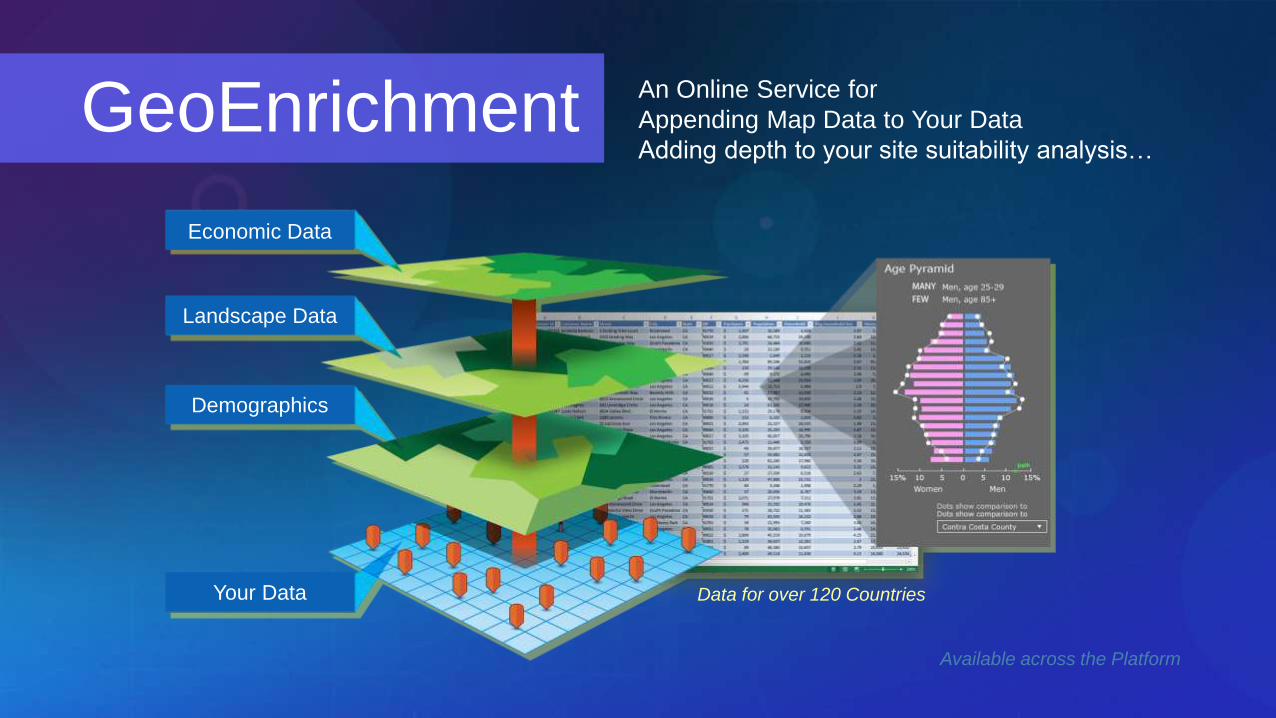
Available across the Platform
Data for over 120 Countries
An Online Service for
Appending Map Data to Your Data
Adding depth to your site suitability analysis… GeoEnrichment
Economic Data
Landscape Data
Demographics
Your Data
Adaptation and
Resilience
Planning Platform for Sustainable Decisions

Resilient Adaptive Planning Key requirement
What is viable, what is lost, what are the options…
MacDill AFB

Adaptation and Resilience Planning Natural Services Impact Assessment
Bhutan (ICIMOD)
Receding Glaciers and Permafrost Melt
Amazon
Increased Wildfire Frequency Prediction
Wildfire Progression
Oregon
San Diego
Fire Incident Reporting
Philippines
South Carolina
Predicting Storm Surge
Illinois
Predicting Tornado Intensity
Drought Prediction
Increased Frequency and Intensity of Severe Storms

Innovation
GeoPAT
Developed for IC, perfect for planning
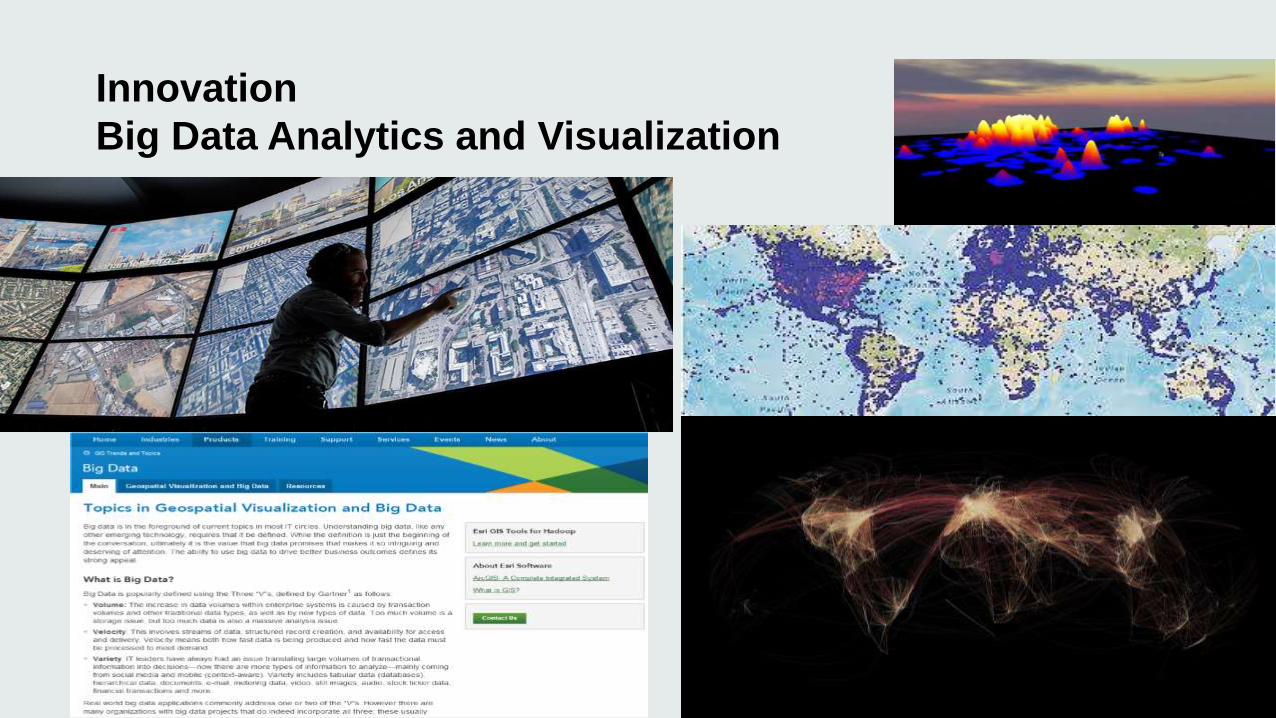
Innovation
Big Data Analytics and Visualization

GeoPlanner
Better Planning
Tools
Platform for Sustainable Planning

Feedback GeoPlanner
Geographic Planning
Data Analysis Design
(Sketch) Evaluate Decision
Urban Design
CityEngine
. . . Discipline-Independent Tools and Methods
Integrating the Planning and Design
Process into GIS Geodesign

Really…new 4D approach to resilient planning/design
• GeoDesign, GeoPlanner, 3D, Pro,
• GeoEvent Server

GeoPlanner for ArcGIS
Enabling informed decision making through geodesign
…create, analyze, and report on design alternatives.
Project
Data
Assess
Create
Evaluate
Compare
Report
Spatial
Analysis
User
Content
Landscape
Content
Imagery &
Basemaps
Weighted
Overlay
Geo-
Enrichment
GeoPlanner

Urban Observatory
Rapid Evaluation
Key Performance Indicators
Scenario Management 3D Design Summary Reports
Import Features
Esri Maps for Office
On-Premises Deployment
Precision Edit Tools
Industry Configurations
Weighted Raster Overlay Collaboration Tools
Spatial Analysis Tools
Dashboards
The Road Ahead GeoPlanner for ArcGIS

Innovation Platform
Portal for ArcGIS with Single Sign On
(CAC Authentication)

The Urban Observatory
Compare Cities,
views of the same city,
change over time
…same data, symbology,
scale
Sal Wurman (TED)
“You can only understand
Something new in relationship
To something you already know.”

Innovation:
Storymaps to tell
Sustainability Stories
Bran Ferren: better ways to tell
stories preceed major evolutionary
steps for civilization
Energy Story Map
Requirements
Options for Energy supply
Change over time

Situational
Awareness and
Reporting A Platform for Sustainability Planning

Innovation
Full Motion Video and UAV platforms

Innovation
Real Time Interactive GIS

Integration: plans, field reporting, situational awareness, and decision support
• GIS can link everyone for better coordination
Web linked, Living plans Situational Awareness Dashboard
3D in a web browser
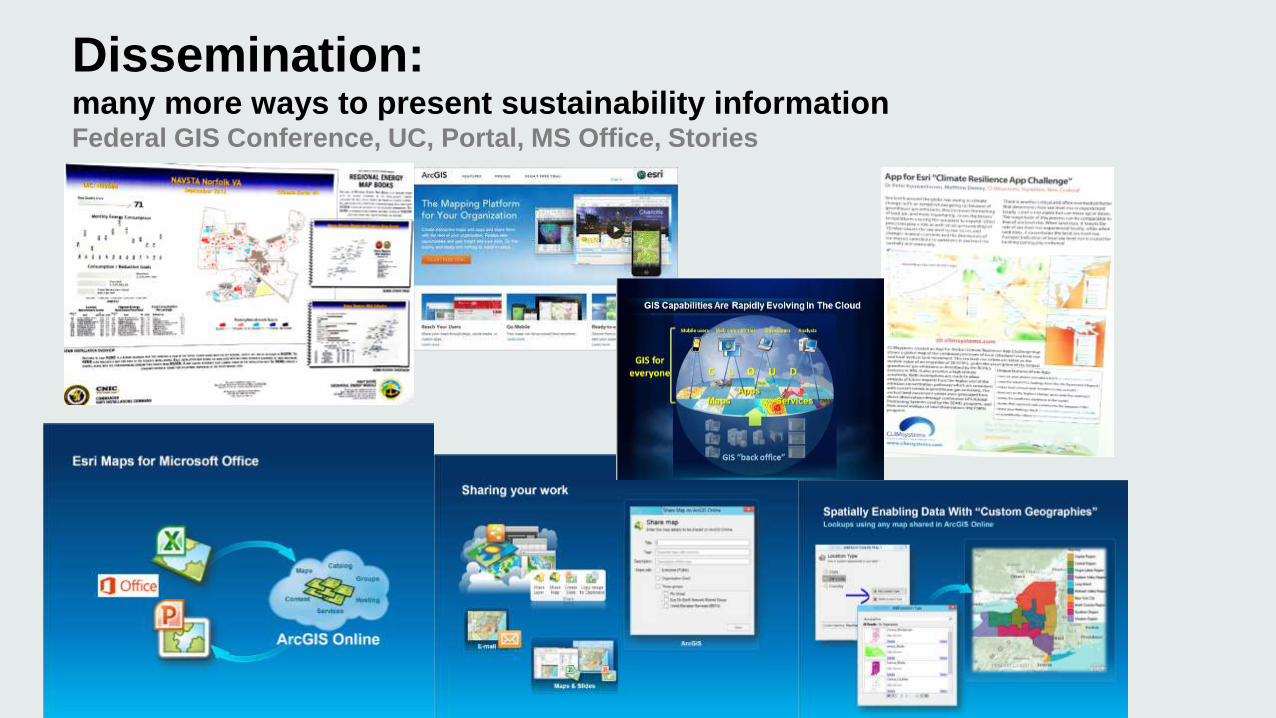
Dissemination: many more ways to present sustainability information Federal GIS Conference, UC, Portal, MS Office, Stories

Summary
A Platform for Sustainability Planning
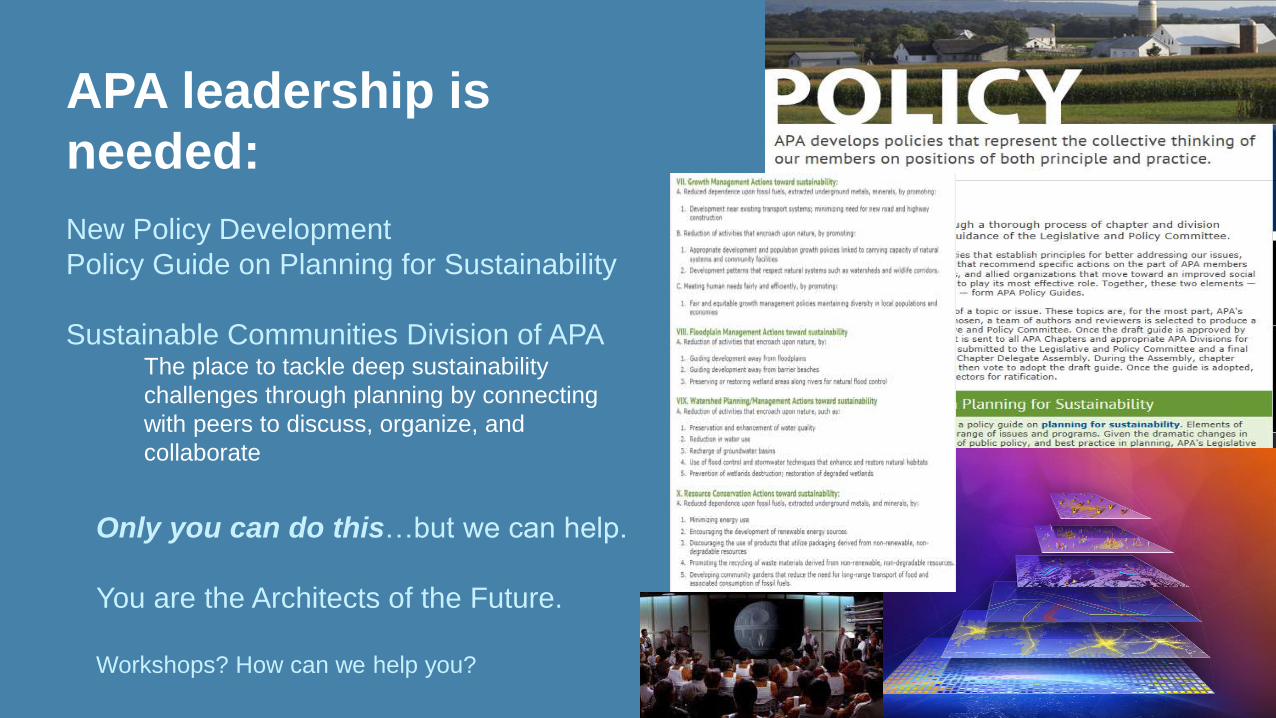
New Policy Development
Policy Guide on Planning for Sustainability
Sustainable Communities Division of APA • The place to tackle deep sustainability
challenges through planning by connecting
with peers to discuss, organize, and
collaborate
• Only you can do this…but we can help.
• You are the Architects of the Future.
• Workshops? How can we help you?
APA leadership is
needed:

A Planner’s “Cockpit”
Geographic
Sustainability Tools
• Data Models • Analysis Tools • Planning Tools • Site Suitability Modeling • Alternative Scenario Modeling • Collaboration Tools • 4D Visualization Tools • Operational View Dashboards • A “cockpit” view of virtual Earths • Management/Reporting Tools

Summary:
• Geography as a framework for content, context, and understanding of sustainability issues
• Climate Change is a geographically defined problem
• Policy is critical
• Geographic Information Systems are a platform and a toolset Assessment tools
Alternatives Analysis (Model Builder)
Situational Awareness/Decision Support (Dashboards and Maps), planning/adaptation
Public Awareness: Story Maps to Portals
Leverages existing technology already in your organization
• A chance to make a difference

Geospatial Platform as A Solution Framework Supporting Integration, Collaboration and Efficiency
. . . Becoming a Common Language
Facilitating
Communication
and Collaboration
Integrating and
Synthesizing Information
from Many Sources
Breaking Down Barriers
Between Institutions,
Disciplines and Cultures
A Geospatial platform to support Sustainability Planning

Thanks
• Terry Martin
• Esri Defense Team, Installations and Environment
• Serving those who serve