
AP42 Section: 13.2.1 Paved Roads Establish Silt … · Mobile Road Silt Collection System Test...
155
AP42 Section: 13.2.1 Paved Roads Title: Section 13.2.1 Establish Silt Loading Database for Typical Roads for use in AP-42 Paved Roads €PA Contract 68-D3-0001 November 1997 Not a reference
Transcript of AP42 Section: 13.2.1 Paved Roads Establish Silt … · Mobile Road Silt Collection System Test...

AP42 Section: 13.2.1 Paved Roads
Title: Section 13.2.1
Establish Silt Loading Database for Typical Roads for use in AP-42
Paved Roads
€PA Contract 68-D3-0001
November 1997
Not a reference
EPA
Text Box
Note: This material is related to a section in AP42, Compilation of Air Pollutant Emission Factors, Volume I Stationary Point and Area Sources. AP42 is located on the EPA web site at www.epa.gov/ttn/chief/ap42/ The file name refers to the file number, the AP42 chapter and then the section. The file name "rel01_c01s02.pdf" would mean the file relates to AP42 chapter 1 section 2. The document may be out of date and related to a previous version of the section. The document has been saved for archival and historical purposes. The primary source should always be checked. If current related information is available, it will be posted on the AP42 webpage with the current version of the section.

FINAL. PROJECT REPORT
ESTABLISH SILT LOADING DATABASE FOR
SECTION 13.2.1, PAVED ROADS TYPICAL ROADS FOR USE IN AP-42
EPA Contract No. 68D30001 Work Assignment No. 4-01
PES Project No. I401
Prepared for
Mr. Ron Myers Emission Factors and Inventory Group
Emissions Monitoring and Analysis Division U.S. Environmental Protection Agency
Research Triangle Park, NC 2771 1
November 10,1997 p:U401 Uinalrpf.wpdUinalrl3.wpd
Submitted by
PACIFIC ENVIRONMENTAL SERVICES, INC. 5001 S . Miami Blvd., Suite 300
PO Box 12077 Research Triangle Park, NC 27709-2077
(919) 941-0333, FAX (919) 941-0234

TABLE OF CONTENTS
€!as?
INTRODUCTION .......................................................... . 1
WORK ASSIGNMENT TASK 1 .............................................. 1
WORK ASSIGNMENT TASK 2 .............................................. 3
WORK ASSIGNMENT TASK 3 .............................................. 3
WORK ASSIGNMENT TASK 4 .............................................. 4
WORK ASSIGNMENT TASK 5 .............................................. 6
WORK ASSIGNMENT TASK 6 .............................................. 6
WORK ASSIGNMENT TASK 7 .............................................. 8
WORK ASSIGNMENT TASK 8 .............................................. 9
APPENDIX A Geographical Silt Loading Maps
APPENDIX B EPA Regional, State, and Local Contacts
APPENDIX C Quality Control Manual
APPENDIX D Safety Proceedures for Diverting Traffic Flow
APPENDIX E Sampling Data From Paved Roads
APPENDIX F Laboratory Analytical Procedures
APPENDIX G Mobile Road Silt Collection System Test Report
APPENDIX H Road and Curb Silt Regression Analysis and Sample Data Spreadsheets
APPENDIX I Sample Collection Sheets From the Excelm Work Book
APPENDIX J Regression Analysis Line Plots of Dependent and Independent Variables
i

LIST OF TABLES
TABLE 1 TABLE 2
TABLE 3
MEASURING NOZZLE EFFICIENCY COMPARISON . . . . . . . .
PERAGENCY ......................................... 10
....................................... 11
7 NUMBER OF SOURCE TEST REPORTS COLLECTED
NUMBER OF SOURCE TEST REPORTS PER AP-42 SECTION
ii

Contract No. 68D30001, WA No. 4-01
INTRODUCTION
The current national inventory for particulate matter with an aerodynamic diameter less than 10 /.un (PM-10) indicates that paved road emissions account for over 27 percent of the national emissions of PM-10. The basis of this inventory uses the emission factor presented in Section 13.2.1 of Compilation ofAir Polluiant Emission Factors, Volume I: Stationary Point and Area Sources, Fifth Edition, January 1995, including Supplement A (AP-42) with a modification of the median silt loading presented for paved roads. There is evidence to suggest that the national inventory overestimates the true emissions significantly. It is believed that part of this overestimation is caused by the silt loadings used to make the national estimate. It is known that the silt loading database presented in the paved roads section of AP-42 is biased as a result of sampling from limited localities in the western US and sampling following events which would result in increased silt loading to the roadway. The Environmental Protection Agency (EPA) is currently reviewing the national ambient air quality standard for particulate matter and may revise the standard to include finer fractions than 10 Mm. Should the Agency select a finer size cutoff, it is estimated that paved road emissions will decrease to 16 percent of national emissions; however, this estimate conflicts with the evidence available from ambient samples suggesting that the percentage should be much less than 16 percent. The Agency would like to obtain silt loading data more representative of the types of paved roadways contributing to the national particulate emissions and would like to begin the collection of information which would identify key roadway design, operation, and usage characteristics that affect silt loading. If possible, the Agency would like to foster an interest by State and local agencies to initiate a more thorough collection of silt loading information for use in local and regional inventories and for use in conformity analyses during roadway planning.
This final report format lists each task assignment, followed by a discussion of how the task was performed and the results. In some cases, recommendations follow the discussion of task results to clarify issues and to present suggestions for future task assignments, based on experience from following this work assignment.
WORK ASSIGNMENT TASK 1
The contractor shall identi3 and obtain information in the National Emissions Trends database which breaks out emissions officgitive particulate emissionsftom paved roads by road classification and Metropolitan Area. The contractor shall establish a methodology to prioritize the matrix of road type and metropolitan area for collection of road surface silt samples. The contractor shall contact individuals in the EPA Regions and the State or Local Air Pollution Conrrol Agencies which are responsible for mobile source emission estimates in the highest priority metropolitan areas to firrther refine the priority list. The contractor shall
1

Contract No. 68D30001, WA No. 4-01
identifi those metropolitan areas where local assistance can be obtained for an initial collection of the paved road samples to characterize the silt loading. In addition, the contractor shall identify those metropolitan areas which are willing to perform silt loading analysis on additional roads and during other seasons of the year than the initial collection time.
National Emission Tren d D s atabas e
PES contacted E. H. Pechan & Associates, of Springfield, VA, to request a copy of the National Emissions Trends database. EPA's Sharon Nizich authorized the release of a diskette copy of the National Emissions Trends database to PES.
The diskette contains 11 silt loading database files, one for each year -- 1984 through 1994. The silt loading files are named PMSILTyy.dbf where yy is the year of the data (Le., 84, 85, ..., 94). Each PMSILT database file contains silt loading data from paved roads for all 50 states and the District of Columbia in grams/square meter (g/mz) for both urban and rural roadways. The databases are M e r subdivided by roadway type; freeway, major street, collector, or local roadway.
In addition to the silt loading databases, the diskette also contains 11 corresponding rain data files. The rain data files are named RNfl-PVD.dbf, whereyy is the year of the data. Each RNyy-PVD.dbf database file contains the total number of rain days experienced by month for every State and the District of Columbia.
PES analyzed the 1994 silt loading data using the geographical information system MapinfoO. Eight maps were generated, one for each road type under both urban and rural classifications. Each map shows a graphical representation of the United States where every state is color coded to correspond with its relative amount of silt loading. See Appendix A.
The maps clearly illustrate that the most heavily silt loaded roads exist in North Dakota, South Dakota, Wyoming, and Montana, with the rest of the states being lower. This conf i i s the suspicion that the national inventory may overestimate hgitive emissions from paved roads due to the use of emission factors that are based on roadway silt loading data from these western states. This analysis indicates a need to establish a larger national data base for road silt loading, representing more of the United States.
PES contacted EPA Regional, State, and local offices in an attempt to get input concerning the identity of road segments for priority sampling of surface silt loading. The results from this effort are shown in Appendix B. It appears the priorities that have been established at both the Regional and State offices are consuming all their attention and assets. There is little interest in the development of a list of road types and metropolitan areas for the collection of road silt data. PES, working with the WAh4, determined that four-lane highways
2

ContractNo. 68D30001, WANo. 4-01
where posted traffic speeds range between 35 and 55 miles per hour are the priority road type.
WORK ASSIGNMENT TASK 2
The contractor shall coordinate with EPA Regional, State, and local contacts in the highestpriority metropolitan areas to identifi road segments representative of the highest priority design and use characteristics to be selected for initial sampling for surface silt loading. The contractor shall coordinate with other Regions and municipalities which are willing to perform additional sampling so that valid information is obtained and may be incorporated in the study.
PES attempted to identify agencies willing to perform silt loading sample collections from key road types. Although there was some interest, the Regions and States are generally unable at this time to commit their l i t e d assets toward this project. EPA Region 2, West Virginia and Michigan State agencies, have expressed some interest in our study. No organization would volunteer to gather road silt samples initially, or later during the different seasons.
WORK ASSIGNMENT TASK 3
The contractor shall coordinate with the study participants and others knowledgeable in paved road silt deposition and removal to identIfi key characteristics (such as road design, trafic type and volume, road maintenance and meteorological events) which may result in variations of the silt content of the roads.
PES contacted experts knowledgeable in paved road silt deposition and removal. With assistance from the experts such as Gregory E. Muleski, Principal Environmental Engineer with Midwest Research Institute (MRI) of Kansas City, Missouri, and Chat Cowherd of MRI, PES is able to identify key characteristics which affect silt content on roads.
Mr. Muleski believes that traffic speed is the major determinant effecting silt loading values. Traffic speed is followed by road winter maintenance such as sanding and salting the road bed for traction. Road design, the presence of curbs and gutters, is the next important factor that effects silt loading.
Chat Cowherd discussed the relationships of traffic volume, traffic speed, road maintenance, threshold speed of wind erosion, land use, and road design to the relative of . amount of silt loading found on paved roads. He pointed out that there is an inverse relationship between the amount of traffic and silt loading. The higher the traffic volume, the
3

Contract No. 68D30001, WA No. 4-01
lower amount of silt loading. The inverse relationship also is true for light traffic volumes. The lighter the traffic volume, the higher the silt loading.
Traffic volume has a direct relationship with traffk speed. Similar roads handling higher traffic volumes tend to have higher posted speed limits. The higher the traffk volume on similar roads, the higher the speed limit, and the lower the silt loading. This direct relationship of traffk volume to traffic speed, and the inverse relationship of high trafEc speed with low silt loading has been substantiated empirically with the silt loading samples collected by PES. Inversely, roads with low amounts of traffic and low speeds show high silt loadings. Traffic volume is defined as high if there are more than 5000 vehicle passes in a day. High speed roads are defined as having posted speed limits above 35 miles per hour.
Low wind velocity may not be a major consideration for silt loading influence. It was thought that wind erosion of near by unpaved surfaces can alter loading levels. The wind velocity necessary to erode soil and other matter and deposit it onto roadbeds is 13 miles per hour. However, soil type and particle size may influence road silt loading.
Land use contributes to road silt loading. Road silt loading levels tend to be higher on roadways that pass through industrial areas. This higher loading is due to industrial areas that have unpaved sections where the vehicles can pick up soil, gravel, and residuals from spilled loads, and then drop these materials onto the roads. This action is called "track out." Roads in residential areas show lower loading levels than some roads that pass through industrial areas.
WORK ASSIGNMENT TASK 4
The contractor shall review Appendix C. 1 and C.2 ofAP-42. The contractor shall prepare a Qualiv Assurance (Qd) plan to establish the comparabili@ of the Mobile Silt Collection System for Paved Roads to the procedures described in Appendix C. 1 ofAP-42. Information to be included in the QA plan are methods to establish the precision and accuracy of the alternative collection method compared to the established method. The QA plan shall include decision points for the performance of split samples. The QA plan shall be presented to the WAM for approval. Considering the existing sampling and analysis procedures for paved road surface silt analysis and the forms depicted, the contractor shall design a replacement form for this study which includes QA procedures approved by the WAMand for documenting key road design and use characteristics that should be collected for all roads. In addition, the contractor shall design an optional portion of the form which can be used for documenting other characteristics which are believed to be important but would require a larger database to identijj relationships between them and the surface silt loading of the roads.
4

Contract No. 68D30001, WA No. 4-01
PES has reviewed Appendix C.1 And C.2 of AP-42. The current status of a mobile collection system will be discussed in more detail under work assignment 6. The mobile system was designed, and a road test of a simulation sample collection system was conducted to empirically test the efficiency of the vacuum pick-up nozzle, and to compare the results with samples collected manually. The road tests demonstrated that the mobil road silt vacuum nozzle could not collect equivalent samples as those collected using the AP-42 manual road silt collection procedures.
PES was directed to collect road silt samples manually while attempting to solve the mobile road silt collection problem. As planning and preparations for manually collecting road silt samples began, PES recognized that additional procedures had to be developed and formalized in addition to those discussed in Appendix C.1.2 and C.2.2. To minimize variables during sample collection, and to provide safety during the collection process, PES developed written quality assurance procedures for the preparation and handling of vacuum cleaner sample bags, and procedures to follow for protecting the collection crew during the collection process.
Laboratory procedures, described in Appendix C.2, AP-42, were reviewed for quality assurance and combined with additional steps and check points. The sampling data for paved roads form, Figure (2.1-4, the moisture analysis form, Figure C.2-3, and the silt analysis form, Figure C.2-4, were combined and enhanced in an Excel" workbook. This workbook has paste functions, equation calculations, and quality assurance points. Information entered in the data collection sheet is automatically copied and pasted in the moisture analysis section and the silt analysis section of the second page in the workbook. The area measurements are reported as two linear foot measurements. The workbook calculates and sums the sample areas, converts the square foot units to square meter areas, and pastes those numbers on the second sheet for additional calculations. A part of the quality assurance checks compares the net dry sample weight calculated during moisture analysis to the total sample weight after the silt analysis. Two percent difference in mass has been chosen as a reasonable limit. The workbook performs a uniquely calculated value in grams for each sample.
These changes and enhancement are discussed in the Quality Assurance manual in Appendix C. The Quality Assuance manual follows the guidelines given in "Preparation Aids for the Development of Category I1 Quality Assurance Project Plans," EPA!600/8-91/004. As required by that document, the QAPjP briefly discusses overall project objectives and the data required to meet those objectives. The QAPjP also addresses QA issues related to data reduction, validation, and reporting. The QAPjP describes the necessary sampling and analysis quality assurance procedures for the manual system. PES revised the existing forms given in Appendices C.l and C.2 of AP-42 to satisfy many of these requirements, to document key road design and use characteristics, and to document other important characteristics which may impact silt loadings.
5

ContractNo. 68D30001, WANo. 4-01
WORK ASSIGNMENT TASK 5
The contractor shall coordinateiset up and perform training sessions with selected State/local agencies ta educate the participants on the proper sample collection and analysis methods, QA procedures, documentation requirements, and proceduresfor the sharing of the information obtained.
The execution of Task 2 resulted in a finding that local assistance in metropolitan areas is not available for the collection of paved road samples to characterize the silt loading in other parts of the country. This finding eliminated the need to train State and local agency personnel. PES coordinated and conduct training sessions for the PES personnel, who operated the manual road silt collection system equipment, on the proper sample collection and analysis methods, QA procedures, and documentation requirements. This training included follow-up quality assurance observation of actual collecting and analyzing operations at various stages during the period of effort.
WORK ASSIGNMENT TASK 6
The contractor shall arrange for the collection of road surface silt samples, the collection of the road design and use characteristics, the analysis of the samples collected, and the compilation of the information obtained. The contractor shall facilitate the sharing of the data amongparticipants of the stu&.
PES collected and analyzed road surface silt samples, using revised sample data and analysis forms generated during this work assignment that reflect road design and use characteristics. As originally contemplated, State and local agencies would be assisting in the sample collection effort in several regions of the country. That assistance was not available.
The contractor shall design, construct and evaluate a Mobile Silt Collection System for Paved Roads such that samples collected with this system comply with the Federal Guidance for EPA for a “Moving Operational Caravan.” The contractor shall use the Mobile Collection System for Paved Roads to collect samples at sites representative of those believed to be the major contributors of the paved road emissions as indicated in the National Emissions Trends database.
PES designed a Mobile Silt Collection System for Paved Roads. This system is designed to collect road silt at linear speeds that meet or exceed the minimum requirements of the Federal Guidance for a “Moving Operational Caravan.” PES conducted road tests with a simulated mobile road silt vacuum system simultaneously with manually collecting samples
6

I L T a 1 I B 1 li
I I I
P 1 2 (VacuumOnly)
3 (Compressed Air)
Contract No. 68D30001, WA No. 4-01
from the same road conditions. The specific procedures used and the analyzed results from the study are covered in the test report document in Appendix D. The mobile vacuum nozzle was not efficient enough to overcome the linear velocity of 3.5 to 4 miles per hour over-the- ground. The manually collected samples exceeded the mass collected using the mobile road silt collection system.
A new nozzle system was assembled that incorporated compressed air. Eight brass fan style nozzles were mounted at a 45 degree angle to the roadbed. Compressed air washes the road surface, directing particulate toward the vacuum cleaner nozzle suction. A test was devised in the PES laboratory to find out if the efficiency of the vacuum cleaner nozzle is increased through the use of compressed air that increase particle momentum toward the low pressure area of the system. A five foot long distance on the floor of the lab was marked off. A sample of 300 grams of construction sand was spread over the five foot length about 8 inches wide. The vacuum nozzle was pulled across this area over a period of 1 second to simulate the over the ground speed of 3 to 4 miles per hour. The results can be seen in Table
300 284 16
300 254 46
1.
TABLE 1. MEASURING NOZZLE EFFICIENCY COMPARISON
4 (Compressed Air)
5 (Compressed Air)
I Material Not Mass Vacuumed I I I Collected (gms) Trial Number Sample Mass (gins)
300 260 40
300 270 30
I 1 (VacuumOnly) I 300 (newsand) I 285 I 15 I
~~~~ ~
6 (Compressed Air)
7 (VacuumOnly)
8 (VacuumOnly)
9 lComuressed Air)
~ ~ ~ ~
300 (new sand) 272 28
300 288 12
300 288 12
300 271 29
10 (Compressed Air) 300 271 29
7

Contract No. 68D30001, WA No. 4-01
Material collected using the vacuum cleaner suction only averaged 13.8 grams while the combined vacuum suction and compressed air averaged 26 grams. These two numbers indicate that the efficiency of a vacuum cleaner nozzle, moving across a surface at 3 to 4 miles per hour, can be improved nearly 100 percent by combining compressed air flow with a vacuum suction. The mobile road silt collection road tests, performed earlier, demonstrates that the vacuum cleaner n o d e efficiency was not sufficient to collect road silt samples comparable to those collected manually.
This experiment does not demonstrate that a mobile road silt collection system is feasible, but it does answer the nozzle efficiency question. Please note that the sample density in this experiment was 90 grams per square foot, a number many times the average road sample density. PES believes a lighter density sample will favor the combined vacuum and compressed air combination. Additionally, the compressor used in the laboratory was limited in pumping capacity and compressed air storage. Only 40 psi could be maintained at the high pressure hose consistently for a period of time to accurately run the experiments. At 40 psi, sand placed completely around the vacuum cleaner nozzle was pulled into the vacuum, showing that the compressed air was not overwhelming the movement of air entering the vacuum cleaner. This indicates the vacuum cleaner has additional capacity to handle an increase of compressed air volume.
Additional efforts be expended toward the mobile road silt collection system development. Collecting samples using the manual road silt collection system is dangerous, very time consuming, and expensive. If a safer and less expensive system to collect accurate samples can be made available, the possibility of assistance in collecting road silt samples throughout the United States is more likely.
WORK ASSIGNMENT TASK 7
At key stages ofthe study, the contractor shall evaluate the revised silt loading database to determine the mathematical relationships between the road design and use characteristics and the resulting silt loading. The contractor shall report the results of these analyses to the WAMand upon approval share these analyses with the participants of the study. At the completion of the project, the contractor shall prepare a report which documents the information collected, the analyses performed to relate the road design and use characteristics with the measured surface silt loading, the results of the analyses, and a discussion of the uncertainties and variabilities which are not addressed in the analysis and which may cause differences in surface silt loading.
8

Contract No. 68D30001, WA No. 4-01
PES collected and analyzed a total of 34 road and curb silt samples. After passing all quality assurance procedures, 16 road silt samples and 13 curb road silt samples remained for road silt analytical study. The quality assurance procedures in place identified two road silt samples and three curb road silt samples that were flawed and should not be used in a national data base. The remaining 16 road silt samples should be representative of road silt loading on four lane highways in Wake and Durham Counties, North Carolina. The curb road silt samples were collected and analyzed to explore the relationship, if any, between road silt loading and silt loading in the corresponding sample curb area. A regression line plot that compares paired sample road to curb silt loading does not show a strong relationship. A copy of this plot is included in Appendix E, along with spreadsheets reflecting the total data pool, information limited to road silt samples, and information limited to curb silt samples.
A complete set of the data forms for each sample, generated by using the new Excelm workbook discussed earlier, and copies of the linear regression relationship plots for the dependent and independent variables for road silt and curb silt are in Appendix F and G respectively. Trends and relationships are not strong in any of the regression analysis plots. However, those relationships are less likely to be discemable when the number of samples are small. Additional road silt samples should improve the ability to discern what if any relationship exists. Until then, the relationship information of dependent and independent variables from the current data should be used only as an indicator until more samples can be included to improve the confidence level.
WORK ASSIGNMENT TASK 8
The contractor shall image process emission test reports supplied through the WAM fiom EPA Regional Ofices and enter test report summary information into the Source Test Information and Retrieval (STIRS) database. The contractor shall provide support in resolving problems identifed by the WAMon using the STIRS database, the RecordStar viewing software, and test report images on CD-ROMdisks. As directed by the WAM, the contractor shall revise the users manual for the integrated use of the STIRS database program, RecordStar image viewing program, and the CD-ROM disks containing electronic images of source test reports. As directed by the WAM the contractor shall perform second level evaluations on identified test reports.
The contractor shall identify those Statellocal agencies which generally require the collection and analysis of condensible particulate matter during emission testing for Filterable Particulate matter. The contractor shall determine the potential number of external combustion source tests located in the files of those State/Local Agencies which collect condensible particulate emission information. The contractor shall also determine the number of additional non-external combustion source test available within the State/Local I
9 I

ContractNo. 68D30001, WAND. 4-01
filing system. The contractor shall deliver to the WAMa prioritized list of State/Local offices to be considered for visits. The list of State/Local ofices shall include information on the number of external and non-external combustion source tests in the files of the identifed State/Local agencies. Upon approval by the WAM the contractor shall visit the State/Local agencies identified by the WAMto obtain electronic images of emission source tests which includes valid information on emissions and process operatiom. The contractor shall arrange the source tests by AP-42 Chapter and Section, and archive the information on CD-ROMdiscs for delivery to the WAM. The contractor shall enter summary informationfiom the source tests into the STIRS database. The contractor shall deliver to the WAMthe updated STIRS data base
PES identified the State and local agencies that generally require the collection and analysis of condensible particulate during air emission testing. PES determined the potential number of external and nonextemal combustion source tests located in the identified offices, and provided the WAM with a prioritized list of the number of external and nonextemal combustion source tests in the files.
Source test report collection trips where made to four State agencies; the Oregon Department of Environmental Quality (ODEQ), the Pennsylvania Department of Environmental Protection (PDEP), the Texas Natural Resource Conservation Commission (TNRCC), and the Wisconsin Department of Natural Resources (WDNR). A total of 338 source test reports were collected, subjected to a primary review, and scanned onto magneto- optical disks. See Table 2 for a numerical breakdown by agency. Once the source test reports had been assigned to AP-42 sections, the individual source test report files were moved into the appropriate directories and copied onto compact discs. The compact discs have been delivered to the WAM. See Table 3 for a list of the determined AP-42 sections. General information regarding each source test report was entered into the STIRS database.
TABLE 2. NUMBER OF SOURCE TEST REPORTS COLLECTED PER AGENCY
Agency Number of Source Test
Environmental Quality I I I ~.
61 I Pennsylvania Department of II Environmental Protection
II 104 I Texas Natural Resource Conservation Commission
M Wisconsin Department of 105 Natural Resources
10

Contract No. 68D30001, WA No. 4-01
TABLE 3. NUMBER OF SOURCE TEST REPORTS PER AP-42 SECTION
AP-42 Section Number olSource Test Reports'
1.1 61 ~~ ~ ~
I .2 7
1.3 28
1.4
1.11
83
I
1.5
1.6
1.10
3
I
65
12
1 .x 45 I
3.1 11
3.2 I 37 I1 II
3.3 I 2
II II
11.30 1 I
'Reports may be listed in more than one hP-42 section,
Recommendation
There were some problems encountered during the source test report collection trips. First, more source test reports could have been scanned during the trips had the scanner been able to accommodate two sided pages. Because it will only scan one-sided pages, the double- sided pages must be manually turned over in order to be scanned. This causes a delay because the scanner gives an out of paper message and then the scanning process must be restarted. Second, during the last source test report collection trip to PDEP, the scanner started to sporadically save batches of pages onto the disk. This caused extra time to be spent double
11

Contract No. 68D30001, WA No. 4-01
checking each batch and rescanning when necessary. PES recommends that a new double- sided capacity scanner be purchased to avoid the above mentioned problems.
12

Contract No. 68D30001, WA NO. 4-01
APPENDIX A
Geographical SiIt Loading Maps

1 I I 9 1 k I I I s I I 1 A I I I i 1
v) % ([I
Q) Q)
LL
3 L
I
([I
m -#-I
n 0) c U ([I 0
.-
0)
0 c Y


4 I I I 1 I I I s i t 1 I E I I 1 1 4
t ,

I

u s I I I 1 I i 0 1 I I I 1 I I I I I
I
(0
(0 0 c
a m 4-
Y
C j G ..... 0 0 0
?

u 1 I I 111 1 I I a: I I I 1 I 1 1 1 I 1
I
(u
(u +
n 0) c T3 (u 0
.-

i I I I I I I I B I I I 1 I I I I I I
cn >r cu Q) Q)
E
G I
cu cu +
n rn S v cu 0
.-
t cu a 3 L
I %
h
R

I I 1 I 1 1 I I D I I I 1 I I I I I I
to ([I 3 u ([I 0 CIL
I
([I ([I +
n rn != U ([I 0 -I
.-
W m I
I'

I I Coneact No. 68D30001, WA No. 4-01
I
I I
APPENDIX B
EPA Regional, State, and Local Contacts

P I 'I I I I I I I I I I I I 1 I I I 'I
ConaaaNo. 68D30001, WANo. 4-01
Region
EPA Region 1
EPA Region 2
EPA Region 2
EPA Region 3
EPA Region 4
EPA Region 4
EPA Region 4
Name
Matt Cairns
Kenneth Eng
Ray Werner
James Burke
Doug Neely
Kaye Prince
Steve Scholfield
Telephone
617-565-3583
2 12-637-4080
212-637-3951
21 5-597-7934
404-347-2864
404-347-2867
404-347-3 5 5 5
Comments
No interest in participating - could not give me any state or local contacts.
Directed me to another person in his office.
Mr. Werner believes that the data in NETD for his areas is high by a factor of two. He would like to participate in the study with two non- attainment areas, New York and Puerto Rico. He also made an information request.
No interest in participating. However, he did give PES some contacts in West Virginia and Allegheny Co. Pennsylvania
Directed to call Kaye Prince.
Never returned PES' calls.
No interest in participating.
Allegheny Co., PA. Cari weaver 412-578-8101 No interest in participating.
EPA Region 5 John Summerhays 3 12-886-6067 No interest in participating. However, he did give PES some contacts in Illiiois and Michigan.
EPA Region 6 Mary Kemp 214-665-8358 Directed PES to other people.

I I I I I I I I I I I I I I I 1 I I I
Contract No. 68D30001, WA No. 4-01
Region
EPA Region 6
EPA Region 7
EPA Region 8
EPA Region 9
EPA Region I O
EPA Region I O
WV OAQ
IL OAQ
MI OAQ
Name
Stanley Sprull
Don Toensing
Cali Vidaticb
Lisa Thorpe
George Lauderdale
John Pavitt
Tim Carroll
Rob Kaleel
Raj Sinha
Telephone
214-665-72 12
913-55 1-7446
303-3 12-6434
415-744-1264
206-553-651 1
907-271 -3688
304-238-1220
217-782-1830
313-832-5001
Comments
Indicated that this was not his area of responsibility. He did give PES a list of contacts in Texas, Oklahoma, New Mexico, Arkansas, and Louisiana.
No interest in Participating, However, he did give PES some contacts in Missouri and Nebraska.
No interest in participating, However, she did give PES some contacts in Colorado and Montana.
No interest in participating.
No interest in participating, However, he did give me a contact in the EPA who handles Alaska, and contacts in Idaho, Lane Region Air Pollution Authority, and Washington State University.
No interest in participating.
Has interest in participating, but before committing he would like to see additional information.
No interest in participating.
Has some interest in participating, but before committing he would like to see additional information.

Conhact No. 68D30001, WA No. 4-01 I ~
I I I I I I I I I I 1 I 1 I I I I
Region
Tx NRCC
OK OAQ
NM OAQ
LA OAQ
AR OAQ
MO OAQ
NE OAQ
MO OAQ
CO OAQ
ID OAQ
LRAF'A
wsu
Name
Dana Vermillion
David Shutz
Jim Shiveley
Larry Devillier
Mike Porta
Calvin Ku
Shelley Kaderly
Gretchen Bennett
Patrick Cummins
Don Redline
Jeneane Parisi
Candace Clayboum
Telephone
5 12-239-1000
405-524-1348
505-827-1492
504-765-0165
501-661-2000
573-751-4817
402-471-2189
406-444-2724
303-629-5450
208-769- 1422
541-726-2514
509-335-5055
Comments
Indicated that this was not her area of responsibility.
No interest in participating.
No interest in participating.
No interest in participating.
No interest in participating.
No interest in participating.
No interest in participating.
No interest in participating.
No interest in participating.
Unable to contact.
No interest in participating.
Ms. Clayboum was unaware of the NETD data and therefore unable to comment.

I I I I I I I I I I I I I 1 I I I I I
Contract No. 68D30001, WA No. 4-01
APPENDIX C
Quality Control Manual

I
I I 1 1 1 I I I I I I 1 I I I I I
‘I Contract No. 68D30001, WA No. 4-01
QUALITY CONTROL MANUAL
ESTABLISH SILT LOADING DATABASE FOR
SECTION 13.2.1 PAVED ROADS TYPICAL ROADS FOR USE IN AP-42
EPA Contract No. 68D30001 Work Assignment No. 4-0 1
PES Project No. 1401
Prepared for
Mr. Ronald Myers Emission Factors and Inventory Group
Emissions Monitoring and Analysis Division US. Environmental Protection Agency
Research Triangle Park, NC 2771 1
August 29, 1997 P:\I401
Submitted by
PACIFIC ENVIRONMENTAL SERVICES, INC. 5001 S. Miami Blvd., Suite 300
PO Box 12077 Research Triangle Park, NC 27709-2077
(919) 941-0333, FAX (919) 941-0234

I I I 1 I I I I I I I I I I I I I I I
Contract No. 68D30001, WA No. 4-01
GENERAL OVERVIEW
Paved roads account for more than 27 percent of particulate matter with an aerodynamic diameter less than 10 pm (PM-10) in the current national inventory for particulate matter. The basis of this inventory uses the emission factor presented in Section 13.2.1 of Compilation ofAir Pollutant Emission Factors, Volume I: Stationary Point andArea Sources, Fifth Edition, January 5, 1995, including Supplement A (AP-42) with a modification of the median silt loading presented for paved roads. There is evidence to suggest that the national inventory overestimates the true emissions significantly. Part of this over estimation may be caused by the silt loading database used to make the national inventory. Sampling data for road silt has been collected in limited localities in the western United States. Such sampling limitations may have created an overestimation of road silt due to sampling following events such as the addition of salt and sand to road surfaces, increasing silt loading on the roadway. The Agency would like to obtain silt loading data more representative of the rest of the United States.
The purpose of this study is to gather road silt samples from roadways that carry major traffic loads. Four lane highways that have a large daily traffic flow pattern fit that definition. Information to be gathered is expected to be added to the national road silt data base as a continuation of data collection efforts used to quantify actual road silt occurrences, particularly along the East Coast.
THE SAMPLING SYSTEM
Sampling procedures will closely follow those described in AP-42 Appendix C.1.2. Road silt samples will be collected manually with a vacuum cleaner. Road traffic will be diverted during the sample collection process. Supporting equipment will include a generator, road safety equipment, and sample containers. Sample areas are to be chosen to reduce the influence of construction projects, agricultural activities, and any activity that may influence the amounts of road silt. The goal is to gather representative samples that can be added to the existing database for road silt. Sample handling procedures are discussed in detail later in this manual.
STATEMENT OF PROJECT OBJECTIVES
The objective of this data collection process is to accurately report road silt amounts found on heavily traveled roadbeds found in the eastern United States.

I I I I I I I I I I I I I I I I I I
Contract No. 68D30001, WA No. 4-01
EXPERIMENTAL DESIGN
The basic design for collecting road silt samples requires the vacuuming of roadbed surfaces, from white line to white line. The designated surface area must be properly measured and vacuumed. Collected samples must be properly identified, transported, and analyzed. The critical measurements are area vacuumed and the mass of the road silt. During road silt analysis, critical measurements are the weighing of equipment and sample materials, and the calculations of moisture and partical size.
SCHEDULE
The sample gathering is scheduled for June and July, 1997 in Durham and Wake counties. Preliminary studies suggest that four lane roadbeds should be selected for study. Traffic diversions on major roads with heavy traffic flow are dangerous and require considerable training using written procedures. Before sampling can begin, site selections must be made, permission gained from the Department of Transportation, equipment rented, team training completed, and laboratory procedures reviewed.
PROJECT ORGANIZATION AND RESPONSIBILITY
Paul Grable will organize and train the collection team. Mike Maret will be responsible for training the lab analysis team. The collection team will be Ken hlullen, Tim Okabayshi, and Paula Frederici. Tim Okabayshi, and Paula Frederici will perform the lab analysis work. Paul Grable will upgrade both the field and laboratory data sheet, and creating an EXCELm workbook containing those two forms. He will insert formulas that will calculate the sample area, the silt loading, and the silt fraction for each sample site. Paul Grable will complete the statistic analysis will be performed by Paul Grable. The final report preparation will be completed by Paul Grable.
QUALITY ASSURANCE OBJECTIVES
This project requires careful measurement of the sample area and the following of standard laboratory techniques and procedures. Other than scale calibrations and checking with standard weights, quality assurance procedure will includes monitoring training and following procedures required to collect the samples and analyze them accurately.
A Ob- . .
The collection and analysis of road silt samples are not complicated. Primary objectives are the requirements for good planning, following procedures, and analytically

I I I 1 I I I I 9 I I I I I I I I I I
SITE SELECTION AND SAMPLING PROCEDURES
The AP-42 discussions in Section 13.2.1, Paved Roads, have guided the planning for site selection and sampling procedures. Using the information, a list of requirements has been generated and will be used to determine if a site is selected for sample gathering. An important step in preparing for collecting road silt samples is to desiccate, tare, and number the vacuum cleaner bags. The vacuum cleaner bags are then individually placed in identically numbered plastic freezer bags, and stored for use at the sampling site.
Contract No. 68D30001, WA No. 4-01
processing samples consistently. Mass balance is to be the QA criteria for sample integrity, laboratory QA, and record keeping accuracy.
. . . . ve OA Obfictives: Oualitative OA Objectives: Pre- Method . .
This type of sample collection does not lend itself to multiple redundant sampling. There are many independent variables that contribute to road silt deposition, equilibrium, and removal. Sample density varies from white line to white line, and down the length of the road bed, within the same sample area.
The dependent variable road silt, and is a direct result of the influence of independent variables. One of the goals of this project is to determine, if possible, the relationship of the independent variables to the dependent variable.
. . . . . . itative OA Objectives: C o m p a h b y and Representativeness
Comparability is the degree that one sample data set can be compared to another. The comparability of sample sets represents an unknown and the use of statistical analysis to define it is a goal of of this project. Statistics will be used to demonstrate representativeness, the degree to which each sample and the group of samples is indicative of the population.
Mass balance is the analytical check for each of the samples analyzed. The laboratory data sheet will demonstrate the accuracy of the analysis.
What If OA Ob- iectives Ar e Not Met?
If the QA objectives are not met, then the infomation will not become a part of the database.

I I I' (1 I I I I 'I I I I I I I I I I I
Contract No. 68D30001, WA No. 4-01
Site Selection
The following is the site criteria to be met prior to gathering road silt samples from the road bed. Safety is of primary concern due to the known hazards of exposing personnel in close proximity to high speed automobile traffic.
1. The topography of the road must permit vehicle drivers enough distance to clearly understand the changing traffic pattern and to safely make the changes necessary to avoid dangerous situations.
2. The sample area for this project must be a four lane road. The four lanes should be homogeneous with regard to the nature of the neighborhood and traffic flow rates.
3. The sample area must be free of construction sites and industrial unpaved drives that would influence road silt distribution.
4. The road surface in a state of normal maintenance. There should not be pot holes or signs of recent construction such as loose gravel.
5. The road surface must be dry with no water puddles visible on the road shoulders.
SamDling Site DescriutiQn
Multiple sample sites will be picked throughout Durham and Wake counties. Site selection will follow the listed requirements discussed above.
Procedure
1. Follow the instructions in Appendix A to divert traffic from two lane into one lane.
2. Measure a distance of 50 feet down the middle of the lane in the sampling area. See Appendix B.
3. Measure the width of the lane in three random places from curb white line to the center division line in the sampling area and average them.
4. Measure the depth of the curb from the white line to the curb. If no curb exists, then find an average depth between the white line and the smooth paved surface grass line.
numbered vacuum cleaner bag from the gallon zip-lock freezer bag. Install it in the vacuum cleaner.
5. Inspect the empty vacuum cleaner interior for foreign materials. Remove a

Contract No. 68D30001, WA No. 4-01
6. Vacuum the main road surface between the curb white line and the center division line in the sampling area.
7. Remove the vacuum cleaner bag, inspect the empty vacuum cleaner for foreign material. then install a new bag. This vacuum bag will hold the curb sample, a - - procedure unique to this project to study the relationship of curb silt fraction and road silt found along the curb, to the road silt recovered from the road surface over - which vehicular traffic operates.
8. Vacuum the paved area from the curb white line (including the white line surface area) to the curb or the edge of the end of the paved area along the road.
9. After vacuuming the sample area curb surface, move the sample collection equipment approximately 200 yards down the road. Repeat steps two through four listed above. Using the curb sample bad till in the vacuum cleaner, collect a sample from the curb in an identical manner to step eight.
I I I ‘I I I I I ‘I I I I ‘I I I I I I I
10. Remove the vacuum cleaner bag, inspect the empty vacuum cleaner for foreign material, then reinstall the first vacuum cleaner bad, originally used to collect the sample from the vehicular road bed. Vacuum the main road surface between the curb white line and the center division line in the sampling area.
1 1 . Follow the instructions in Appendix A to divert traffic from one lane to the lane just sampled.
12. Reposition the sample collection equipment to the traffic lane next to the original road lane sample area. Follow steps two through four. The vacuum cleaner bag in the vacuum cleaner is the one used to collect the road sample, as opposed to the vacuum cleaner bag containing the curb sample.
13. Follow steps seven through nine. Each time a vacuum cleaner bag is changed in the vacuum cleaner, only one freezer bag is to be open at a time to preclude mixing up the vacuum cleaner bags with the numbered freezer bags.
14. Follow the instructions in Appendix A to safely reopen the divert traffic lane back to the normal two lane traffic flow.
Sample custody is in the hands of the sampling team that collects the samples while filling out the “Sampling Data from Paved Roads” data collection sheet. Bag numbers are

P I I 'I 1 I I I I E 1 I D I ~I
Contract No. 68D30001, WA No. 4-01
recorded at the site, and become the link between the sample, data collection sheet, and the laboratory analysis documentation. Upon completing the collection of the sample, the road silt collection team returns the vacuum bags holding the sample to the PES lab.
ANALYTICAL PROCEDURES AND CALIBRATION
-ved Or Other Validated Standard M&Q&
PES will follow the guidance found in AP-42, Appendix C. 1, (reformatted 1/95>. See Appendix C.
Nonstandard Or Modified Methods
Not Applicable
m r o c e d u m And Freqmuy
Follow the calibration procedure required by the electronic digital scale in the PES lab.
DATA REDUCTION, VALIDATION, AND REPORTING
Data Reductm
Data reduction shall be made using the EXCEL'- spread sheet. Statistics used will include multilineal regression and log transform. This will be a coordinated effort by Paul Grable, Vicky Kriegsman, and Robert Wagoner.
Data Valldatlon . .
In addition to using the data reduction listed above, standard deviations and other tools will be employed to find relationships between the independent variables and the dependent variable.
PES personnel who collect samples and conduct laboratory analysis procedures on the sample are listed on the data sheets. The final project report will contain a complete discussion of the statistical analysis of collected data.
I I I I ~-

I 0 I I I I I I I I I t I I I I I I I
ContractNo. 68D30001, WANo. 4-01
INTERNAL QUALITY CONTROL CHECKS
Mass balance calculations and scale calibrations are the major QA checks available. QA checks on procedural practices will be conducted during system audits.
PERFORMANCE AND SYSTEM AUDITS
The project manager is responsible for training. After the road silt collection crew is trained, The project manager will make two procedure inspections by acting as an observer during actual collections of sample materials.
The project manager will also follow two samples though the laboratory analysis, insuring that the written laboratory procedures are followed.
CALCULATION OF DATA QUALITY INDICATORS
Data Qual& Indicatars
Road silt collection and sample analysis is not conducive to QC check such as split or replicated samples. The discussion in AP-42 indicates that high traffic flow and high speed travel minimizes the amount of road silt density. The number of independent variables that influence the amount of road silt per area unit creates too much variability to permit side-by- side comparisons of collected samples. Spiked samples are of small value due in part to the simple nature of sifting the sample to size partials.
CORRECTIVE ACTION
If any deviatioas or misunderstanding of procedures is discovered during system audits, immediate corrective action will be taken to correct it, and effected samples identified. As a precaution to such a problem, samples will be stored for 6 months after the original analysis is completed to permit reanalysis if necessary.
QUALITY CONTROL REPORTS TO MANAGEMENT
A quality control report will be made by the project manager after the system audits are complete.

R
I I I I I I # II I 1 I I
1 I I
i
n
Contract No. 68D30001, WANo. 4-01
REFERENCES
1. Preparation Aids for the Development of Category II Qualiw /Assurance Project Plans, EPA/600/8-91/004, February 1991, Office of Research and Development, United States Environmental Protection Agency, Washington DC 20460.
Paved Roads, AP-42, Section 13.2.1, United States Environmental Protection Agency 2.
3. Procedures for Sampling Surface/Bulk Dust Loading, AP-42, Appendix C. 1, United States Environmental Protection Agency
Procedures for Laboratory Analysis Of Surface/Bulk Dust Loading Samples, AP-42, Appendix C.2, United States Environmental Protection Agency.
4.

k t I t 1 f 1 I 4 I I P P 1 P 1 c I I
Contract No. 68D30001, WA No. 4-01
APPENDIX D
Safety Proceedures for Diverting Traffic Flow

Contract No. 68D30001, WA No. 4-01
PES SAFETY PROCEEDURES FOR DIVERTING TRAFFIC FLOW
The following description of the safety procedures is to be followed unless it is deemed to be too dangerous or is modifies. This is written to improve PES employees’ understanding of the order of event that need to take place when diverting high speed traffic. All of us depend on the others to keep us safe, but that dependency does not allow complacency or sloppiness to occur. Each of us must stay alert at all times. It is best to be scared, and not to take any chances.
About one-half a mile from the sample area, the truck will pull to the side of the road to permit the placement of “Men Working” sign on the shoulder. One-tenth of a mile further, and a second sign “Merge Left” is placed on the shoulder of the road. Travel an additional one-tenth of a mile and place the sign with the symbol of two lanes converging on the shoulder of the road.
The actual cone placement begins an additional one-tenth of a mile past the last sign placement on the shoulder of the road. The truck is stopped, half on the shoulder of the road and half on the road. One member with a hand held red flag, faces the oncoming traffic and waves the cars into the open lane. Then the second person starts placing the cones (five) at a gradual angle across the road, watching the traffic.
Once the cones &e placed across the road, the two people return to the truck. The remaining cones will be placed over a thousand feet (two-tenths of a mile). This area is known as the taper and buffer zone. It is the distance needed for a vehicle, traveling at high speed and crashing through the cone, to safely recover and stop. This is our safety zone.
At the end of the safety zone, the truck will be positioned, facing the traffk, and be between the oncoming trafic and PES employees on the road surface. The road and curb samples will be vacuumed, the truck moved a distance, additional samples collected.
After collecting the sample from one of the two lanes, the truck will return to the last to signs, moving in the normal traffic direction (not against the traffic flow) and change the signs. Then the cones will be moved. When traffic permits, both lanes will be opened. Then one member, with a hand held red flag, will face the oncoming traffic and waves the cars into the second lane. The second person repositions the cones (five) at a gradual angle across the road, while watching the traffic.
The cone and sign recovery will be conducted in the opposite order in which they were set up. After the cones are removed, the truck will be driven in the direction of traffic flow to return to pick up the signs.

Contract No. 68D30001, WA No. 4-01
SAFETY RULES:
1. The yellow strobe safety light will be operational after the first arrival stop at the sample area.
Hard hats and safety vests will be worn.at all times when not in the truck. 2.

Contract No. 68D30001, WA No. 4-01
APPENDIX E
Sampling Data From Paved Roads

Contract No. 68D30001, WA No. 4-01
S A M P L I N G D A T A F R O M P A V E D R O A D S (Sample in .rrord.ncr vixh A P - 4 2 . Appendix C . l . 2 )
R o a d area z i p c o d e
Romd d e s c r i p t i o n :
I .
2 .
3 .
4 .
S .
6 .
7.
8 .
9 .
N u m b e r o f l a n c s L a n e w i d l h P o r t e d traffic s p e e d
Surface t y p e (e.8.. .sphall . oonsre l r ) :
S u r f i c e c o n d i t i o n s ( c . 6 . . r m o a l h . w c a l h c r c d ) :
V e h i c l e t y p e s (e+. cars. #rusks):
E t t i m a l ~ d d a i l y v c h i s l c tr i f f ic l o a d ( i n f o r m a t i o n available at l o c i 1 DOT): 8 . M r a r u r c d or e ~ t i m a t e d ?
D e s c r i p t i o n of n e i g h b o r h o o d (ngricultural . r e s i d e n t i a l . c o m m c r s i a l . i n d u s t r i a l :
A r c there ~ ~ n i i r u c t i o n s i l c ~ w i t h i n 0.S m i l e s . or u n p a v c d r o a d a c c e s s e s other t h a n r e r i d s n t i a l d r i v c w a y i t h a l w o u l d c o n t r i b u t e to silt l o a d i n g ? d i s l n s c f r o m s n m p l c I o c i l i ~ n .
If so. d c r c r i b c t h e s e v c r i l y o f I r a c k - o u I a n d
D c r s r i h c s u r r o u n d i n s m i l 1 y p c (e.#.. l o a m . r s n d . c l a y ... )
W e i t h e r R c l i l c d I n f o r m a l i o n :
a. H a s i t r a i n e d in t h c p a s t 4 8 h o u r s 7 ( Y c r l N o ) b. H a s w i n t e r w e a t h e r t rac t ion material h c s n r p r c a d on I b c r o a d in the p s r 1 3 0 day.
( Y c i l N o ) c . I f r o . w h a t t y p e o f m a t e r i a l (c .6 . . r a n d . 1111. 91.8) d . How h e a v i l y w a s i t r p r c a d ? ( l b d m i l e / l a n c )
10 . W e a t h e r c o n d i t i o n s (over t h e p a i l 2 4 h o u r r ) ( c . d . . s u n n y . w i n d y ) :
I I . R a n d S s m p l t surface d i m e n s i o n s for t h i s s a m p l e
12. C u r b S a m p l e : R o a d c d g o d e s c r i p t i o n ( r . ~ . . c u r b e d . d i l s h ) :
a . W a s a curb s n m p l r m k e n ( Y e d N o ) b . I fro . S . m p l e B.E I d e n t l l l r * l i a n N u m .
S u r f a c e d i m c n r i o n r f o r t h i s s n m p l c . (use I b r o o m IO c o l l ~ e t a n y large d e b r i s a n d v a c y y m are. f r o m c u r b - s i d e w h i l e l i n e to c u r b . I f no c u r b ~ x i s i i . FOI I I~ I t h e s a m p l e from t h e c u r h . r i d c w h i t c l i n e on h a r d p a v e d s h o u l d e r rurfasc 10 t h e b e s i n n i n g o f grass or di tch . )
B A G N o .

Contract No. 68D30001, WANo. 4-01
13. Sample Collection Team:
Sample Collection Team Members (Last names)
Organization Collecting Samples Organimtion Telephone Number

Contract No. 68D30001, WANo. 4-01
APPENDIX F
Laboratory Analytical Procedures

Contract No. 68D30001, WANo. 4-01
ANALYTICAL PROCEDURES FOR
ROAD SILT STUDY
VACUUM FILTER BAG PREPARATION
Prior to their use in the field, filter bags (hereafter, these shall be referred to as “bags”) must be prepared. Received bags are first marked with a unique identification number using a permanent marker. PES has marked each of the bags sequentially, with a letter prefix denoting the bag type. For example, bag number D-001 signifies the first bag of the type used in the Dayton 52041B canister vacuum. After marking, the bags are placed into a desiccator for overnight drying.
While the bags are desiccating, the appropriate number of “Zip Lock” bags are prepared as containers for the vacuum bags. These Zip-Lock bags are the plastic freezer bags with a one-gallon capacity (hereafter, the “Zip Lock” bags will be referred to as “pouches”). Each of the pouches are marked with the same identification scheme as the bags are, so that there is one pouch for each bag.
Afier drying, each bag is placed into its pouch, and the pouch is sealed. From this ~~ . -
point on, each bag and pouch are weighed as a single unit for subsequent analysis. The weight of each badpouch combination is weighed to the nearest 0.1 g using an analytical balance, and the weightrecorded in the logbook.
BAG HANDLING PROCEDURES DURING SAMPLE COLLECTION
During sampling, the bags are kept in the pouches until just prior to use in the canister vacuum. The bag is removed from the pouch, and placed into the canister portion of the vacuum cleaner. The bag is resealed and kept in a safe place during vacuuming operations. After a road silt sample has been collected into the bag, the bag is carefully removed from the canister, and refolded so as not to lose any of the material that has been collected into the bag. The bag is then carefully placed back into its numbered pouch and the baglpouch pair stored in a safe place for transport to the lab for analysis.

~
I JI I 1. 1 I 9 I E
1
I' ? I 1 I 1 I
i
a
ContractNo. 68D30001, WANo. 4-01
ANALYTICAL PROCEDURES
Analysis of the collected road silt sample consists of two parts. These are the analysis to determine the moisture content of the sample and the bag, and the analysis to determine the size fractions of the collected material.
Upon receipt in the lab, the badpouch combination is weighed to the nearest 0.1 g. The bag is removed from its pouch, laid out on a flat surface, and the ends are carefully cut off. Entrained material in each end is removed and transferred into a tare drying pan. The end folds are opened up so as much material as possible is recovered from in between the folds. Material that is still contained in the bag is transferred to the drying pan by gently shaking the bag and letting the material slide into the pan. After the loose material is transferred to the pan, the bag is once again laid on the flat surface, and the bag is cut open along the length of the bag. The bag is then opened up, and the paper is laid out flat. Using a brush, the remaining dust is carefully swept to one edge of the bag, and into the drying pan. When no more loose material remains, the bag is folded up, placed back into its pouch, and reweighed. The bag and the drying pan are each oven-dried at a temparature of aproximately 75 "C for two hours. After the two hour period has elapsed, the drying pan is removed from the oven and immediatly weighed. The bag is allowed to cool for one or two minutes, then place back into its pouch and reweighed. The wet material and dry material weights are then used to calculate the moisture content of the sample according to the following equation.
%M = wf - wf x 100 w,
where:
% M = percent moisture content, by weight Wi = Weight of badpouch combination prior to drying, g Wf = Weight of badpouch combination after drying, g
After the moisture analysis of the sample is conducted, the material in the drying pan is separated according to size using a mechanical sieve to determine the weight fractions of each of the three size ranges, which are:
4 0 mesh particles particles with sizes between 200 and 20 mesh >200 mesh particles

Contract No. 68D30001, WANo. 4-01
Since no further analysis are conducted on the vacuum bag, the bag and its pouch are archived. Any difference in post drying weight and the tare weight of the vacuum cleaner bag is assumed to be due to road silt entrained in the bag.
After all material is transferred into the weighing pan and the weights are recorded, the collected road material is carefUy transferred onto the top stage (the 20-mesh pan) of the mechanical seive separator. Extra care must be taken at this point to guard against loss of material. Any fines that stick to the bottom and walls of the pan are carefully brushed from the pan onto the top stage. The lid is then placed onto the 20-mesh sieve, and the crossbar is secured across the seive stages using the lockdown nuts.
Upon starting the mechanical shaker the shaking speed is set at the lowest possible setting. The unit and the elapsed timer are both started at the same time, and the shaker is allowed to stabilize (Le., the vibrations are fairly steady). M e r the unit stabilizes, which takes about lO,to 20 seconds, the speed is increased to a setting of “five”, as indicated on the front of the shaker. If excessive noise develops, or if the pans can be seen to rotate during the shaking period, the lockdown nuts are re-tightened. After a period of ten minutes, the power to the shaker is cut off and the shaker is allowed to come to a halt. The weight of each pan, and the material that has been collected in each pan is then weighed using an analytical balance, the seive stages are reassembled and the mechanical shaker is started again as before, by starting at a speed of “one” for a few seconds and then adjusting to “five”.
At the end of the second ten-minute shaking period, the pans are again removed and weighed. The change in weight of the silt that has collected in the pan is then calculated according to the following equation:
w - w i x 100 1-1 AW =
w,-I
where:
AW = percent increase in weight from the previous weighing Mi., = Weight of 200-mesh pan and contents WCi = Tare Weight of 200-mesh pan i = current analytical interation i - I = previous analytical interation
Analyses are conducted until the weight change in the material collected in the pan, (e.g., the silt) is less than three percent for two subsequent analyses. For the purposes of this study any increase in weight of the bag after the material has been removed to the pan is assumed to consist of silt. This value added to the weight fraction of silt determined from the sieving analysis.

Contract No. 68D30001, WA No. 4-01
QUALITY ASSURANCE PROCEDURES
Analytical quality assurance procedures consist of ensuring that the balance used for the weighings is properly zeroed and calibrated, and that the drying pans and seive pans and properly tared prior to analysis.
1 Procedures O h
1.
2.
3.
4.
5.
6.
7.
8.
9.
Heat oven to a temperature of 75 'C (1 67 'F).
Record the make, capacity, and smallest division of the balance.
Calibrate and tare the balance according to the balance's instructions.
Weigh the filter badpouch combination and record the mass on the data sheet. (The empty filter badpouch must be weighed prior to sample collection.)
Weigh the drying pan to be used during the moisture analysis, and record the tare weight on the data sheet.
Dissect the bag and transfer contents to the tamed drying pan. (See analytical procedure discussion for detailed bag dissection procedure).
Weigh the drying pan with the sample and record the mass on the data sheet.
Weigh the empty filter badpouch combination and record the mass on the data sheet. Place the filter bag into another drying pan.
Place the drying pan containing the sample and the drying pan containing the filter bag into the oven for 2 hours.
10. Remove b3th drying pans from the oven and allow to cool for several minutes.
11. Weight the drying pan containing the sample and record the mass on the data sheet.
12. Place the filter bag back into its corresponding pouch. Weigh the filter badpouch combination and record the mass on the data sheet.
13. Calculate the moisture content of the sample and silt collected.
I I I I 1 I 1 I I 1 I 1 1 1 I
1 n I
m
Contract No. 68D30001, WA No. 4-01
-ation and . .
1.
2.
3.
4.
5.
6.
7.
8.
9.
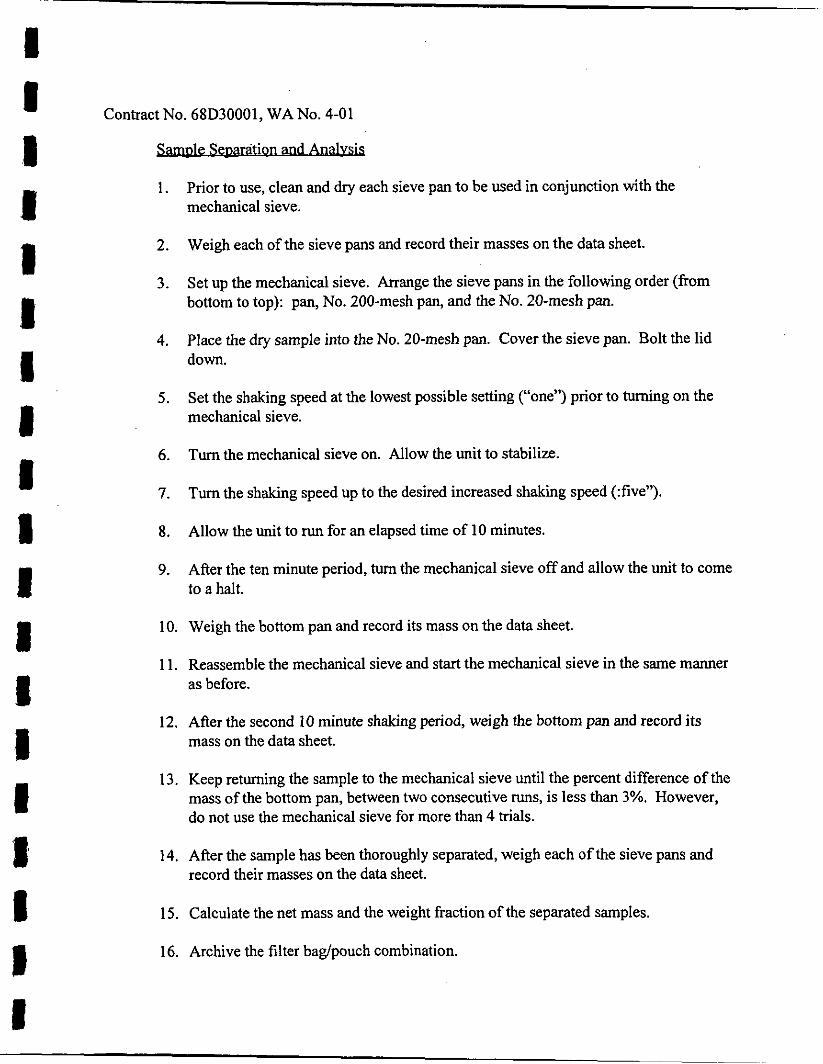
Prior to use, clean and dry each sieve pan to be used in conjunction with the mechanical sieve.
Weigh each of the sieve pans and record their masses on the data sheet.
Set up the mechanical sieve. Arrange the sieve pans in the following order (from bottom to top): pan, No. 200-mesh pan, and the No. 20-mesh pan.
Place the dry sample into the No. 20-mesh pan. Cover the sieve pan. Bolt the lid down.
Set the shaking speed at the lowest possible setting (“one”) prior to turning on the mechanical sieve.
Turn the mechanical sieve on. Allow the unit to stabilize.
Turn the shaking speed up to the desired increased shaking speed (:five”).
Allow the unit to run for an elapsed time of 10 minutes.
After the ten minute period, turn the mechanical sieve off and allow the unit to come to a halt.
10. Weigh the bottom pan and record its mass on the data sheet.
11. Reassemble the mechanical sieve and start the mechanical sieve in the same manner as before.
12. After the second 10 minute shaking period, weigh the bottom pan and record its mass on the data sheet.
13. Keep returning the sample to the mechanical sieve until the percent difference of the mass of the bottom pan, between two consecutive runs, is less than 3%. However, do not use the mechanical sieve for more than 4 trials.
14. After the sample has been thoroughly separated, weigh each of the sieve pans and record their masses on the data sheet.
15. Calculate the net mass and the weight fraction of the separated samples.
16. Archive the filter badpouch combination.

I I 1 I 1 1 I 1 I 1 I 1 1 I I 1 I I I
Contract No. 68D30001, WA No. 4-01
17. Clean all materials in preparation for the next sample.
I I 1 I 1 1 1 I I I I 1 I I I 1 I u I
~
4 Ifneccessaiy
Contract No. 68D30001, WA No. 4-01
I
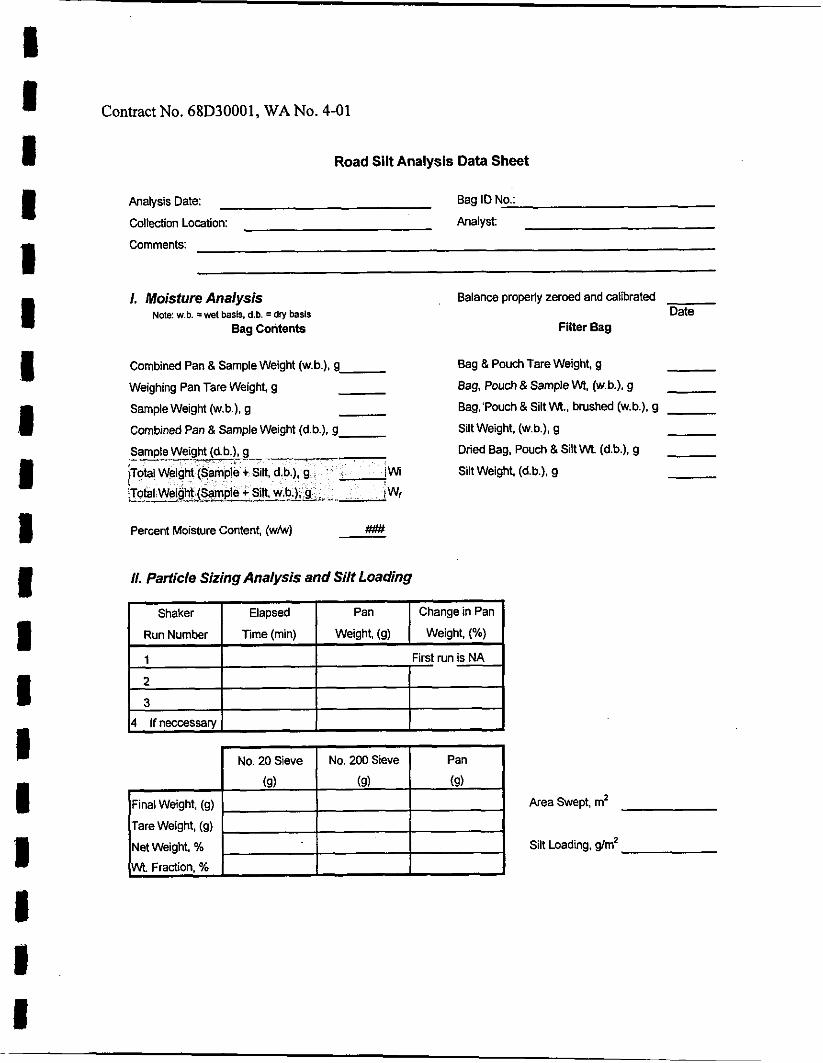
Road Silt Analysis Data Sheet
No. 20 Sieve
(9)
Final Weight, (g)
Tare Weight, (9)
Net Weight, %
WL Fraction, %
Analysis Date: Bag ID No.: Collection Location: Analyst:
Comments:
No. 2M) Sieve Pan
(9) (9)
1. Moisture Analysis ~ 0 1 s : w.b. =wet basis. d.b. = d v basis
Bag Contents
Combined Pan 8 Sample Weight (w.b.), g-
Weighing Pan Tare Weight g - Sample Weight (w.b.). g - Combined Pan 8 Sample Weight (d.b.), g-
Percent Moisture Content, (WM) At## -
Balance properly zeroed and calibrated Date
Filter Bag
Bag 8 Pouch Tare Weight g
Bag, Pwch & Sample Wt, (w.b.). g
Bag.'Pouch 8 Silt W., brushed (w.b.). g
Silt Weight, (w.b.), g
Dried Bag. Pouch &Silt Wt (d.b.). g
Silt Weight (d.b.). g
11. Particle Sizing Analysis and Silt Loading
Shaker Elapsed Change in Pan
First run is NA
L I I I I
Area Swept. m2
Silt Loading, s/m2

Contract No. 68D30001, WA No. 4-01
APPENDIX G
Mobile Road Silt Collection System Test Report

I I 1 I 1 I I I I I I I I I R I 1 I I
~
MEMORANDUM
TO: Mr. Ronald E. Myers, EPA
FROM Mr. Paul Grable, PES
DATE: April 10,1997
SUBJECT: Test Results -- Mobile Silt Collection System for Paved Roads
INTRODUCTION
An engineering study is being conducted to design a truck-mounted (i.e., mobile) silt collection system that will collect silt samples comparable to silt samples collected via the established manual procedure. The mobile system is required to travel at a minimum speed of 3 miles per hour to meet “moving operation caravan” speed requirements, a federal highway guidance procedure that has been adopted by most if not all states. Collecting road silt samples using the moving operation caravan eliminates the need for permits to close traffic lancs and could reduce sample collection costs by as much as 75 percent.
Performance testing to evaluate the feasibility of a mobile silt collection system (i.e., to collect silt samples that are representative of silt samples collected via the manual procedure) is necessary prior to the actual construction of a truck-mounted silt collection system. Two trials have been conducted. The first trial was designed to check the ability of a mobile system to collect known silt loading samples. The second was designed to show equivalence between the manual and mobile collection systems.
The first trial @e., Trial 1) was conducted in the parking lot at the PES office at the intersection of 1-40 and Miami Boulevard in Research Triangle park, North Carolina. Trial 1 was performed to test the ability of a mobile system to collect known silt loading samples. Trial 1 consisted of two experiments. The first involved the distribution of a known sample that represented a heavy dust loading relative to normal street dust loading. The second experiment used a smaller amount of road dust for the known sample. To differentiate the two experiments, the following labels are used in the discussions of Trial 1: “Trial 1 - Parking Lot: High Silt Loading” and “Trial 1 - Parking Lot: Low Silt Loading.”
An area of the parking lot was selected and marked with nylon strings. The strings were set parallel to each other. The area between the strings was manually vacuumed to remove loose material. Then a known sample was distributed on the cleaned area between the parallel strings. The sample area was vacuumed, using a two stage vacuum cleaner, from a moving pickup truck. A PES engineer sat on the truck tailgate and held the vacuum cleaner

I # I I 1 I I I I I I I I I I I I I I
The parking lot surface area was heavily laden with loose materials. The asphalt surface of the parking lot is as rough or rougher than most secondary roads. However, it was not difficult to push the vacuum cleaner nozzle across the surface, and the vacuum cleaner nozzle did not bounce across the parking lot surface as it was pulled behind the truck. The surface was dry, and there was a slight breeze of 2-3 mph. Two large construction areas are to the south and north of the parking lot.
Two bright yellow nylon strings were placed parallel over a distance of 60 feet, 20 inches apart. The paved parkng lot surface between the strings.and on either side of the strings was hand vacuumed to remove loose materials. The material collected was analyzed
Memorandum to Ron Myers Page 2
nozzle in contact with the parking lot surface. The sample area between the strings was vacuumed with one pass. After changing the vacuum cleaner’s bag, the sample area was manually vacuumed to collect any material missed by the mobile collection system. Then a second known sample, much smaller in mass than the first sample, was distributed in the cleaned area. Again the pickup truck was used to collect the sample. PES concluded Trial 1 by analyzing the two samples collected.
The goal of Trial 2 was to show equivalence between the manual and mobile collection systems. The two experiments conducted on the road during Trial 2 involved the retracted or extended vacuum cleaner brush. Trial 2’s labels are “Trial 2 - Road Surface: Brush Retracted” and “Trial 2 - Road Surface: Brush Extended.”
Trial 2 took place on Old Trenton Road near the North Carolina Fair grounds in Raleigh, North Carolina. A one lane section of the road was selected for this trial. Both systems of road silt collection (i.e., manual and mobile) were used in this trial. The methodology was designed to minimize the effect of variations in road silt distributions over the road surface. Trial 2 consisted of two experiments, one on February 19, 1997, and the second on February 25, 1997. The only known major difference between the two experiments was the position of the vacuum cleaner’s nozzle brush. The brush can be retracted into the nozzle, or extended out of the nozzle. During the first experiment the brush was retracted, allowing the metal face of the nozzle to directly contact the road surface. A week later, the same experiment was conducted with the brush extended.
There are five additional sections following this introduction section. The second section discusses the methodology used during the trials. Sampling and analysis, and test results are presented in the third and fourth section. Conclusions and recommended future actions are found in the last two sections. Within these sections are individual discussions related to the four experiments conducted during Trial 1 and Trial 2.
METHODOLOGY
Trial 1 - Parking Lot: High Silt Loading

I I I I I I I I . I 1 I I I I I 1 I I 1
Memorandum to Ron Myers Page 3
for partical size distributions in accordance with the AP-42 procedure. Material that did not pass through a 20 mesh screen was discarded. The remaining sample was recombined and distributed between the parallel strings on the cleaned area in the parking lot (i.e., the test area). T h i s seeded test area could be distinguished visually as being covered with sample material, when compared to the cleaned surface on either side of the parallel strings. The sample distribution appeared uneven in several areas. The test area was then vacuumed from a pickup truck traveling at 4 mph. The test area was then manually vacuumed to collect any of the sample missed by the mobile collection. The results of this experiment are reported in the test results section. The known sample weighed 702.0 grams and was distributed over an area of 8.86 m2, with a calculated average dust loading of 79.3 g/m2. The silt loading was 11.5 g/m2.
Trial 1 - Parking Lot: Low Silt Loading
The identical procedures used in the first experiment were followed during the second experiment. The same sample area was used. The difference between the two experiments was the mass of the known sample. A 5 gram sample was distributed over an area of 5.5 mz, with a calculated average dust loading of 0.9 g/m2. The silt loading was 0.24 g/m2.
Approximately two hours elapsed between the manual vacuuming of the test area at the end of the high silt loading experiment (i.e., the manual vacuuming and recovery of any of the sample missed by the mobile collection) and the distribution of the second known sample. The wind was blowing from of the south at approximately 3-5 mph. The test area was vacuumed, from the pickup truck traveling at 4 mph. No additional manual vacuuming was done. The samples collected during both experiments in the parking lot were taken to the PES lab for analysis. The vacuum cleaner nozzle’s brush was extended during both Trial 1 experiments.
Trial 2 - Road Surface: Brush Retracted Road Trial February 19, 1997
A section of one lane of Old Trenton Road was selected for Trial 2. The section was selected because it was straight and offered approaching automobile drivers a good view of the activity, allowing the work to be performed in a relatively safe environment. Old Trenton Road passes through an agricultural section of North Carolina State property. The sample area was located between two barns with accesses to the road. There were visible mud tracks leading out of the barn access roads, but none in the sample area. During the first experiment, State employees were burning pasture stubble in two fields upwind &om the test area. The wind was blowing at 5-10 mph. The road surface consisted of rough asphalt that looked weathered. The surface was rough enough to prevent a measuring tape from being pulled evenly down the road. The end catch of the measuring tape would snag on large aggregate extending out of the road surface, and would cause the end of the tape to bounce up and down on the lane. PES found it difficult to push the vacuum cleaner nozzle across the road surface

I I 1 1 I I 1 I I I P 1 I I I I fl I I
Memorandum to Ron Myers Page 4
manually. The vacuum cleaner nozzle bounced up and down on the road surface when pulled behind the truck, despite best efforts to maintain constant contact. During manual collection of road dust, the operator could distinctly hear large amounts of loose materials being pulled up from uneven areas in the road surface.
Three separate passes were made over a 228 foot section of the sample lane. During the first pass, a single bright yellow string was stretched 18 inches in the lane from the curb- side white line. The center of the 228 foot long string was marked, designating the position where the manually collecting the sample shifted to the opposite side of the string. Mobile collection took place on the opposite side of the string from the manual sample collection. The string position was then repositioned in the center of the lane, equal distant from the white lines, and sampling was repeated. The third string position was 18 inches from the road center white line. Two clean vacuum cleaner bags were used during Trial 2: one for the manually collected sample, and the other for the truck collected sample. No road surface sample area was vacuumed more than once. The vacuum cleaner nozzle’s brush was kept in the retracted position during this experiment.
Trial 2 - Road Surface: Brush Extended Road Trial February 25,1997
The identical testing procedure and collection methods used during the first experiment of Trial 2 were used during this experiment, except the vacuum cleaner nozzle’s brush was extended. The same identical road area and lane were used. The wind was blowing across the road at about 10 mph. The roughness of the road surface, even with the brush extended, created the same problems with maintaining contact between the vacuum cleaner’s nozzle and the road surface.
SAMPLING AND ANALYSIS
All vacuum cleaner bags used in these experiments were individually tarred, labeled with a unique number, and placed in a sealed plastic freezer bag. The freezer bag was also marked with the same number as the vacuum cleaner bag. Sampling analysis in the PES lab followed the Procedures For Laboratoly Analysis of Surface/Bulk Loading Samples as discussed in Appendix C.2 of AP-42.
TESTRESULTS
Trial 1 - Parking Lot: High Silt Loading
Table A presents the results of the partical size distribution analysis. The column entitled “ Distributed Sample’’ in Table A is the partical size distribution of the sample redistributed over the cleaned parking lot surface. The mobile system was used to recollect the material. It was visually obvious that not all the sample had been successfully recovered. The

I I I 1 I I 1 I I rn I I I I I 1 l I I
Memorandum to Ron Myers Page 5
entire surface between the strings was then vacuumed by hand to collect the remainder of the sample material. The column labeled “Total” in Table A is the sum of materials recovered from two vacuum cleaner bags. The total mass collected using both the mobile and manual road dust collection systems was found to be 4.5 percent larger than the sample that was seeded originally. Figure A shows the close relationship of the partical size distribution collected using both systems.
Table A. Partical Size Distribution: Trial 1 - Parking Lot: High Silt Loading
Figure A. Partical Size Distribution: Trial 1 - Parking Lot: High Silt Loading
Size Oistribution
0 Total 0 Original
The analyzed percent partical distribution as presented in Table B demonstrates that the mobile system is capable of collecting very close to the same percentage of sample partical size distribution as collected using the manual collection system. Figure B graphically shows the comparison capability of the two systems.
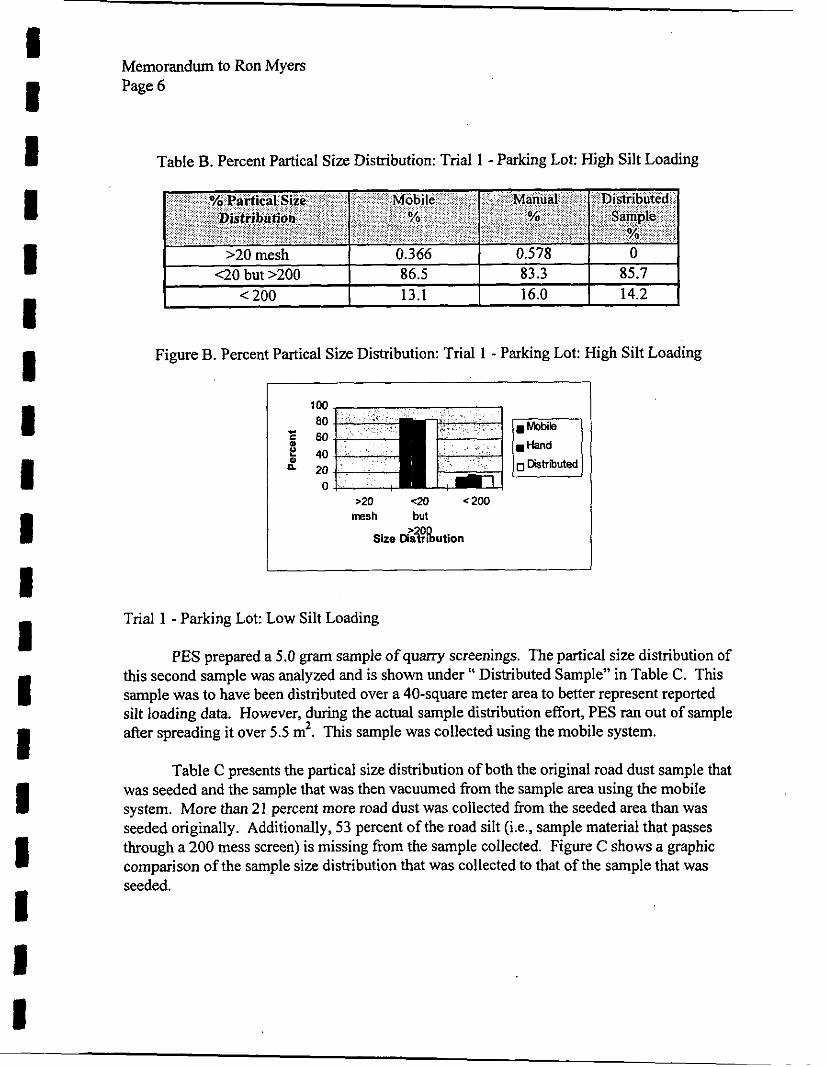
-
I I I I 1 I I 1 I I I I I I I I I I I
- % Partical Size Mobile Manual
Distribution % YQ
Memorandum to Ron Myers Page 6
Distributed Sample
%
Table B. Percent Partical Size Distribution: Trial 1 -Parking Lot: High Silt Loading
>20 mesh 0.366 0.578 0 <20 but >200 86.5
Figure B. Percent Partical Size Distribution: Trial 1 - Parking Lot: High Silt Loading
83.3 85.7
100 80
E 60 $ 40 0 20
0
0
< 200 13.1
Trial 1 - Parking Lot: Low Silt Loading
PES prepared a 5.0 gram sample of quarry screenings. The partical size distribution of this second sample was analyzed and is shown under ‘‘ Distributed Sample” in Table C. This sample was to have been distributed over a 40-square meter area to better represent reported silt loading data. However, during the actual sample distribution effort, PES ran out of sample after spreading it over 5.5 m2. This sample was collected using the mobile system.
Table C presents the partical size distribution of both the original road dust sample that was seeded and the sample that was then vacuumed from the sample area using the mobile system. More than 21 percent more road dust was collected from the seeded area than was seeded originally. Additionally, 53 percent of the road silt (Le., sample material that passes through a 200 mess screen) is missing from the sample collected. Figure C shows a graphic comparison of the sample size distribution that was collected to that of the sample that was seeded.
16.0 I 14.2

Memorandum to Ron Myers Page 7
t
I
Table C . Partical Size Distribution: Trial 1 - Parking Lot: Low Silt Loading
Figure C. Partical Size Distribution: Trial 1 - Parking Lot: Low Silt Loading
7 6
E 4 ! 2 3 8 Original
z 5
! 2 S I
0 0 5 " E N O s
V
Size Distribution
Table D shows the percent partical size distribution. The distributed sample was designed to reflect percentages of road dust that have been recently reported to the EPA. There is a 10 percent increase in mass that passed through the 20 mess screen but not the 200 mess screen. Figure D graphically shows the loss of the road silt component of the seeded sample.
Table D. Percent Partical Size Distribution: Trial 1 - Parking Lot: Low Silt Loading
I I I

Memorandum to Ron Myers I Page 8 I
I 1 I I I I I I I I I I I I I I I
Figure D. Percent Partical Size Distribution: Trial 1 - Parking Lot: Low Silt Loading
>20 QO c 200
>zoo Size Distribution
m s h but
Trial 2 - Road Surface: Brush Retracted Road trial February 19,1997
Trial 2 was designed to compare the performance of the manual and mobile road silt collection systems under actual road conditions. Safety considerations for personnel required the use of a straight section of road, highly visible to drivers as they approached from either direction. The road surface in the sample area was badly weathered, and consisted of asphalt made with large aggregate. Agricultural activities were taking place on both sides of the road, including the burning of pasture stubble, and tractor traffic to barns and stock yards at either end of the sample area.
During sample collection, PES found that the rough road surface created more friction between the vacuum cleaner nozzle and the asphalt road surface than the friction experienced in the parking lot. During sample collection using the truck, the road surface was rough enough to make nozzle to road surface contact difficult to maintain.
Table E shows that the manual collection system with the nozzle brush retracted, collected 5 times the sample mass collected using the mobile collection system. Table E presents the partical size distribution of the samples collected. Figure E shows the partical size distribution graphically.

I I I 1 I I I I I I I I I 'I I I I I I
< 200 mesh
Memorandum to Ron Myers Page 9
7.43
Table E. Partical Size Distribution: Trial 2 - Road Surface: Brush Retracted
-=20 but >200 23.7 85.6 < 200 mesh 3.4 13.4
Total 45.7 231.3
Figure E. Partical Size Distribution: Trial 2 - Road Surface: Brush Retracted
I
>20 QO c 200 m s h but
>200
I Sire Distribution
Table F reflects percent partical size distribution of the two samples. The percent partical size distribution presented in Table F indicates that the mobile collection system was more successful in capturing larger sized road dust. Table E shows that the larger sized materials (i.e., material not passing through a 20 mess screen) represents a majority of the mass collected with the manual collection system. It should not be inferred, when viewing the percent partical size distribution of the mobile collection system, that the mobile collection system is more efficient at collecting smaller sized particles. Figure F graphically shows that a relationship between the two collecting systems does not exist.
Table F. Percent Partical Size Distribution: Trial 2 - Road Surface: Brush Retracted

I Memorandum to Ron Myers Page 10
Figure F. Percent Partical Size Distribution: Trial 2 - Road Surface: Brush Retracted I I I I I I I I I I I I I I I I I I
I
0 >20 QO c 200 msh but
>zoo Size Distribution
lo t
Trial 2 - Road Surface: Brush Extended Road trial February 25, 1997
The results from the road test conducted on February 19, 1997, indicated a performance problem existed for the mobile system under certain road conditions. During Trial 2, the vacuum cleaner nozzle’s brush was retracted. The experiment with the brush extended was performed to find out if the use of the vacuum cleaner nozzle brush would improve the performance of the mobile system. To minimize changing testing variables, the test was conducted over the same area, using identical sampling procedures. Even with the brush extended, there was more friction than was that experienced during the parking lot tests.
Table G presents the partical size distributions of the samples collected with the nozzle brush extended. Again, the manual collection system captured roughly 500 percent more mass than the mobile collection system, and that the majority of the mass collected using the manual collection system consisted of material that could not be passed through a 20 mess screen (i.e., greater than 75 microns in diameter). These facts mimic the results of the road manual sample collection with the nozzle brush retracted. Figure G graphically represent Table G.
Table G. Partical Size Distribution: Trial 2 - Road Surface: Brush Extended
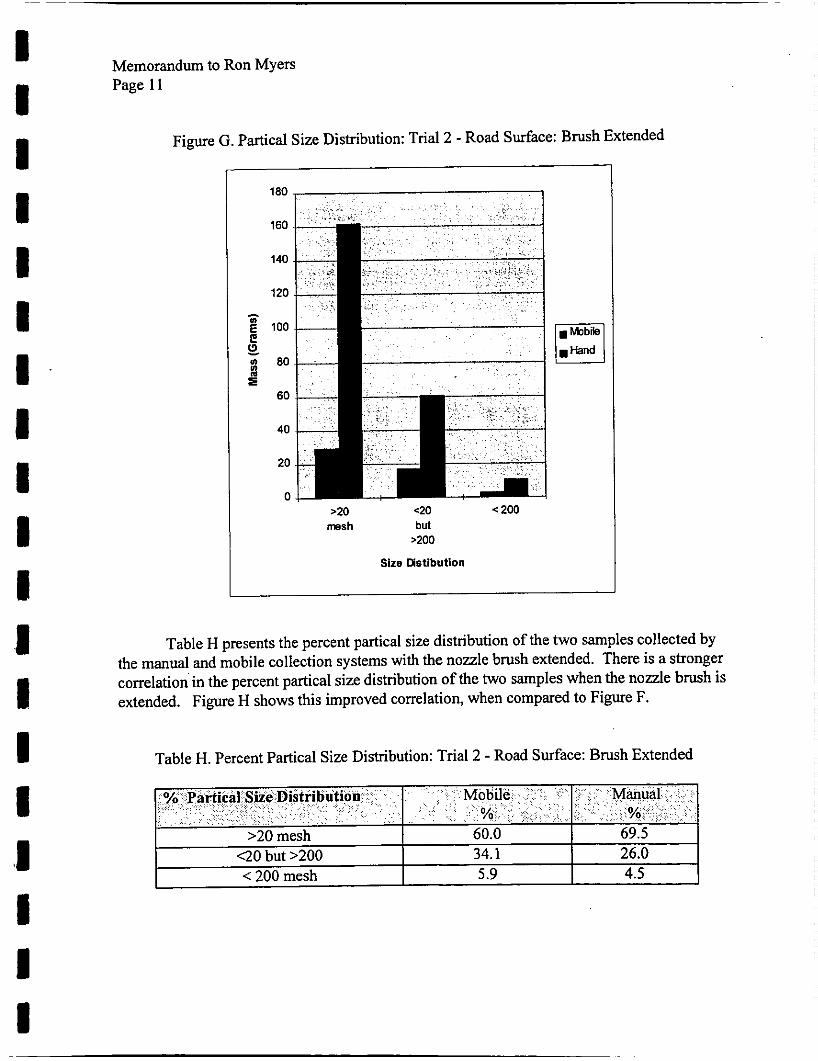
I I
Memorandum to Ron Myers Page 11
Figure G. Partical Size Distribution: Trial 2 - Road Surface: Brush Extended I I I I I I I I I 1 i I I ‘I I I I
. bbbi’a (.WndI
>20 <20 < 200 msh but
>zoo Size astibution
Table H presents the percent partical size distribution of the two samples collected by the manual and mobile collection systems with the nozzle brush extended. There is a stronger correlation in the percent partical size distribution of the two samples when the nozzle brush is extended. Figure H shows this improved correlation, when compared to Figure F.
Table H. Percent Partical Size Distribution: Trial 2 - Road Surface: Brush Extended

~
I I I I I I I I I I I (I I I I
I I I I I
Memorandum to Ron Myers Page 12
Figure H. Percent ,Partical Size Distribution: Trial 2 - Road Surface: Brush Extended
70
60
50
& 40
$ 30 n
20
?! al
10
0
. hbble
>20 QO < 200 msh but
>2w
Size Distribution
CONCLUSIONS
Trial 1 - Parking Lot: High Silt Loading
There exists an upper limit ofroad silt density at which the mobile system will be unable to collect 100 percent of the sample.
The percent partical size distribution for both samples were very close, as shown in Figure B.
Trial 1 - Parking Lot: Low Silt Loading
The mobile system captured more sample material than was seeded.
The mobile system failed to collect all of the road silt sample seeded.
The reasons for these results are not known. However, the additional material may have been deposited from two adjacent construction sites during the hvo hours that lapsed between the parking lot surface cleaning and the time when the small sample was seeded. The

I I I I I I l I I I I'
I I 1
t I I
I I I I I
Memorandum to Ron Myers Page 13
mobile system's failure to recover all of the road silt seeded might be that part of the road silt was blown away from the trial area during the seeding process.
Trial 2 - Road Surface: Brush Retracted
Surface roughness reduces the ability of a mobile collection system to collect accurate samples.
This trial exceeded that limit.
No comparable samples were collected.
The manual system collected a sample almost 5 times larger than the mobile system.
Trial 2 - Road Surface: Brush Extended
The same sampling problem (is., surface roughness) existed with the brush extended as was discovered after Trial 2 with the brush retracted.
The manual system collected a sample almost 5 times larger than the mobile system.
The percent partical size distribution for the experiment with the brush extended shows a stronger correlation between samples than the percent partical size distribution for the experiment with the brush retracted.
The rough road surface with its weathered crevices and large asphalt aggregate limited the amount of material the mobile system could capture. Particulate matter in the deep cracks was exposed to the mobile system only 25 percent as long as particulate was exposed to the manual system. Over-the-ground-speed of the nozzle from the truck was slightly faster than 4 mph. Ground speed of the nozzle during manual sample collection was less than 1 mph. The asphalt aggregate sticking up on the road surface made it difficult to maintain contact between the vacuum nozzle and the road when using the mobile system.
Table I presents the silt loading calculated for Trial 1 and Trial 2 experiments. These silt loading values are in the range of the silt loading values reported in AP-42 , Table 13.2.1- 3. Nonindustrial Paved Road Sampling Data.

I 'I' I I I I 'I I I I I'
1 I I
I I I
t I I I I
Trial I - Parking Lot: Low Silt Loading Distributed Sample
Mobile Samole
Memorandum to Ron Myers Page 14
0.236 0.109
I Sample Silt Loading Table I I 1
I I . . I Trial 2 -Road Surface: Brusn Ketractea I
Mohile Samnle 1 n.nhi ~ . .~
0.241 I I
Trial 2 - Road Surface: Brush Extended I Mobile Sample 1 0.052 Manual Sample I 0.188
RECOMMENDED FUTURE ACTIONS
PES recommends that the long term advantages of a mobile road silt collection system warrants continued testing. The additional tests should be conducted on road surfaces more closely associated with normal silt loading. The testing methodology used in Trial 2 appears adequate to ensure sampling equality between the mobile and manual collecting systems. Additional trials will be necessary on road surfaces that may require a permit to reroute traffic. Silt loading numbers recently provided to EPA are approximately IS percent of the silt load collected during Trial 1 Parkng Lot - Small Sample. PES believes additional trials should be made on roads with higher traffic loading to provide lighter silt loading samples.
If the recommended trial results are not satisfactory (Le., if mobile and manual trial results can not be shown to be nearly equal) then PES recommends that the nozzle design include the use of compressed air to aid in the collection of particles, using the general design guidance from Improved Street Sweepersfor Controlling Inhalable Particulate Matter, EPA-600/7-84-02, February 1984. Failing these steps, PES recommends discontinuing developmental work on producing a mobile collection system, and use the remaining assets to collect and analyze manually collected samples.
PDG/pdg p:\i40 l\memo\test-S .doc
cc: Robert Y. Purcell, PES Project Manager

I I I I I I I I I I I I I I I I 1 I
APPENDIX H
Road and Curb Silt Regression Analysis and
Sample Data Spreadsheets
I

~~
I I
I I
I I
I i
I I I I I
Y v- (v 0 0 0 0 0 ~ ~ + 0 0 u) 0 0 n
0) t U m 0 J
.- '0 a 0
m
m C .I
3

I I I I 1 I r I 1 I I I I I I I I I I
P tj
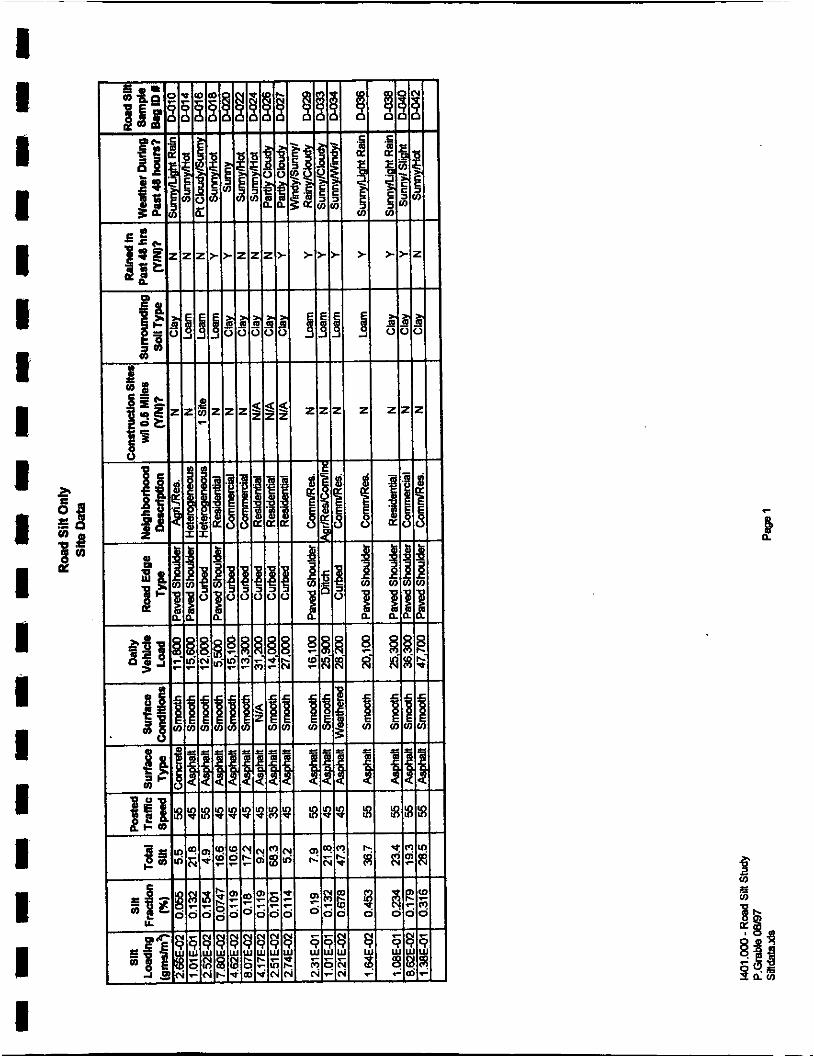
I
I I

I 0
I I 1
I
I I

I I I I I 1 I I 1 1 I I I I I I I 1 I
APPENDIX I
Sample Collection Sheets From the Excelm Work Book

Data collection sheet
SAMPLlNG DATA FROM PAVED ROADS (Sample in scmrdancc with AP4Z Appendix C.l.2)
Data Sample Collated 7/16/97 Sampk Bag IdeatilicaHon Number D-010
Sampling Location (e.g.. Maple bawm 3rd and 4th Strta)
501 North 1.5 miles north of BahamaRoad
4 Lane width P o d M I C specd S5 mph 1. Number of lanes
2. Surface type (e.&. asphalc concrete):
3. Surface conditions (e.&, smooth, weathered):
4. Vehicle types (e.g.. cars, trucks):
mncretc
smooth
all
5. Estimated daily vehicle traffic load (information available at local DOT): 11,800 a Measured or estimated?
6. Description of neighborhood (agriculhual, residential, commercial, industrial:
7. Are that mnsrmction sites within 0.5 miles, or unpaved road ac~csscs other than residential driveways that would contribute to silt loading? If so. describe the severity of track-oul and distance from sample location.
agriculturaVrcsidcntial
No
8. Dewn’be surrounding soil type (e&, loam, sand, clay ... ) Clay
9. Weather Related Information:
a Has it rained in the pan 48 hours? b. Has winter weather traction material been spread on the road in the past 30 days
( Y d o ) Yes. light rain
( Y d o ) No c. If so, what type of material (e.g., sand, Salt, slag) d. How heavily was it spread? (Ibslmilwlanc)
IO. Weather conditions (over the past 24 hours)(e.d., sunny. windy): sunny with light rain
Page 1

Data collection sheet
11. Road Sample surface dimensions for this Sample
Note: The wmputcr will calculate the m a Report 5'4' as 5.5 R
TotalAna 206.56 mz
paved shouldm 12. Curb Sample: Road edge description (e.&. curbd. ditch):
a Was a curb m p l c t&cn ( Y W N O ) b. If so, Sample Bag Identification Num. BAGNO. D-011
surface dimensions for this sample. (Use a bmom to collect any large deb+ and vacuum area from &side white line to curb. If no curb exists, collect the m p l c from the curb-side white line on hard paved shoulder surf- to the beginning of grars or ditch.)
Note: The wmputcr will calculate the area Report 5'4" BS 5.5 fl
TotalArea 81.29 m'
13. Sample Collection Team:
Ohbayashi Sample Collection Team Membcn Grable (Last names) Mullen
Organization Collecting Samplc~ PES Organization Telephone Number (919) 941-0333
Page 2

Road Silt Analysis Data Sheet
I Analysis Date: 8/11/97 Bag ID No.: W l O , Collection Location: 501 North Analyst Frederici
Comments:
Balance pmperly zeroed and calibrated: 8/11/97 Date
1 1. Moisture Analysis Nods: W.b. mwstL!ash, d.b. -dly bash
Bag Contents Filter Bag I
393.1 Bag 8 Pouch Tare Weight g 70.5 294.0 . Bag, Pouch 8 Sample WC. (w.b.). g 173.8 99.1 Bag. Pouch 8 Silt WL, brushed {w.b.). g 75.2
Pan 8 Sample Weight (w.b.), g
Weighing Pan Tam Weight g
Sample Weight (w.b.). g
Pan 8 Sample Weight (d.b.). 9
I
392.9 Silt Weight (w.b.1. 9 4.7
Sill Weight (d.b.). g 2
I I 1
Dried Bag. Pouch 8 Silt Wt (d.b.). g 72.5
WI
Wf
%M= wl -wf +100 w, Percent Moisture Content %M= 2.79%
11. Particle Sizing Analysis and Silt Loading I
No. 20 Sieve No. 200 Sieve Pan
I I
Final Weight (g) 386.3 396 503.1 Tare Weight (9) 382 305 499.6
90.19% 3.47% Netweight (g) 4.3 91 3.5 , WtF1XUon.9b 4.26%
SAMPLE MASS COMPAFiiSlON
1 ~ r y sample weight 1m.9 sked sample weight 100.8
0.1 M a x allowable IimR is 2% difference. or for this 'particular sample:
- Net Difference I I 2.018 gms
AW
Total S i t (9) = Filter Silt + Pan Silt Total Silt (g) = 5.5
Area swept, m2 206.56
Silt Loading, g/mz 2.66E-02
Silt Fraction, % 0.055688
COMPUTER DATA SHEET

I I 1 I I I I 1 I I I 1. I I I 1 I 1 I
NO. 20 Sieve No. 200 Sieve
(9) (9) 426.3
305
121.3
60.22%
Final Weight. (e) 400.3
302 Tare Weight. (9)
Netweight, (e) 18.3
Curb Silt Analysis Data Sheet
8 1.29 Area Swept, m2
Silt Loading, g/m* 1.59E-01
0.096125 Sill Fraction. %
pan
(9) 510.6
499.6
11
7.26%
Bag ID No.: Do1 1 Analysis Date: 8/11/97 Collection Location: 501 North
Commenb: curb sample
Analyst Frederid
8/11/97 Baianm properly zeroed and calibrated: - 1. Moisture Analysis Dale Noba:r.b.-wa(baS&d.b.-dV~ Fllter Bag
Bag Contents
wt Fraction. %
Combined Pan 8 Sample Weight (w. ' 443.8 Weighing Pan Tare Weight. g 294.3 Sample Weight (w.b.). g 149.5
Combined Pan 8 Sample Weight (d. 443.6
12.10%
71
225.2
15.5
4.5
72.9
1.9
- - - - - - % 1.82% Percent Moisture Content
11. Partlcle Sizlng Analpis and Sllt Loading
SAMPLE MASS COMPARlSiON
Dry sample weight 151.2 152.5 sired sample weight -1.3 - Net Difference M= allowable limit is 2% difference,
or for this particular sample: 3.024 gms.
COMPUTER DATA SHEET

I I I I I I I 1 I I I # I I I I I I I
Data collection sheet
SAMPJJNG DATA FROM PAVED ROADS (Sample in accordance with AP-42. Appendw C.1.2)
Data Sample Collcctcd urn7 Sample Bag Identification Number Do36
. -
(e.&, Maple bmvan 3rd and 4th S h e )
HV 64 Betwan 1435 8 Apex H.S.
Road area zip eode
1. Numbcroflane~ 4 Lane width Posted Jpccd 55
2. Surf= type (e+, asphalt, concrete): asput
smooth
all
3. Surface conditions (e.&, smooth, weathcmd):
4. Vehicle types (e.&, car$ bucks):
5. EEtimated daily vehicle MIC load (information available at local DOT): 20.100 a Meanrrcd or &alcd?
6. Description of neighborhood (agricultural, residential, commercial, industrial:
7. An thm construction sites within 0.5 miles, or unpaved mad acccsscs other than residential driveways that would contribute to silt loading? If so, describe the severity of track-out and distance from sample location.
midmtial, wmmmial
No
8. Describe surrounding soil type (e.g.. lorn, sand, clay ...) loam
9. Weather Related Information:
a Has it rained in the past 48 hours? (Yer/No) b. Has winta weather traction material I%m spmd on the road in the past 30 days
Yes
(YcsNo) No E. If so. wh& typc of material (e.& sand. salt, sing) d. How heavily was it sprtad? (Ibdmildane)
10. Weather conditions (over the past 24 hours)(e.d., sunny, windy): light rain. sunny
Page 1

I I I I I I I 1 1 I I I I I I I I I I
Data collection sheet
11. Road Sample surface dimensions for this m p l C
TotalArea 223.37 m'
shouldra (r.1). ditch (r.1) 12. Curb Sample: Road edge description (e.&. curbcd. ditch):
b. If so. Sample Bag Identifiutlon Num. a Was a curb Sample talrcn (YCao) Yes BAGNO. D-037
Surface dimensions for this sample. (VSC 8 broom to follecl any large debris and vacuum ana from curb-sidc white line to curb. If no curb exists collecl the sample from the curt-sidc white line on bard paved shoulder mrfm to the beginning Of grass or ditch.)
__
TotalArca 128.26 m'
13. Sample Collation Team:
Sample Collietion Team Members Mullen Okabayashi (La names) Gatewood
Organization Collecting Samples PES Organization Telephone Number (919) 941-0333
Page 2

Road Silt Analysis Data Sheet
Bag ID No.: Do38 I AnalysisDate: a12197
Collection Location:
Comments:
Hwya Analyst Frederid
Between 1435 &Apex High School I
I 811 2197 Balance properly zeroed and calibrated: - 1 1. MolstureAnalysis Date
Nots:w.b.=wetbasb,d.b.=dr/WiS Fllter Bag Bag Contents
Bag & Pouch Tare Weight g 92.8
109.7
Bag, Pouch 8 Silt Wt. brushed (w.b.). 9 107 1 Sample Weight (w.b.). 9 Silt Weight. (w.b.). g 14.4
oried Bag, Pouch 8 Silt W (d.b.). 9 105.3 I Silt Weight. (d.b.), g 12.7
303.2 Pan & Sample Weight (w.b.). 9
Weighing Pan Tare Weight. g 222.7 Bag, Pouch 8 Sample Wt. (w.b.). 9
80.5
302.9 Pan & Sample Weight (d.b.). 9
Wi -Wf * i o0 Wi
%M= Percent Molslure Content, %M= 2.11% I
No. 20 Sieve
(9)
Final Weight (9) 394.2 Tare Weight. (9) 381.8 Net Weight (Q) 124 Wt Fraction, % 13.35%
/I. Partlcle Sizing Analysis and Silt Loading I ,
No. 200 Sieve Pan
(9) (9) , 349.1 523.7
304.8 499.7
44.5 24
47.90% 25.83% L
I ' I I I I I
0.00%
SAMPLE MASS COMPARISION
Dly sample weight 92.9 sied sample weight 93.6
-0.7 Max allowable limit is 2% difference. or for this parlicuiar sample:
- Net Difference
1 I 1.858 gms.
AW= w,,,
Total Silt (9) = Filter Silt + Pan Silt
Total Silt (9) = 36.7
Area swept mz 223.37
Silt Loading, g h 2 1.64E-01
Silt Fraction. % 0.453648
COMPUTER DATA SHEET

curb Siit Analysis Data Sheet I I Analysis Date: 8/12/97 Bag ID No.: m 7 , Collection Locatin: H w y 6 4 Analyst
1 1. Moisture Analysis Date
Comments: Between 1435 B Apex High School
Note: Shoulder - fight landditch - right Ism
Balance properly zeroed and calibratd 8/12/97 NOW w.b. m w a t bsrb. d b. - dry basla
Filter Bag Bag Contents
- Final Weight. (9)
Tare Weight. (9)
Net Weight, (g)
W. Fraction. % ~
I I I t I I I I I I I I I I I
(9) . (e) 602.5 645.4
304.7 499.9
497.6 145.5
651.5
382.1
. 269.4 26.73% 53.09% 15.52%.
Bag 8 Pouch Tare Weight g
Bag, Pouch 8 SampleW (w.b.), g
92.1
1034.7
i l9.1
Combined Pan 8 Sample Weight (W. 1137.6
Weighing Pan Tare Weight. g 222.6 Sample Weight (w.b.). g 915.2 Bag, Pouch 8 Silt Wt.. brushed (w.b.), g
SiHWelght, (w.b.). g 27
Siltweight, (d.b.1, g 25.5
Combined Pan 8 Sample Weight (d. 1134.7
912.1 Dried Bag. Pouch 8 SiRWt. (d.b.). g 117.6
WI
wi-wf *IO0 w, %M = Percent Moisture Content % 0.49%
~
11. Particle Sizlng Analysis and Silt Loading
NO. 20 Sieve !NO. ZOO Sieve Pan I
SAMPLE MASS COMPARISION
Drj sample weight 937.6 sized sample weight 938.2
-0.6 Max allowable limit is 2% difference. or for this Darticular sample:
- Net Difference
10.752 gms.
~ o t a l Silt. (g) = Filter Silt + Pan Silt
Total Silt, (g) = 171
Area Swept, m2 128.26
Silt Loading, g/m2 1.33E+00
Silt Fraction, % 0.255682
COMPUTER DATA SHEET

I I I I I I I I 1 I I I I I I I I I I
Data collection sheet
SAMPLING DATA FROM PAVED ROADS (Sample in accordance with AF’42. Appendix C.1.2)
Data Sample Collected 8/8/97
Sampling Location
and 4th S M ) N e w River (cg., Maple bawm 3rd us 64 past
Sample Bag Identifleation Number D-042
Road ~ l t a zip code
4 h e width Posted M I C spccd 55 1. Numbex of lanes
2. surface type (e.g., asphalt, c o n e ) : asphalt
3. Sur$cc conditions (e.g., smooth, weathwrd): smooth
all 4. Vehicle types (e.& cars, trucks):
47.700 5. Estimatcd daily vehicle MIC load (information available at local DOT): a Measured or estimated?
6. Dwription of neighborhood (agricultural. ksidential, commercial, industrial: nsidentidcommucial
7. Are there construction sites within 0.5 miles, or unpaved mad B C ~ C S S ~ S other than residential driveways that would contribute to silt loading? If so, describe the severity of track-out and distance from sample location.
No
8. Describe surrounding soil type (e&. loam. sand, clay ...I clay
9. Weather Related Information:
a Has it rained in the past 48 hours? (YcdNo) b. Has winter weather traction material been spnad on the road in the PSI 30 days
No
(Yes/No) No c. If so, what type of material (e.& m d salt, slag) d. How heavily was it spread? (Ibslmildane)
IO. Weatherconditions (over the part 24 houn)(e.d.. sunny, windy):
Page I
hot, sunny

~
I I I I 1 I I I I I I I I I I I I I I
\
Data collection sheet
11. Road Sample surface dimensions for this Sample
~ o t a l ~ r c a 206.03 m'
12. Curb Sample: Road edge description (e.g.. curbed, ditch): shoulder (rfl), ditch (I)
b. If so, Sample Bag Identiflca(l0n Num. Yes a was a curb sample taken ( Y d d BAGNo. D-043
Surface dimensions for this sample. (Use a broom to collect my large debris and vacuum area from curb-Side white line to curb. If no curb exist$ COllCa the SamplC from the curb-side white line on hard paved shoulder surface to the beginning of grass or ditch.)
Nols: 'Ihc cnmputcr WI c
Total- 65.13 m'
13. Sample Collection Team:
Sample Collection Team Memben Mullen (Last names) Okabayashi
mmiza t ion Collecting Samples Organization Telephone Number (91% 941-0333
PES
Page 2

I
Run Number
1 5
2 5
3
4
Road Sllt Analysis Data Sheet
I AnalysisDate: 8112197 Bag ID No.: Do42
I Collection Location: us 64 Analyst Frederia
Commenb: Past Neuse River
8112197 - 1 1. MoIsfureAnalys1.s Balance pmpefiy zemed and calibrated:
l ime (min) &Sill Weight Tare Weight
10 520.4 499.6
10 520.7 499.6
499.6
499.6
I I I I I I I I I I I I I I I
No, 20 Sieve No. 200 Sieve
(9) (9)
Final Weight (9) 395.8 360.1
Tare Weight (9) 382.3 304.7
Netweight, (g) 13.5 55.4
Wt Fraction. % 13.90% 57.05%
Noia:w.b.=wetbarlhd.b.*dnba~ Bag Contents
Pan
(a) 520.7
409.6
21.1
21.734
uate Fllter Bag
312.8 Bag 8 Pouch Tare Weight g 91.1
222.7 Bag. pouch 8 Sample 1M. (w.b.1. 191
312.4 Silt Weight, (w.b.). 9 9.2
Dried Bag. Pouch & Silt Wt (d.b.1. g SiitWeight (d.b.). g 7.4
Pan &Sample Weight (w.b.). g
Weighing Pan Tare Weight 9
Pan 8 Sample Weight (d.b.1, g
Bag. Pouch &Sill Wt. brushed (w.b.). 9 100.3 Sample Weight (w.b.). g 90.1
98.5
WI
Wr
%M= WI -Wf *,oo w, Percent Molshrm Content %M= 2.22%
. 11. Particle Sizing Analysis and Silt Loading
I Shaker I Elapsed I Collectionpan Pan Change in Silt 4 Weight (%) I 20.8 ZERO%
1.42%
0.00%
SAMPLE MASS COMPARISION
ory sample weight 97.1
6.3 Sized sample weight 97.4
Max allowable limit is 2% difference. or for Mis parb'cular sample:
- Net Difference
1.942 gms.
p:U40lUABUJATASHTS.XLS 7/29/87
Total Silt (g) = Filter Silt + Pan Silt
Total Silt (g) = 28.5
Area swept m2 206.03
Silt Loading. g/mz 1.38E-01
Silt Fraction, % 0.316667
COMPUTER DATA SHEET

I I I I I I I I I I I I I I I I I I I
Final Weight, (0)
Tare Weight. (g)
Net Weight (g)
Wt. Fraction. %
Curb Silt Analysis Data Sheet
No. 20 Sieve No. 200 Sieve Pan
(9) (9) (9)
382.3 304.7 499.7
538.5 459.3 567
158.2 154.6 67.3
39.60% 39.20% 17.06%
Analysis Date 8/12/97 Bag ID No.: a043 Calleotion Location: us 64 Analyst Frederid
Comments: Past Neuse River
Note: Should (rA); Ditch (I)
1. Moisture Analysls Nols:w.b.nuslbarh,d.b.=dWM
Bag Contents
Combined Pan 8 Sample WeigM (w.
Weighing Pan Tare Weight. g
600.3
222.5 Sample Weight (ab.), g 377.8
Combined Pan 8 Sample Weight (d. 599.4
Percent Moisture Content K 1.05%
Balance properly zeroed and calibrated: 8/12197 Data
Filter Bag
Bag 8 Pouch Tare Weight. g
Bag. Pouch 8 Sample Wt, (w.b.), g
Silt Weight, (w.b.). 9 20.8
90.8
490.3
111.6 Bag. Pouch 8 Silt Wt., brushed (w.b.). 9
Dried Bag. Pouch 8 Silt Wt (d.b.1. g 108.3 Sir Weight (d.b.). g 17.5
11. Particle Sizing Analysis and Silt Loading _B
AW= %-I,
Total Silt, (g) = Filter Silt + Pen Sir
Total Siit, (9) = 84.0
SAMPLE MASS COMPARISION
Dly sample weight 394.4 sued sample weight 395.6
-1.2 Max allowable limit is 2% difference. or for this particular sample:
- Net Difference
7.880 gms.
Area s w p t m2 65.13
Silt Loading, g/m2 1.30EMO
Silt Fraction. % 0.354219
COMPUTER DATA SHEEl

I I I I I I I I I I I I I I I I I I I
Data collection sheet
SAMPLING DATA FROM PAVED ROADS (Sample in accordance with AP42 Appendix C.1.2)
Data Sample Collated 1/18/91 Sample Bag Identification Number D-012
Sampling Location (e& Maple between 3rd and 4th S m )
Alexander b a n Miami Blvd and Page Rd
~~
Road area zip code
1. Number of lanes 4 Lane width 1 1' + 10" posted traffic speed
2. Sutface type (eg.. asphalt. concrcte): concrete
3. Surface conditions (e.&, smwth, weathd) :
4. Vehicle types (e.g., cars, trucks):
5. Estimated daily vehicle traffic load (information available at local DOT):
smooth
all
16.2 a Measured or estimated?
6. Description of neighborhood (agricultural, residential, eonuncrei& industrial: commcrCial
7. Are there conshuction sites within 0.5 miles, or unpaved road ~ccesscs other than residential driveways that would contribute to silt loading? If so, describe the severity of tnck-out and distance ihm sample location.
No
8. Describe surrounding soil type (e.&. loam, sand, clay ... )
9. Weather Related Information:
a Has it rained in the past 48 hours? (YesMo) b. Has winter weather Waftion material been spread on the road in the past 30 days
c. If so. what type of material (c.g., sand, salt. slag) d. How heavily was it s p d ? (Ibdmildane)
Yes
(YesMo) No
LO. Weather conditions (over the past 24 hours)(e.d., sunny. windy):
Page 1

-
I I I I I I I I I I I I I I I I I I I
Data collection sheet
11. Road Sample surface dimensions for this sample
Note: The computer WI
TotalAren 220.59 ma
paved shoulder (1). curbed (I) 12. Curb Sample: Road edge description (c.g., curbed, ditch):
a Was a curb sample taken W d o ) b. If so, Sample Bag ldentiflcatlon Num. BAGNo. D-013
Surface dimensions for this sample (Use a bmom 10 collcct any l a c debris and vacuum ma from &side whitc line to curb. If no curb exist$ collcct the sample from the curb-sidc whitc line on hard paved shoulder nuface to the beginning of g a s or ditch.)
Tocal Ana 21.27 m’
13. Sample Collection Team:
Okabnyashi Sample Collection Team Members Grable (Last names) Mullen
Organization Collecting Samples PES Organization Telephone Number (919) 9416333
Page 2

I I I I I I I I II I I I I I I I I I I
No. 20 Sieve No. 200 Sieve
(9) (9)
Final Weight, (9) 434.3 338.8
Tare Weight, (9) 382.4 304.6
Net Weight (9) 51.9 34.2 Wt Fraction, % 51.39% 33.86%
Road Silt Analysis Data Sheet
Pan
(9) 508.1
499.7
8.4
8.32%
h l y s i s Date: @All97 Bag ID No.: 0-012
Collection Location: Alexander between Miami 8 Page Analyst Frederia
Comments:
1. Moisture Analysls Note: w.b. = wet bssls. d.b. =dry basis
Bag Contents
Balance properly zeraed and calibrated: 8/11197 Date
Fllter Bag
391.5 Bag 8 Pouch Tare Weight g 70.5
294.4 Bag, Pouch 8 Sample Wt (w.b.), g 173.9 Pan 8 Sample Weight (w.b.). g
Weighing Pan Tare Weight, g
Sample Weight (w.b.). g
Pan 8 Sample Weight (d.b.), g
97.1 Bag, Pouch 8 SiRWt. brushed (w.b.),g 77.4
391.3 Silt Weight (w.b.1.g 6.9
Dried Bag. Pouch 8 Silt Wt (d.b.1. g 74.8 Silt Weight (d.b.). g 4.1
Wf
%M= wi -Wf *,OO w, Percent Moisture Content, %M= 2.88%
r
11. Particle Sizing Analysis and Silt Loading
I Shaker I Elapsed I CollectionPan Pan Change in Silt
SAMPLE MASS COMPARlSiON
Dty sample weight 101.0 sized sample weight 98.6
2.4 Max allowable limit is 2% difference, or for this particular sample:
- Net Difference
2.02 gms.
p:U401 UABUIATASHTS.XLS 7123187
Total Silt, (g) = Filter Silt + Pan Silt
Total Silt (9) = 12.5
&ea swept mz 220.59
Silt Loading, s/mz 5.67E-02
Silt Fraction, % 0.132275
COMPUTER DATA SHEET

Curb Silt Analysis Data Sheet I I Analysis Date: Bag ID No.: bo1 3
Analyst I Collection Location:
Comments:
Balance properly zeroed and calibrated: Date
1 1. Mokture Analysfs Nodp: w.b. - Wbasb, d.b. = dfY bufr
Eag Contents Filter Bag
Bag 8 Pouch Tare Weight g
~ a g , pouch 8 Sample Wt (w.b.). g
Bag, Pouch 8 SiltyK. brushed (w.b.). g
1 Comblned Pan 8 Sample Weight (w.b.). g
Weighing Pan Tare Weight, 9
Sample Weight (w.b.1. g 0.0 I
Final Weight. (9)
Tare Weight (9)
Net Weight, (a) WL Fraction. %
I I I I I I I I I I I I I
NO. 20 Sieve No. 200 Sieve Pan
(9) (9) (9)
,
0 0 0 I
#DIVX)l #DIVIOI #DIV/OI
Silt Weight (w.b.). g 0
Sill Weight, (d.b.), g 0
Combined Pan 8 Sample Weight ( d . b L Samnle WebM fd.b.L a 0.0 Dried Bag. Pouch 8 Siltwt (d.b.1. g
* l oo vv, - vv, %M=
w, Penant Moisture Content % #DIV/OI
_a__
11. Particle Sizing Analysis and Silt Loading
4 I I I
SAMPLE MASS COMPARISION
Dry sample weight 0.0 sked sample weight 0.0
0.0 Max allowable limit is 2% differenm. or for this particular sample:
- Net Difference
0 gms.
P:U4OIVAB\DATASHTS.XS 7RW7
Total Silt, (9) Filter Sill + Pan Sill
Total Silt (9) = 0
Area swept, m' 21.27
Silt Loading, m' 0.00E+00 I
Silt Fraction. % #DNIOI
COMPUTER DATA SHEET

I I I I I I I I I I I I I I I I I I I
Data collection sheet
SAMPLING DATA FROM PAVED ROADS (Sample in auardana with AP-42, Appendix ‘2.1.2)
Data Sample Colleacd 7/28/97 Sample Bag Identification Number D-024
Sampling Location
and 4th Stn*) (e.& Maple,bawcco 3rd csry phxy
bmucol Branningan and Coorsdale
Road area zip code
4s 1. Number of lanes 4 Lane width Posted M I C speed
2. Surtacc type (e.g.. asphalt, con&):
3. Surface conditions (e.g.. smooth, wcathcnd):
asphalt
4. Vehicle types (e.&, ear$ trucks): all
5. Estimated daily vehicle traffic load (information available at local DOT): 31,200 a M d o r e s t i m a t e d ?
6. Description of neighborhood (agriculhrral. residential, commercial, industrial: residential
7. Arc there construction sites within 0.5 miles, or unpaved road accesses other than residential driveways that would contribute to silt loading? If so. describe Ihe severity of track-out and distance fmm sample location.
8. Describe surrounding soil type (e& loam. sand. clay ... )
9. Weather Related Information:
clay
a Has it rained in the past 48 hours? b. Has winter weather traction material been spread on the road in the past 30 days
(YesMo) NO
(YesMo) No c. If so, what typc of material (e.&. rand, salt, slag) d. How heavily was it spread? (Ibs/mile!lanc)
IO. Weather conditions (over the pasf 24 hours)(e.d.. sunny, windy): SUMY. hot
Page 1

I I I I I I I I I I I I I I I I I I I
Data collection sheet
11. Road Sample surface dimensions for this m p l e
Note: ThC camputer will calculate the ma RepoR 5’4’ m 5.5 tt
~ o t a ~ ~ m 220.68 ma
12. Curb Sample: Road edge description (e.&, curbed. ditch): curbed (r), cwbcd medi i (I)
a Was a curb sample taken (YcsMo)
Surface dimensions for this mple. (Lk n broom to collat any large debris and vacuum B I C ~ from &side white line to curb. If no curb exists collat the sample from the curb-side white lie on hard paved shoulder surface to the beginning of grass or ditch.)
Yes b. I f so, Sample Bag Identification Num. BAGNo. D-025
~ o t a l ~ m 23.91 ma
13. Sample Collection Team:
White Sample Collection Team Members Gatewood (Last names) Okabayashi
Organization Collecting Samples PES Organization Telephone Number (919) 941-0333
Page 2
i

1 I I I I I I I I I I I I I I I I I I
Road Silt Analysis Data Sheet
Analysis Date: mi97 Bag ID No.: W 2 4
Collection Locatlon: Cary Pkwy Analyst Frederiti
Comments: between Brannigan 8 Coorsdaie
1. Moisture Analysis NcW w.h D we1 basis. d.b. = dry basla
Bag Contents
Balanca properly zemU and calibrated: El7197 Date
Filter Bag
300.7 Bag 8 Pouch Tare Weight g 76
222.6 Bag, Pouch 8 Sample Wt (w.b.1. g 158.7
78.1 Bag. Pouch 8 Silt Wt, brushed Wb.). 9 80.8
Pan 8 Sample Weight (w.b.). g
Weighing Pen Tare Weight, g
Sample Weight (w.b.). g
Pan 8 Sample Weight (d.b.), g 300.4 Siltweight (w.b.). 9 4.0
Dried Bag, Pouch 8 SiitWt. (d.b.1. g 78.1 Siltweight, (d.b.). g 2.1 wi
WI
%M= WI -Wf * ,00 w, Percent Moisture Content %M= 3.62%
11. Pardicle Sizing Analysls and Silt Loading
Final Weight (g) 405.5 351.5 506.6
Tare Weight (g) 381.9 304.6 499.7
Net Weight, (g) 23.6 7.1
wt Fraction, % 29.54% 1 58.70% 1 1 I
Total Silt, (g) =Filter Silt + Pan Silt
Total Silt (g) = 9.2
Area swept m2 220.68
Sin Loading. g h 2 4.17E-02
Silt Fraction, % 0.11 8557
SAMPLE MASS COMPARISION
Dry sample weight 79.9 Sued sample weight 79.7
0.2 M a x allowable limit is 2% difference. or for this particular sample:
7 Net Differenat
1.598 gms.
p:wolyAB\DATAsHT5.xLs COMPUTER DATA SHEET li?.W?

I I I I I I I 1 I I I 1 I 1 I I I I I
\
Curb Silt Analysis Data Sheet
Analysis Date: 8/7/97 Bag ID No.: Do25
Collection Location: Cary Pkwy Analyst Frederid
Comments: Between Brannigan 8 Coorsdale
Note: Curb Sample Area
1. Moisture Analysis W. wb. D wsl bash. d.b. -dry ba$a
Bag Contents
Balance properly re& and calibratd. 8/7/97 Date
Fllter Bag
Combined Pan 8 Sample Weight (w. 449.4 Beg 8 Pouch Tare Weight, g 70.1
Weighing Pan Tare Weight, g 218.6 Bag. Pouch 8 Sample Wt. (w.b.). g 308.3
Sample Weight (w.b.), g 230.8 Bag, Pouch 8 Silt \lK, brushed (w.b.). g 77.7
Combined Pan 8 Sample Weight (d. 448.7 Silt Weight, (w.b.), g 7.8
230. I Dried Bag, Pouch 8 SUt Wt (d.b.), g 75.2 wi Sin Weight, (d.b.). g 5.1
WI
%M= wl-wf cqoo w, Percent Moisture Content % 1.34%
* - - 11. Particle Sizing Analysis and Silt Loading
AW = wll-,,
Total Silt, (9) = Filter Silt + Pan Silt
Total Silt (9) = 24.9
411.3 519.5
304.7 499.7
I 106.6 I 19.8 I 45.32% I 8.42%
SAMPLE MASS COMPARISION
~ r y sample weight 235.2
-0.2 sized sample weight 235.4
Max allowable limit is 2% difference. or for this particular sample:
- Net Difference
4.704 gms.
Area swept, mz 23.97
Silt Loading, dmz 1.04E+00
Silt FfacUon, % 0.1893%
COMPUTER DATA SHEET

I' I I 1 1 I I I I I I 1 I 1 I I I I I
Data collection sheet
SAMPLING DATA FROM PAVED ROADS (Sample in accordance with A P 4 Appendix C. 1.2)
Data Sample Collected 1/29/97 Sample Bag Identification Number D-026
Sampling Location (e.&. Maple bctwan 3rd and 4th Street)
m e strat Between Green & b o x
Road area zip eode
1. Number of Inns 2 Lane width Posted traffic sped 35
2. Surface type (e.& asphalt, concrete):
3. Surface conditions (e& smwfb, wcathed):
4. Vehicle types (e.& cars, trucks):
5. Estimated daily vehicle MIC load (information available at local DOT):
asphalt
smooth
both
14,000 a Measured or estimated?
6. Description of neighborhood (agricultural. residential, commercial, industrial. residential
7. An thm c o n m a i o n sites within (1.5 mils. or unpaved road acasscs other than residential driveways that would contribute to silt loading? If so. describe the severity of uack-out and distance from sample location.
Gravel 81. weathered residential driveways contribute to lrackouf
8. Describe surrounding soil type (e& loan sand, clay ... )
9. Weather Related Information:
clay
a. Has it rained in the past 48 hours? b. Has winter weather traction material been spread on the road in the past 30 days
(YesMo) No
(YcsNo) No c. If so, whaf type of material (e.g., sand. ralr slag) d. How heavily was it spread? (Ibshnilflanc)
10. Weather conditions (over the past 24 houn)(cd., sunny. windy): partly cloudy
Page 1
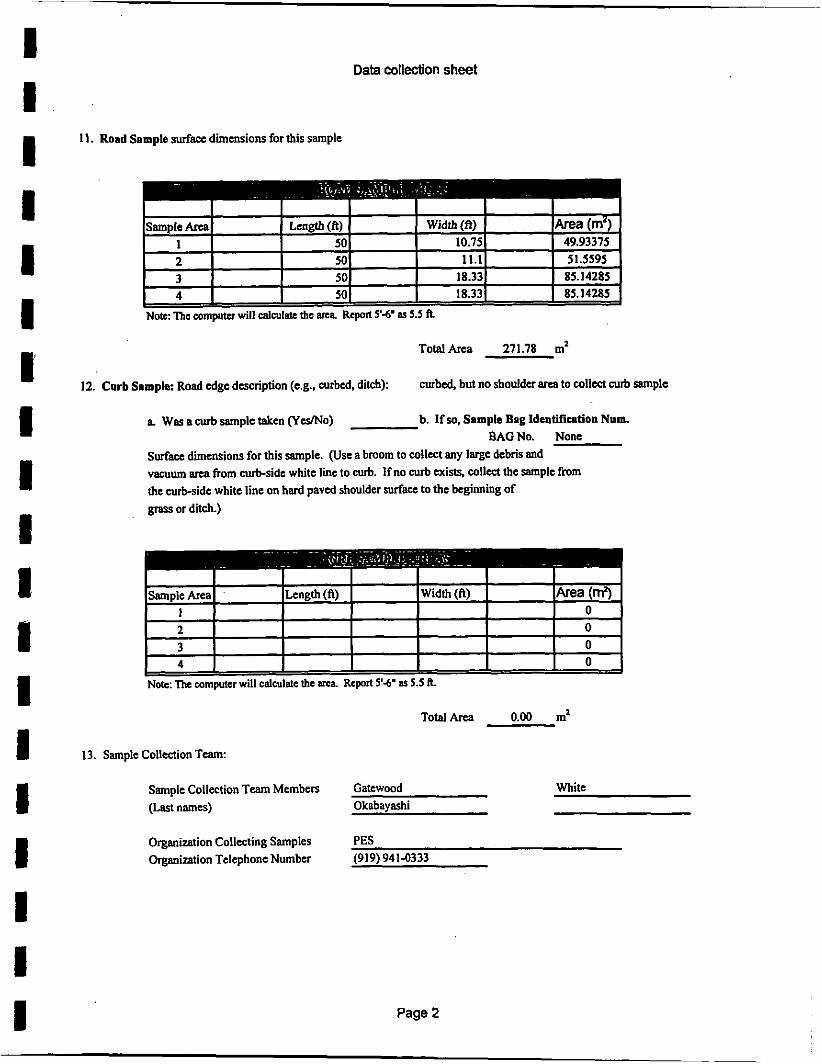
I I I I I I I 1 I I 1 1 I 1 I I I I I
... . . ~~~ . -- 2 50 11.1 51.5595 3 50 18.33 85.14285 4 50 18.33 85.14285
-
Data collection sheet
11. Road Sample surface dimensions for this sample
r I I I I I I I I I I I
Sample Anal I h g t h ( f 0 I I Width@) I lArea (m') 1 I 1 qnl I 10.751 I 49.93375
TotalArea 271.78 m2
12. Curb Sample: Road edge description (e.&, curbed, ditch): curbed, but no shoulder a m to collect curb sample
a Wan a curb sample taken (Yes/No) b. If so, Sample Bag Identification Nnm. BAGNo. None
Surface dimensions for this sample. (Use a bmom to collect any large debris and vacuum sea from curb-side white line to curb. If no curb cxisls, collect the sample fmm the curb-sidc white line on hard paved shoulder surface to the beginning of grass or ditch.)
I I I I I I Sample Areal lLength(n) I (Width@) I l h a (m3
I I I I I 0 I I
I I I I I 0 n I I I I
4 I I I I I I 0 Note: The computer will ealculatc lhe m. Report Y-6' a9 5.5 I?.
Total Ana 0.00 ma
13. Sample Collection Team:
Sample Collection Team Members Gatewood White (Last names) Okabayashi
Organization Collecting Samples PES Organization Telephone Number (919) 9416333
Page 2

I I I I I I I 1 I I I 1 I I I 1 I I I
Shaker Elapsed
Run Number Time (min)
4 4 i n
Road Silt Analysis Data Sheet
Collection Pan Pan Change in Silt
8 Sill Weight Tare Weight AW=
5535 I W,,-,,
Analysis Date: 6/7/97 Bag ID No.: D-026 Collection Location: Duke Street Analyst Frederid
Comments: Betwean Green 8 Knox
I
5 2 3 5 4
1. Moisture Analysis Note: w.b. = Wa bnslr. d.b. = thy basla
Bag Contents
. , .. . . .- 10 557.9 499.6 58.3 7.55% 10 559.3 499.6 59.7 2.35% Total Silt, (9) = Filter Si t + Pan Slt
499.6 -500 111.95% Total Silt, (g) = 68.3
Balance properly zeroed and calibrated: m/97 Date
Filter Bag
Pan 8 Sample WeigM (w.b.), g 894.5 Bag & Pouch Tare Welght g 69.7
Weighing Pan Tare Weight g 211.3 Bag, Poud & Sample Wt, (w.b.), g 766 Sample Weight (w.b.). g 683.2 Bag, Pouch 8 Siltwt. brushed (w.b.). g 82
Pan &Sample Weight (d.b.). g 888.3 Silt Weight, (w.b.), g 12.3 Dried Bag, Pouch & Silt Wt (d.b.). 9 Silt Weight (d.b.). g 8.6
78.3
%M= -w, *,OO Wl Percent Moisture Content %M= 1.71%
- Ii. Particle Sizing Analysis and Silt Loading
Final Weight (9) 628.2 676.6 559.3 Tare Weight (9) 381.9 301.7 499.6
Netweight (9) 244.3 372.1 59.7 Wt. Fraction. % 35.74% 54.43% 8.73%
L
SAMPLE MASS COMPARISION
Dry sample weight 663.6 sled sample weight 684.7
-1.1 Max allowable limit is 2% difference. or for this particular sample:
- Net Difference
13.672 gms.
p:wol\LAB\DATASHTs.XLS 7nw7
k e a swept mz 111.18
Silt Loading, g/m2 2.51E-01
Silt Fraction. % 0.101021
COMPUTER DATA SHEET

~ ~~
I I I I I 1 I I I I I 1 I I I I I I I
Final Weight. (g)
Tare Weight (9)
Net Weight. (9)
wt. Fraction. %
Curb Silt Analysis Data Sheet
NO. 20 Sieve No. 200 Sieve Pan
(e) (9 1 (S)
0 0 0
#DIV/OI #DN/OI #DIV/Oi
Analysis Date: Bag ID No.: None
Collection Location: Analyst
Comments.
1. Molstum Analysis Nola:w.b.-wetks4,d.b.~dIYb.I)l
Bag Contents
Balance properly zeroed and calibrated Date
Fllter Bag
Bag 8 Pouch Tare Weight. g
Bag. Pouch 8 Sample Wt (w.b.). g
Bag, Pouch 8 Sikwt. bNshed (w.b.). g
Silt Weight. (w.b.), g
Combined Pan 8 Sample Weight (w.b.1. g
Weighing Pan Tare Weight. g
Sample Weight (w.b.). g
Combined Pen 8 Sample Welght (d.b.). g
0.0
Dried Bag, Pouch 8 Sinwt (d.b.). g wi Silt Weight (d.b.), g
%M= wl -wf *IO0 WI
Percent Moisture Content % #DNIOI
0
0
P - II. Padele Slzhg Analysk and Silt Loadlng
SAMPLE MASS COMPARISION
Dry sample weight 0.0 sized sample weight 0.0
0.0 Max allowable litnil is 2% differem,
or for lhis particular sample: - Net Differenca
0 gms.
p;WOlUB\OATASHT5.XLS 7nm7
: !
Total Sill, (9) = Filter Sit + Pan Sil l
Total Silt, (9) = 0
Area Swept, mz 0.00
Silt Loading, g/mz #DIVIOi
Siil Fraction. % #DNMI
COMPUTER DATA SHEET

I I I I I I I 1 I I t 1 I I I I I I I
Data collection sheet
SAMPLING DATA FROM PAVED ROADS (Sample in ascordmce withAP-42, Appendix C.1.2)
Data Sample Collcaed 8/5/97 Sample Bag Identification Nombtr Do34
Sampling Location (e.& Maple b m v m 3rd Hwy 70 and 4th Sbat ) Garner
Road area zip code
1. Number of lanes 4 Lane width Posted m c spad 45
2. Surfaa type (e&. asphalt, concrete):
3. Surface mnditions (e.&, smooth, weathered):
asphalt
weathered and smooth
4. Vehicle types (e.g.. cars, trucks):
5. Estimated daily vehicle WIC load (information available st local DOT):
all
28.200 a Mcasurcd or atimatcd?
6. Description of neighborhood (agricultural, residential. commercial, industrial: commercial, residential
7. Arc then construction sites within 0.5 miles, or unpaved mad ~ccesses other than residential driveways that would contribute to silt loading? If so. describe the severity of track-out and distance from sample location.
No
8. Describe surrounding soil type (e.'&., loam, sand, clay ... ) loam
9. Weather Related Information:
a Has it rained in the past 48 hours? (YCsMo) b. Has winter weather traction material been spread on the mad in the psst 30 days
c. If so, what type of material (e.&, sand. salt slag) d. How heavily was it spread? (Ihshnilflane)
Yes
(YcSMo) No
IO. Wcathcr conditions (over the pBn 24 hours)(e.d.. SUMY. windy): SUM)'. windy, rainy
Page I

I I I I I I I I I I I I I I I E I I I
\
Data collpon sheet
11. Rond Sample surface dimensions for this sample
T o t a l h 213.85 ma
12. Curb Sample: Road edge dwaiption (c.g., curbed, ditch): curbed - only on 'r' and ditch (rll), small shoulder on I d
a Was a curb sample taken ( Y d N o )
Surface dimensions for this sample. (Use a broom to collccl any large debris and vacuum area from curb-side white line to curb. If no curb exists collect the sample fiom the curb-side white line on hard paved shoulder surface to the beginning of grass or ditch.)
Yes b. If so, Sample Bng Identification Num. BAGNo. Do35
'Total Area 40.65 ' ma
13. Sample Collection Team:
White Sample Collection Team Members Gatewood (Last names) Okabaymhi
Organization Collecting Samples PES Organiration Telephone Number (919) 9414333
Page 2

I I I I I I I I I I I 1 I I I I I I I
- Tare Weight (91 382.1 Netweight (9) 3.8
Wt Fraction. % 4.25%
Road Sllt Analysis Data Sheet
304.8 499.9
37.7 28.3
42.17% 31.66%
Analysis Date: 6/11/97 Bag ID No.: D-034
Collection Location: Hwy 70 Analyst Frederid
Comments: Garner
1. Moisture Analysis Note: w.b. =wet bash. d.b. E dy bad9
Bag Contents
Balance properly zeroed and calibrated:
Filter Bag
Pan 8 Sample Weight (w.b.). g
Weighing Pan Tare Weight g
Sample Weight (w.b.). g
Pan 8 Sample Weight (db.), g
289.8
218.7
70.9
289.1
Bag 8 Pouch Tare Weight g
Bag. Pouch 8 Sample wt (w.b.1. g
Bag. Pouch 8 Silt WL, brushed (w.b.1, g
Silt Weight, (w.b.1, g
Dried Bag. Pouch 8 SiltWt (d.b.). g
Wi Silt Weight (d.b.). g
Wr
%M= wi-wf *IO0 w, Percent Molsture Content %MI 2.61%
El11197 Date
92.4
184.5
113.3
20.9
111.4 I 9
. 11. Partlcle Slzlng Analysis and Silt Loading
AW= w,i-1,
Total Silt, (9) = Filter Silt + Pan Silt
Total Silt. (g) = 47.3
Final Weight (9) 385.9 342.5 528.2 -
SAMPLE MASS COMPARISION
Dry sample weight 89.4 Sued sample weight 08.0
0.6 Max allowable lin 2% differenc - Net Difference or for this particular sample:
Area swept, m2 213.85
Silt Loading, glrn’ 2.21E.01
Silt Fraction, % 0.87765
1.768 gms.
COMPUTER DATA SHEET
~

I I I I I I I I I I I 1 1 I I I I I I
(9) Final Weight, (9) 414
Tare Weight. (9) 362
Curb Slit Analysis Data Sheet
Analysis Date: 8/11/97 Bag ID No.: Do35
Coliedion Location: Hwy 70 -Gamer Analyst FlWJeriCi
Comments: Note: Curb area sample (right side)
Note: Curb area sample (leR side - ditdr)
(9) (9) 409.5 550.4
304.6 499.6
1. Moisture Analysis Nots.w.b.~wa(bnsb,d.b.=dybasb
Bag Contents
Balance properly z e d end calibrated:
Fllter Bag
8/11/97 Date
Combined Pan 8 Sample Weight (w. 399.3 Bag 8 Pouch Tare Weight, g 92.5
Weighing Pan Tare Weight, g 211.3 Bag, Pouch 8 Sample Wt (w.b.). g 301.9
Sample Weight (w.b.), g 188.0 Bag, Pouch 8 Silt wt. brushed (w.b.). g 113.2
Combined Pan 8 Sample Weight (d. .
- 11. Padcie Sizing Analysis and Silt Loading
A W = wn-1,
Total Silt, (9) = Filter Silt + Pan Silt
Total Silt (9) = 69.5
Run Number Tm (mln) Silt Weight. (%) Tare Weight Weight (%) Aw= 1 5 10 549.2 I 499.6 I 49.6 I ZERO% wn-1,
Total Silt, (9) = Filter Silt + Pan Silt
Total Silt (9) = 69.5
NO. 20 sieve 1.0. ZOO sieve Pan I
I 104.9 I 50.95%
SAMPLE MASS COMPARISION
Dry sample weight 205.9 sked sample weight 206.4
-0.5 Max allowable limit is 2% difference, or for this particular sample:
- Net Difference
4.118 gms
A- swept m’ 40.65
Silt Loading, g/m2 1.71E+00
Silt Fraction, % 0.398509
COMPUTER DATA SHEET

-
I I I I I 1 I I I I I I t I I I I I I
Data collection sheet
SAMPLING DATA FROM PAVED ROADS (Sample in accordance with AP-42, Appndm C.12)
Data Sample Colledcd 8/6/97 Sample Bag Idendfiestion Number D-038
Sampling Location (e.g., Maple between 3rd and 4th Street)
401 Mer split from 70
Road area d p code
1. Numbcr of lanes 4 Lane width Posted haffic speed 55
2. Surface type (e.g., asphalt, concrete):
3. Surfacc conditions (e.&, smooth, wca thd) :
asphalt
smooth w/ cracks on surface
all 4. Vehicle t y p (e.&, cars, bucks):
5. Enimatcd daily vehicle WIC load (information available at local DOT): 25,300 a M d or estimated?
6. Description of neighborhood (agricullural, residential. commercial. industrial:
7. An therc construction sites within 0.5 miles, or unpaved mad accesses other than residential driveways that would contribute to silt loading? If so. describe the severity of back-out and distance from sample location.
residential
No
8. Dcscribc surrounding soil type (e.& loam. sand, clay ... )
9. Weather Related Information:
clay
a Has it rained in the past 48 hours? (YcsMo) b. Has winter weather baction material been spread on the mad in the past 30 days
Yes
( Y d o ) No c. If so. what type of material (e& sand, salt, slag) d. How heavily was it spread? (Ibs/mildane)
IO. Weather conditions (over the past 24 hours)(c.d.. sunny, windy): rainy, sunny, hot
Page 1
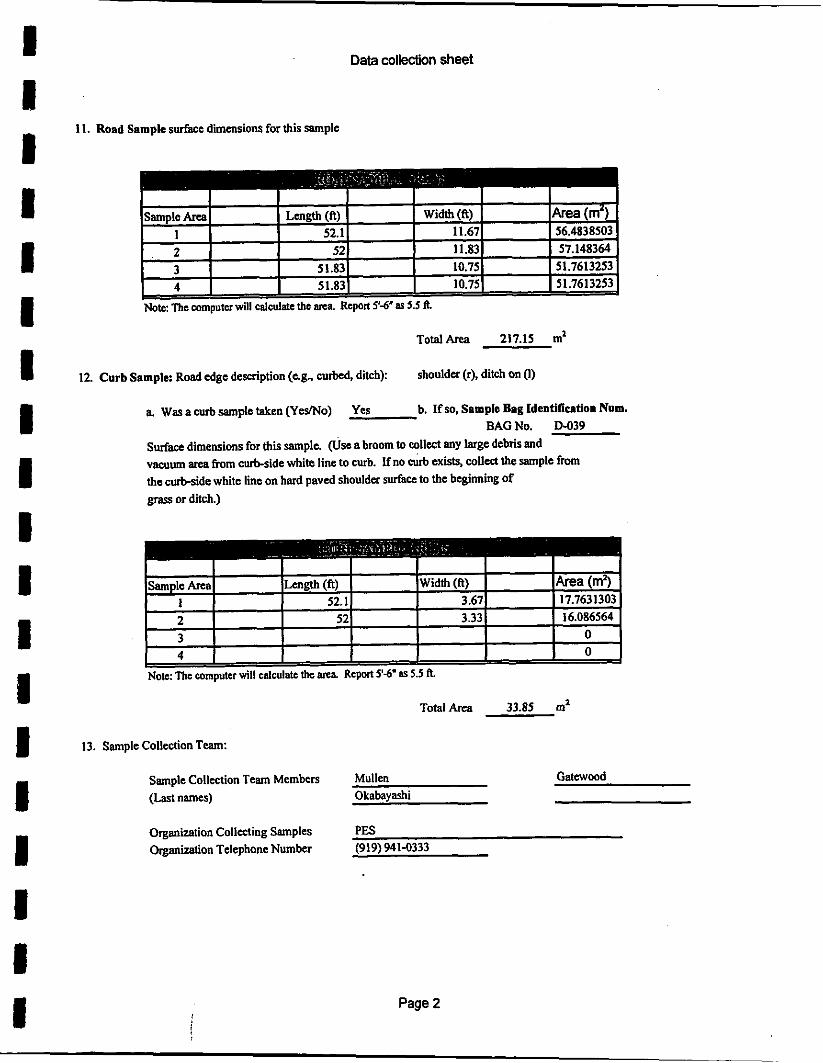
I II I I I I I 1 I I I 1 I I I I I I I
Data collection sheet
11. Road Sample surface dimensions for this sample
I I I I I I
Total& 217.15 ma
12. Curb Sample: Road edge description (e&, curbed, ditch): shoulder (r), ditch on (I)
b. If so, Sample Bag Identifiation Num. a Was a curb sample taken (YeYNo) yes BAGNo. D.039
Surface dimensions for this sample. (vsc a broom to collect any large debris and __ vacuum a m from curb-side white line to curb. If no curb exists, collect the sample from the curb-side white line on bard paved shoulder surface to the beginning of grass or ditch.)
Sample Area Length (A) Width (ft) Area (m3 17.7631303 1 52.1 3.67
2 52 3.33 16.086564 0
Now: Ths computer will cdculate the arca Report 5'4" PS 5.5 R
Total Area 33.85 ma
13. Sample Collection Team:
Sample Collection Team Members Mullm Gatewood (Last names) Okabayashi
Organization Collecting Samples PES Organization Telephone Number (919) 941-0333
Page 2 i
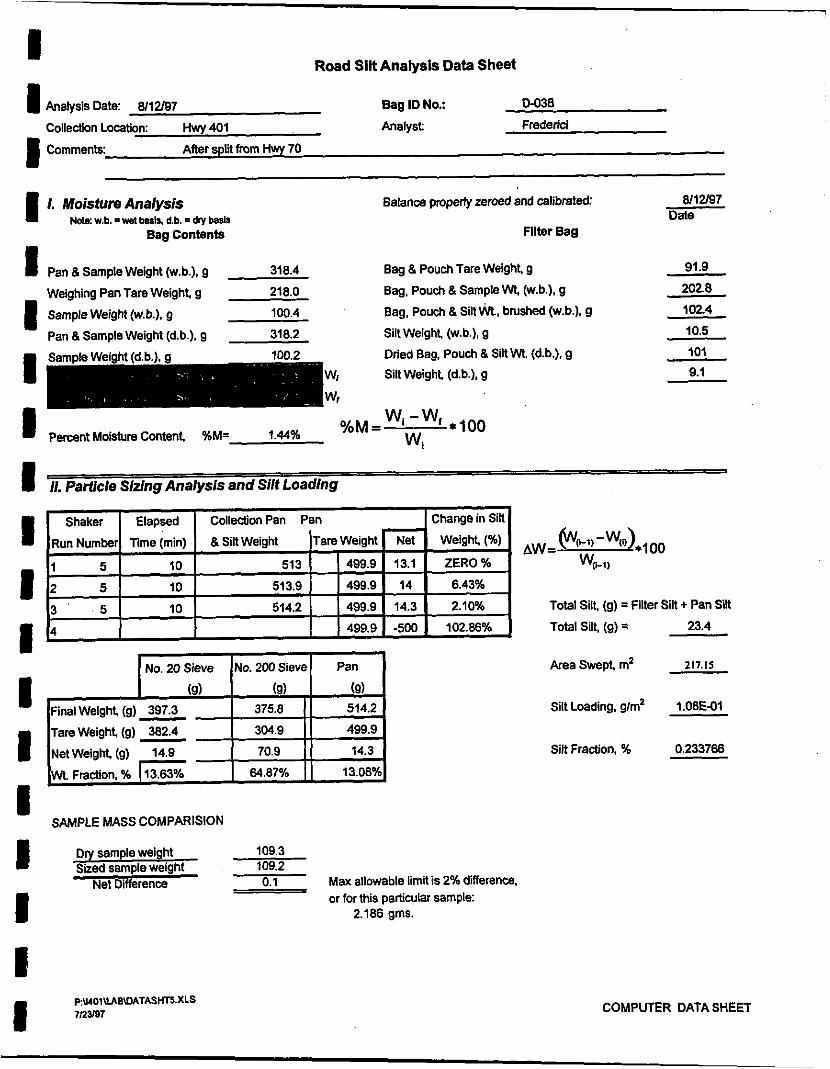
Road Silt Analysis Data Sheet I I Analysis Date: 8/12/97 Bag ID No.: Do38 , Collection Location: w 401 Analyst Fredetid
Comments: Afler split from Hvq 70
1 1. MoistureAnalysis Balanca properly z e m d and calibrated: 8/12/97 Dale Nots: W.b. W baris. d.b. c d y baah
Bag Contents Fllter Bag
1 Pan 8 Sample Weight (w.b.1, g 318.4 Bag 8 Pouch Tare Weight g 91.9
Weighing Pan Tare Weight g 218.0 Bag. Pouch 8 Sample Wt, (w.b.1. g 2028 1 Sample Weight (w.b.). g lW.4 Bag, Pouch 8 S i l l h , brushed (w.bJ.9 1024
Pan 8 Sample Weight (d.b.). g 318.2 Silt Weight (w.b.), g 10.5
I (9)
h a 1 Weight (9) 397.3 Tare Weight (9) 382.4 Net Weight (9) 14.9
Wt Fraction. % 13.63%
I I I I I I I I I I I I I
(9) (9) 375.8 514.2
304.9 499.9
70.9 14.3
64.87% 13.08%
100.2 Dried Bag, Pouch 8 Silt wt (d.b.). g 101
Sill Weight (d.b.). g 9.1
70 IVI = - Percent Moisture Content, %M= 1.44%
NO. 20 sieve IN^. 200 sieve pan
SAMPLE MASS COMPARISION
Dry sample weight 109.3 Sued sample weight 109.2
0.1 Max allowable limit is 2% difference. or for this particular sample:
- Net Difference
2.186 gms.
1 Total Silt (g) = Filter Silt + Pan Silt Total Silt, (g) = 23.4
Area Swept m2 217.15
p:u4OlUAEuIATASHT5.XLS 7/23/87
Silt Loading, g/m2 1.08EOl
Silt Fraction. % 0.233766
COMPUTER DATA SHEET

~-
I I I I I I I I I I I I I I I I I I I
.
Run Number
I
\
Curb Silt Analysis Data Sheet
Analysis Date: 8/12/97 Bag ID NO.: Do39
Collection Location: Hwy 401 Analyst Frederid
Comments: Afler split from Hwy 70
Note: Shoulder - righV Ditch - lefl
Time (mln) Silt Weight (%) Tare Weight AW =
1. Moisture Analysis N&. w.b, = w d W. d.b - dry bstb
Bag Contents
2 5
3 5
4 5
Balance properly zeroad and calibrated: 6/12/97 Date
Filter Bag
10 513.6 499.6 14 1O.W%
499.6 14.5 3.45% Total Silt, (9) = Filter Sill + Pan Sill 10 514.1 10 514.3 499.6 14.7 1.36% Total Silt, (g) = 20.6
Combined Pan 8 Sample Weight (w. 470.3 Bag 8 Pouch Tare Weight g 92.8
Weighing Pan Tare Weight g 247.6 Bag, Pouch 8 Silt wt., brushed (w.b.). g lW.3 Sample Weight (w.b.). g
Combined Pan 8 Sample Weight (d.
222.7 Bag, Pouch 8 Sample wt. (w.b.), g 348.1
470.2 Silt Weight (w.b.), g 7.5
Dried Bag. Pouch 8 Silt wt. (d.b.). g Silt Weight, (d.b.). g 5.9
98.7
%M= wi-wf *,oo Wi
Percent Moistun, Content % 0.67%
No. 20 Sieve No. 200 Sieve Pan
(e) (9) (9)
490.1 514.3 Final Weight, (9) 429.6 Tare Weight, (g) 382.2 304.6 499.6
165.5 14.7 Net Weight, (9) 47.4 .Fraction, % 16.71% 73.20% 5.60%
ED_ - 11. Partlcle Sizing Analysis and Silt Loading
Area swept. m2 33.85
Silt Loading, g/m' 6.09E-01
Silt Fraction, % 0.099951
I Shaker I Eiansed I Collection Pan, I Pan I change in Silt
SAMPLE MASS COMPARISION
Dry sample weight 253.4 253.5 4.1
S i sample weight Net Difference Max allowable limit is 2% diffemm,
or for this particular sample: -
5.066 gms.
COMPUTER DATA SHEET

I I I I I II I I I I I 1 I I I I I I I
Data Sample Collected
smplii Location (e& Maple between 3rd and 4th Stnet)
Data collection sheet
SAMPLING DATA FROM PAVED ROADS (Sample in accordana with AP-42, Appendix C.1.2)
7/28/91
nw 54 = Maynard before Northwoods Drive
Sample Bag ldentlficetion Number D-022
1. Numberoflanes 4 Lane width
mad area zip code
Posted MIC speed 45
2. Surface type (e.& asphalt, eonmete):
3. Surface conditions (e& smooth, weathered):
4. Vehicle types (c.g., cars, hllcks):
5. Estimated daily vehicle traffic load (information available at local WT):
asphalt
smooth
both
13,300 a Mcasund or estimated?
6. Description of neighborhood (agricultural, residential, commercial, industrial: commercial
7. Am there construction sites within 0.5 miles, or unpaved road aCCeSSCS other than residential driveways that would contribute to silt loading? If so, describe the severity of track-out and distance ftom sample location.
No
8. Describe surrounding soil type (e&, loam, sand, clay ...) clay
9. Weather Related Information:
a Has it rained in the past 48 hours? (YerMo) b. Has winter weather traction material been spread on the mad in the past 30 days
c. If so, what type of material (e.& sand salt, slag) d. How heavily was it spread? (Ibdmildane)
No
(YSMo) No
IO. Weather conditions (over the past 24 hours)(c.d., sunny, windy): hot, sunny
Page 1

-
I I I I I I I I I I I I I I u I I I I
Data collection sheet
11. Road Sample surface dimensions for this sample
I I I I I I I
Note: The wmputer will calculalc the ma Report 5%. as 5.5 fL
TotalAna 213.03 m'
curbed (r). no curb or shoulder (I) 12. Curb Sample: Road edge description (e.g.. curbed, ditch):
a Was a curb sample taken (YwNo)
Surface dimensions for this sample. (Use a broom to collcct any large debris and
Ycs b. If so, Snmpte Bng Ideatifiation Num. BAG No. D-OU
vacuum arc? from curb-side white lime Io curb. If no curb exist% collst the sample h m the curb-side white lime on hard paved shoulder surface to the beginning of grass or ditch.)
2 50.25 1.83 8.54285 I75 3 0 4 0
Note: The mmputer will calculalc thc ma Report 5%' m 5.5 A.
Total Ana 17.09 m'
13. Sample Collection Team:
Sample Collection T m Membas Okabayashi White (Last names) Gatewood
Organization Collecting Samples PES Organization Telephone Number (919) 941-0333
Page 2

I I I I I I I I I I I I I I I I I I I
Road Silt Analysis Data Sheet
AnalyslsDak 8/6/97 Bag ID No.: D-022
Collection Location: Hwy 54 = Maynard Analyst
Comments: Before Norlhwoods Drive
1. Moisture Analysis Nobs: w.b. -wetbasla, d.b. = d y h d s
Bag Contents
Balance properly zeroed and calibrated: em97 Date
Filter Bag
Pan 8 Sample Walght (w.b.). g 317.8 Bag 8 Pouch Tare Weight g 75.9
222.3 Bag, Pouch 8 Sample "4 (w.b.), g 178.3
Sample Weight (w.b.). g 95.5 Bag. Pouch 8 Siit Wt. brushed (w.b.), g 82.5
Pan 8 Sample Weight (d.b.). g 318.0 Silt Weight (w.b.), g 8.6
79.7
Weighing Pan Tare Weight g
Dried Bag, Pouch 8 Siit Wt (d.b.), g Siltweight. (d.b.). g 3.8
%M= wl -wf *IO0 w, Percent MoI6lure Content %M= 2.55%
11. Parficle Sizlng Analysis and Silt Loading
NO. 20 Sieve No. 200 Sieve Pan
(a) (S) (9)
Final Weight (9) 410.2 359 513.1
Net Weight (9) 28.1 54.2 13.4
Tare Weight (9) 382.1 304.8 499.7
Wt Fraction. % 28.24% 54.47% 13.47% -
Total Silt, (9) = Filter Silt + Pan Silt
Total Siit. (9) = 17.2
Area w e p t m2 213.03
Slit Loading, g/m2 8.07E-02
Silt Fraction, % 0.179728
SAMPLE MASS COMPARISON
Dry sample weight 99.5 Sized sample weight 99.5
0.0 Max allowable limit Is 2% difference. or for this particular sample:
- Net Difference
1.99' gms.
COMPUTER DATA SHEET

I,
Final Weight, (9)
Tare Weight. (9)
Net Weight, (9)
W. Fraction, %
\
Curb Silt Analysis Data Sheet
No. 20 Sieve No. 200 Sieve Pan
(9) (e) (e)
382.2 304.9 499.9
424.5 378.9 514.4
42.3 74 14.5
31.38% 54.90% 10.76%
Analysis Date: 8/M97 Bag ID No.: DO23
Collection Location: Hwy 54 = Maynard Analyst Frederid
Comments: Before Northwwds Drive I Note: Curb Sampleha
I
1 1. Moisture Analysis NObs:w.b.-llstbPlt*d.b.*Wborh
Bag Contents
Balance properly zeroed and calibrated: am97 Date
Filter Bag
349.7
217.8
131.9
349.8
Beg a Pouch Tare Weight g
Bag. Pouch & sample W, (w.b.). g Bag, Pouch 8 Silt WL, brushed (w.b.). g
SIR Weight, (w.b.). g
1 Combined Pan 8 Sample Weight (w.
Weighing Pan Tare Welght. g
Sample Weight (w.b.), g I Combined Pan 8 Sample Weight (d. Dried Bag, Pouch 8 Siltwt (d.b.). g
WI Silt Weight, (d.b.). g
WI I
%M= wl -Wf .,00 w, I Penent Moisture Content % 2.03%
I I I I I I
76
214
81.7
5.7
78.8 2.8
- ii. Particle Sizlng Analysis and Silt Loading
I SAMPLE MASS COMPARISION
D I ~ sample weight 134.8 sued sample weight 133.6
1.2 Max allowable limit is 2% difference, or for this particular sample:
- Net Difference I
Total Silt. (9) = Filter Silt + Pan Silt
Total S i t (9) = 17.3
Area swept m2 17.09
Silt Loading, glm’ 1.01E+00
Silt Fraction. % 0.189485
I I
2.696 gms.
p:U4OtYAs\DATASHTS.XS 7123187 I COMPUTER DATA SHEET

I I I I I I I I I I I I I I I I I I I
Data collection sheet
SAMPLING DATA FROM PAVED ROADS (Sampls in accordance with AP-42, Appmdw C.12)
Data Sample Collected 7/22/97 Sample Bag Identifleation Nomber D-016
Sampling Location (e.&, Maple between 3rd and 4th SM)
Hwy 55 b c t w w Cornwallis & Riddle
Road area zip code
1. Numberoflanes 4 Lane width Posted mflic speed 55 rnph
2. Surface type (e& asphalt, concrete): asphalt
3. Surface conditions (e& smooth. w c a t h d ) : smooch
4. Vehicle types (e.g.. cars, w c h ) : both
5. Estima~ed daily vehicle MIC load (information available at local DOT): 12,000 a Measured orcsfimaIed7
6. Description of neighborhood (agricultural. midentid, commmid, industrial:
7. Are there construction sites within 0.5 miles, or unpaved mad a c c c s ~ s other lhnn residential driveways that would contribute Io silt loading? If so. describe the %verity of back-out and distance from sample location.
hWgcnwus
1 construction site on opposite side of mad. Limited backout b/c site appears nonopcrational
8. Dewibc surrounding sail type (e&, loam, sand, clay ... ) loam
9. Weather Related Infnmalion:
a Has it rained in the pas1 48 hours? b. Has winter weather baction material been spread on the mad in the past 30 days
e. If so. what type of material (e.g., sand, salt slag) d. How heavily was it spread? (Ibr/milJlane)
(Ycflo) No
(YcY'No) No
IO. Weather conditions (over the p8St 24 hours)(e.d., sunny. windy): p d y cloudy - sunny
Page 1

I I I I I I I I I I I I I I I I I I I
Data collection sheet
11. Road Sample surface dimensions for this Sample
Note: The computer will calculate the am. Report 5'4" ar 5.5 A.
TotalArea 194.25 m'
paved shoulder with ditch 12. Curb Sample: Road edge description (e&, curbed, ditch):
a Was a curb sample taken ( Y m o ) b. If so, Sample Bag Identification Num. BAGNo. D-017
Surface dimensions for this sample. (Use a broom to collect any large debris and vacuum area from curb-side white line to curb. If no curb exist% collect the sample fmm the curb-side white line on hard paved shoulder surface to the beginning of grass or ditch. j
Note: The computer will calculate the ma Report 5'4' as 5.5 A.
Total Area 14.31 m'
13. sample Collection T m :
Sample Collection Team Members Mullen (Last names) Okabayashi
Organization Collecting Samplcs PES Organization Telephone Number (919) 941-0333
Page 2

I I I I I I I I I I I I I I I I I I I
Road Sllt Analysls Data Sheet
Analysis Date: 8/5/97 Bag ID No.: D-016
Collection Location: Hwy 55 between Analyst Frederid
Comments: Cornwailis 8 Riddle
1. Molstura Analysis NOW w.b = Wa M. d.b. -dry M
Bag Contents
Balance property zeroed and calibrated: 8/5/97 Date
Filter Bag
Pan B Sample Weight (w.b.). g
Weighing Pan Tare Weight g
Sample Weight (w.b.). g Pan 8 Sample Weight (d.b.). g 325.3 Siltweight, (w.b.). g
325.4
293.5
31.9
Bag & Pouch Tare Weight, g
Bag, Pouch 8 Sample W (w.b.). 9
Bag, Pouch 8 Siitwt. brushed (w.b.). 9
70.5
107.1
74.9
4.4
72.1 -
1.8
%M= Wl Percent Moisture Content %M= 7.69%
AWE W(I-1)
Total Silt (g) = Filter Silt + Pan Silt Total Silt (9) = 4.9
NO. 20 Sieve /NO. ~ G U sieve Pan I Final Weight (9) 390.5 325.8 503.1 - Tare Weight (9) 382.7 499.8 - Net Weight (a) 7.8 3.3
Fraction. % 23.35% I 62.28% 11 9.88%
SAMPLE MASS COMPARISION
Dry sample weight 33.4 Sized sample weight 33.5
-0.1 Max allowable limit is 2% difference, or for this particular sample:
- Net Difference
0.668 gms.
Area swept mz 194.25
Silt Loading, s/mZ 2.52E-02
Siit Fraction. % 0.153605
COMPUTER DATA SHEET

I I I I 1 I 1 I I I I I I I I I I I I
Final Weight, (9)
Tare Weight. (9)
Net Weight, (g)
wt. Fraction, %
Curb Silt Analysis Data Sheet
Analysis Date: 8/W7 Bag ID No.: W 1 7
Collection Location: nw 55 between Analyst Frederld
Comments: Comwallis 8 Riddle Road
Note: Curb Sample Area
No. 20 Sieve No. 200 Sieve Pan
(S) (9) (9)
382.3 304.2 499.8
15 26.1 2
33.56% 58.39% 4.47%
397.3 330.3 501.8
1. Moisturn Analysis N-. w.b. * Va W. d.b. = dw b.tir
Bag Contents
Balance properly zeroed and calibrated: 8/5/97 Date
Fllter Bag
Bag 8 Pouch Tare Welght, g 70.5 Combined Pan 8 Sample Weight (w.
Weighing Pan Tam WeigM. g
Combined Pan 8 Sample Weight (d.
. 337.2 293.5 Bag, Pouch B Sample WC. (w.b.1. g 118.8
Bag, Pouch 8 Sill Wt. brushed (w.b.). g 337.0 Silt Weight. (w.b.). g 3.5
74 Sample Weight (w.b.). g 43.7
Dried Bag, Pouch 8 Silt Wt (d.b.). g 71.7 Silt Weight, (d.b.). g 1.2 wi
WI
wi-wf *IO0 Wi
%M= Percent Moisture Content % 5.30%
AW= YI-1,
Total Silt, (g) = Filter Silt + Pan SP Total Silt, (9) = 3.2
SAMPLE MASS COMPARISION
Dry sample weight 44.7 siied sample weight 44.3
0.4 Max allowable limit is 2% difference. or for this particular sample:
__. Net Difference
0.894 gms.
Area Swept, mz 14.31
Silt Loading, g/mz 2.24E-01
Silt Fraction. % 0.10921 5
COMPUTER DATA SHEET

I I I I I I 1 I I I, 1 I I I I I I I I
Data collection sheet
SAMPLING DATA FROM PAVED ROADS (Sample in acmdfmffi with AP-42, Appendix C.1.2)
Data Sample Collated 7/23/97 Sample Big Identification Number D-033
Sampling Location . - (e.&, Maple between 3rd and 4th Strca)
Hwy 64 Bchveen King William Road & Wake Medical Ccntcr
Road area rip code
1. Numberoflanes 4 Lane width Posted eaffic s p d 45
2 Surfacetypc(e.g.,asphalt, concrete): asphfdt
3. Surface conditions (c.g., smooth weatherrd): smooth
all 4. Vehicle lypa (e.&, can, Iruc!~):
5. EstimaIcd daily vehicle traffic load (information available at local WT): 25,900 a. Measured or estimated?
6. Description of neighborhood (agri~ltural. residential, commercial, induslrial:
7. Arc thm construction sites within 0.5 miles, or unpaved road accesscs other than residential driveways that would contribute to silt loading? If so. daaibc the severity of Irack-out and distance from sample location.
all
No
8. Dcscribc surrounding soil type (e.&, loam, sand, clay ... ) loam
9. Weather Related Information:
a. Has it rained in the past 48 hours? (YesMo) b. Has winter weather haction material been spread on the road in the past 30 days
Ycs
(YaMo) No e. If so, what type of material (c.g., sand. salt, slag) d. How heavily was it spread? (lbs/mildane)
10. Weather conditions (over the pa^ 24 hours)(e.d., sunny, windy): sunny. cloudy
Page 1

1 I I I I I I I I I I I I IE I I I I I
\
Data coll on sheet P
11. Road Sample surface dimensions for this sample
I I I I I I
Note: The wmputn will calculars Ue awn Rcport 5'4' as 5.5 A.
TOMAW 19s.00 m'
12. Curb Sample: Road edge description (e.g., curbed. ditch): ditch on both sides, "low shoulder" signs
a Was a curb sample Iakm ( Y d o ) NO b. If so. Sample Bag Identification Num. BAGNo. None
~
Surface dimensions for this sample. (Use a broom to eollcct any large debris and vacuum area fmm &side white line to curb. If no curb exists, collc~3 the sample fmm the curb-side white line on hard paved shoulder surface to the beginning of graa or ditch.)
Note: The wmputcr will c a l ~ l s t ~ Ihs ma RepoIt 5'4" as 5.5 h
Total Area 0.00 m'
13. Sample Collection Team:
Sample Collection Team Mcmbm (Last names)
Organization Collecting Samples Organization Telephone Number
Page 2

~-
I I I I I I I I I I I I I I I 1 I I i
No. 20 Sieve No. 200 Sieve
(9) (9)
Final Weight (9) 384.2 332.5 - Tare Weight (9) 382.1 304.6
Netweight. (9) 2.1 27.9
Wt Fraction, % 5.16% 68.55%
Road Silt Analysis Data Sheet
Pan
(9) 505.2
499.7
5.5
13.51%
Analysis Date: 8/11/97 Bag ID No.: 0-033
Colledon Location: Hwyw Analyst Frederld
Comments: Between King Wlliams Road 8
Wake Medical Center
1. Moisture Analysis Ncb: w.b. = wst baait. d.b. = dry ba&
Bag Contents
Balance properly zeroed and calibrated: 8/11/97 Date
Fllter Bag
Pan 8 Sample Weight (w.b.), g 258.0 Bag 8 Pouch Tare Weight. g 92.1
Sample Weight (w.b.), g 35.2 Bag. Pouch 8 Silt Wt, brushed (w.b.), g 99.3
Weighing Pan Tare Weight. g 222.8 Bag, Pouch 8 Sample Wt (w.b.). g 134.4
Pan 8 Sample Weight (d.b.1. g 257.9 SiRWeight (w.b.). g 7.2
97.7 wi Silt Weight, (d.b.1. g 5.6
wi
Dried Bag, Pouch 8 SiltWt (d.b.), g
%M= WI -Wf *,oo w, Percent Moisture Content %M= 4.01%
a
ii. Parucle Sizing Analysis and Silt Loading
AW= Po-1, -w,”)*,oo Wc-1,
SAMPLE MASS COMPARISION
Dry sample weight 40.7 sued sample weight 41.1
-0.4 Max allowable limit is 2% difference. or for this Darticular sample:
- Net Difference
0.814 gms.
P:UOi WWJAlASHT5.XLS 7RW7
Total Sin. (9) = Filter Silt + Pan Sin
Total Silt (g) = 11.1
Area Swept, mz 195.M)
Silt Loading, g/m‘ 5.69E-02
Silt Fraction, % 0.312676
COMPUTER DATA SHEET

rn I I I I I I I I I I I I I I I I
Final Weight (9)
Tare Weight (e)
Net Weight, (g)
Wt. Fraction, %
I Curb Silt Analysts Data Sheet
Analysis Date: Bag ID No.: None
Collection Location: Analyst I
No. 20 Sieve No. 200 Sieve Pan
(e) (e) (g)
0 0 0
#DIVIOI #DN/OI #DIV/OI
Comments:
1. Moisture Analysis Nota: w.b. - wd 0.1* db = dn berLI
Bag Contents
Balance properly zeroed and calibrated: Date
Filter Bag
Combined Pan 8 Sample Weight (w.b.), g
Weighing Pan Tare Weight g
Sample Weight (w.b.). g
Combined Pan 8 Sample Weight (d.b.). g
Bag 8 Pouch Tare Weight, g
Bag. Pouch 8 Sample ‘M, (w.b.), 9
Bag, Pouch 8 Silt WL, brushed (w.b.). g
Silt Weight, (w.b.). g 0.0
0
Dried Bag, Pouch 8 Silt W t (d.b.). g Silt Weight (d.b.). g 0
WI
Wi -W, * loo Wi
%M= P e m t Moisture Content % wtvm - Ii. Particle Sizing Analysis and Slit Loading
Shaker Elapsed Collection Pan, Pan Change in Silt
Run Number Time (mln) Sib Weight (%) Tare Weight
1
2 #DNIOI
3 0.0 I 0 I #DNIOI I
SAMPLE MASS COMPARISION
Dry sample weight 0.0 Sued sample weight 0.0
0.0 Max allowable limit is 2% difference. or for this particular sample:
- Net Difference
o gms.
Total Silt, (9) = Filter Silt + Pan Sib
Total Silt, (9) = 0
Area swept m’ 0.00
Silt Loading, g/m’ #DN/OI
Siii Fraction, % #DN/OI
COMPUTER DATA SHEET

I I I I I I I I I I I I I I I I I I I
Data collection sheet
SAMPLING DATA FROM PAVED ROADS (Sample m acwrdance with AP42. Appendix C.1.2)
Data Sample Collated 7/23/91 Sample Bag ldeatifiution Number D-020
Sampling Location (e&. Maple betwan 3rd and 4th Street)
Evans, St Road 3048 behvem Aviation & Hwy 54
Road a m zip d e
1. Numbcroflanes 4 Lane width P o n d M I C sped 4s
2 Surface type (c.g.. asphalt, concrete): asphalt
3. Surface cpnditions (e.&, smooth, wcathcnd): smooth
car$ mcks 4. Vehicle types (e& cars trucks):
5. Estimated daily vehicle W i c load (information available at local DOT): 15.100 a Mcanvtd or &mated?
6. Description of neighborhood (agricultural, residential, commercial, industrial: commercial
7. Are them constnraion s i t s within 0.5 miles, or unpaved mad a c u x s other than residential driveways that would contribute to silt loading? If so. describe Ihe severity of track-out and distance from sample location.
No - past old construction site 0.5 miles. not trackout
8. D d b c surrounding soil type (e& loam, sand, clay ... )
9. Weather Related Information:
clay
' a Has it rained in the past 48 hours? (YesMo) Yes b. H s winter weather traction material been spread on the road in the p a t 30 days
c. If so. what type of material (e&, sand, salt, slag) d. How heavily WBS it s p d ? (Ibs/mile/lane)
(YesMo) No
IO. Weather conditions (over the past 24 hours)(e.d.. sunny, windy): sunny
Page 1

I I I I I I 1 I I I I I I I I I I I I
Sample Area I 2
Data collection sheet
11. Road Sample surface dimensions for thin sample
Length (Q Width (A) Area (m3 53.61 1.83 9.12427569 53.42 I .92 9.52841856
Note: The computer will calculate the ma RcpoR 5’4’ ES 5.5 R
TotalArea 229.46 ma
12. Curb Sample: Road edge description (e& curbed, ditch): curbed
a Was a curb sample taken O ’ d o ) BAGNo. Do21
Surface dimensions for this sample. (Use a broom to collect any large debris and vacuum wen from curb-sidc white line to curb. If no curb mists, collcct the sample fmm the curb-side white line on hard paved shoulder surface to the beginning of grass or ditch.)
Ycs b. If so, Sample Bag Ideatiflcntioo Num.
Total Area 18.65 m’
13. Sample Collection Team:
Sample Collection Team Members Gatewood (Last names) Okabayashi
Organization Collecting Sampls PES Organization Telephone Number (919) 941-0333
Page 2
!

I I 1 I I I I I I I I I I I I I I I I
un Number] Time (min) I &Silt Weight lTare Weight I Net I Weight (%)
5 1 10 506.5 I I 499.7 I 6.8 I ZERO %
Road Silt Analysis Data Sheet
Analysis Date: 6/6/97 Bag ID No.: D-020
Collection Location: Evans, SL Road 3048 Analyst
Comments: Between Aviation Pkwy and H v ~ 54
~ w =
1. Moisture Analysis Ncds: w.h = wel has% db. *dry basla
Bag Contents
2 5 10 506.8 499.7 7.1 4.23%
3 5 10 506.9 499.7 7.2 1.39% - 4 499.7 -5M) 101.44%
Balance properly zeroed and calibrated: w6/97 Date
Fllter Bag
NO. 20 Sieve No. 200 Sieve
(9) (g)
Final Weight (9) 400.4 368.6
Tam Weight’(g) 382.5 304.7 - Net Weight (9) 17.9 63.9
Wt Fraction. % 19.37% 69.16%
Pan B Sample Weight (w.b.). g 300.5 Bag B Pouch Tare Weight g 70.4
Weighing Pan Tare Weight g 21 1.3 Bag, Pouch 8 Sample Wf (w.b.). g 165.7
Sample Weight (w.b.), g 89.2 Bag, Pouch B SiHWt, brushed (w.b.). g 76.3 Pan 8 Sample Weight (d.b.). g 300.3 Silt Weight, (w.b.). g 5.9
89.0 Dried Bag, Pouch 8 Sit W t (d.b.). g 73.8
Siltweight (d.b.). g 3.4 Sample Welght (d.b.). g
Pan
(9) 506.9
499.7
7.2
7.79%
%M= wi -wf * I 0 0 w, Percent Moisture Content %M= 2.84%
i
II. Particle Sizing Analysis and Silt Loading
Shaker I Elapsed Collectionpan Pan
SAMPLE MASS COMPARiSlON
Dry sample weight 92.4 Si& sample weight 92.4
0.0 M a x allowable limit is 2% difference, or for this Darticular samde:
7 Net Difference
1 . ~ 4 gms.
PIJ401WBIDATASHTS.XLS 7 r n ?
Total Silt (g) = Filter Silt + Pan Silt
Total Silt. (9) = 10.6
Area swept, m* 229.46
Silt Loading, g/mz 4.62E-02
Silt Fraction, % 0.119101
COMPUTER DATA SHEET

I I I I I I 1 I 1 E I I I I I I I I I
Shaker Elapsed Collection Pan, Pan - Run Number Time (min) Silt Weight, (96) Tare Weight Net
1 5 10 504.7 499.7 5
2 5 10 505 499.7 5.3
3 5 10 505.1 499.7 5.4
A 499.7 -499.7
\
Curb Silt Ayaalysis Data Sheet
Analysis Date: 8/8/97 Bag ID No.: Do21
Collection Location: Evans, St Road 3048 Analyst Frederid
Comments: Between Aviation Pkwy 8 Hwy 54
Note: Curb Sample Area
Change in Silt
Weight (%)
ZERO %
5.66%
1.85%
101.08%
1. Moisture Analysls N e wb. nwbasb. d.b. - dW W
Bag Contents
Final Weight (g)
Tare Weight, (e)
Net Weight, (9)
Wt. Fraction, %
Balance properly zeroed and calibrated:
Filter Bag
No. 20 Sieve No. 200 Sieve Pan
(9) (9) (9) 410.7 350.2 505.1
382.1 304.9 499.7
28.6 45.3 5.4
35.53% 56.27% 6.71%
8/6/97 Date
Combined Pan 8 Sample Weight (w. 301.9 Bag 8 Pouch Tare Weight, g 69.8
Weighing Pan Tare Weight. g 222.6 Bag. Pouch 8 Sample'% (w.b.). 9 153.6
Sample Weight (w.b.). g 79.3 Bag. Pouch 8 SiRWL. brushed (w.b.1. 9 73.9
Combined Pan 8 Sample WI
SAMPLE MASS COMPARISION
Dry sample weight 80.5
-0.4 Sired sample weight 80.9
Max allowable limit is 2% difference. or for this particular sample:
- Net Difference
1.61 gms.
PU401WWATKSHT5.Xffi 7nm7
Total Silt, (g) = Filter Silt + Pan Silt
Total Silt, (9) = 7
Area Swept, mz 18.65
Silt Loading, g/mz 3.75E-01
Silt Fraction, % 0.133843
COMPUTER DATA SHEET

I I I I I I I I I t I I I I I t I I I
Data Sample Collected
Sampling Location
and 4th Stnet) (e& Maple b*Wm 3rd
1. Number of lanes
Data collection sheet
SAMPLING DATA FROM PAVED ROADS (Sample in aFmrdancs with Ap-42. Appendix C.11)
8/7/97 Sample Bag Identifleation Number Do40
us1 Between Neusc River& Burlington Mill Road
Road area zip d e
4 Lane width
2. Surf' type (e.g., asphalt, concrete):
3. Surf' conditions (e.g.. smooth, weathered): smooth
all 4. Vehicle typcs (e.g.. ears, bucks):
5. Estimated daily vehicle W i c load (information available at local DOT): 36.300 a M c a r d or estimated?
6. Description of neighborhood (agricultural. residential. commercial. industrial: commercial
7. Are there conmuction sits within 0.5 miles, or unpaved mad ~cecsses other than residential driveways that would contribute to silt loading? If so, describe the severity of track-out and distance from sample location.
No
8. Dacribc surrounding soil type (e.&. loam. sand, clay ... )
9. Weather Related Information:
clay
a Has it rained in the past 48 hours? (YedNo) b. Har winter weather lraction material been spread on the mad in the part 30 days
c. If so, what type of material (e.!& m d , salt, slag) d. How heavily war it spread? (Ibs/mildlane)
Yes
(YedNo) No
IO. Wcathcr conditions (over the pan 24 hours)(c.d., s m y , windy): sunny, cloudy, rainy
Page I

I I I I 1 I I I I I I I I I I I I I I
Data collection sheet
I I. Road Sample surf= dimensions for this sample
Total- 223.19 m'
12. Curb Sample: Road edge description (c.g.. curbed. ditch): shoulder (r.1). ditch (I)
a Was a curb sample taka ( Y d o ) BAGNo. Do41
Surface dimensions for thii sample. (Use a bmom to collect any large debris and vacuum ak from &side white line to curb. If no curb exists, collect the m p l c h m the curb-side while line on hard paved shoulder surf= Io the beginning of grass or ditch.)
Yes b. If so, Sample Bag Identitiention Num.
T O ~ ~ I A K ~ 132.11 m'
13. Sample Collation Team:
Sample Collection Team Membm Gatewood Okabayashi (Last names) Mullen
Organization Collecting Samples PES Organization Telephone Number (919) 941-0333
Page 2

I I I I I I I I I I I I I I I I I I I
Netweight (9) 14.4
Road Silt Analysis Data Sheet
Analysis Date: 8/12/97 Bag ID No.: D-040
Collection Location: us 1 Analyst Frederid
Comments: Between Neuse River 8
Burilngton Mill Road
82.1 11.2
1. Molsture Analysls Note: w.b. =wlbasia, d.b. = dry bash
Bag Contents
Balance properly zeroed and calibrated:
Filter Bag
0iIZl97 Date
Pan 8 Sample Weight (w.b.). g 326.6 Bag 8 Pouch Tare Weight, g 92.8
Weighing Pan Tare Weight g 218.7 Bag, Pouch B Sample 'A% (w.b.), g 211
Pan 8 Sample Weight (d.b.). g 326.2 Silt Weight (w.b.), g 9.7
Sample Weight (w.b.). g 107.9 Bag. Pouch 8 SIR Wt. brushed (w.b.). 9 102.5
107.5 Dried Bag, Pouch 8 Silt WL (d.b.). g 100.9 SiltWelght (d.b.), g 8.1
%M= wl -wf *goo w, Percent Moisture Content %M= 1.70%
II. Particle Sizing Analysis and Silt Loading
AW= Wn-1,
Total Silt, (9) = Filter Silt + Pan Silt
Total Silt (g) = 19.3
Final Weight (g) 396.8 388.7 510.8
Area swept, m2 223.79
Silt Loading, g/m2 8.82E-02
Silt Fraction, % 0.179201
SAMPLE MASS COMPARISION
Dry sample weight 115.6 Sized sample weight 115.8
Net Difference -0.2 Max allowable limit is 2% difference. or for this particular sample:
2.312 gms.
P:wOlWUTASKTS.XLS 7125187 COMPUTER DATA SHEET

I
No. 20 Sieve
\
Curb Silt A$lysis Data Sheet
No. 200 Sieve Pan
Bag ID No.: Do41 I Analysis Date: 8/12/87 Analyst Frederici Collection Location: us 1
Comments: Batweeen Neuse River 8 Burlington Mill Road
Note: shoulder - right land Ditch- lefl lane
8/12/87
I I 1. MolstureAnalys1s Dste Balance pmperly zeroed and calibrated:
Noto:w.b. =*abash. d.b. I dry bnlh Flker Bag Bag Contents
I Final Weight, (9)
Tare Weight, (9) I Netweight. (9)
WL Fraction. %
Combined Pan 8 Sample Weight (w. 672.5
Weighing Pan Tare Weight. g 21 1.2 Sample Weight (w.b.), g 461.3 I Combined Pan 8 Sample Weight (d. 670.6
Bag 8 Pouch Tare Weight. g
Bag. Pouch 8 Sample Wt, (w.b.1, B
Bag. Pouch 8 Silt WL. brushed (w.b.). 9
Silt Weight, (w.b.). 9
I
(9) (9) (S)
473.3 605.6 568.3
382.3 304.7 499.6
91 300.9 68.7
19.01% 62.66% 14.35%
~~
459.4 ~ r i e d Bag. Pouch 8 Silt WL (d.b.). 9
I Silt Weight (d.b.). 9
I \ A I \ A I
%M= ''1 - '"1 * I00 w, Percent Moisture Content % 0.77% I
1 I I I
91.1
574.6
112.2
21.1
110.4 19.3
_p - /I. Particle Sizing Anaiysls and Silt Loading
Dry sample weight 478.7 sized sample weight 479.9
-1.2 M a x allowable limit is 2% difference or for this particular sample:
- Net Differenw I
Total Silt. (9) = Filter Silt + Pan Silt , Total Silt, (9) = 88 I
Area Swept, m2 132.11
Silt Loading, glm' 6.ffiE-01
Silt Fraction. % 0.226279
p:Y4OlUAB\DATASHTS.xLS 7nm7 I COMPUTER DATA SHEET

I I I I I I I I I I I I I I I I I I I
Data Sample Collected
Sampling Location
and 41h S a a ) (e.g., M a p l C baww 3rd
1. Number of lana
Data collection sheet
SAMPLING DATA FROM PAVED ROADS (Sample in mrdancc with Ap-42. Appendix C.1.2)
7i30t97 Sample Bag IdentifiCnUoa Number D-027
Wade Avenue &hvccn Dogwood & Dixie Trail
4 Lane width
Road area zip wde
Posted W l C speed
2. Surfaatypc(e.g.,asphalt. concrete): asphalt
smooth
both
3. Surface conditions (e.g., smooth, weathered):
4. Vehicle types (e.&. cars, trucks):
5. Estimated daily Vehicle VaAic load (information available at local DOT): 22,000 a Measured or estimated?
6. Description of ncighborhwd (agricultural, midentid, commercial. industrial:
7. h e there conmuction sites within 0.5 miles, or unpaved road accesses other than residential driveways that would contribute to silt loading? If so, describe the severity of kack-out and distance h m sample location.
residential
8, Describe surrounding soil typc (e.& loam, sand, clay ... ) clay
9. Weather Related Information:
a Has it rained in the pa9 48 hours? ( Y m o ) b. Has winter weather traction material been spread on the road in the p a 9 30 days
Yes
(YesMo) No c. If so, what type of material (e.& sand, salt, slag) d. How heavily was it spread? (Ibrlmildane)
IO. Westher conditions (over the pacf 24 hours)(e.d., sunny, windy): partly cloudy
Page 1

I I I I I I I I I I I I I I I I I I I
Data collection sheet
11. Road Sample surface dimensions for this sample
~ o t c : me wmputn will cakulatc the arta Rcpon 5'4' 8s 5.5 It
Total Arca 189.86 ma
12. Curb Sample: Road edge description (e& curbed, ditch): curbed
a Was a curb sample taken (YcvNo) Yes b. If so. Sample Bag Identiflution Num. BAGNo. Do28
Surfacc dimensions for this sample. (Use a broom to collect any large debris and vacuum area from curbside white line to curb. If no curb exists, collect the sample from the curb-sidc white line on hard paved shoulder surface to the beginning of grass or ditch.)
Sample Arca Len& (A) Width (A) Area (m3 I 50.25 1.75 8.16939375 2 0 - n
~~
Note: The computer will &sulate the arm Report 5'4" as 5.5 R
13. Sample Collection Tcam:
Sample Collection Team Members Gatewood White i.L.m names)
Organization Collecting Samples PES Organization Telephone Number (919) 941-0333
Page 2

I I I I I I I I I I 1 I I I I I I I I
No, 20 Slew
(9)
Final Weight (9) 386.1 Tare Weight (g) 2 Net Weight, (9) 4.1
wt Fraction, % 8.78%
Road Silt Analysis Data Sheet
Analysis Date: 8n197 Bag ID No.: DO27
Collection Location: Wade Avenue Analyst Frederid
Comments: Between Dogwood 8 Di ie Trail
No. 200 Sieve Pan
(9) (9) 342.2 503.7
304.7 499.6
37.5 4.1
60.30% 8.78%
1. Moisture Analysis NOW w.b. = viU baa d.b. = dV bash
Bag Contents
Balance propew zeroed and calibrated:
Fllter Bag
Pan 8 Sample Weight (w.b.). g
Weighing Pan Tare Weight g
Sample Weight (w.b.), g
Pan 8 Sample Weight (d.b.1. g
268.4
222.6
45.8
268.2
Bag &.Pouch Tam Weight g
Bag, Pouch 8 Sample Wt (w.b.). g
Bag, Pouch 8 Silt Wt, brushed (w.b.), 9
Silt Weight, (w.b.). g
Dried Bag, Pouch 8 Silt Wt (d.b.). 9
Wi Silt Weight (d.b.), g
Wr
%M= w, -wf *IO0 w, Percent Moisture Content %M= 6.60%
0m97 Date
70
120.1
74.2
4.2
71.1
1.1
SAMPLE MASS COMPARISION
Dry sample weight 46.7
-0.1 sized sample weight 46.8 - Net Difference
P:U401 WEDATASHTS.XLs 7 n w
Max allowable limit is 2% difference, or for this particular sample:
0.934 gms.
Total Silt (9) = Filter Silt + Pan Silt
Total Silt, (9) = 5.2
Area swept m2 189.86
Silt Loading, g/m2 2.74E-02
Silt Fraction, % 0.1 13786
COMPUTER DATA SHEET

I I I 1 I I I I I I I I I I I I I I I
Final Weight. (9)
Tare Weight, (9)
Net Weight, (9)
Wt. Fraction, %
Curb Silt Analysis Data Sheet
No. 20 Sieve No. 200 Sieve Pan
(9) (e) (9) 429.8 421.2 507.5
382 304.8 499.6
47.8 116.6 7.9
27.46% 66.97% 4.54%
Analysis Date: 8/7/97 Bag ID No.: Do28
Collection Location: Wade Avenue Analyst Frederia
Comments: Between Dogwood 8 Di’e Trail
Note: Curb Sample Area
1. Moisture Analysis Note: wb. = wsl baris. d.b. =dry bsslr
Bag Contents
Balance properly z e d and calibrated: en197 Date
Filter Bag
Combined Pan 8 Sample Weight (w. 395.8 Bag 8 Pouch Tare Weight. g 78.3
Sample Weight (w.b.), g 173.4 Bag, Pouch 8 Silt wt., brushed (w.b.). g 80.8
Weighing Pan Tare Weight, g 222.4 Bag. Pouch 8 Sample WT (w.b.). g 254.3
Combined Pan 8 Sample We
- 11. Particle Sizing Analysis and Silt Loading
AW= @+91-wm)*i00 w+,,
Total Silt, (9) = Filter Silt + Pan Silt
Total Silt, (9) = 9.7
Shaker Elapsed Colledion Pan, Pan I Chanoe in Silt
Run Number Time Imin) Silt Weieht. 1%) Tare WeiQ I . .
1 506.7 499.6 I 7.1 I ZER
2 5 10 507.2 I Total Silt, (9) = Filter Silt + Pan Silt 3 5 10 507.5 499.6 I 7.9 I 3.80% I
A 5
SAMPLE MASS COMPARISION
Dly sample weight 174.1 Sued sample weght 174.1
Net Difference 0.0 Max allowable limit is 2% difference, - or for this particular sample:
3.482 gms.
Area Swept, m2 8.17
Silt Loading, g/mz 1.19E+00
Silt Fraction, % 0.078801
. COMPUTER DATASHEET

I I I I I I I I I I I I I I I I I I I
Data Sample Colleaed
Samplii Location (e.&. Maple bnwecn 3rd and 4th Strat)
1. Numberoflancs
Data collection sheet
SAMPLING DATA FROM PAVED ROADS (Sample in acmrdanca with AP42. Append* C.1.Z)
07/37/97 Sample Bag Identification Number D-029
Road area zip code
4 Lane width Posfed M C SpeCd 55
2. Surface type (e.g., asphalt, concrete):
3. Surface conditions (e.&. smooth, wcathmd):
4. Vehicle types (e.g., cam. trucks):
5. Estimated daily vehicle WIC load (information available at Id DOT):
arphalt
smwth
all
16,100 a Measured or cstimatcd?
6. Description of neighborhood (agricultural, residential, commercial, industrial: commercial, residential
7. Are there construction sites within 0.5 milcs, or unpaved road acccDes other than residential driveways that would eontribute to silt loading? If so, dcscribc the severity of track-out and distance from sample location.
No
8. Describe surrounding soil type (e.& loam, sand, clay ... ) loam
9. Weather Related Information:
a Has it rained in the past 48 hours? (YesMo) b. Has winter weather traction material been spread on the road in the past 30 days
Yes
(YcsMo) No c. If so, what type of material (c.g., sand, salt, slag) d. How heavily was it spread? (Ibdmildane)
IO. Weather conditions (over the past 24 hours)(c.d., sunny, windy): windy, sunny, rainy, cloudy
Page I

I I I I I I I I I I I I I I I I I I I
\
Data collection sheet
11. Road Sample surface dimensions for this sample
Note: The w m p m will calculate the ma. Report 5’4’ 89 S.5 A.
Total Area 202.38 m’
shoulder on right and left; ditch on right 12. Curb Sample: Road edge dsaiption (e.&, furbed, ditch):
a Was a curb sample taken (YcsMo) YS b. If so. Sample Bag Identifiation Num. BAGNo. Do30 -
Surface dimensions for this sample. (Use a broom to collect any large debris and vacuum a m from curb-side white line to curb. If no curb exists, collect the sample fmm the curb-sidc white l i e on hard paved shoulder surfacr. to the beginning of grass or ditch.)
I I I . I I I Sample Areal (Length(fi) I IWidth(A) I lkea (m3
I I I 5nl I 1 R 1 l I R50035 . . . -- 2 50 1.75 8.12875 3 50 2. I 9.7545 4 so I .67 7.75715 -.
Note: The wmputcr will calculate the ma Report 5%’ as 5.5 11.
Total Area 34.14 ma
13. Sample Collection Team:
Sample Collection Tam Members Gatcwood Okabayashi (Last names) White
Organization Collecting Samples PES Organization Telephone Number (919) 941-0333
Page 2

I I I I I I I I I I I I I I I I I I I
Road Silt Analysis Data Sheet
Analysis Date: 8/7/97 Bag ID No.: D-029
Collection Location: Hwy 70 Analyst Fredefid
Comments: Between Angier 8 Miami Blvd
1. Moisture Analysis N~~:w.b=wetbssis,d.b.=drybasiS
Bag Contents
Balance properly zeroed and calibrated: 8/7/97 Date
Fllter Bag
Pan 8 Sample Weight (w.b.). g 227.9 Bag 8 Pouch Tare Weight g 75.3
Welghlng Pan Tare Weight g 217.9 Bag, Pouch 8 Sample Wt (w.b.1. g 88.7
Pan 8 Sample Weight (d.b.), g 228.0 Silt Weight (w.b.). g 3.3
Sample Weight (w.b.), g 10.0 Bag, Pouch 8 S i twt . brushed (w.b.1. g 78.6
Dried Bag. Pouch 8 Si l twt (d.b.). g 76.1 Sill Weight (d.b.), g 0.8
WI
%M= WI -Wf *,oo w, Percent Moisture Content %M= 18.05%
Final Weight (g) 384 311.4 501.3
Tare Weight (9) 382.1 304.6 499.6 - -
Welght (9) 1.9 I 6.8 II 1.7 Fraction. % 11.43% I 62.39% 1 1 15.60%
Total Silt (g) = Filter Silt Pan Sit Total Silt (9) = 2.5
Area Swept m2 202.38
Silt Loading, g/m2 1.24E-02
Sit Fraction. % 0.240385
SAMPLE MASS COMPARISION
Dry sample weight 10.9 Sued sample weight 11.2
4.3 Max allowable limit is 2% difference, or for this particular sample:
7 - 0.218 gms.
P:U4OlWIDAlASHTSXLS 7nm7 COMPUTER DATA SHEET

I I I I I I 1 I I I Io I I I I I I I I
Final Weight (g)
Tare Weight, (g)
Net Weight, (g) Wt Fraction, 96
Curb Silt Analysis Data Sheet
Analysis Date: OW0797 Bag ID No.: Po30
Collection Localion: Hwy 70 Analyst
Comments: Between Angier 8 Miami Blvd. Note: Curb Sample Area
1. Moisture Analysis 8aianw properly zemed and calibrated: WE97 N&r.b =ura2bssb,db.-dwbaab Date
Bag Contents Fitter Bag
Combined Pan &Sample Weight (w. 302.0 Bag 8 Pouch Tare Weight, g 76
Walghlng Pan Tare Weight, g 226.5 Bag, Pouch 8 Sample wt. (w.b.). g 159.7
Sample Weight (w.b.). g 75.5 Bag, Pouch 8 Siltwt, brushed (w.b.). g 80.8
~
No. 20 Sieve No. 200 Sieve Pan
(e) (e) (9) 422.7 338.3 504.6
382.1 304.7 499.6
40.6 33.6 5
52.52% 43.47% 6.47%
Combined Pan 8 Sample Weight (d. 300.9 SM Weight. (w.b.), g 4.8
74.4 Dried Bag, Pouch 8 Siltwt (d.b.). g 78.9 WI Siltweight, (d.b.). g 2.9
Wt
%M= -Wf *,(lo w, Percent Moisture Content % 3.74%
- - - Ii. Particle Sizing Analysis and Silt Loadlng
Run Number Time (min) Silt Weight, (%) Tare Weight Net Welght (%)
1 5 10 504 499.6 4.4 ZERO % 2 5 10 504.2 499.6 4.6 4.35%
I O I 504.4 I 499.6 I 4.8 I 4.17%
10 1 504.6 1 499.8 5 I 4.00%
SAMPLE MASS COMPARISION
Dry sample welght 77.3 Sized sample weight 82.1
-4.8 Max allowable limit is 2% difference. or for this oarticular samole:
- Net Differenw
1.546 gms.
Total Silt. (g) = Filtar Silt + Pan Silt
Total Silt, (g) = 7.9
Area swept, m2 34.14
Silt Loading, glm' 2.31E-01
Silt Fraction. % 0.190361
COMPUTER DATA SHEET
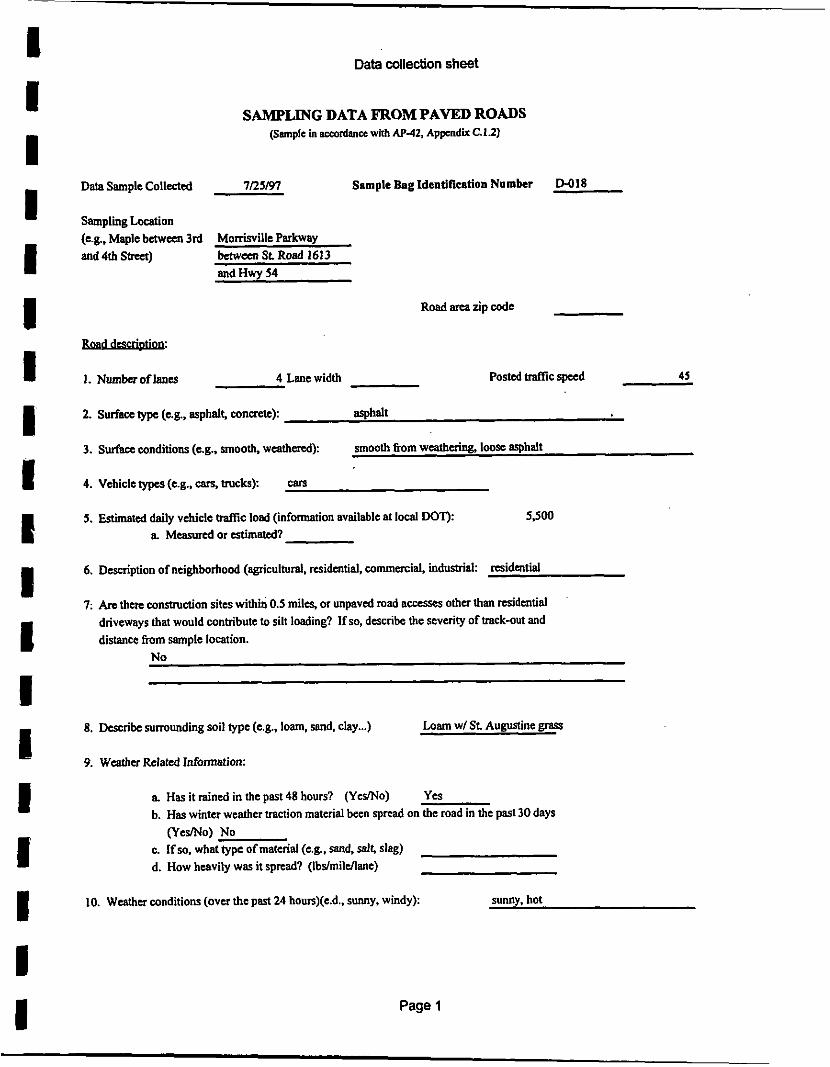
I I I I I I I I I E I I I 1 I I I I I
Data collection sheet
SAMPLING DATA FROM PAVED ROADS (Sample in ascordancc with AP-42, Appendix C.12)
Data Sample Collected 1/23/97 Sample Bag Identification Number Po18
Sampling Loeation (e.&. Maple between 3rd Morrisville Parkway and 4th strca) between S t Road 1613
and Hwy 34
Road arca zip code
4 Lane width Posted traffic spccd 45 1. Numberoflanes
2. Surface type (e.g., asphalt, concrete):
3. Surface conditions (e.&, smooth, weathered):
asphalt
smooth from weathmng, loosc asphalt
4. Vehicle types (e.g., can. trucks): cam
5. Estimated daily vehicle WIC load (information available at local DOT): 5,500 a M d or estimated?
6. Description of neighborhood (agricul~ral, residential, commercial, indumial:
7: Are then construction s i t s within 0.5 miles, or unpaved mad accsscs other than residential driveways that would contribute to silt loading? If so, describe the severity of track-out and distance from sample location.
residential
8. Dcscribc surrounding soil type (e.g.. loam, sand. clay ... ) Loam w/ St. Augustine grass
9. Weather Related Information:
a Has it rained in the past 48 hours? (YesMo) b. Has winter weather traction material been spread on the mad in the past 30 days
Yes
(YcSMo) No c. If so. what type of material (e.g., sand, sals slag) d. How heavily was it spread? (Ibdmildane)
IO. Weather conditions (over the pUt 24 houn)(e.d.. sunny, windy): sunny, hot
Page I

Data collection sheet
11. Road Sample surface dimensions for this Sample
TotalArea 212.86 ma
curbed 12. Curb Sample: Road edge description (e.& curbed, ditch):
a Was a curb sample taken WsMo) b. If so. Sample Bag ldentificltion Nom. BAGNo. Do19
Surface dimensions for this sample. (Use a broom to collect any large debris and vacuum area h m curbside white line to curb. If no curb exists. colkct the sample from the curbside white line on hard paved shoulder surface to the beginning of grass or ditch.)
Note: me computer will calculate the ma. Report 5%" as 5.5 A.
~ o t a l ~ n a 28.10 ma
13; Sample Collection Tcam:
Sample Collection Team Members Okabayashi Gatwood (Last names) Grable
Organization Collecting Samples PES Organization Telephone Number (919) 941-0333
Page 2
i

Road Silt Analysis Data Sheet I
Analysis Date: 6/6/97 Bag ID No.: D-018
Collection Locabion: Monisville Pkwy Analyst Frederid
between St Road 1663 8 Hwy 54
1 1. Moisture Analysis NOW w.b. =vet baais. d.b. = dv basir
Bag Contents
Balance properly zeroed and calibrated: 8/6/97 Date
Fllter Bag
1 Pan 8 Sample Weight (w.b.). g Weighing Pan Tare Weight g
Sample Weight (w.b.). g
Pan 8 Sample Weight (d.b.), g
444.9 222.6
222.3
444.5
Bag 8 Pouch Tare Weight g
Bag. Pouch 8 Sample W'(w.b.). g
Bag. Pouch 8 Silt Wt. brushed (w.b.). g
Silt Weight (w.b.). g
Dried Bag. Pouch 8 Silt Wt (d.b.), g I Silt Weight (d.b.), g
1 Percent Molsture Content %M= %M= wl-wf * loo
w, 1.35%
70.5
299.7
77.1
6.8
74.4
3.9
1, '11. Partlcle Sizing Analysis and Silt Loading
AW = Po-~~-wm)*,oo ww,
Total Silt (9) = Filter Silt + Pan Silt
Total Silt (9) = 16.6
NO. 20 Sieve No. 200 Sieve Pan i I (9) (9) (9)
Final Weight (9) 448.3 447.5 I 512.4 - Tare Weight (9) 381.7 304.7 499.7
Net Weight (9) 66.6 1 142.8 I I 12.1
Wt. Fraction. % 29.50% I 63.24% 1 1 5.62%
SAMPLE MASS COMPARISION
D I ~ sample weight 225.8
-0.2 I sized sample weight 228.0
Max allowable limit is 2% difference, or for thls particular sample:
- Net Difference I
4.516 gms. I
h a swept, m2 212.86
sin Loading, g/m2 7.80E-02
Silt Fraction, % 0.074741
p:U401WIDATASHTS.XLS 7t2307 I . .
COMPUTER DATA SHEET

I
1 :
\
Curb Silt Ahalysis Data Sheet
4 Run Number Time (mln) Silt Weight (%) Tare Weight Net Weight. (%) cN,-t,-w~~J*,oo AW= 1 5 t o 527.3 499.7 27.6 ZERO% w,-,,
5 10 529.2 499.7 29.5 6.44%
5 10 530.8 499.7 31.1 5.14% Total Silt. (9) = Filter Silt + Pan Sill
10 532.2 499.7 32.5 4.31% Total Silt. (9) = 38.3 4 5
Analysis Date: 8/8/97 Bag ID No.: Do19
Colledion Location: Monisville Pkwy Analyst
Comments:
1 batween St. Road 1613 8 lby 54 I Note: Curb sample area
No. 20 Sieve No. 200 Sieva
(9) (9)
Tare Weight, (9) 361.6 304.7
IF
I WtFradon,% ’38.11% 55.49%
] Final Weight, (g) 605.8 630.6
Net Weight (9) 224 326.1
1 1. MolstumAnalysis W r . b . -\rat bad%. d.b. dV buh
Bag Contents
Pan h a swept. m’ 28.10
(Q) 532.2 Silt Loading. glm’ 1.36E+00
499.7
32.5 Silt Fradion, % 0.105104
5.53%
Balance properly r e m and calibrated: em97 Date
Filter Bag
Combined Pan 8 Sample Weight (w. 806.9 Bag 8 Pouch Tare Weight. g 70.8
Weighing Pan Tare Weight g 222.4 Bag, Pouch 8 Sample Wt. (w.b.). g 664 1 1 Combined Pan 8 Sample Weight (d. 804.3 Silt Weight. (w.b.). g 8.4
Sample Weight (w.b.). g 584.5 Bag, Pouch 8 Silt WL. brushed (w.b.). g 79.2
Dried Beg, Pouch 8 Silt Wt (d.b.). g 76.6 wi Silt Waighf (d.b.). g 5.8
Wf I 1 Panerd Moisture Content % 0.88%
%M= wI-wf * loo w,
I Shaker I ElaDSed I Collection Pan. I Pan 1 Change in Silt I
1 SAMPLE MASS COMPARlSlON
Dly sample weight 587.7 I Sued sample weight 588.4 4 .7 Max allowable limit is 2% diffemnce.
or for this particular sample: - Net Diffirenca
I I
11.751 gms.
COMPUTER DATA SHEET

I 1 I I I 1 i 1 I I t I 1 I I I I I I
Data collection sheet
SAMPLING DATA FROM PAVED ROADS (Sample in accordance with AP-42, Appendix C.12)
Data Sample Collected 7/21/97 Sample Bag Identifleation Number D-014
(e.g., Maple between 3rd S. Miami Blvd and 4th Shut ) bctwan Alexander and
Comwallii
Road arca zip code
1. Number of lans 4Lnnewidth 11'+9" Postcd m c sped 45 mph
2. Surface type (c.g., asphalt, concrete): asphalt
3. Surface conditions(e.g., smooth, weathered): smooth
4. Vehicle types (e&, can, trucks): all
q. Estimated daily vehicle traffic load (information available at local DOT): 15,600 a M d or estimated?
6. Description of neighborhood (agriculhlral, residential, commercial, industrial:
7. Are thac construction s i t s within 0.5 m i l a or unpaved mad BCM~S other than residential driveways that would contribure to silt loading? If so, dexribe the severity of track-out and distance fmm sample location.
heterogeneous
No
8. Describe surrounding soil type (e.g., loam. sand, clay ... ) loam
9. Weather Related Information:
a Has it rained in the past 48 hours? b. Has winter weather traction material been spread on the road in the past 30 days
c. If so. what typc of material (e.g., sand, sals slag) d. How heavily was it spread? (Ibu'mildkne)
(YesMo) No
C r r n O )
10. Weather conditions (over the past 24 houn)(e.d.. sunny, windy): sunny, hot
Page I

1 I 1 1 I I I 1 I I I I I I P I I I I
Data collection sheet
11. Road Snmpk surface dimensions for this sample
Note: The computer will calculate the am. Repon 5’4’ as 5.5 R
Total Area 215.20 mz
eurbcd (I), turning lane (I) 12. Curb Sample: Road edge dcsaiption (e& curbed, ditch):
a Was a curb sample taken (YWNo) b. If so, Snmplc Bag Identification Num. BAGNo. Do13
Surface d m w i o n s for this sample. (Use a b m m to collect any large debris and vacuum area from curb-side white line to curb. If no curb exists. collect the sample from the curb-side white line on hard paved shoulder surface to the beginning of grass or ditch.)
Notc: The computer will calculatc the ma Rcpon 5’4’ 8s 5.5 R
Total Area 15.47 m2
13. Sample Collcaion Team:
sample Collection Team Members Mullen (Last names) Okabayashi
Organization Collecting Samples PES Organization Telephone Number (919) 9416333
Page 2

1
1 E '
Road Silt Analysis Data Sheet
Shaker Elapsed Collection Pan Pan Change in Silt
Run Number Tima (min) 8 Silt Weight ITare Weight Weight (%)
5 10 514.3 I I 499.6 I 14.7 ZERO%
I Analysis Date: 8/11/97 Bag ID No.: Do14
Coliedion Location: South Miami Blvd Analyst Frederid
Comments: between Cornwailis 8 Alexander
1 2
1 1. MoistureAnalysis Note: w.b. = Wa basis. d.b. 5 dry basis
Bag Contents
5 1 10 I 516.7 I I 499.6 I 17.1 14.04%
5 10 514.6 1499.6 15 -14.00% 3
-
4 Pan 8 Sample Weight (w.b.). g 480.8
293.4
167.4
459.7
Weighing Pan Tare Weight g I Sample Weight (w.b.). g
Pan 8 Sample Weight (d.b.), g
I (9) Final Weight (g) 442.5 Tare Weight (g) 381.8
Net Weight (g) 60.7 - I
Balance properly zemed and calibrated: 8/11/97 Date
Fllter Bag
(9) (S) 394.2 515.3
304.6 499.6
89.4 15.7
51.86% 9.11%
Bag 8 Pouch Tare Weight g
Bag, Pouch B Sample wt. (w.b.). g
70.8
247.7
80.1 Bag, Pouch 8 Silt wt, brushed (w.b.), g
Silt Weight (w.b.). g 9.3
166.3 Dried Bag. Pouch 8 Si i twt (d.b.). g 78.9
WI Silt Weight (d.b.). g 6.1
Wr
%M= wl -wf * l oo Wl 2.43%
I '11. Particle Sizing Analysis and Silt Loading
10 I 515.3 I I 499.6 I 15.7 I 4.46% 14 I I
No. 20 Sieve No. 200 Sieve Pan
- SAMPLE MASS COMPARISION
Dry sample weight 172.4 Ci7-d sampie weight
rlet Difference I 171.9
0.5 Max allowable limit is 2% difference, or for this particular sample:
- 3.446 gms.
AW
Total Silt, (9) = Filter Silt + Pan SUI Total Silt (9) = 21.6
Area wept. mz 215.20
Sill Loading, glm' I.OlE-01
Silt Fraction, % 0.131484
COMPUTER DATASHEET

1 I I I I B 1 1 I 1 I I I I I I I ID E
Shaker Elapsed Collection Pan, Pan Change in Silt
Run Number Time (min) Silt Weight (96) Tare Weight Weight (%)
1 585.9 499.6 I 86.3 ZERO%
Curb Silt Analysis Data Sheet
aw= Wo-1,
Analysis Date: Wl1197 Bag ID No.: Do15
Collection Locatio S. Miami Blvd Analyst Frederid
Comments: Leff side curb area unsafe. Sample not recovered for that side Of the mad.
1. Moisture Analysis Balance properly zeroed and calibrated: Nolo: w.b. = Va bntf.. d.b = dry !xds Date
Bag Contents Filter Bag
Combined Pan 8 Sample Weight (w. 1141.2 Bag 8 Pouch Tare Weight, g 11.4
Weighing Pan Tare Weight, g 295.5 Bag. Pouch 8 Sample Wt (w.b.), g 925.4
Sample Weight (w.b.), g 845.7 Bag, Pouch 8 Silt Wt.. brushed (w.b.). g 18.2 Combined Pan 8 Sample Weight (d. 1140.1 Silt Weight, (w.b.). g 6.8
2
3 4
Dried Bag, Pouch 8 Silt Wt (d.b.). g 11.4 W! Silt Weight, (d.b.). g 6
Wf
%M= wi -Wf *,oo w, Percent Moisture Content % 0.22%
591.8 499.6 92.2 6.40% 499.6 499.6 118.45% Total Silt. (9) = Filter Silt + Pan Silt
499.6 499.6 O.W% Total Silt. (g) = 62
- /I. ParUcle Sizing Analysis and Silt Loading
No. 20 Sieve No. 200 Sieve Pan
(0) (a) (9) Final Weight. (9) 673.6 798.9 555.6 -.
Y W e i g h t , (g) I 382.8 I I 4; I Net Weight. (9) 290.8
.Fraction, % 134.19% I 57.87% I 6.58% I
SAMPLE MASS COMPARISION
Dry sample weight 850.6 Sized sample weight 895.0
Net Difference 5.6 Max allowable limit is 2% difference, or for lhis particular sample:
17.012 gms.
P:U401\UBU)ATASHT5.XLS 7/29/87
Area swept, m2 15.47
Silt Loading, g/mz 4.01E+00
Silt Fraction, % 0.1 11813
COMPUTER DATA SHEET

1 Road Silt Analysls Data Sheet
1 AnalysisDate: WE97 Bag ID No.: D-031
Collection Location: Creedmore Anabst Frededa
Comments: Between Hwy 70 8 Millwood
Shaker Elapsed
Run Number Tima (min)
1 5 10
2 5 10
3 5 10
4 5 10
I I b I I I 1 I I I 1 I I I I I
Collection Pan Pan
8 Siltweight Tare Weight
503.2 499.8
503.4 499.8
503.6 499.8
503.6 499.8
1. Moisture Analysis N-: w.b. = wel basls. d.b. = dry basls
Bag Contents
No, 20 Sieve No. 200 Sieve
(9) (9)
Balance properly zeroed and calibrated: wl97 Date
Fllter Bag
Pan
(9)
Pan 8 Sample Weight (w.b.), g 260.9 Bag 8 Pouch Tare Weight g 92.1
Weighing Pan Tare Weight g 218.6 Bag, Pouch 8 Sample Wf. (w.b.), g 136
Sample Weight (w.b.). g Pan &Sample Welght (d.b.). g 260.8 Silt Weight (w.b.). g
42.3 Bag, Pouch 8 SiltW. brushed (w.b.). g
Dried Bag, Pouch 8 Silt Wt (d.b.). g Q8.1 wi Silt Weight (d.b.), g 4
Wr
%M= Wi -W, * l o o Wi Percent Moisture Content, %M= -33.91%
- 11. ParUcle Sizing Analysis and Silt Loading
Final Weight. (g) 381
INet Weight, (g) = W t Fraction, % -2.38% 76.62% 8.23%
Tare Weight, (9) 382.1 499.8
Change in Silt f wh;hIl
1 3.6 5.56%
5.26%
0.00%
SAMPLE MASS COMPARISION
Dry sample weight 46.2 Sized sample weight 42.1
4.1 Max allowable limit is 2% difference, or for this particular sample:
- Net Difference
0.924 gms.
cN,l-l, AW= w,i-1,
Total Silt, (9) = Filter Silt + Pan SI Total Silt, (9) = 7.8
Area wept , m2 189.46
Silt Loading, g/m2 4.12E-02
Silt Fraction, % 0.204724
COMPUTER DATA SHEET

Curb Silt Analysis Data Sheet I 6/7/97 Bag ID No.: Do32
Collection Location: CreedmOrn Analyst Fraderid
Between Hwy 709 8 Miihvod
Note: Curb Area Sample
1 1. MoistureAnalys& Balance properly zeroed and calibrated: 6/7/97 Note: w.b. - wal basis, d.b - d q biub
Bag Contents
330.0 J Bag 8 Pouch Tare Weight, g
211.2 J Weighing Pan Tare Weight. g
I Combined Pan 8 Sample Weight (w.
Sample Weight (w.b.), g 1m.e , Bag, Pouch 8 Silt Wt, brushed (w.b.). g
Bag, Pouch 8 Sample Wt (w.b.), g
Combined Pan 8 Sample Weight (d. 329.5 I 3‘’ Silt Weight, (w.b.). g -6.7
Final Weight (9)
Tare Weight, (e)
Net Weight, (9)
Wt. Fraction, %
Dried Bag, Pouch 8 Silt Wt (d.b.). g 91.5 Silt Weight, (d.b.), g 5 I
1 Peroent Moisturn Content % -9.99% %M= wi-wf *IO0
w,
(9) (e) (a) 424.3 365.4 509
382.2 304.8 499.8
42.1 60.6 9.2
34.14% 49.15% 7.46%
AW= Wn-1,
I I Total Silt, (g) 1 Filter Silt + Pan Silt
Total SiR. (9) = 14.2 I
I I I SAMPLE MASS COMPARISION
Dry sample weight 123.3 I sired sample weight 116.9 6.4 Max allowable limit is 2% difference.
or for this particular sample: - Net Oifferenm
2.465 gms.
Area swept, m’ 23.81
Silt Loading, g/m’ 5.96E-01
Silt Fraction. X 0.18984
I COMPUTER DATA SHEET

I I I I I n I 1 I I I I I I I I I I
APPENDIX J
Regression Analysis Line Plots of Dependent and Independent Variables

I I 1 I I (D
I I I 1 I I I I I I I I I
The following four pages are regression line plots of road silt samples collected by PES.
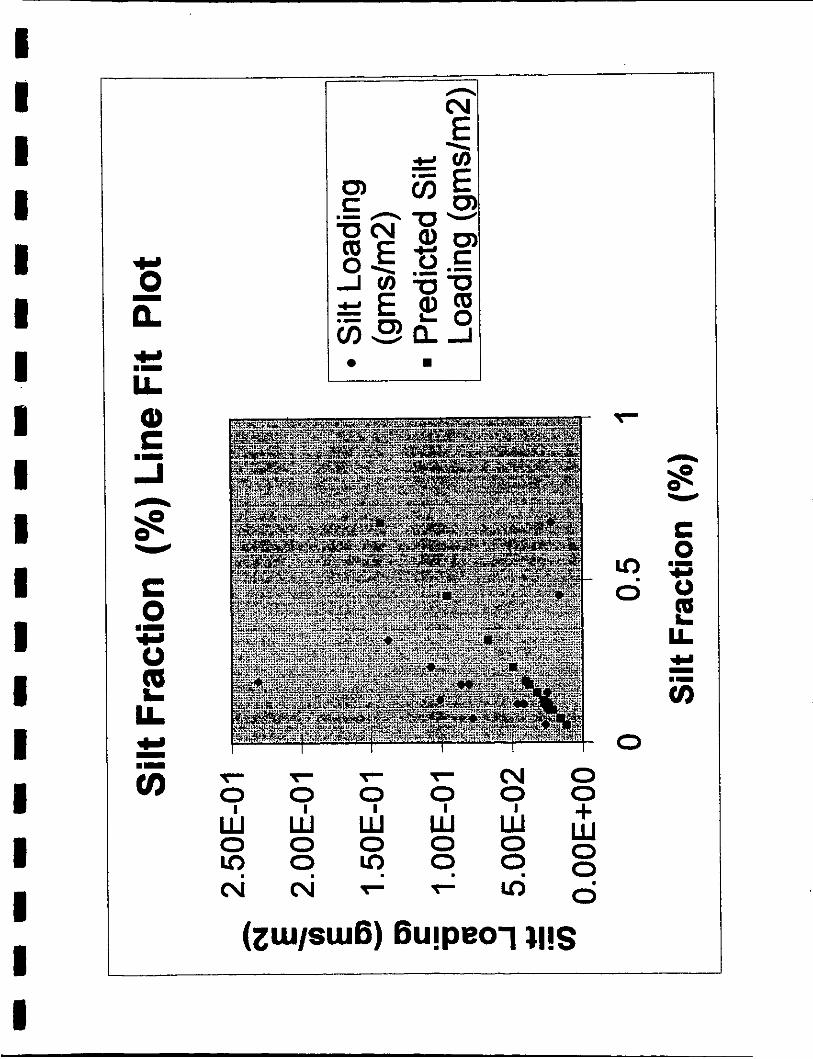
I I I I I I I I I I I I I I I I I I I
0 I
uj 0 m
0 I
uj 0 0
?
I 0 w 0
?
0 I
N 0
0 0 w
0 0 + W 0 0
0

I I I I I I I I I I I I I I I I I I I
CI 0 - e
I-
0 0 F
0 Ln
0 F r Y ? N 0 0 0 0 0 0 0 w 0 Ln c i
w 0 0
w 0 Lo Y
w 0 0 r
w 0 0 lo
+ w 0 0 0

I I I I I I I 1 I I I I I I I I I I I
s E
0 co
0 d-
0 cv
0 Y T T T cv 0 0 lil 0 m
0
0 0 lil
0
0 u)
lil 0
0 0 w
0
0 0 ilcl
0 + W 0 0
N cv v T - 0

I I I 1 I I I I I I I I I I I I I I I
Q rn 0 J 0 E
'EI Q) c,
m- z c, v) W
Ki E
I I I I I I
\ \ \ . r c v o 0 0 0 0 0 0 W & W W W & 0 0 0 0 0 ~ m o m 0 0 0
0 0
CL) 0- O
0 0 do d- 0 0
cv do
0

I I I I I I I I I I I I I 1 I I I I 1
The following four pages are regression line plots of curb silt samples collected by PES.

I I I I I I I I I I I I I I I I I I I
c, 0 e c, 8-
0 0
cc) do 0 n U
o o * 0
cv O O 0-
0 0 0 0 0 0 0 0 0 0 0 0 0 + + + + + + w w w w w w 0 0 0 0 0 0 0 0 0 0 0 0

I I I I I I I I I I I I I I I I I I I
i3 S
rn
0 0 0 0 0 0 0 0 ~ 0 0000000000
ulr& + + c , j c 4 c \ j c \ j 4 T 4 0
+ + + + + + + + w w w w w w w w 00000000 m o m o m o m o 00 00

I I I I I I I I I I I I I I I I I I I
c, 0 - e
O 0 + w 0 rc)
0 0 + W 0 0
cv E
rn
0 0 cv
0 0 + W 0 rc)
0 0 + W 0 0
0 0 + w 0
0 0 + W 0 0
0 c
0 0 0 + W 0 rc)
0 0 + W 0 0
0 uj 0 0
0 0 + w 0 0

I ~-
I I I I I I I I I I I I I I I I I I I -
0 0 + W 0 u3 .cs:
0 0 + W 0 0 +
0 0 + W 0 lo c.j
0 0 + W 0 0 c.j
00 00 + + w w 00 loo
0 0 + W 0 0 'c-
0 0 + W 0 0 v
Y 0
0 0 w
uj
0 0 + W 0 0 0
CD 0
v 0
N 0
0