AP42 Section 11.12 Concrete Batching - edited February 2011
14
6/06 11.12-1 11.12 Concrete Batching 11.12.1 Process Description 1-5 Concrete is composed essentially of water, cement, sand (fine aggregate) and coarse aggregate. Coarse aggregate may consist of gravel, crushed stone or iron blast furnace slag. Some specialty aggregate products could be either heavyweight aggregate (of barite, magnetite, limonite, ilmenite, iron or steel) or lightweight aggregate (with sintered clay, shale, slate, diatomaceous shale, perlite, vermiculite, slag pumice, cinders, or sintered fly ash). Supplementary cementitious materials, also called mineral admixtures or pozzolan minerals may be added to make the concrete mixtures more economical, reduce permeability, increase strength, or influence other concrete properties. Typical examples are natural pozzolans, fly ash, ground granulated blast-furnace slag, and silica fume, which can be used individually with portland or blended cement or in different combinations. Chemical admixtures are usually liquid ingredients that are added to concrete to entrain air, reduce the water required to reach a required slump, retard or accelerate the setting rate, to make the concrete more flowable or other more specialized functions. Approximately 75 percent of the U.S. concrete manufactured is produced at plants that store, convey, measure and discharge these constituents into trucks for transport to a job site. At most of these plants, sand, aggregate, cement and water are all gravity fed from the weight hopper into the mixer trucks. The concrete is mixed on the way to the site where the concrete is to be poured. At some of these plants, the concrete may also be manufactured in a central mix drum and transferred to a transport truck. Most of the remaining concrete manufactured are products cast in a factory setting. Precast products range from concrete bricks and paving stones to bridge girders, structural components, and panels for cladding. Concrete masonry, another type of manufactured concrete, may be best known for its conventional 8 x 8 x 16-inch block. In a few cases concrete is dry batched or prepared at a building construction site. Figure 11.12-1 is a generalized process diagram for concrete batching. The raw materials can be delivered to a plant by rail, truck or barge. The cement is transferred to elevated storage silos pneumatically or by bucket elevator. The sand and coarse aggregate are transferred to elevated bins by front end loader, clam shell crane, belt conveyor, or bucket elevator. From these elevated bins, the constituents are fed by gravity or screw conveyor to weigh hoppers, which combine the proper amounts of each material. 11.12.2 Emissions and Controls 6-8 Particulate matter, consisting primarily of cement and pozzolan dust but including some aggregate and sand dust emissions, is the primary pollutant of concern. In addition, there are emissions of metals that are associated with this particulate matter. All but one of the emission points are fugitive in nature. The only point sources are the transfer of cement and pozzolan material to silos, and these are usually vented to a fabric filter or “sock”. Fugitive sources include the transfer of sand and aggregate, truck loading, mixer loading, vehicle traffic, and wind erosion from sand and aggregate storage piles. The amount of fugitive emissions generated during the transfer of sand and aggregate depends primarily on the surface moisture content of these materials. The extent of fugitive emission control varies widely from plant to plant. Particulate emission factors for concrete batching are give in Tables 11.12-1 and 11.12-2.
Transcript of AP42 Section 11.12 Concrete Batching - edited February 2011
6/06 11.12-1
11.12 Concrete Batching 11.12.1 Process Description 1-5
Concrete is composed essentially of water, cement, sand (fine aggregate) and coarse aggregate. Coarse aggregate may consist of gravel, crushed stone or iron blast furnace slag. Some specialty aggregate products could be either heavyweight aggregate (of barite, magnetite, limonite, ilmenite, iron or steel) or lightweight aggregate (with sintered clay, shale, slate, diatomaceous shale, perlite, vermiculite, slag pumice, cinders, or sintered fly ash). Supplementary cementitious materials, also called mineral admixtures or pozzolan minerals may be added to make the concrete mixtures more economical, reduce permeability, increase strength, or influence other concrete properties. Typical examples are natural pozzolans, fly ash, ground granulated blast-furnace slag, and silica fume, which can be used individually with portland or blended cement or in different combinations. Chemical admixtures are usually liquid ingredients that are added to concrete to entrain air, reduce the water required to reach a required slump, retard or accelerate the setting rate, to make the concrete more flowable or other more specialized functions.
Approximately 75 percent of the U.S. concrete manufactured is produced at plants that store, convey, measure and discharge these constituents into trucks for transport to a job site. At most of these plants, sand, aggregate, cement and water are all gravity fed from the weight hopper into the mixer trucks. The concrete is mixed on the way to the site where the concrete is to be poured. At some of these plants, the concrete may also be manufactured in a central mix drum and transferred to a transport truck. Most of the remaining concrete manufactured are products cast in a factory setting. Precast products range from concrete bricks and paving stones to bridge girders, structural components, and panels for cladding. Concrete masonry, another type of manufactured concrete, may be best known for its conventional 8 x 8 x 16-inch block. In a few cases concrete is dry batched or prepared at a building construction site. Figure 11.12-1 is a generalized process diagram for concrete batching.
The raw materials can be delivered to a plant by rail, truck or barge. The cement is transferred to elevated storage silos pneumatically or by bucket elevator. The sand and coarse aggregate are transferred to elevated bins by front end loader, clam shell crane, belt conveyor, or bucket elevator. From these elevated bins, the constituents are fed by gravity or screw conveyor to weigh hoppers, which combine the proper amounts of each material.
11.12.2 Emissions and Controls 6-8 Particulate matter, consisting primarily of cement and pozzolan dust but including some aggregate and sand dust emissions, is the primary pollutant of concern. In addition, there are emissions of metals that are associated with this particulate matter. All but one of the emission points are fugitive in nature. The only point sources are the transfer of cement and pozzolan material to silos, and these are usually vented to a fabric filter or “sock”. Fugitive sources include the transfer of sand and aggregate, truck loading, mixer loading, vehicle traffic, and wind erosion from sand and aggregate storage piles. The amount of fugitive emissions generated during the transfer of sand and aggregate depends primarily on the surface moisture content of these materials. The extent of fugitive emission control varies widely from plant to plant. Particulate emission factors for concrete batching are give in Tables 11.12-1 and 11.12-2.
11.12-2 6/06
Types of controls used may include water sprays, enclosures, hoods, curtains, shrouds, movable and telescoping chutes, central duct collection systems, and the like. A major source of potential emissions, the movement of heavy trucks over unpaved or dusty surfaces in and around the plant, can be controlled by good maintenance and wetting of the road surface.
Predictive equations that allow for emission factor adjustment based on plant specific conditions are given in the Background Document for Chapter 11.12 and Chapter 13. Whenever plant specific data are available, they should be used with these predictive equations (e.g. Equations 11.12-1 through 11.12-3) in lieu of the general fugitive emission factors presented in Table 11.12-1, 11.12-2, and 11.12-5 through11.12-8 in order to adjust to site specific conditions, such as moisture levels and localized wind speeds.
11.12.3 Updates since the 5th Edition.
October 2001
– This major revision of the section replaced emissions factors based upon engineering judgment and poorly documented and performed source test reports with emissions tests conducted at modern operating truck mix and central mix facilities. Emissions factors for both total PM and total PM10 were developed from this test data.
June 2006
– This revision of the section supplemented the two source tests with several additional source tests of central mix and truck mix facilities. The measurement of the capture efficiency, local wind speed and fines material moisture level was improved over the previous two source tests. In addition to quantifying total PM and PM10, PM2.5 emissions were quantified at all of the facilities. Single value emissions factors for truck mix and central mix operations were revised using all of the data. Additionally, parameterized emissions factor equations using local wind speed and fines material moisture content were developed from the newer data.
February 2011 – This is an editorial revision of the section. Emissions factors in Tables 11.12-1, 11.12-2, 11.12-7 and 11.12-8 were corrected to agree with the emissions factors presented in the background report.
August 2011 - Equation 11.12-2 was corrected. An explanation was added under the equation. January 2012 - This is an editorial revision of the section. Emissions factors for Uncontrolled factors in Table 11.12-3 for Total PM, PM10 and PM10-2.5 were corrected to agree with the emissions factors presented in Table 11.12-2 and the emissions factors presented in the background report.

6/06
11.12-3
Figure 11.12-1. Typical C
oncrete Batching Process.

11.12-4
6/06
Emission Factor Rating
D
E
B
B
Total PM10
ND
ND
0.00017
0.0024
ND
0.0028 or Eqn. 11.12-1
0.0131 or Eqn. 11.12-1
Emission Factor Rating
D
D
B
B
Controlled
Total PM
ND
ND
0.00050
0.0045
ND
0.0092 or Eqn. 11.12-1
0.049 or Eqn. 11.12-1
Emission Factor Rating
D
D
E
E
D
B
B
Total PM10
0.0017
0.00051
0.24
0.65
0.0013
0.078 or Eqn. 11.12-1
0.155
Emission Factor Rating
D
D
E
E
D
B
B
Uncontrolled
Total PM
0.0035
0.0011
0.36
1.57
0.0026
0.286 or Eqn. 11.12-1
0.559
See AP-42 Section 13.2.1, Paved Roads
See AP-42 Section 13.2.2, Unpaved Roads
See AP-42 Section 13.2.5, Industrial Wind Erosion
TABLE 11.12-1 (METRIC UNITS) EMISSION FACTORS FOR CONCRETE BATCHING a
Source (SCC)
Aggregate transfer b (3-05-011-04,-21,23)
Sand transfer b (3-05-011-05,22,24)
Cement unloading to elevated storage silo (pneumatic)c (3-05-011-07)
Cement supplement unloading to elevated storage silo (pneumatic)d (3-05-011-17)
Weigh hopper loading e (3-05-011-08)
Mixer loading (central mix)f (3-05-011-09)
Truck loading (truck mix)g (3-05-011-10)
Vehicle traffic (paved roads)
Vehicle traffic (unpaved roads)
Wind erosion from aggregate and sand storage piles

6/06 11.12-5
ND = No data a All emission factors are in kg of pollutant per Mg of material loaded unless noted otherwise. Loaded material includes course aggregate, sand, cement, cement supplement and the surface moisture associated with these materials. The average material composition of concrete batches presented in references 9 and 10 was 846 kg course aggregate, 648 kg sand, 223 kg cement and 33kg cement supplement. Approximately 75 liters of water was added to this solid material to produce 1826 kg of concrete. b Reference 9 and 10. Emission factors are based upon an equation from AP-42, section 13.2.4 Aggregate Handling And Storage Piles, equation 1 with kPM-10 =.35, kPM = .74, U = 10mph, Maggregate =1.77%, and Msand = 4.17%. These moisture contents of the materials (Maggregate and Msand) are the averages of the values obtained from Reference 9 and Reference 10. c The uncontrolled PM & PM-10 emission factors were developed from Reference 9. The controlled emission factor for PM was developed from References 9, 10, 11, and 12. The controlled emission factor for PM-10 was developed from References 9 and 10. d The controlled PM emission factor was developed from Reference 10 and Reference 12, whereas the controlled PM-10 emission factor was developed from only Reference 10. e Emission factors were developed by using the AP-42 Section 13.2.4, Aggregate and Sand Transfer Emission Factors in conjunction with the ratio of aggregate and sand used in an average yard3 of concrete. The unit for these emission factors is kg of pollutant per Mg of aggregate and sand. f References 9, 10, and 14. The emission factor units are kg of pollutant per Mg of cement and cement supplement. The general factor is the arithmetic mean of all test data. g Reference 9, 10, and 14. The emission factor units are kg of pollutant per Mg of cement and cement supplement. The general factor is the arithmetic mean of all test data.
11.12-6
6/06
Emission Factor Rating
D
E
B
B
Total PM10
ND
ND
0.00034
0.0049
ND
0.0055 or Eqn. 11.12-1
0.0263 or Eqn. 11.12-1
Emission Factor Rating
D
D
B
B
Controlled
Total PM
ND
ND
0.00099
0.0089
ND
0.0184 or Eqn. 11.12-1
0.098 or Eqn. 11.12-1
Emission Factor Rating
D
D
E
E
D
B
B
Total PM10
0.0033
0.00099
0.47
1.10
0.0028
0.156 or Eqn. 11.12-1
0.310
Emission Factor Rating
D
D
E
E
D
B
B
Uncontrolled
Total PM
0.0069
0.0021
0.73
3.14
0.0048
0.572 or Eqn. 11.12-1
1.118
See AP-42 Section 13.2.1, Paved Roads
See AP-42 Section 13.2.2, Unpaved Roads
See AP-42 Section 13.2.5, Industrial Wind Erosion
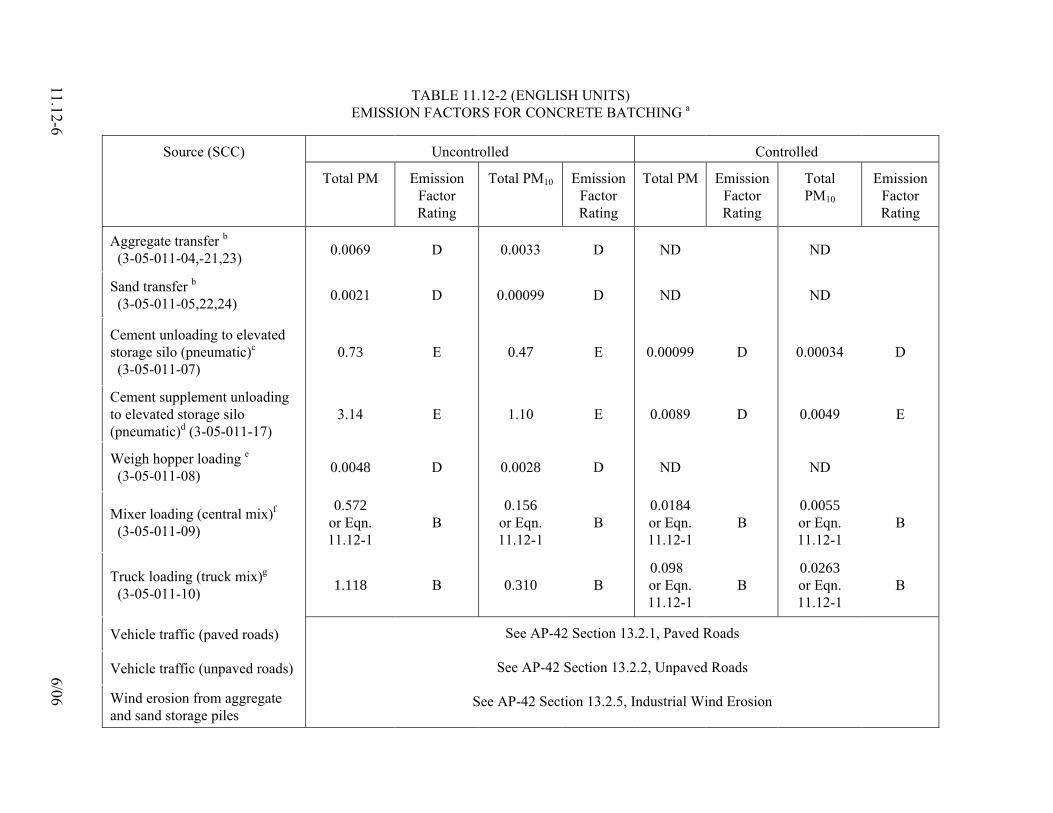
TABLE 11.12-2 (ENGLISH UNITS) EMISSION FACTORS FOR CONCRETE BATCHING a
Source (SCC)
Aggregate transfer b (3-05-011-04,-21,23)
Sand transfer b (3-05-011-05,22,24)
Cement unloading to elevated storage silo (pneumatic)c (3-05-011-07)
Cement supplement unloading to elevated storage silo (pneumatic)d (3-05-011-17)
Weigh hopper loading e (3-05-011-08)
Mixer loading (central mix)f (3-05-011-09)
Truck loading (truck mix)g (3-05-011-10)
Vehicle traffic (paved roads)
Vehicle traffic (unpaved roads)
Wind erosion from aggregate and sand storage piles

6/06 11.12-7
ND = No data a All emission factors are in lb of pollutant per ton of material loaded unless noted otherwise. Loaded material includes course aggregate, sand, cement, cement supplement and the surface moisture associated with these materials. The average material composition of concrete batches presented in references 9 and 10 was 1865 lbs course aggregate, 1428 lbs sand, 491 lbs cement and 73 lbs cement supplement. Approximately 20 gallons of water was added to this solid material to produce 4024 lbs (one cubic yard) of concrete. b Reference 9 and 10. Emission factors are based upon an equation from AP-42, section 13.2.4 Aggregate Handling And Storage Piles, equation 1 with kPM-10 =.35, kPM = .74, U = 10mph, Maggregate =1.77%, and Msand = 4.17%. These moisture contents of the materials (Maggregate and Msand) are the averages of the values obtained from Reference 9 and Reference 10. c The uncontrolled PM & PM-10 emission factors were developed from Reference 9. The controlled emission factor for PM was developed from References 9, 10, 11, and 12. The controlled emission factor for PM-10 was developed from References 9 and 10. d The controlled PM emission factor was developed from Reference 10 and Reference 12, whereas the controlled PM-10 emission factor was developed from only Reference 10. e Emission factors were developed by using the Aggregate and Sand Transfer Emission Factors in conjunction with the ratio of aggregate and sand used in an average yard3 of concrete. The unit for these emission factors is lb of pollutant per ton of aggregate and sand. f References 9, 10, and 14. The emission factor units are lb of pollutant per ton of cement and cement supplement. The general factor is the arithmetic mean of all test data. g Reference 9, 10, and 14. The emission factor units are lb of pollutant per ton of cement and cement supplement. The general factor is the arithmetic mean of all test data.

11.12-8 6/06
The particulate matter emissions from truck mix and central mix loading operations are calculated in accordance with the values in Tables 11.12-1 or 11.12-2 or by Equation 11.12-114 when site specific data are available.
c ) 0.0032 (k E b +⎥⎦
⎤⎢⎣
⎡=
MU a
Equation 11.12-1
E = Emission factor in lbs./ton of cement and cement supplement k = Particle size multiplier (dimensionless) U = Wind speed at the material drop point, miles per hour (mph) M = Minimum moisture (% by weight) of cement and cement
supplement a, b = Exponents
c = Constant
The parameters for Equation 11.12-1 are summarized in Tables 11.12-3 and 11.12-4.
Table 11.12-3. Equation Parameters for Truck Mix Operations
Condition Parameter Category k a b c
Total PM 0.8 1.75 0.3 0.013 PM10 0.32 1.75 0.3 0.0052 PM10-2.5 0.288 1.75 0.3 0.00468Controlled1
PM2.5 0.048 1.75 0.3 0.00078Total PM 1.118 PM10 0.310 PM10-2.5 0.260 Uncontrolled1
PM2.5 0.050
Table 11.12-4. Equation Parameters for Central Mix Operations
Condition Parameter Category k a b c
Total PM 0.19 0.95 0.9 0.0010 PM10 0.13 0.45 0.9 0.0010 PM10-2.5 0.12 0.45 0.9 0.0009 Controlled1
PM2.5 0.03 0.45 0.9 0.0002 Total PM 5.90 0.6 1.3 0.120 PM10 1.92 0.4 1.3 0.040 PM10-2.5 1.71 0.4 1.3 0.036 Uncontrolled1
PM2.5 0.38 0.4 1.3 0 1. Emission factors expressed in lbs/tons of cement and cement supplement
To convert from units of lbs/ton to units of kilograms per mega gram, the emissions calculated by Equation 11.12-1 should be divided by 2.0.
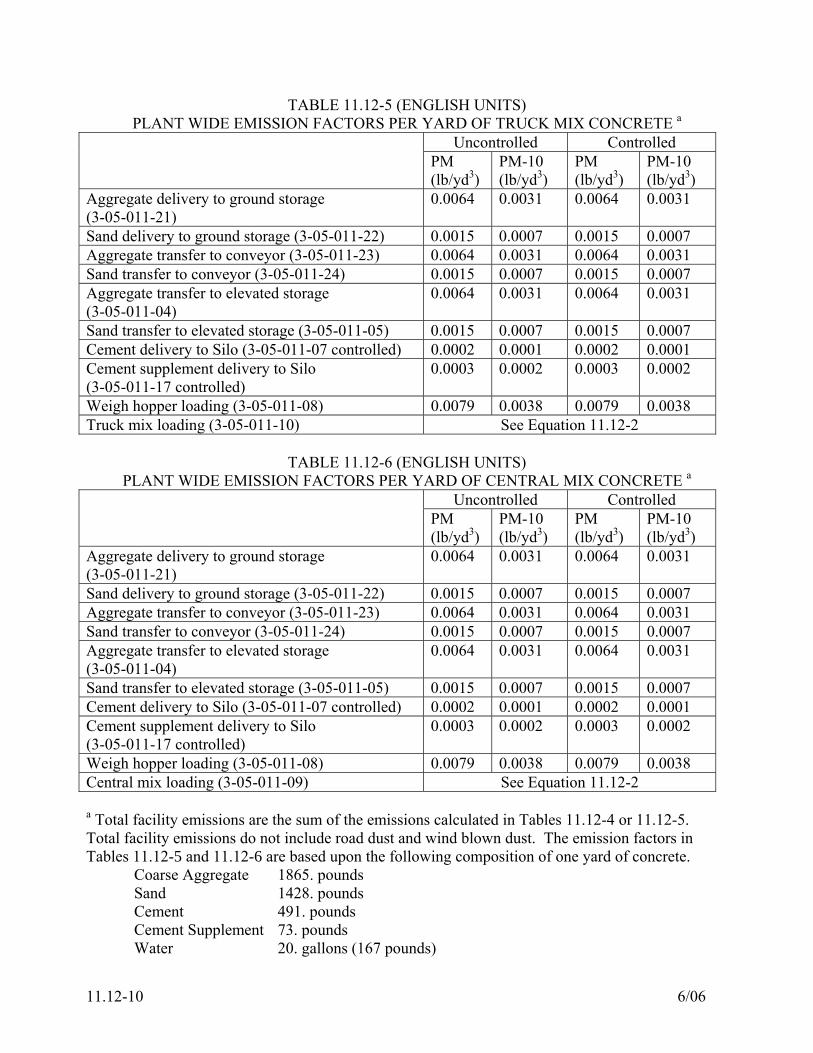
Particulate emission factors per yard of concrete for an average batch formulation at a typical facility are given in Tables 11.12-5 and 11.12-6. For truck mix loading and central mix loading, the

6/06 11.12-9
emissions of PM, PM-10, PM-10-2.5, and PM-2.5 are calculated by multiplying the emission factor calculated using Equation 11.12-2 by a factor of 0.140 to convert from emissions per ton of cement and cement supplement to emissions per yard of concrete. This equation is based on a typical concrete formulation of 564 pounds of cement and cement supplement in a total of 4,024 pounds of material (including aggregate, sand, and water). This calculation is summarized in Equation 11.12-2.
Factor) 2-11.12 Tableor factor 111.12 (Equation * 0.282concrete of yd
poundsemissions PM2.5 2.5,-PM10 PM10, PM, 3 −=⎟⎟⎠
⎞⎜⎜⎝
⎛
Equation 11.12-2
*NOTE: August 8, 2011. The equation was corrected. The basis of this conversion constant is: EF (pounds / ton cem) * (ton cem / 2,000 pounds cem) * (564 pounds cem / yd3 concrete) = EF (pounds / yd3 concrete) Where:
cem is the sum of cement (491 pounds) and cement supplement (73 pounds). Metals emission factors for concrete batching are given in Tables 11.12-7 and 11.12-8. Alternatively, the metals emissions from ready mix plants can be calculated based on (1) the weighted average concentration of the metal in the cement and the cement supplement (i.e. flyash) and (2) on the total particulate matter emission factors calculated in accordance with Equation 11.12-3. Emission factors calculated using Equation 11.12-3 are rated D.
⎟⎟⎠
⎞⎜⎜⎝
⎛
++
=S CbS aCPMMetal EFEF
Equation 11.12-3
Where:
MetalEF= Metal Emissions, Lbs. As per Ton of Cement and Cement Supplement
PMEF = Controlled Particulate Matter Emission Factor (PM, PM10, or PM2.5) Lbs. per Ton of Cement and Cement Supplement
a = ppm of Metal in Cement C = Quantity of Cement Used, Lbs. per hour b = ppm of Metal in Cement Supplement S = Quantity of Cement Supplement Used, Lbs. per hour
This equation is based on the assumption that 100% of the particulate matter emissions are material entrained from the cement and cement supplement streams. Equation 11.12-3 over-estimates total metal emissions to the extent that sand and fines from aggregate contribute to the total particulate matter emissions.
11.12-10 6/06
TABLE 11.12-5 (ENGLISH UNITS) PLANT WIDE EMISSION FACTORS PER YARD OF TRUCK MIX CONCRETE a
Uncontrolled Controlled PM (lb/yd3)
PM-10 (lb/yd3)
PM (lb/yd3)
PM-10 (lb/yd3)
Aggregate delivery to ground storage (3-05-011-21)
0.0064 0.0031 0.0064 0.0031
Sand delivery to ground storage (3-05-011-22) 0.0015 0.0007 0.0015 0.0007 Aggregate transfer to conveyor (3-05-011-23) 0.0064 0.0031 0.0064 0.0031 Sand transfer to conveyor (3-05-011-24) 0.0015 0.0007 0.0015 0.0007 Aggregate transfer to elevated storage (3-05-011-04)
0.0064 0.0031 0.0064 0.0031
Sand transfer to elevated storage (3-05-011-05) 0.0015 0.0007 0.0015 0.0007 Cement delivery to Silo (3-05-011-07 controlled) 0.0002 0.0001 0.0002 0.0001 Cement supplement delivery to Silo (3-05-011-17 controlled)
0.0003 0.0002 0.0003 0.0002
Weigh hopper loading (3-05-011-08) 0.0079 0.0038 0.0079 0.0038 Truck mix loading (3-05-011-10) See Equation 11.12-2
TABLE 11.12-6 (ENGLISH UNITS) PLANT WIDE EMISSION FACTORS PER YARD OF CENTRAL MIX CONCRETE a
Uncontrolled Controlled PM (lb/yd3)
PM-10 (lb/yd3)
PM (lb/yd3)
PM-10 (lb/yd3)
Aggregate delivery to ground storage (3-05-011-21)
0.0064 0.0031 0.0064 0.0031
Sand delivery to ground storage (3-05-011-22) 0.0015 0.0007 0.0015 0.0007 Aggregate transfer to conveyor (3-05-011-23) 0.0064 0.0031 0.0064 0.0031 Sand transfer to conveyor (3-05-011-24) 0.0015 0.0007 0.0015 0.0007 Aggregate transfer to elevated storage (3-05-011-04)
0.0064 0.0031 0.0064 0.0031
Sand transfer to elevated storage (3-05-011-05) 0.0015 0.0007 0.0015 0.0007 Cement delivery to Silo (3-05-011-07 controlled) 0.0002 0.0001 0.0002 0.0001 Cement supplement delivery to Silo (3-05-011-17 controlled)
0.0003 0.0002 0.0003 0.0002
Weigh hopper loading (3-05-011-08) 0.0079 0.0038 0.0079 0.0038 Central mix loading (3-05-011-09) See Equation 11.12-2 a Total facility emissions are the sum of the emissions calculated in Tables 11.12-4 or 11.12-5. Total facility emissions do not include road dust and wind blown dust. The emission factors in Tables 11.12-5 and 11.12-6 are based upon the following composition of one yard of concrete. Coarse Aggregate 1865. pounds Sand 1428. pounds Cement 491. pounds Cement Supplement 73. pounds Water 20. gallons (167 pounds)

6/06
11.12-11
Emission Factor Rating
E E
E E
E E
E E
Selenium
ND ND
ND 3.62e-08
ND ND
1.31e-06 5.64e-08
Total Phosphorus
5.88e-05
ND
ND 1.77e-06
1.01e-05 6.04e-07
1.92e-05 6.16e-06
Nickel
8.83e-06 2.09e-08
ND 1.14e-06
1.64e-06 1.24e-07
5.99e-06 2.39e-06
Manganese
1.01e-04 5.87e-08
ND 1.28e-07
3.06e-05 1.89e-06
3.06e-05 1.04e-05
Lead
3.68e-07 5.46e-09
ND 2.60e-07
1.91e-07 1.83e-08
1.81e-06 7.67e-07
Total Chromium
1.26e-07 1.45e-08
ND 6.10e-07
7.11e-07 6.34e-08
5.71e-06 2.05e-06
Cadmium
1.17e-07 ND
ND 9.92e-09
5.92e-09 3.55e-10
1.71e-08 4.53e-09
Beryllium
8.97e-09 2.43e-10
ND 4.52e-08
ND ND
1.22e-07 5.18e-08
Arsenic
8.38e-07 2.12e-09
ND 5.02e-07
4.19e-06 1.48e-07
6.09e-06 3.01e-07
TABLE 11.12-7 (METRIC UNITS) CONCRETE BATCH PLANT METAL EMISSION FACTORS a
Cement Silo Filling b (SCC 3-05-011-07)
w/ Fabric Filter
Cement Supplement Silo Filling c (SCC 3-05-011-17) w/ Fabric Filter
Central Mix Batching d (SCC 3-05-011-09)
w/ Fabric Filter
Truck Loading e (SCC 3-05-011-10)
w/ Fabric Filter
ND=No data a All emission factors are in kg of pollutant per Mg of material loaded unless noted otherwise. Loaded material includes course aggregate, sand, cement, cement supplement and the surface moisture associated with these materials. The average material composition of concrete batches presented in references 9 and 10 was 846 Kg course aggregate, 648 kg sand, 223 kg cement and 33kg cement supplement. Approximately 75 liters of water was added to this solid material to produce 1826 kg of concrete. b The uncontrolled emission factors were developed from Reference 9. The controlled emission factors were developed form Reference 9 and 10. Although controlled emissions of phosphorous compounds were below detection, it is reasonable to assume that the effectiveness is comparable to the average effectiveness (98%) for the other metals. c Reference 10. d Reference 9. The emission factor units are kg of pollutant per Mg of cement and cement supplement. Emission factors were developed from a typical central mix operation. The average estimate of the percent of emissions captured during each run is 94%. e Reference 9 and 10. The emission factor units are kg of pollutant per Mg of cement and cement supplement. Emission factors were developed from two typical truck mix loading operations. Based upon visual observations of every loading operation during the two test programs, the average capture efficiency during the testing was 71%.

11.12-12
6/06
Emission Factor Rating
E E
E E
E E
E E
Selenium
ND ND
ND 7.24e-08
ND ND
2.62e-06 1.13e-07
Total Phosphorus
1.18e-05
ND
ND 3.54e-06
2.02e-05 1.20e-06
3.84e-05 1.23e-05
Nickel
1.76e-05 4.18e-08
ND 2.28e-06
3.28e-06 2.48e-07
1.19e-05 4.78e-06
Manganese
2.02e-04 1.17e-07
ND 2.56e-07
6.12e-05 3.78e-06
6.12e-05 2.08e-05
Lead
7.36e-07 1.09e-08
ND 5.20e-07
3.82e-07 3.66e-08
3.62e-06 1.53e-06
Total Chromium
2.52e-07 2.90e-08
ND 1.22e-06
1.42e-06 1.27e-07
1.14e-05 4.10e-06
Cadmium
2.34e-07 ND
ND 1.98e-10
1.18e-08 7.10e-10
3.42e-08 9.06e-09
Beryllium
1.79e-08 4.86e-10
ND 9.04e-08
ND ND
2.44e-07 1.04e-07
Arsenic
1.68e-06 4.24e-09
ND 1.00e-06
8.38e-06 2.96e-07
1.22e-05 6.02e-07
TABLE 11.12-8 (ENGLISH UNITS) CONCRETE BATCH PLANT METAL EMISSION FACTORS a
Cement Silo Filling b (SCC 3-05-011-07)
w/ Fabric Filter
Cement Supplement Silo Filling c (SCC 3-05-011-17) w/ Fabric Filter
Central Mix Batching d (SCC 3-05-011-09)
w/ Fabric Filter
Truck Loading e (SCC 3-05-011-10)
w/ Fabric Filter
ND=No data a All emission factors are in lb of pollutant per ton of material loaded unless noted otherwise. Loaded material includes course aggregate, sand, cement, cement supplement and the surface moisture associated with these materials. The average material composition of concrete batches presented in references 9 and 10 was 1865 lbs course aggregate, 1428 lbs sand, 491 lbs cement and 73 lbs cement supplement. Approximately 20 gallons of water was added to this solid material to produce 4024 lbs (one cubic yard) of concrete. b The uncontrolled emission factors were developed from Reference 9. The controlled emission factors were developed form Reference 9 and 10. Although controlled emissions of phosphorous compounds were below detection, it is reasonable to assume that the effectiveness is comparable to the average effectiveness (98%) for the other metals. c Reference 10. d Reference 9. The emission factor units are lb of pollutant per ton of cement and cement supplement. Emission factors were developed from a typical central mix operation. The average estimate of the percent of emissions captured during each test run is 94%. e Reference 9 and 10. The emission factor units are lb of pollutant per ton of cement and cement supplement. Emission factors were developed from two typical truck mix loading operations. Based upon visual observations of every loading operation during the two test programs, the average capture efficiency during the testing was 71%.

6/06 11.12-13
References for Section 11.12 1. Air Pollutant Emission Factors, APTD-0923, U.S. Environmental Protection Agency,
Research Triangle Park, NC, April 1970.
2. Air Pollution Engineering Manual, 2nd Edition, AP-40, U.S. Environmental Protection Agency, Research Triangle Park, NC, 1974. Out of Print.
3. Telephone and written communication between Edwin A. Pfetzing, PEDCo Environmental., Inc., Cincinnati, OH, and Richards Morris and Richard Meininger, National Ready Mix Concrete Association, Silver Spring, MD, May 1984.
4. Development Document for Effluent Limitations Guidelines and Standards of Performance, The Concrete Products Industries, Draft, U.S. Environmental Protection Agency, Washington, DC, August 1975.
5. Portland Cement Association. (2001). Concrete Basics. Retrieved August 27, 2001 from the World Wide Web: http://www.portcement.org/cb/
6. Technical Guidance for Control of Industrial Process Fugitive Particulate Emissions, EPA-450/3-77-010, U.S. Environmental Protection Agency, Research Triangle Park, NC, March 1977.
7. Fugitive Dust Assessment at Rock and Sand Facilities in the South Coast Air Basin, Southern California Rock Products Association and Southern California Ready Mix Concrete Association, Santa Monica, CA, November 1979.
8. Telephone communication between T.R. Blackwood, Monsanto Research Corp., Dayton, OH, and John Zoller, PEDCo Environmental, Inc., Cincinnati, OH, October 18, 1976.
9. Final Test Report for USEPA [sic] Test Program Conducted at Chaney Enterprises Cement Plant, ETS, Inc., Roanoke, VA April 1994.
10. Final Test Report for USEPA [sic] Test Program Conducted at Concrete Ready Mixed Corporation, ETS, Inc., Roanoke, VA April 1994.
11. Emission Test for Tiberi Engineering Company, Alar Engineering Corporation, Burbank, IL, October, 1972.
12. Stack Test “Confidential” (Test obtained from State of Tennessee), Environmental Consultants, Oklahoma City, OK. February 1976.
13. Source Sampling Report, Particulate Emissions from Cement Silo Loading, Specialty Alloys Corporation, Gallaway, Tennessee, Reference number 24-00051-02, State of Tennessee, Department of Health and Environment, Division of Air Pollution Control, June 12, 1984.

11.12-14 6/06
14. Richards, J. and T. Brozell. “Ready Mixed Concrete Emission Factors, Final Report” Report to the Ready Mixed Concrete Research Foundation, Silver Spring, Maryland. August 2004.