“Growing Redwoods for the Future” - Amazon Web Services€¦ · the fire quickly across...
26
1 “Growing Redwoods for the Future” March 23, 2011 Cal-Fire Forest Practice 135 Ridgway Ave Santa Rosa, CA 95401 Re: Minor Amendment Updating Conditions Following the Lockheed Fire NTMP # 1-07NTMP-020 SCR Dear Cal-Fire, Since the approval of the Swanton Pacific Ranch NTMP in June of 2008, the Lockheed wildfire enveloped a major portion of the NTMP area. The purpose of this amendment is to provide a detailed account of the fire, the damage to the forest resource, and a description of salvage harvest operations that followed. It will take many years to observe, evaluate, and analyze the effects of wildfire on this landscape, so this is the first chapter in a series of amendments to the Swanton Pacific Ranch NTMP that will occur in the coming years. Topics covered in this amendment include the following: Lockheed Fire Description ……..………………………………………………………………………………. 1 Damage to Timber ……..…………………………………………………………………………………………… 4 Salvage Harvest Operations ……………………………………………………………………………………. 6 Ongoing Research Opportunities ……..…………………………………………………………………….. 7 NTMP Sustainability Analysis Update, February 2011 …………………………….…………….. 8 Burn Severity and Fire Progression Maps ……..………………………………………………………….18 Marbled Murrelet Survey Results …………………………………………………………………………… 20 Proof of Re-zoning Parcels 057-251-08 and 057-251-09 to TPZ……………………………… 27 Archaeology Update to Filipino Camp Primary Record …………………………………………… 28 Please do not hesitate to contact me if you have any questions at (831) 457-6383 or [email protected] . Sincerely, Nadia Hamey RPF # 2788 BIG CREEK LUMBER CO. 3564 Highway 1, Davenport, CA 95017 (831) 457-6383
Transcript of “Growing Redwoods for the Future” - Amazon Web Services€¦ · the fire quickly across...

1
“Growing Redwoods for the Future” March 23, 2011 Cal-Fire Forest Practice 135 Ridgway Ave Santa Rosa, CA 95401 Re: Minor Amendment Updating Conditions Following the Lockheed Fire NTMP # 1-07NTMP-020 SCR Dear Cal-Fire,
Since the approval of the Swanton Pacific Ranch NTMP in June of 2008, the Lockheed wildfire enveloped a major portion of the NTMP area. The purpose of this amendment is to provide a detailed account of the fire, the damage to the forest resource, and a description of salvage harvest operations that followed. It will take many years to observe, evaluate, and analyze the effects of wildfire on this landscape, so this is the first chapter in a series of amendments to the Swanton Pacific Ranch NTMP that will occur in the coming years.
Topics covered in this amendment include the following:
Lockheed Fire Description ……..………………………………………………………………………………. 1 Damage to Timber ……..…………………………………………………………………………………………… 4 Salvage Harvest Operations ……………………………………………………………………………………. 6 Ongoing Research Opportunities ……..…………………………………………………………………….. 7 NTMP Sustainability Analysis Update, February 2011 …………………………….…………….. 8 Burn Severity and Fire Progression Maps ……..………………………………………………………….18 Marbled Murrelet Survey Results …………………………………………………………………………… 20 Proof of Re-zoning Parcels 057-251-08 and 057-251-09 to TPZ……………………………… 27 Archaeology Update to Filipino Camp Primary Record …………………………………………… 28 Please do not hesitate to contact me if you have any questions at (831) 457-6383 or [email protected]. Sincerely,
Nadia Hamey
RPF # 2788
BIG CREEK LUMBER CO. 3564 Highway 1, Davenport, CA 95017 (831) 457-6383

2
Lockheed Fire Description
The Lockheed Fire was first reported on August 12th, 2009 at 1916hrs. The fire consumed 7,819 acres with 1,093 acres on Swanton Pacific Ranch, and suppression efforts continued until August 23rd, 2009. The acres burned in the NTMP and acres burned in the corresponding watersheds within the NTMP area can be seen in Table 1, below. Suppression forces included: Cal Fire, local governments and volunteers, OES, USFS, Dept. of Corrections, and various private contractors. Suppression efforts focused on human life and evacuation, structure protection, and wildfire suppression. The Ranch evacuated staff, students, and livestock to the shipping corrals located on Hwy 1. Well systems were readied and the central Queseria junction box was opened to direct water flow from the 500GPM and 320GPM variable speed drive wells to the fire hydrant in the crop field located behind the long barn at 125 Swanton.
Ranch managers were actively involved with Cal Fire throughout the suppression efforts providing accurate maps and local knowledge. Ranch LIDAR data was utilized by Ranch staff serving on the “Lockheed Fire Post Fire Risk Assessment” team as GIS specialists. That report is available online: http://www.santacruzcountyfire.com/resource_mgmt/final_lockheed_ra.pdf
Table 1. Percent of the NTMP and watersheds burned during the Lockheed Fire.
The fire spread quickly through tree canopies, surface/brush fires, and by spotting. High winds moved the fire quickly across drainages and to different vegetation types. Suppression efforts were hindered by the steep terrain and initial attack relied on air assault and hand crews. Helicopters quickly depleted small local ponds and were forced to draft from the Pacific Ocean at Scotts Beach and Scotts Creek estuary. Pilots favored fresh water drafting from the estuary, due to salt water’s corrosive effect on equipment. CDC hand crews, and USFS hot shot crews constructed miles of handline, and lit several backfires. Most visible is the hand work done in Queseria creek drainage located across the street from 125 Swanton Road. Fire engines were stationed upslope along Strawberry Shack Road, and hand crews burned top to bottom through the brush into the drainage.
Watershed Total Area
(ac) Area
Burned (ac) Area
Burned (%) NTMP 701 556 79%
Winter Creek 116 94 81%
Archibald Creek 421 369 88%
Little Creek 1306 1200 92%Entire Scotts Creek Watershed
19001 6755 36%
Lockheed Fire Watershed Statistics

3
Photograph of a fire suppression helicopter filling at the Scotts Creek lagoon. The Queseria Creek watershed is on fire in the background. August 13, 2009.
Local knowledge and timber harvesting infrastructure (seasonal roads, landings, and skid trails) played a critical role in fire suppression and recovery efforts by providing accessibility to the fire’s edge. Skid trails functioned as fuel breaks once cleared by dozer or hand crews. Large landings once cleared of vegetation or slash, provided engine and hand crews with safety zones. While opening haul roads for suppression efforts Cal Fire dozers removed waterbars of all sizes. Winter Creek, Lions Flat, and Strawberry Shack Roads were all used during the suppression effort and post fire rehabilitation. Rehabilitation included, but was not limited to: the repair, reconstruction, or addition of erosion control structures, and seeding and/or straw mulching of disturbed road edges and landings. Erosion control structure location and frequency was pre-flagged by the Ranch Resource Manager, and structures were installed by Big Creek Lumber Company operators on contract with Cal Fire, and fine tuned by Ranch staff.
Swanton Pacific Ranch pumped over 629,000 gallons of water from agricultural wells to Cal Fire type I, II, and III fire engines, and water tenders. Water from Swanton Pacific Ranch will prove to be essential for fire events in the future, following the closure of the CEMEX cement plant in Davenport, which pumped over 1,200,000 gallons of water during the fire effort. Water was distributed from the fire hydrant behind the barn through 2.5” hose. Fire engines and water tenders under 35tons GVW were able to access the hydrant over the Ranch’s HS20 certified Queseria bridge that was installed in the summer of 2008. It would take 10-20 minutes for the 320 GPM variable speed drive well to fill a 4000 gallon water tender. Ranch staff was on hand to distribute water to fire engines and water tenders, and to ensure proper well operation. If the hydrant was closed too abruptly the variable speed drive would surge and throw a fault code that could only be reset at the well mounted breaker. It should be noted that electricity to the wells was never compromised and therefore allowed for pumping. Without power, the well system is valueless.

4
The southeastern edge of the fire was contained despite three spot fires along Warrenella Road. Warrenella’s pre-existing 50’ shaded fuel break, location, slope, and accessibility from Hwy 1 and Empire Grade provided the infrastructure suppression forces were looking for to halt the Lockheed Fire.
Winter Creek Road served as the western fire line between School House Gulch and Archibald Creek. This haul road provided protection to the Big Creek Cal Fire station (a major staging area) and acted as the ignition point for the back fire to stop the fire from moving west onto Swanton Road. The Ranch maintains Winter Creek Road for summer time access by maintaining waterbars and mowing the road. Type III engines were able to drive this road immediately.
Old School House Gulch Road was wide enough to allow type I fire engines to access the Al Smith House, and Staub house. Defensible space, vegetation management, access, and fast acting firefighters saved both structures. Firefighters utilized landing 10 as defensible space for the Staub house, while a skid trail proved to be an essential fuel break for protecting the Al Smith house. The large parking areas at both the Staub and Al Smith house allowed type I fire engines to be staged during original suppression efforts and played a large role protecting each structure. Fire crews dug handline around the water tanks above the Al Smith house. The only Ranch culvert lost during the Lockheed fire was a 24” plastic culvert and downspout located in the drainage immediately before landing 10. It should be noted that the culvert downspout extended down slope 30’, and was surrounded by high levels of vegetation, possibly resulting in ignition of the culvert through the downspout. Throughout suppression efforts the road prism continued to support fire truck and vehicle traffic without the culvert in place. The culvert was reinstalled and armored by Swanton Pacific Ranch staff during rehabilitation efforts. A Ranch communications line runs through the center of the road to the Staub house approximately 8” above the culvert and caution should be taken when excavating this location. The wooden horse corral and storage shed located to the north of the Staub were damaged beyond repair. Wooden 4” diameter pressure treated posts carried the fire up to the 2x6” material and burned 98% of the corral. Damage to the shed was less severe, it can be assumed without structure protection provided by firefighters it would have also burned to the ground.
Little Creek Road was not used during fire suppression efforts. The narrow mid slope road location, fire rate of spread and intensity, steep slopes, and limited turnarounds did not allow for safe entry of fire personnel during the crown fire that went through this area. Fire intensities were high but no culverts or bridges were lost during the fire event. The Spafford cabins, associated water uptake and Al’s Jeep located near the confluence of Little Creek were lost to the fire. A through-fill on Little Creek road located approximately 350ft down road from stream crossing R7 was damaged by the fire when historic crib logs buried in the through-fill ignited into ground fires. The ends of the logs were exposed by years of erosion and surrounded by vegetation, and provided the entry point for the fire underneath the road. The slow burning ground fires created an interconnected network of tunnels with diameters exceeding 36” and lengths over 20’ running parallel and perpendicular to the road. While the through fill remained solid, the tunnels were first discovered when the road prism started to collapse and jeopardize vehicle and personnel traffic. The tunnels were excavated by Ranch staff using a CASE 580 Super L backhoe with extendahoe and a 2’ bucket. Ranch staff was accompanied by a Cal Fire engine that extinguished ground fires as they were excavated. Fires continued to burn with minimal oxygen as the fire spread deeper underground from crib log to crib log throughout the road prism. After excavation, log remnants were extinguished, and the road prism was repaired and reconstructed. Crib logs used as rail-car bridge footings were minimally charred on the North Fork bridge of Little Creek and appear to be sound at this time through cursory evaluations. Ranch staff utilized a 500 gallon water trailer on the other multiple entries that followed to extinguish fires occurring in redwood groves for months after.

5
In December 2009, Swanton Pacific Ranch conducted a hazard tree analysis in which ranch staff identified and marked potentially hazardous trees. Trees that are standing dead or sustained structural bole or root damage have an increased probability of falling onto roads and other infrastructure. Two storm seasons have passed since the hazard tree assessment was completed. Over 800 trees were identified in the assessment and about 80% of trees that have fallen onto the haul road to date were identified in the hazard tree assessment. Trees continue to fall at an accelerated rate.
Damage to Timber
Redwood (Sequoia sempervirens), and Douglas-fir (Pseudotsuga menziesii) are known to have fire resistant characteristics; thick bark and self pruning lower limbs, making them more resistant to surface fires. The Lockheed fire was a high intensity crown fire that burned with such heat and rate of spread that it completely engulfed stands of redwoods and Douglas-fir resulting in high levels of tree mortality and defect. Douglas-fir trees with crown scorch of 60% or more are presumed dead, while redwood stands that have suffered 100% crown scorch have resprouted demonstrating lower mortality rates. While redwoods seem to be resistant to the mortality effects of fire, many trees have sustained cambium and root damage. The cambium damage will lead to rot, and increase the defect in the tree. As time passes the tree will grow larger, and so will the decay. This decay was witnessed in the logs milled from the salvage harvest. Trees that had burnt during the 1948 fire had evident damage and decay from the fire. In some cases one could see the remnants of 12”x 40’ tall tree that burned in the 1948 fire, like a fossil inside the log of a larger tree.
The more logs milled the more apparent it was to see rot up the entire length of the butt log. The trees left standing now have the decay of the 1948 fire, and will have another layer of decay 60 growth rings out. Continually adding more defect on the outside of these logs would only result in Swanton’s managed forest segments becoming financially un-manageable over time unless it was cleaned up through salvage efforts. Small cat-faces have appeared on trees that had none, goose pens have formed where cat-faces existed, and goose pen trees have converted to chimneys. The legacy stump found inside of the circular sprouting pattern of second growth redwoods is now missing in many situations. The intense fire has burned the stump, and large portions of the original root system with it. It is difficult to say at this time what affect this will have on the health, and stability of the redwood trees surrounding the void left by the stump. The addition of these new characteristics to the forest adds many wildlife qualities that can only

6
be created with fire and the Ranch seeks to maintain a balance between these qualities and merchantable timber.
In December 2009, the Ranch designated a set of criteria from scientific publications and professional foresters, to determine post-fire tree mortality of the Continuous Forest Inventory plots (CFI). Using this criteria, Ranch forestry technicians reestablished the plots and determined the tree mortality of CFI plots affected by the Lockheed fire. Using GPS and a hand compass, forestry technicians would pace out the approximate 500 ft horizontal distance in a cardinal direction to reach the next fixed plot. Locating plots in high intensity burn areas proved to be extremely difficult. The fire removed marking paint from the trees, witness cards, flagging, and aluminum tags. Some plots were burned so intensely that only the rebar center stake remained to identify a CFI plot. Using previous measurement data, forestry technicians were able to identify even the most severely damaged CFI plot. Trees were evaluated on species, dbh, height, scorch height, percent remaining crown, fire intensity, cambium damage, root damage, basal sprouting, crown sprouting, and determined live/dead. In July 2010, a forestry technician and a student intern reevaluated the CFI plots measured in Dec. 2009. Results were consistent with the conclusions from the 2009 visit, but Ranch management is aware that it may take several years to determine the true mortality of certain tree species. Plans exist to measure the CFI for tree mortality over the next 2 - 4 years. Continued measurement will support the analysis in the NTMP prior to the next entry and will also act as important research for coast redwood species burned by wildfire.
Salvage Harvest Operations
In the spring of 2010 the Ranch submitted an Emergency Notice that focused on areas of managed forest within the NTMP that were burned at medium and high intensities, resulting in mortality and substantial damage to timber resources. The damaged trees would have sustained high levels of defect into the future. Harvest of these dead, dying and damaged trees allows the landowner to minimize financial loss of timber resources that would certainly occur as a result of decay over time. The Emergency Notice included approximately 90 acres of harvest area in the North Fork and South Fork of Little Creek as well as Archibald Creek and Winter Creek watersheds. Logs were flown with a Boeing Vertol 107 helicopter to landings 1, 10, and 11 by Columbia Helicopters, and hauled out of Winter Creek Road as conditions permitted.
Prior to conducting salvage operations, the Ranch consulted with several professionals familiar with the Ranch property for technical assistance relative to biological and geological issues related to proposed salvage harvest operations in the wake of the Lockheed Fire. In particular, Dr. John Bulger, wildlife biologist, was asked to evaluate the post-fire condition of two previously identified areas of potentially suitable marbled murrelet habitat on Swanton Pacific Ranch and to make recommendations for avoiding take of habitat and avoiding potential disturbance to nesting murrelets (if any) with respect to the proposed harvest operations. Additionally, Tim Best, Certified Engineering Geologist and Certified Professional in Erosion and Sediment Control, was asked to outline general slope stability recommendations. Mitigations to follow these recommendations were incorporated in all Emergency Notice operations.
The Swanton Pacific Ranch Emergency Notice, #1-10EM-006-SCR, covering 90 acres, is on file with Cal-Fire. Emergency Notice harvest entries on Swanton Pacific Ranch and adjoining properties in the Scotts Creek watershed are displayed in Table 2 below.

7
Table 2 displays the scope of Emergency Notice operations in the Scotts Creek Watershed.
The Ranch will be filing a Notice of Timber Operations for the South Fork Little Creek this summer, 2011, to harvest substantially damaged timber and perpetuate selection management. Harvesting methods and logistics are undecided at the time of the amendment but will be disclosed in the NTO. Following timber operations in spring 2011 the next entries will likely be in 10 to 20 years, depending on stocking levels. Before the Ranch enters the NTMP area for future timber operations, following the South Fork Little Creek this summer, the CFI plots will be re-measured and analyzed for sustainability with a minor amendment submitted to Cal Fire.
The Ranch has also begun initiating a Forest Recovery Management Plan. This Plan is the Ranch’s rehabilitation strategy for the forest post Lockheed Fire. Treatments are proposed which include monitoring, planting, and vegetation management. Demonstration sites have been laid out to compare a variety of vegetation treatments and intensities to successfully regenerate redwood. This effort will be focused on severely burned areas with redwood site potential, some of which have been previously planted with non-native Monterey pine. Ranch staff planted over 16,000 redwood seedlings in winter 2010 and 2011, and intends to plant 20,000 more in substantially damaged areas.
Ongoing Research Opportunities
The Lockheed Fire shifted the research opportunities at the Ranch. The focus of the Paired Watershed study has been redirected to monitor the effects developing in the aftermath of the burn. Within several months of the fire, Ranch and visiting scientists were testing soil hydrophobicity at various locations throughout the watershed. A rainfall simulator from the University of Oregon was used to test soil infiltration at sites both in and out of the burn. A post-fire LiDAR flight on the Scotts Creek watershed was conducted, to allow post-fire comparisons of the ground topography and the vegetation relief prior to significant re-growth. Re-growth has occurred rapidly, comprised of many unique fire-following species, which are recorded to a great extent in the botanical essay, Traversing Swanton Road, by James West, http://arboretum.ucsc.edu/pdfs/TraversingSwanton.pdf. Inventory of invasive plant populations on the Ranch has also been compiled and submitted to the Invasive Plant Council to help prioritize management efforts.
WATERSHEDTractor
(ac)Helicopter
(ac)Yarder
(ac) Total (ac)
Upper Scotts Creek 113 21 0 134
Mill Creek 0 342 0 342
Big Creek 14 568 0 582
Little Creek - North Fork 69 131 0 200
Little Creek - South Fork 60 26 17 103
Little Creek - Mainstem 0 46 0 46
Winter Creek 0 10 0 10
Archibald Creek - North Fork 11 0 0 11
Archibald Creek - South Fork 18 0 10 28
Archibald Creek - Mainstem 0 7 0 7
Total 285 1151 27 1463
Lockheed Fire 2010 and 2011 Emergency Notices by Watershed

8
Photograph of a rainfall simulation experiment in the South Fork of Little Creek. January 6, 2011.
Swanton NTMP Sustainability Analysis Update, February 2011
Purpose: To provide pre and post fire stand and stock tables by timber type (RW II, RW III, RW IV, DF, DFHW, and Smith Stand) of redwood and Douglas-fir within the burn area.
Data: 2003 CFI (Continuous Forest Inventory) report, 2008 CFI report, 1st Post-fire mortality assessment (2009), 2nd Post-fire mortality assessment (2010).
Methodology: The same approach utilized in the NTMP was utilized to create stand and stock tables by timber type with the most current information.
For the Post-fire Mortality Assessment, a set of mortality thresholds was developed through review of available literature and discussions with other professional foresters. This evaluation was conducted on the 83 CFI plots within the burn perimeter. These plots were measured in December 2009, and again in August 2010, with another visit planned for fall 2011. Stand and Stock tables for all relevant Timber Types and species are presented below. Stand and Stock tables are not provided for MPP (Monterey Pine Plantation) due to the fact that the NTMP proposes removal of the stands over time, however, field evaluations in the MPP timber type support mortality in the range of 80 – 100%. Douglas-fir tables were not developed for RW II and Smith Stand due to insufficient stocking. It is recognized that total mortality may not be realized for several years. This long-term effect will be re-assessed when re-visiting the CFI plots, prior to the next update of the NTMP.

Burn Area-Post Fire Statistics# of Plots= 31
Mean (bf/ac)= 40131Standard Deviation (bf/ac)= 25140
Coefficient of Variation= 63Standard Error of the Mean (bf/ac)= 4515
Standard Error as a Percent of the Mean= 11
DBH TPA BA (ft^2/ac) DBH TPA BA (ft^2/ac) DBH Vol. (bf/ac) DBH Vol. (bf/ac)2 22.80 0.50 2 0.16 0.00 2 4.56 2 0.034 24.52 2.14 4 4.52 0.39 4 49.03 4 9.036 26.29 5.16 6 7.26 1.43 6 105.16 6 29.038 21.45 7.49 8 10.32 3.60 8 150.16 8 72.2610 11.45 6.25 10 7.10 3.87 10 171.77 10 106.4512 7.58 5.95 12 7.10 5.57 12 227.42 12 212.9014 7.58 8.10 14 6.61 7.07 14 606.45 14 529.0316 5.00 6.98 16 4.19 5.86 16 450.00 16 377.4218 6.13 10.83 18 4.68 8.27 18 980.65 18 748.3920 5.48 11.96 20 4.19 9.15 20 1370.97 20 1048.3922 5.81 15.33 22 4.84 12.77 22 1916.13 22 1596.7724 5.32 16.72 24 4.84 15.20 24 2820.97 24 2564.5226 3.87 14.27 26 3.23 11.89 26 3096.77 26 2580.6528 2.42 10.35 28 2.26 9.66 28 2177.42 28 2032.2630 2.74 13.46 30 2.42 11.88 30 2796.77 30 2467.7432 2.10 11.71 32 1.77 9.91 32 2348.39 32 1987.1034 1.29 8.14 34 1.29 8.14 34 1548.39 34 1548.3936 2.26 15.96 36 2.10 14.82 36 3793.55 36 3522.5838 2.58 20.32 38 1.94 15.24 38 4851.61 38 3638.7140 1.13 9.85 40 0.97 8.44 40 2529.03 40 2167.7442 0.65 6.21 42 0.65 6.21 42 1541.94 42 1541.9444 0.16 1.70 44 0.16 1.70 44 429.03 44 429.0346 0.48 5.58 46 0.32 3.72 46 1359.68 46 906.4548 0.48 6.08 48 0.48 6.08 48 1770.97 48 1770.9750 0.16 2.20 50 0.16 2.20 50 635.48 50 635.4852 0.16 2.38 52 0.16 2.38 52 650.00 52 650.00Total 148.23 225.62 Total 83.71 185.45 Total 38382.30 Total 33173.26
Timber Type: Redwood III, Species: RW
Post 2008 Harvest Post Salvage Post 2008 Harvest Post Salvage2009 Pre Fire 2011 Post Fire 2009 Pre Fire 2011 Post Fire
RW Stand Table RW Stand Table RW Stock Table RW Stock TableRW III Type RW III Type RW III Type RW III Type
0
5
10
15
20
25
30
2 10 18 26 34 42 50
RW TPA
DBH
Burn Area‐Pre Fire
Burn Area‐Post Fire
Burn AreaPre FirePost 2008 Harvest
Burn AreaPost FirePost Salvage
9

Burn Area-Post Fire Statistics# of Plots= 31
Mean (bf/ac)= 40131Standard Deviation (bf/ac)= 25140
Coefficient of Variation= 63Standard Error of the Mean (bf/ac)= 4515
Standard Error as a Percent of the Mean= 11
DBH TPA BA (ft^2/ac) DBH TPA BA (ft^2/ac) DBH Vol. (bf/ac) DBH Vol. (bf/ac)2 1.45 0.03 2 0.00 0.00 2 0.64 2 0.004 2.58 0.23 4 0.32 0.03 4 8.21 4 1.036 0.81 0.16 6 0.16 0.03 6 8.17 6 1.638 0.16 0.06 8 0.16 0.06 8 3.72 8 3.7210 0.81 0.44 10 0.48 0.26 10 35.19 10 21.1212 0.32 0.25 12 0.16 0.13 12 23.70 12 11.8514 0.48 0.52 14 0.48 0.52 14 55.23 14 55.2316 0.48 0.68 16 0.48 0.68 16 80.89 16 80.8918 1.29 2.28 18 1.13 2.00 18 302.04 18 264.2820 0.00 0.00 20 0.00 0.00 20 0.00 20 0.0022 0.16 0.43 22 0.16 0.43 22 66.99 22 66.9924 0.00 0.00 24 0.00 0.00 24 0.00 24 0.0026 0.48 1.78 26 0.48 1.78 26 323.94 26 323.9428 0.16 0.69 28 0.16 0.69 28 133.45 28 133.4530 0.16 0.79 30 0.16 0.79 30 162.53 30 162.5332 0.65 3.60 32 0.65 3.60 32 781.80 32 781.8034 0.48 3.05 34 0.48 3.05 34 697.27 34 697.2736 0.32 2.28 36 0.32 2.28 36 547.32 36 547.3238 0.32 2.54 38 0.32 2.54 38 638.77 38 638.7740 0.32 2.81 40 0.32 2.81 40 739.61 40 739.6142 0.32 3.10 42 0.32 3.10 42 850.27 42 850.2744 0.16 1.70 44 0.16 1.70 44 485.58 44 485.5846 0.16 1.86 46 0.16 1.86 46 551.35 46 551.3548 0.16 2.03 48 0.16 2.03 48 622.66 48 622.66Total 12.26 31.31 Total 7.26 30.37 Total 7119.36 Total 7041.31
DF Stand Table DF Stand Table DF Stock Table DF Stock Table
Timber Type: Redwood III, Species: DF
Post 2008 Harvest Post Salvage Post 2008 Harvest Post SalvageRW III Type RW III Type RW III Type RW III Type
2009 Pre Fire 2011 Post Fire 2009 Pre Fire 2011 Post Fire
0
1
2
3
2 10 18 26 34 42
DF TPA
DBH
Burn Area‐Pre Fire
Burn Area‐Post Fire
Burn AreaPre FirePost 2008 Harvest
Burn AreaPost FirePost Salvage
10
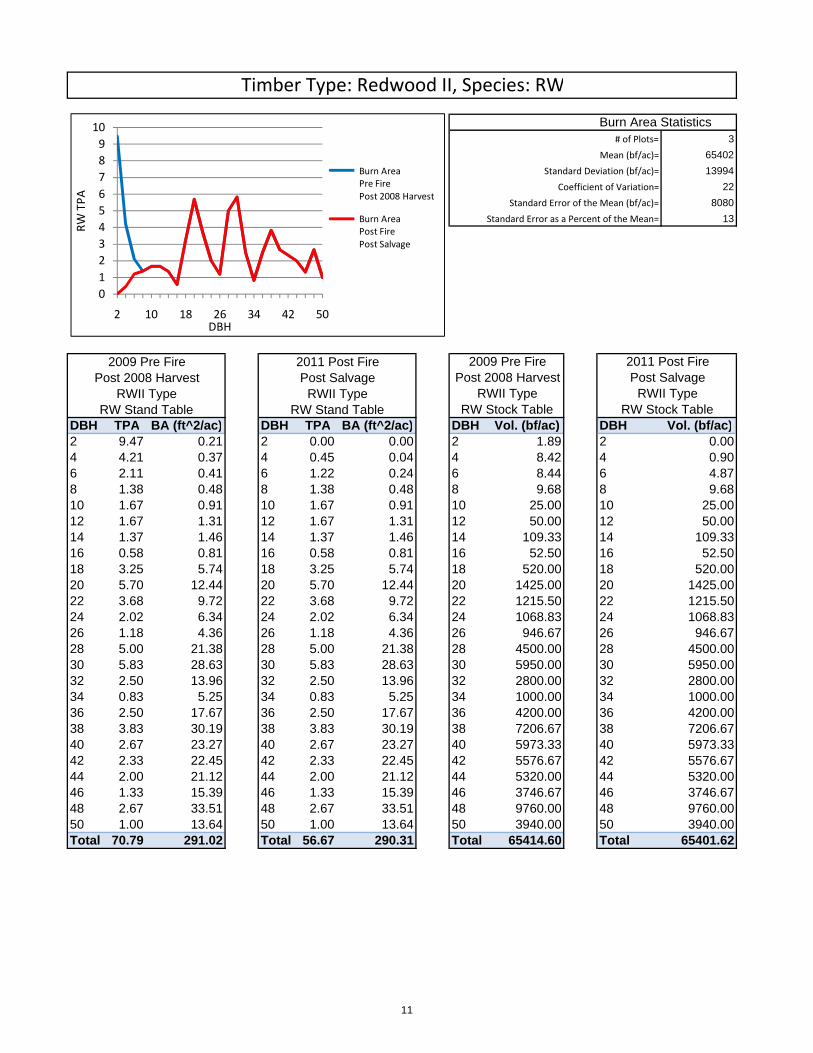
Burn Area Statistics# of Plots= 3
Mean (bf/ac)= 65402Standard Deviation (bf/ac)= 13994
Coefficient of Variation= 22Standard Error of the Mean (bf/ac)= 8080
Standard Error as a Percent of the Mean= 13
DBH TPA BA (ft^2/ac) DBH TPA BA (ft^2/ac) DBH Vol. (bf/ac) DBH Vol. (bf/ac)2 9.47 0.21 2 0.00 0.00 2 1.89 2 0.004 4.21 0.37 4 0.45 0.04 4 8.42 4 0.906 2.11 0.41 6 1.22 0.24 6 8.44 6 4.878 1.38 0.48 8 1.38 0.48 8 9.68 8 9.6810 1.67 0.91 10 1.67 0.91 10 25.00 10 25.0012 1.67 1.31 12 1.67 1.31 12 50.00 12 50.0014 1.37 1.46 14 1.37 1.46 14 109.33 14 109.3316 0.58 0.81 16 0.58 0.81 16 52.50 16 52.5018 3.25 5.74 18 3.25 5.74 18 520.00 18 520.0020 5.70 12.44 20 5.70 12.44 20 1425.00 20 1425.0022 3.68 9.72 22 3.68 9.72 22 1215.50 22 1215.5024 2.02 6.34 24 2.02 6.34 24 1068.83 24 1068.8326 1.18 4.36 26 1.18 4.36 26 946.67 26 946.6728 5.00 21.38 28 5.00 21.38 28 4500.00 28 4500.0030 5.83 28.63 30 5.83 28.63 30 5950.00 30 5950.0032 2.50 13.96 32 2.50 13.96 32 2800.00 32 2800.0034 0.83 5.25 34 0.83 5.25 34 1000.00 34 1000.0036 2.50 17.67 36 2.50 17.67 36 4200.00 36 4200.0038 3.83 30.19 38 3.83 30.19 38 7206.67 38 7206.6740 2.67 23.27 40 2.67 23.27 40 5973.33 40 5973.3342 2.33 22.45 42 2.33 22.45 42 5576.67 42 5576.6744 2.00 21.12 44 2.00 21.12 44 5320.00 44 5320.0046 1.33 15.39 46 1.33 15.39 46 3746.67 46 3746.6748 2.67 33.51 48 2.67 33.51 48 9760.00 48 9760.0050 1.00 13.64 50 1.00 13.64 50 3940.00 50 3940.00Total 70.79 291.02 Total 56.67 290.31 Total 65414.60 Total 65401.62
Timber Type: Redwood II, Species: RW
Post 2008 Harvest Post Salvage Post 2008 Harvest Post Salvage2009 Pre Fire 2011 Post Fire 2009 Pre Fire 2011 Post Fire
RW Stand Table RW Stand Table RW Stock Table RW Stock TableRWII Type RWII Type RWII Type RWII Type
012345678910
2 10 18 26 34 42 50
RW TPA
DBH
Burn Area‐Pre Fire
Burn Area‐Post Fire
Burn AreaPre FirePost 2008 Harvest
Burn AreaPost FirePost Salvage
11

# of Plots= 4Mean (bf/ac)= 30074
Standard Deviation (bf/ac)= 20447Coefficient of Variation= 68
Standard Error of the Mean (bf/ac)= 10224Standard Error as a Percent of the Mean*= 34
* Only 4 plots in the burn area. One of the plotshad only 3 out of 107 trees survive.
DBH TPA BA (ft^2/ac) DBH TPA BA (ft^2/ac) DBH Vol. (bf/ac) DBH Vol. (bf/ac)2 30.00 0.65 2 0.00 0.00 2 6.00 2 0.004 35.91 3.13 4 0.00 0.00 4 71.82 4 0.006 22.73 4.46 6 0.00 0.00 6 90.92 6 0.008 20.91 7.30 8 2.50 0.87 8 146.37 8 17.5010 17.73 9.67 10 7.50 4.09 10 265.95 10 112.5012 15.00 11.78 12 3.75 2.95 12 450.00 12 112.5014 18.75 20.04 14 15.00 16.03 14 1500.00 14 1200.0016 15.00 20.94 16 13.75 19.20 16 1350.00 16 1237.5018 8.75 15.46 18 6.25 11.04 18 1400.00 18 1000.0020 5.00 10.91 20 1.25 2.73 20 1250.00 20 312.50
Timber Type: Redwood IV, Species: RW
Burn Area-Post Fire Statistics
Post 2008 Harvest Post Salvage Post SalvagePost 2008 Harvest2009 Pre Fire 2011 Post Fire 2009 Pre Fire 2011 Post Fire
RW Stand Table RW Stock TableRW Stock TableRW IV Type RW IV Type RW IV TypeRW IV Type
RW Stand Table
05
10152025303540
2 6 10 14 18 22 26 30
RW TPA
DBH
Burn Area‐Pre Fire
Burn Area‐Post Fire
Burn AreaPre FirePost 2008 Harvest
Burn AreaPost FirePost Salvage
20 5.00 10.91 20 1.25 2.73 20 1250.00 20 312.5022 3.75 9.90 22 1.25 3.30 22 1237.50 22 412.5024 6.25 19.63 24 2.50 7.85 24 3312.50 24 1325.0026 3.75 13.83 26 1.25 4.61 26 3000.00 26 1000.0028 1.25 5.34 28 0.00 0.00 28 1125.00 28 0.0030 2.50 12.27 30 1.25 6.14 30 2550.00 30 1275.00Total 207.28 165.33 Total 56.25 78.81 Total 17756.06 Total 8005.00
05
10152025303540
2 6 10 14 18 22 26 30
RW TPA
DBH
Burn Area‐Pre Fire
Burn Area‐Post Fire
Burn AreaPre FirePost 2008 Harvest
Burn AreaPost FirePost Salvage
12

# of Plots= 4Mean (bf/ac)= 30074
Standard Deviation (bf/ac)= 20447Coefficient of Variation= 68
Standard Error of the Mean (bf/ac)= 10224Standard Error as a Percent of the Mean*= 34
* Only 4 plots in the burn area. One of the plotshad only 3 out of 107 trees survive.
DBH TPA BA (ft^2/ac) DBH TPA BA (ft^2/ac) DBH Vol. (bf/ac) DBH Vol. (bf/ac)2 2.50 0.05 2 0.00 0.00 2 1.10 2 0.004 2.50 0.22 4 0.00 0.00 4 7.95 4 0.006 1.25 0.25 6 0.00 0.00 6 12.67 6 0.008 1.25 0.44 8 1.25 0.44 8 28.83 8 28.83
10 5.00 2.73 10 1.25 0.68 10 218.20 10 54.5512 6.25 4.91 12 5.00 3.93 12 459.23 12 367.3914 2.50 2.67 14 0.00 0.00 14 285.37 14 0.0016 1.25 1.75 16 1.25 1.75 16 208.98 16 208.9818 0.00 0.00 18 0.00 0.00 18 0.00 18 0.00
DF Stand Table DF Stand Table DF Stock Table DF Stock Table
Timber Type: Redwood IV, Species: DF
Burn Area-Post Fire Statistics
Post 2008 Harvest Post Salvage Post 2008 Harvest Post SalvageRW IV Type RW IV Type RW IV Type RW IV Type
2009 Pre Fire 2011 Post Fire 2009 Pre Fire 2011 Post Fire
0
1
2
3
4
5
6
7
2 10 18 26 34 42
DF TPA
DBH
Burn Area‐Pre Fire
Burn Area‐Post Fire
Burn AreaPre FirePost 2008 Harvest
Burn AreaPost FirePost Salvage
18 0.00 0.00 18 0.00 0.00 18 0.00 18 0.0020 1.25 2.73 20 1.25 2.73 20 395.40 20 395.4022 2.50 6.60 22 0.00 0.00 22 1038.36 22 0.0024 1.25 3.93 24 0.00 0.00 24 665.74 24 0.0026 0.00 0.00 26 0.00 0.00 26 0.00 26 0.0028 6.25 26.72 28 2.50 10.69 28 5171.16 28 2068.4730 6.25 30.68 30 3.75 18.41 30 6298.15 30 3778.8932 1.25 6.98 32 0.00 0.00 32 1514.75 32 0.0034 1.25 7.88 34 0.00 0.00 34 1801.27 34 0.0036 1.25 8.84 36 1.25 8.84 36 2120.88 36 2120.8838 2.50 19.69 38 1.25 9.84 38 4950.49 38 2475.2440 1.25 10.91 40 1.25 10.91 40 2866.00 40 2866.0042 0.00 0.00 42 0.00 0.00 42 0.00 42 0.0044 1.25 13.20 44 1.25 13.20 44 3763.25 44 3763.25
Total 48.75 151.16 Total 21.25 81.40 Total 31807.79 Total 18127.88
13

# of plots= 18
Mean (bf/ac)= 15254
Standard Deviation (bf/ac)= 23638
Coefficient of Variation= 155
Standard Error of the Mean (bf/ac)= 5572
Standard Error as a Percent of the Mean= 37
DBH TPA BA (ft^2/ac) DBH TPA BA (ft^2/ac) DBH Vol. (bf/ac) DBH Vol. (bf/ac)2 5.63 0.12 2 0.00 0.00 2 2.47 2 0.004 12.08 1.05 4 1.39 0.12 4 38.44 4 4.426 11.88 2.33 6 2.50 0.49 6 120.43 6 25.348 9.58 3.34 8 2.22 0.78 8 220.96 8 51.2510 5.63 3.07 10 0.56 0.30 10 245.69 10 24.2412 4.38 3.44 12 1.11 0.87 12 321.83 12 81.6414 3.89 4.16 14 1.39 1.48 14 443.90 14 158.5416 6.11 8.53 16 2.78 3.88 16 1021.66 16 464.3918 3.33 5.89 18 1.39 2.45 18 780.26 18 325.1120 2.22 4.85 20 0.83 1.82 20 702.93 20 263.6022 4.44 11.73 22 2.50 6.60 22 1845.98 22 1038.3624 1.67 5.24 24 0.83 2.62 24 887.66 24 443.8326 2.50 9.22 26 1.11 4.10 26 1673.69 26 743.8628 1.11 4.75 28 0.28 1.19 28 919.32 28 229.8330 1.39 6.82 30 0.83 4.09 30 1399.59 30 839.7532 2.22 12.41 32 1.39 7.76 32 2692.88 32 1683.0534 0.83 5.25 34 0.83 5.25 34 1200.85 34 1200.8536 1.39 9.82 36 0.83 5.89 36 2356.54 36 1413.9238 0.28 2.19 38 0.28 2.19 38 550.05 38 550.0540 0.28 2.42 Total 23.06 51.88 40 636.89 Total 9542.0542 0.00 0.00 42 0.0044 0.00 0.00 44 0.0046 0.00 0.00 46 0.0048 0.28 3.49 48 1072.3550 0.00 0.00 50 0.0052 0.28 4.10 52 1347.9654 0.00 0.00 54 0.0056 0.00 0.00 56 0.0058 0.00 0.00 58 0.0060 0.28 5.45 60 2028.9662 0.00 0.00 62 0.0064 0.00 0.00 64 0.0066 0.28 6.60 66 2664.1668 0.00 0.00 68 0.0070 0.00 0.00 70 0.0072 0.00 0.00 72 0.0074 0.28 8.30 74 3694.47Total 82.24 134.58 Total 28869.93
Stock Table
Timber Type: DF, Species: DF
Burn Area‐Post Fire Statistics
Douglas-fir Type
2009 Pre FirePost Salvage
2011 Post FirePost Salvage
Douglas-fir TypeStand Table
2011 Post Fire
Douglas-fir TypeStand Table
Post 2008 HarvestDouglas-fir Type
Post 2008 Harvest2009 Pre Fire
Stock Table
024
68
10
1214
2 10 18 26 34 42 50 58 66 74
DF TP
A
DBH
Burn Area‐Pre Fire
Burn Area‐Post Fire
Burn AreaPre FirePost 2008 Harvest
Burn AreaPost FirePost Salvage
14

Burn Area-Post Fire Statistics# of Plots= 23
Mean (bf/ac)= 12739Standard Deviation (bf/ac)= 15821
Coefficient of Variation= 124Standard Error of the Mean (bf/ac)= 3299
Standard Error as a Percent of the Mean= 26
DBH TPA BA (ft^2/ac) DBH TPA BA (ft^2/ac) DBH Vol. (bf/ac) DBH Vol. (bf/ac)2 3.75 0.08 2 0.00 0.00 2 0.75 2 0.004 1.74 0.15 4 0.00 0.00 4 3.48 4 0.006 2.39 0.47 6 0.43 0.09 6 9.57 6 1.748 0.87 0.30 8 0.43 0.15 8 6.09 8 3.0410 1.30 0.71 10 0.87 0.47 10 19.57 10 13.0412 0.65 0.51 12 0.65 0.51 12 19.57 12 19.5714 0.43 0.46 14 0.43 0.46 14 34.78 14 34.7816 0.65 0.91 16 0.65 0.91 16 58.70 16 58.7018 0.65 1.15 18 0.65 1.15 18 104.35 18 104.3520 0.22 0.47 20 0.22 0.47 20 54.35 20 54.3522 0.65 1.72 22 0.65 1.72 22 215.22 22 215.2224 0.22 0.68 24 0.22 0.68 24 115.22 24 115.2226 0.65 2.40 26 0.43 1.60 26 521.74 26 347.8328 0.22 0.93 28 0.22 0.93 28 195.65 28 195.6530 0.65 3.20 30 0.22 1.07 30 665.22 30 221.7432 0.43 2.43 32 0.22 1.21 32 486.96 32 243.4834 0.00 0.00 34 0.00 0.00 34 0.00 34 0.0036 0.22 1.54 36 0.00 0.00 36 365.22 36 0.0038 0.22 1.71 38 0.22 1.71 38 408.70 38 408.7040 0.43 3.79 40 0.43 3.79 40 973.91 40 973.9142 0.00 0.00 42 0.00 0.00 42 0.00 42 0.0044 0.00 0.00 44 0.00 0.00 44 0.00 44 0.0046 0.00 0.00 46 0.00 0.00 46 0.00 46 0.0048 0.00 0.00 48 0.00 0.00 48 0.00 48 0.0050 0.00 0.00 50 0.00 0.00 50 0.00 50 0.0052 0.22 3.21 52 0.22 3.21 52 876.09 52 876.09Total 16.58 26.85 Total 7.17 20.16 Total 5135.10 Total 3887.39
Timber Type: DF/HW, Species: RW
RW Stand Table RW Stand Table RW Stock TableDFHW Type DFHW Type
2009 Pre Fire 2011 Post Fire 2009 Pre Fire 2011 Post Fire
RW Stock Table
Post 2008 Harvest Post Salvage Post 2008 Harvest Post SalvageDFHW Type DFHW Type
0
1
2
3
4
2 10 18 26 34 42 50
RW TPA
DBH
Burn Area‐Pre Fire
Burn Area‐Post Fire
Burn AreaPre FirePost 2008 Harvest
Burn AreaPost FirePost Salvage
15

Burn Area-Post Fire Statistics# of Plots= 23
Mean (bf/ac)= 12739Standard Deviation (bf/ac)= 15821
Coefficient of Variation= 124Standard Error of the Mean (bf/ac)= 3299
Standard Error as a Percent of the Mean= 26
DBH TPA BA (ft^2/ac) DBH TPA BA (ft^2/ac) DBH Vol. (bf/ac) DBH Vol. (bf/ac)2 5.47 0.12 2 0.00 0.00 2 2.40 2 0.004 4.53 0.40 4 1.09 0.09 4 14.41 4 3.466 5.22 1.02 6 0.87 0.17 6 52.89 6 8.818 4.13 1.44 8 1.74 0.61 8 95.27 8 40.1110 1.74 0.95 10 0.65 0.36 10 75.89 10 28.4612 2.61 2.05 12 0.65 0.51 12 191.68 12 47.9214 1.09 1.16 14 1.09 1.16 14 124.07 14 124.0716 2.61 3.64 16 1.09 1.52 16 436.12 16 181.7218 1.30 2.30 18 0.65 1.15 18 305.32 18 152.6620 1.96 4.27 20 1.74 3.79 20 618.88 20 550.1222 1.30 3.44 22 1.09 2.87 22 541.75 22 451.4624 1.52 4.78 24 1.30 4.10 24 810.47 24 694.6926 1.52 5.61 26 1.09 4.01 26 1018.77 26 727.6928 0.65 2.79 28 0.65 2.79 28 539.60 28 539.6030 0.43 2.13 30 0.22 1.07 30 438.13 30 219.0732 1.09 6.07 32 0.65 3.64 32 1317.17 32 790.3034 1.09 6.85 34 1.09 6.85 34 1566.32 34 1566.3236 0.43 3.07 36 0.00 0.00 36 737.70 36 0.0038 0.00 0.00 38 0.00 0.00 38 0.00 38 0.0040 0.22 1.90 40 0.22 1.90 40 498.44 40 498.4442 0.22 2.09 42 0.00 0.00 42 573.01 42 0.0044 0.00 0.00 44 0.00 0.00 44 0.00 44 0.0046 0.00 0.00 46 0.00 0.00 46 0.00 46 0.0048 0.22 2.73 48 0.00 0.00 48 839.23 48 0.0050 0.00 0.00 50 0.00 0.00 50 0.00 50 0.0052 0.22 3.21 52 0.22 3.21 52 1054.92 52 1054.9254 0.22 3.46 54 0.22 3.46 54 1175.06 54 1175.06Total 39.78 65.49 Total 16.30 43.25 Total 13027.52 Total 8854.88
Post 2008 Harvest Post Salvage Post 2008 Harvest Post Salvage
DF Stand Table DF Stand Table DF Stock Table DF Stock TableDFHW Type DFHW Type DFHW Type DFHW Type
2009 Pre Fire 2011 Post Fire 2009 Pre Fire 2011 Post Fire
Timber Type: DF/HW, Species: DF
0
1
2
3
4
5
6
2 10 18 26 34 42 50
DF TPA
DBH
Burn Area‐Pre Fire
Burn Area‐Post Fire
Burn AreaPre FirePost 2008 Harvest
Burn AreaPost FirePost Salvage
16

Burn Area Statistics# of Plots= 2
Mean (bf/ac)= 56191Standard Deviation (bf/ac)= 13140
Coefficient of Variation= 23
Timber Type: Smith Stand, Species: RW
56789
10
TPA
Burn Area‐Pre FireBurn AreaPre Fire Standard Error of the Mean (bf/ac)= 9291
Standard Error as a Percent of the Mean= 17
0123456789
10
2 10 18 26 34 42 50 58
RW TPA
Burn Area‐Pre Fire
Burn Area‐Post Fire
Burn AreaPre Fire
Burn AreaPost Fire
DBH TPA BA (ft^2/ac) DBH TPA BA (ft^2/ac) DBH Vol. (bf/ac) DBH Vol. (bf/ac)2 8.33 0.18 2 0.00 0.00 2 1.67 2 0.004 5 00 0 44 4 0 00 0 00 4 10 00 4 0 00
RW Stand Table RW Stand Table RW Stock Table RW Stock Table
2009 Pre Fire 2011 Post Fire 2009 Pre Fire 2011 Post Fire Smith Stand Type Smith Stand Type Smith Stand Type Smith Stand Type
0123456789
10
2 10 18 26 34 42 50 58
RW TPA
DBH
Burn Area‐Pre Fire
Burn Area‐Post Fire
Burn AreaPre Fire
Burn AreaPost Fire
4 5.00 0.44 4 0.00 0.00 4 10.00 4 0.006 8.33 1.64 6 0.00 0.00 6 33.32 6 0.008 6.83 2.38 8 4.55 1.59 8 47.78 8 31.8510 2.95 1.61 10 2.73 1.49 10 44.25 10 40.8812 7.05 5.54 12 7.05 5.54 12 211.50 12 211.5014 4.93 5.26 14 4.93 5.26 14 394.00 14 394.0016 2.88 4.01 16 2.88 4.01 16 258.75 16 258.7518 4.63 8.17 18 4.63 8.17 18 740.00 18 740.008 63 8 8 63 8 8 0 00 8 0 0020 2.88 6.27 20 2.88 6.27 20 718.75 20 718.7522 6.75 17.82 22 6.75 17.82 22 2227.50 22 2227.5024 3.25 10.21 24 3.25 10.21 24 1722.50 24 1722.5026 0.38 1.38 26 0.38 1.38 26 300.00 26 300.0028 0.00 0.00 28 0.00 0.00 28 0.00 28 0.0030 5.78 28.35 30 5.78 28.35 30 5890.50 30 5890.5032 2.98 16.62 32 2.98 16.62 32 3332.00 32 3332.0034 2 50 15 76 34 2 50 15 76 34 3000 00 34 3000 0034 2.50 15.76 34 2.50 15.76 34 3000.00 34 3000.0036 1.25 8.84 36 1.25 8.84 36 2100.00 36 2100.0038 1.50 11.81 38 1.50 11.81 38 2820.00 38 2820.0040 1.00 8.73 40 1.00 8.73 40 2240.00 40 2240.0042 0.00 0.00 42 0.00 0.00 42 0.00 42 0.0044 0.00 0.00 44 0.00 0.00 44 0.00 44 0.0046 0.00 0.00 46 0.00 0.00 46 0.00 46 0.0048 0.00 0.00 48 0.00 0.00 48 0.00 48 0.00
0 0 00 0 00 0 0 00 0 00 0 0 00 0 0 0050 0.00 0.00 50 0.00 0.00 50 0.00 50 0.0052 0.00 0.00 52 0.00 0.00 52 0.00 52 0.0054 0.00 0.00 54 0.00 0.00 54 0.00 54 0.0056 0.00 0.00 56 0.00 0.00 56 0.00 56 0.0058 3.00 55.04 58 3.00 55.04 58 15390.00 58 15390.0060 2.00 39.27 60 2.00 39.27 60 11940.00 60 11940.00Total 84.16 249.33 Total 60.00 246.16 Total 53422.51 Total 53358.23
17

Big CreekMill Creek
San Vicente Creek
Lower Scotts
Little Creek
Molino Creek
Davenport Landing
Queseria Creek
Archibald CreekWinter Creek
0 0.5 10.25Miles
Davenport USGS 7.5' Quadrangle
Lockheed Fire Burn SeveritySwanton Pacific Ranch NTMP
1:42,000
LegendLockheed Fire Perimeter
Swanton Pacific Ranch Boundary
NTMP Boundary
Watercourses
Watersheds
Burn SeverityHigh Intensity
Low Intensity
Forestry [email protected] Burned Acres Percent
Lockheed Fire Total 7,819 --Scott Creek Watershed 6,735 35%Swanton Pacific Ranch 1,142 35%
Burn Severity from USFS BARCFire Perimeter from Cal Fire
Ignition Area
18

Big CreekMill Creek
San Vicente Creek
Lower Scotts
Little Creek
Molino Creek
Davenport Landing
Queseria Creek
Archibald CreekWinter Creek
0 0.5 10.25Miles
Davenport USGS 7.5' Quadrangle
Lockheed Fire ProgressionSwanton Pacific Ranch NTMP
1:42,000
LegendLockheed Fire Perimeter
Swanton Pacific Ranch Boundary
NTMP Boundary
Watercourses
Watersheds
Fire ProgressionDay
8/12/2009
8/13/2009
8/14/2009
8/15/2009
8/16/2009
8/17/2009
8/18/2009
Forestry [email protected]
Area Burned Acres PercentLockheed Fire Total 7,819 --Scott Creek Watershed 6,735 35%Swanton Pacific Ranch 1,142 35% Fire Progression from Cal Fire
Ignition Area
19

20
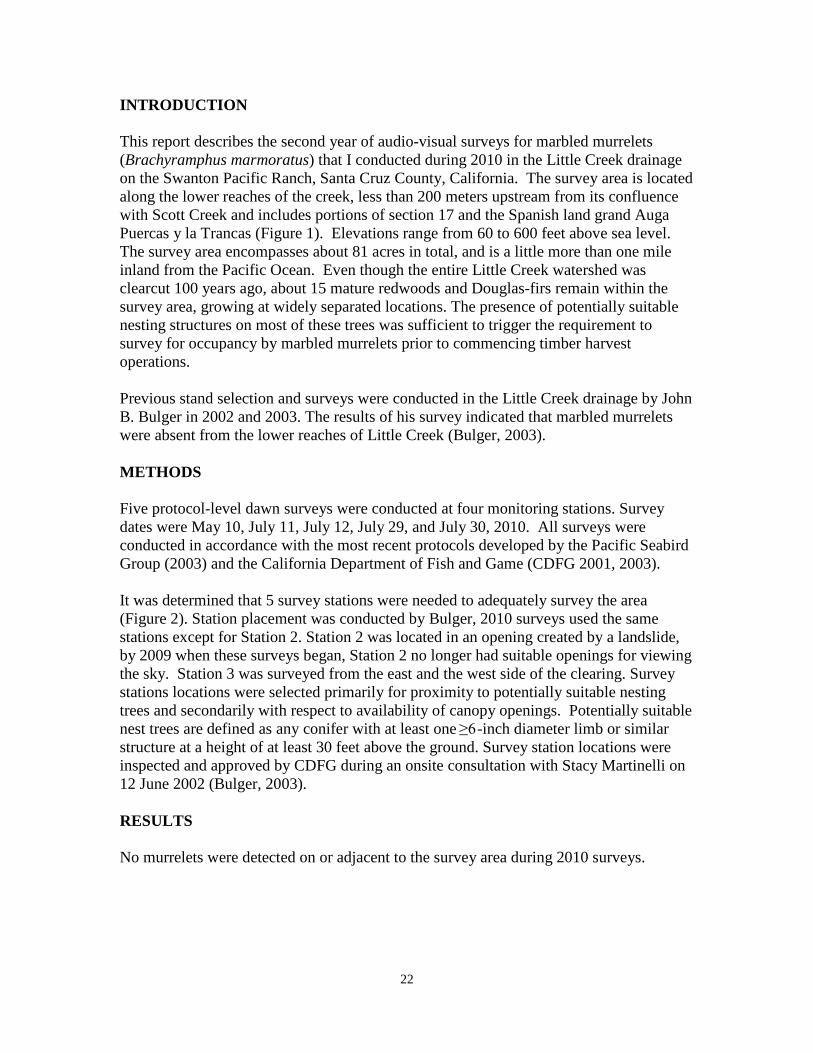
Marbled Murrelet Survey Results
Surveys have been conducted for two years in the Little Creek Stand and one year in the General Smith Stand to date. No detections have resulted from any of these surveys (see attached report). Murrelet surveys will continue for one more year in the General Smith Stand. It is not known at this time whether trees previously designated as habitat will survive following the effects of the Lockheed Fire. Forest mortality assessments will continue over the next few years. If habitat changes are significant enough to warrant adjustment, habitat designations will be proposed for amendment at that time.

21
Results of Surveys for Marbled Murrelets during 2010 At the Lower Little Creek Stand, Swanton Pacific Ranch
Santa Cruz County, California
Prepared for:
Big Creek Lumber 3564 Highway 1
Davenport, CA 95017
Prepared by:
Portia Halbert 2560 Ocean St. Ext.
Santa Cruz, CA 95060
February 2011
22
INTRODUCTION This report describes the second year of audio-visual surveys for marbled murrelets (Brachyramphus marmoratus) that I conducted during 2010 in the Little Creek drainage on the Swanton Pacific Ranch, Santa Cruz County, California. The survey area is located along the lower reaches of the creek, less than 200 meters upstream from its confluence with Scott Creek and includes portions of section 17 and the Spanish land grand Auga Puercas y la Trancas (Figure 1). Elevations range from 60 to 600 feet above sea level. The survey area encompasses about 81 acres in total, and is a little more than one mile inland from the Pacific Ocean. Even though the entire Little Creek watershed was clearcut 100 years ago, about 15 mature redwoods and Douglas-firs remain within the survey area, growing at widely separated locations. The presence of potentially suitable nesting structures on most of these trees was sufficient to trigger the requirement to survey for occupancy by marbled murrelets prior to commencing timber harvest operations. Previous stand selection and surveys were conducted in the Little Creek drainage by John B. Bulger in 2002 and 2003. The results of his survey indicated that marbled murrelets were absent from the lower reaches of Little Creek (Bulger, 2003). METHODS Five protocol-level dawn surveys were conducted at four monitoring stations. Survey dates were May 10, July 11, July 12, July 29, and July 30, 2010. All surveys were conducted in accordance with the most recent protocols developed by the Pacific Seabird Group (2003) and the California Department of Fish and Game (CDFG 2001, 2003). It was determined that 5 survey stations were needed to adequately survey the area (Figure 2). Station placement was conducted by Bulger, 2010 surveys used the same stations except for Station 2. Station 2 was located in an opening created by a landslide, by 2009 when these surveys began, Station 2 no longer had suitable openings for viewing the sky. Station 3 was surveyed from the east and the west side of the clearing. Survey stations locations were selected primarily for proximity to potentially suitable nesting trees and secondarily with respect to availability of canopy openings. Potentially suitable nest trees are defined as any conifer with at least one ≥6-inch diameter limb or similar structure at a height of at least 30 feet above the ground. Survey station locations were inspected and approved by CDFG during an onsite consultation with Stacy Martinelli on 12 June 2002 (Bulger, 2003). RESULTS No murrelets were detected on or adjacent to the survey area during 2010 surveys.

23
CONCLUSIONS Surveys for marbled murrelets have been conducted in the Little Creek drainage six of the last eleven years. No murrelets have been detected during any of these surveys (Bulger, 2003, Halbert 2009). For the purposes of forestry management, 2010 was the second season of surveys required to determine the occupancy status of the survey area. Marbled murrelets were not detected at these sites during the 10 surveys over a two-year period, therefore, this area can be classified as probable absence for marbled murrelets. Under the current CDFG guidelines the results of these surveys are valid for a period of at least three years for forest management purposes. Under some circumstances the period of validity for negative results may be extended beyond three years, if approved in consultation with CDFG. Table 1 Dates and locations of surveys for marbled murrelets at Lower Little Creek, Swanton Pacific Ranch, Santa Cruz County, California.
2010 Surveys Date Station
5/10 4 7/11 1 7/12 5 7/29 3b 7/30 3a
2009 Surveys
Date Station 5/10 1 5/30 3 6/20 4 7/14 5 7/23 1

24
LITERATURE CITED Bulger, J.B. 2003. Results of Marbled Murrelet Surveys during 2002 in the Lower Little Creek Drainage, Swanton Pacific Ranch. Santa Cruz County, California. Report prepared for Big Creek Lumber Company. August 2003. Halbert, P. 2009. Results of Marbled Murrelet Surveys during 2009 in the Lower Little Creek Drainge, Swanton Pacific Ranch. Santa Cruz County, California. Report prepared for Big Creek Lumber Company. March 2010. Pacific Seabird Group. Methods for surveying Marbled Murrelets in forests: a revised protocol for land management and research. Marbled Murrelet Technical Committee. Report dated 6 January 2003. CDFG. Marbled Murrelet Survey Protocol Guidelines. Habitat Conservation Planning Branch Sacramento. 2003. CDFG. Marbled Murrelet Survey Protocol Guidelines. Habitat Conservation Planning Branch Sacramento. 2001.

25

26