“Calculation and Applications Phase Equilibria” Principles...
25
Office: 33-313 Telephone: 880-7221 Email: [email protected] Office hours: by appointment 2017 Fall 1 “Calculation and Applications Phase Equilibria” Principles of Solidification Eun Soo Park 05. 15. 2017
Transcript of “Calculation and Applications Phase Equilibria” Principles...

Office: 33-313 Telephone: 880-7221Email: [email protected] hours: by appointment
2017 Fall
1
“Calculation and Applications Phase Equilibria”
Principles of Solidification
Eun Soo Park
05.15.2017

Solidification: Liquid Solid
Fig. 4.19 A hypothetical phase diagram.
1) Pure Metals: Nucleation and Growth (thermally activated process)
a) homogeneous Nucleation or Heterogeneous Nucleation • Undercooling ΔT
• Interfacial energyγSL / S(θ) wetting angle
b) Growth of solidKinetic roughening
Liquid α
No compositional changeduring solidification

3
“Alloy solidification”1. Solidification of single-phase alloys
1) Equilibrium Solidification: perfect mixing in solid and liquid
2) No Diffusion on Solid, Diffusional Mixing in the Liquid
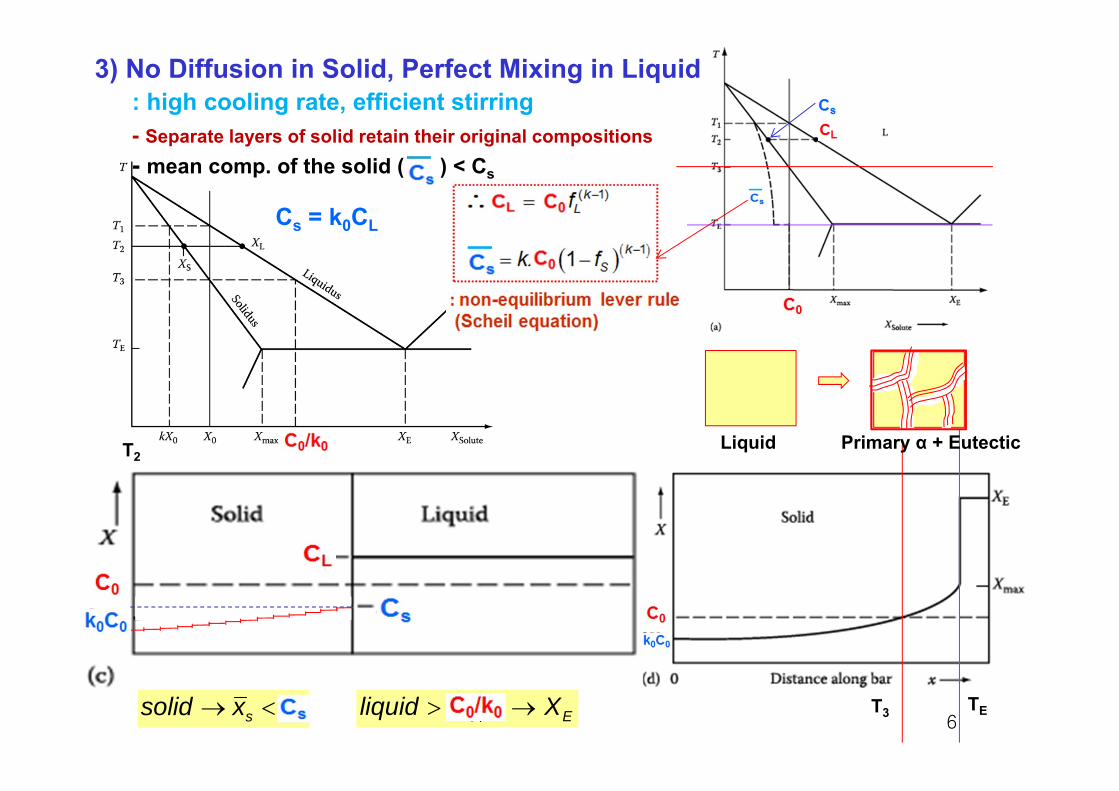
3) No Diffusion in Solid, Perfect Mixing in Liquid
• Three limiting cases
- Planar S/L interface → unidirectional solidification
- Cellular and Dendritic Solidification
- Superheated liquid
- Constitutional Supercooling
Chapter 5. Redistribution of solute during solidification
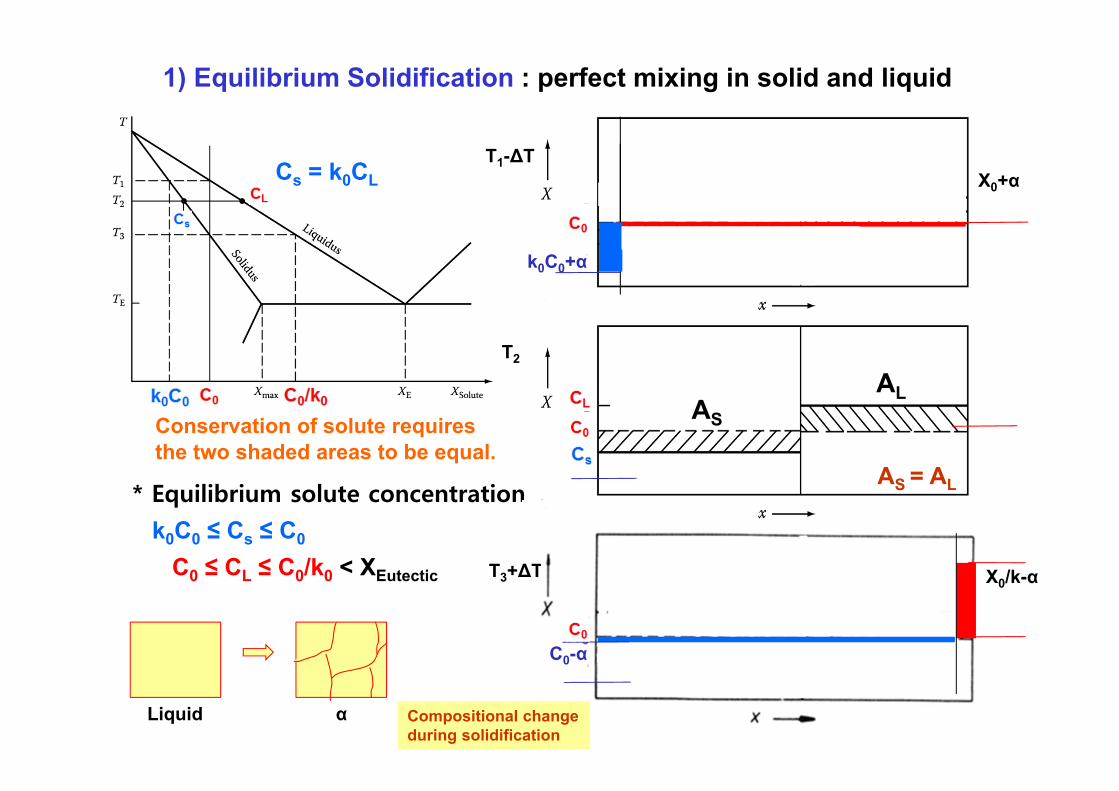
Cs = k0CL
1) Equilibrium Solidification : perfect mixing in solid and liquid
T1-ΔT
T2
* Equilibrium solute concentration
k0C0 ≤ Cs ≤ C0
C0 ≤ CL ≤ C0/k0 < XEutectic
k0C0+α
X0+α
Liquid α
AS
AL
AS = AL
Conservation of solute requires the two shaded areas to be equal.
T3+ΔT
C0-α
X0/k-α
Compositional changeduring solidification
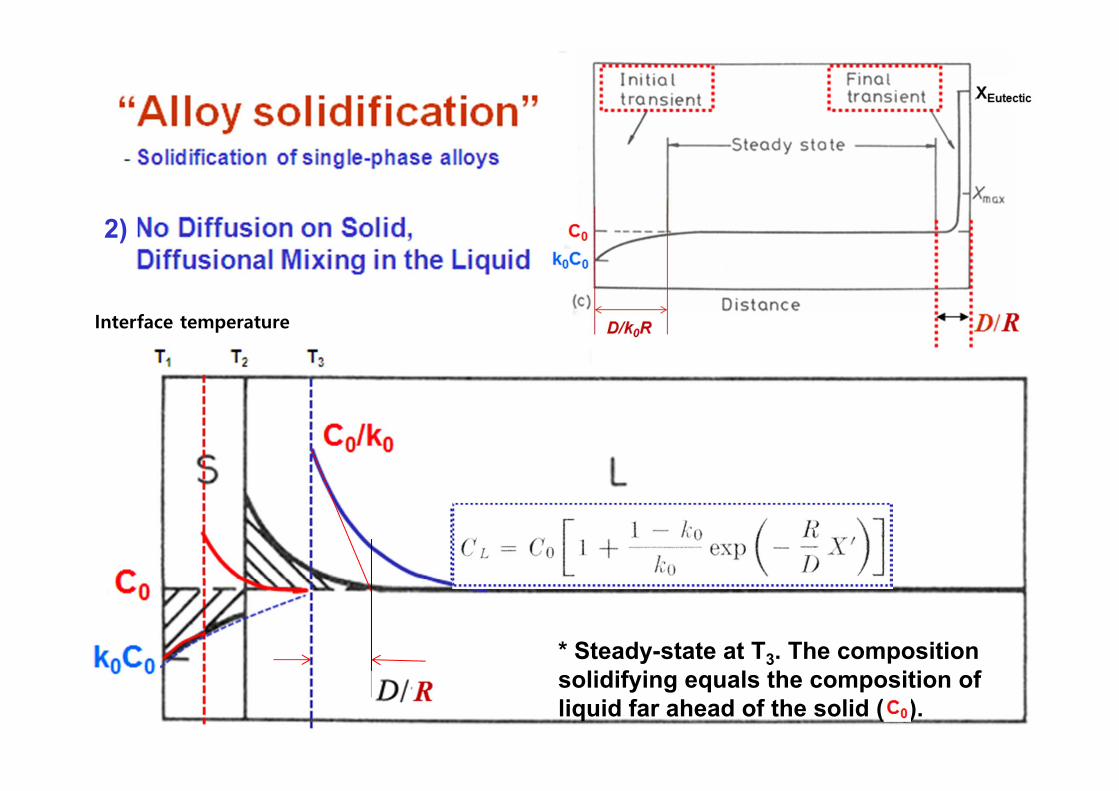
Interface temperature
* Steady-state at T3. The composition solidifying equals the composition of liquid far ahead of the solid (X0).
2)
6
3) No Diffusion in Solid, Perfect Mixing in Liquid
- Separate layers of solid retain their original compositions
- mean comp. of the solid ( ) < XsSX
T1-ΔT
T3 TE
Liquid Primary α + Eutectic
s ssolid x x 0 Eliquid X k X
Cs = k0CL
: high cooling rate, efficient stirring
T2
- Separate layers of solid retain their original compositions- mean comp. of the solid ( ) < CsSX
7
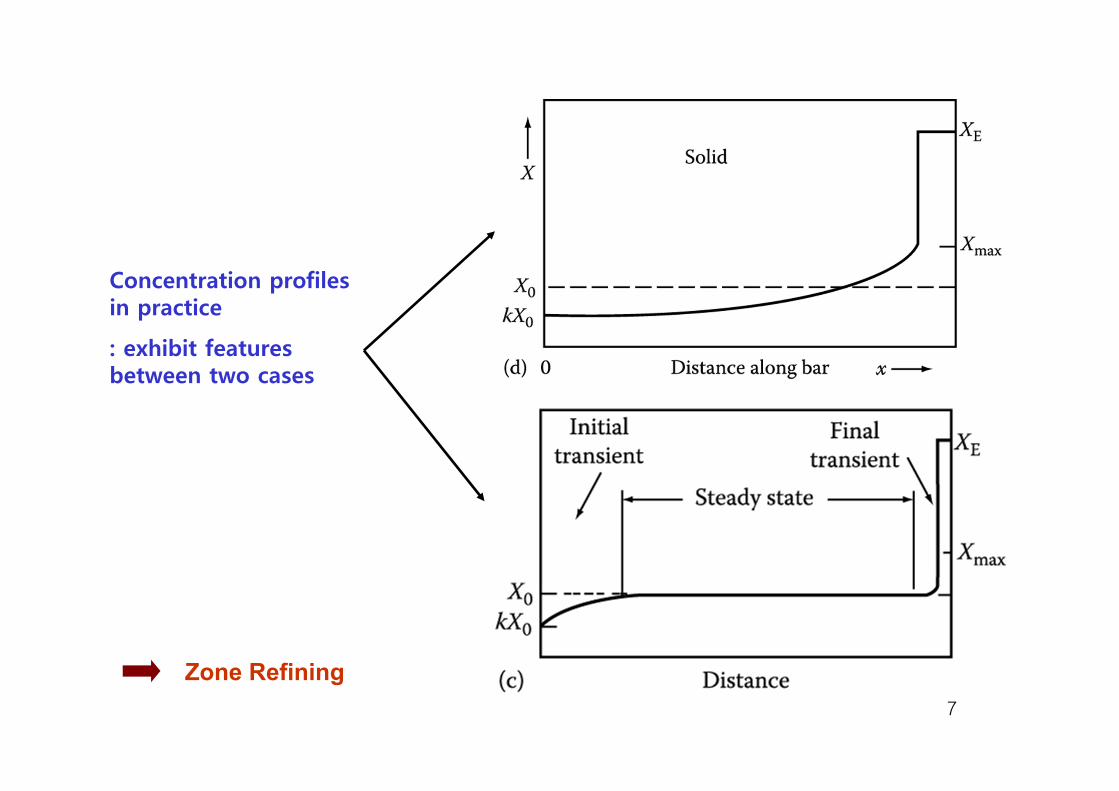
Concentration profiles in practice
: exhibit features between two cases
Zone Refining

8
Fig. 5.18. Solute distribution after uniaxial solidification. (a) Complete diffusion in solid and liquid, (b) mixing by diffusion only, (c) complete mixing in liquid (kE=k0), (d) partial mixing in liquid [kE = (1+k0)/2].
* Comments: Solidus temperature of an alloyTL: Solidification start → supercooling → TL (recalesence)→ TS: Solidification finish Phase diagram → determined from cooling curve ∴TL satisfactory, TS large errorsWhen a single-phase solid is formed, the last liquid always solidifies at a temperature below the solidus for the original liquid (of composition C0) some times by a large amount→ Please check “Zone refining”.

9
What would be “Te“ along the concentration profile ahead of the growth front during steady-state solidification?
5.5ConstitutionalsupercoolingFast Solute diffusion similar to the conduction of latent heat in pure metal,possible to break up the planar front into dendrites.+ complicated by the possibility of temp. gradients in the liquid.
TL’ Tetemp. gradients in the liquid
steady-state solidification at a planar interface

10
Fig. 5.26. Variation of concentration and liquidus temperature ahead of an interface.(a) Variation of concentration, (b) relationship between concentration and liquidus temperature, (c) variation of liquidus temperature.
liquidus temp, of liquid in contact with the interface (T2) is lower than that of the liquid at a greater distance from the interface (T1).
Assumption: Steady state condition Typical binary alloy with k0=0.2
Variation of Te depending on distance from interface

11
Fig. 5.27. Actual temperature of the liquid and its liquidus temperature
→ Actual temp. of liquid at interface < Temp. of bulk liquid: superheated condition : Undercooling may occur in front of the solidification interface due to the change of the equilibrium solidification temperature (Te) by the solute released from the solid phase.
Equilibrium solidification temp. (Te)
TL’ temp. gradients in the liquid

12
At the interface, TL = Te (not TE) = T3
* Constitutional Supercooling No Diffusion on Solid, Diffusional Mixing in the Liquid
Steady State
* Actual temperature gradient in Liquid
TL’ * equilibrium solidification temp. change
Te
TL' > (T1-T3)/(D/v) : the protrusion melts back - Planar interface: stable
13
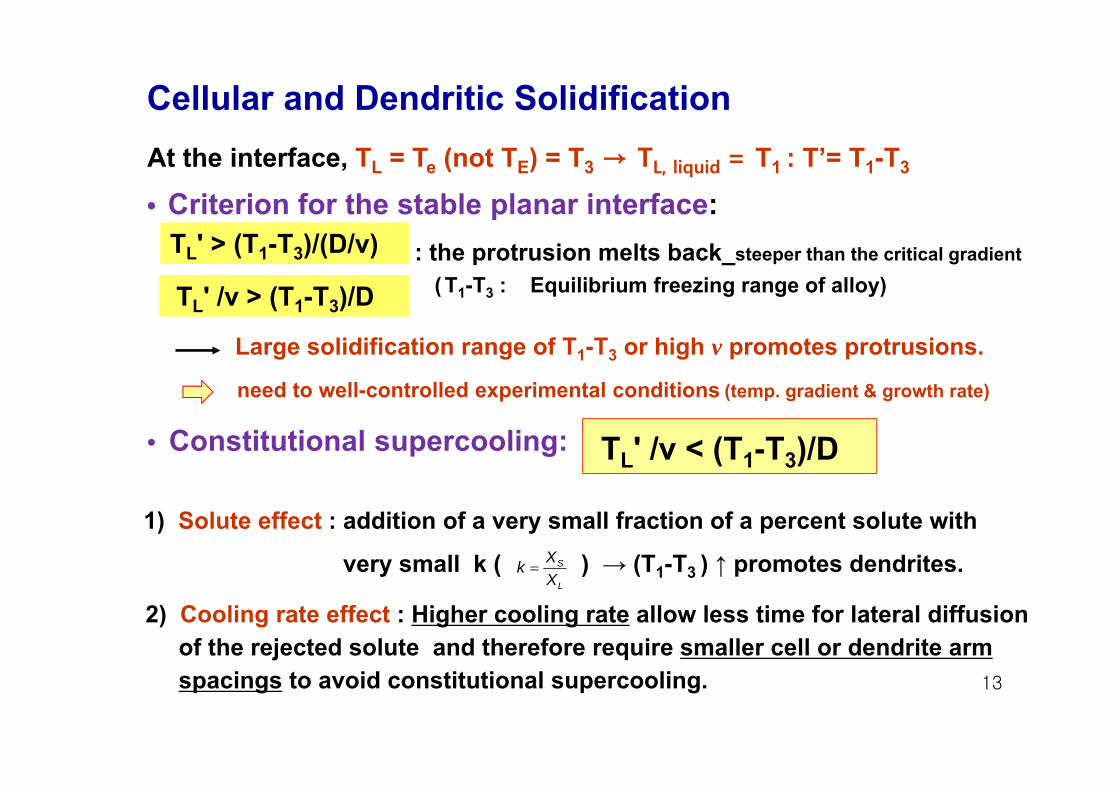
Cellular and Dendritic SolidificationAt the interface, TL = Te (not TE) = T3 → TL, liquid = T1 : T’= T1-T3
• Criterion for the stable planar interface:: the protrusion melts back_steeper than the critical gradient
( T1-T3 : Equilibrium freezing range of alloy)
Large solidification range of T1-T3 or high v promotes protrusions.need to well-controlled experimental conditions (temp. gradient & growth rate)
• Constitutional supercooling:
1) Solute effect : addition of a very small fraction of a percent solute with
very small k ( ) → (T1-T3 ) ↑ promotes dendrites.
2) Cooling rate effect : Higher cooling rate allow less time for lateral diffusion of the rejected solute and therefore require smaller cell or dendrite arm spacings to avoid constitutional supercooling.
TL' /v < (T1-T3)/D
S
L
XkX
TL' /v > (T1-T3)/D
TL' > (T1-T3)/(D/v)

14
* Instability due to constitutional supercooling TL' /v < (T1-T3)/D
Fig. 5.28. Freezing range in copper-tin alloys
(a) Freezing range of 90Cu-10Sn~ very large (190 K) → the liquidahead of the advancinginterface could be constitutionalsupercooling by 190 K.
(b) This condition (= largeundercooling) is never evenapproached because a verymuch smaller amount ofsupercooling is sufficient to setup an instability
1) Solute effect : addition of a very small fraction of a percent solute with
very small k ( ) → (T1-T3 ) ↑ promotes dendrites.S
L
XkX
15
* Constitutional supercooling → Interface instability → compositional fluctuation of solid → “Periodicity of solute”
1) Axial periodicity of solute (Landau proposal)
(a) Solute content of solid varies periodically in the direction of travel ofthe solid-liquid interface.→ Uniform in any plane parallel to the interface
Assumption: (a) whole of the interface advances together/ (b) Accumulation of solute, as a resultof the “initial transient”, increase progressively until some concentration is reachedwhere either independent nucleation would occur in the most supercooled region, orthe existing crystal would grow into that region.
(b) Landau cite evidence for periodic variation of concentration ofantimony in Ge crystals grown by the Kyroplous method, but noquantitative comparison btw this theory and experiment is available. →No conclusive evidence btw Landau type of instability and periodicfluctuation in the thermal characteristics of the system
2) Transverse periodicity of solute (opposite with axial periodicity)
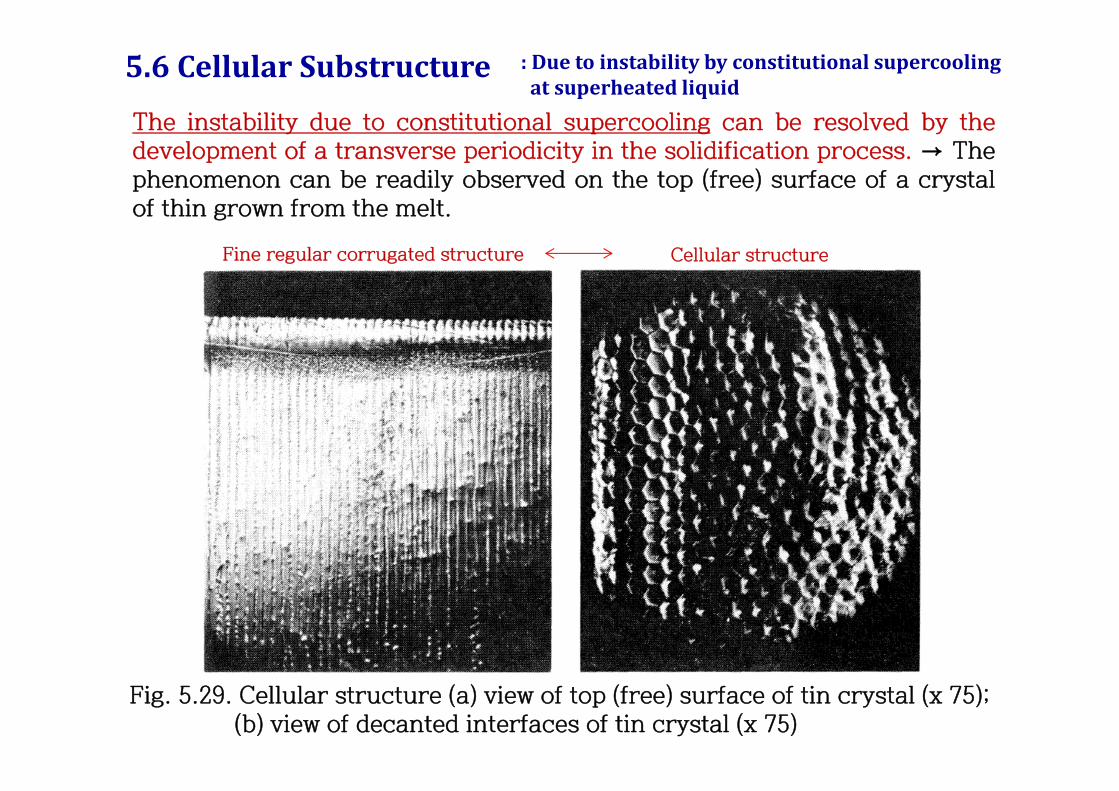
The instability due to constitutional supercooling can be resolved by thedevelopment of a transverse periodicity in the solidification process. → Thephenomenon can be readily observed on the top (free) surface of a crystalof thin grown from the melt.
Fig. 5.29. Cellular structure (a) view of top (free) surface of tin crystal (x 75); (b) view of decanted interfaces of tin crystal (x 75)
Fine regular corrugated structure Cellular structure
5.6CellularSubstructure :Duetoinstabilitybyconstitutionalsupercoolingatsuperheatedliquid

The instability due to constitutional supercooling can be resolved by thedevelopment of a transverse periodicity in the solidification process. → Thephenomenon can be readily observed on the top (free) surface of a crystalof thin grown from the melt.
Fig. 5.29. (continue) Cellular structure (c) Less regular forms of cell
5.6CellularSubstructure :Duetoinstabilitybyconstitutionalsupercoolingatsuperheatedliquid

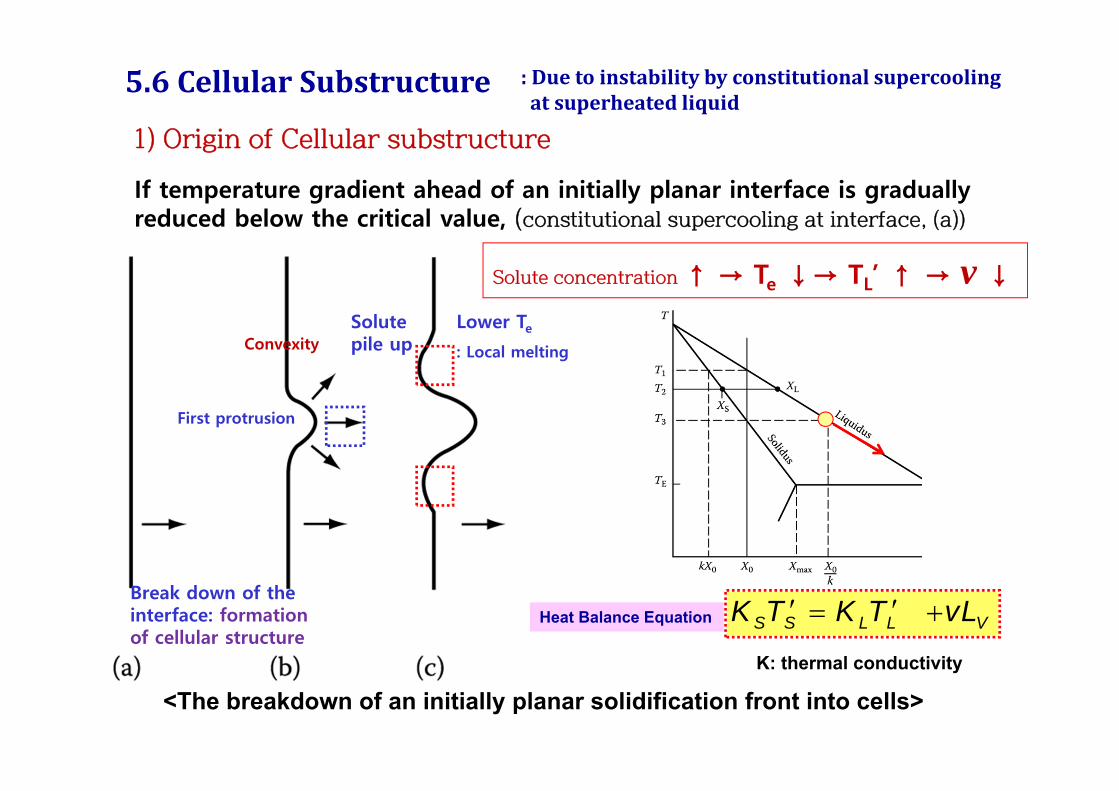
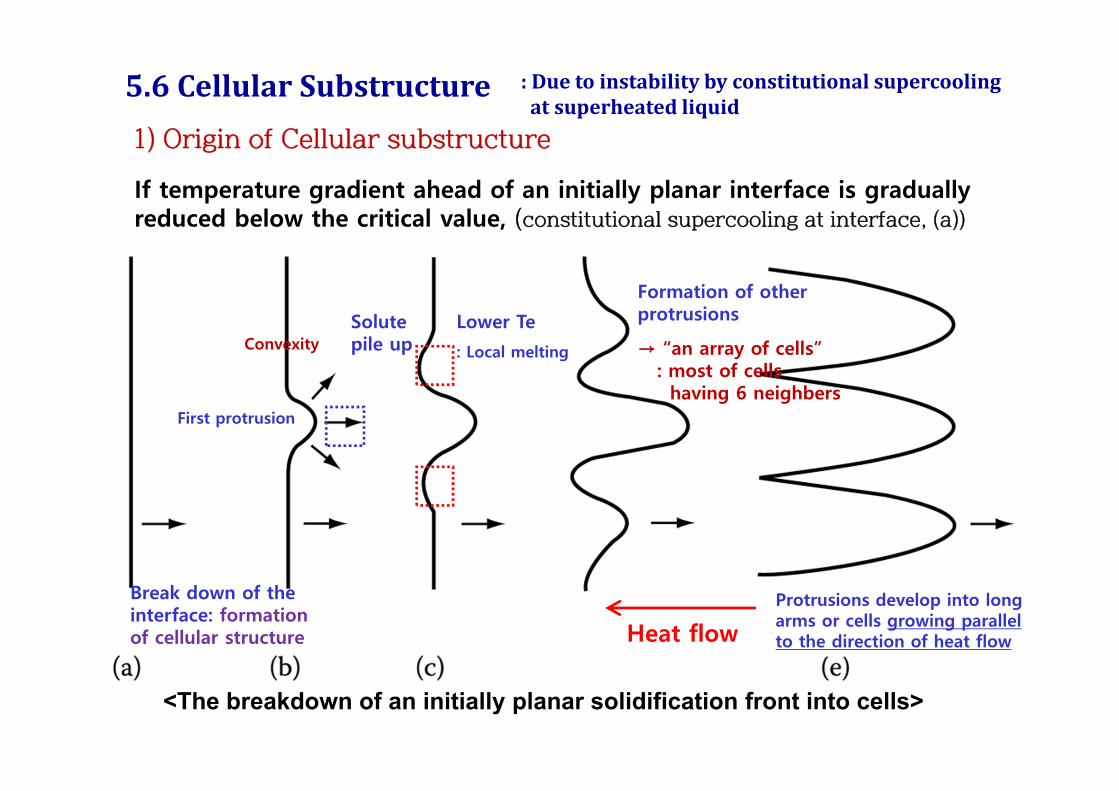
1) Origin of Cellular substructureIf temperature gradient ahead of an initially planar interface is gradually reduced below the critical value, (constitutional supercooling at interface, (a))
<The breakdown of an initially planar solidification front into cells>
LS
Heat flowFig. 5.30. Supercooling ahead of planar interface
5.6CellularSubstructure :Duetoinstabilitybyconstitutionalsupercoolingatsuperheatedliquid

1) Origin of Cellular substructure: discussed by solute redistribution theoryCell formation can be suppressed by a) reducing the solute content, (T1-T3)↓ / b) reducing the speed of growth, v ↓, or/ c) increasing the temperature gradient, TL’ to eliminate the region of suppercooling (AV in Fig. 5.30).
TL' /v < (T1-T3)/D
5.6CellularSubstructure :Duetoinstabilitybyconstitutionalsupercoolingatsuperheatedliquid

Break down of the interface: formation of cellular structure
First protrusion
<The breakdown of an initially planar solidification front into cells>
Convexity
Fig. 5.14. Solute diffusion ahead of a convex interface
1) Origin of Cellular substructureIf temperature gradient ahead of an initially planar interface is gradually reduced below the critical value, (constitutional supercooling at interface, (a))
5.6CellularSubstructure :Duetoinstabilitybyconstitutionalsupercoolingatsuperheatedliquid
Solute pile up
Lower Te
: Local melting
Break down of the interface: formation of cellular structure
First protrusion
<The breakdown of an initially planar solidification front into cells>
Convexity
S S L L VK T K T vL Heat Balance Equation
K: thermal conductivity
Solute concentration ↑ → Te ↓→ TL’ ↑ → v ↓
1) Origin of Cellular substructureIf temperature gradient ahead of an initially planar interface is gradually reduced below the critical value, (constitutional supercooling at interface, (a))
5.6CellularSubstructure :Duetoinstabilitybyconstitutionalsupercoolingatsuperheatedliquid
22Heat flow
Solute pile up
Lower Te
: Local melting
Break down of the interface: formation of cellular structure
Formation of other protrusions
→ “an array of cells”: most of cellshaving 6 neighbers
Protrusions develop into long arms or cells growing parallel to the direction of heat flow
First protrusion
<The breakdown of an initially planar solidification front into cells>
Convexity
1) Origin of Cellular substructureIf temperature gradient ahead of an initially planar interface is gradually reduced below the critical value, (constitutional supercooling at interface, (a))
5.6CellularSubstructure :Duetoinstabilitybyconstitutionalsupercoolingatsuperheatedliquid

23
* Cellular microstructures
(a) A decanted interface of a cellularly solidified Pb-Sn alloy (x 120) (after J.W. Rutter in Liquid Metals and Solidification, American Society for Metals, 1958, p. 243).
(b) Longitudinal view of cells in carbon tetrabromide (x 100) (after K.A. Jackson and J.D. Hunt, Acta Metallurgica 13 (1965) 1212).
Note that each cell has virtually the same orientation as its neighbors and together they form a single grain.

24
* Temp. and solute distributions associated with cellular solidification. 1) Note that solute enrichment in the liquid between the cells, and
coring in the cells with eutectic in the cell walls.
Solute file up → eutectic solidification→ formation of 2nd phases at the cell wall
Even if X0 << Xmax
Tips of the cells grow into the hottest liquid and therefore contain the least solute.
2)
3)
25
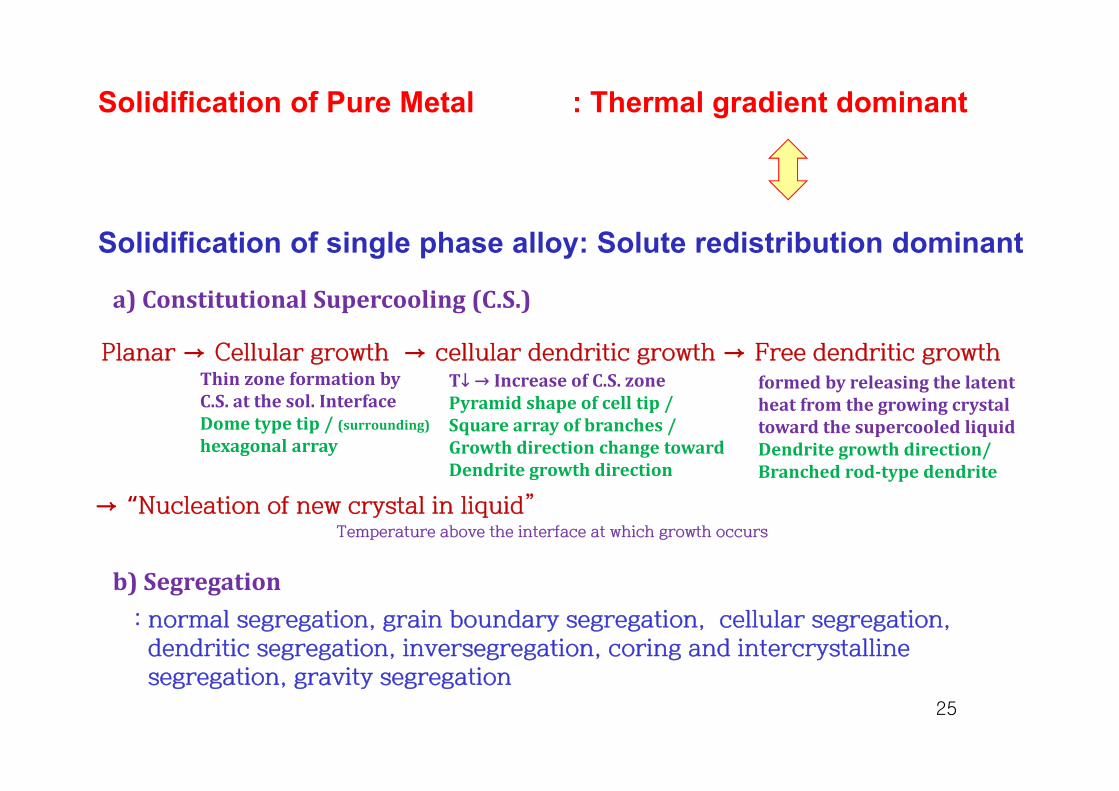
Solidification of Pure Metal : Thermal gradient dominant
Solidification of single phase alloy: Solute redistribution dominant
Planar → Cellular growth → cellular dendritic growth → Free dendritic growth
→ “Nucleation of new crystal in liquid”
a)ConstitutionalSupercooling(C.S.)
Temperature above the interface at which growth occurs
b)Segregation: normal segregation, grain boundary segregation, cellular segregation, dendritic segregation, inversegregation, coring and intercrystalline segregation, gravity segregation
ThinzoneformationbyC.S.atthesol.InterfaceDometypetip/(surrounding)hexagonalarray
T↓→IncreaseofC.S.zonePyramidshapeofcelltip/Squarearrayofbranches/GrowthdirectionchangetowardDendritegrowthdirection
formedbyreleasingthelatentheatfromthegrowingcrystaltowardthesupercooledliquidDendritegrowthdirection/Branchedrod‐typedendrite