Anticipating 2025 in Northeast Corridor Transportation
92
Aerial, Highway, Marine, and Rail Technologies & Linkages Anticipating 2025 in Northeast Corridor Transportation: Anticipating 2025 in Northeast Corridor Transportation: Aerial, Highway, Marine, and Rail Technologies & Linkages Featured Papers from the 2007 Public Policy Forum published October 2008 Institute for Public Administration College of Human Services, Education & Public Policy University of Delaware co-sponsored by the Delaware Department of Transportation www.ipa.udel.edu www.ipa.udel.edu
Transcript of Anticipating 2025 in Northeast Corridor Transportation
Aerial, Highway, Marine, and RailTechnologies &Linkages
Anticipating 2025 in NortheastCorridor Transportation:Anticipating 2025 in NortheastCorridor Transportation:Aerial, Highway, Marine, and RailTechnologies &Linkages
Featured Papers fromthe 2007 Public PolicyForum
published October 2008
Institute for Public AdministrationCollege of Human Services, Education & Public PolicyUniversity of Delaware
co-sponsored by the Delaware Department of Transportation
www.ipa.udel.eduwww.ipa.udel.edu
Anticipating 2025 in Northeast Corridor Transportation:
Aerial, Highway, Marine, and Rail Technologies and Linkages
FEATURED PAPERS
FROM THE 2007 PUBLIC POLICY FORUM
Friday, October 19, 2007 Clayton Hall Conference Center • University of Delaware • Newark, Del.
Authors Robert Warren, Ph.D.
William P. Anderson, Ph.D. Jean-Paul Rodrigue, Ph.D.
T. H. Wakeman III, Eng.Sc.D. Allison L. C. de Cerreño, Ph.D.
published October 2008
by the
Institute for Public Administration College of Human Services, Education & Public Policy
University of Delaware
PREFACE
Anticipating 2025 in Northeast Corridor Transportation: Aerial, Highway, Marine, and Rail Technologies & Linkages i
Preface As the Director of the Institute for Public Administration (IPA) at the University of Delaware, I am pleased to provide this report on the Anticipating 2025 in Northeast Corridor Transportation: Aerial, Highway, Marine, and Rail Technologies & Linkages policy forum. The forum was held October 19, 2007, at the University of Delaware’s John M. Clayton Hall Conference Center and was sponsored by IPA with the University Transportation Center (UTC) in conjunction with the Delaware Department of Transportation (DelDOT). Informed by a set of commissioned research papers, policymakers, planners, private-sector leaders, advocates, and scholars from around the region convened to discuss, debate, and speculate on what can and should be done now to optimize mobility in the Northeast Corridor two decades forward. I would like to take this opportunity to acknowledge those who contributed time and energy toward the success of the forum. My colleague, Robert Warren (School of Urban Affairs & Public Policy, University of Delaware) was principally involved in forum planning and provided the overview for the forum discussion. I would especially like to thank Secretary Carolann D. Wicks (DelDOT) for her welcoming comments and the University of Delaware’s Sue McNeil (UTC) and Ardeshir Faghri (Delaware Center for Transportation) for their introductory remarks. I also want to acknowledge our five speakers for their presentations (full-text copies of the latter four are included in this report):
Kaan Ozbay and Ozlem Yanmaz-Tuzel (Center for Advanced Infrastructure and Transportation, Rutgers University) “NEC Auto and Truck Transportation with Emphasis on New Technology.”
William P. Anderson (Center for Transportation Studies, Boston University) “Air Transportation in the Northeast Corridor: Challenges for the Future.”
Allison L. C. de Cerreño (NYU-Wagner Rudin Center for Transportation Policy and Management) “The Future of Transportation in the Northeast Corridor, 2007-2025: Rail Transportation.”
T.H. Wakeman III (Center for Maritime Systems, Stevens Institute of Technology) “Marine Transportation of International Freight for the Northeast Corridor.”
Jean-Paul Rodrigue (Department of Economics & Geography, Hofstra University) “The Insertion of BostWash Corridor Within the Global and National Dimensions.”
George Schoener (I-95 Corridor Coalition), Jack Lettiere (Nation’s Port), Richard Walker (U.S. Maritime Administration), and James P. RePass (National Corridors Initiative) offered their insight on the panel “Planning for Technological Change and Intermodal Linkage Two Decades Forward.” I also want to thank the following IPA staff for their involvement in this forum. Ed O’Donnell and research assistants Tim Soper and Gilad Skolnick assisted with the planning and coordination of the forum event and the preparation of materials. Nell Downer and Wanda Moore were responsible for onsite registration and logistics. Mark Deshon, Lisa Moreland, and Shelley Cook, an IPA research assistant, managed the overall effort to produce and edit this report. Mark Deshon also designed its cover. Jerome R. Lewis, Ph.D. Director, Institute for Public Administration

TABLE OF CONTENTS
Anticipating 2025 in Northeast Corridor Transportation: Aerial, Highway, Marine, and Rail Technologies & Linkages ii
Table of Contents Introduction 1 by Robert Warren, Ph.D. Air Transportation in the Northeast Corridor: Challenges for the Future 4 by William P. Anderson, Ph.D. The Insertion of BostWash Within the Global and National Freight Frameworks 27 by Jean-Paul Rodrigue, Ph.D. Marine Transportation of International Freight for the Northeast Corridor 38 by T. H. Wakeman III, Eng.Sc.D. The Future of Transportation in the Northeast Corridor, 2007–2025: Rail Transportation 60 by Allison L. C. de Cerreño, Ph.D.
INTRODUCTION
Anticipating 2025 in Northeast Corridor Transportation: Aerial, Highway, Marine, and Rail Technologies & Linkages 1
Introduction Robert Warren, Ph.D. University of Delaware Newark, DE The dynamics and productivity of the Northeast Corridor (NEC) are recognized as key drivers of the United States’ economy as well as for the eastern part of the nation. Especially important, in this context, is the capacity of the NEC’s multimodal transportation system to efficiently move people and freight into, around, and out of the Corridor. This is especially important for its central portion linking Boston, New York, Philadelphia, Baltimore, and Washington, D.C. It is no surprise, therefore, that a good deal of concern is being given to current needs related to the repair and maintenance of the road, highway, and rail elements of the infrastructure and to reducing flow bottlenecks and choke points within this section of the NEC. Focusing primarily on immediate needs, however, means that more limited attention is being given to the longer-term character and future issues that will emerge as the NEC’s multimodal transportation system, which also includes critical aerial and maritime dimensions, becomes increasingly complex and interdependent. One reason for this focus on present highway and rail transportation needs and problems is that by trying to anticipate several decades into the future of the multimodal infrastructure of the NEC, we face the hazards of fuzzy projections, unforeseen technological changes, and economic and institutional uncertainty. If this is true, why, as the collection of papers brought together here has undertaken to do, consider the dimensions and capacity of the NEC’s transportation system in 2025? One of the most obvious reasons is that straight-line projections frequently do not get things right. The importance of using a longer-term policy horizon is not that it will necessarily produce precise predictions but, rather, it will allow non-linear changes and developments to be imagined, their probability estimated, and their functionality assessed. Further, the possibility that there can be significant changes over the next two decades from what “more of the same” forecasts lead us to believe makes it a high-risk strategy not to undertake a forward-oriented policy perspective for transportation planning in the Corridor while responding to existing needs. In 1900, for example, horses, trolleys, and walking dominated transportation in larger cities. Within twenty years, motor cars and trucks and their road and highway infrastructure were well along to becoming a dominant feature of intra- and inter-urban mobility and the nation’s economy. Today, the technological and economic environments for change in the transportation infrastructure over the next several decades are more complex and variegated than they were at the start of the 20th century. Between 1980 and 2000, we became a computerized and digitized nation. The applications of information technologies that recently have been made and are anticipated in the immediate future related to motor vehicles, marine vessels, and aircraft and their infrastructures will, we expect, make major contributions to the efficiency, capacity, and operation aspects of these
INTRODUCTION
Anticipating 2025 in Northeast Corridor Transportation: Aerial, Highway, Marine, and Rail Technologies & Linkages 2
modes. EZPass, cameras monitoring traffic flows and highway events, and the application of Global Positioning System-based technology to aircraft guidance quickly come to mind. In the late 20th century, increases in the size of marine containers and the vessels that move them revolutionized sea transport and port facilities and the sophistication of their equipment. The nation of Panama, for example, has recently made a decision to expand the width of its canal so that mega container vessels can move from the Pacific Ocean to the Atlantic Ocean. This will create the opportunity for more ships carrying goods produced in Asia to unload their cargos in East and Gulf Coast ports. In turn, an upgrading of their facilities, technology, and intermodal highway and rail linkages (and doing so in ways that are environmentally acceptable) will be needed for these ports to be competitive. Over the coming two decades there are other challenges on the horizon—some are clearer than others. Given the existing uses and expected trajectories of Global Positioning and Radio Frequency Identification systems and a variety of software control developments, there is every likelihood we will need to find ways to integrate the simultaneous use of cars and trucks on roads and highways, some of which are directly controlled by drivers, some remotely controlled, and some programmed to operate autonomously. The same is true of planes and airspace. Auto manufacturers now produce upscale vehicles that park themselves, and an increasing array of in-car automated safety warning and control technologies that function while the car is in motion are being made available. Trucks being driven on the highway or parked can be monitored, and their speeds can be controlled remotely if the management of a trucking company so chooses. The Defense Advanced Research Projects Agency (DARPA), which germinated the basis for the Internet, is now giving away prizes in the millions of dollars in annual contests for the design of reliable autonomous motor vehicles. We already have fully functional Unmanned Aerial Vehicles (UAVs) used for military and policing purposes. Because of the proven success and increasing range of applications of this technology, there is growing pressure from the private sector in the United States and Europe to establish regulations that would allow the commercial use of UAVs in civil airspace. And, as always, there is the flying auto waiting to emerge. Fully operational models exist, but cost is still prohibitive. Even if that were solved, what are thought to be insuperable barriers are likely to remain—the lack of adequate urban airspace and flight safety issues. Significant possibilities for change can also involve the adoption of existing advanced technology rather than require innovations. A holy grail for corridor rail transportation in the United States has been and continues to be the improvement of the track infrastructure that would allow the introduction of the high-speed train service with technology that is already in use in Europe and Japan. The shifting of freight movement from the highways to coastal waters through the building of short sea shipping operations that use existing cargo vessels is receiving considerable attention. Beyond technological and economic change, there is another critical aspect of enhancing the future of NEC mobility, and of transportation in corridors in general in the United States, that has not received sufficient attention. The capacity of the existing structures for planning and policy-
INTRODUCTION
Anticipating 2025 in Northeast Corridor Transportation: Aerial, Highway, Marine, and Rail Technologies & Linkages 3
making are not adequate to anticipate and respond to longer-term changes and needs. This is true for the aerial and maritime as well as the highway and rail systems. The need to determine what technological changes should be expected and/or fostered, how synergy among the modes can be enhanced, and ways that environmental sustainability can be built into planning and policy-making all require us to look several decades ahead in our current discourses on NEC transportation. Continuing to rely on structures and processes that make straight-line projections for each mode separately and advocate for more of the same in each case will not produce satisfactory outcomes. There is no single governmental entity with authority over all transportation or over single modes for the Corridor as a whole. Existing public agencies range in scale from municipalities to metropolitan planning organizations and to state, multi-state, and national governmental units. Private transportation firms and nongovernmental and advocacy groups exercise formal authority, control, or influence over the current and future of transportation within the NEC on various scales and for one or more modes. Thus, one of the most perplexing tasks related to the future is giving more priority to the examination of how the institutional dimensions needed for planning and policy-making can and should evolve. The ways this array of actors and the various scales could interact or be changed to enhance mobility for the Corridor over the next several decades for individual modes and to foster synergistic intermodal dimensions will have important consequences for responding to technological, economic, and environmental opportunities and challenges. The papers that follow are written as part of a project undertaken by the University of Delaware’s Institute of Public Administration that focuses on the factors that will influence the likely attributes of the transportation infrastructure for moving people and freight into, around, and out of the NEC in 2025. Their goal is to provide one of the first steps in stimulating forward-oriented research, speculation, and planning and policy discourse that takes into account the likelihood that what will or should be the character and dimensions of the Corridor’s multimodal transportation structure two decades from now cannot be anticipated using straight-line, single modal projections.

AIR TRANSPORTATION IN THE NORTHEAST CORRIDOR: CHALLENGES FOR THE FUTURE
Anticipating 2025 in Northeast Corridor Transportation: Aerial, Highway, Marine, and Rail Technologies & Linkages 4
Air Transportation in the Northeast Corridor: Challenges for the Future William P. Anderson, Ph.D. Boston University Center for Transportation Studies Boston, MA Introduction The goal of this paper is to provide an overview of air transportation in the Northeast Corridor, with an eye to identifying the most crucial challenges faced in the next few decades. It is organized into two parts: Part I which provides and overview and Part II which looks specifically at two major challenges: congestion and environmental mitigation. Part I begins with some facts and figures describing both passenger and freight movements in the Corridor and the current state of its most important airports. It also reviews some industry trends that are likely to affect developments in the near future. In order to provide some context, a review the economic role of air transportation follows, both in general and in the context of the Northeast Corridor. Because the corridor comprises a set of large urban areas with a high degree of intercity interaction, there are extraordinary demands on air transportation and high-speed rail to facilitate face-to-face interaction and to move high-value goods. The last section of Part I reviews the environmental impacts of air travel and likely environmental constraints to come. There are a number of important challenges that face the air transportation system in the corridor, but two dominant ones are the focus of Part II: first, the management of congestion in the face of growing demand with limited opportunities for infrastructure expansion, and second, environmental constraints that may increasingly impinge on air transportation over the coming decades. Of course, the two challenges are interrelated because it is the environmental impacts of air transportation that have limited the possibilities for airport expansion. At the outset, a comment with respect to definitions is in order. I have used a traditional definition of the Northeast Corridor as extending from Boston to Washington DC (Bosnywash.) Where state level data are presented, I have used the line of contiguous states from Massachusetts to Virginia and including Pennsylvania. Where data are presented for airports I have excluded those that are in the states just mentioned but clearly outside the corridor. I have had to make some rather arbitrary decisions in the process – for example including Syracuse while excluding Rochester. An argument can be made that the Corridor as a functional regions now extends into New Hampshire and Maine at the northern extent and perhaps into North Carolina at the southern extent, but no data for those states have been included state level data. However, I have included Raleigh-Durham International among the large airports in the Corridor.
AIR TRANSPORTATION IN THE NORTHEAST CORRIDOR: CHALLENGES FOR THE FUTURE
Anticipating 2025 in Northeast Corridor Transportation: Aerial, Highway, Marine, and Rail Technologies & Linkages 5
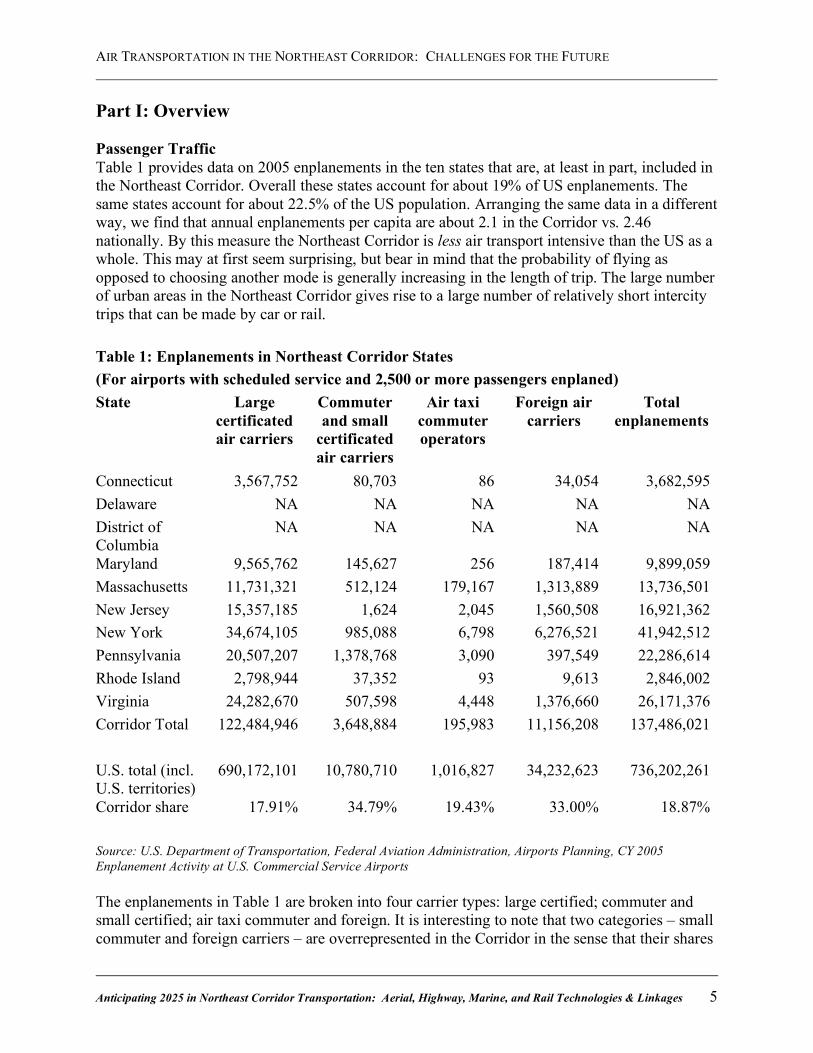
Part I: Overview Passenger Traffic Table 1 provides data on 2005 enplanements in the ten states that are, at least in part, included in the Northeast Corridor. Overall these states account for about 19% of US enplanements. The same states account for about 22.5% of the US population. Arranging the same data in a different way, we find that annual enplanements per capita are about 2.1 in the Corridor vs. 2.46 nationally. By this measure the Northeast Corridor is less air transport intensive than the US as a whole. This may at first seem surprising, but bear in mind that the probability of flying as opposed to choosing another mode is generally increasing in the length of trip. The large number of urban areas in the Northeast Corridor gives rise to a large number of relatively short intercity trips that can be made by car or rail.
Source: U.S. Department of Transportation, Federal Aviation Administration, Airports Planning, CY 2005 Enplanement Activity at U.S. Commercial Service Airports The enplanements in Table 1 are broken into four carrier types: large certified; commuter and small certified; air taxi commuter and foreign. It is interesting to note that two categories – small commuter and foreign carriers – are overrepresented in the Corridor in the sense that their shares
Table 1: Enplanements in Northeast Corridor States (For airports with scheduled service and 2,500 or more passengers enplaned) State Large
certificated air carriers
Commuter and small
certificated air carriers
Air taxi commuter operators
Foreign air carriers
Total enplanements
Connecticut 3,567,752 80,703 86 34,054 3,682,595 Delaware NA NA NA NA NA District of Columbia
NA NA NA NA NA
Maryland 9,565,762 145,627 256 187,414 9,899,059 Massachusetts 11,731,321 512,124 179,167 1,313,889 13,736,501 New Jersey 15,357,185 1,624 2,045 1,560,508 16,921,362 New York 34,674,105 985,088 6,798 6,276,521 41,942,512 Pennsylvania 20,507,207 1,378,768 3,090 397,549 22,286,614 Rhode Island 2,798,944 37,352 93 9,613 2,846,002 Virginia 24,282,670 507,598 4,448 1,376,660 26,171,376 Corridor Total 122,484,946 3,648,884 195,983 11,156,208 137,486,021 U.S. total (incl. U.S. territories)
690,172,101 10,780,710 1,016,827 34,232,623 736,202,261
Corridor share 17.91% 34.79% 19.43% 33.00% 18.87%
AIR TRANSPORTATION IN THE NORTHEAST CORRIDOR: CHALLENGES FOR THE FUTURE
Anticipating 2025 in Northeast Corridor Transportation: Aerial, Highway, Marine, and Rail Technologies & Linkages 6
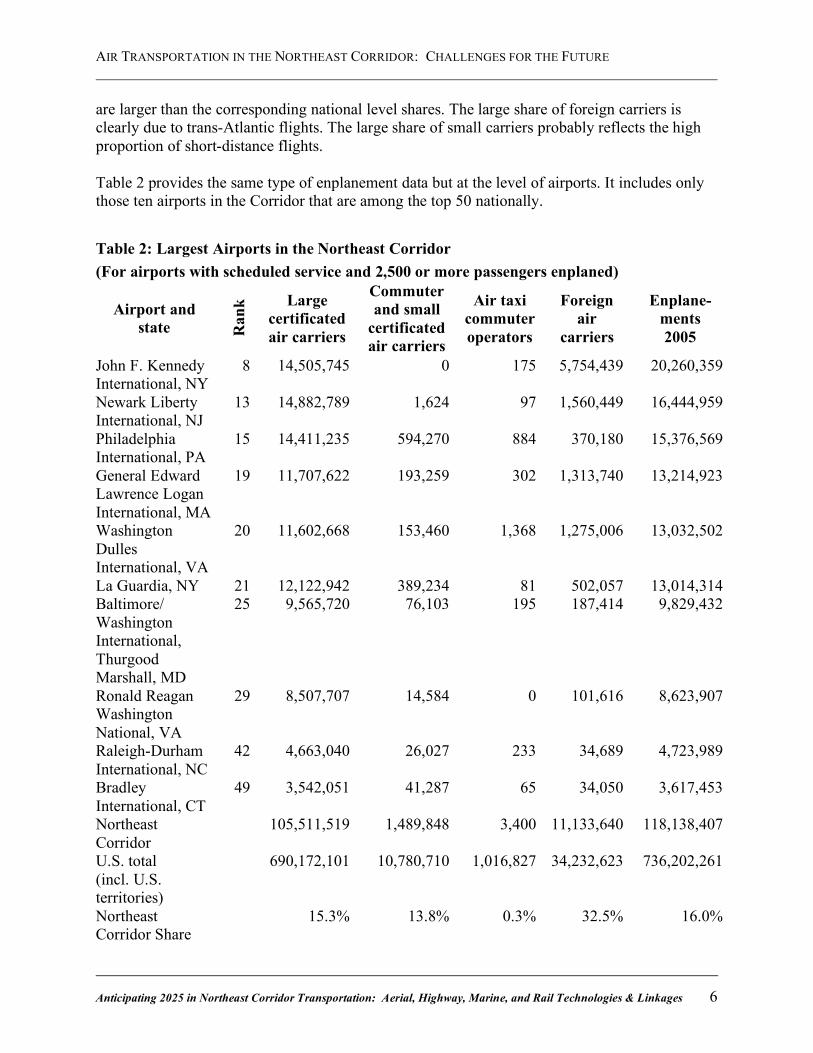
are larger than the corresponding national level shares. The large share of foreign carriers is clearly due to trans-Atlantic flights. The large share of small carriers probably reflects the high proportion of short-distance flights. Table 2 provides the same type of enplanement data but at the level of airports. It includes only those ten airports in the Corridor that are among the top 50 nationally.
Table 2: Largest Airports in the Northeast Corridor (For airports with scheduled service and 2,500 or more passengers enplaned)
Airport and state R
ank Large
certificated air carriers
Commuter and small
certificated air carriers
Air taxi commuter operators
Foreign air
carriers
Enplane- ments 2005
John F. Kennedy International, NY
8 14,505,745 0 175 5,754,439 20,260,359
Newark Liberty International, NJ
13 14,882,789 1,624 97 1,560,449 16,444,959
Philadelphia International, PA
15 14,411,235 594,270 884 370,180 15,376,569
General Edward Lawrence Logan International, MA
19 11,707,622 193,259 302 1,313,740 13,214,923
Washington Dulles International, VA
20 11,602,668 153,460 1,368 1,275,006 13,032,502
La Guardia, NY 21 12,122,942 389,234 81 502,057 13,014,314 Baltimore/ Washington International, Thurgood Marshall, MD
25 9,565,720 76,103 195 187,414 9,829,432
Ronald Reagan Washington National, VA
29 8,507,707 14,584 0 101,616 8,623,907
Raleigh-Durham International, NC
42 4,663,040 26,027 233 34,689 4,723,989
Bradley International, CT
49 3,542,051 41,287 65 34,050 3,617,453
Northeast Corridor
105,511,519 1,489,848 3,400 11,133,640 118,138,407
U.S. total (incl. U.S. territories)
690,172,101 10,780,710 1,016,827 34,232,623 736,202,261
Northeast Corridor Share
15.3% 13.8% 0.3% 32.5% 16.0%
AIR TRANSPORTATION IN THE NORTHEAST CORRIDOR: CHALLENGES FOR THE FUTURE
Anticipating 2025 in Northeast Corridor Transportation: Aerial, Highway, Marine, and Rail Technologies & Linkages 7
It also excludes Pittsburg, which is included in the state level data, while it includes Raleigh-Durham, which is not. Direct comparison of the aggregate numbers across tables 1 and 2 is therefore not very meaningful. An interesting point, however is that the share of small commuter airlines is closer to the corresponding national share in this table and the share of air taxi services nearly disappears, which indicates that a large proportions of enplanements in these categories occurs in smaller airports.
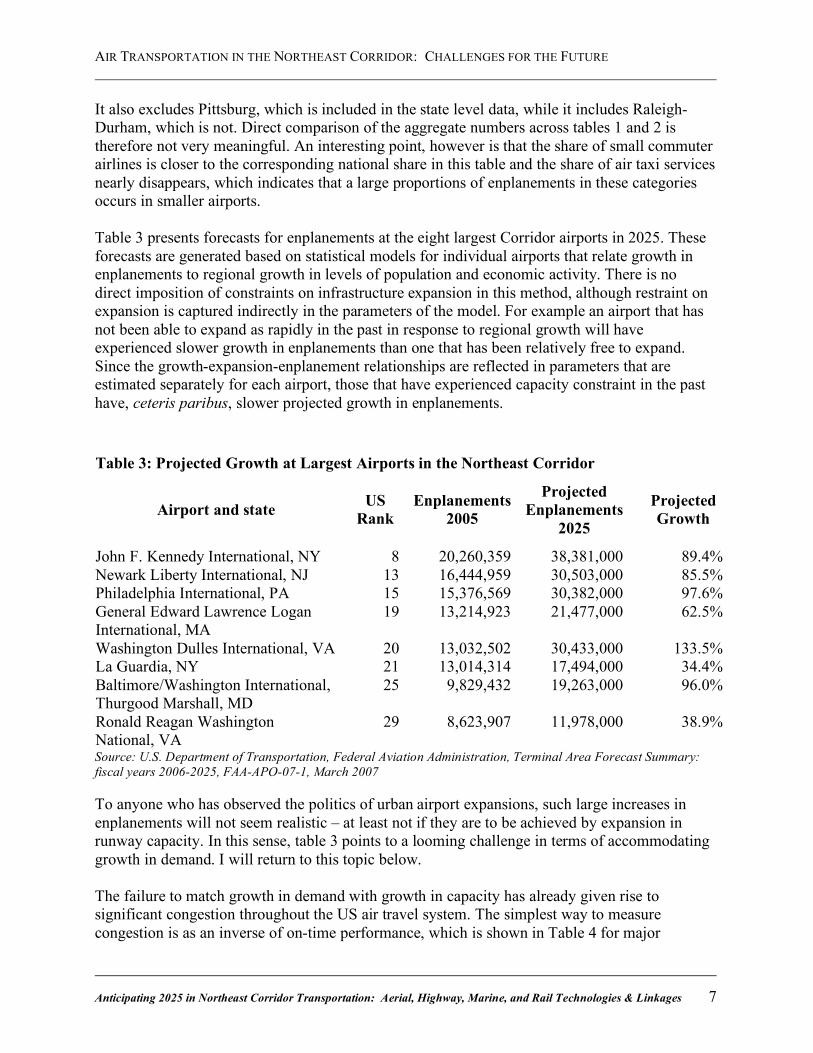
Table 3 presents forecasts for enplanements at the eight largest Corridor airports in 2025. These forecasts are generated based on statistical models for individual airports that relate growth in enplanements to regional growth in levels of population and economic activity. There is no direct imposition of constraints on infrastructure expansion in this method, although restraint on expansion is captured indirectly in the parameters of the model. For example an airport that has not been able to expand as rapidly in the past in response to regional growth will have experienced slower growth in enplanements than one that has been relatively free to expand. Since the growth-expansion-enplanement relationships are reflected in parameters that are estimated separately for each airport, those that have experienced capacity constraint in the past have, ceteris paribus, slower projected growth in enplanements.
Source: U.S. Department of Transportation, Federal Aviation Administration, Terminal Area Forecast Summary: fiscal years 2006-2025, FAA-APO-07-1, March 2007 To anyone who has observed the politics of urban airport expansions, such large increases in enplanements will not seem realistic – at least not if they are to be achieved by expansion in runway capacity. In this sense, table 3 points to a looming challenge in terms of accommodating growth in demand. I will return to this topic below. The failure to match growth in demand with growth in capacity has already given rise to significant congestion throughout the US air travel system. The simplest way to measure congestion is as an inverse of on-time performance, which is shown in Table 4 for major
Table 3: Projected Growth at Largest Airports in the Northeast Corridor
Airport and state US Rank
Enplanements 2005
Projected Enplanements
2025
Projected Growth
John F. Kennedy International, NY 8 20,260,359 38,381,000 89.4% Newark Liberty International, NJ 13 16,444,959 30,503,000 85.5% Philadelphia International, PA 15 15,376,569 30,382,000 97.6% General Edward Lawrence Logan International, MA
19 13,214,923 21,477,000 62.5%
Washington Dulles International, VA 20 13,032,502 30,433,000 133.5% La Guardia, NY 21 13,014,314 17,494,000 34.4% Baltimore/Washington International, Thurgood Marshall, MD
25 9,829,432 19,263,000 96.0%
Ronald Reagan Washington National, VA
29 8,623,907 11,978,000 38.9%
AIR TRANSPORTATION IN THE NORTHEAST CORRIDOR: CHALLENGES FOR THE FUTURE
Anticipating 2025 in Northeast Corridor Transportation: Aerial, Highway, Marine, and Rail Technologies & Linkages 8
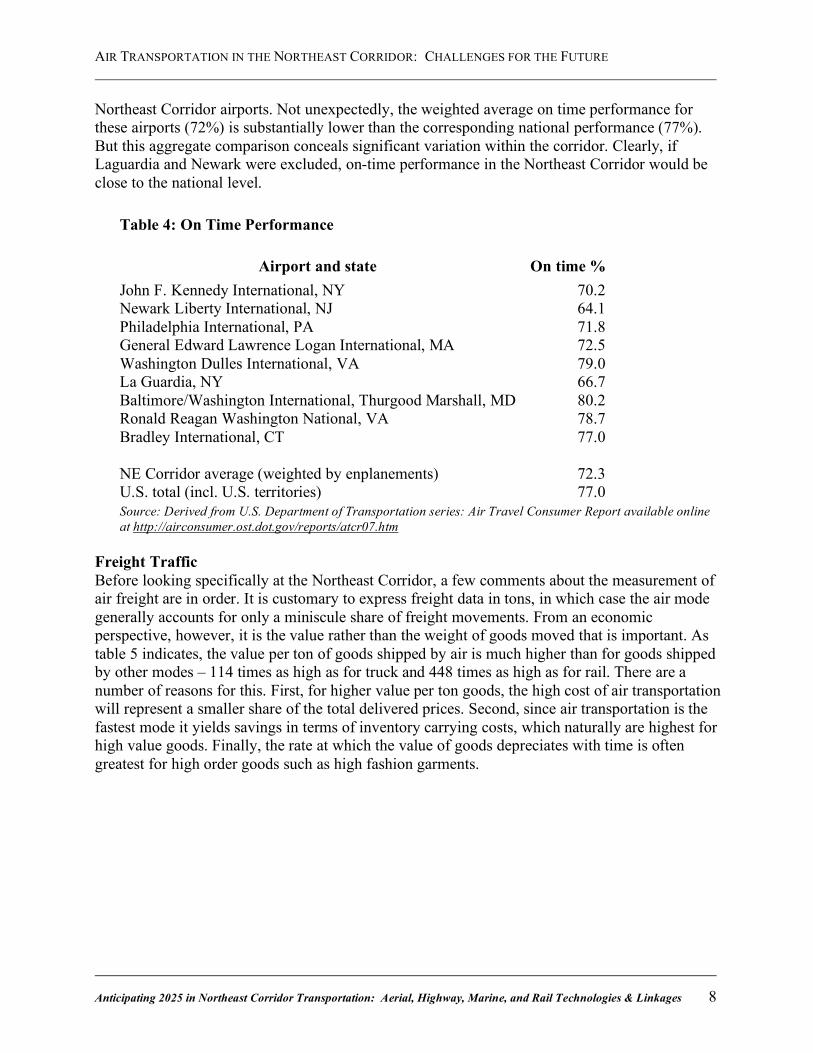
Northeast Corridor airports. Not unexpectedly, the weighted average on time performance for these airports (72%) is substantially lower than the corresponding national performance (77%). But this aggregate comparison conceals significant variation within the corridor. Clearly, if Laguardia and Newark were excluded, on-time performance in the Northeast Corridor would be close to the national level.
Source: Derived from U.S. Department of Transportation series: Air Travel Consumer Report available online at http://airconsumer.ost.dot.gov/reports/atcr07.htm
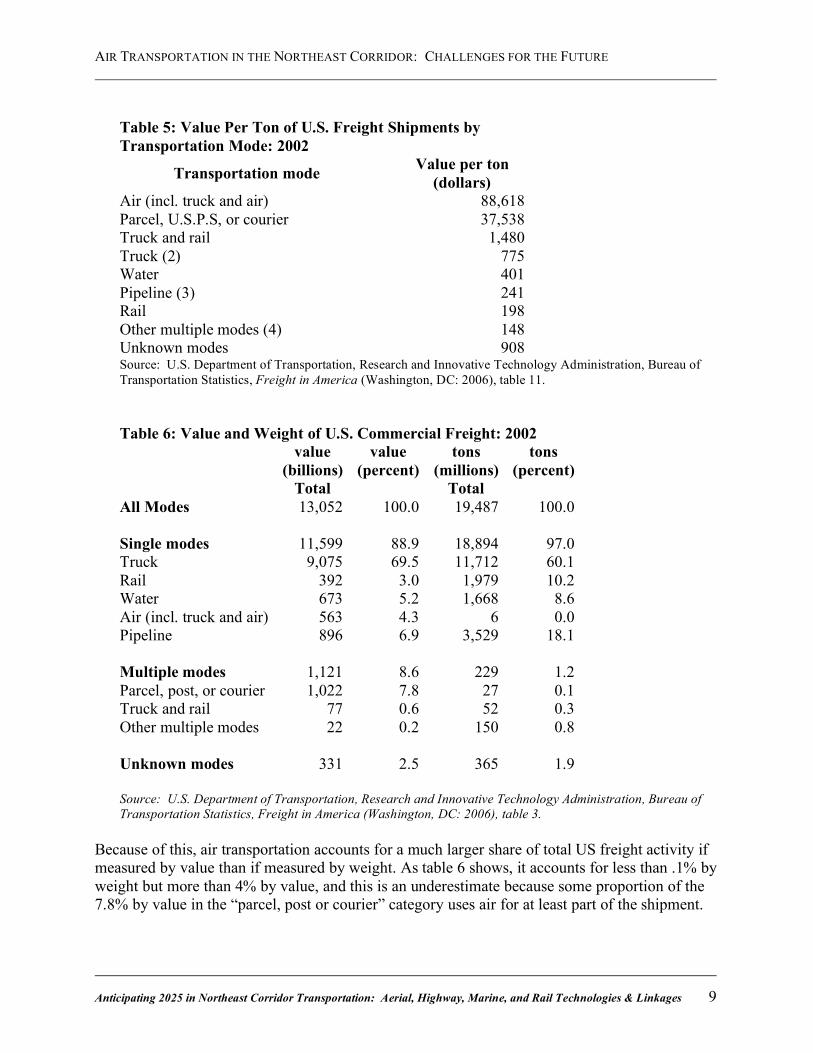
Freight Traffic Before looking specifically at the Northeast Corridor, a few comments about the measurement of air freight are in order. It is customary to express freight data in tons, in which case the air mode generally accounts for only a miniscule share of freight movements. From an economic perspective, however, it is the value rather than the weight of goods moved that is important. As table 5 indicates, the value per ton of goods shipped by air is much higher than for goods shipped by other modes – 114 times as high as for truck and 448 times as high as for rail. There are a number of reasons for this. First, for higher value per ton goods, the high cost of air transportation will represent a smaller share of the total delivered prices. Second, since air transportation is the fastest mode it yields savings in terms of inventory carrying costs, which naturally are highest for high value goods. Finally, the rate at which the value of goods depreciates with time is often greatest for high order goods such as high fashion garments.
Table 4: On Time Performance
Airport and state On time % John F. Kennedy International, NY 70.2 Newark Liberty International, NJ 64.1 Philadelphia International, PA 71.8 General Edward Lawrence Logan International, MA 72.5 Washington Dulles International, VA 79.0 La Guardia, NY 66.7 Baltimore/Washington International, Thurgood Marshall, MD 80.2 Ronald Reagan Washington National, VA 78.7 Bradley International, CT 77.0 NE Corridor average (weighted by enplanements) 72.3 U.S. total (incl. U.S. territories) 77.0
AIR TRANSPORTATION IN THE NORTHEAST CORRIDOR: CHALLENGES FOR THE FUTURE
Anticipating 2025 in Northeast Corridor Transportation: Aerial, Highway, Marine, and Rail Technologies & Linkages 9
Table 5: Value Per Ton of U.S. Freight Shipments by Transportation Mode: 2002
Transportation mode Value per ton (dollars)
Air (incl. truck and air) 88,618 Parcel, U.S.P.S, or courier 37,538 Truck and rail 1,480 Truck (2) 775 Water 401 Pipeline (3) 241 Rail 198 Other multiple modes (4) 148 Unknown modes 908 Source: U.S. Department of Transportation, Research and Innovative Technology Administration, Bureau of Transportation Statistics, Freight in America (Washington, DC: 2006), table 11. Table 6: Value and Weight of U.S. Commercial Freight: 2002 value
(billions) value
(percent) tons
(millions) tons
(percent) Total Total All Modes 13,052 100.0 19,487 100.0 Single modes 11,599 88.9 18,894 97.0 Truck 9,075 69.5 11,712 60.1 Rail 392 3.0 1,979 10.2 Water 673 5.2 1,668 8.6 Air (incl. truck and air) 563 4.3 6 0.0 Pipeline 896 6.9 3,529 18.1 Multiple modes 1,121 8.6 229 1.2 Parcel, post, or courier 1,022 7.8 27 0.1 Truck and rail 77 0.6 52 0.3 Other multiple modes 22 0.2 150 0.8 Unknown modes 331 2.5 365 1.9 Source: U.S. Department of Transportation, Research and Innovative Technology Administration, Bureau of Transportation Statistics, Freight in America (Washington, DC: 2006), table 3.
Because of this, air transportation accounts for a much larger share of total US freight activity if measured by value than if measured by weight. As table 6 shows, it accounts for less than .1% by weight but more than 4% by value, and this is an underestimate because some proportion of the 7.8% by value in the “parcel, post or courier” category uses air for at least part of the shipment.

AIR TRANSPORTATION IN THE NORTHEAST CORRIDOR: CHALLENGES FOR THE FUTURE
Anticipating 2025 in Northeast Corridor Transportation: Aerial, Highway, Marine, and Rail Technologies & Linkages 10
Table 7 Lists the top freight airports (by weight of landings) in the Northeast Corridor. Three large airports (Kennedy, Newark and Philadelphia) account for well over half of the total freight. It is interesting to note, however, that the list includes a number of smaller airports. This may reflect the tendency for freight operations to avoid competing with passenger operations for terminal capacity.
Table 7: Top Freight Airports in the Northeast Corridor by Weight
US
Ran
k
ST City Airport Name Hub
2005 Landed Weight (lbs.)
6 NY New York John F Kennedy International L 5,622,506,380 9 NJ Newark Newark Liberty International L 3,740,721,280
12 PA Philadelphia Philadelphia International L 2,801,700,462 29 MA Boston General Edward Lawrence Logan
International L 1,148,881,400
32 CT Windsor Locks
Bradley International M 967,385,010
47 DC Washington Washington Dulles International L 609,997,900 58 MD Baltimore Baltimore/Washington International
Thurgood Marshall L 514,993,500
59 NC Greensboro Piedmont Triad International S 500,225,543 60 NC Raleigh/
Durham Raleigh-Durham International M 495,393,120
66 VA Richmond Richmond International S 404,237,494 72 NY Syracuse Syracuse Hancock International S 373,569,800 88 VA Norfolk Norfolk International M 235,580,740 95 NY Albany Albany International S 205,630,700
100 VA Roanoke Roanoke Regional/Woodrum Field N 200,074,040 104 NY Newburgh Stewart International N 188,093,300 110 RI Providence Theodore Francis Green State M 155,171,000 119 ME Bangor Bangor International S 23,173,600 122 NH Portsmouth Portsmouth International at Pease N 1,893,004
Sum of Corridor Airports 18,189,228,273 US All reporting airports 152,537,230,547 Corridor
Share 11.9%
Source: U.S. Department of Transportation, Federal Aviation Administration, table available online at: http://www.faa.gov/airports_airtraffic/airports/planning_capacity/passenger_allcargo_stats/passenger/media/cy05_cargo.pdf
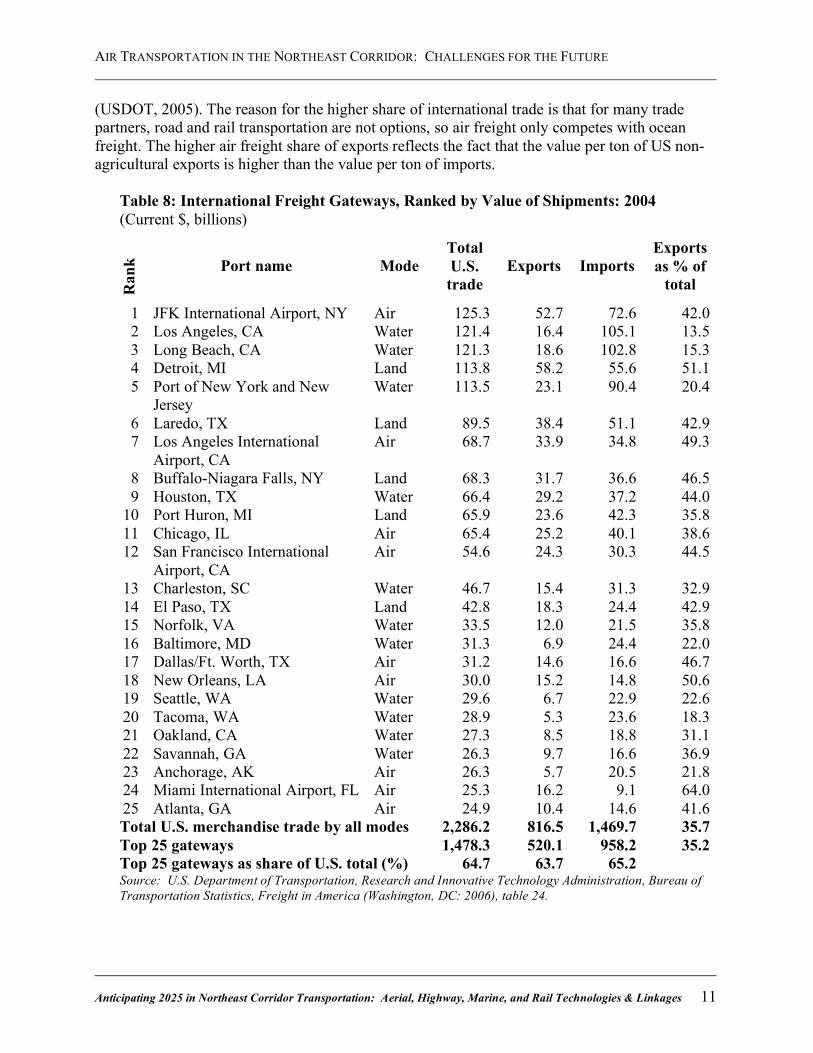
Air freight accounts for a much larger share of international merchandise trade than it does of domestic goods movement. Furthermore, it accounts for a larger share of exports than of imports—roughly 30% by value in 2002, which is larger than the share of water transportation
AIR TRANSPORTATION IN THE NORTHEAST CORRIDOR: CHALLENGES FOR THE FUTURE
Anticipating 2025 in Northeast Corridor Transportation: Aerial, Highway, Marine, and Rail Technologies & Linkages 11
(USDOT, 2005). The reason for the higher share of international trade is that for many trade partners, road and rail transportation are not options, so air freight only competes with ocean freight. The higher air freight share of exports reflects the fact that the value per ton of US non-agricultural exports is higher than the value per ton of imports.
Table 8: International Freight Gateways, Ranked by Value of Shipments: 2004 (Current $, billions)
Ran
k Port name Mode Total U.S. trade
Exports Imports Exports as % of
total
1 JFK International Airport, NY Air 125.3 52.7 72.6 42.0 2 Los Angeles, CA Water 121.4 16.4 105.1 13.5 3 Long Beach, CA Water 121.3 18.6 102.8 15.3 4 Detroit, MI Land 113.8 58.2 55.6 51.1 5 Port of New York and New
Jersey Water 113.5 23.1 90.4 20.4
6 Laredo, TX Land 89.5 38.4 51.1 42.9 7 Los Angeles International
Airport, CA Air 68.7 33.9 34.8 49.3
8 Buffalo-Niagara Falls, NY Land 68.3 31.7 36.6 46.5 9 Houston, TX Water 66.4 29.2 37.2 44.0
10 Port Huron, MI Land 65.9 23.6 42.3 35.8 11 Chicago, IL Air 65.4 25.2 40.1 38.6 12 San Francisco International
Airport, CA Air 54.6 24.3 30.3 44.5
13 Charleston, SC Water 46.7 15.4 31.3 32.9 14 El Paso, TX Land 42.8 18.3 24.4 42.9 15 Norfolk, VA Water 33.5 12.0 21.5 35.8 16 Baltimore, MD Water 31.3 6.9 24.4 22.0 17 Dallas/Ft. Worth, TX Air 31.2 14.6 16.6 46.7 18 New Orleans, LA Air 30.0 15.2 14.8 50.6 19 Seattle, WA Water 29.6 6.7 22.9 22.6 20 Tacoma, WA Water 28.9 5.3 23.6 18.3 21 Oakland, CA Water 27.3 8.5 18.8 31.1 22 Savannah, GA Water 26.3 9.7 16.6 36.9 23 Anchorage, AK Air 26.3 5.7 20.5 21.8 24 Miami International Airport, FL Air 25.3 16.2 9.1 64.0 25 Atlanta, GA Air 24.9 10.4 14.6 41.6 Total U.S. merchandise trade by all modes 2,286.2 816.5 1,469.7 35.7 Top 25 gateways 1,478.3 520.1 958.2 35.2 Top 25 gateways as share of U.S. total (%) 64.7 63.7 65.2 Source: U.S. Department of Transportation, Research and Innovative Technology Administration, Bureau of Transportation Statistics, Freight in America (Washington, DC: 2006), table 24.
AIR TRANSPORTATION IN THE NORTHEAST CORRIDOR: CHALLENGES FOR THE FUTURE
Anticipating 2025 in Northeast Corridor Transportation: Aerial, Highway, Marine, and Rail Technologies & Linkages 12
Table 8 reflects this fact, showing that JFK International Airport is the single largest international trade gateway in the United States, exceeding even the largest port and land gateways. The fact that this dominant air gateway is located in the Northeast Corridor perhaps reflects the higher value to weigh ratio of European as opposed to Asian trade, but also the fact that merchandise exports from the Northeast Corridor are of relatively high value goods. Note that exports from JFK are about twice as high as exports from the Port of New York and New Jersey, while imports to that port are actually higher than imports to JFK. In part, this reflects the fact that shipping containers often arrive at the port with relatively high value goods and depart with low value goods such as scrap metal. A completely new category of air freight transportation may be introduced over the next decade or so: Unmanned Aerial Vehicles (UAVs) have been used by the military for various surveillance and attack operations. They can be operated by remote control or with pre-programmed flight plans. There is now an increasing push by firms who have produced UAVs for the military to apply them to commercial applications. Early applications are mostly in various forms of surveillance, such as monitoring pipeline corridors or aerial damage assessment. The current potential to use of UAVs for freight is limited by the fact that they generally carry payloads of 2000 lbs. or less. However, if institutional barriers could be overcome (in particular, if UAVs could be permitted in civilian airspace) there may be a niche for using such vehicles to make high priority deliveries from point of origin to point of destination without involving airports. UAVs can take off from short runways that could be constructed at industrial parks or on properties controlled by firms specializing in rapid delivery of emergency cargoes. Such cargoes which might include documents, medical supplies, machinery components and other goods whose speed of delivery is so critical as to justify the cost of such a specialized service. Given their small payloads, UAVs will not have a major impact on the volume of freight movements, but they may add a new dimension to air freight and pose a variety of institutional challenges. Industry Trends and Implications Two airline industry trends that may have serious implications for air travel in the Northeast Corridor are the well-established move to hub-and-spoke networks and the possible shift to larger airplanes. The hub-and-spoke network was an outcome of deregulation. Free to offer whatever services they chose, airlines soon discovered that it was more economical to design their network of interconnecting flights around one or more hubs than to offer a large number of point-to-point services. Benefits to the airlines included economies of scale, higher load factors and the ability to centralize repair and maintenance. Consumers benefited from greater air travel opportunities as the number of city pairs served by scheduled flights roughly doubled. However, there are downsides. The scheduling of flights in “banks” to make connections efficiently has led to higher congestion in hub airports. Also, there is evidence that airlines that become dominant in their hub airport are able to charge a premium on trips that begin and end there. The use of the term “hub” has been somewhat obscured by the FAA’s designation of airports as “large hubs” based solely on the number of enplanements. By their definition, La Guardia is a “large hub” despite the fact that it does not serve a hub function for any major airline. A more
AIR TRANSPORTATION IN THE NORTHEAST CORRIDOR: CHALLENGES FOR THE FUTURE
Anticipating 2025 in Northeast Corridor Transportation: Aerial, Highway, Marine, and Rail Technologies & Linkages 13
functional definition of whether or not an airline is a hub should be based on the proportion of “through” passengers – that is passengers who pass through an airport but whose trips neither begin nor end at that airport. A study at the Boston University Center for Transportation Studies (Gong, 2006) calculated “hubness” as the proportion of through passengers and found that only Baltimore-Washington International and Philadelphia (both of which serve as regional hubs for US Airways) are hubsi. Thus, congestion in the Northeast Corridor is not predominantly the outcome of hub-and-spoke operations. It is interesting to speculate as to why few hub airports have been established in the Corridor. The most likely explanation is that in order to establish a hub an airline must command a large number of gates in a single airport. This will be possible only where there is either significant slack capacity or the potential for terminal and runway expansion. Neither of these conditions is typical of large airports in the corridor. Also, a number of the airports have many international flights and within-corridor shuttles, all of which may have crowded out hub operations. Another possible trend is the move to larger planes such as the new Airbus A380, which will seat 550 to 850 people depending upon configuration. Such a trend might be positive in the sense that it could relieve congestion by moving more people through a single runway slot, but might also require some capital expenditures, especially at gates. Such a large plane would logically fit into a hub-and-spoke rather than point-to-point strategy (Mason, 2007) so it would have little role in domestic traffic within the corridor. It might, however, be used on some trans-Atlantic services. There is a fair bit of skepticism about the future role of very large planes except in very specialized international or transcontinental applications. In fact, the industry move has been mostly in the opposite direction, with the share of 747 operations declining in the most crowded airports over the past twenty years. While a large airplane can move more people through a runway slot, it takes much longer to “turn” at the gate, which greatly diminishes its potential to address congestion problems (Swan, 2007.)
The Economic Role of Air Transportation Accessible and affordable air transportation is critical for regional economic development. Recent econometric studies have established a strong relationship between the level of air transportation activity in a city and its rate of employment growth, especially in service and high-tech industries (Button et al., 1999; Bruekner, 2003.) In a related vein, a recent paper by Cohen and Morrison-Paul (2003) measures significant labor productivity benefits in regional manufacturing due to airport infrastructure expenditures. In part the economic benefits of air travel activities derive from the fact that they employ a lot of people. For example, the complex of air freight related industries on the grounds of and surrounding JFK International has been reported as employing 60,000 people (NYT, 2004.) But a more important benefit arises because firms whose business requires either rapid goods delivery or frequent face-to-face contact need a high level of air service accessibility. They will therefore locate only in those metropolitan areas with large airports. It may seem that modern communication technologies should make face-to-face interaction decreasingly important. Research indicates, however, that the more complex a transaction is, the
AIR TRANSPORTATION IN THE NORTHEAST CORRIDOR: CHALLENGES FOR THE FUTURE
Anticipating 2025 in Northeast Corridor Transportation: Aerial, Highway, Marine, and Rail Technologies & Linkages 14
less effective is written or even telephone communication (Daft and Lengel, 1986; Olanian, 1996.) This explains why firms that deal with highly complex information transfer such as financial institutions and corporate law firms are willing to pay high rent premiums to locate in downtown office districts close to their clients and service providers. Because producer services and high technology industries generate very complex information, they require a lot of face-to-communication and are therefore intensive consumers of air services. This relationship between information-intensive activities and air transportation is especially important in the Northeast Corridor, where a number of major metropolitan areas are linked by frequent point-to-point (shuttle) air services, making it possible for people from different cities to attend the same meeting without the expense and inconvenience of overnight lodging. In fact, this capability for frequent intercity face-to-face communication is one of the main characteristics of the Northeast Corridor that define it a multi-city agglomeration, rather than just a set of interrelated by independent cities. Anyone who frequents the shuttle departure lounges at Logan, La Guardia, Reagan-National and Dulles airports is familiar with a community of people working in business and government whose normal field of activities straddles the entire Northeast Corridor. Perhaps no other phenomenon better typifies the unique nature of the Northeast Corridor as urban agglomeration writ large. Air Transportation and the Environment Air transportation has environmental impacts that are felt at the local, regional and global scales. Noise pollution, which is the greatest single impediment to siting new airports and expanding existing airports, is basically a local phenomenon. Airplane emissions, especially those that are precursors to ground level ozone, affect air quality at the regional level. Contributions to CO2 and other greenhouse gasses will affect climate at the global scale. Noise pollution has always been the most prominent environmental problem associated with air transportation. Federal regulations on airplane noise were imposed as early as 1968 and were tightened on several occasions thereafter. As a result, the number of people exposed to airport noise above 65 dB has declined from about 7 million in the 1970’s to 500,00 today (USDOT, 2004.) Despite this, noise pollution is still a major source of annoyance to the public and the main deterrent to locating new airports and expanding existing ones. For this reason, technological progress to reduce noise pollution could have a very positive effect on the air transportation industry. Airplane exhausts contribute to emissions of a number of air pollutants that are monitored by the US government, including volatile organic compounds (VOC), oxides of nitrogen (NOx), carbon monoxide (CO) and particulate matter (PM). Airplane contributions to the aggregate emissions of these pollutants are small relative to emissions from highway vehicles, but they tend to be spatially concentrated at airports, most of which are in urban areas. Thus, the relatively low levels of pollutants do not fully express the potential impacts on human health. State Implementation Plans (SIP) in non-attainment areas generally include airplane exhausts in emissions inventories. However, due in part to environmental standards on new equipment that have been imposed by US environmental legislation, emissions per landing and takeoff of most pollutants have decreased dramatically since the 1980s.

AIR TRANSPORTATION IN THE NORTHEAST CORRIDOR: CHALLENGES FOR THE FUTURE
Anticipating 2025 in Northeast Corridor Transportation: Aerial, Highway, Marine, and Rail Technologies & Linkages 15
As one of the most energy intensive forms of personal and freight transportation, air transportation makes a major contribution to the emissions of CO2 and other greenhouse gases. According to the International Panel on Climate Change (1999), air transportation accounts for about 3.5% of total anthropogenic radiative forcingii, which is about 13% of the total due to transportation. Furthermore, the share is expected to increase to about 5% by 2050 because of the rapid growth of air travel relative to other economic activities. While the US does not have a formal policy for greenhouse gas reduction in place, it may have one in the future. The European Union, which has signed the Kyoto protocol, recently instituted a program by which CO2 emissions from airplanes will be capped at the 2004-2006 level and tradeable permits will be issued. This means that airlines must improve the fuel efficiency of their fleets, eschew any further growth in operations or purchase permits from other airlines that either curtail operations or improve efficiency at a rate that more than offsets their growth.

AIR TRANSPORTATION IN THE NORTHEAST CORRIDOR: CHALLENGES FOR THE FUTURE
Anticipating 2025 in Northeast Corridor Transportation: Aerial, Highway, Marine, and Rail Technologies & Linkages 16
Part II: Challenges for the Future This second part of the paper takes a closer look at what I believe are the two most pressing challenges facing air transportation in the Northeast Corridor over the next two decades. The first is the problem of managing congestion in an environment of rapid growth in demand and severe constraint on infrastructure expansion. The second are the present and impending environmental constraints on air travel. Addressing Congestion in the Northeast Corridor The figures in table 3 indicate that demand for air transportation services will continue to grow rapidly over the next twenty years. If sufficient capacity is not developed to accommodate this demand, congestion and resulting delays will grow as well. There are actually two types of congestion associated with air transportation: congestion in the air space and congestion at airports. While airspace congestion is just beginning to emerge as an important issue, airport congestion is already an established problem and I will focus on it here. One can envision a number of mechanisms to address congestion at airports: • Physical expansion. This can involve increasing the number of runways and the number of
terminal facilities, or increasing the capacity of existing runways and terminals. • Shift to larger planes. If there is a limit to the number of planes that can land over a given
time interval, the only way to increase the number of enplanements is to increase the seating capacity of planes.
• Reductions in separation. More planes can be accommodated over a time interval if the safe interval of separation between planes can be increased. Improvements in air traffic control technology have already reduced separations in recent years and new technologies promise further reductions.
• More rational assignment of existing capacity. Institutional mechanisms such as congestion pricing and various approaches to slot management may increase the value of the air transportation service delivered per time interval, even if it does not increase the number of planes. (There may be some overlap between this mechanism and the shift to larger planes.)
• Shift of services to smaller airports. To some extent this process has already begun with services provided by Southwest and other low-fare carriers.
• Provision of comparable transportation services by alternative modes. Specifically, the shift of some shorter air trips to high speed rail.
Physical Expansion Physical expansion, especially of runway capacity, may be the most obvious mechanism for addressing congestion, but it is also the most problematic from a social and political perspective. Most airports in the Northeast Corridor are in densely settled urban or suburban areas where there is significant resistance to the negative externalities associated with airports: especially noise pollution but also air pollution and the high level of vehicular traffic generated by airport customers. The recent addition of a new runway to Logan International Airport in Boston is a case in point. Proposed as early as the 1970’s, the new runway (the first addition in 40 years) came into service
AIR TRANSPORTATION IN THE NORTHEAST CORRIDOR: CHALLENGES FOR THE FUTURE
Anticipating 2025 in Northeast Corridor Transportation: Aerial, Highway, Marine, and Rail Technologies & Linkages 17
in November 2006 after lengthy court battles and a long FAA review. Furthermore, construction of the runway was only possible when the airport authority (Massport) agreed to limit its use to about one in three days when prevailing winds make use of an existing runway impossible, and to limit its use even on those days to small and medium sized planes. While this may be an extreme case, it illustrates that the process of runway expansion is slow, expensive and uncertain. Other types of infrastructure improvements can have significant impacts on airport capacity. For example, construction of improved taxiways and holding areas that minimize the time it takes queuing plans to enter the runway or landing planes to exit it may increase the number of takeoffs and landings per hour. While such improvements yield smaller benefits that the construction of new runways, they may generate less public opposition. Of course an alternative to infrastructure expansion at existing airports is the construction of new airports. This implies an even more difficult process of approval and public opposition and would require a political commitment that few elected officials would be willing to make. Shift to Larger Planes Given the limited possibilities for expanding physical capacity, a number of other mechanisms for reducing congestion are based on trying to increase number of passengers that passes through existing facilities. One such mechanism is a shift to larger planes. If there is a fixed separation interval between planes using a runway, it is still possible to move more people through the runway by increasing the average number of passengers per planeiii. (A similar argument applies for freight.) To a significant effect this has been accomplished through increased load factors in the post-deregulation era. But as average load factors move toward 1, increased passenger flow requires a shift to planes with larger seating capacities. The shift to hub-and-spoke networks has had this result to a limited extent, but current trends do not suggest that such a trend is in force. Swan (2007) gives a number of reasons for the persistent popularity of smaller planes. First, large planes take longer to “turn” at the gate because of the large number of passengers to load and unload and the extra time needed for fueling and maintenance. Thus, a significant portion of the scale economy benefits (reduced costs per passenger mile) that airlines enjoy from larger planes is offset by higher idle times. Second, air travel markets place a reasonably high value on frequency – that is, passengers will pay more for flights with frequent service because they are more likely to come close to their desired departure and arrival times. Here again, some of the cost savings of large planes are offset, this time by higher fares on more frequent services that use smaller planes. There is also the issue of airport noise, which is lower for small planes. The outcome of these factors has been that growth in the average size of plane has been flat to declining since about 1990 (Swan, 2007, Figure 3.) Of course, one clear way to increase the average size of plane would be to eliminate small general aviation (GA) planes from airports with scheduled commercial flights. I’ll return to this question below.
AIR TRANSPORTATION IN THE NORTHEAST CORRIDOR: CHALLENGES FOR THE FUTURE
Anticipating 2025 in Northeast Corridor Transportation: Aerial, Highway, Marine, and Rail Technologies & Linkages 18
Reductions in Separations Air traffic control is an excellent example of how information technology may be applied to expand the capacity of physically limited infrastructure (Lakshmanan and Anderson, 2000.) In this sense, it can be viewed as the major precursor to the more recent concept of intelligent transportation systems (ITS.) Initially the use of radar in conjunction with radio communications made it possible to keep track of the locations of various planes and maintain safe separations as they approach airports, while at the same time ensuring that departing planes do not interfere with planes that are already in the air. This is combined with ever more sophisticated weather detection and forecasting systems to move a larger an ever larger number of planes simultaneously and to reduce safe separation intervals. The progress in air traffic control technology is continuing via a gradual transformation from a radar-based system to one that employs satellite based global positioning systems. The new technology, called ADS-B (Automatic Dependent Surveillance – Broadcast) will be implemented throughout the US over the period 2009-2013, although a complete transformation from radar systems will take longer because ADS-B requires equipment to be installed in all planes. The new technology promises ever shorter safe separations. Air traffic control technology has had a huge impact. It largely explains why it has been possible for flight activity to grow so much more rapidly than physical infrastructure. Yet there must be diminishing returns at some point. Ultimately, separations will be limited by the length of time it takes for arriving and departing planes to clear the runway. A study my MITRE Corporation (reported in Golaszewski, 2002) showed that an ambitious program of improved air traffic control and runway technology can mitigate but not eliminated expected growth in flight delays by 2015. More Rational Assignment of Existing Capacity Institutional rules to determine what flights can use airports at what times in the United States have been largely absent or ad hoc. Congestion pricing and slot management are two organizational policies that have been proposed as means to ensuring that scarce runway capacity is distributed efficiently. In a theoretical sense, “efficiency” here means that the benefit enjoyed by those flights that land are at least as large as the costs in terms of congestion that they impose on other flights. Congestion pricing is frequently proposed by economists, but very seldom applied successfully in practice. The idea is that a landing fee should be charged that reflects not only the operations cost of the airport but also the congestion cost imposed on other flights (Levine, 1969). Since the congestion charge may be zero at off peak periods, airlines have an incentive to shift their scheduled flights away from the congested peaks. This is similar to the notion of congestion pricing of highways, where tolls are higher at peak hours, although there are significant differences between the road and airport cases (Nombela, de Rus and Betancor, 2004). Implementation of congestion pricing implies a revision of landing fees, which even in the absence of a congestion charge should serve to discourage small commercial and GA flights. Landing fees in the US have traditionally been based on the weight of the airplane, which favors small and GA users. Since a small plane has a similar impact on congestion as a large oneiv, a congestion pricing scheme starts with a flat landing charge to which a congestion charge is added,
AIR TRANSPORTATION IN THE NORTHEAST CORRIDOR: CHALLENGES FOR THE FUTURE
Anticipating 2025 in Northeast Corridor Transportation: Aerial, Highway, Marine, and Rail Technologies & Linkages 19
depending upon the time of day. Such a scheme not only encourages schedule shifts away from the peak, but more generally discourages small and GA users – which naturally increases the average size of aircraft. According to Shank (2005), congestion pricing has been applied in only a very few cases and has for the most part been unsuccessful because those users who are disadvantaged have succeeded in bringing legal challenges and applying political pressure. For example, a 1988 attempt by Logan Airport in Boston to impose a hybrid fee structure with a flat fee and a small upward adjustment based on weight was challenged in court by GA interests who argued that it was discriminatory. The case was successful and Logan Airport had to return to its original weight-based fees. In the 1960’s, LaGuardia Airport in New York was more successful in imposing a congestion pricing scheme that specifically targeted GA users. According to Shank (2005), La Guardia was able to survive legal challenges because GA users had a dedicated alternative at Teterboro Airport, so they could not make a convincing case that they were being priced out of the New York market. In 1988, LaGaurdia extended the congestion fees to cover regional air carriers as well as GA, but in 2000 an act of Congress mandated unlimited access for regional carriers. (The spike in congestion following this interference resulted in a slot management plan, discussed below.) As the experiences of Logan and LaGuardia indicate, congestion pricing schemes are likely to have a greater negative impact on some users than on others. Since airport authorities are public agencies, rather than private firms, disadvantaged users have a variety of legal and political mechanisms available to prevent implementation. Slot management simply refers to a system whereby a fixed number of landings are permitted during each hour of the day and some set of rules is established to distribute those slots to users. From an economic perspective, an efficient mechanism would be a slot auction, but this is seldom the case in practice. In Europe, where many airports are slot managed, grandfathering is often the most important principle for slot assignment, a situation that may stifle competition and innovation. (See Madas and Zografos, 2006, for a discussion of alternative slot allocation strategies.) La Guardia is one of the few US airports to use a slot management scheme (known as the FAA “High Density Rule.”) Under this rule slots are capped at 75 per hour. Most are grandfathered, while a certain number are made available by lottery. The two other High Density Traffic Airports (HDTA) are also located in the Northeast Corridor: JFK and Reagan National. Slot management is an effective way to reduce delays at airports, but it does not really solve the congestion problem. We can define the congestion problem as existing because more people want to travel by air than the system of airport facilities can manage. Slot management does not address the imbalance; it simply caps the number of people who can fly. The benefits to air travelers from reduced delays due to slot management must be weighed against the cost incurred on travelers who are unable to fly because of the slot limit and the possible increase in fares due to supply constraint.
AIR TRANSPORTATION IN THE NORTHEAST CORRIDOR: CHALLENGES FOR THE FUTURE
Anticipating 2025 in Northeast Corridor Transportation: Aerial, Highway, Marine, and Rail Technologies & Linkages 20
Shift of Services to Small Airports With a number of the major airports in the Corridor under severe congestion constraint, increasing the number of scheduled flights from smaller airports that generally serve GA is an attractive alternative. To some extent, Southwest Airlines and other low-cost carriers have moved this process forward. For example, while Southwest offers no service from Logan, it offers service from Nashua, NH and Providence, RI that are advertised to the Boston market. It also offers service from Islip, Long Island (although it has some service to LaGuardia) and Baltimore-Washington International (although it has some service to both Reagan-National and Dulles.) In some cases, however, attempts by low cost airlines to offer services from suburban airports have been stymied by public opposition to an increased number of flights, as in the case of Hanscom Airport in Bedford, MA. Besides the potential for public opposition, there are other limitations on the ability of smaller airports to absorb traffic from large, congested airports. For the most part, they are only useful for point-to-point service (which may include service to hubs) since the opportunities to make connections from such airports are limited. Also, many smaller airports do not have sufficiently long runways for the use of larger commercial jets. Perhaps a more practical strategy than shifting large commercial planes to smaller airports is to shift GA traffic to those airports. As the comparison of the experiences of Logan and LaGuardia airports in imposing congestion pricing suggests, the availability of an alternative airport detracts from the legal arguments of GA interests for access to major airports. Another example is the State of Maryland, which operates BWI Airport. Because it also operates another airport (Glen Martin Field) specifically for GA traffic it is able to discourage GA from using BWI. The FAA defines a set of airports as “relievers” because of there ability to divert GA traffic away from larger airports nearby and congress has set aside a small proportion of airport improvement funds for them. Provision of Comparable Service by Alternative Mode The two alternative modes of intercity transportation in the Northeast Corridor are rail and highway. Given the high level of road congestion in the Corridor, diversion of trips to private automobile travel is hardly a desirable policy and intercity bus transportation is probably too slow to represent a direct substitute for air transportation. Thus high-speed rail service is the alternative with the greatest potential to serve as a viable substitute for air travel. According to AMTRAK, 2005 ridership in the Northeast Corridor was about 9.5 million. This is a very substantial number, roughly equivalent to the number of enplanements at Baltimore-Washington International Airport and greater than enplanements at Reagan-National. There are, however, a number of reasons to be skeptical about the potential for high-speed rail service to make an increasing impact on the air travel market. The first is the fact that AMTRAK continues to incur losses of about $1 billion per year. It is likely that if fares were raised sufficiently to cover this shortfall, ridership would drop precipitously. Perhaps the best hope is for the operations in the Corridor to be split out from other national operations, as it probably has a higher potential for profitability in the dense corridor market. Even if AMTRAK can be restored to financial health without increasing fares, it is (like small airports) an alternative only for point-
AIR TRANSPORTATION IN THE NORTHEAST CORRIDOR: CHALLENGES FOR THE FUTURE
Anticipating 2025 in Northeast Corridor Transportation: Aerial, Highway, Marine, and Rail Technologies & Linkages 21
to-point travel, mostly within the corridor. Nevertheless, increasing New York based high-speed rail by even 50% could have a very significant impact in reducing (or slowing the growth of) delays at LaGuardia and other Corridor airports. Environmental Constraints on the Growth in Air Transportation in the Northeast Corridor We live in an era of heightened public sensitivity to the environmental impacts of all types of economic activities. Until recently, concern over the environmental impact air travel has been largely limited to noise pollution issues. Noise pollution impacts tend to be localized, affecting a small population severely. Opposition by groups representing this highly affected population have been effective in slowing and in some cases thwarting expansion of airport infrastructure and activities. Other impacts, including regional air pollution and climate change, affect a broader segment of the population and may therefore result in more widespread opposition to expanded air transportation in the future. Noise Pollution Noise pollution around airports has been an issue since the early days of commercial aviation. Federal policy with respect to noise pollution goes back to the 1960’s and generally takes the approach of mandating successively stricter maximum noise standards for new airplanes (referred to as stage 1, 2 and 3 airplanes) and requiring that all substandard planes be either retired or retrofitted by certain dates. So, for example, all airlines were required to bring their fleets up to stage 3 standards – either by retiring old plane or installing “hush kits” – by 1999. (Some contend that “hush kits” are ineffective and that all planes built under stage 2 standards should be retired, see Crowley, 2001.) As noted earlier, these standards have resulted in a significant reduction in the number of people exposed to airplane noise above 65 db. A new set of stage 4 standards was introduced were introduced for all new planes whose design is submitted to FAA after January 1, 2006. More recently federal policy has been extended to actions either on the airport grounds or in the surrounding communities to help limit exposures. The FAA has determined that residential land use is not compatible with noise above an average of 65 db. Airports are encouraged to create maps of noise levels that define the most adversely effected areas. Funds from the Airport Improvement Program are provided for mitigations such as purchasing land in high noise impact areas, paying for the installation of soundproofing in severely effected homes and other buildings, building noise barriers around the airport and creating new taxiways and holding facilities that keep airplanes further away from local neighborhoods. Despite these measures, public opposition to airport expansion has not waned – indicating an increased sensitivity to noise pollution over time. FAA has noted that complaints about airport noise have been registered at ever lower noise levels and at ever greater distances from airports (USDOT, 2007.) Thus, abatement policies to date do not seem to have eliminated, or even substantially weakened, noise pollution as a constraint on siting new airports and expanding existing airports. This constraint is especially binding in the Northeast Corridor, where the high population density leads to relatively large exposed populations around existing or proposed airport sites.
AIR TRANSPORTATION IN THE NORTHEAST CORRIDOR: CHALLENGES FOR THE FUTURE
Anticipating 2025 in Northeast Corridor Transportation: Aerial, Highway, Marine, and Rail Technologies & Linkages 22
In the longer term, new airplane technologies are under development that may provide radical reductions in noise pollution. A collaborative research project of MIT and Cambridge University (UK) known as the Silent Aircraft Initiative (SAI) is attempting to develop a new class of passenger airplane with noise levels so low as to be “imperceptible outside the airport perimeter.” (http://www.cambridge-mit.org/project/home/default.aspx?objid=1409) The new aircraft would have a radically different shape that is more like the “flying wing” style stealth military planes than a conventional airliner. This means that runways, gates etc. would have to be reconfigured to serve it. Despite these problems, a broad coalition of firms in the aerospace industry -- including Boeing, Rolls Royce, several airlines and air freight companies – are collaborators in the SAI. While commercialization of this technology is 15-20 years off, it could potentially be the key to unlocking capacity constraints on air travel in the Corridor and beyond. Local and Regional Air Pollution As noted earlier, airplanes make a relatively small contribution to the main categories of local and regional air pollutants. In particular, airplanes account for around 1-1.5% of emissions of oxides of nitrogen (NOx), which is one of the precursor pollutants for ground level ozone, commonly know as smog. Despite the relatively small share, airplane emissions are coming under increasing scrutiny for a number of reasons. For one thing, they are highly concentrated. Emissions from cars and trucks are much larger in aggregate, but they are much more broadly spread out across the landscape. Since the effects of air pollution on human health depend on concentrations and exposed populations, rather than on aggregate emissions, concentrated emissions may do more damage than dispersed emissions. Also, as the fastest growing category of transportation emissions, airplane emissions are expected to make up a greater share of total emissions in the future. A large proportion of top 50 airports are located in areas that fail to meet EPA’s concentration standards. In some cases airplane emissions account for as much as 4% of the NOx total, so airport activities become a substantial part of the State Implementation Plans (SIPs) that commit state governments to policy actions to aimed at improving air quality. This means that if emissions are to rise at the airport due to growth in air traffic, offsetting reductions must be found elsewhere. Stricter ozone concentration standards were introduced this year (2007). It remains to be seen whether the new standards will have a significant impact on airport operations. The US federal government has enforced some restrictions on airplane emissions for about 30 years, but did not have a specific standard for NOx until 1997. In 2005, EPA instituted a new set of NOx standards for new airplanes that are about 16% more strict than the 1997 standards (USEPA, 2005). (The new regulation adopts a set of standards that were defined by the United Nations International Civil Aviation Organization.) Nevertheless, the new regulations have relatively little impact because the vast majority of airplanes either approved or in production for use in the US already meet them. Both the European Union and the US are currently pressing for much more stringent international standards, reducing NOx emissions by 50-80% over the next ten to fifteen years. In anticipation of tighter standards, NASA has included development of low emissions engines in its Ultra-Efficient Engine Technology (UEET) program and Boeing has a research team working on low emissions airplane designs.
AIR TRANSPORTATION IN THE NORTHEAST CORRIDOR: CHALLENGES FOR THE FUTURE
Anticipating 2025 in Northeast Corridor Transportation: Aerial, Highway, Marine, and Rail Technologies & Linkages 23
At least for the moment, regional air pollution provides much less constraint on air travel activities in the Northeast Corridor than does noise pollution. But it is at least possible that it will become a much more binding constraint over the next ten years or so. Greenhouse Gases As noted earlier, aviation accounts for only about 3.5% of global emissions of CO2 and other greenhouse gases. Thus, it has received less public attention in debates about climate change than emissions from automobiles and electricity generation. But while its share is small, it is the fastest growing major source of emissions. Furthermore, there is no technological breakthrough on the horizon – jet engines will run on aviation kerosene and achieve efficiency improvements in the range of 1-1.5% per year for the foreseeable future (Economist, 2006). The simple arithmetic is that if passenger and freight aviation activities continue to grow at rates of 3–6% per year, fuel consumption (and thereby CO2 emissions) will grow at a rate of 1.5–5% per year. (To put this into perspective, a 3.5% growth rate implies that consumption will double in about 20 years.) Since most other categories of fuel demand are expected to grow more slowly, the share of aviation in greenhouse gas emissions will increase rapidly. Of course, constraints on the supply of infrastructure discussed elsewhere in this paper might prevent such rapid growth from extending far into the future.v The rapid growth in greenhouse gas emissions has been a point of much greater contention in the European Union than in the United States. This is because the EU is committed to significant reductions in emissions under the Kyoto Protocol. A recent study at the University of Manchester (Bows et al, 2005) plays up the crucial role of aviation in a policy to reduce aggregate emissions. The United Kingdom recently committed to a reduction of emissions of 60% from 1990 levels by the year 2050. The study estimated, using relatively conservative assumptions, that air travel would make up 40% or more of the total emissions allowable under the 60% reduction goal by 2050. Under assumptions that the authors considered more realistic the air travel share would be even higher. Their conclusion is that any realistic policy to achieve the greenhouse gas reduction goal must include a curtailing of air travel growth. It was in the context of this type of argument that the EU has instituted a cap and trade program to arrest growth in greenhouse gases from aviation. There several possible implications for air transportation the Northeast Corridor and elsewhere. If the United States undertakes an aggressive policy of greenhouse gas mitigation in the near future, it is unlikely that air travel will be exempted. Even if no such policy is adopted, the increasing share of air transportation in emissions will eventually lead to greater public awareness of the role of aviation in climate change. This, in turn, will lead for greater calls to reduce air travel by environmental groups and perhaps broader public resistance to expanding infrastructure.
AIR TRANSPORTATION IN THE NORTHEAST CORRIDOR: CHALLENGES FOR THE FUTURE
Anticipating 2025 in Northeast Corridor Transportation: Aerial, Highway, Marine, and Rail Technologies & Linkages 24
Concluding Comments Air transportation, both of passengers and of freight, plays a crucial role in the highly interconnected economy of the Northeast Corridor. As the economy grows, and resources shift into economic activities that are intensive users of air transportation services, demand will continue to grow. But constrains that are already evident such as the failure to expand airport infrastructure, as well as environmental constraints that will only become more pressing in the future, imply that the growth in supply will not keep up with the growth in demand (at least not at current prices). The likely result is increased delays, increased fares or some combination of the two. Both technological and institutional changes are needed if this rather pessimistic picture is to change. Until now, technological advances in air traffic control have made it possible to move a rapidly growing number of flights through a slow growing infrastructure. Continued advances of this type will be necessary in the future, but they cannot provide the whole solution. Among vehicle technologies on the horizon, the “silent” aircraft holds a special promise because it could significantly mitigate one of the main impediments to expanding infrastructure. This technology is at least 15 years from broad application and will require a lot of adjustments in airport infrastructure – broader runways, different gate configurations, etc. Also, it does not necessarily solve the other environmental problems: air pollution and greenhouse gases. But as a potential key to unlocking public resistance to infrastructure expansion it deserves special attention, especially from policy makers. In the mean time, institutional reforms may help move more passengers and freight through the existing infrastructure. I emphasize “passengers and freight” as opposed to “landings and takeoffs” because it is the former that contribute to economic growth and development. There is no doubt that a market-based provision of aviation terminal services would allocate facilities to flights in a very different way than the current legislation-based system. Under the current system, landing fees are generally too low to provide any incentive for more efficient use of the infrastructure and there is little or no means of differentiating potential users according to their willingness to pay. This is not to suggest that privatization of airports is necessarily the answer. (In fact, privatized airports acting under strict price regulation might not be any better than the current system.) Rather, airports should be free to apply market principles in setting prices for their services. If slots are to be capped, then at least a large proportion of slots should be distributed by auction. (If nothing else, this would provide information on what price the market will bear.) Otherwise landing fees should be set high enough to exclude flights with low economic value. This does not necessarily mean the policy of providing adequate capacity for GA flights must be abandoned. Rather, facilities at reliever airports could be improved to better serve them. Ironically, the best way to reduce congestion at large commercial airports may be to spend money on small GA airports.
AIR TRANSPORTATION IN THE NORTHEAST CORRIDOR: CHALLENGES FOR THE FUTURE
Anticipating 2025 in Northeast Corridor Transportation: Aerial, Highway, Marine, and Rail Technologies & Linkages 25
References Bows, Alice, Paul Upham and Kevin Anderson (2005) Growth Scenarios for EU and UK Aviation: contradiction with climate policy, Tyndall Centre for Climate Change Research, University of Manchester (Report for Friends of the Earth Trust Ltd.) Bruekner, Jan K. (2003) Air traffic and urban economic development, Urban Studies, 40(8):1455-1469. Button, Kenneth, Somik Lall, Roger Stough and Mark Trice (1999) High-technology employment and hub airports, Journal of Air Transport Management, 5:53-59. Cohen, Jeffrey P. and Cletus Coughlin (2003) Congestion at airports: the economics of airport expansion, Federal Reserve Bank of St. Louis Review, May/June 2003. Cohen, Jeffrey P. and Catherine J. Morrison Paul (2003) Airline infrastructures spillovers in a network system, Journal of Urban Economics, 54:459-473. Crowley, Congressman Joseph (2001) LaGuardia Airport: Can the airport and the community coexist. United States House of Representatives. Daft, R. and Lengel, R. (1986), ‘Organizational information requirements, media richness and structural design’, Management Science, 32A (32): 554 - 71. Economist (2006) Aircraft emissions: the sky’s the limit, June 8. Forsyth, Peter (2007) The impacts of emerging aviation trends on airport infrastructure, Journal of Air Transport Management, 13:45-52. Golaszewski, Richard (2002) Reforming air traffic control: an assessment from the American perspective, Journal of Air Transportation Management, 8:3-11. Gong, Gang (2006) Airfare, Competition and Spatial Structure: New Evidence in the US Airline Deregulation, doctoral dissertation, Boston University Graduate School of Arts and Sciences. Intergovernmental Panel on Climate Change (1999) Aviation and the Global Atmosphere, IPCC Special Report. Lakshmanan, T.R. and William P. Anderson (2000) Transportation in the 21st century: technological innovation, in T. John Kim (ed.) Transportation Engineering and Planning, UNESCO EOLOS (available at http://www.eolss.net/E6-40-toc.aspx). Levine, Michael E. (1969) Landing fees and the airport congestion problem, Journal of Law and Economics, 12:79-108.
AIR TRANSPORTATION IN THE NORTHEAST CORRIDOR: CHALLENGES FOR THE FUTURE
Anticipating 2025 in Northeast Corridor Transportation: Aerial, Highway, Marine, and Rail Technologies & Linkages 26
Madas, Michael A. and Konstantinos G. Zografos (2006) Airport slot allocation: from instruments to strategies, Journal of Air Transport Management, 12:53-62. Mason, K.J. (2007) Airframe manufacturers: which has the better view of the future, Journal of Air Transport Management, 13:9-15. Nombella, Gustavo, Gines de Rus and Ofelia Betancor (2004) Internalizing airport congestion, Utilities Policy, 12:323-331. Olanian, B. (1996), ‘A model of group satisfaction in computer-mediated communication and face to face meetings,’ Behavior and Information Technology, 15 (1): 24 - 36. Schank, Joshua (2005) Solving airside airport congestion: Why peak runway pricing is not working, Journal of Air Transportation Management, 11:417-425. Swan, William (2007) Misunderstandings about airline growth, Journal of Air Transport Management, 13:3-8. U.S. Department of Transportation, Bureau of Transportation Statistics (2005) United States 2002: Exports, EC02TCF-US(EX), March. U.S. Department of Transportation, Federal Aviation Administration (2007) Report to Congress: National Plan of Integrated Airport System (NPIAS) 2005-2009, U.S. Department of Transportation, Federal Aviation Administration (2007) Terminal Area Forecast Summary: fiscal years 2006-2025, FAA-APO-07-1, March. U.S. Environmental Protection Agency (2005) Regulatory Announcement: New Emissions Standards for New Commercial Aircraft Engines, EPA420-F-05-015, November.
i This study is based on 1995 data but probably reflects current circumstances fairly well. ii Radiative forcing refers to the contribution via various gas emissions of a particular human activity to climatic change. Calculation of radiative forcing takes account of the fact that various greenhouse gases have different effects per unit emitted on the warming of the atmosphere via the greenhouse effect. iii In reality it is not that simple, because larger planes require somewhat longer separation on landing and require a bit more time to take-off. But to the extend that the proportion time increase is smaller that the proportional increase in the number of seats, larger planes can increase passenger throughput. iv On the one hand, small planes require less time to take off and require smaller separations among themselves, so one could argue that small planes have a smaller impact on congestion. On the other hand, when small and large planes are mixed, separations intervals must be increased to avoid the dangerous effect of wake turbulence from large planes on small planes landing behind them. (These issues are addressed in Wells and Young, 2004.) What is certain, however, is that small planes have a larger impact on congestion measured on a per passenger basis. v This is the expectation of the Energy Information Agency, which projects the aviation share of energy consumption to remain stable out to 2030 because infrastructure constraints will slow growth in air transportation.
THE INSERTION OF BOSTWASH WITHIN THE GLOBAL AND NATIONAL FREIGHT NETWORKS
Anticipating 2025 in Northeast Corridor Transportation: Aerial, Highway, Marine, and Rail Technologies & Linkages 27
The Insertion of BostWash Within the Global and National Freight Frameworks Jean-Paul Rodrigue, Ph.D. Department of Economics & Geography, Hofstra University Hempstead, NY Abstract A large urban agglomeration such as Boston – Washington is the origin, destination and point of transit of large quantities of freight. As the deindustrialization of the American economy endured, this freight is increasingly coming from international locations. Containerized traffic handled by North America’s gateways has consequently increased as well as flows on long distance rail corridors. This paper investigates the main mechanisms in which the global, regional and local freight frameworks of the Boston – Washington corridor are inserted. Keywords: Transport Corridor, Boston – Washington, Gateways, Freight Distribution Transportation, Gateways and Corridors Gateways and Corridors Gateways have become fundamental locations where the components of the global economy interact as they promote the continuity of circulation in a transportation system. They are an interface between different systems of circulation. Gateways reap advantage of a favorable physical location such as highway junctions, confluence of rivers, seaboards, and have been the object of a significant accumulation of transport infrastructures such as terminals and their links. A gateway generally commands the entrance to and the exit from its market area and commonly imply a shift from one mode to the other (such as maritime / land). In other words, a gateway is a pivotal point for the entrance and the exit of merchandise in a region, a country, or a continent. The emergence of intermodal transportation systems reinforces gateways as major locations of convergence and transshipment and has modified their geography with increased locational flexibility. While major terminals have expanded and relocated to more peripheral locations, namely port facilities, many distribution centers have relocated even further away along corridors.
The global transport system is subject to remarkable geographical changes even if many of its infrastructures are fixed. Flows, origins, destination and the modes used can change rather rapidly as new economic activities emergence (while other are shut down) and transport operators modify their services accordingly. What remains relatively constant are gateways, which can be seen as semi-obligatory points of passage, while a hub is a central location in a transport system with many inbound and outbound connections on the same mode. Gateways also tend to be most stable in time as they often have emerged at the convergence on inland transport systems while the importance of a hub can change if transport companies decide to use
THE INSERTION OF BOSTWASH WITHIN THE GLOBAL AND NATIONAL FREIGHT NETWORKS
Anticipating 2025 in Northeast Corridor Transportation: Aerial, Highway, Marine, and Rail Technologies & Linkages 28
another hub, a strategy fairly common in the airline industry. Thus, gateways tend to be intermodal entities while hubs tend to perform transmodal (within a mode) operations. Corridors as Transport Paradigms The structure of a corridor is often taken for granted and simply relates to its linear orientation. Yet, corridors imply a much more complex reality than a simple linear correspondence. They are structures of accumulation where investments in economic activities are performed and also flow structures linked with an intense circulation of people, freight and information over specific segments. The later underlines that corridors are axis of transportation that has a significant role in shaping space. This role can be understood within three main paradigms (Rodrigue, 2004).
• Corridors as market areas. The first paradigm is the most traditional as far as geographical theory is concerned. The central places theory mainly considers cities as structurally independent entities that compete over overlapping market areas. Under the location and accessibility paradigm an urban region is considered as a hierarchy of services and functions and the corridor a structure organizing interactions within this hierarchy. Transport costs are considered a dominant factor in the organization of the spatial structure as the hinterland of each center is the outcome of the consumers’ ability to access its range of goods and services. Because of higher levels of accessibility along the corridor, market areas are smaller and the extent of goods and services being offered are broader. Thus, differences in accessibility are the least significant along the corridor. This applies well to the consumption based functions of a corridor where each market area is serviced by a wide array of service activities.
• Corridors as specialization structures. The specialization and interdependency model
considers that some cities can have a level of interaction and that transportation could be more than a factor of market accessibility, but also of regional specialization and of comparative advantages. Accessibility and economies of scale, both in production and consumption, are factors supporting the development of such entities where urban areas are increasingly specialized and interdependent. The main assumption is that the accessibility provided by the corridor reinforces territorial specialization and interdependency along its main axis, and consequently the reliance on a regional transport system. This applies well to the production based functions of the corridor.
• Corridors as logistically integrated axis. The distribution/flow model is one where a major
gateway of an urban region acts as the main interface between global, national and regional systems. Under such a paradigm, three core structural elements are defining a regional corridor: 1) Gateways regulating freight, passengers and information flows. 2) Transport corridors with a linear accumulation of transport infrastructures servicing a set of gateways. They provide for the physical capacity of distribution. 3) Flows, their spatial structure and the underlying activities of production, circulation and consumption.
Inserting BostWash Within the Freight Framework Freight distribution is a physical activity where the transportation component is of prime importance. Paradoxically, because of its efficiency, freight transportation is almost invisible to the end consumer as the outcome (retailing) is seen, but not the process (distribution). Such a perspective often permeates public policy where the importance of freight transportation is often
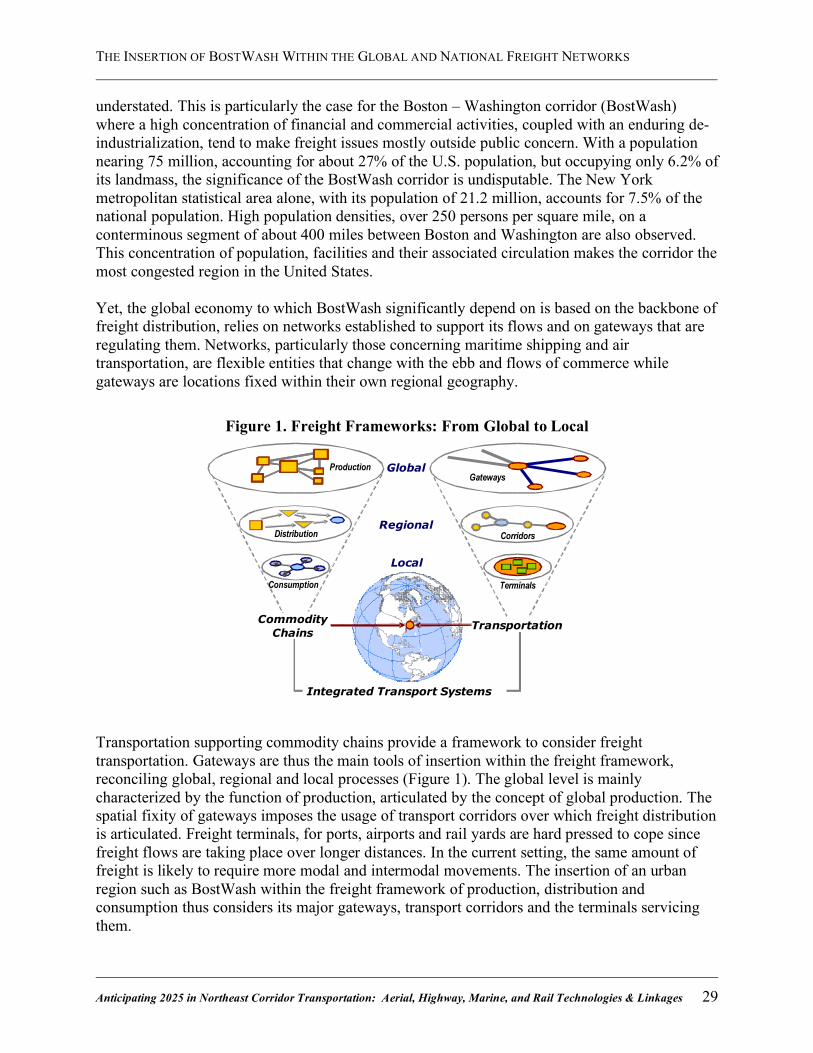
THE INSERTION OF BOSTWASH WITHIN THE GLOBAL AND NATIONAL FREIGHT NETWORKS
Anticipating 2025 in Northeast Corridor Transportation: Aerial, Highway, Marine, and Rail Technologies & Linkages 29
understated. This is particularly the case for the Boston – Washington corridor (BostWash) where a high concentration of financial and commercial activities, coupled with an enduring de-industrialization, tend to make freight issues mostly outside public concern. With a population nearing 75 million, accounting for about 27% of the U.S. population, but occupying only 6.2% of its landmass, the significance of the BostWash corridor is undisputable. The New York metropolitan statistical area alone, with its population of 21.2 million, accounts for 7.5% of the national population. High population densities, over 250 persons per square mile, on a conterminous segment of about 400 miles between Boston and Washington are also observed. This concentration of population, facilities and their associated circulation makes the corridor the most congested region in the United States. Yet, the global economy to which BostWash significantly depend on is based on the backbone of freight distribution, relies on networks established to support its flows and on gateways that are regulating them. Networks, particularly those concerning maritime shipping and air transportation, are flexible entities that change with the ebb and flows of commerce while gateways are locations fixed within their own regional geography.
Figure 1. Freight Frameworks: From Global to Local
Commodity
ChainsTransportation
Global
Regional
Local
Production
Distribution
Consumption
Gateways
Corridors
Terminals
Integrated Transport Systems Transportation supporting commodity chains provide a framework to consider freight transportation. Gateways are thus the main tools of insertion within the freight framework, reconciling global, regional and local processes (Figure 1). The global level is mainly characterized by the function of production, articulated by the concept of global production. The spatial fixity of gateways imposes the usage of transport corridors over which freight distribution is articulated. Freight terminals, for ports, airports and rail yards are hard pressed to cope since freight flows are taking place over longer distances. In the current setting, the same amount of freight is likely to require more modal and intermodal movements. The insertion of an urban region such as BostWash within the freight framework of production, distribution and consumption thus considers its major gateways, transport corridors and the terminals servicing them.
THE INSERTION OF BOSTWASH WITHIN THE GLOBAL AND NATIONAL FREIGHT NETWORKS
Anticipating 2025 in Northeast Corridor Transportation: Aerial, Highway, Marine, and Rail Technologies & Linkages 30
Global Supply Chains and the BostWash Corridor Global Supply Chains and Production Networks In a context of intense global competition and diminishing profit margins, logistics offer additional opportunities to improve the efficiency of production through distribution strategies. In this context, Global Production Networks (GPNs) are accounting for an emerging and active branch of investigation of the various paradigms of globalization. While the term globalization implies many issues depending on the perspective considered, economic interdependencies in trade, production and consumption – core elements of GPNs – are a major factor accounting for its dynamics. Global production networks have various structures according to the nature of their production and the markets they service. GPNs are bound to the interactions of supply and demand, as they reconcile the material needs of the consumers (let it be an individual or a corporation) to have the right product, in the right quantity, at the right price, at the right location and at the right time, and the capacity of production and distribution systems to accommodate such needs. The embededness they reflect is thus multidimensional, as markets, production and distribution become more linked in a complex web of flows. The development of GPNs has lead to a substantial growth of flows of commodities, parts and finished goods, hinting at mobility requirements that must be accommodated. In such a context, global freight transport systems have faced additional demands in absolute terms, but also in terms of the average distance goods are carried over. By keeping the quantity transported constant, but increasing its distance, additional transport demand is implied, literally through a multiplying effect as more distributional capacity gets tied with the same quantity of physical flows.
The manufacturing function of many corporations has been hollowed out by the process of globalization, in which manufacturing accounts for one of the least added value activity, particularly if it takes place within a subcontracting framework. This has been true for the United States, notably its major urban agglomerations where the economy has become dominantly service oriented. In a global economy and globalized consumption market, an important share of the added value of a product concerns the R&D, branding and design on the concept segment (creating a product). On the logistics segment, distribution, marketing and sales / after sales services (such as customer support) are among the activities generating the most added value. In spite of acute deindustrialization, many American corporations still command substantial added value. Continental Gateways Conventionally, geographical factors linked to the site and situation of “hard” terminals (especially for maritime terminals) were bounded with the location of gateways. Around these facilities agglomerated many freight handling and distribution activities. The emergence of intermodal transportation systems reinforces gateways as major locations of convergence and transshipment and has modified their geography with increased locational flexibility. While major terminals have expanded and relocated to more peripheral locations, namely port facilities, many distribution centers have relocated even further away along corridors.
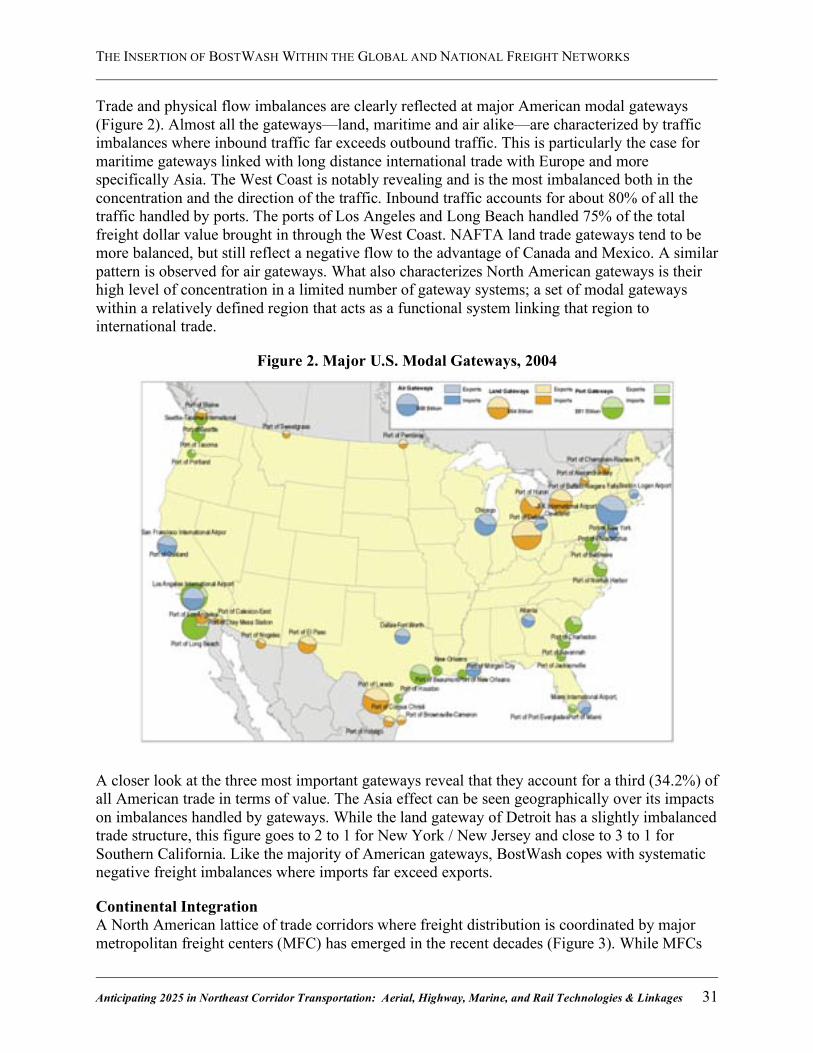
THE INSERTION OF BOSTWASH WITHIN THE GLOBAL AND NATIONAL FREIGHT NETWORKS
Anticipating 2025 in Northeast Corridor Transportation: Aerial, Highway, Marine, and Rail Technologies & Linkages 31
Trade and physical flow imbalances are clearly reflected at major American modal gateways (Figure 2). Almost all the gateways—land, maritime and air alike—are characterized by traffic imbalances where inbound traffic far exceeds outbound traffic. This is particularly the case for maritime gateways linked with long distance international trade with Europe and more specifically Asia. The West Coast is notably revealing and is the most imbalanced both in the concentration and the direction of the traffic. Inbound traffic accounts for about 80% of all the traffic handled by ports. The ports of Los Angeles and Long Beach handled 75% of the total freight dollar value brought in through the West Coast. NAFTA land trade gateways tend to be more balanced, but still reflect a negative flow to the advantage of Canada and Mexico. A similar pattern is observed for air gateways. What also characterizes North American gateways is their high level of concentration in a limited number of gateway systems; a set of modal gateways within a relatively defined region that acts as a functional system linking that region to international trade.
Figure 2. Major U.S. Modal Gateways, 2004
A closer look at the three most important gateways reveal that they account for a third (34.2%) of all American trade in terms of value. The Asia effect can be seen geographically over its impacts on imbalances handled by gateways. While the land gateway of Detroit has a slightly imbalanced trade structure, this figure goes to 2 to 1 for New York / New Jersey and close to 3 to 1 for Southern California. Like the majority of American gateways, BostWash copes with systematic negative freight imbalances where imports far exceed exports.
Continental Integration A North American lattice of trade corridors where freight distribution is coordinated by major metropolitan freight centers (MFC) has emerged in the recent decades (Figure 3). While MFCs
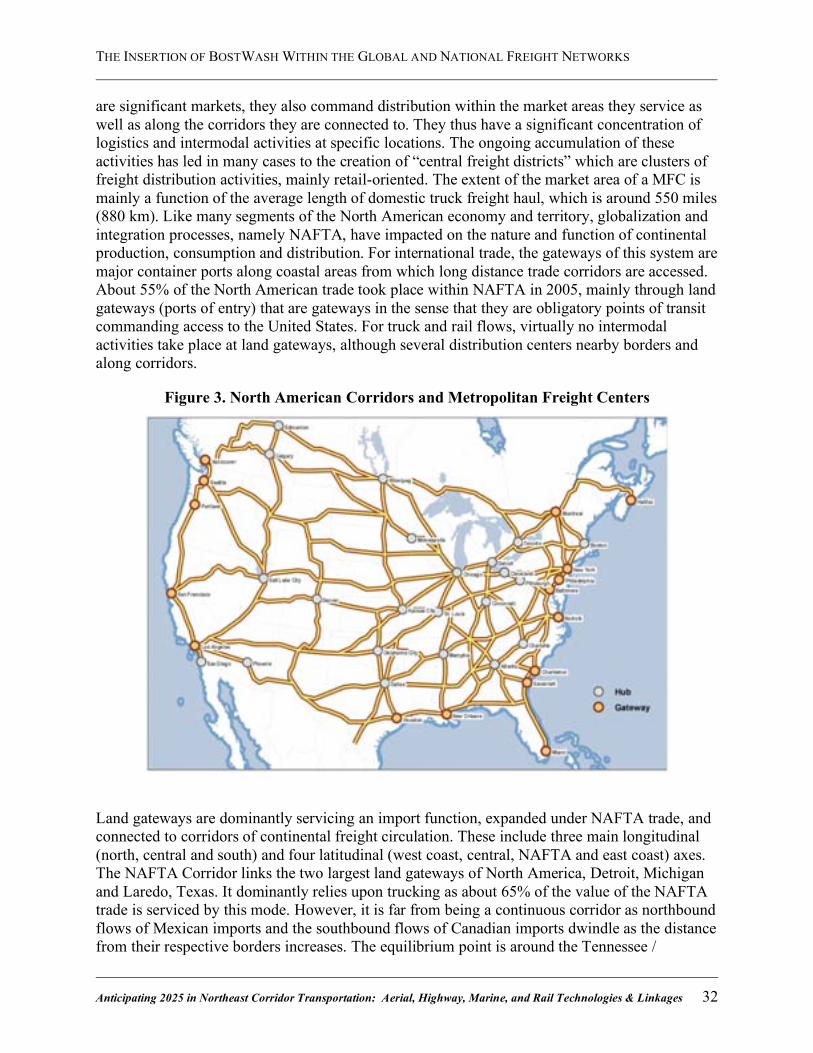
THE INSERTION OF BOSTWASH WITHIN THE GLOBAL AND NATIONAL FREIGHT NETWORKS
Anticipating 2025 in Northeast Corridor Transportation: Aerial, Highway, Marine, and Rail Technologies & Linkages 32
are significant markets, they also command distribution within the market areas they service as well as along the corridors they are connected to. They thus have a significant concentration of logistics and intermodal activities at specific locations. The ongoing accumulation of these activities has led in many cases to the creation of “central freight districts” which are clusters of freight distribution activities, mainly retail-oriented. The extent of the market area of a MFC is mainly a function of the average length of domestic truck freight haul, which is around 550 miles (880 km). Like many segments of the North American economy and territory, globalization and integration processes, namely NAFTA, have impacted on the nature and function of continental production, consumption and distribution. For international trade, the gateways of this system are major container ports along coastal areas from which long distance trade corridors are accessed. About 55% of the North American trade took place within NAFTA in 2005, mainly through land gateways (ports of entry) that are gateways in the sense that they are obligatory points of transit commanding access to the United States. For truck and rail flows, virtually no intermodal activities take place at land gateways, although several distribution centers nearby borders and along corridors.
Figure 3. North American Corridors and Metropolitan Freight Centers
Land gateways are dominantly servicing an import function, expanded under NAFTA trade, and connected to corridors of continental freight circulation. These include three main longitudinal (north, central and south) and four latitudinal (west coast, central, NAFTA and east coast) axes. The NAFTA Corridor links the two largest land gateways of North America, Detroit, Michigan and Laredo, Texas. It dominantly relies upon trucking as about 65% of the value of the NAFTA trade is serviced by this mode. However, it is far from being a continuous corridor as northbound flows of Mexican imports and the southbound flows of Canadian imports dwindle as the distance from their respective borders increases. The equilibrium point is around the Tennessee /
THE INSERTION OF BOSTWASH WITHIN THE GLOBAL AND NATIONAL FREIGHT NETWORKS
Anticipating 2025 in Northeast Corridor Transportation: Aerial, Highway, Marine, and Rail Technologies & Linkages 33
Kentucky range, past which the respective flows are very small. About a third of the volume involves auto parts produced in Southern Ontario and in the Maquiladoras of Mexico, which are used for low-cost car manufacturing in the Southeast states. It is however over longitudinal corridors that traffic has expanded the most, which reflects the booming transpacific trade carried over transcontinental rail corridors to East Coast markets. Freight Distribution Clusters Due to their operational requirements, which are space intensive, distribution centers (DC) have migrated to more affordable locations at the periphery of metropolitan areas. Even if many DCs are unrelated and linked to different supply chains, they tend to agglomerate in clusters nearby major road facilities. Market accessibility is the main driving force of this process. Freight clusters emerged in suburban (or exurban) settings to accommodate two market accessibility factors and their distribution requirements. The first is proximity, either to customers or to the major transport terminals from which DCs draw their supply. The second is intermediacy where a DC must find a location within corridors of freight circulation that enables a reliable and constant supply. Since a DC is just one link in a sequence, being efficiently connected to the upstream segment can be as important as being connected downstream, notably when global sourcing is concerned. As globalization took place, proximity evolved at a wider scale, mainly from the metropolitan area to a regional system of cities, which tend to be organized along corridors. Supply chains that are time dependent tend to rely more on an intermediacy strategy (notably large retailers) while those that are less time dependent are more prone to proximity. The setting of large distribution centers, often part of distribution clusters, has been a dominant trend, particularly among major retailers such as Wal-Mart, Target and Home Depot. When intermediacy is important, which particularly concerns supply chains of foreign goods, freight clusters tend to locate in small intermediary locations. For instance, the vicinities of Albany (NY) and Allentown (PA) have experienced the setting of several large distribution centers for retailers. These locations are along long distance highway corridors enabling to service the Eastern Seaboard market, particularly the New York metropolitan area, within a 48 hours envelope (order / delivery). Central New York is at the nexus of two important axis between Montreal and New York and between Buffalo and Boston. Eastern Pennsylvania has the advantage of being serviced in less than a day from the major rail terminals of Chicago from which transcontinental containerized rail traffic bound from the Pacific Coast arrives.
Gateways, Corridors and Competitiveness A Paradoxical Competitive Setting In the current economic setting that characterizes North America, the freight transport system cannot be considered as a tool of industrial competition with the global economy. It has become a tool of freight distribution, logistics, industrial reorganization and market penetration for foreign goods. The efficiency of containerized international transportation has given a net advantage for foreign producers over a wide array of goods. The reorganization of freight distribution went in three major phases. The first concerned a relocation of manufacturing activities to lower costs locations within the United States in an initial attempt to cope with increasing global competition, particularly in the car industry. Aging industrial clusters, such as in the Midwest, saw serious declines in output and employment mainly due to high labor costs.
THE INSERTION OF BOSTWASH WITHIN THE GLOBAL AND NATIONAL FREIGHT NETWORKS
Anticipating 2025 in Northeast Corridor Transportation: Aerial, Highway, Marine, and Rail Technologies & Linkages 34
The second stage took shape around the setting of NAFTA and permitted a further rationalization of manufacturing with Canadian and Mexican comparative advantages in numerous sectors of activity. It created a set of logistical relationships around border regions and new latitudinal corridors of freight distribution. Cross-border traffic surged as the North American market increasingly became perceived by freight forwarders as a single entity. The third stage is now in full motion and involves entirely new commodity chains using global comparative advantages to a much fuller extent. The logistical relationships involve a maritime / land interface involving containerized maritime shipping and long distance intermodal rail operations. All these stages have been linked with a growing quantity of freight being moved as well as its average distance. Gateways and Hinterland Competition As a growing share of the consumption of vast markets such as BostWash is being supplied by international sources new systems of inland freight distribution are being established. Many ports see growth opportunities and potential to capture added value activities, particularly at inland freight distribution clusters. Such expectations are however clashing with acute congestion since there is limited potential to increase the capacity of existing road systems along the BostWash corridor. There is thus competition between ports over the hinterland they service, but this competition takes increasingly the shape of the reliability of these services. To do so, modal shift and freight diversion strategies are contemplated. Modal shift implies that freight entering or exiting the port terminals would use a mode other than road, particularly rail. Freight diversion, which goes concomitantly with modal shift, involves the setting of inland terminals where freight converges. There is thus a hinterland access strategy in the making along the BostWash corridor. Unlike Europe, the North American East Coast does not offer significant axis of fluvial circulation (the St. Lawrence Seaway is limited). The Port Authority of New York and New Jersey has developed an ambitious plan to siphon off some traffic through a web of inland hubs connected to the mother port by barge and rail (Figure 4). The Port Inland Distribution Network (PIDN) plan would free up valuable terminal space, ease mounting congestion and provide environmental benefits. It would also provide reliable, scheduled service for containers no longer subject to the saturated highway system and the potential disruptions that congestion may create.
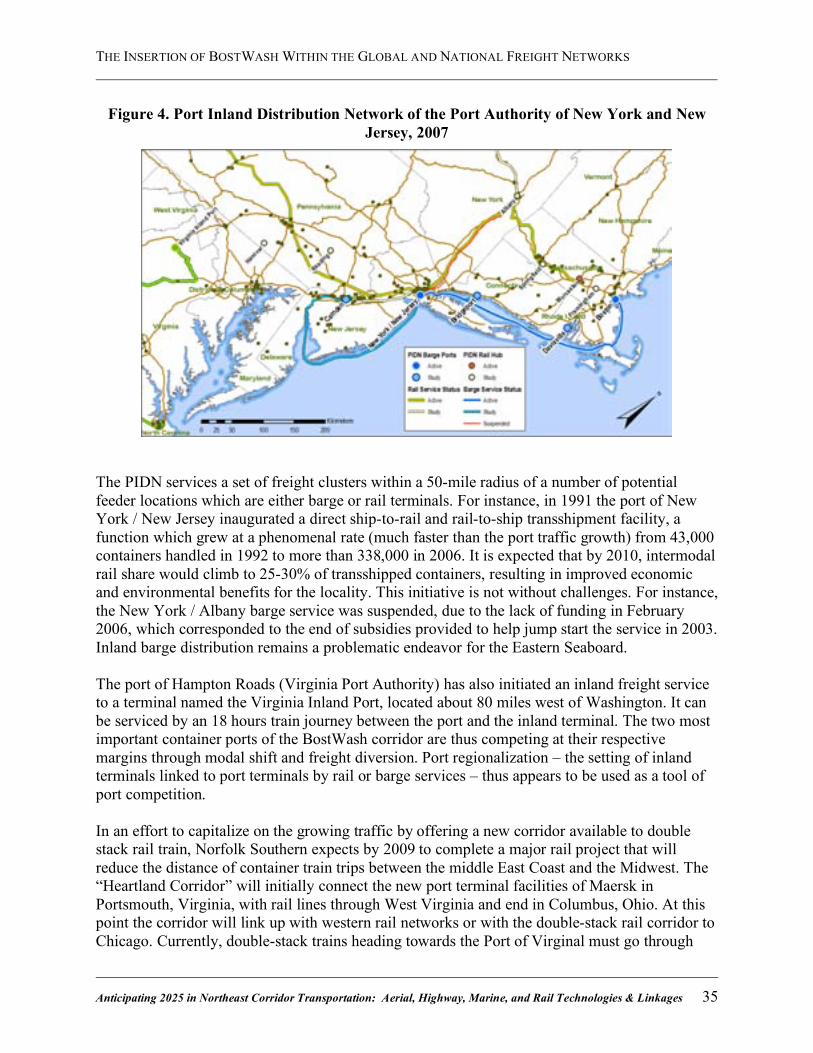
THE INSERTION OF BOSTWASH WITHIN THE GLOBAL AND NATIONAL FREIGHT NETWORKS
Anticipating 2025 in Northeast Corridor Transportation: Aerial, Highway, Marine, and Rail Technologies & Linkages 35
Figure 4. Port Inland Distribution Network of the Port Authority of New York and New Jersey, 2007
The PIDN services a set of freight clusters within a 50-mile radius of a number of potential feeder locations which are either barge or rail terminals. For instance, in 1991 the port of New York / New Jersey inaugurated a direct ship-to-rail and rail-to-ship transshipment facility, a function which grew at a phenomenal rate (much faster than the port traffic growth) from 43,000 containers handled in 1992 to more than 338,000 in 2006. It is expected that by 2010, intermodal rail share would climb to 25-30% of transshipped containers, resulting in improved economic and environmental benefits for the locality. This initiative is not without challenges. For instance, the New York / Albany barge service was suspended, due to the lack of funding in February 2006, which corresponded to the end of subsidies provided to help jump start the service in 2003. Inland barge distribution remains a problematic endeavor for the Eastern Seaboard. The port of Hampton Roads (Virginia Port Authority) has also initiated an inland freight service to a terminal named the Virginia Inland Port, located about 80 miles west of Washington. It can be serviced by an 18 hours train journey between the port and the inland terminal. The two most important container ports of the BostWash corridor are thus competing at their respective margins through modal shift and freight diversion. Port regionalization – the setting of inland terminals linked to port terminals by rail or barge services – thus appears to be used as a tool of port competition. In an effort to capitalize on the growing traffic by offering a new corridor available to double stack rail train, Norfolk Southern expects by 2009 to complete a major rail project that will reduce the distance of container train trips between the middle East Coast and the Midwest. The “Heartland Corridor” will initially connect the new port terminal facilities of Maersk in Portsmouth, Virginia, with rail lines through West Virginia and end in Columbus, Ohio. At this point the corridor will link up with western rail networks or with the double-stack rail corridor to Chicago. Currently, double-stack trains heading towards the Port of Virginal must go through
THE INSERTION OF BOSTWASH WITHIN THE GLOBAL AND NATIONAL FREIGHT NETWORKS
Anticipating 2025 in Northeast Corridor Transportation: Aerial, Highway, Marine, and Rail Technologies & Linkages 36
Harrisburg, Pennsylvania because of insufficient tunnel clearance. But the Heartland Corridor project will bypass this loop, cutting 250 miles and 36 hours off the present route from Virginia to the Midwest. This setting is thus likely to increase hinterland competition at the margin of the BostWash corridor and offer a new alternative to long distance transcontinental freight distribution. Conclusion Globalization and its associated changes in freight distribution have resulted in a context where urban regions such as BostWash are affected by a growing quantity of freight and tons-km in circulation. This imposes intense pressures on transport terminals and corridors to cope with demands that have increased in volume, but also over the distance freight is transported. The increasingly congested setting in which transportation operates within the BostWash corridor leaves few other alternatives than the usage of modal shift strategies, particularly from the major port terminal facilities. Inferring how the current freight situation will unfold in the coming years remains challenging since many variables, ranging from energy prices, the value of the US dollar, to the comparative costs of Chinese labor, can have significant impacts on freight flows. Still, the last 50 years have seen the integration of BostWash within a freight framework relying on large volumes of containerized freight related to time-dependent distribution strategies. It underlined the strategic importance of gateways and corridors to service the region. This framework of global production and distribution is likely to continue shaping freight flows at the regional level in the coming years. The question remains about the modal balance, the location of major terminals and freight distribution centers and the related level of congestion that would characterize this framework.
THE INSERTION OF BOSTWASH WITHIN THE GLOBAL AND NATIONAL FREIGHT NETWORKS
Anticipating 2025 in Northeast Corridor Transportation: Aerial, Highway, Marine, and Rail Technologies & Linkages 37
References Barke, M. (1986). Transport and trade. Oliver & Boyd: Edinburgh
Chopra, S., Meindl, P. (2001). Supply chain management: strategy, planning, and operation. Upper Saddle River, N.J.: Prentice Hall
Coe, N., Hess, M., Yeung, H., Dicken, P. and J. Henderson (2004). Globalizing regional development: a global production networks perspective. Transactions of the Institute of British Geographers 29: 468-484.
Fernandez-Armesto, F. (2006). Pathfinders: A Global History of Exploration. New York: W. W. Norton & Company
Gereffi, G., Korzeniewicz, M. (1994). Commodity chains and global capitalism. Praeger: Westport
Gereffi, G. (2001). Shifting Governance Structures in Global Commodity Chains, with Special Reference to the Internet. American Behavioral Scientist 44: 1616–1637.
Henderson, J., Dicken, P., Hess, M., Coe, N. and H. Yeung (2002). Global production networks and the analysis of economic development. Review of International Political Economy 9: 436-464.
Hesse, M., Rodrigue, J.-P. (2004). The transport geography of logistics and freight distribution. Journal of Transport Geography 12: 171-184.
Hesse, M., Rodrigue, J-P (2006). Guest Editorial: Transportation and Global Production Networks. Growth and Change 37: 599-609.
Levinson, M. (2006). The Box: How the Shipping Container Made the World Smaller and the World Economy Bigger. Princeton University Press: Princeton
Notteboom, T., Rodrigue, J.-P. (2005). Port regionalization: towards a new phase in port development. Maritime Policy and Management 32: 297-313.
Notteboom, T. and J-P Rodrigue (2007) Re-assessing Port-Hinterland Relationships in the Context of Global Supply Chains. In: J. Wang et al. (eds) Ports, Cities, and Global Supply Chains, London: Ashgate.
Robinson, R (1998). Asian hub/feeder nets: the dynamics of restructuring. Maritime Policy and Management 25: 21-40.
Rodrigue, J.-P. (1999). Globalization and the synchronization of transport terminals. Journal of Transport Geography 7: 255-261.
Rodrigue, J-P (2004) “Freight, Gateways and Mega-Urban Regions: The Logistical Integration of the BostWash Corridor”, Tijdschrift voor Sociale en Economische Geografie, Vol. 95, No. 2, pp. 147-161
Rodrigue, J.-P. (2006). Transportation and the Geographical and Functional Integration of Global Production Networks. Growth and Change 37: 510-525.
MARINE TRANSPORTATION OF INTERNATIONAL FREIGHT FOR THE NORTHEAST CORRIDOR
Anticipating 2025 in Northeast Corridor Transportation: Aerial, Highway, Marine, and Rail Technologies & Linkages 38
Marine Transportation of International Freight for the Northeast Corridor T. H. Wakeman III, Eng.Sc.D. Stevens Institute of Technology Hoboken, NJ
Abstract Global trade is increasingly a significant part of the United States’ economic well-being. It is estimated that international trade will more than double over the next two decades. The success of international trade transactions for the nation is directly dependent on having an efficient and effective international gateways and an internal intermodal transportation system for freight movement. As population grows, congestion in the transportation system is also becoming problematic. The Northeast region of the U.S. represents more than 100 million citizens and approximately 40 percent of the nation’s disposable income. This is a region with a high demand for consumer goods and industry materials. Continued expansion of economic prosperity and community and environmental well-being will be dependent on having adequate transportation capacity and efficiencies. Port authorities are working with other transportation agencies and industry representatives to create the needed added transportation system capacity and provide transportation efficiencies to meet the regional and national demand for handling the growing volumes of international and domestic cargo. Two promising avenues for enhancing goods mobility are the development and application of Intelligent Transportation System technologies and greater utilization of Short Sea Shipping, particularly along the Northeast corridor. These approaches will require new levels of national and regional coordination among public agencies and private entities. Without improvement in cooperation, communication and commitment among the stakeholders, there is a serious risk of increasing congestion and transportation system inefficiencies that will hurt both the Northeast’s economic prosperity, its environment and ultimately the region’s quality of life. Introduction Trade has been the principal underpinning for economic growth and development for centuries. In this century, no nation is fully self-sufficient; to some degree, each must depend on international trade. More than 90 percent of international trade is carried by sea (IMO, 2005). International trade has become critical not only for the economic development of global regions but also for a wide range of other factors such as national security, technological sophistication, standard of living, and quality of life that includes community and environmental conditions. The influences of trade are so apparent to political leaders, and particularly to the last several United States federal administrations, that there have been widespread and aggressive efforts to push further expansion of trade agreements between nations.

MARINE TRANSPORTATION OF INTERNATIONAL FREIGHT FOR THE NORTHEAST CORRIDOR
Anticipating 2025 in Northeast Corridor Transportation: Aerial, Highway, Marine, and Rail Technologies & Linkages 39
The United States is the world’s largest economy. In 2005, it accounted for 28 percent of world Gross Domestic Product or GDP (USDOT, 2007). Transportation is the third largest sector of the U.S. economy, behind housing and health care (US Dept of Commerce, 2004). In 2003, transportation-related goods and services contributed approximately 10.5 percent ($1.2 trillion) of the U.S. GDP ($11 trillion) (USDOT, 2005). The expansion of international transportation services and significance of international trade has precipitously risen over the last several decades. In 1960, international trade only accounted for 9 percent of U.S. GDP. The percentage has grown to 25 percent today and is predicted to reach as much as one-third by 2020 (AAPA, 2007) and 60 percent by 2030 (AASHTO, 2007). Each year since the early 1990s, there has been an increasing portion of our manufactured products coming from overseas, particularly from Far East Asia. The value of U.S. international merchandise trade in 2003 was approximately $2 trillion with a modal split of 41 percent for water, 26.5 percent for air, 20.5 percent for truck, 5 percent for rail, and the remainder divided between pipeline and other miscellaneous conveyances (USDOT, 2005). Gateways and Corridors The foundation of today’s global trade activities is transportation connectivity, or the ability to link worldwide suppliers with local markets and individual consumers, and the emergence of the standard international cargo container. The increasing number of trade agreements (demanding expanded transportation connectivity) and the growth of outsourcing of manufacturing jobs (increasing the volume of foreign produced merchandise) have driven the need for expansion of transportation capacity. International connectivity for goods movement may be pictured as a global pipeline. The size of the smallest pipe cross-section determines the system’s capacity as it acts as volume constraint for cargo flow. Structurally this pipeline is comprised of the world’s oceans, international gateways (i.e., ports and borders crossing), and internal corridors (including road, rail and inland waterway routes). The transport media is the second ingredient in this global plumbing system. The international container was developed in the 1950s. In the U.S., it started with Malcolm McLean, a trucking entrepreneur, putting 58 containers aboard a refitted tanker ship, the "Ideal-X," and sailing them from Newark to Houston (Broeze, 2002). It transformed goods movement from a piecemeal activity to a consolidated process that enable tremendous increases in freight flow, as measured by improved transportation productivity (Muller, 1999; Lowe, 2005). Without both international connectivity and the container, today’s global freight transport would be cumbersome, highly inefficient and prohibitively expensive. The 25 top foreign trade gateways in the U.S. (measured by value) include 11 water ports (both seaports and inland ports), 9 airports, and 5 border crossings (FHWA, 2006). Imports represent about 65 percent of the total movements at these gateways. Coastal water ports (such as Los Angeles/Long Beach and New York/New Jersey) frequently have higher percentages of imports to exports. Measured in tons, the Port of South Louisiana handles the most freight of any water port in the nation. Water ports dominated by domestic trade include St. Louis, MO-IL; Pittsburgh, PA; Huntington, WV-KY-OH, and Valdez, AK. Water ports dominated by foreign trade include Los Angeles, Ca; Freeport, TX; and Beaumont, TX. The top 25 water ports handle about two-thirds of all domestic and foreign goods moved by water (FHWA, 2006). If the
MARINE TRANSPORTATION OF INTERNATIONAL FREIGHT FOR THE NORTHEAST CORRIDOR
Anticipating 2025 in Northeast Corridor Transportation: Aerial, Highway, Marine, and Rail Technologies & Linkages 40
nation’s gateway capacity and internal intermodal connectivity were constrained, it can be anticipated that regional and national economic decline would quickly follow. Containers are increasingly being used to move all general cargo including merchandise and processed materials (Lowe, 2005). Containerized cargo has grown rapidly over the last decade and is concentrated at a few large seaports (AAPA, 2006). The Port of Los Angeles handles about one-fifth of all U.S. container traffic and with the contribution of Long Beach, these two ports share about one-third of all traffic (FHWA, 2006). The Port of New York and New Jersey is the third largest container port. Container volumes at these three ports have doubled between 1995 and 2005 and are expected to continue to grow, doubling again in the coming decade unless choked off by congestion. Unfortunately the U.S. economy is facing a potential significant degradation of its economic vitality because of growing congestion and lack of transportation capacity at its gateways and along its corridors, particularly with respect to container movements. This lack of capacity is painfully apparent at the Southern California ports. Capacity constraints are beginning to be felt in the northeast region. The growing influx of international cargo is resulting in increasing congestion, particularly in the intermodal movement and distribution of freight to the middle of the country from the coastal and border gateways. Until almost the end of the twentieth century, the logistics pipeline for moving international trade was largely uncoordinated. It relied on many modal links that were administered by both public and private agents in different jurisdictions. These parties approached intermodality with different objectives and economic interests resulting in connectivity inefficiencies (or “friction”) within the system. The inefficiency in the system was allowed because there was ample excess transport capacity, which absorbed seasonal higher volumes and minimized sporadic delays. However with the globalization of manufacturing, there has been a fundamental shift from U.S. domestic production of consumer goods to a dependence on global sources resulting in rapid growth in the volume of international cargo. Competition among cargo carriers has created new alliances and simultaneously economies of scale have favored new mega-transport vehicles and vessels. The greater volumes delivered by these larger carriers have diminished the modal capacity of the landside systems that must absorb and transfer this loads to discrete inland markets. Simultaneously there has been a growth in domestic cargo driven by population expansion and losses in redundancy of rail capacity driven by deregulation. Lack of highway and rail capacity is creating bottlenecks at key transfer points, and the resulting negative impacts are increasingly radiating through the entire distribution system. These negative impacts will not just be felt in commercial business terms but also as a constraint on labor availability and new job creation. By volume, more than 99 percent of all international overseas cargo enters the nation through its seaport and waterway systems (AAPA, 2007; AASHTO, 2007). On average, each of the fifty states relies on one to several of the nation’s 13 to 15 major seaports to handle their imports and exports. These cargo flows add up to $5.5 billion worth of goods moving in and out of U.S. ports every day (AAPA, 2007). Strategically important imports such as oil and minerals move into the country almost exclusively through marine terminals (AASHTO, 2007).
MARINE TRANSPORTATION OF INTERNATIONAL FREIGHT FOR THE NORTHEAST CORRIDOR
Anticipating 2025 in Northeast Corridor Transportation: Aerial, Highway, Marine, and Rail Technologies & Linkages 41
How and where international goods come from the seaports to their first point of rest for integration into the domestic system is becoming crucial to plan and to manage. Retailers are increasingly concerned about the fit between the seaport (and airport gateways) and the efficiency of transportation corridors to their international and regional distribution centers. The corridors and distribution centers must be connected and properly sized to allow efficient, seamless mobility and avoid creating system chokepoints. Unfortunately, chokepoints and congestion plague both passengers and freight on U.S. highways, railways, waterways, and airways as the impacts of this discordant mix of international and domestic movements are increasingly fully felt in a confined system (AASHTO, 2007). There is a lack of either Federal or regional programs to strategically address these connectivity problems (Pedersen, 2007). Federal policies have promoted global trade but have relied on regional and local investment by states and private businesses to provide the conveyance system for this trade to move and to be distributed. These investments frequently are not coordinated across public agencies or private businesses, reducing connectivity and therefore efficiency and reliability. In fact, the distribution of cargo in the Northeast has become increasingly constricted at chokepoints in the channels, terminals, highways, and railways or at distribution points reducing velocity of cargo movements and increasing logistics costs. The I-95 Corridor Coalition estimates that there are at least 65 major highway bottlenecks at urban Interstate interchanges and over 70 major rail chokepoints along the mid-Atlantic region (Pedersen, 2007). The problem is only mounting. The Coalition’s projections suggest that traffic, especially truck traffic, will almost double and that containerized cargo entering the Northeast will more than double by 2025 significantly increasing regional road and rail congestion. Freight Movement Historically, freight transportation has been organized around nodes (e.g., ports and depots) and modes (e.g., highway, rail, air and waterway). International freight transportation was organized as a series of individual moves between export nodes, e.g., passed from truck to ship, and the import port to truck or rail at the other shore. The planning, construction, and financing of supporting infrastructure have been separated among public and private entities. Each has focused on their own node and modal stovepipe as part of separate business models. This separation of responsibilities has created transportation inefficiencies along corridors and at modal interfaces as volumes of international cargo have grown. The congestion increases costs, reduces goods movement reliability, and creates negative environmental impacts. Shippers cannot tolerate the added transportation costs in today’s super-competitive marketplace, and the public will not accept growing environmental degradation and health impacts. System integration was crucial, and application of supply chain management tools has transformed the goods movement process (Hensher and Brewer, 2001). International cargo continues to move from seaports to inland users by barge, truck, rail, and pipeline, but now international shipments are planned and organized as a logistics system where each move is part of a supply chain, and the links are seamless. Having an effective international gateway is no longer simply a matter of having a strong port system; international freight movement is happening within a logistics framework where the port is just one element of the
MARINE TRANSPORTATION OF INTERNATIONAL FREIGHT FOR THE NORTHEAST CORRIDOR
Anticipating 2025 in Northeast Corridor Transportation: Aerial, Highway, Marine, and Rail Technologies & Linkages 42
total delivery system (Wakeman, 2001). The competition for business among international shippers and domestic suppliers is between entire freight logistic systems, not just ports or distribution centers. Imported goods movement is viewed en total from initial point of origin to the final destination, which in the U.S. may be a multi-state region. The same cost pressure is true to a large extent in the domestic trade. Trucking is the essential mobility provider for domestic moves, but seeking greater efficiencies from other modes is increasingly important. Further, intermodalism is increasingly replacing long-distance truck moves for environmental reasons (Lowe, 2005). It is also from U.S. ports that American made goods are exported overseas after their overland journeys from inland manufacturing plants. In fact, U.S. manufactured exports have increased 82 percent since the end of the last multilateral trade round nearly a decade ago (AAPA, 2007). The port industry, however, does not just embrace the physical handling of cargo and the transport of cargo to and from port terminals; it also requires workers from a myriad of other private enterprises and governmental agencies to ensure the movement of millions of tons of goods through inland corridors and coastal port facilities. These activities generate $18 billion in industry fees and taxes (AAPA, 2007). Northeast Region Consumer Demand The Northeast (including the northern tier to Chicago), with more than 100 million residents, is the largest consumer market in the United States. This region’s demand is fueled by its residents’ purchasing power, which constitutes approximately 40 percent of the nation’s disposable income. As population grows, so will the volume of goods needed to support them and their businesses. Demand for international goods continues to grow within the Northeast. For example, the 10-county New York Metropolitan region already has the highest volume of freight movement of any metropolitan region in the country but is also seeing its population grow by an estimated 2 million people by 2025. The New York Metropolitan Transportation Council forecasts a 47 percent increase in freight volumes within the region over this time period (Mann, 2005). Consumer demand for international cargo is growing throughout the Northeast. The primary gateway for these international goods is the nation’s ports including the eight principal North Atlantic ports from Halifax to Norfolk, particularly the Port of New York and New Jersey. The North Atlantic ports along the East Coast are all experiencing significant growth in container traffic since 2000. There has been an approximately 50 percent growth in container export and import movements at these ports from 2000 to 2005. The percent growth for individual ports is displayed at Table 1 (AAPA, 2006). The Port of New York and New Jersey is the gateway for approximately 50 percent of the total cargo demand for the New York-New Jersey metropolitan region. Of note, the majority of the other half of the goods consumed in the region is transported from the ports in Southern California by mini land-bridge. The point of entry is on the West Coast because a significant portion of this international cargo is coming from the Far East.
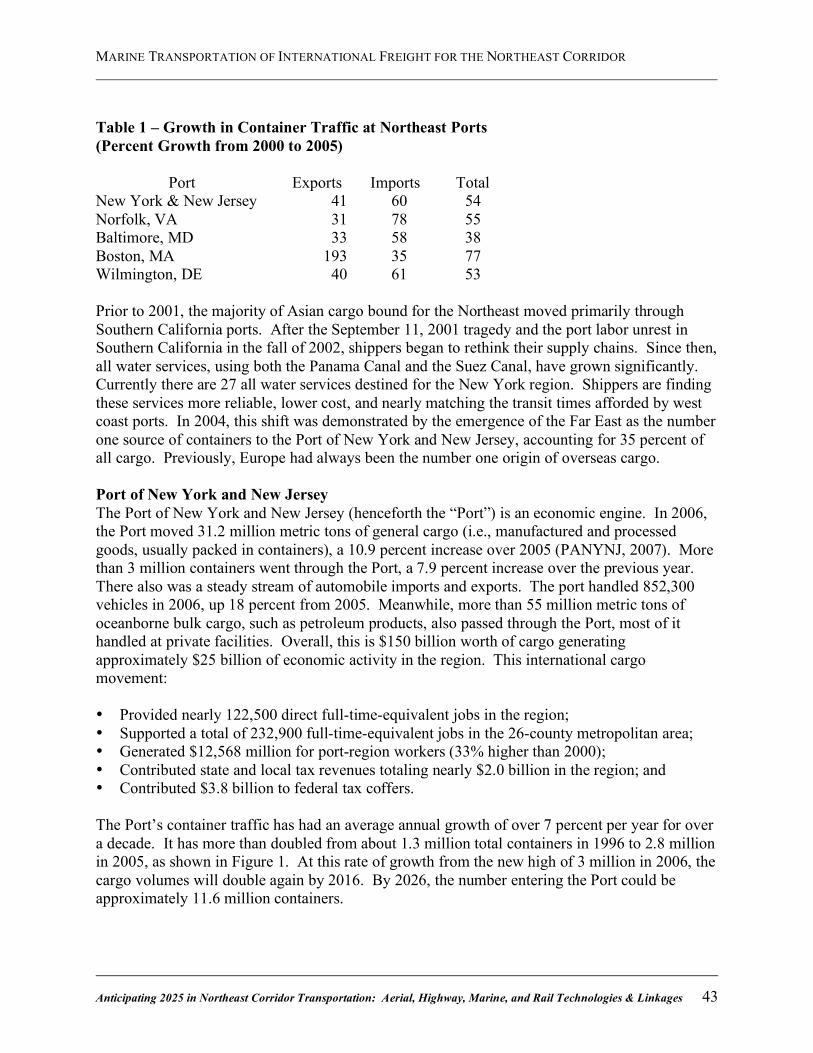
MARINE TRANSPORTATION OF INTERNATIONAL FREIGHT FOR THE NORTHEAST CORRIDOR
Anticipating 2025 in Northeast Corridor Transportation: Aerial, Highway, Marine, and Rail Technologies & Linkages 43
Table 1 – Growth in Container Traffic at Northeast Ports (Percent Growth from 2000 to 2005)
Port Exports Imports Total
New York & New Jersey 41 60 54 Norfolk, VA 31 78 55 Baltimore, MD 33 58 38 Boston, MA 193 35 77 Wilmington, DE 40 61 53 Prior to 2001, the majority of Asian cargo bound for the Northeast moved primarily through Southern California ports. After the September 11, 2001 tragedy and the port labor unrest in Southern California in the fall of 2002, shippers began to rethink their supply chains. Since then, all water services, using both the Panama Canal and the Suez Canal, have grown significantly. Currently there are 27 all water services destined for the New York region. Shippers are finding these services more reliable, lower cost, and nearly matching the transit times afforded by west coast ports. In 2004, this shift was demonstrated by the emergence of the Far East as the number one source of containers to the Port of New York and New Jersey, accounting for 35 percent of all cargo. Previously, Europe had always been the number one origin of overseas cargo. Port of New York and New Jersey The Port of New York and New Jersey (henceforth the “Port”) is an economic engine. In 2006, the Port moved 31.2 million metric tons of general cargo (i.e., manufactured and processed goods, usually packed in containers), a 10.9 percent increase over 2005 (PANYNJ, 2007). More than 3 million containers went through the Port, a 7.9 percent increase over the previous year. There also was a steady stream of automobile imports and exports. The port handled 852,300 vehicles in 2006, up 18 percent from 2005. Meanwhile, more than 55 million metric tons of oceanborne bulk cargo, such as petroleum products, also passed through the Port, most of it handled at private facilities. Overall, this is $150 billion worth of cargo generating approximately $25 billion of economic activity in the region. This international cargo movement: • Provided nearly 122,500 direct full-time-equivalent jobs in the region; • Supported a total of 232,900 full-time-equivalent jobs in the 26-county metropolitan area; • Generated $12,568 million for port-region workers (33% higher than 2000); • Contributed state and local tax revenues totaling nearly $2.0 billion in the region; and • Contributed $3.8 billion to federal tax coffers. The Port’s container traffic has had an average annual growth of over 7 percent per year for over a decade. It has more than doubled from about 1.3 million total containers in 1996 to 2.8 million in 2005, as shown in Figure 1. At this rate of growth from the new high of 3 million in 2006, the cargo volumes will double again by 2016. By 2026, the number entering the Port could be approximately 11.6 million containers.
MARINE TRANSPORTATION OF INTERNATIONAL FREIGHT FOR THE NORTHEAST CORRIDOR
Anticipating 2025 in Northeast Corridor Transportation: Aerial, Highway, Marine, and Rail Technologies & Linkages 44
Logistic Pipelines International freight movement is now part of a global supply chain where logistic providers control the flow. Seaports and their intermodal connectors are part of this logistics system that must provide shippers with low cost, reliability, and cargo velocity to compete effectively. This formula works if there is adequate capacity within the components of the transportation/logistics pipeline to meet the shipping customer’s demands. A port is just one segment along the pipeline that must move containers swiftly and cost efficiently. It is also a replaceable segment. If a port’s capacity is “narrower” than that of the rest of the pipeline, or if a port impedes the flow of goods in any other way, it can and will be replaced. The pipeline will be rerouted through another seaport that can keep up. The new gateway may be in Canada or to the south, and amid the fierce competition that engulfs the shipping sector, the chances of reconnecting will be slim. The capacity and scale of this global pipeline is changing with the expansion of global trade. It is being driven by the ever-increasing size of container ships. The ocean carrier industry has been steadily building larger vessels from the 2,500 TEU ships in 1990 to 13,000 TEU mega-ship emerging in 2007 fleet (Barnard, 2007). The savings offered by the economies of scale created by these mega-ships is allowing the carrier industry to drop their costs and to tighten margins. The rest of the delivery system must react and create comparable capacity within the system or face the economic consequences of congestion and diversions. Hence, the entire logistics system for a region (waterways, terminals, intermodal connections and distribution centers) must be expanded and redeveloped. Although the system failure may be regional (as occurred at Southern California ports in Fall 2002), the economic consequences are national in-scope. Infrastructure Investments The Port Authority of New York and New Jersey (henceforth the “Port Authority”) recognized these changes in the maritime transportation system starting in the mid-1990s. Since then, the Port Authority has been heavily investing in port infrastructure, on both the waterside and on the landside to keep pace with the demands for greater capacity. Over the past five years, the Port Authority has invested $1.1 billion in an unprecedented capital program for port redevelopment. The goal has been to enable the Port of New York and New Jersey to accommodate the steady swell in commerce and the new generation of ships that sail to it. Dredging As has been done with many other ports, the Port Authority entered into an agreement with the federal government for dredging of local waterways. The agency agreed to spend in excess of $1.6 billion to deepen and expand the local navigation channels to provide adequate underkeel draft demanded by today’s container ship fleet. Deepen major shipping channels to 13.7 m (45 feet) in the first phase of an effort to ensure access for the mega-containerships (called Post-Panamax size because they’re too big to fit through the Panama Canal) that have become the industry standard. The Port Authority
MARINE TRANSPORTATION OF INTERNATIONAL FREIGHT FOR THE NORTHEAST CORRIDOR
Anticipating 2025 in Northeast Corridor Transportation: Aerial, Highway, Marine, and Rail Technologies & Linkages 45
undertook the job with the U.S. Army Corps of Engineers (USACE) and completed it in 2004 under budget and ahead of schedule. The Port Authority and the USACE have begun construction of new deeper channels to accommodate the new generation of containerships. Deepening of navigation channels to 15.2 m (50 feet) is now underway as is the deepening of terminal berths to lodge the mega-ships. Construction is anticipated to be completed in 2014. Terminals Investments (approximately $1 billion) were also made in the redevelopment of the Port Authority’s marine terminals. These investments, which included wharf reconstruction, terminal reconfiguration, paving, and so forth, were coupled with operator activities to increase terminal and rail productivity. The Port’s tenants’ $500 million-plus investment in terminal infrastructure and equipment has improved system performance. Private investments include strengthen of wharves to enable them to deploy bigger, higher-capacity, electrically driven container cranes capable of efficiently working the mega-ships. The operators have also purchased new and more efficient yard equipment to increase productivity, and have constructed new gates structures to reduce delays and increase terminal effectiveness.
Rail As much as 80 percent of the containerized cargo entering the regional Port complex stays within the New York-New Jersey metropolitan region. However, a significant portion heads inland to Chicago and to Northeastern Canada. Approximately 13 percent of the Port’s cargo moves by rail today, but there are plans and investments being made to increase that proportion to about 25 percent over the next decade. In the last few years alone, the Port Authority has authorized $600 million for regional rail expansion including the expansion of on-dock rail infrastructure at four of the Port’s terminal facilities to accommodate the unprecedented growth in intermodal rail volumes. International intermodal rail cargo is good business for the Port to handle as it increases the cargo handling capacity of facilities, is environmentally friendly, and meets the needs of port users, i.e., shippers. It also fills a critical role in the national freight distribution chain. However, much of the $530 million investment in on-dock rail is at risk if other funding sources (public or private) are not identified to expand the freight rail system to handle the burgeoning growth in intermodal and other rail cargo. The Port cannot handle the growth expected and reach the capacity potential of the on-dock facilities with the existing freight rail lines beyond the terminals. Trying to do so would be like having a single-lane country road as the primary access to a huge football stadium. The Port Authority’s Port Inland Distribution Network (PIDN) initiative is a regional approach to encourage the greater use of rail to move boxes within the metropolitan area as well as the Northeast (Ellis, 2005). Federal funding was provided to support the Alameda Corridor in Los Angeles and the Heartland Corridor, which is being built from Norfolk to Columbus and Cincinnati. But there are no programmatic mechanisms to fund these types of rail linkages to the hinterland (AASHTO, 2003).
MARINE TRANSPORTATION OF INTERNATIONAL FREIGHT FOR THE NORTHEAST CORRIDOR
Anticipating 2025 in Northeast Corridor Transportation: Aerial, Highway, Marine, and Rail Technologies & Linkages 46
Inland Access Containerized freight movement is often conceptualized as a “door-to-door” process that moves manufactured goods from the factory to the retail store’s shelf as quickly and efficiently as possible. This movement can be characterized as two transportation segments: an open ocean leg (with the move conducted by steamship), and landside move (using cranes, trucks, trains and possibly barges to the retail “door”). The term “landside or inland” transportation refers to the movement of freight from port facilities to the retail store. From this perspective, the inland move is actually three separate moves or tiers: first from the waterside berth to the terminal gate, next from the gate to the regional warehouse or distribution center, and third from the warehouse to the store. Conceptualizing the freight distribution network in these three tiers offers a representative framework for discussing roles and responsibilities within the landside transportation system. The moves (i.e., Tier I - waterside to port, Tier II - port to first point-of-rest, i.e., whether depot, warehouse or distribution center, and Tier III - to the store) are graphically represented at Figure 2. It displays the Tier I, II and III cargo moves of international freight. An assessment of carrier costs on the landside was performed and included container handling, transport by truck and rail, local and inland empty repositioning, and equipment maintenance and repair. The assessment culminated in an estimate that these landside cost components made up approximately 55% on the West Coast and 60% on the East Coast of the total cost of delivering ocean borne goods (Pierce, 2006). Twenty to twenty five percent were thought to be concentrated in handling at marine terminals. In New Jersey, most of the Tier I activities fall within the span-of-control of the Port Authority. The Port Authority has invested approximately $1.5 billion since 2001 in Tier I projects including dredging of navigation channels, redevelopment of terminals, construction of on-dock rail facilities and local road improvements. Currently the Port Authority forecasts an additional $1.7 billion of analysis and infrastructure investments in Tier I and Tier II move capacity and capabilities. Although there Tier II investments incorporated in the Port Authority forecast, for the most part Tier II is the domain of the federal, state and local transportation agencies and their private sector partners. Environmental Pressures As international cargo volumes continue to grow at ports, the locally impacted communities are increasingly concerned about congestion, water and air pollution, and other environmental impacts that this rapid growth is having on their quality of life. Most recently air quality has become the chief concern, particularly at the San Pedro Bay ports (POLB, 2006). Ports have been forced to develop cold iron capability, terminal operators compelled to meet government mandates for no net increase in air emission levels, (regardless of substantially increased cargo volumes), and ocean carriers required to comply with state regulations on vessel speed and fuel used that are imposed on ships at distances where state jurisdiction is uncertain.
MARINE TRANSPORTATION OF INTERNATIONAL FREIGHT FOR THE NORTHEAST CORRIDOR
Anticipating 2025 in Northeast Corridor Transportation: Aerial, Highway, Marine, and Rail Technologies & Linkages 47
Air quality impact is only one of the categories of environmental issues drawing concern from both the public and transportation agencies. Other major areas of potential environmental impact have been documented for several decades and include: • Dredging and dredged material disposal; • Environmental windows for fisheries protection; • Oil spills and vessel discharges; • Filling of wetlands; • Water pollution from yard and industry discharges; • Invasive species introductions in ballast water; • Noise and light pollution; and • Environmental justice issues. Across the U.S., ports are coming under increasing scrutiny by environmental advocates who claim that their economic benefits are being increasingly offset by their role in degrading the environment and the health of surrounding communities. They allege that ports have slipped through gap resulting from an inadequate regulatory framework (Bailey et al., 2004). Suits filed by environmental interest groups to stop development or limit operations have resulted in certain ports undertaking millions of dollars in environmental enhancements, beyond that required by regulation, to meet court-mandated settlements. There is increasing pressure from environmental advocacy groups on government regulators to close what they see as the regulatory gap controlling the port industry. The Natural Resources Defense Council (NRDC) alleges: “Marine ports are now among the most poorly regulated sources of pollution in the United States” (Bailey et al., 2004). The NRDC recommends that the Congress, US EPA, US Coast Guard and the States impose regulations governing air emissions from ships, locomotives, on road trucks, non-road cargo handling equipment, baseline levels for storm water effluent, oil spill prevention, ballast water management, and waste discharge (Bailey et al., 2004). Another group, the Bluewater Network, filed suit against EPA for its failure to include large ocean going vessels in its standards for marine diesel engines. EPA subsequently promulgated standards for Category 3 marine diesel engines pursuant to a settlement agreement. Suits filed by environmental interest groups against federal and state government agencies and port authorities because they have failed to follow the federal or state environmental documentation processes have stopped development projects outright or result in settlements substantially increasing the project’s cost. The NRDC suit against the Port of Los Angeles for failing to conduct a state environmental impact report for the China Shipping Terminal development resulted in a court settlement costing the port $55 million. The Port of Oakland was forced to undertake $9 million in court mandated air mitigation for its Port’s Vision 2000 expansion plan as settlement for a suit brought against it by a local environmental group (Bailey et al., 2004). The current NRDC suit versus the U.S. Army Corps of Engineers over the latter’s failure to follow the federal environmental documentation process when Newark Bay was designated as a study area for the Diamond Shamrock Super Fund site. This suit resulted in a delay of the project and similarly expensive court settlement for the USACE and its local sponsor, the Port Authority of New York and New Jersey.
MARINE TRANSPORTATION OF INTERNATIONAL FREIGHT FOR THE NORTHEAST CORRIDOR
Anticipating 2025 in Northeast Corridor Transportation: Aerial, Highway, Marine, and Rail Technologies & Linkages 48
Addressing environmental issues has moved from a regulatory obligation to a strategic issue for the port and freight transportation industry. In order to continue to expand capacity and to deliver port services to the constantly growing international trade industry, ports are moving to directly address community and environmentalist’s concerns and demands. For example, the Ports of Los Angeles and Long Beach released a plan, the San Pedro Bay Ports Clean Air Action Plan, in June 2006 to address air emissions from their arriving ships, port facilities including terminal equipment, and the truck moves associated with container terminals (POLB, 2006). The plan has a price tag in excess of a billion dollars. However without addressing port related air pollution, these ports are facing stiff public opposition to their expansion desires. The ports, with the participation and cooperation of the staff of the U.S. Environmental Protection Agency, California Air Resources Board and South Coast Air Quality Management District, have developed a cooperative, sweeping, aggressive strategy to significantly reduce the health risks posed by air pollution from port-related sources (POLB, 2006). The ships, trucks, trains and other diesel-powered equipment and harbor craft at the ports are major sources of air pollution in a region that already has some of the worst air quality in the nation. Air pollutants at the ports include nitrogen oxides (NOx), which contributes to smog, and particulate matter (PM), which poses health risks. The San Pedro Bay Ports Clean Air Action Plan involves hundreds of millions of dollars of investment by the ports, the state, air quality regulatory agencies and the ports industry. It will expedite the introduction of new and innovative methods of reducing emissions prior to that of any federal or state requirements. The measures that will be implemented under the Plan are expected to eliminate more than 50 percent of diesel particulate matter (PM) emissions from port-related sources within the next five years and significantly reduce associated health risks (POLB, 2006). Smog-forming nitrogen oxide (NOx) emissions will be reduced by more than 45 percent, and the plan measures also will result in reductions of other harmful air emissions such as sulfur oxides (SOx). According to the two ports, in five years, under the Plan, diesel PM from all port-related sources would be reduced by a total of 1,200 tons per year, and NOx emissions would be reduced by 12,000 tons per year (POLB, 2006). They are hoping these actions will gain them the regulatory approvals needed to meet their infrastructure expansion requirements forecasted by national cargo growth projections. Without the expansion, congestion in these ports will obviously increase. Attempting to move from crisis-to-crisis responses, many ports and maritime industries are seeking new management approaches for addressing community and environmental issues. Several management measures to address these issues have been developed including: (1) IMO regulations and guidelines, (2) Port State Regulations, and (3) Environmental Management Systems (EMS) and Port Environmental Management Systems strategies (Palantezas et al., 2006). Being systematic in their approach to environmental issues by integrating these measures into their processes and integrating what have been traditionally-viewed as external needs (and often, as related above, demands) into the Northeast’s transportation infrastructure and business plans, the responsible public and private officials will certainly reduce environmental lawsuits and the resultant project delays and costs. Intelligent Technologies
MARINE TRANSPORTATION OF INTERNATIONAL FREIGHT FOR THE NORTHEAST CORRIDOR
Anticipating 2025 in Northeast Corridor Transportation: Aerial, Highway, Marine, and Rail Technologies & Linkages 49
The ability to increase transportation capacity in the urban areas of the Northeast is almost non-existent. Because of the restricted physical capacity at ports and their intermodal connectors, i.e., road and rail corridors, and the growing environmental pressures, new transportation processes and operational procedures must be considered. Two alternatives that have promise for the dense urban areas of the Northeast are application of intelligent technologies to transportation and greater utilization of coastal shipping services on America’s Marine Highways (MARAD, 2007). Intelligent Technology System (ITS) is the new technology infrastructure that is achieving major transportation advancements in many urban areas. The introduction of smart technologies, such as E-ZPass or other electronic toll technologies for vehicles have made tremendous improvements for the traveler in terms of trip time and convenience. One of the results of ITS advancements on individual travel is that people expect to know more about their entire trip from pre-planning it, to knowing what is happening as they travel and in searching out alternative routes or modes as necessary. These technologies advancements were initially driven by the private sector investments, fostering the ability of the private sector to provide more transportation services, and thereafter were adopted by government agencies to increase transportation efficiencies. The line between government agencies providing transportation services and the private sector providing them is becoming more blurred. The application of specific ITS technologies to freight mobility ameliorates the problem of knowing where the goods are within the transportation system. ITS applications include electronic commerce initiatives, global positioning systems, and automated cargo handling technologies. These technologies are making transportation operations more efficient (Sussman, 2005). By creating a link between water, terminal, and landside information systems and processes that facilitate access to critical port information (such as real-time vessel traffic, cargo status, intermodal connections, and highway conditions), freight movement through the nation’s internal intermodal transportation system is becoming more efficient, secure, and cost effective. Port authorities are considering ITS initiatives to improve marine freight movement. For example, the Port Authority of New York and New Jersey, in the 2002-2004 timeframe, developed and implemented the Freight Information Real-Time System for Transportation (FIRST, www.firstnynj.com) online berth application system (FHWA, 2002). An expansion of the system could provide real-time container status information, vessel arrival and departure information, and real-time port and highway traffic information to all segments of the port community. This ITS application could also provide the technology platform for other initiatives that will improve system transparency, such as: • Port-wide appointment system and port pass system that would confirm a truck appointment,
notify the terminal of the in-bound status, and provide location and ETA, to expedite truck turnaround time within the terminal;
• Port-wide chassis pool that would be managed via a satellite-based tracking and equipment monitoring system, which could improve asset management for both carriers and port operators and maximize on-port land usage;

MARINE TRANSPORTATION OF INTERNATIONAL FREIGHT FOR THE NORTHEAST CORRIDOR
Anticipating 2025 in Northeast Corridor Transportation: Aerial, Highway, Marine, and Rail Technologies & Linkages 50
• Virtual Container Yard (VCY), which is an electronic bulletin board for the off-port exchange of empty containers, would improve asset management and reduce the amount of truck vehicle miles traveled; and
• Trusted Trucker (an operation respond and commercial vehicle inspections tool) would provide police and other first responders with real-time information on commercial vehicles moving to and from the port, including hazardous cargo, driver information, and vehicle information.
There are clearly new opportunities fro application of ITS technologies, but there are also challenges with integration of ITS into existing transportation systems. Two issues emerging with respect to ITS applications are institutional compatibility and physical asset life-time compatibility. First, the ITS technologies available to a traveler or freight carrier transcends traditional transportation jurisdictions. This situation requires that the responsible agencies work together to provide seamless travel corridors. Lack of technology standards and communication system compatibility create problems in coordination among these transportation agencies. Whereas a road is a road from one jurisdiction to another and requires no coordination except to meet at the borders, ITS technology allows information on regional or national traffic to be collected, processed, disseminated and used anywhere. To the extent different technologies and communication systems are used, the integration of these data across a region, or the nation, becomes more difficult and more costly. Regarding the second issue, as the integration of ITS technology with transportation infrastructure projects continues to increase, the old standard for estimating life cycle costs of physical transportation projects will require new thinking on long range planning and budgeting of projects. For example, once a road or bridge is built, maintenance of that facility is not generally required on a daily basis. With technology, however, constant maintenance or monitoring is required. An ITS platform can go down at almost any time. Software/hardware of intelligent technologies require more regular maintenance and are at risk of becoming obsolete long before the infrastructure that they are used to support. This means that different parts of the transportation system will have inconsistent applicability durations and different life-cycle costs. Short Sea Ship The second promising avenue to enhancing international and domestic freight mobility, particularly along the Northeast corridor, is the utilization of America’s Marine Highways (MARAD, 2007). The East Coast has multiple coastal and inland waterways that can also support freight transportation – waterborne transportation. Along the Northeast Corridor, excess road and rail capacity is being rapidly exhausted by the rising population, which is expected to grow by approximately 25 percent by 2025, and increasing goods volume, estimated to increase by approximately 50 percent. A modal shift by freight to waterways has the potential to mitigate some of the effects of road and rail congestion along the corridor. This modal strategy may effectively increase the available transport capacity for freight is the use of Short Sea Shipping (SSS).
MARINE TRANSPORTATION OF INTERNATIONAL FREIGHT FOR THE NORTHEAST CORRIDOR
Anticipating 2025 in Northeast Corridor Transportation: Aerial, Highway, Marine, and Rail Technologies & Linkages 51
Short Sea Shipping is defined as a barge or ship service (also known as a feeder service) that moves containers between major maritime hubs and smaller ports. The use of short-sea feeder services is common in Europe to complement existing intermodal terminal operations. The availability of SSS feeder services would reduce highway and rail congestion by providing parallel corridors for international and domestic container moves. In 2003, SSS accounted for 63 percent of the entire volume of goods transported by sea in the European Union (EU-15), totaling over 1.6 billion tons (Xenellis, 2005). There are over 100 SSS operators within the Northeast region (I-95 Corridor Coalition, 2005). Currently these services do not transport a significant volume of freight moving into or out of the region. They only account for approximately 13 percent of the movements by weight and less than 2 percent of the overall freight shipments by value (I-95 Corridor Coalition, 2005). Along the East Coast there are several examples of potential short-sea routes including Jacksonville to San Juan, Albany to Boston, or Philadelphia to New York. These routes are defined by current marine operators as shown at Figure 3. To be successful, the routes must be economically competitive and operationally reliable. Even with a good route, it is not always feasible to maintain service. For example, working with the Port of Albany under the PIDN program, the Port Authority of New York and New Jersey launched a container-on-barge service from the NY/NJ port to Albany (Ellis, 2005). Although the service was not sustainable for several reasons, the Port Authority, other ports, and many maritime interests continue to look for innovative ways to use the Marine Highway system and Short Sea Shipping approaches to moving cargo out of port areas and on to inland locations. Next Steps To proceed, there needs to be an articulated vision of the future, the contributions to the regional well-being including prosperity and quality of life, and an implementation framework and tools that cut across political, jurisdictional, and industry stovepipes to deliver that vision. Given the difficulty in addressing the freight transportation challenges, it will be critical to gain agreement with other key stakeholders on the application of 24/7 options, modal shifts to sprint rail or coastal barge, truck-only toll roads, and so forth. There are no easy answers to the problems of adequate transportation capacity, new financing for added infrastructure or the community concerns surrounding health and congestion that challenge state agencies, port authorities and international businesses. Nevertheless, the cargo is coming and the current issues faced will only grow if ignored. The transportation and logistics leadership in the Northeast region recognizes the need for cooperation in the development of transportation solutions in the movement of international cargo from the seaport or airport to the distribution center/warehouse and ultimately to the consumer. Finding the right balance of public and private involvement and investment is critical when working with regional and local government agencies and business interests, particularly when the risk is large and the opportunities great.
MARINE TRANSPORTATION OF INTERNATIONAL FREIGHT FOR THE NORTHEAST CORRIDOR
Anticipating 2025 in Northeast Corridor Transportation: Aerial, Highway, Marine, and Rail Technologies & Linkages 52
The key is an agreed to vision. The way to deliver the regional vision comes from working with others. Whatever the vision that the Northeast adopts, it must be presented to the nation, and the region must seek concurrence among our national transportation partners. The tools to be used include cooperation, communication and collaborations to gain the committed involvement of federal and other state agencies, international and domestic businesses, and regional stakeholders to achieve the promise of a Northeast transportation vision that offers efficient and effective service, regional prosperity, and environmental responsibility. What Could Exist in 2025? Projecting into a hopeful view of the future of the Northeast regarding these issues, suppose: In 2025, with the guidance of visionary leaders and the commitment of both public and private stakeholders, the Northeast region of the United States could be a key global trading participant. This success would be founded on a broad system of transportation gateways and corridors seamlessly connecting the Northeast to other regions of the nation, North America and the world. Under a National Passenger and Freight Transportation Policy, the region would use both its wealth and intellectual capacity to develop and implement new ITS technologies and SSS application to improving transportation efficiencies and regional prosperity. The use of waterborne freight movements along the East Coast would be fully developed, leaving corridor road and rail capacity available for time sensitivity freight and traveler demands. The key to this success was a Strategic Vision ands Plan developed in the late 2000s. Responsible stakeholders developed the willingness to work together for the region’s and nation’s greater good as well as their individual benefit. The region’s public-private partnerships for infrastructure improvements and integrated operations would not only be beneficial to the local communities and environment where the people and goods movement activities were taking place, but also to other regions of the nation and the world in general. In deed, cooperation, communication, and commitment to address long-term transportation needs beyond 2025 would be manifested in the continued wise planning, construction and financing programs that internalize both community and environmental concerns. Under these conditions of mutual cooperation, there is a high probability for this bright future. A future filled with the promise of continued public and private benefits provided by achieving system harmony and outstanding performance in the field of transportation and goods movement for the Northeast. Conclusions Global trade is increasingly a significant part of the United States’ economic well-being. It is estimated that international trade will grow from 25 percent of U.S. Gross Domestic Product today to 60 percent by 2030. The success of international trade transactions for the nation is directly dependent on having an efficient and effective international gateways and an internal intermodal transportation system for freight movement. The Northeast region of the U.S. represents more than 100 million citizens and approximately 40 percent of the nation’s
MARINE TRANSPORTATION OF INTERNATIONAL FREIGHT FOR THE NORTHEAST CORRIDOR
Anticipating 2025 in Northeast Corridor Transportation: Aerial, Highway, Marine, and Rail Technologies & Linkages 53
disposable income. This is a region with a high demand for consumer goods and industry materials. Port authorities are working with other transportation agencies and industry representatives to create the needed added transportation system capacity and provide transportation efficiencies to meet the regional and national demand for handling the growing volumes of international and domestic cargo. Two promising avenues for enhancing goods mobility are the development and application of Intelligent Transportation System technologies and greater utilization of Short Sea Shipping, particularly along the Northeast corridor. ITS technologies can improve transportation efficiencies by increasing gateway and corridor transparency for management of freight movement. The application of SSS services would reduce highway and rail congestion by providing parallel corridors for international and domestic container moves. These approaches will require new levels of national and regional coordination among public agencies and private entities. Without improvement in cooperation, communication and commitment among the stakeholders, there is a serious risk of increasing congestion and transportation system inefficiencies that will hurt both the Northeast’s economic prosperity, its environment and ultimately the region’s quality of life.
MARINE TRANSPORTATION OF INTERNATIONAL FREIGHT FOR THE NORTHEAST CORRIDOR
Anticipating 2025 in Northeast Corridor Transportation: Aerial, Highway, Marine, and Rail Technologies & Linkages 54
Bibliography AAPA. 2007. America’s Ports Today. American Association of Port Authorities. Alexandria, VA. February 2007. AAPA. 2006. Seaports of the Americas. American Association of Port Authorities. 2006 AAPA Directory. Alexandria, VA. AASHTO. 2007. Transportation Investment in Our Future: America’s Freight Challenge. American Association of State Highway and Transportation Officials (AASHTO), Washington, DC. May 2007 AASHTO. 2003. T Freight-Rail Bottom Line Report. American Association of State Highway and Transportation Officials (AASHTO), Washington, DC. Bailey, D., Plenys, T., Solomon, G., Campbell, T., Feuer, G., Masters, J., and Bella, T. 2004. Harboring Pollution: The Dirty Truth about U.S. Ports. Natural Resources Defense Council, New York, NY. Barnard, B. 2007. German Owner Orders 13,000-TEU Box Ships. Journal of Commerce Online, Commonwealth Media, Inc. Newark, NJ. July 30, 2007. Broeze, F. 2002. The Globalization of the Oceans. International Maritime Economic History Association, St. John’s, Newfoundland, Canada. Ellis, W. 2005. Port Inland Distribution Network. American Association of Port Authorities, Port Professional Manager (PPM) Paper, Washington, D.C. (website: http://www.aapa-ports.org/Publications/PPMList.cfm). February 2005. FHWA. 2006. Freight Facts and Figures, 2006. Federal Highway Administration, FHWA-HOP-07-033, EDL 14330, Office of Freight Management and Operations, U.S. Department of Transportation, Washington, D.C. November 2006. FHWA. 2002. Freight Information Real-Time System for Transport (FIRST). Federal Highway Administration, FHWA-OP-02-042, EDL 13616, Office of Freight Management and Operations, U.S. Department of Transportation, Washington, D.C. March 2002. Hensher, D. and A. Brewer. 2001. Transport – An Economics and Management Perspective. Oxford University Press Inc., New York, NY. I-95 Corridor Coalition. 2005. Short-Sea and Coastal Shipping Options Study. Report prepared by Cambridge Systematics, Inc., for I-95 Corridor Coalition. Washington, D.C. November 2005. International Maritime Organization (IMO). 2005. International Shipping, Carrier of the World Trade. World Maritime Day 2005, IMO, United Nations, New York, NY.
MARINE TRANSPORTATION OF INTERNATIONAL FREIGHT FOR THE NORTHEAST CORRIDOR
Anticipating 2025 in Northeast Corridor Transportation: Aerial, Highway, Marine, and Rail Technologies & Linkages 55
Lowe, D. 2005. Intermodal Freight Transport. Elsevier Butterworth-Heinemann, London, UK. Mann, H. 2005. The Basics of Freight Transportation in the New York Region. New York Metropolitan Transportation Council, New York, NY. MARAD. 2007. America’s Marine Highway Initiative. Maritime Administration, U.S. Department of Transportation, Washington, D.C. (website address: http://www.marad.dot.gov/Programs/America's Marine Highways/Marine highways.html ) Muller, G. 1999. Intermodal Freight Transportation, 4th Edition. Eno Transportation Foundation, Inc. and Intermodal Association of North America (IANA). Washington, D.C. Palantzas, G., C. Wooldridge, A. Naniopoulos, S.Theofanis, and M. Boile. 2006. Applying Environmental Management Systems in European Ports: The Application of Port Environmental Management System (PERS) in the Ports of Piraeus and Thessaloniki. In TRB 85th Annual Meeting Compendium of Papers CD-ROM, National Research Council, Washington, DC, January 22-26, 2006. PANYNJ. 2007. 2006 Trade Statistics. Port Authority of New York and New Jersey, New York, NY. (website: www.panynj.info ) PANYNJ. 2006. Port Authority Marine Container Terminals Truck Origin-Destination Survey 2005. Port Authority of New York and New Jersey, report prepared by Vollmer Assoc., Eng-Wong, Taub & Assoc., New Jersey Institute of Technology, and Stevens Institute of Technology. New York, NY. Revised February 2006. Pierce, A. 2006. Remarks by A.A. Pierce, Executive Director, Transpacific Stabilization Agreement (TSA) before IBC Asia Conference, Hong Kong, November 28, 2006. POLB. 2006. San Pedro Bay Ports Clean Air Action Plan. Port of Long Beach (POLB), report prepared by Port of Los Angeles and Port of Long Beach in cooperation with U.S. EPA, California Air Resources Board, and the South Coast Air Quality Management District, CA. (website: www.polb.com/environmental/environmental_documents.asp). Sussman, J. 2005. Perspectives on Intelligent Transportation Systems. Springer Science, New York, NY. US Department of Commerce. 2004. Survey of Current Business. Bureau of Economic Analysis, US Department of Commerce. October 2004. USDOT. 2005. Pocket Guide to Transportation. U.S. Department of Transportation, Bureau of Transportation Statistics. Washington, D.C. January 2005.
MARINE TRANSPORTATION OF INTERNATIONAL FREIGHT FOR THE NORTHEAST CORRIDOR
Anticipating 2025 in Northeast Corridor Transportation: Aerial, Highway, Marine, and Rail Technologies & Linkages 56
USDOT. 2007. America’s Container Ports: Delivering the Goods. U.S. Department of Transportation, Research and Innovative Technology Administration, Bureau of Transportation Statistics. Washington, D.C. March 2007. (website: www.bts.gov/publications/americas_container_ports/) Wakeman, T. 2001. Developing multi-modal connections at the Port of New York and New Jersey. In T. Collins (ed.) Ports '01, Proceedings of ASCE/PIANC Specialty Conference, held in Norfolk, Virginia, April 29 - May 2, 2001. Xenellis, G. 2005. Short Sea Shipping 2000-2003. Statistics in Focus, Transport. EUROSTAT, KS-NZ-05-002-EN-N, European Communities. February 2005.
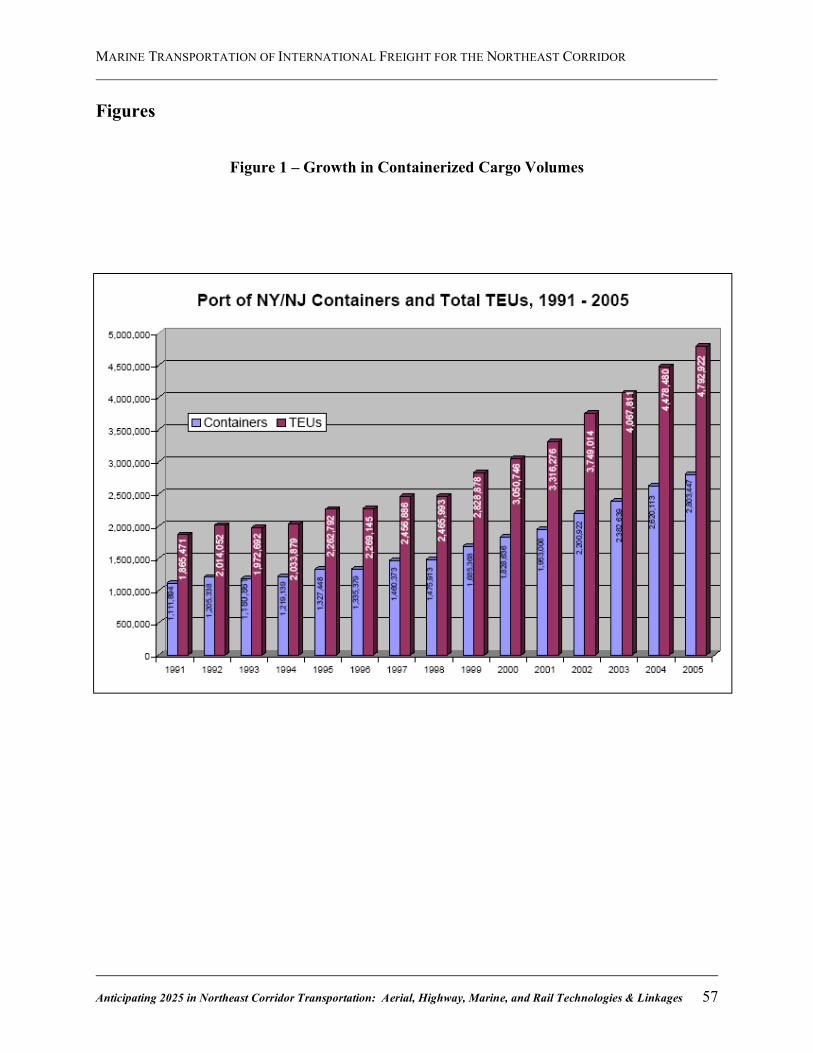
MARINE TRANSPORTATION OF INTERNATIONAL FREIGHT FOR THE NORTHEAST CORRIDOR
Anticipating 2025 in Northeast Corridor Transportation: Aerial, Highway, Marine, and Rail Technologies & Linkages 57
Figures
Figure 1 – Growth in Containerized Cargo Volumes
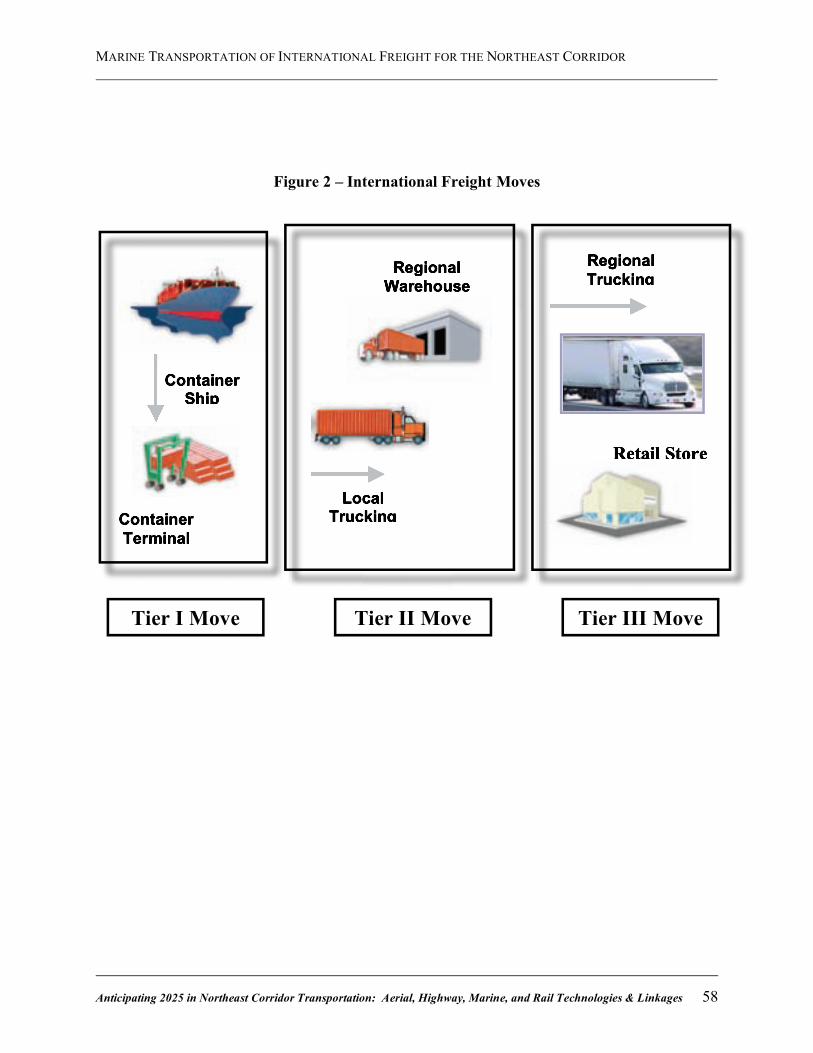
MARINE TRANSPORTATION OF INTERNATIONAL FREIGHT FOR THE NORTHEAST CORRIDOR
Anticipating 2025 in Northeast Corridor Transportation: Aerial, Highway, Marine, and Rail Technologies & Linkages 58
Figure 2 – International Freight Moves
Container Terminal
Local Trucking
Regional Warehouse
Regional Trucking
Retail Store
Container Ship
ContainerTerminal
ContainerShip
LocalTrucking
RegionalWarehouse
RegionalTrucking
Retail Store
Tier I Move
Tier II Move
Tier III Move
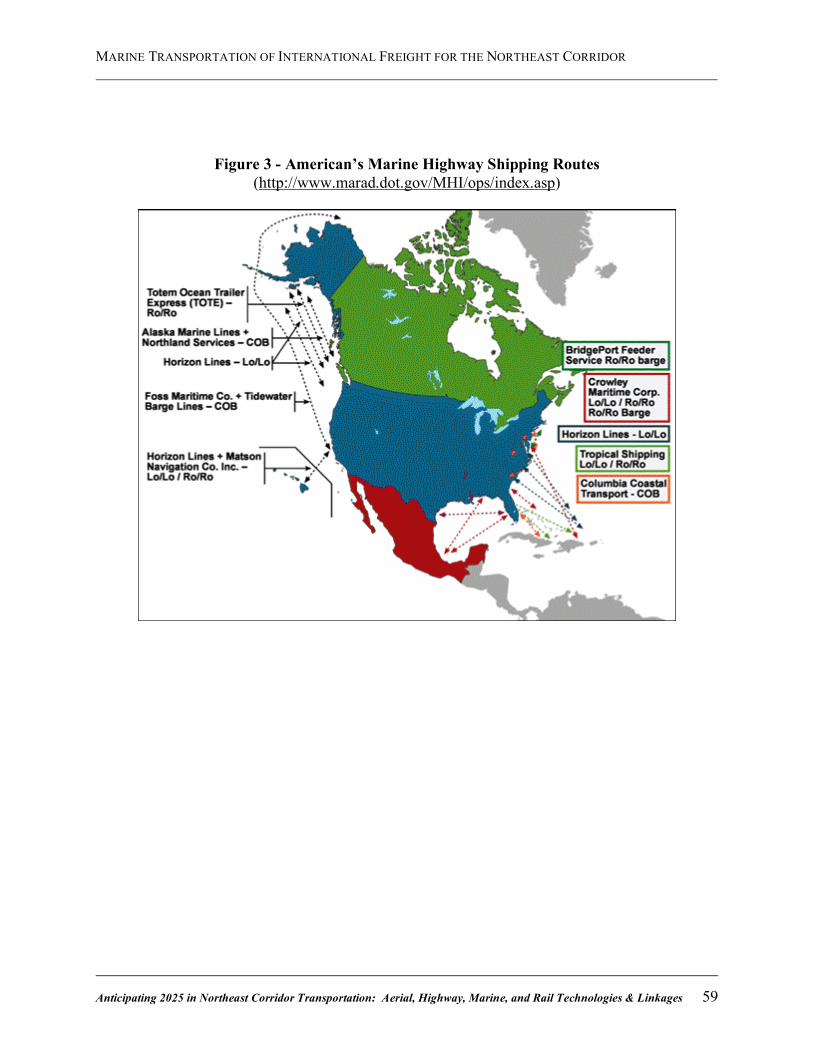
MARINE TRANSPORTATION OF INTERNATIONAL FREIGHT FOR THE NORTHEAST CORRIDOR
Anticipating 2025 in Northeast Corridor Transportation: Aerial, Highway, Marine, and Rail Technologies & Linkages 59
Figure 3 - American’s Marine Highway Shipping Routes (http://www.marad.dot.gov/MHI/ops/index.asp)
THE FUTURE OF TRANSPORTATION IN THE NORTHEAST CORRIDOR, 2007–2025: RAIL TRANSPORTATION
Anticipating 2025 in Northeast Corridor Transportation: Aerial, Highway, Marine, and Rail Technologies & Linkages 60
The Future of Transportation in the Northeast Corridor, 2007–2025: Rail Transportation Allison L. C. de Cerreño, Ph.D. Wagner Rudin Center for Transportation Policy and Management, New York University New York, NY Introduction The Northeast Corridor links the southernmost portion of Maine with Virginia, along the Atlantic Coast of the United States. The entire corridor, which represents some of the most densely populated regions of the country, is comprised of over 42 billion people (15% of total U.S. population), boasts a $1.99 trillion economy (2005), and leads the nation in the financial, media, healthcare, and higher education sectors.1 In terms of transportation, the Corridor is home to some of the most congested roadways, air, and railway infrastructure in the country, both with regard to passengers and freight. Moreover, along the Corridor, there is very limited ability to expand transportation capacity, particularly in terms of highways and airspace. With almost half of all the transit riders in the country and over three-quarters of all the rail commuters, the opportunities for rail to play a vital connecting role for passenger travel along the Northeast Corridor are tremendous.2 A fast, efficient, and reliable intercity rail service could help address congestion problems in the air by providing a ground-based alternative to air travel for trips shorter than 500 miles, and could alleviate highway congestion (where the bulk of current freight movements take place in the corridor) by making rail attractive for trips of more than 100 miles. Such a system could also generate economic benefits along the Northeast Corridor by more closely linking cities in a way that would make possible intercity commuting on a regular basis, allowing businesses to draw off a much larger base for their employees and allowing employees to look for jobs beyond their immediate urban centers. However, for this to become a reality, much needs to happen both financially and, more importantly, politically. While arguably the best intercity service in the nation, the Northeast Corridor’s intercity rail system still falls short of the region’s global competitors in Europe and Asia in terms of reliability, efficiency, and travel times. While France recently tested a high-speed train that can reach maximum speeds of 357 miles per hour (mph), and Shanghai’s Maglev system zips along easily at 268 mph (with higher maximum speeds), and while Japan’s soon-to-be older generation Shinkansen reaches speeds of 186 mph, the NEC’s Acela – the flagship of intercity passenger rail in the United States – brings up the rear with maximum authorized speeds of only 150 mph
1 U.S. Census Bureau, Census 2000; U.S. Conference of Mayors, U.S. Metro Economies: GMP – The Engines of America’s Growth (Lexington, MA: Global Insight, Inc.), 2006, Table 1; Regional Plan Association and the Penn Institute for Urban Research, “Northeast Climate and Competitiveness Summit,” March 2, 2007, http://www.america2050.org/2007/03/northeast_corridor_mobilty_sum.html (accessed 5/7/07). 2 University of Pennsylvania, Reinventing Megalopolis: The Northeast Megaregion (Philadelphia: UPenn School of Design, Spring 2005).
THE FUTURE OF TRANSPORTATION IN THE NORTHEAST CORRIDOR, 2007–2025: RAIL TRANSPORTATION
Anticipating 2025 in Northeast Corridor Transportation: Aerial, Highway, Marine, and Rail Technologies & Linkages 61
on only 33.9 miles of the entire length of the corridor.3 In fact, maximum authorized speeds are 90 mph or below for over half (127.1 out of 226.9 miles) the section between New York City and Boston, and the highest maximum authorized speed on the New York City-Washington, DC length is only 135 mph (and again only for a portion of the entire line). Indeed, to provide a frame of reference, even if trains could run at maximum speed for all segments along the length of the line between New York City and Boston, they would only average 82 mph.4 Further, because of the number of station stops, because trains need to decelerate and accelerate around curves and when entering and leaving stations, and because on any given day there may be additional speed restrictions, actual speeds are often significantly slower. To address these deficiencies and bring the Northeast [rail] Corridor (NEC) to a level of service which not only entices passengers from automobile and air, but also is recognized by our global competitors as true high-speed rail, several things need to happen. First, at the very least the corridor needs to be brought up to a state of good repair. Second, policy decisions (and corresponding funding to support them) need to be made that would allow for a true high-speed intercity rail system that is both closely linked with the aviation industry, and is supported by transit networks in the cities it connects. This paper provides a historical background and describes the current context of the NEC, discusses the dilemmas that are faced, and then turns toward new challenges and opportunities. The paper concludes with a discussion of what the future could and should hold for the rail corridor and for the Northeast with respect to an integrated transportation system with high-speed rail as a central component. Background Before one begins to think about the future, it is often helpful to know about and understand the past as well as the current context within which debates and decisions are taking place. To that end, the following paragraphs will provide the historical, policy, and economic framework within which the NEC must be viewed. The Context Legally, the Northeast [rail] Corridor (NEC) is composed of three segments: the main line right-of-way (ROW) between Washington, DC and Boston, MA; the branch line, referred to as the “spine segment” from Philadelphia, PA to Harrisburg, PA (also referred to as the Keystone Corridor); and the branch line, referred to as the “non-spine segment” between New Haven, CT and Springfield, MA. At times, the New York City-Albany, NY corridor (referred to as the Empire Corridor) is also included. However, in common usage and the way in which it will be used throughout this paper, NEC refers only to the main line. Connecting eight states and the District of Columbia, the NEC is the busiest rail line in the United States, as well as one of the most complex operationally. On a daily basis, the line is used 3 Arianne Bernard, “International Business: Research Model of French Train Beats Record, Hitting 357 Miles an Hour,” The New York Times (4 April 2007): C-4; Allison L. C. de Cerreño and Shishir Mathur, High-Speed Rail Projects in the United States: Identifying the Elements of Success – Part 2, MTI Report 06-03 (San José, CA: MTI, November 2006), p. 87. 4 Average MAS calculated using Maximum Authorized Speed and Speed Restriction Tables, provided by Amtrak’s Planning and Analysis Department.
THE FUTURE OF TRANSPORTATION IN THE NORTHEAST CORRIDOR, 2007–2025: RAIL TRANSPORTATION
Anticipating 2025 in Northeast Corridor Transportation: Aerial, Highway, Marine, and Rail Technologies & Linkages 62
by over 700,000 intercity and commuter riders (200 million annually), and several Class I and Class II freight railroads, which combined account for roughly 38 daily trains along various segments.5 In FY 2005, intercity rail ridership alone, on Amtrak’s Acela, Metroliner, and Regional services combined, was 9.5 million, just over 37% of Amtrak’s total national ridership (25.4 million).6 At the geographic center of the 456-mile long rail corridor is New York City, the most populous city in the United States as well as the anchor for the most populous region in the country.7 Including the New York region, the NEC serves five of the twenty largest metropolitan areas in the United States (Philadelphia, Washington, DC, Boston, and Baltimore are the foundations for the other four areas). On the south-end of the NEC (New York City-Washington, DC), Amtrak owns and has full operating control over the entire rail line, including dispatching, transportation supervision, and maintenance of way. Several other entities operate along sections of the south-end, including four commuter rail operators (Figure 1). Virginia Railway Express connects Alexandria, VA with Washington, DC, making use of Union Station in Washington, DC Maryland Rail Commuter Service (MARC) runs service between Washington, DC and Perryville, MD. MARC is administered by Maryland Department of Transportation’s Transit Administration, but is operated under contract with CSX and Amtrak, depending upon the line being used. Southeastern Pennsylvania Transportation Authority (SEPTA) operates between Wilmington, DE and Trenton, NJ, with Philadelphia as the center of its regional commuter railroad operations. Finally, NJ Transit operates between Trenton, NJ and Penn Station in New York City. On the north-end of the NEC (New York City-Boston), there are also multiple commuter passenger operators. However, the north-end of the Corridor is also owned, operated, and maintained by multiple agencies (Figure 1). Amtrak owns 15.2 miles from New York Penn Station to New Rochelle, NY, and 117.9 miles between New Haven and the Massachusetts state line. From New Rochelle to the Connecticut state border (9.8 miles), the line is owned by New York’s Metropolitan Transportation Authority (MTA) and operated and maintained by MTA Metro-North Railroad (MNR). From the Connecticut state border to New Haven, CT (46.8 miles), the line is owned by Connecticut Department of Transportation (ConnDOT), but still operated and maintained by MNR. The remainder of the Corridor, from the Massachusetts state border to Boston’s South Station (37.9 miles) is owned by the Massachusetts Bay Transportation Authority (MBTA), which contracts out to Amtrak for dispatching and maintenance.8 In other
5 Voorhees Transportation Center, “Northeast Corridor Action Plan: A Call for a New Federal-State Partnership,” Draft Document 12/11/05, p. 1; U.S. Government Accountability Office (GAO), Intercity Passenger Rail: Amtrak’s Management of Northeast Corridor Improvements Demonstrates Need for Applying Best Practices, Report to the Chairman, Committee on Commerce, Science, and Transportation, U.S. Senate, GAO-04-94 [hereafter, Need for Applying Best Practices] (Washington, DC: GAO, February 2004), p. 1; U.S. GAO, Intercity Passenger Rail: Congress Faces Critical Decisions in Developing a National Policy, Testimony Before the Subcommittee on Railroads, Committee on Transportation and Infrastructure, House of Representatives – Statement of JayEtta Hecker, Director of Physical Infrastructure Issues, GAO-02-522T (Washington, DC: GAO, April 11, 2002), http://www.gao.gov/new.items/d02522t.pdf (accessed 6/23/05), p. 3. 6 Amtrak, “News Release: Annual Amtrak Ridership of 25.4 Million Marks Third Straight Year of Record Increases” (October 19, 2005), http://www.amtrak.com/servlet/ContentServer?pagename=Amtrak/am2Copy/News_Release_Page&c=am2Copy&cid=1093554022797&ssid=181 (accessed 1/19/06). 7 U.S. Census Bureau, Census 2000. 8 Information on ownership and operations from U.S. GAO, Northeast Rail Corridor: Information on Users, Funding Sources and Expenditures, Report to the Chairman, Subcommittee on Surface Transportation and Merchant Marine, Committee on Commerce,
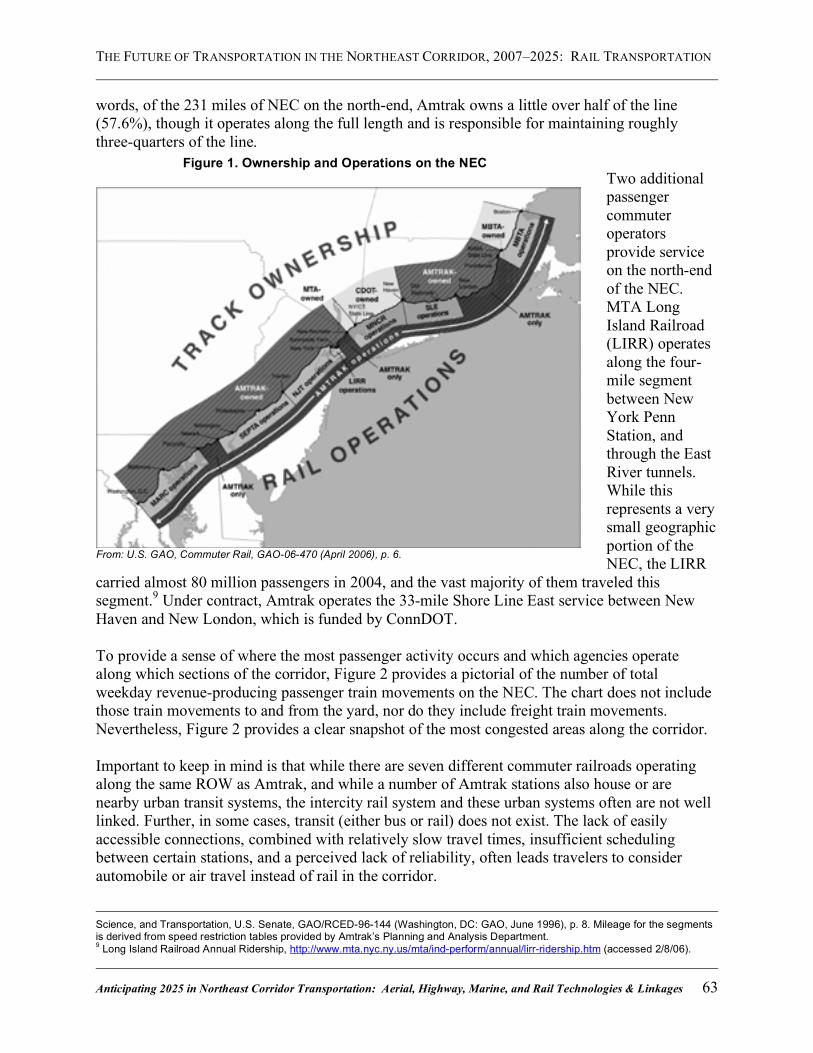
THE FUTURE OF TRANSPORTATION IN THE NORTHEAST CORRIDOR, 2007–2025: RAIL TRANSPORTATION
Anticipating 2025 in Northeast Corridor Transportation: Aerial, Highway, Marine, and Rail Technologies & Linkages 63
words, of the 231 miles of NEC on the north-end, Amtrak owns a little over half of the line (57.6%), though it operates along the full length and is responsible for maintaining roughly three-quarters of the line.
Two additional passenger commuter operators provide service on the north-end of the NEC. MTA Long Island Railroad (LIRR) operates along the four-mile segment between New York Penn Station, and through the East River tunnels. While this represents a very small geographic portion of the NEC, the LIRR
carried almost 80 million passengers in 2004, and the vast majority of them traveled this segment.9 Under contract, Amtrak operates the 33-mile Shore Line East service between New Haven and New London, which is funded by ConnDOT. To provide a sense of where the most passenger activity occurs and which agencies operate along which sections of the corridor, Figure 2 provides a pictorial of the number of total weekday revenue-producing passenger train movements on the NEC. The chart does not include those train movements to and from the yard, nor do they include freight train movements. Nevertheless, Figure 2 provides a clear snapshot of the most congested areas along the corridor. Important to keep in mind is that while there are seven different commuter railroads operating along the same ROW as Amtrak, and while a number of Amtrak stations also house or are nearby urban transit systems, the intercity rail system and these urban systems often are not well linked. Further, in some cases, transit (either bus or rail) does not exist. The lack of easily accessible connections, combined with relatively slow travel times, insufficient scheduling between certain stations, and a perceived lack of reliability, often leads travelers to consider automobile or air travel instead of rail in the corridor.
Science, and Transportation, U.S. Senate, GAO/RCED-96-144 (Washington, DC: GAO, June 1996), p. 8. Mileage for the segments is derived from speed restriction tables provided by Amtrak’s Planning and Analysis Department. 9 Long Island Railroad Annual Ridership, http://www.mta.nyc.ny.us/mta/ind-perform/annual/lirr-ridership.htm (accessed 2/8/06).
From: U.S. GAO, Commuter Rail, GAO-06-470 (April 2006), p. 6.
Figure 1. Ownership and Operations on the NEC
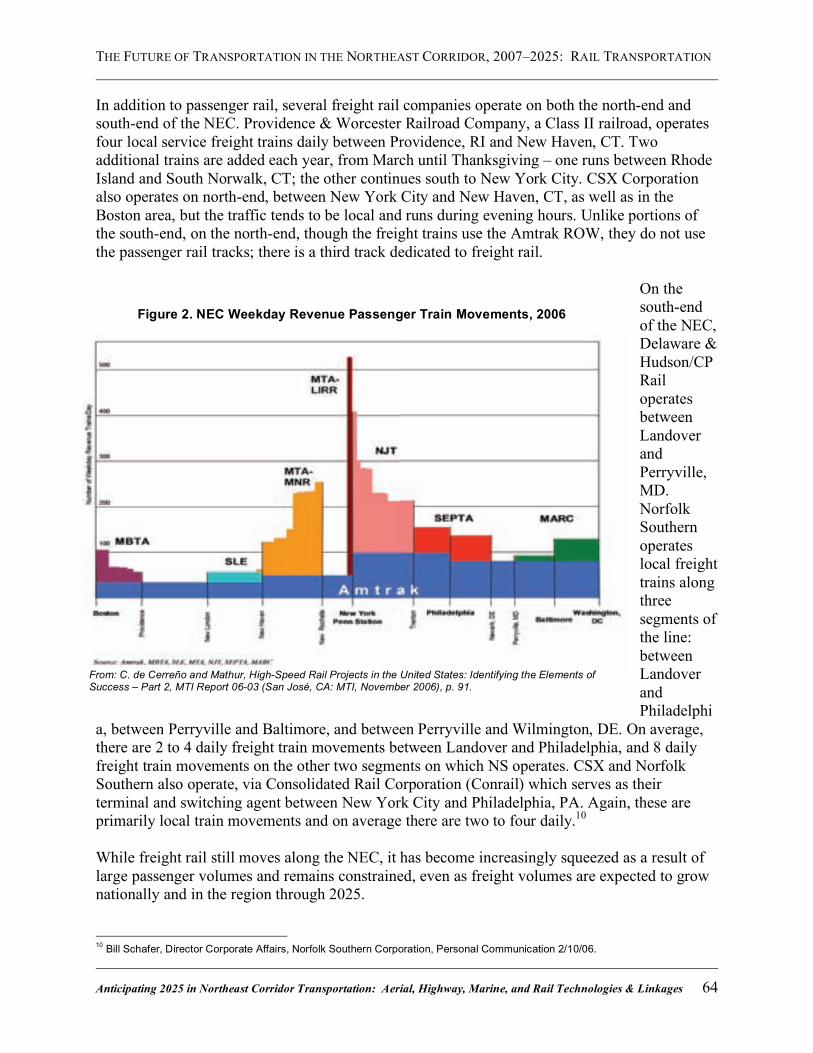
THE FUTURE OF TRANSPORTATION IN THE NORTHEAST CORRIDOR, 2007–2025: RAIL TRANSPORTATION
Anticipating 2025 in Northeast Corridor Transportation: Aerial, Highway, Marine, and Rail Technologies & Linkages 64
In addition to passenger rail, several freight rail companies operate on both the north-end and south-end of the NEC. Providence & Worcester Railroad Company, a Class II railroad, operates four local service freight trains daily between Providence, RI and New Haven, CT. Two additional trains are added each year, from March until Thanksgiving – one runs between Rhode Island and South Norwalk, CT; the other continues south to New York City. CSX Corporation also operates on north-end, between New York City and New Haven, CT, as well as in the Boston area, but the traffic tends to be local and runs during evening hours. Unlike portions of the south-end, on the north-end, though the freight trains use the Amtrak ROW, they do not use the passenger rail tracks; there is a third track dedicated to freight rail.
On the south-end of the NEC, Delaware & Hudson/CP Rail operates between Landover and Perryville, MD. Norfolk Southern operates local freight trains along three segments of the line: between Landover and Philadelphi
a, between Perryville and Baltimore, and between Perryville and Wilmington, DE. On average, there are 2 to 4 daily freight train movements between Landover and Philadelphia, and 8 daily freight train movements on the other two segments on which NS operates. CSX and Norfolk Southern also operate, via Consolidated Rail Corporation (Conrail) which serves as their terminal and switching agent between New York City and Philadelphia, PA. Again, these are primarily local train movements and on average there are two to four daily.10
While freight rail still moves along the NEC, it has become increasingly squeezed as a result of large passenger volumes and remains constrained, even as freight volumes are expected to grow nationally and in the region through 2025.
10 Bill Schafer, Director Corporate Affairs, Norfolk Southern Corporation, Personal Communication 2/10/06.
From: C. de Cerreño and Mathur, High-Speed Rail Projects in the United States: Identifying the Elements of Success – Part 2, MTI Report 06-03 (San José, CA: MTI, November 2006), p. 91.
Figure 2. NEC Weekday Revenue Passenger Train Movements, 2006
THE FUTURE OF TRANSPORTATION IN THE NORTHEAST CORRIDOR, 2007–2025: RAIL TRANSPORTATION
Anticipating 2025 in Northeast Corridor Transportation: Aerial, Highway, Marine, and Rail Technologies & Linkages 65
A Brief History While the history of rail on the NEC begins as early as the 1800s, for the purposes of this paper, the starting point is the 1965 High-speed Ground Transportation Act (HSGTA). The Act authorized $90 million for high-speed demonstration projects and established the Office of High-speed Ground Transportation (OHSGT) within the Department of Commerce, directing them to plan, organize, fund, and evaluate demonstration projects to determine how high-speed ground transportation systems could contribute to more efficient and cost-efficient intercity rail.11 Both the north and south-ends of the Northeast Corridor were quickly identified for demonstration projects under the HSGTA and $51.8 million was allocated to the corridor. On the south-end, between Washington, DC and New York City, the OHSGT signed a contract with the Pennsylvania Railroad, initially committing $6.7 million (later increased to $11 million) to support the acquisition of new-generation electric-powered self-propelled passenger cars that could travel at speeds of up to 160 mph.12 The total cost for the trainsets would eventually reach $60 million, with another $45 million spent on upgrades to the ROW to run the new trains.13 The first Metroliner placed into service in January 1969. The new service reduced the trip time between New York City and Washington, DC by an hour and was well received by passengers. Indeed, immediately after the introduction of the Metroliner, ridership improved markedly.14 However, within less than a decade performance was suffering, in part because the infrastructure was not upgraded at the same time as the trainsets were introduced, and in part because of overall deferred maintenance on the line. Initially able to run at speeds over 100 mph, the Metroliner was limited to 80 mph by 1975, severely hampering operations with resulting decreases in ridership. By the end of 1976 three-quarters of the Metroliner trains were arriving late.15 What could have been a stronger and long-lasting success was undermined by inadequate vision and investment. Indeed, the issue of deferred maintenance is one that continues to haunt and constrain high-speed rail on the NEC. On the north-end of the NEC, between New York City and Boston, MA, the TurboTrain was introduced into revenue service in April 1969. The TurboTrain featured a pendular banking suspension system similar to the Talgo trains in Spain, allowing it to round curves faster than conventional trains and travel and achieve speeds of up to 170 mph. The goal was to reduce travel between Boston and New York City by an hour, but the TurboTrain fell short, only reducing travel time by half that. Furthermore, though it attracted a loyal clientele, the TurboTrain experiment was plagued with mechanical difficulties. By 1970, when the National Railroad Passenger Corporation (Amtrak) was created under the Rail Passenger Services Act, it was clear that the TurboTrain was not as successful as hoped. In September 1976, after several incidents in which the trains caught fire, the TurboTrain was taken out of service.
11 U.S. GAO, Problems in the Northeast Corridor Railway Improvement Project, Report by the Comptroller General of the United States, CED-79-38 (Washington, DC: USGAO, 1979), p. 3. 12 Anthony Perl, New Departures: Rethinking Rail Passenger Policy in the Twenty-first Century (Lexington: University Pres of Kentucky, 2002), p. 141. 13 Ibid., p. 142; Southeast High-speed Rail Corridor (SHSRC), “A Time to Act” (1999), http://www.sehsr.org/reports/time2act/time2act.html (accessed 11/27/06). 14 U.S. Department of Transportation (USDOT), Two-Year Report on the Northeast Corridor (Washington, DC: USDOT, 1978), p. 2. 15 Ibid, p. 6.
THE FUTURE OF TRANSPORTATION IN THE NORTHEAST CORRIDOR, 2007–2025: RAIL TRANSPORTATION
Anticipating 2025 in Northeast Corridor Transportation: Aerial, Highway, Marine, and Rail Technologies & Linkages 66
The Northeast Corridor Improvement Project (NECIP), Phase 1 High-speed rail on the NEC was given a critical boost at the federal level in 1976 when Congress passed the Railroad Revitalization and Regulatory Reform Act (4R Act), launching what would become the largest federal investment in intercity rail in the 20th Century. In addition to designating Amtrak as the primary owner of the NEC, the Act authorized the Northeast Corridor Improvement Project (NECIP) which included $1.75 billion for improvements between Washington, DC and Boston.16 The primary objective was to have, by 1981, “the establishment of regularly scheduled and dependable” intercity rail passenger service of 3 hours 40 minutes between Boston and New York, and of 2 hours 40 minutes between New York and Washington, DC, including intermediate stops.17 From the beginning, however, these trip times were a representation of political expediency, rather than being based on an objective analysis of what would make high-speed intercity rail competitive with air and automobile along the corridor. Indeed, to truly reach speeds that would make rail in the NEC competitive with alternative modes, almost double the figure provided in the NECIP ($3.5 billion) would have been needed at the time.18 Even as the NECIP represented a tremendous boost for rail in the corridor, the unwillingness to invest what was truly necessary to meet the desired goals was reminiscent of the discussions and debates between the Congress and Administration today. Indeed, throughout the next decade even as work progressed, constant revisions were made in scope and budget, and elements were shuffled or lost. This is not to negate the tremendous amount of progress that was made on the line. The trip time goals between Washington, DC and New York City were realized during this period and travel times between Boston and New York improved greatly. Nevertheless, the NECIP failed to meet the trip time goals on the north-end and, more importantly, the electrification of the north-end was dropped, in large part because of costs.19 Again, the result was that even with the improvements, rail was still not well positioned to offer a strong alternative to rail or automobile travel. The NECIP, Phase 2 – Electrification of the North-end Electrification of the north-end of the NEC was revisited when the Coalition of Northeastern Governors (CONEG) released a study on HSR feasibility between New York City and Boston in October 1990. The report concluded that:
• Three-hour travel by rail between New York City and Boston could be attained in the near-term through a program with public-private funding;
• Diversion of trips from air and roads to rail would help reduce fuel consumption and air pollution; and,
• A high-speed rail project would generate new regional activity throughout the Northeast and the rest of the United States, with many new jobs and increased productivity.20
16 USDOT, Federal Railroad Administration (FRA), Northeast Corridor Improvement Project: Final Programmatic Environmental Impact Statement, volume 1, FRA-RNC-EIS-77-01-F (Washington, DC: USDOT, 1978), p. ES-1. 17 Ibid., p. 1-3. 18 C. de Cerreño and Mathur, High-Speed Rail Projects in the United States, pp. 98-101. 19 Ibid., pp. 108-109 20 Parsons Brinckerhoff Quade & Douglas, Inc., Cambridge Systematics, Inc., Regional Science Research Institute, CONEG High-speed Rail Regional Benefits Study: Summary Report, Prepared for the Coalition of Northeast Governors High-speed Rail Task Force (1990), p. ES-2.
THE FUTURE OF TRANSPORTATION IN THE NORTHEAST CORRIDOR, 2007–2025: RAIL TRANSPORTATION
Anticipating 2025 in Northeast Corridor Transportation: Aerial, Highway, Marine, and Rail Technologies & Linkages 67
On the heels of the report, Senator Frank Lautenberg (D, NJ 1982-2000/2002-) played a critical role in renewing funding for the NEC by placing $100 million in the FY 1991 appropriations bill. Efforts were refocused on increasing speeds and decreasing north-end trip times. In FY 1991, Congress appropriated $25 million for engineering associated with electrification of the north-end between New Haven, CT and Boston.21 This was followed, in October 1992, by passage of the Amtrak Authorization and Development Act which amended the 4R Act of 1976 to include a new section, stipulating that the Secretary of Transportation submit a program master plan for the establishment of “regularly scheduled, safe, and dependable” service between New York and Boston of three hours or less, including intermediate stops. The Act also authorized $470 million during FY 1993 and FY 1994 for the NECIP.22 The Draft Environmental Impact Statement/Report (DEIS/R) for the New Haven–Boston project was released in fall 1993, with roughly two-thirds of the system design already complete.23 Concerns were soon voiced, ranging from whether the full implications of the new service on freight rail had been taken into account, to whether the electrification system would pose a health hazard to residents along the route, to how to ensure that the moveable bridges in the New England region remained open a sufficient amount of time for marine traffic.24 On this last point, Amtrak eventually agreed to a cap on the number of passenger trains along the Corridor, and committed to a change in policy that would allow the default position of the bridges to be “open for marine traffic” rather than “closed for rail” as is the case elsewhere around the country. The result has been a severe and ongoing constraint on capacity on the north-end. In July 1994, Secretary of Transportation Federico Peña issued The Northeast Corridor Transportation Plan: New York City to Boston which included goals for the electrification and trip times, and identified capacity improvements and recapitalization projects to bring the line up to a state of good repair. FRA estimated that the trip time goals could be achieved by 1999 with an estimated cost of $1.255 billion in FY 1993 dollars.25 An additional $606 million would be needed for capacity improvements to ensure efficient operation and growth of freight and commuter services on the line. Finally, funds of roughly $1.2 billion would be needed for recapitalization related to the north-end. The total for these three components was $3.1 billion (in 1993 $).26 Amtrak would manage the program, with responsibility for implementation shared by Amtrak, the commuter railroads, freight railroads, and state governments.27 Expected completion for the
21 USDOT, FRA, Northeast Corridor Improvement Project Electrification New Haven, CT to Boston, MA: Scoping Document, DOT-FRA-RDV-92-01 (Washington, DC: FRA, 1992), p. 3. 22 Pub. L. 102-533. 23 USDOT, FRA, Draft Environmental Impact Statement/Report, Volume 1: Northeast Corridor Improvement Project Electrification – New Haven, CT to Boston, MA, DOT/FRA/RDV-93/01-A (Washington, DC: FRA, 1993). 24 USDOT, FRA, Draft Environmental Impact Statement/Report, Volume 2: Technical Studies, Northeast Corridor Improvement Project Electrification – New Haven, CT to Boston, MA, DOT/FRA/RDV-93/01-B (Washington, DC: FRA, 1993); USDOT, FRA, Final Environmental Impact Statement/Report, Volume 3: Response to Comments on Draft Environmental Impact Statement/Report, Northeast Corridor Improvement Project Electrification – New Haven, CT to Boston, MA, DOT/FRA/RDV-94/01-C (Washington, DC, FRA, 1994). 25 USDOT, FRA, The Northeast Corridor Transportation Plan: New York City to Boston, Report to Congress–Volume 1 (Washington, DC: USDOT, 1994), p. 1-5. 26 U.S. GAO, Intercity Passenger Rail: Amtrak’s Management of Northeast Corridor Improvements Demonstrates Need for Applying Best Practices, Report to the Chairman, Committee on Commerce, Science and Transportation, U.S. Senate. GAO-04-94 (Washington, DC: GAO, 1994), p. 13. 27 Ibid., p. 3.
THE FUTURE OF TRANSPORTATION IN THE NORTHEAST CORRIDOR, 2007–2025: RAIL TRANSPORTATION
Anticipating 2025 in Northeast Corridor Transportation: Aerial, Highway, Marine, and Rail Technologies & Linkages 68
entire program was forecast for 2010, with electrified operations between New Haven and Boston beginning in 1997 and 3-hour service between New York and Boston beginning in 1999. Limited HSR service was introduced between New York City and Boston by Amtrak in January 2000. By March 2003, $3.2 billion had been spent by Amtrak ($2.6 billion) and the other stakeholders ($625 million) on the north-end of the NEC. 28 However, as with the earlier phase of the NECIP, not all the projects identified had been completed, and the trip time goals remained elusive. Specifically, Amtrak had failed again to meet the goal of 3-hour service between New York City and Boston. Current Challenges Rail in the NEC currently faces three key sets of interrelated and critical challenges. How these challenges are addressed in the coming years will spell the difference between whether rail, particularly high-speed intercity rail, is strengthened in the corridor or whether it will continue to be plagued by inefficiencies. Institutional Challenges Perhaps the most obvious and long-lasting challenge to implementation of a coherent and rational rail strategy on the NEC is the multitude of stakeholders involved. First and foremost are the multiple owners and operators, each with its own priorities and perceptions about who should bear the cost of maintaining the line and ensuring adequate levels of service for high-speed intercity rail, commuter rail, and freight rail. The tension between the goals of the commuter rail lines, the freight operators, and Amtrak has been evident historically and remains today, particularly given that while some improvements benefit all interests, many are only beneficial to one or another. (See Figure 3 for an illustration of this point). Adding to the complexity involving institutional arrangements, the NEC is caught up in the larger national debate regarding Amtrak and the future of intercity rail more broadly. While the Northeast legislators feel strongly about the need for maintaining and enhancing rail on the corridor, many from other parts of the country chafe at the funding directed to the NEC. In recent years, a more specific set of discussions have cropped up regarding whether a new business model is needed. In particular, there have been calls for the NEC to follow the examples of its European intercity counterparts with respect to separation of rail infrastructure and operations. The Amtrak Reform Council, an independent federal commission that had been established to review Amtrak’s performance, submitted a recommended plan of action for Amtrak in early 2002. Calling for a new business model and more competition, the plan recommended dividing oversight, operations, and infrastructure responsibilities among three entities.29 This call has been more recently rekindled by the Alan M. Voorhees Transportation Center at Rutgers University, which suggests that USDOT should assume ownership of the line and then create a public benefit corporation that would contract with Amtrak for intercity rail service.30 28 Ibid., p. 20. 29 Amtrak Reform Council, “Today, the Amtrak Reform Council Releases its Action Plan for the Restructuring and Rationalization of the National Railroad Passenger System,” Press Release (February 7, 2002), p. 1. 30 Alan M. Voorhees Transportation Center and Hamilton, Rabinovitz & Alschuler, Inc., Northeast Corridor Action Plan: A Call for a New Federal-State Partnership (November 2006), p. 3.
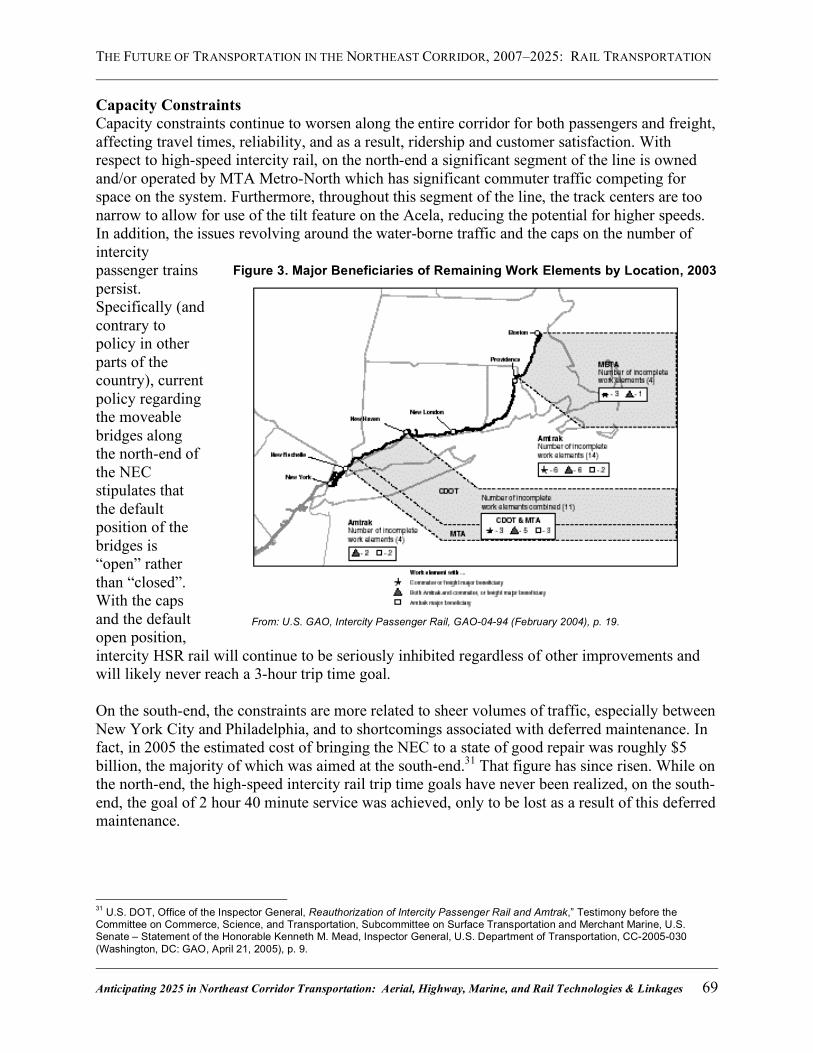
THE FUTURE OF TRANSPORTATION IN THE NORTHEAST CORRIDOR, 2007–2025: RAIL TRANSPORTATION
Anticipating 2025 in Northeast Corridor Transportation: Aerial, Highway, Marine, and Rail Technologies & Linkages 69
Capacity Constraints Capacity constraints continue to worsen along the entire corridor for both passengers and freight, affecting travel times, reliability, and as a result, ridership and customer satisfaction. With respect to high-speed intercity rail, on the north-end a significant segment of the line is owned and/or operated by MTA Metro-North which has significant commuter traffic competing for space on the system. Furthermore, throughout this segment of the line, the track centers are too narrow to allow for use of the tilt feature on the Acela, reducing the potential for higher speeds. In addition, the issues revolving around the water-borne traffic and the caps on the number of intercity passenger trains persist. Specifically (and contrary to policy in other parts of the country), current policy regarding the moveable bridges along the north-end of the NEC stipulates that the default position of the bridges is “open” rather than “closed”. With the caps and the default open position, intercity HSR rail will continue to be seriously inhibited regardless of other improvements and will likely never reach a 3-hour trip time goal. On the south-end, the constraints are more related to sheer volumes of traffic, especially between New York City and Philadelphia, and to shortcomings associated with deferred maintenance. In fact, in 2005 the estimated cost of bringing the NEC to a state of good repair was roughly $5 billion, the majority of which was aimed at the south-end.31 That figure has since risen. While on the north-end, the high-speed intercity rail trip time goals have never been realized, on the south-end, the goal of 2 hour 40 minute service was achieved, only to be lost as a result of this deferred maintenance.
31 U.S. DOT, Office of the Inspector General, Reauthorization of Intercity Passenger Rail and Amtrak,” Testimony before the Committee on Commerce, Science, and Transportation, Subcommittee on Surface Transportation and Merchant Marine, U.S. Senate – Statement of the Honorable Kenneth M. Mead, Inspector General, U.S. Department of Transportation, CC-2005-030 (Washington, DC: GAO, April 21, 2005), p. 9.
Figure 3. Major Beneficiaries of Remaining Work Elements by Location, 2003
From: U.S. GAO, Intercity Passenger Rail, GAO-04-94 (February 2004), p. 19.
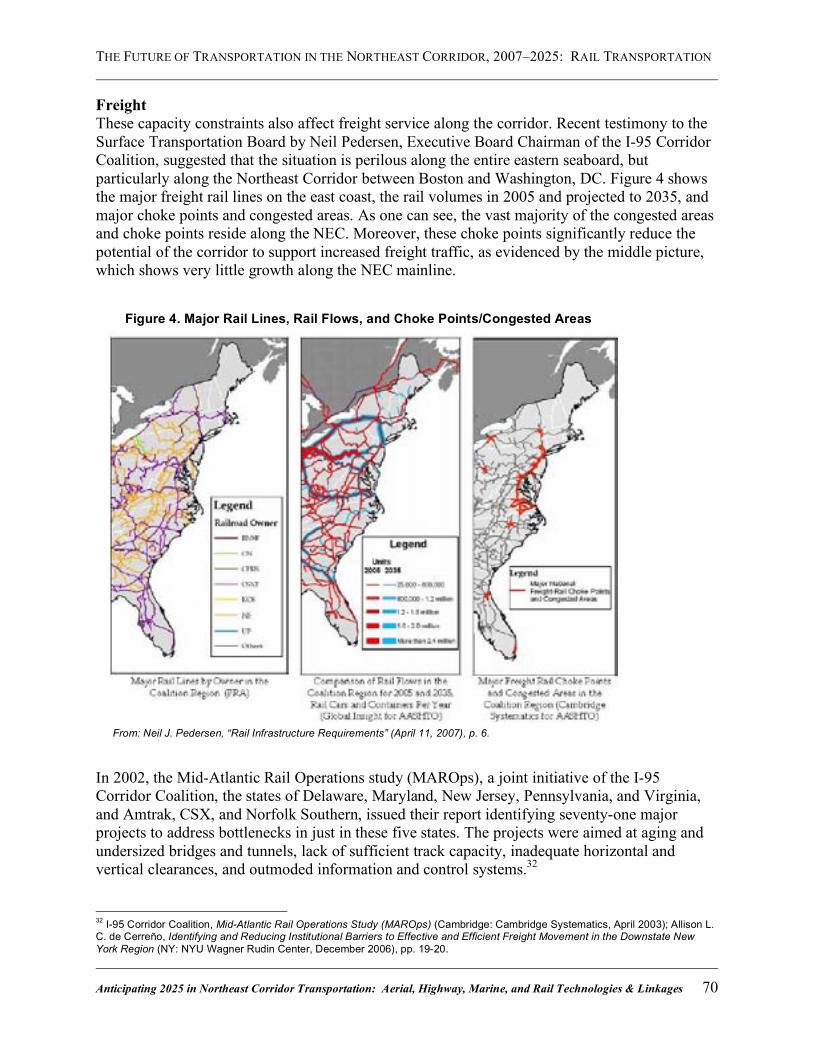
THE FUTURE OF TRANSPORTATION IN THE NORTHEAST CORRIDOR, 2007–2025: RAIL TRANSPORTATION
Anticipating 2025 in Northeast Corridor Transportation: Aerial, Highway, Marine, and Rail Technologies & Linkages 70
Freight These capacity constraints also affect freight service along the corridor. Recent testimony to the Surface Transportation Board by Neil Pedersen, Executive Board Chairman of the I-95 Corridor Coalition, suggested that the situation is perilous along the entire eastern seaboard, but particularly along the Northeast Corridor between Boston and Washington, DC. Figure 4 shows the major freight rail lines on the east coast, the rail volumes in 2005 and projected to 2035, and major choke points and congested areas. As one can see, the vast majority of the congested areas and choke points reside along the NEC. Moreover, these choke points significantly reduce the potential of the corridor to support increased freight traffic, as evidenced by the middle picture, which shows very little growth along the NEC mainline.
In 2002, the Mid-Atlantic Rail Operations study (MAROps), a joint initiative of the I-95 Corridor Coalition, the states of Delaware, Maryland, New Jersey, Pennsylvania, and Virginia, and Amtrak, CSX, and Norfolk Southern, issued their report identifying seventy-one major projects to address bottlenecks in just in these five states. The projects were aimed at aging and undersized bridges and tunnels, lack of sufficient track capacity, inadequate horizontal and vertical clearances, and outmoded information and control systems.32 32 I-95 Corridor Coalition, Mid-Atlantic Rail Operations Study (MAROps) (Cambridge: Cambridge Systematics, April 2003); Allison L. C. de Cerreño, Identifying and Reducing Institutional Barriers to Effective and Efficient Freight Movement in the Downstate New York Region (NY: NYU Wagner Rudin Center, December 2006), pp. 19-20.
Figure 4. Major Rail Lines, Rail Flows, and Choke Points/Congested Areas
From: Neil J. Pedersen, “Rail Infrastructure Requirements” (April 11, 2007), p. 6.
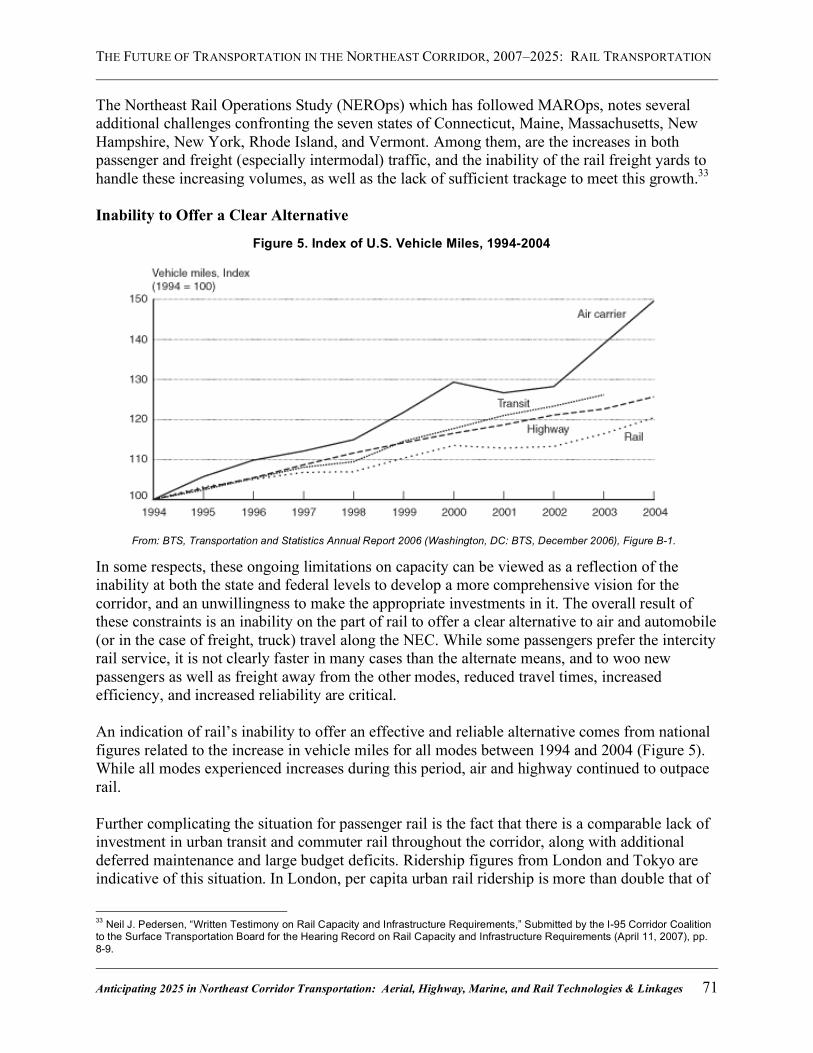
THE FUTURE OF TRANSPORTATION IN THE NORTHEAST CORRIDOR, 2007–2025: RAIL TRANSPORTATION
Anticipating 2025 in Northeast Corridor Transportation: Aerial, Highway, Marine, and Rail Technologies & Linkages 71
The Northeast Rail Operations Study (NEROps) which has followed MAROps, notes several additional challenges confronting the seven states of Connecticut, Maine, Massachusetts, New Hampshire, New York, Rhode Island, and Vermont. Among them, are the increases in both passenger and freight (especially intermodal) traffic, and the inability of the rail freight yards to handle these increasing volumes, as well as the lack of sufficient trackage to meet this growth.33 Inability to Offer a Clear Alternative
In some respects, these ongoing limitations on capacity can be viewed as a reflection of the inability at both the state and federal levels to develop a more comprehensive vision for the corridor, and an unwillingness to make the appropriate investments in it. The overall result of these constraints is an inability on the part of rail to offer a clear alternative to air and automobile (or in the case of freight, truck) travel along the NEC. While some passengers prefer the intercity rail service, it is not clearly faster in many cases than the alternate means, and to woo new passengers as well as freight away from the other modes, reduced travel times, increased efficiency, and increased reliability are critical. An indication of rail’s inability to offer an effective and reliable alternative comes from national figures related to the increase in vehicle miles for all modes between 1994 and 2004 (Figure 5). While all modes experienced increases during this period, air and highway continued to outpace rail. Further complicating the situation for passenger rail is the fact that there is a comparable lack of investment in urban transit and commuter rail throughout the corridor, along with additional deferred maintenance and large budget deficits. Ridership figures from London and Tokyo are indicative of this situation. In London, per capita urban rail ridership is more than double that of
33 Neil J. Pedersen, “Written Testimony on Rail Capacity and Infrastructure Requirements,” Submitted by the I-95 Corridor Coalition to the Surface Transportation Board for the Hearing Record on Rail Capacity and Infrastructure Requirements (April 11, 2007), pp. 8-9.
From: BTS, Transportation and Statistics Annual Report 2006 (Washington, DC: BTS, December 2006), Figure B-1.
Figure 5. Index of U.S. Vehicle Miles, 1994-2004
THE FUTURE OF TRANSPORTATION IN THE NORTHEAST CORRIDOR, 2007–2025: RAIL TRANSPORTATION
Anticipating 2025 in Northeast Corridor Transportation: Aerial, Highway, Marine, and Rail Technologies & Linkages 72
Philadelphia, Boston, or Washington, DC – all key urban centers along the NEC.34 While Tokyo has double the population of New York City, ridership levels are three times higher than in New York City.35 Similarly, links are often missing between ports and key rail lines along the corridor so trucks are still needed for freight connections. Thus, the overall picture for the corridor is of an inadequate rail network at all levels, both for passengers and freight. Such inadequacies not only reduce efficiency and reliability, but also result in lack of key connectivity between different services, again making it more difficult to justify rail transportation when compared to air or highway. New Opportunities Along with the current challenges are new opportunities that can help shape and define the future of rail in the corridor. Technologies Technology is often pointed to as one means for enhancing operations in transportation, mitigating congestion, and addressing a myriad of other issues. Indeed, there are a number of technologies, broadly grouped as intelligent railroad systems, that could help transform rail on the Northeast Corridor. Among them are, for example, digital data communications, track sensors, emergency notification systems, crew alertness monitoring systems, Positive Train Control (PTC), differential global positioning systems (DGPS), electronically-controlled pneumatic (ECP) braking systems, automatic equipment identification, and intelligent grade crossings.36 Together, such technologies can increase safety and security, enhance capacity and asset utilization, reduce energy consumption and resulting emissions, and increase profitability and customer satisfaction.37 For example, while current train air braking systems are applied sequentially along the length of a train, ECP braking systems allow simultaneous braking of all cars. The result is a substantial reduction in braking distance and time, which allows for faster trains with less space in between them. By increasing effective capacity while ensuring safety and security, ECP braking systems and other intelligent railroad systems could help to increase both passenger and freight rail service along the NEC. Nevertheless, while new technological systems might aid to some degree with respect to rail operations on the NEC, in an important sense, technologies are not the limiting factor for rail on the NEC. Nowhere is this clearer than in intercity rail operations where high-speed technologies have been available for decades, and have been deployed successfully in many parts of the world, but only to a very limited extent on the Northeast Corridor, and nowhere else in the United States. Japan’s Shinkansen was first deployed in 1964, at the same time as the United States was pursuing the Metroliner and TurboTrain on the NEC. Over three decades later, the NEC is still 34 University of Pennsylvania, Reinventing Megalopolis, p. 13. 35 Ibid. 36 Steven R. Ditmeyer, “Network-Centric Railroading Utilizing Intelligent Railroad Systems,” Presented at the World Bank Transport Forum 2006 (May 31, 2006), http://www.worldbank.org/transport/learning/tf2006/railways%20day/presentations/ditmeyer2.ppt#1 (accessed 6/4/07); Ditmeyer, “Network-Centric Railroading Utilizing Intelligent Railroad Systems,” Presented at the 10th International Command and Control Research and Technology Symposium (June 13-16, 2006). 37 Ibid.
THE FUTURE OF TRANSPORTATION IN THE NORTHEAST CORRIDOR, 2007–2025: RAIL TRANSPORTATION
Anticipating 2025 in Northeast Corridor Transportation: Aerial, Highway, Marine, and Rail Technologies & Linkages 73
dysfunctional, while Japan is already moving toward a third-generation model that will be even faster than the current 186 mph. Throughout Europe and Asia there are multiple examples of high-speed intercity rail, using several different technologies. France’s TGV (Train à Grand Vitesse – now sometimes called the Automotrice à Grand Vitesse), Germany’s ICE (Intercity Express), and Taiwan’s THSR (Taiwan High Speed Rail) all run at comparable speeds. Italy’s Treno Alto Velócita (TAV) also cruises at 186 mph but can also run on regular rail lines at 155 mph – still higher than on the NEC. More recently, Spain (Alta Velocidad Española – AVE) and Korea (KTX) have deployed and continue to expand their intercity high-speed rail lines. And, of course there is Shanghai’s Maglev. Thus, high-speed technologies are readily available as are information systems and a variety of other technologies that could help improve rail operations on the NEC. Steven Ditmeyer echoes this, suggesting that many of the technologies integral to intelligent railroad systems are already being used or tested on highways, in air traffic control, for maritime vessel tracking, parcel delivery services, emergency response systems, and for military command and control applications.38 Yet, their applications and deployment to the rail industry, both passenger and freight, still lag behind. Indeed, as with the high-speed technologies, PTC has been piloted for over a decade, but has still not been widely deployed in the United States. Thus, while technological advances may help to some degree, on its own technology is unlikely to generate a new future for rail in the corridor by 2025. The more difficult and yet more central issue is the willingness to invest in these technologies and implement them. With that said, however, there are several other areas of opportunity that might aid in providing the political will, and resulting financial support, to do just that. Congestion Rail offers one means for alleviating congestion on the increasingly crowded highways and airways throughout the northeast. Along the entire Northeast Corridor, roadways are clogged with both passenger and freight traffic. According to the Texas Transportation Institute, in 2005, travelers on the roadways along the NEC experienced over 867 million hours of travel delay, for a total cost of over $14.6 billion.39 As overall travel increases, so does freight transport on the corridor’s major highways. Figure 6 provides a pictorial of the overall system of major highways, the truck flow volumes along them (current and projected), and the key bottlenecks. As can be seen, the bottlenecks run along the entire corridor and serious delays occur in every major metropolitan area along the route.
38 Ibid. 39 David Schrank and Tim Lomax, The 2005 Urban Mobility Report (College Station, TX: TTI, May 2005), Table 2.

THE FUTURE OF TRANSPORTATION IN THE NORTHEAST CORRIDOR, 2007–2025: RAIL TRANSPORTATION
Anticipating 2025 in Northeast Corridor Transportation: Aerial, Highway, Marine, and Rail Technologies & Linkages 74
Airspace along the corridor is also becoming increasingly congested. According to the most recent Terminal Area Forecast Summary released from the Federal Aviation Administration (FAA), the projected growth in enplanements by 2025 for the largest five airports along the corridor ranges from 62.8% (General Edward Lawrence Logan International, Boston, MA) to over 128% (Washington Dulles International, Washington, DC). By 2025, enplanements at John F. Kennedy International (New York City, NY), Newark Liberty International (Newark, NJ), and Philadelphia International (Philadelphia, PA), are expected to increase by 91.6%, 88.5%, and 96.3%, respectively.40 With these forecasts in mind, the FAA has suggested that even if all current planned improvements are made at John F. Kennedy International, Newark Liberty International, and Philadelphia International airports, each of them will still need more capacity by 2025. Logan and Dulles airports will be able to meet passenger travel needs by 2025, but only if current planned improvements are all made.41 Enplanements are only a part of the picture as they measure only passenger travel. While freight data is more difficult to assess, air cargo is also growing, albeit at a more modest rate compared 40 U.S. DOT, Federal Aviation Administration (FAA), Terminal Area Forecast Summary: Fiscal Years 2006-2025, FAA-APO-07-1 (Washington, DC: FAA, March 2007), p. 9. 41 U.S. DOT, FAA, Capacity Needs in the National Airspace System, 2007-2025: An Analysis of Airports and Metropolitan Area Demand and Operational Capacity in the Future (FACT 2) (Washington, DC: FAA, May 2007), pp. 17-19.
From: Neil J. Pedersen, “Rail Infrastructure Requirements” (April 11, 2007), p. 4.
Figure 6. Major Highways, Truck Flows, and Bottlenecks on the East Coast
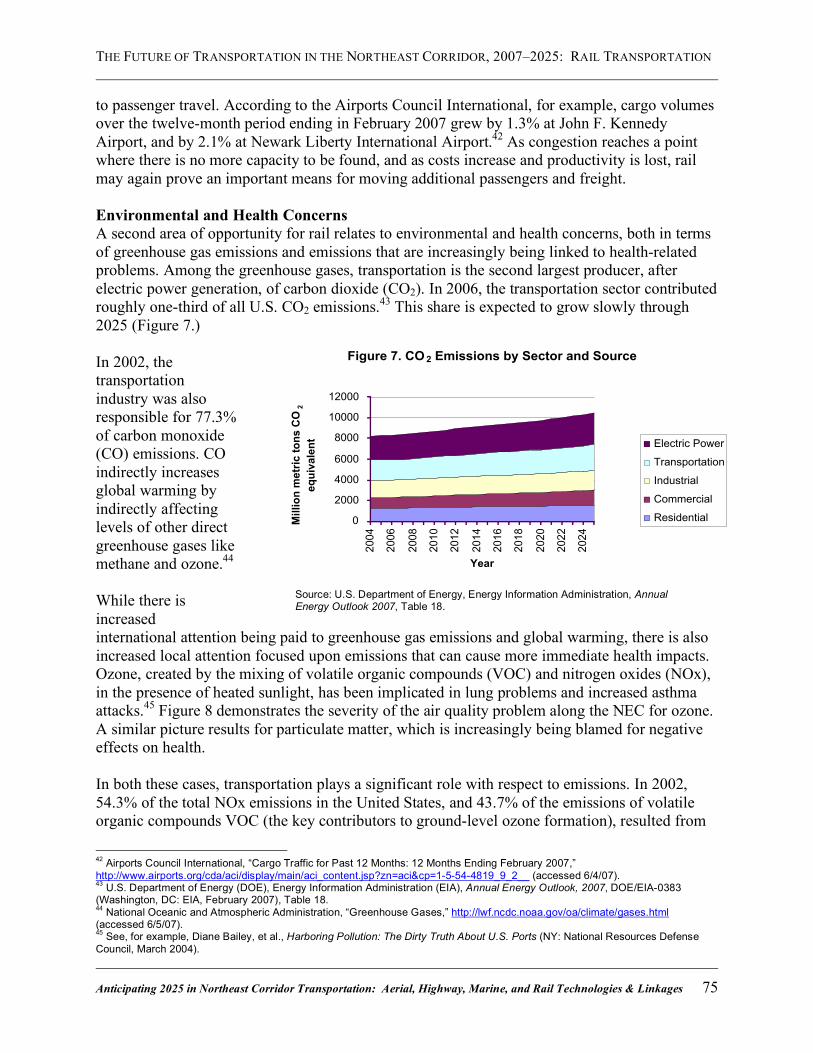
THE FUTURE OF TRANSPORTATION IN THE NORTHEAST CORRIDOR, 2007–2025: RAIL TRANSPORTATION
Anticipating 2025 in Northeast Corridor Transportation: Aerial, Highway, Marine, and Rail Technologies & Linkages 75
Figure 7. CO 2 Emissions by Sector and Source
0
2000
4000
6000
8000
10000
12000
20
04
20
06
20
08
20
10
20
12
20
14
20
16
20
18
20
20
20
22
20
24
Year
Mil
lio
n m
etr
ic t
on
s C
O2
eq
uiv
ale
nt Electric Power
Transportation
Industrial
Commercial
Residential
Source: U.S. Department of Energy, Energy Information Administration, Annual Energy Outlook 2007, Table 18.
to passenger travel. According to the Airports Council International, for example, cargo volumes over the twelve-month period ending in February 2007 grew by 1.3% at John F. Kennedy Airport, and by 2.1% at Newark Liberty International Airport.42 As congestion reaches a point where there is no more capacity to be found, and as costs increase and productivity is lost, rail may again prove an important means for moving additional passengers and freight. Environmental and Health Concerns A second area of opportunity for rail relates to environmental and health concerns, both in terms of greenhouse gas emissions and emissions that are increasingly being linked to health-related problems. Among the greenhouse gases, transportation is the second largest producer, after electric power generation, of carbon dioxide (CO2). In 2006, the transportation sector contributed roughly one-third of all U.S. CO2 emissions.43 This share is expected to grow slowly through 2025 (Figure 7.) In 2002, the transportation industry was also responsible for 77.3% of carbon monoxide (CO) emissions. CO indirectly increases global warming by indirectly affecting levels of other direct greenhouse gases like methane and ozone.44 While there is increased international attention being paid to greenhouse gas emissions and global warming, there is also increased local attention focused upon emissions that can cause more immediate health impacts. Ozone, created by the mixing of volatile organic compounds (VOC) and nitrogen oxides (NOx), in the presence of heated sunlight, has been implicated in lung problems and increased asthma attacks.45 Figure 8 demonstrates the severity of the air quality problem along the NEC for ozone. A similar picture results for particulate matter, which is increasingly being blamed for negative effects on health. In both these cases, transportation plays a significant role with respect to emissions. In 2002, 54.3% of the total NOx emissions in the United States, and 43.7% of the emissions of volatile organic compounds VOC (the key contributors to ground-level ozone formation), resulted from
42 Airports Council International, “Cargo Traffic for Past 12 Months: 12 Months Ending February 2007,” http://www.airports.org/cda/aci/display/main/aci_content.jsp?zn=aci&cp=1-5-54-4819_9_2__ (accessed 6/4/07). 43 U.S. Department of Energy (DOE), Energy Information Administration (EIA), Annual Energy Outlook, 2007, DOE/EIA-0383 (Washington, DC: EIA, February 2007), Table 18. 44 National Oceanic and Atmospheric Administration, “Greenhouse Gases,” http://lwf.ncdc.noaa.gov/oa/climate/gases.html (accessed 6/5/07). 45 See, for example, Diane Bailey, et al., Harboring Pollution: The Dirty Truth About U.S. Ports (NY: National Resources Defense Council, March 2004).
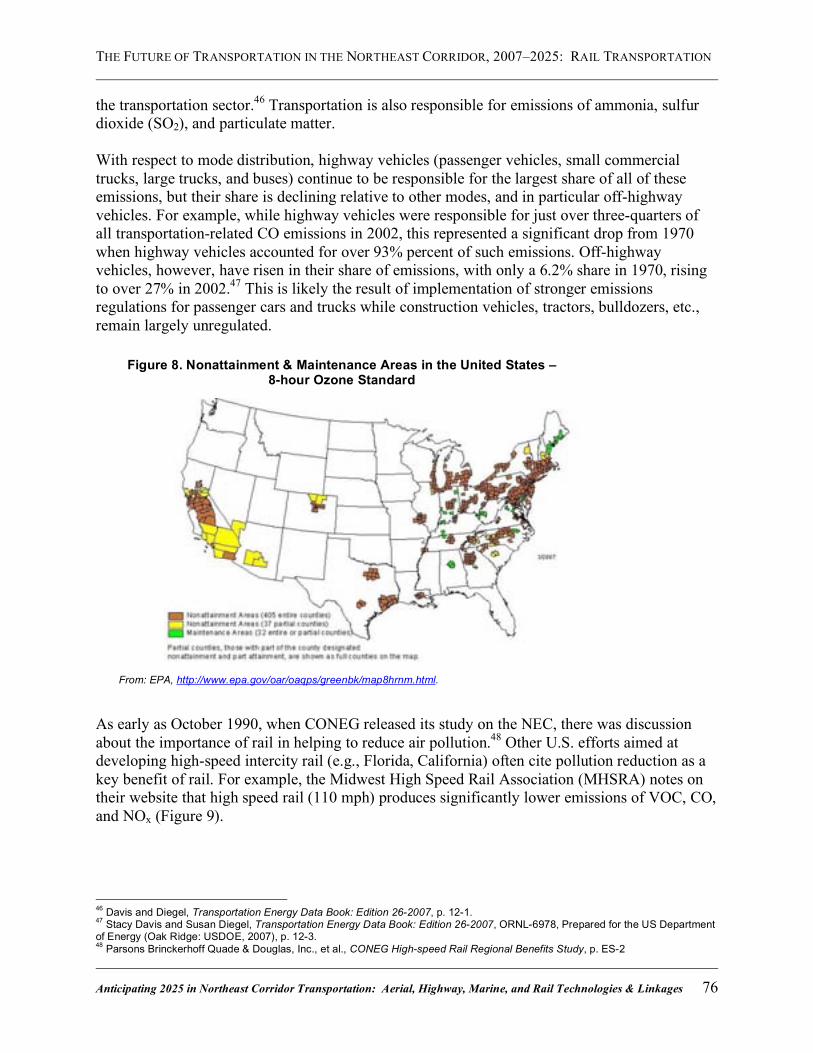
THE FUTURE OF TRANSPORTATION IN THE NORTHEAST CORRIDOR, 2007–2025: RAIL TRANSPORTATION
Anticipating 2025 in Northeast Corridor Transportation: Aerial, Highway, Marine, and Rail Technologies & Linkages 76
the transportation sector.46 Transportation is also responsible for emissions of ammonia, sulfur dioxide (SO2), and particulate matter. With respect to mode distribution, highway vehicles (passenger vehicles, small commercial trucks, large trucks, and buses) continue to be responsible for the largest share of all of these emissions, but their share is declining relative to other modes, and in particular off-highway vehicles. For example, while highway vehicles were responsible for just over three-quarters of all transportation-related CO emissions in 2002, this represented a significant drop from 1970 when highway vehicles accounted for over 93% percent of such emissions. Off-highway vehicles, however, have risen in their share of emissions, with only a 6.2% share in 1970, rising to over 27% in 2002.47 This is likely the result of implementation of stronger emissions regulations for passenger cars and trucks while construction vehicles, tractors, bulldozers, etc., remain largely unregulated.
As early as October 1990, when CONEG released its study on the NEC, there was discussion about the importance of rail in helping to reduce air pollution.48 Other U.S. efforts aimed at developing high-speed intercity rail (e.g., Florida, California) often cite pollution reduction as a key benefit of rail. For example, the Midwest High Speed Rail Association (MHSRA) notes on their website that high speed rail (110 mph) produces significantly lower emissions of VOC, CO, and NOx (Figure 9).
46 Davis and Diegel, Transportation Energy Data Book: Edition 26-2007, p. 12-1. 47 Stacy Davis and Susan Diegel, Transportation Energy Data Book: Edition 26-2007, ORNL-6978, Prepared for the US Department of Energy (Oak Ridge: USDOE, 2007), p. 12-3. 48 Parsons Brinckerhoff Quade & Douglas, Inc., et al., CONEG High-speed Rail Regional Benefits Study, p. ES-2
Figure 8. Nonattainment & Maintenance Areas in the United States – 8-hour Ozone Standard
From: EPA, http://www.epa.gov/oar/oaqps/greenbk/map8hrnm.html.
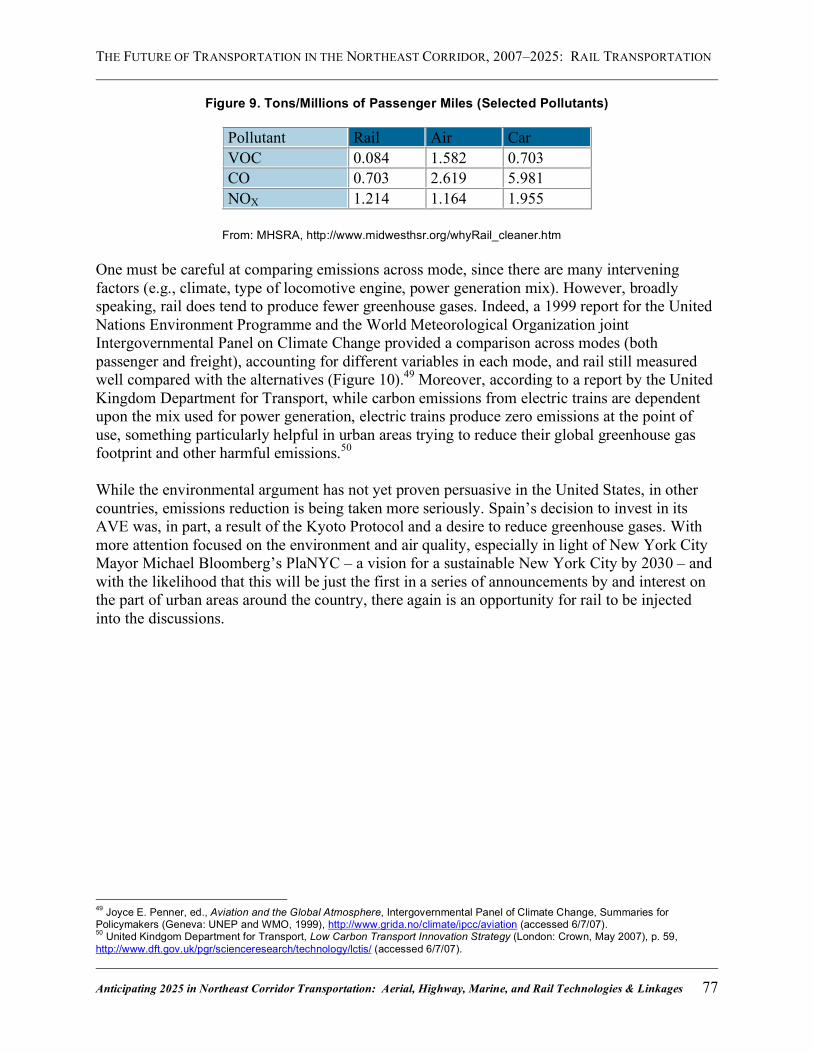
THE FUTURE OF TRANSPORTATION IN THE NORTHEAST CORRIDOR, 2007–2025: RAIL TRANSPORTATION
Anticipating 2025 in Northeast Corridor Transportation: Aerial, Highway, Marine, and Rail Technologies & Linkages 77
Figure 9. Tons/Millions of Passenger Miles (Selected Pollutants)
Pollutant Rail Air Car VOC 0.084 1.582 0.703 CO 0.703 2.619 5.981 NOX 1.214 1.164 1.955 From: MHSRA, http://www.midwesthsr.org/whyRail_cleaner.htm
One must be careful at comparing emissions across mode, since there are many intervening factors (e.g., climate, type of locomotive engine, power generation mix). However, broadly speaking, rail does tend to produce fewer greenhouse gases. Indeed, a 1999 report for the United Nations Environment Programme and the World Meteorological Organization joint Intergovernmental Panel on Climate Change provided a comparison across modes (both passenger and freight), accounting for different variables in each mode, and rail still measured well compared with the alternatives (Figure 10).49 Moreover, according to a report by the United Kingdom Department for Transport, while carbon emissions from electric trains are dependent upon the mix used for power generation, electric trains produce zero emissions at the point of use, something particularly helpful in urban areas trying to reduce their global greenhouse gas footprint and other harmful emissions.50 While the environmental argument has not yet proven persuasive in the United States, in other countries, emissions reduction is being taken more seriously. Spain’s decision to invest in its AVE was, in part, a result of the Kyoto Protocol and a desire to reduce greenhouse gases. With more attention focused on the environment and air quality, especially in light of New York City Mayor Michael Bloomberg’s PlaNYC – a vision for a sustainable New York City by 2030 – and with the likelihood that this will be just the first in a series of announcements by and interest on the part of urban areas around the country, there again is an opportunity for rail to be injected into the discussions.
49 Joyce E. Penner, ed., Aviation and the Global Atmosphere, Intergovernmental Panel of Climate Change, Summaries for Policymakers (Geneva: UNEP and WMO, 1999), http://www.grida.no/climate/ipcc/aviation (accessed 6/7/07). 50 United Kindgom Department for Transport, Low Carbon Transport Innovation Strategy (London: Crown, May 2007), p. 59, http://www.dft.gov.uk/pgr/scienceresearch/technology/lctis/ (accessed 6/7/07).
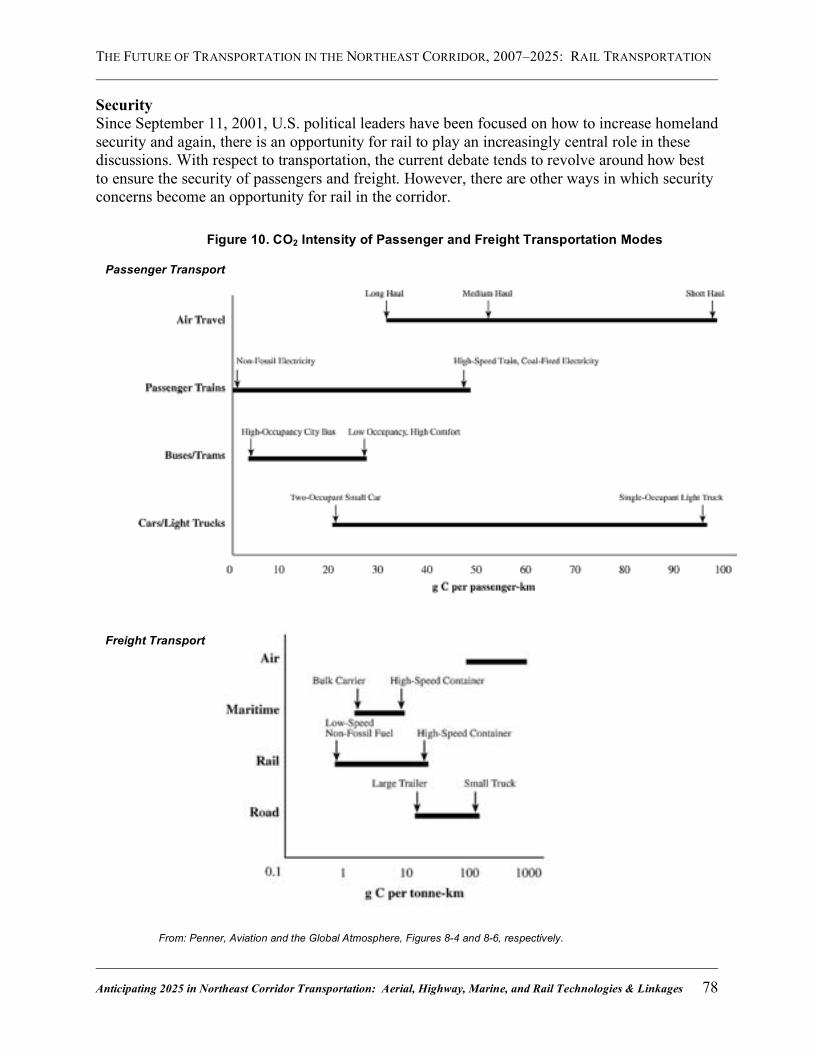
THE FUTURE OF TRANSPORTATION IN THE NORTHEAST CORRIDOR, 2007–2025: RAIL TRANSPORTATION
Anticipating 2025 in Northeast Corridor Transportation: Aerial, Highway, Marine, and Rail Technologies & Linkages 78
Security Since September 11, 2001, U.S. political leaders have been focused on how to increase homeland security and again, there is an opportunity for rail to play an increasingly central role in these discussions. With respect to transportation, the current debate tends to revolve around how best to ensure the security of passengers and freight. However, there are other ways in which security concerns become an opportunity for rail in the corridor.
Figure 10. CO2 Intensity of Passenger and Freight Transportation Modes
From: Penner, Aviation and the Global Atmosphere, Figures 8-4 and 8-6, respectively.
Passenger Transport
Freight Transport
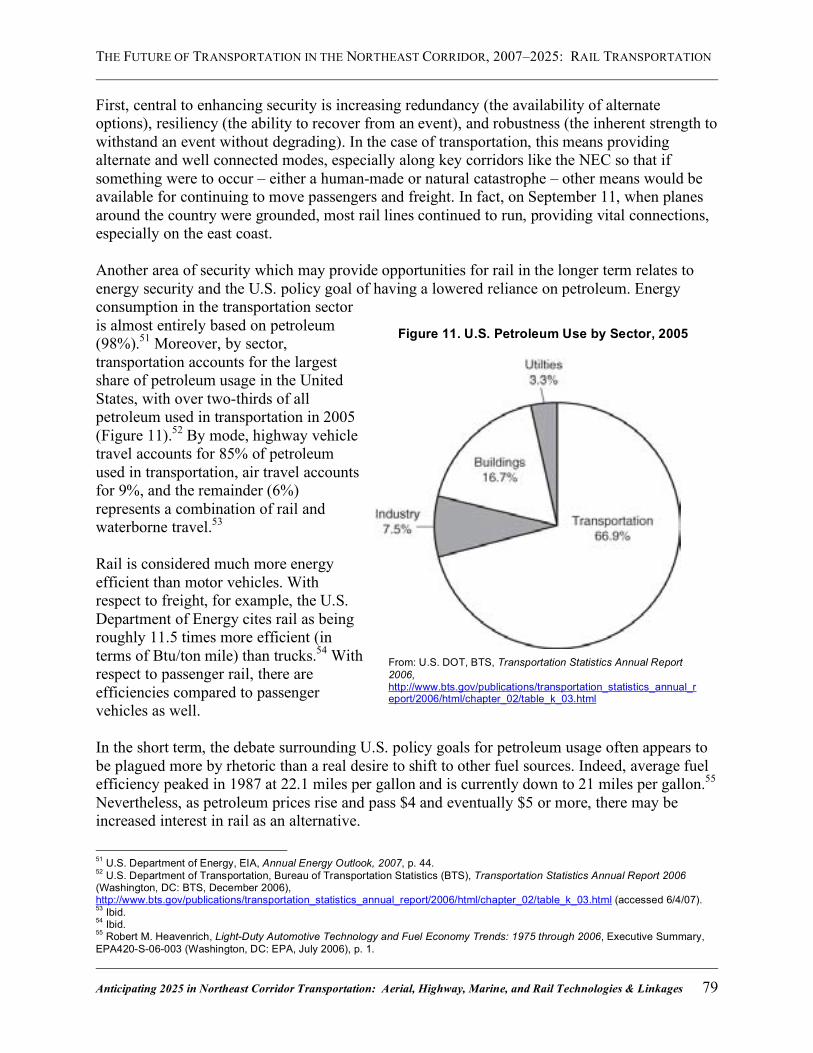
THE FUTURE OF TRANSPORTATION IN THE NORTHEAST CORRIDOR, 2007–2025: RAIL TRANSPORTATION
Anticipating 2025 in Northeast Corridor Transportation: Aerial, Highway, Marine, and Rail Technologies & Linkages 79
First, central to enhancing security is increasing redundancy (the availability of alternate options), resiliency (the ability to recover from an event), and robustness (the inherent strength to withstand an event without degrading). In the case of transportation, this means providing alternate and well connected modes, especially along key corridors like the NEC so that if something were to occur – either a human-made or natural catastrophe – other means would be available for continuing to move passengers and freight. In fact, on September 11, when planes around the country were grounded, most rail lines continued to run, providing vital connections, especially on the east coast. Another area of security which may provide opportunities for rail in the longer term relates to energy security and the U.S. policy goal of having a lowered reliance on petroleum. Energy consumption in the transportation sector is almost entirely based on petroleum (98%).51 Moreover, by sector, transportation accounts for the largest share of petroleum usage in the United States, with over two-thirds of all petroleum used in transportation in 2005 (Figure 11).52 By mode, highway vehicle travel accounts for 85% of petroleum used in transportation, air travel accounts for 9%, and the remainder (6%) represents a combination of rail and waterborne travel.53 Rail is considered much more energy efficient than motor vehicles. With respect to freight, for example, the U.S. Department of Energy cites rail as being roughly 11.5 times more efficient (in terms of Btu/ton mile) than trucks.54 With respect to passenger rail, there are efficiencies compared to passenger vehicles as well. In the short term, the debate surrounding U.S. policy goals for petroleum usage often appears to be plagued more by rhetoric than a real desire to shift to other fuel sources. Indeed, average fuel efficiency peaked in 1987 at 22.1 miles per gallon and is currently down to 21 miles per gallon.55 Nevertheless, as petroleum prices rise and pass $4 and eventually $5 or more, there may be increased interest in rail as an alternative.
51 U.S. Department of Energy, EIA, Annual Energy Outlook, 2007, p. 44. 52 U.S. Department of Transportation, Bureau of Transportation Statistics (BTS), Transportation Statistics Annual Report 2006 (Washington, DC: BTS, December 2006), http://www.bts.gov/publications/transportation_statistics_annual_report/2006/html/chapter_02/table_k_03.html (accessed 6/4/07). 53 Ibid. 54 Ibid. 55 Robert M. Heavenrich, Light-Duty Automotive Technology and Fuel Economy Trends: 1975 through 2006, Executive Summary, EPA420-S-06-003 (Washington, DC: EPA, July 2006), p. 1.
Figure 11. U.S. Petroleum Use by Sector, 2005
From: U.S. DOT, BTS, Transportation Statistics Annual Report 2006, http://www.bts.gov/publications/transportation_statistics_annual_report/2006/html/chapter_02/table_k_03.html
THE FUTURE OF TRANSPORTATION IN THE NORTHEAST CORRIDOR, 2007–2025: RAIL TRANSPORTATION
Anticipating 2025 in Northeast Corridor Transportation: Aerial, Highway, Marine, and Rail Technologies & Linkages 80
What Could and Should the Future Hold? Given the history of the NEC and the current situation with respect to support (or lack thereof) for rail, when looking out to 2025, the picture is not terribly optimistic. Yet, we are increasingly challenged as our desire to grow economically is increasingly constrained by congestion, environmental and health concerns, the need to conserve energy, and the need to improve security. While not by any means the only solution, rail must certainly play a more important role in addressing these challenges. However, in considering what role rail must play and how it must be connected, we need to think beyond rail. From Megalopolis… In 1961, Jean Gottmann published his book and coined the phrase, Megalopolis (which he had first used in an article several years earlier), to describe the northeast corridor from Boston to Washington, DC.56 Several years later, Claiborne Pell published, Megalopolis Unbound, which informed the early discussions on the NEC and the vision of what it could be if thought of as a larger region.57 Megalopolis, as used by Gottmann and Pell, referred to a “…chain of metropolitan areas, each of which grew around a substantial urban nucleus.”58 At the time, Gottmann suggested that, among other things, a new way of governing might be needed to deal with the challenges that would be faced by this megalopolis including (ironically) “traffic difficulties.”59 Focusing on large cities as key economic generators and the need to think more broadly about how they connect has been revisited in recent years. In 2006, Richard Morrill updated the original maps in Megalopolis, suggesting that while in 1950, the corridor was more a “string of pearls” with vast rural areas in between the large connecting cities, with the turn of the century the corridor has become an almost continuous urban settlement.60 Looking more closely at transportation between Boston and Washington, DC, in Reinventing Megalopolis: The Northeast Megaregion, the authors describe the NEC as now consisting of a “chain of overlapping commuting patterns.”61 There are some interesting parallels with the overall concept of the megalopolis and rail transportation in the United States. Just as the United States was one of the first countries to deploy high speed rail and yet quickly fell behind its European and Asian counterparts, the Northeast Corridor was the first megalopolis and yet the United States is now behind here too. During the past few decades, while Europe and Asia have been moving toward broader regional and national planning and new forms of governance to allow this to occur, the United States has moved further away from such regional views and mechanisms, leaving planning and investment increasingly in the hands of state and municipal governments and agencies.62
56 Jean Gottmann, Megalopolis: The Urbanized Northeastern Seaboard of the United States (NY: The Twentieth Century Fund, 1961). 57 Claiborne Pell, Megalopolis Unbound: The Supercity and the Transportation of Tomorrow (NY: Praeger, 1966). 58 Jean Gottmann, “Megalopolis or the Urbanization of the Northern Seaboard,” Economic Geography 33, 3 (July 1957): 189. 59 Ibid., p. 194. 60 Richard Morrill, “Class Map Revisited: The Growth of Megalopolis,” The Professional Geographer 58, 2 (May 2006): 155-160. 61 University of Pennsylvania, Reinventing Megalopolis, p. 7. 62 Ibid., p. 3.
THE FUTURE OF TRANSPORTATION IN THE NORTHEAST CORRIDOR, 2007–2025: RAIL TRANSPORTATION
Anticipating 2025 in Northeast Corridor Transportation: Aerial, Highway, Marine, and Rail Technologies & Linkages 81
The result, at least in terms of transportation, is that while large-scale projects crossing various regions (and in some cases, country borders) are being developed and implemented in Europe and Asia, the United States is unable to keep pace. Nowhere is this clearer perhaps than along the NEC. While high-speed trains take just under 3 hours (soon to be reduced to 2 hours and 15 minutes), to travel the 480 miles between Paris and Marseille, traveling between Boston and Washington, DC by rail (only 456 miles) still takes 6 hours and 30 minutes.63 Rail transportation in the United States is very much in need of a national policy and a corresponding regional implementation plan. This is particularly important on the NEC, where multiple states are involved as well as multiple agencies and authorities, and where very large sums of funding will be necessary. Megalopolis provides the conceptual basis for pursuing such policy and the coalition that could be built upon this concept would have a greater sphere of influence than any one group could on its own. Further, such a coalition could provide an agglomeration of economies and allow for pooling of funding for the large projects that are needed.64 …to Megamodal Megalopolis thus provides an important conceptual basis for developing new ways of planning and new forms of governance along the Northeast Corridor, as well as new opportunities for financing. However, with respect to transportation, more is needed, especially given the limitations imposed by the built urban environment that characterizes the majority of the corridor. As we begin to think in larger terms with respect to how our cities and regions are connected, we also need to be thinking about how our passenger and freight transportation relate to each other, and how all the transportation modes relate to each other. Given scarce resources, it is no longer sufficient to look at the feasibility of beginning or increasing service on a particular mode of transportation. We need to begin thinking beyond intermodalism (which can mean linking as few as two types of transportation modes) and multimodalism (which just refers to the presence of more than one mode of transportation), to thinking of our transportation network as an entire organic system – in essence, a megamodal approach – in which decisions taken in one area are likely to have an impact (either positive or negative) in others. With a megamodal approach, one no longer thinks about how rail best connects to transit services or even how intercity rail can aid in opening up airspace for more long-haul planes (though that is, indeed, part of the discussion). A megamodal approach for the Northeast Corridor challenges us to look at all transportation modes along the entire corridor, and develop a vision for how passengers and freight can most effectively share the system (in an environmentally-sustainable way) while creating the highest levels of mobility and accessibility possible for both people and goods.
63 “High-Speed Rail Give Short-Haul Air a Run for the Money in Europe, with More Flexible Travel, Greater Comfort, Lower Environmental Impact,” PRNewswire (April 20, 2007), http://www.prnewswire.com/cgi-bin/stories.pl?ACCT=ind_focus.story&STORY=/www/story/04-20-2007/0004570197&EDATE=FRI+Apr+20+2007,+10:48+AM (accessed 5/10/07). 64 Paula Dowell, “Multi-state/Jurisdictional Freight Transportation Planning,” Presented for the FHWA Talking Freight Seminar, 12/15/04.
THE FUTURE OF TRANSPORTATION IN THE NORTHEAST CORRIDOR, 2007–2025: RAIL TRANSPORTATION
Anticipating 2025 in Northeast Corridor Transportation: Aerial, Highway, Marine, and Rail Technologies & Linkages 82
The NEC in 2025 To think of the entire transportation network, as an organic system is a daunting task and, at this point, the types of metrics and data that would be needed to make decisions using a megamodal approach have not all been developed or gathered. Moreover, few decision makers are thinking along these lines. Thus, if we ask “what will rail in the NEC look like in 2025?” the answer is likely “not very different from what it looks like today.” Perhaps if the political will can be found to provide some additional monies for state of good repair (and to deal with the moveable bridge issue on the north-end), intercity passenger rail may be able to sustain current trip times and might even be able to add some additional trains. Commuter and freight rail operations along the corridor might also be able to sustain current operations and, in some locations (primarily on the north-end) add some modest service. However, if we ask a different question, namely “what should and could the NEC look like in 2025” the answer is quite different, especially if one applies a megamodal approach while envisioning it. With a megamodal approach applied to the NEC, one can begin to imagine a Northeast Corridor in 2025 along which the investment has been made to develop a true high-speed intercity rail line that forms the central spine of a fully interconnected transportation system. At various nodes (cities) along the way, investments have been made in transit (bus, rail, ferry as appropriate), in transit oriented development, and in commuter services, so that the vast majority of people living within the Boston-Washington, DC megalopolis are now easily able to get from their homes to places they want to work or visit, with sufficient service and comfort that they need not use air travel, nor personal vehicles in most instances within the region. At the same time, investments will perhaps have been made in cleaner truck technologies and truck lanes since trucks can now benefit from decreased passenger use of highways, and in the links between marine ports, short-sea shipping, highways, and rail (where still appropriate in the northeast) to create more efficiency in freight movements as well. And, finally, with the additional space freed up in the air, airlines will be able to focus more on long-haul travel and opening new markets abroad that link the world to the northeast megalopolis.
THE FUTURE OF TRANSPORTATION IN THE NORTHEAST CORRIDOR, 2007–2025: RAIL TRANSPORTATION
Anticipating 2025 in Northeast Corridor Transportation: Aerial, Highway, Marine, and Rail Technologies & Linkages 83
Bibliography
Airport Council International. “Cargo Traffic for Past 12 Months: 12 Months Ending February 2007.” http://www.airports.org/cda/aci/display/main/aci_content.jsp?zn=aci&cp=1-5-54-4819_9_2__ (accessed 6/4/07).
Alan M. Voorhees Transportation Center. “Northeast Corridor Action Plan: A Call for a New
Federal-State Partnership.” Draft Document 12/11/05. Alan M. Voorhees Transportation Center and Hamilton, Rabinovitz & Alschuler, Inc.,
Northeast Corridor Action Plan: A Call for a New Federal-State Partnership. New Brunswick, NJ: Voorhees Transportation Center, November 2006.
American Association of State and Highway Transportation Officials (AASHTO).
Transportation: Invest in America – America’s Freight Challenge. Washington, DC: AASHTO, May 2007.
Amtrak. “News Release: Annual Amtrak Ridership of 25.4 Million Marks Third Straight
Year of Record Increases.” October 19, 2005. http://www.railserve.com/railnews/newsjump.cgi?http://www.amtrak.com/servlet/ContentServer?pagename=Amtrak/am2Copy/News_Release_Page&c=am2Copy&cid=1093554022797&ssid=180 (accessed 1/9/06).
Amtrak Reform Council. “Today, the Amtrak Reform Council Releases its Action Plan for
the Restructuring and Rationalization of the National Railroad Passenger System.” Press Release. February 7, 2002.
Bailey, Diane, et al. Harboring Pollution: The Dirty Truth About U.S. Ports. NY: National
Resources Defense Council, March 2004. Bernard, Arianne. “International Business: Research Model of French Train Beats Record,
Hitting 357 Miles an Hour.” The New York Times. April 4, 2007. C. de Cerreño, Allison. Identifying and Reducing Institutional Barriers to Effective and
Efficient Freight Movement in the Downstate New York Region. NY: NYU Wagner Rudin Center, December 2006.
C. de Cerreño, Allison, and Shishir Mathur. High-Speed Rail Projects in the United States:
Identifying the Elements of Success – Part 2. MTI Report 06-03. San José, CA: MTI, November 2006.
Davis, Stacy, and Susan Diegel. Transportation Energy Data Book: Edition 26-2007. ORNL-
6978. Prepared for the U.S. Department of Energy. Oak Ridge, TN: DOE, 2007.
THE FUTURE OF TRANSPORTATION IN THE NORTHEAST CORRIDOR, 2007–2025: RAIL TRANSPORTATION
Anticipating 2025 in Northeast Corridor Transportation: Aerial, Highway, Marine, and Rail Technologies & Linkages 84
Ditmeyer, Steven R. “Network-Centric Railroading Utilizing Intelligent Railroad Systems.” Presented at the World Bank Transport Forum (May 31, 2006). http://www.worldbank.org/transport/learning/tf2006/railways%20day/presentations/ditmeyer2.ppt#1 (accessed 6/4/07).
Ditmeyer, Steven R. “Network-Centric Railroading Utilizing Intelligent Railroad Systems.”
Presented at the 10th International Command and Control Research and Technology Symposium. June 13-16, 2006.
Dowell, Paula. “Multi-state/Jurisdictional Freight Transportation Planning.” Presented for the
FHWA Talking Freight Seminar. 12/15/04. Gottmann, Jean. Megalopolis: The Urbanized Northeastern Seaboard of the United States.
NY: The Twentieth Century Fund, 1961. Gottmann, Jean. “Megalopolis or the Urbanization of the Northern Seaboard.” Economic
Geography 33, 3 (July 1957): 189-200. Graber, Cynthia. “High-Speed Railways in Spain.” Special Advertising Section – New
Technologies in Spain. Technology Review. 7 November 2006. http://www.technologyreview.com/microsites/spain/train/index.aspx (accessed) 4/23/07.
Heavenrich, Robert M. Light-Duty Automotive Technology and Fuel Economy Trends: 1975
Through 2006, Executive Summary. EPA420-S-06-003. Washington, DC: EPA, July 2006.
“High-Speed Rail Give Short-Haul Air a Run for the Money in Europe, with More Flexible
Travel, Greater Comfort, Lower Environmental Impact.” PRNewswire (April 20, 2007). http://www.prnewswire.com/cgi-bin/stories.pl?ACCT=ind_focus.story&STORY=/www/story/04-20-2007/0004570197&EDATE=FRI+Apr+20+2007,+10:48+AM (accessed 5/10/07).
I-95 Corridor Coaltion. Mid-Atlantic Rail Operations Study (MAROps). Cambridge:
Cambridge Systematics, Inc. April 2003. Long Island Railroad. “Long Island Railroad Annual Ridership.”
http://www.mta.nyc.ny.us/mta/ind-perform/annual/lirr-ridership.htm (accessed 2/8/06). Morrill, Richard. “Class Map Revisited: The Growth of Megalopolis.” The Professional
Geographer 58, 2 (May 2006): 155-160. Midwest High Speed Rail Association. “Why Railroads – A Cleaner Environment.”
http://www.midwesthsr.org/whyRail_cleaner.htm (accessed 6/7/07).
THE FUTURE OF TRANSPORTATION IN THE NORTHEAST CORRIDOR, 2007–2025: RAIL TRANSPORTATION
Anticipating 2025 in Northeast Corridor Transportation: Aerial, Highway, Marine, and Rail Technologies & Linkages 85
National Oceanic and Atmospheric Administration. “Greenhouse Gases.” http://lwf.ncdc.noaa.gov/oa/climate/gases.html (accessed 6/5/07).
Parsons Brinckerhoff Quade & Douglas, Inc., Cambridge Systematics, Inc., Regional Science
Research Institute. CONEG: High Speed Rail Regional Benefits Study: Summary Report. Prepared for the Coalition of Northeastern Governors High Speed Rail Task Force. October 1990.
Pedersen, Neil J. “Rail Capacity and Infrastructure Requirements.” Written Testimony
Submitted by the I-95 Corridor Coalition to the Surface Transportation Board, Hearing Record on Rail Capacity and Infrastructure Requirements. April 11, 2007.
Pell, Claiborne. Megalopolis Unbound: The Supercity and the Transportation of Tomorrow.
NY: Praeger, 1966. Penner, Joyce E., ed. Aviation and the Global Atmosphere. Intergovernmental Panel of
Climate Change. Summaries for Policymakers. Geneva: UNEP and WMO, 1999. http://www.grida.no/climate/ipcc/aviation (accessed 6/7/07).
Perl, Anthony. New Departures: Rethinking Rail Passenger Policy in the Twenty-first
Century. Lexington, KY: University Press of Kentucky, 2002). Regional Plan Association and the Penn Institute for Urban Research. “Northeast Climate
and Competitiveness Summit.” March 2, 2007. http://www.america2050.org/2007/03/northeast_corridor_mobility_sum.html (accessed online 5/7/07).
Schrank, David and Tim Lomax. The 2005 Urban Mobility Report. College Station, TX:
TTI, May 2005. Southeast High Speed Rail Corridor. “A Time to Act (1999).”
http://www.sehsr.org/reports/time2act/time2act.html (accessed 11/27/06). University of Pennsylvania. Reinventing Megalopolis: The Northeast Megaregion.
Philadelphia: UPenn School of Design, Department of City and Regional Planning, Spring 2005.
University of Pennsylvania. Uniting People, Places & Systems: Megalopolis Unbound.
Philadelphia: UPenn School of Design, Department of City and Regional Planning, April 2006.
United Kingdom Department for Transport. Low Carbon Transport Innovation Strategy.
London: Crown, May 2007. http://www.dft.gov.uk/pgr/scienceresearch/technology/lctis/ (accessed 6/7/07).
U.S. Census Bureau. Census 2000. http://www.census.gov/.
THE FUTURE OF TRANSPORTATION IN THE NORTHEAST CORRIDOR, 2007–2025: RAIL TRANSPORTATION
Anticipating 2025 in Northeast Corridor Transportation: Aerial, Highway, Marine, and Rail Technologies & Linkages 86
U.S. Conference of Mayors. U.S. Metro Economies: GMP – The Engines of America’s
Growth. Lexington, MA: Global Insight, Inc., 2006. U.S. Department of Energy (DOE). Energy Information Administration (EIA). Annual
Energy Outlook, 2007. DOE/EIA-0383. Washington, DC: EIA, February 2007. U.S. Department of Transportation (DOT(. Two-Year Report on the Northeast Corridor.
Washington, DC: USDOT, February 1978. http://www.fra.dot.gov/downloads/RRDev/1978a.pdf (accessed 8/31/05).
U.S. DOT. Bureau of Transportation Statistics (BTS). Transportation Statistics Annual
Report 2006. http://www.bts.gov/publications/transportation_statistics_annual_report/2006/html/chapter_02/table_k_03.html (accessed 6/4/07).
U.S. DOT. Federal Aviation Administration (FAA). Capacity Needs in the National Airspace
System, 2007-2025: An Analysis of Airports and Metropolitan Area Demand and Operational Capacity in the Future (FACT 2). Washington, DC: FAA, May 2007.
U.S. DOT. Terminal Area Forecast Summary: Fiscal Years 2006-2025, FAA-APO-07-1.
Washington, DC: FAA, March 2007. U.S. DOT. Federal Railroad Administration (FRA). Baltimore’s Railroad Network:
Challenges and Alternatives. Report to Congress. Washington, DC: FRA, November 2005.
U.S. DOT. Draft Environmental Impact Statement/Report, Volume 1: Northeast Corridor
Improvement Project Electrification– New Haven, CT to Boston, MA. DOT/FRA/RDV-93/01-A. Washington, DC: FRA, September 1993.
U.S. DOT. Draft Environmental Impact Statement/Report, Volume 2: Technical Studies:
Northeast Corridor Improvement Project Electrification–New Haven, CT to Boston, MA. DOT/FRA/RDV-93/01-B. Washington, DC: FRA, September 1993.
U.S. DOT. Final Environmental Impact Statement/Report, Volume 3: Response to
Comments on Draft Environmental Impact Statement/Report, Northeast Corridor Improvement Project Electrification–New Haven, CT to Boston, MA. DOT/FRA/RDV-94/01-C. Washington, DC: FRA, October 1994.
U.S. DOT. Northeast Corridor Improvement Project: Final Programmatic Environmental
Impact Statement, Volume 1. FRA-RNC-EIS-77-01-F. Washington, DC: USDOT, June 1978.
THE FUTURE OF TRANSPORTATION IN THE NORTHEAST CORRIDOR, 2007–2025: RAIL TRANSPORTATION
Anticipating 2025 in Northeast Corridor Transportation: Aerial, Highway, Marine, and Rail Technologies & Linkages 87
U.S. DOT. Northeast Corridor Improvement Project Electrification New Haven, CT to Boston, MA: Scoping Document. DOT-FRA-RDV-92-01. Washington, DC: FRA, April 1992.
U.S. DOT. The Northeast Corridor Transportation Plan: New York City to Boston. Report to
Congress, Volume 1. Washington, DC: FRA, July 1994. U.S. DOT. Office of the Inspector General. Reauthorization of Intercity Passenger Rail and
Amtrak. Testimony Before the Committee on Commerce, Science, and Transportation, Subcommittee on Surface Transportation and Merchant Marine, US Senate – Statement of the Honorable Kenneth M. Mead, Inspector General, U.S. Department of Transportation. CC-2005-030. Washington, DC: GAO, April 21, 2005.
U.S. General Accounting Office (GAO). Commuter Rail: Commuter Rail Issues Should Be
Considered in Debate over Amtrak. Report to the Chairman, Committee on Banking, Housing, and Urban Affairs, US Senate. GAO-06-470. Washington, DC: GAO, April 2006.
U.S. General Accounting Office (GAO). Intercity Passenger Rail: Amtrak’s Management of
Northeast Corridor Improvements Demonstrates Need for Applying Best Practices. Report to the Chairman, Committee on Commerce, Science and Transportation, US Senate. GAO-04-94. Washington, DC: GAO, February 2004.
U.S. General Accounting Office (GAO). Intercity Passenger Rail: Congress Faces Critical
Decisions in Developing a National Policy. Testimony Before the Subcommittee on Railroads, Committee on Transportation and Infrastructure, House of Representatives–Statement of JayEtta Hecker, Director of Physical Infrastructure Issues. GAO-02-522T. Washington, DC: GAO, April 11, 2002. http://www.gao.gov/new.items/d02522t.pdf (accessed 6/23/05).
U.S. General Accounting Office (GAO). Northeast Rail Corridor: Information on Users,
Funding Sources and Expenditures. Report to the Chairman, Subcommittee on Surface Transportation and Merchant Marine, Committee on Commerce, Science, and Transportation, US Senate. GAO/RCED-96-144. Washington, DC: GAO, June 1996.
U.S. General Accounting Office (GAO). Problems in the Northeast Corridor Railway
Improvement Project. Report by the Comptroller General of the United States. CED-79-38. Washington, DC: GAO, 29 March 1979. http://archive.gao.gov/f0302/108987.pdf (accessed 8/31/05).
U.S. General Accounting Office (GAO). Reauthorization of Intercity Passenger Rail and
Amtrak. Testimony before the Committee on Commerce, Science, and Transportation, Subcommittee on Surface Transportation and Merchant Marine, U.S. Senate–Statement of the Honorable Kenneth M. Mead, Inspector General, US Department of Transportation. CC-2005-030. Washington, DC: GAO, April 21, 2005.
An Equal Opportunity/Affirmative Action EmployerThe University of Delaware is committed to assuring equal opportunity to all persons and does not discriminate on the basis of race, creed, color,gender, age, religion, national origin, veteran or handicapped status, or sexual orientation in its educational programs, activities, admissions oremployment practices as required by Title IX of the Educational Amendments of 1972, Section 504 of the Rehabilitation Act of 1973, Title VII of theCivil Rights Act of 1964, and other applicable statutes. Inquiries concerning Section 504 compliance and information regarding campus accessibilityshould be referred to the Americans with Disabilities Act (ADA) Coordinator, 831-4643, located at 413 Academy Street. Inquiries concerning Title VIIand Title IX should be referred to the Office of the Assistant Vice President for Affirmative Action, 831-8735, located at 124 Hullihen Hall.
Institute for Public AdministrationCollege of Human Services, Education & Public Policy
University of Delaware180 Graham Hall
Newark, DE 19716-7380
phone: 302-831-8971 e-mail: [email protected] fax: 302-831-3488
www.ipa.udel.edu
The University of Delaware’s Institute for Public Administration (IPA) addresses the policy, planning,and management needs of its partners through the integration of applied research, professionaldevelopment, and the education of tomorrow’s leaders.