Annual Shareholders’ Meeting on April 8, 2014 Annual ... · Annual Shareholders’ Meeting on...
30
Joachim Kreuzburg Chairman of the Board and CEO Annual Shareholders’ Meeting on April 8, 2014 Welcome | Bienvenue | Benvenuti | Bienvenido | Willkommen | Welcome | Bienvenue | Benvenuti Bienvenue | Benvenuti | Bienvenido | Willkommen | Welcome | Bienvenue | Benvenuti | Bienvenid Willkommen | Welcome | Bienvenue | Benvenuti | Bienvenido | Willkommen | Welcome | Bienvenue Annual Shareholders’ Meeting on April 4, 2017
Transcript of Annual Shareholders’ Meeting on April 8, 2014 Annual ... · Annual Shareholders’ Meeting on...

Joachim Kreuzburg Chairman of the Board and CEO
Annual Shareholders’ Meeting on April 8, 2014
Welcome | Bienvenue | Benvenuti | Bienvenido | Willkommen | Welcome | Bienvenue | Benvenuti
Bienvenue | Benvenuti | Bienvenido | Willkommen | Welcome | Bienvenue | Benvenuti | Bienvenid Willkommen | Welcome | Bienvenue | Benvenuti | Bienvenido | Willkommen | Welcome | Bienvenue
Annual Shareholders’ Meeting on April 4, 2017

Disclaimer
This presentation contains statements concerning Sartorius Stedim Biotech Group’s future performance. These statements are based on assumptions and estimates. Although we are convinced that these forward-looking statements are realistic, we cannot guarantee that they will actually materialize. This is because our assumptions harbor risks and uncertainties that could lead to actual results diverging substantially from the expected ones. It is not planned to update our forward-looking statements.
Throughout this presentation, differences may be apparent as a result of rounding during addition.

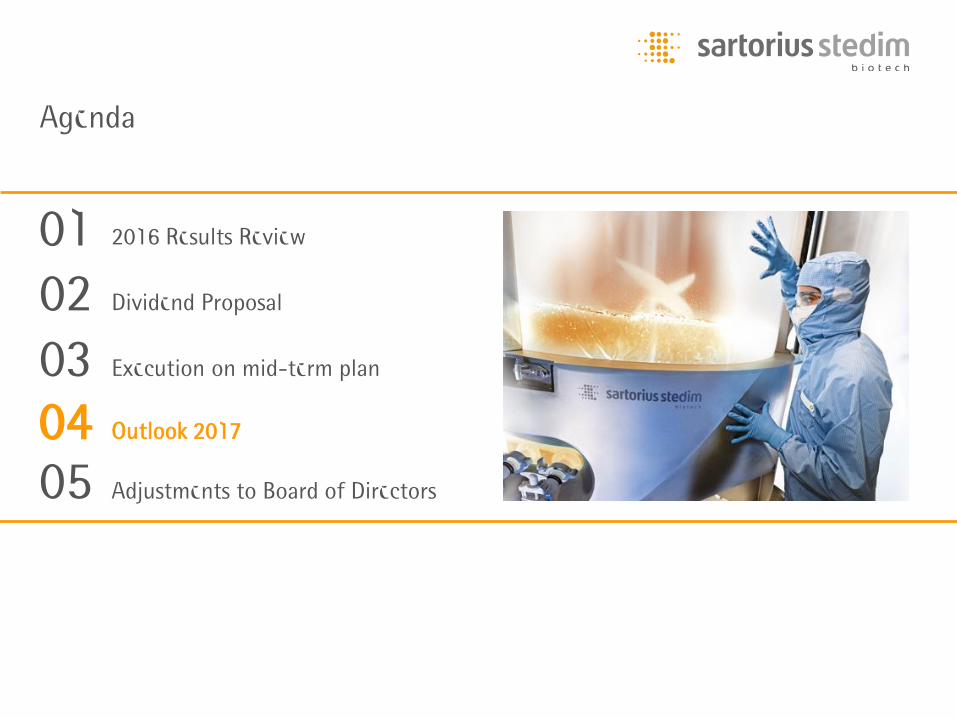
Agenda
01
2016 Results Review
Dividend Proposal 02
Outlook 2017 04 Execution on mid-term plan 03
Adjustments to Board of Directors 05
Another year of healthy growth in revenues and profits
4
Continued double-digit top line growth
Economies of scale drive overproportionate expansion of profitability
Single-use portfolio complemented through the acquisition of kSep Systems
Acceleration and step up of investments to support future growth 20
16
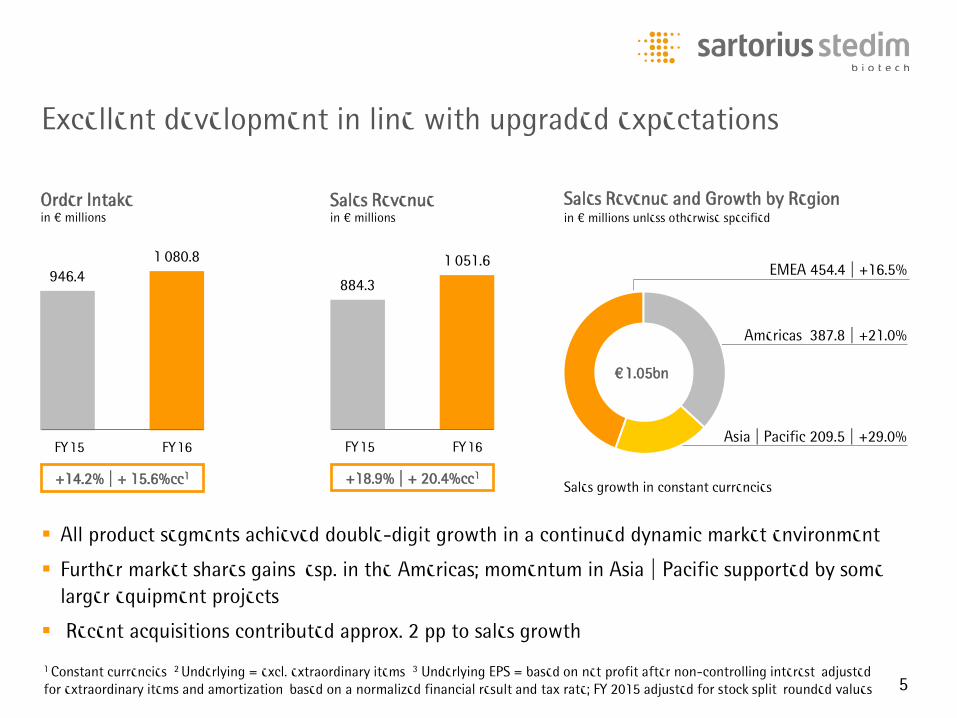
Excellent development in line with upgraded expectations
1 Constant currencies 2 Underlying = excl. extraordinary items 3 Underlying EPS = based on net profit after non-controlling interest, adjusted for extraordinary items and amortization, based on a normalized financial result and tax rate; FY 2015 adjusted for stock split, rounded values
All product segments achieved double-digit growth in a continued dynamic market environment
Further market shares gains, esp. in the Americas; momentum in Asia | Pacific supported by some larger equipment projects
Recent acquisitions contributed approx. 2 pp to sales growth
5
+18.9% | + 20.4%cc1
Sales Revenue in € millions
884.3
1,051.6
FY 16 FY 15
Order Intake in € millions
+14.2% | + 15.6%cc1
946.4 1,080.8
FY 16 FY 15 Asia | Pacific 209.5 | +29.0%
Americas 387.8 | +21.0%
EMEA 454.4 | +16.5%
€ 1.05bn
Sales Revenue and Growth by Region in € millions unless otherwise specified
Sales growth in constant currencies
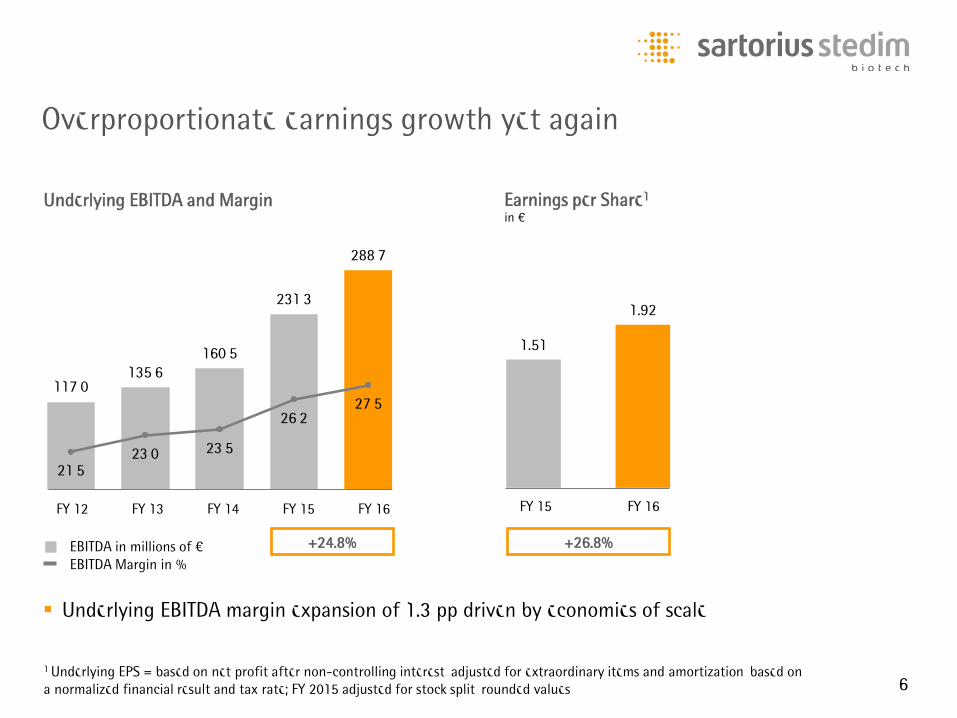
1.51
1.92
Overproportionate earnings growth yet again
1 Underlying EPS = based on net profit after non-controlling interest, adjusted for extraordinary items and amortization, based on a normalized financial result and tax rate; FY 2015 adjusted for stock split, rounded values
Underlying EBITDA margin expansion of 1.3 pp driven by economies of scale
6
+26.8%
FY 16 FY 15
Underlying EBITDA and Margin
Earnings per Share1 in €
FY 12
117,0 135,6
160,5
231,3
288,7
21,5 23,0 23,5
26,2 27,5
1818,318,618,919,219,519,820,120,420,72121,321,621,922,222,522,823,123,423,72424,324,624,925,225,525,826,126,426,72727,327,627,928,228,528,829,129,429,73030,330,630,931,231,531,832,132,432,73333,333,633,934,234,534,835,135,435,73636,336,636,937,237,537,838,138,438,73939,339,639,9
0.6
0.9
0.3
1.2
1.5
FY 13 FY 14 FY 15 FY 16
EBITDA in millions of € EBITDA Margin in %
+24.8%
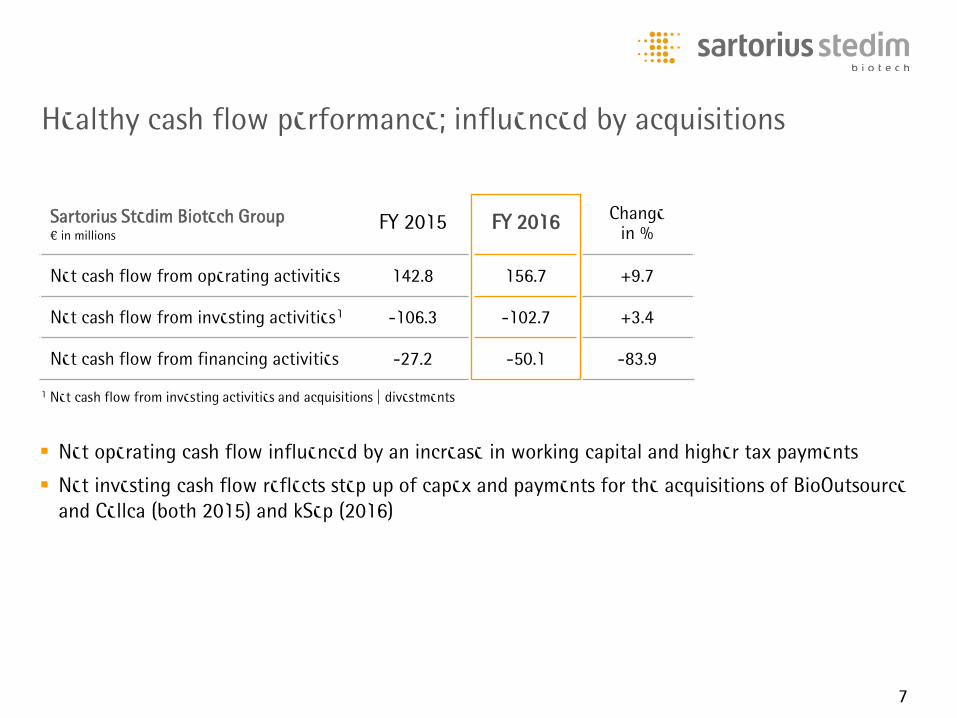
Healthy cash flow performance; influenced by acquisitions
Sartorius Stedim Biotech Group € in millions
FY 2015 FY 2016 Change in %
Net cash flow from operating activities 142.8 156.7 +9.7
Net cash flow from investing activities 1 -106.3 -102.7 +3.4
Net cash flow from financing activities -27.2 -50.1 -83.9
1 Net cash flow from investing activities and acquisitions | divestments
7
Net operating cash flow influenced by an increase in working capital and higher tax payments
Net investing cash flow reflects step up of capex and payments for the acquisitions of BioOutsource and Cellca (both 2015) and kSep (2016)

Financial position remains very strong
8
Net debt in millions of € Net debt to underlying EBITDA
50
100
150
67.1% 63.9% 60.7%
63.9%
32.9% 36.1%
13.7% 12.3%
25.6% 23.8%
Non-current assets Current assets
Equity Financial debt Non-financial debt
FY 15 FY 16 FY 15 FY 16
Balance Sheet in € millions unless otherwise specified
Net Debt to underlying EBITDA in € millions
FY 12
113.7
130.0
87.4 86.4
67.6 1.0 1.0
0.5 0.4
0.2 0
0,3
0,6
0,9
1,2
1,5
0.6
0.9
0.3
1.2
1.5
FY 13 FY 14 FY 15 FY 16

Balance sheet of the parent company
Sartorius Stedim Biotech S.A. December 31, 2016; € in millions (unless otherwise specified)
Assets Equity and Liabilities
Non-current assets 136.5 87.6% Equity 103.6 66.4%
Current assets 19.4 12.4% Liabilities 19.4 33.6%
Total 155.9 100% Total 155.9 100%
9

Stable share price development after a steep increase in 2015
10
SSB +1.8% NASDAQ Biotech -21.7%
CAC Small +9.9% SBF120 +4.7%
105%
90%
70%
Share price more than doubled in 2015; increased by 1.8% in fiscal 2016
Implementation of stock split in May 2016
Market Capitalization
€5.8 bn as of March 31, 2017
Jan 2016
Feb Mar Apr May Jun Jul Aug Sept Oct Nov Dec Jan 2017
Feb Mar
85%
130%
Agenda
01
2016 Results Review
Dividend Proposal 02
Outlook 2017 04 Execution on mid-term plan 03
Adjustments to Board of Directors 05

Strong dividend increase yet again
Figures for 2012-15 adjusted for stock split; rounded values 1 Subject to approval by the AGM 2 Relative to underlying net profit
Earnings per Share in €
2012 2014 2013 2015 2012 2014 2013 2015
0.70 0.82
0.95
1.51
1.92
0.18 0.20 0.22
0.33
0.42
12
Dividend per Share in €
20161 2016
8th dividend increase in succession
Total profit distributed would increase by 26.0% from €30.7mn to 38.7mn
Payout ratio2 of 21.9% (2015: 22.1%) in line with SSB’s dividend policy

Agenda
01
2016 Results Review
Dividend Proposal 02
Outlook 2017 04 Execution on mid-term plan 03
Adjustments to Board of Directors 05
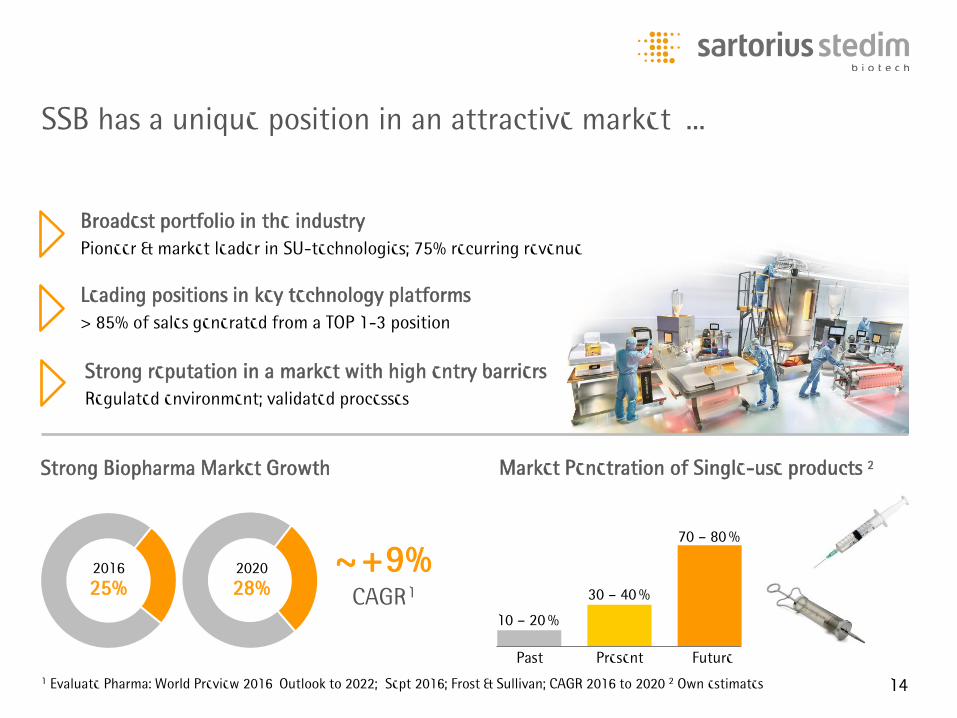
1 Evaluate Pharma: World Preview 2016, Outlook to 2022; Sept 2016; Frost & Sullivan; CAGR 2016 to 2020 2 Own estimates
SSB has a unique position in an attractive market, ...
14
Past Present Future
10 – 20 %
30 – 40 %
70 – 80 %
2016 25%
2020 28%
~ + 9% CAGR
1
Market Penetration of Single-use products 2 Strong Biopharma Market Growth
Strong reputation in a market with high entry barriers Regulated environment; validated processes
Broadest portfolio in the industry Pioneer & market leader in SU-technologies; 75% recurring revenue
Leading positions in key technology platforms > 85% of sales generated from a TOP 1-3 position

... a strong track record of profitable growth...
Sales growth and CAGR in constant currencies ; 1 Excluding extraordinary items 15
20.9 21.5 23.0 23.5
26.2 27.5
15
16
17
18
19
20
21
22
23
24
25
26
27
28
29
30
31
32
33
0
200
400
600
800
1000
1200
+10.3%
Sales revenue EBITDA1 margin in %
2011 2015
+10.8% +15.9%
+19.4%
2012 2013 2014
€1.05bn
2016
+20.4%
€477m
2011-16 Sales CAGR ~ +15.5% EBITDA1 Margin +6.6 pp

16 1 CAGR 2011 to 2016 in constant currencies 2 Based on 2015 fx rates 3 Excl. extraordinary items
~ €1.5-1.6 bn2
Sales revenue
~ 29-30%2 EBITDA3 margin
~ 4|5 Organic
~ 1|5 Acquisitions
... and is well on track to meet 2020 targets
Portfolio Alliances and acquisitions Own product development
Regional Gain share in North America Leverage market growth in Asia
Infrastructure Continued capacity expansion
Strategic Initiatives
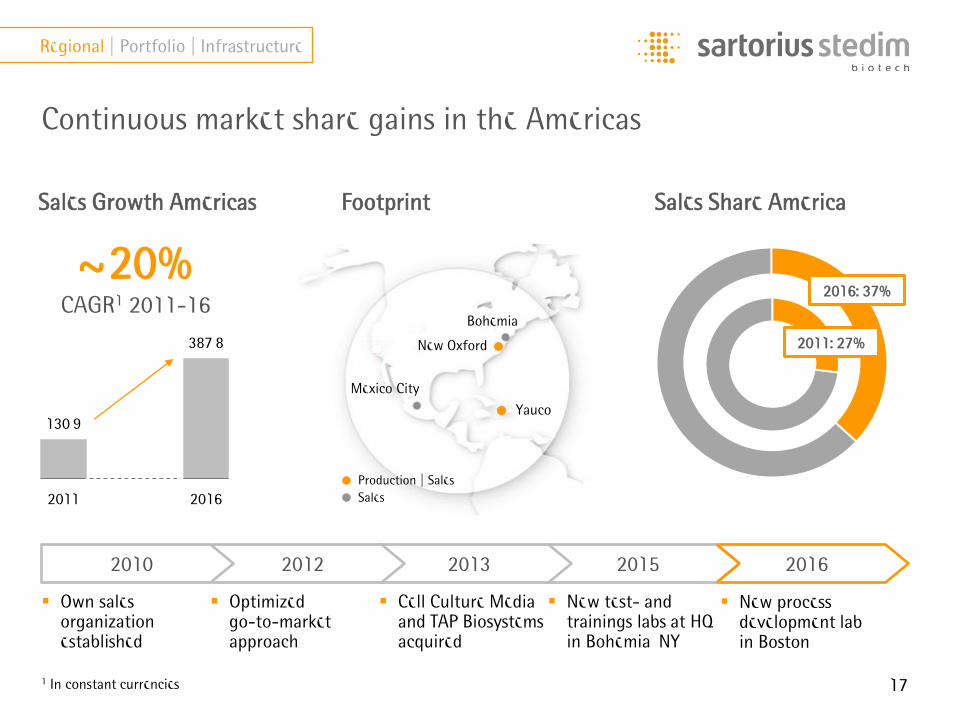
Continuous market share gains in the Americas
17 1 In constant currencies
Footprint Sales Growth Americas
~ 20% CAGR1 2011-16
130,9
387,8
2011 2016
Own sales organization established
Optimized go-to-market approach
Cell Culture Media
and TAP Biosystems acquired
New test- and trainings labs at HQ in Bohemia, NY
2016 2015 2013 2012 2010
Mexico City
Yauco
New Oxford
Production | Sales Sales
Bohemia
Regional | Portfolio | Infrastructure
Sales Share America
2011: 27%
2016: 37%
New process development lab in Boston
Singapore
Kuala Lumpur
Bangalore
Hanoi
Tokyo Beijing Seoul
Shanghai
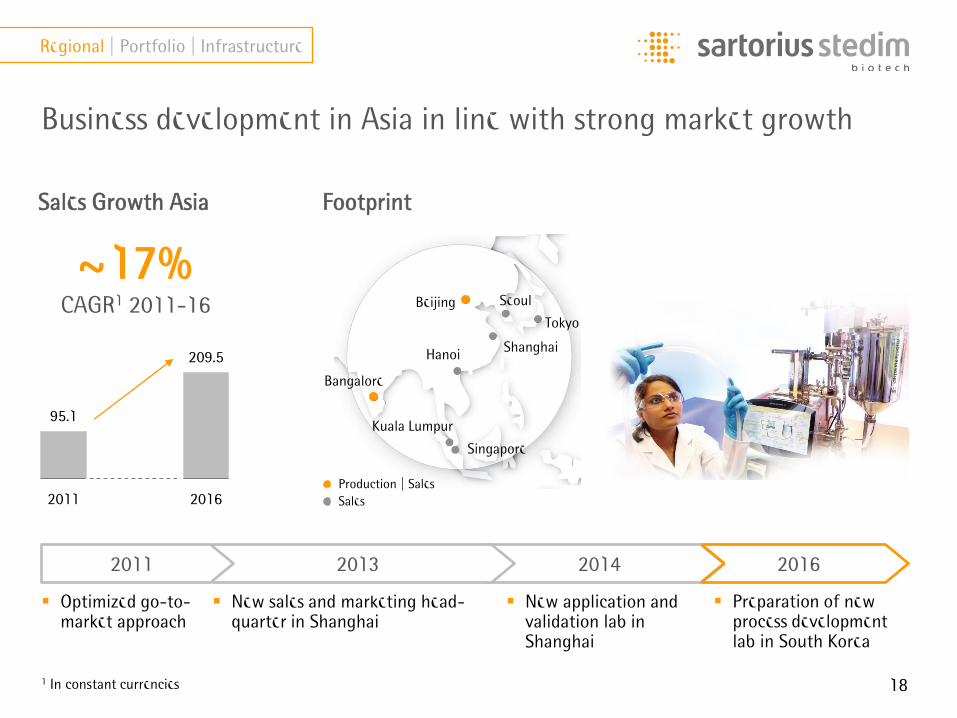
Business development in Asia in line with strong market growth
18 1 In constant currencies
Footprint Sales Growth Asia
~ 17% CAGR1 2011-16
95.1
209.5
2011 2016
Optimized go-to-market approach
New sales and marketing head- quarter in Shanghai
New application and validation lab in Shanghai
2016 2014 2013 2011
Regional | Portfolio | Infrastructure
Production | Sales Sales
Preparation of new process development lab in South Korea
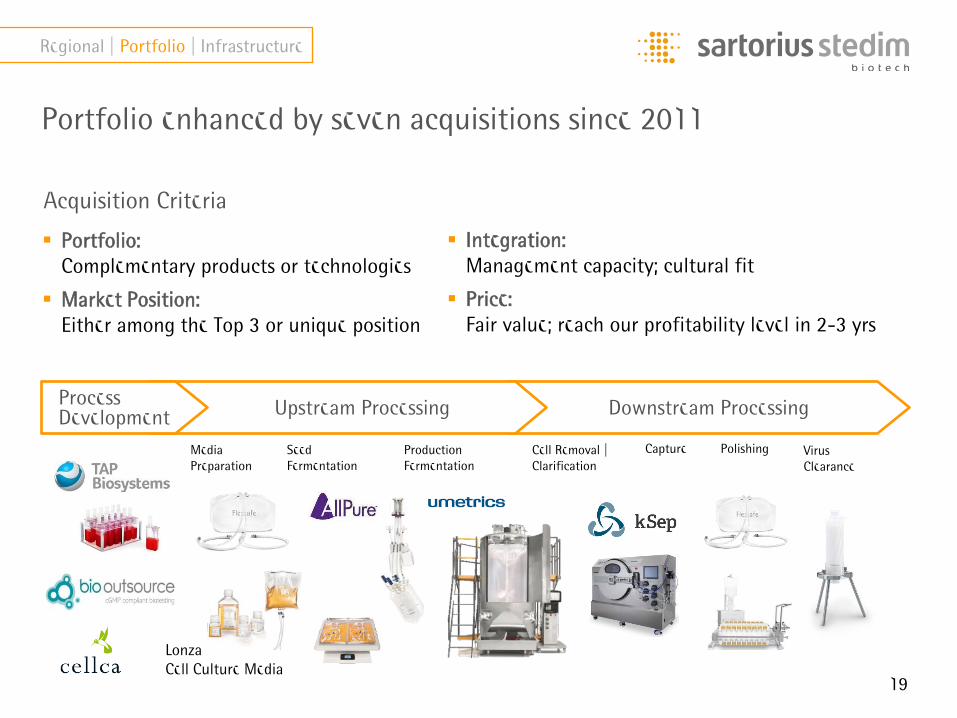
Portfolio enhanced by seven acquisitions since 2011
Portfolio: Complementary products or technologies
Market Position: Either among the Top 3 or unique position
Acquisition Criteria
19
Media Preparation
Seed Fermentation
Production Fermentation
Cell Removal | Clarification
Capture Polishing Virus Clearance
Integration:
Management capacity; cultural fit
Price: Fair value; reach our profitability level in 2-3 yrs
Lonza Cell Culture Media
Downstream Processing Upstream Processing Process Development
Regional | Portfolio | Infrastructure
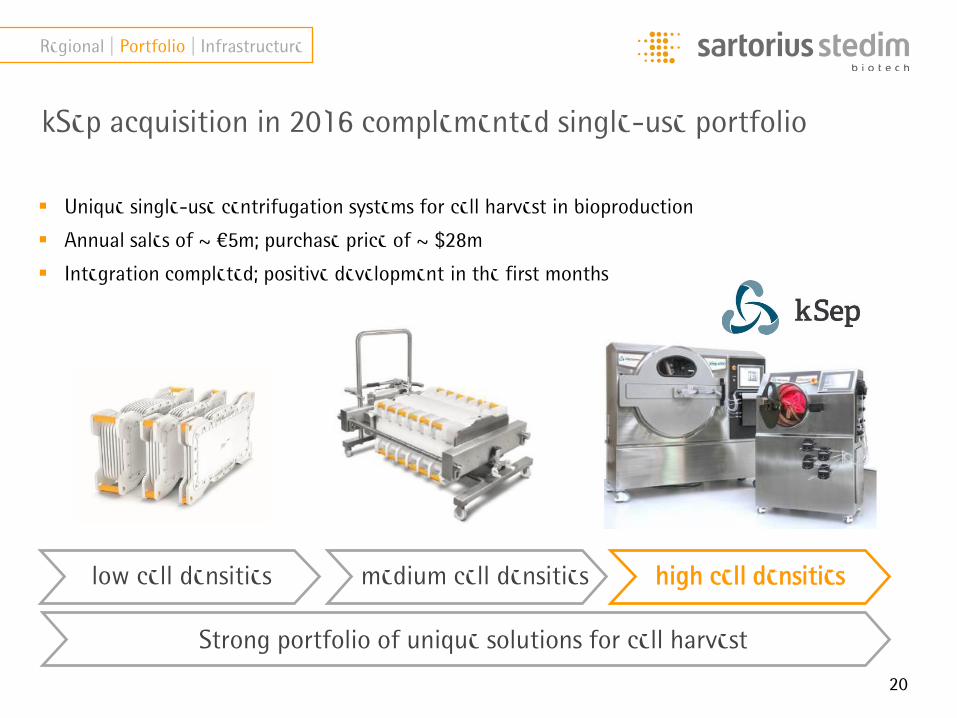
kSep acquisition in 2016 complemented single-use portfolio
Strong portfolio of unique solutions for cell harvest
low cell densities
Unique single-use centrifugation systems for cell harvest in bioproduction
Annual sales of ~ €5m; purchase price of ~ $28m
Integration completed; positive development in the first months
high cell densities
Regional | Portfolio | Infrastructure
medium cell densities
20

Recent Acquisition of leading biopharma software developer Umetrics
Regional | Portfolio | Infrastructure
Highly specialized provider of data analytics software
Powerful solutions for modeling and optimizing development and manufacturing processes of biopharmaceuticals
Successful distribution and co-marketing cooperation with Umetrics since 2012
Annual sales of ~$15m; signi significant double-digit margins
Acquired in early April; purchase price of $72.5m
21

Significant expansion of production capacities initiated in 2016
22
Capacities increased earlier and to a greater extent than initially planned due to strong organic growth
Capacities at Yauco plant for single-use bags and filters will be more than doubled
Expansion of Goettingen site (filter & instruments production; additional R&D & application labs)
Capex ratio expected to remain above long-term average until 2018
9.2
5.8 6.5 6.2
7.6
5,0
6,0
7,0
8,0
9,0
10,0
11,0
12,0
13,0
14,0
15,0
16,0
17,0
18,0
0
200
400
600
800
1000
1200
1400
2016 2014 2013 2012 2015 2017e2
Capex Development
~ 10-13
1 Based on guidance 2017
Sales revenue Capex as a % of sales revenue
Stonehouse: | UK New production building put in operation
Yauco | Puerto Rico: Start of building additional capacity for filters and bags
Goettingen | Germany: Expansion of filter membrane production
Executed in 2016 Initiated in 2016 Initiated in 2016
Regional | Portfolio | Infrastructure
23
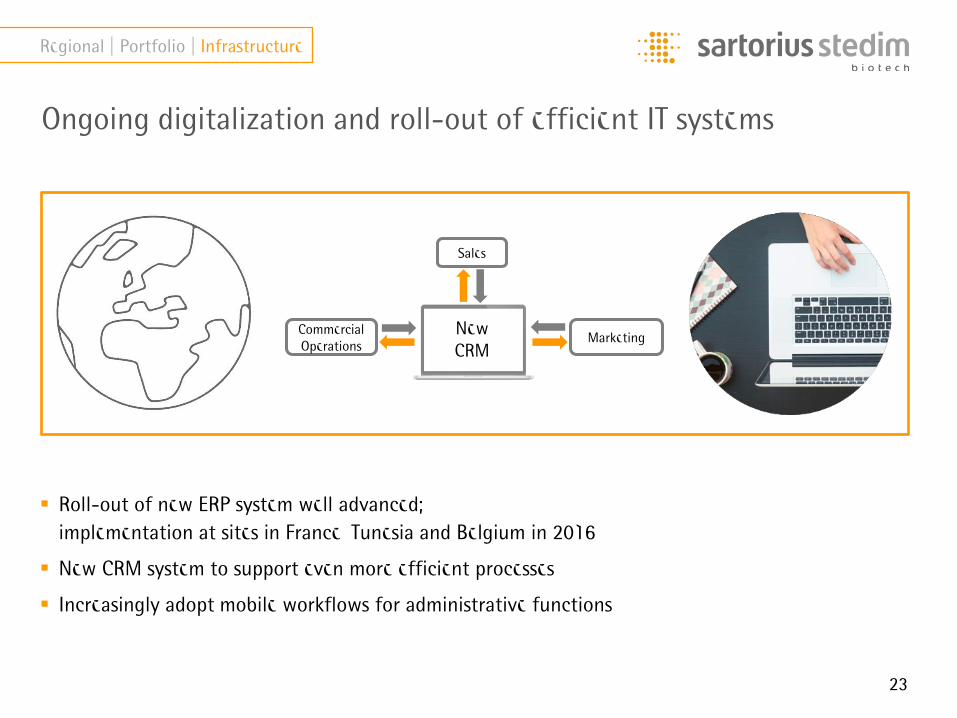
Ongoing digitalization and roll-out of efficient IT systems
Roll-out of new ERP system well advanced; implementation at sites in France, Tunesia and Belgium in 2016
New CRM system to support even more efficient processes
Increasingly adopt mobile workflows for administrative functions
Sales
Commercial Operations
Marketing New CRM
Regional | Portfolio | Infrastructure

24
Considerable number of new jobs created again
Regional | Portfolio | Infrastructure
Group
France
4.725
456
788
2015 2016
4.202
+ 12.5% + 5.2%
2012 ...
2.986
+ 58.2% + 72.8%
749
2015 2016 2012 ...
More than 4,700 people; 523 new employees, thereof 5 relating acquisition of kSep
Corporate Values
SUSTAINABILITY Growing profitably and acting responsibly.
Driving change and progress internally and externally.
OPENNESS
Working in an energetic and rewarding environment.
ENJOYMENT
„Family Day“ of Sartorius Stedim Biotech at Aubagne site
Agenda
01
2016 Results Review
Dividend Proposal 02
Outlook 2017 04 Execution on mid-term plan 03
Adjustments to Board of Directors 05
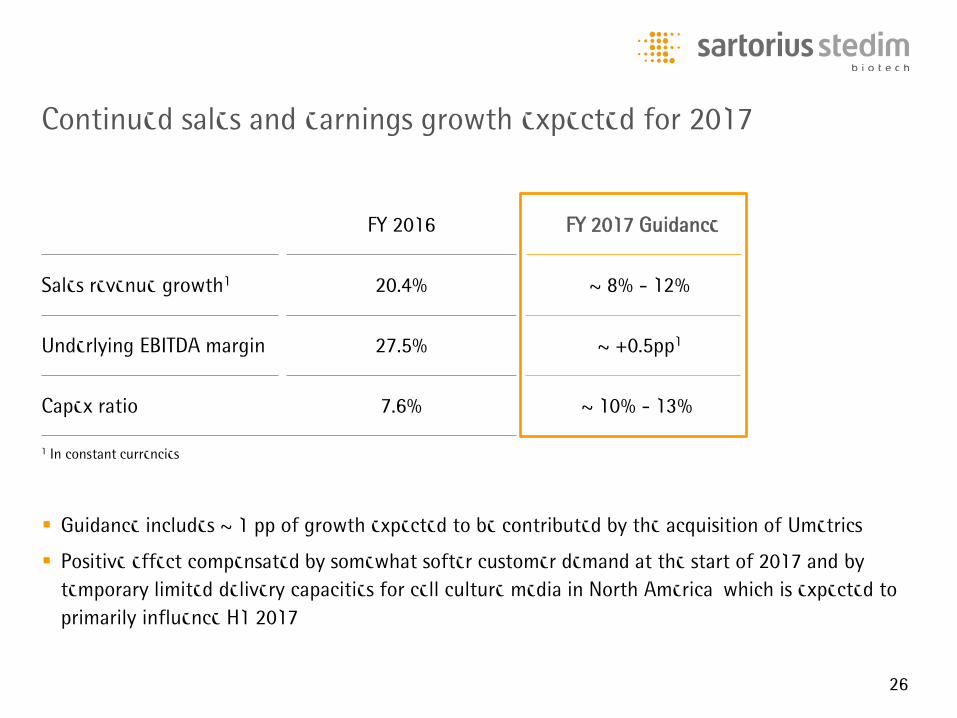
FY 2016 FY 2017 Guidance
Sales revenue growth1 20.4% ~ 8% - 12%
Underlying EBITDA margin 27.5% ~ +0.5pp1
Capex ratio 7.6% ~ 10% - 13%
Continued sales and earnings growth expected for 2017
1 In constant currencies
26
Guidance includes ~ 1 pp of growth expected to be contributed by the acquisition of Umetrics
Positive effect compensated by somewhat softer customer demand at the start of 2017 and by temporary limited delivery capacities for cell culture media in North America, which is expected to primarily influence H1 2017

Agenda
01
2016 Results Review
Dividend Proposal 02
Outlook 2017 04 Execution on mid-term plan 03
Adjustments to Board of Directors 05
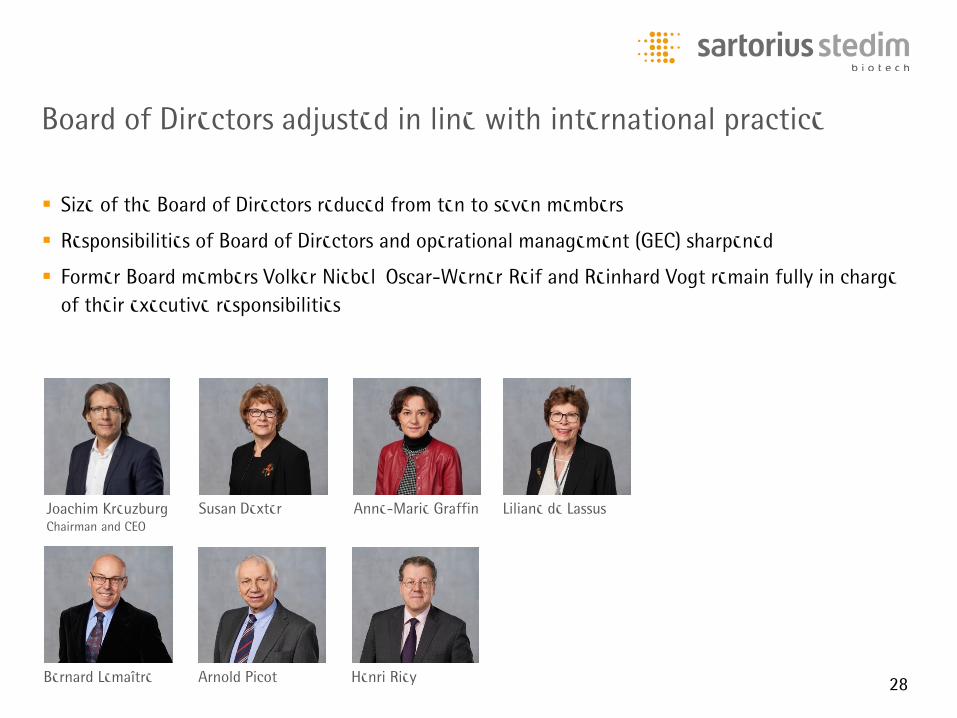
Board of Directors adjusted in line with international practice
28
Size of the Board of Directors reduced from ten to seven members
Responsibilities of Board of Directors and operational management (GEC) sharpened
Former Board members Volker Niebel, Oscar-Werner Reif and Reinhard Vogt remain fully in charge of their executive responsibilities
Joachim Kreuzburg Chairman and CEO
Susan Dexter Anne-Marie Graffin Liliane de Lassus
Bernard Lemaître Arnold Picot Henri Riey

Next Annual Shareholders‘ Meeting of Sartorius Stedim Biotech S.A. | April 3, 2018 | Aubagne |
Next Annual Shareholders‘ Meeting of Sartorius Stedim Biotech S.A. | April 4, 2017 | Aubagne | Next Annual Shareholders‘ Meeting of Sartorius Stedim Biotech S.A. | April 3, 2018 | Aubagne | Next Annual Shareholders‘ Meeting of Sartorius Stedim Biotech S.A. | April 3, 2018 | Aubagne | Next Ann
Next Annual Shareholders’ Meeting on April 3, 2018

Financial calendar and contacts
Petra Kirchhoff Vice President Corporate Communications & IR Phone: +49.551.308.1686 E-mail: [email protected]
Sartorius Corporate Administration GmbH Weender Landstrasse 94-108 37075 Goettingen, Germany www.sartorius.com
Andreas Theisen Director Investor Relations Phone: +49.551.308.1668 E-mail: [email protected]
30
April 24, 2017 Publication of first-quarter 2017 results
May 3, 2017 Deutsche Bank HC Conference | Boston
May 30, 2017 Gilbert Dupont Healthcare Forum | Paris
July 25, 2017 Publication of first-half 2017 results
October 24, 2017 Publication of nine-month 2017 results