2021 Annual Meeting of Shareholders
33
1 2021 Annual Meeting of Shareholders January 26, 2021
Transcript of 2021 Annual Meeting of Shareholders

1
2021Annual Meeting of Shareholders January 26, 2021

Call to order
2
Catherine M. BurzikDirector (G, Q, S)
Claire M. Fraser, Ph.D.Director (G, Q, S)
R. Andrew EckertDirector (A, S)
Jeffrey W. HendersonDirector (A, C)
Marshall O. LarsenDirector (C, G, Q)
Christopher JonesDirector (C, G, Q)
David F. MelcherDirector (A, C)
Rebecca W. RimelDirector (A, S)
Timothy M. RingDirector (Q, S)
Bertram L. ScottDirector (A, C)
Tom PolenDirector
CEO and President
Vincent A. ForlenzaExecutive Chairman
of the Board
Claire Pomeroy, MDDirector (G, Q, S)
Board Committee LegendA = Audit
C = CompensationG = Governance
Q = Quality & RegulatoryS = Science, Marketing,
Innovation & Technology

Meeting Matters
3

Introduction of proposals
4

The election of directors of the thirteen nominees named in the proxy statement for a one-year term
The Board of Directors recommends a vote “FOR” each of the nominees for director
The ratification of the selection of independent registered public accountant firm
The Board of Directors recommends a vote “FOR”
An advisory vote to approve named executive officer compensation
The Board of Directors recommends a vote “FOR”
A shareholder proposal regarding special meetings
The Board of Directors recommends a vote “AGAINST”
Shareholder proposals
5

Strategic and Business Update
6

7
Tom PolenCEO and President
Driving Value Creation through Fulfilling our Purpose

8
Caution Concerning Forward-Looking StatementsThis presentation contains certain estimates and other forward-looking statements (as defined under Federal securities laws) regarding BD’s future prospects andperformance, including, but not limited to, future revenues, margins, and earnings per share, leverage targets, capital deployment and total return targets. All suchstatements are based upon current expectations of BD and involve a number of business risks and uncertainties. Actual results could vary materially from anticipatedresults described, implied or projected in any forward-looking statement. With respect to forward-looking statements contained herein, a number of factors couldcause actual results to vary materially. These factors include, but are not limited to risks relating to the COVID-19 pandemic on our business (including continueddecreases in the demand for our products, any disruptions to our operations and our supply chain and uncertainty regarding the level of demand and pricing for ourCOVID-19 diagnostics testing); product efficacy or safety concerns resulting in product recalls or actions being taken with respect to our products; new or changinglaws and regulations impacting our business (including the imposition of tariffs or changes in laws impacting international trade) or changes in enforcement practiceswith respect to such laws; fluctuations in costs and availability of raw materials and in BD’s ability to maintain favorable supplier arrangements and relationships;legislative or regulatory changes to the U.S. or foreign healthcare systems, potential cuts in governmental healthcare spending (including China’s volume-basedprocurement tender process), or governmental or private measures to contain healthcare costs, including changes in pricing and reimbursement policies, each ofwhich could result in reduced demand for our products or downward pricing pressure; changes in interest or foreign currency exchange rates; adverse changes inregional, national or foreign economic conditions, particularly in emerging markets, including any impact on our ability to access credit markets and finance ouroperations, the demand for our products and services, or our suppliers’ ability to provide products needed for our operations; the adverse impact of cyber-attacks onour information systems or products; competitive factors including technological advances and new products introduced by competitors; interruptions in our supplychain, manufacturing or sterilization processes; pricing and market pressures; difficulties inherent in product development, delays in product introductions anduncertainty of market acceptance of new products; adverse changes in geopolitical conditions; increases in energy costs and their effect on, among other things, thecost of producing BD’s products; the remediation of our infusion pump business (including the timely submission of our 510(k) submission related to Alaris); our abilityto successfully integrate any businesses we acquire; uncertainties of litigation (as described in BD’s filings with the Securities and Exchange Commission); and issuanceof new or revised accounting standards, as well as other factors discussed in BD’s filings with the Securities and Exchange Commission. We do not intend to updateany forward-looking statements to reflect events or circumstances after the date hereof except as required by applicable laws or regulations.
Disclaimer

9
Caution Concerning Non-GAAP Financial Measures• To supplement BD’s consolidated financial statements presented on a U.S. GAAP basis, the Company discloses certain non-GAAP financial measures. These
non-GAAP financial measures are not in accordance with generally accepted accounting principles in the United States.
• BD strongly encourages investors to review its consolidated financial statements and publicly filed reports in their entirety and cautions investors that the non-GAAP measures used by the Company may differ from similar measures used by other companies, even when similar terms are used to identify such measures.Non-GAAP measures should not be considered replacements for, and should be read together with, the most comparable GAAP financial measures.
• These materials include non-GAAP financial measures. Figures herein are on an “as adjusted non-GAAP” basis which exclude, among other things, the impact ofpurchase accounting adjustments (including the non-cash amortization of acquisition-related intangible assets); integration, restructuring and transactioncosts.
• A reconciliation of non-GAAP to the most directly comparable GAAP measures can be found herein, or in our earnings releases and the financial schedulesattached thereto.
• Basis of Presentation: All dollar amounts presented are in millions, unless otherwise indicated, except per share figures. Certain financial information excludesthe impact of foreign currency translation. “FXN” denotes currency neutral basis. Growth denotes year-over-year percent change to the comparable period ayear ago. Revenue year-over-year change comparisons are on a FXN basis unless otherwise noted.
• Note: The COVID impact represents BD’s estimate of the net financial impact of the global COVID-19 pandemic on the Company’s results. Revenue growthrates presented herein are not adjusted to reflect the impact of COVID-19.
Disclaimer

BD associates around the world are assisting in this generation’s greatest healthcare challenge
10
Thank you, BD associatesYour efforts are making
a world of difference

PREVENTTREATDIAGNOSE
BD innovation, scale and crisp execution has made us an essential partner in enabling the pandemic response globally
11
BD HealthSight™ with MedMined™ Data Analytics for real-time surveillance reporting and medication use reporting
Note: Not all products are available in all countries/regions.
Swabs and UVT kits
BD Veritor™ rapid POC COVID-19 antigen test
BD Max™ molecularCOVID-19 tests and respiratory panel
IV catheters and PICCS for COVID-19 treatments
Medication management in field hospitals
IV drug delivery in ICUs and isolation extension sets
Over 1 billion devices committed for COVID-19 vaccinations
Partnering with pharma for potential future pre-filled COVID-19 vaccine

190 +countries served
40B +devices made annually
$1B +annual R&D spending
70,000 +BD associates
27,000 +active patents
BD is an innovative medtech leader with global reach and scale to address healthcare’s most pressing challenges
12
57%
United States
20%
EuropeChina
6%
17%
Rest of World
Revenues by region
43% International Revenue14% Emerging Markets
Revenues by segment
$17.1billion
MDS21%
MMS14%
PS9%DC
6%
IDS21%
BDB7%
PI9%
UCC7%
SURG6%
#1 in nearly all major served categories
Note: BD financial information based on FY20. Market share information and rank based on internal estimates and publicly available information.

Clear category leader with key platforms in large, foundational areas of healthcare
13 Category size represents the area in which BD competes and size and position are management’s internal estimates based on market information for 2019.
BD In
terv
entio
nal
BD M
edic
al
BD L
ife S
cien
ces
Flow-based cell sorting and analysis ~$2.3 B #1
Specimen management ~$2.7 B #1
Core microbiology ~$3.7 B #1
Core served category Category size BD position
Vascular access management ~$14.0 B #1
Medication dispensing (acute care) ~$4.0 B #1
Infusion pumps, sets (acute care) ~$3.5 B #1
Injectable drug delivery devices ~$3.3 B #1
Dialysis access solutions / ESKD ~$0.8 B #1
Biopsy & Ports ~$1.8 B #1
Hernia repair ~$1.4 B #1
Acute urological drainage ~$1.0 B #1
~$70Btotal addressable
opportunity
~90% of revenue from
leadership positions
~85% recurring/non-capital revenue

Our expanding innovation pipeline is focused on healthcare’s shifting trends leveraging BD’s core strengths
14
to improve care processes and lower costs
Applying smart devices, robotics & analytics/AI
Enabling new care settings
Better diagnosis and treatment of chronic disease
to enhance patient experience and lower costs
to improve outcomes and lower costs
BD Innovation Theme
Increased investment in FY21+ including our new BD Growth & Innovation Fund
Point of care blood collection BD Accustat, YODA platform High-teens
Point of care diagnostics BD Veritor, POC Molecular Double-digits
Self-administered drug delivery BD Intevia, BD Vystra, BD Libertas Double-digits
Non-acute medication dispensing BD ROWA, MedBank platform Mid-teens
Urological female incontinence BD Purewick Urine Collection System & Catheter Double-digits
Peripheral vascular disease BD Rotarex/Aspirex, Venous Solutions High-single digitsEndovascular AV fistula BD WaveLinQ Double-digitsAdvanced repair/reconstruction Hiatal, Incisional Reinforcement High-single digitsMolecular diagnostics BD Onclarity HPV Genotyping Assay Double-digits
Microbiology lab automation, informatics BD Kiestra, BD Synapsys Double-digits
Integrated medication management software solutions
BD HealthSight, Pyxis Prep, Logistics Double-digits
Flow cytometry with cell imaging and informatics BD Mosiac, FloJo High-single digits
Growth area BD product/solutionCategorygrowth*
*Category growth represents management’s estimated underlying revenue growth rate, excluding the impact of COVID-19 and foreign currency rates, for the next 3 years.Note: Not all products are available in all countries/regions.

Tuck-in M&A strategy further strengthens our pipeline of category solutions in high growth, target markets
15
Rigorous Screening Criteria Strengthens strategic position and customer offering
Creates shareholder value (ROIC hurdles, growth and margin accretion)
FY18
0 3
FY19 FY20 Q1 FY21
3
Innovative non-surgical AV fistula creation;
Served market growth double-digits
Point-of-care molecular diagnostics (in development);
Served market growth double-digits
Sensica UO, automated urine output monitoring, integrated into the BD HealthSight™ platform; launching
FY21; New market opportunity
Infection prevention product
(launching FY21)
Dialysis catheter (launching FY21)
Atherectomy and thrombectomy; Served market growth double-digits;
6
Non-acute medication management;
Served market, growth mid-teens
# of tuck-ins per year

Going forward and subject to market conditions, BD expects to refocus capital deployment on one or more of:
• Internal investments
• Increased dividends
• Tuck-in M&A pipeline
• Share repurchases
... while maintaining a strong and flexible balance sheet
• Achieved 3.0x net leverage as of 9/30/20
• Targeting ~2.5x net leverage longer-term
• Maintain investment grade credit ratings
Future cash can be directed more toward additional growth opportunities and shareholder return
16
*Debt Paydown Notes: Excludes the Bard transactionDebt paydown notes:
- $4.0b of debt paydown was achieved with operating cash flow- $1.0b of debt paydown through proceeds from May 2020 equity offering- Excludes $1.9b term loan drawn in Q2 and repaid in Q3 FY20
FY 2018–2020 cash allocation
~$10B Cumulative GAAP Operating Cash Flows FY18-20
Dividends$2.9B
Share Repurchases
$0.0B
Tuck-in M&A$0.4B
CapEx$2.7B
DebtPaydown
$5.0B*
Opportunities to reallocate going forward

Continuing to advance our culture and empowering BD associates globally to ensure long-term organizational success
17
The BD Way
• We believe our employees our greatest assets
• We believe in and encourage our associates and leaders a Growth Mindset, a belief that qualities and talents can be developed through dedication and hard work.
• We align our performance management to support a culture evolution and increased focus on continuous learning and development.
• Diverse representation has steadily improved over the past 5 years
• We have seen progress through a more deliberate focus on accelerating the development of diverse future leaders and more leadership engagement.
• We have increased funding of the BD University, which provides our associates with learning and development opportunities that are strategically aligned with corporate goals.

BD Global Health has a long history of driving positive societal outcomes across a wide array of health areas
18
Improving infusion, injection & phlebotomy practices in Kenya
Advancing health worker and patient safety
STRIDES Scaling TB DST in Indonesia and India
Expanding capacity for second line in TB DST in Kenya, Ethiopia
Labs for Life laboratory system
strengtheningFACSPresto™point of care CD4 testing
AMR MOOC training on diagnostic stewardship
AMR Scorecardassessing health facility readiness
Scaling cancer treatments safe for providers and patients
PCR and Rapid POC Antigendiagnostic tests for COVID-19
Safety-Engineered and Auto-Disable injection devices for COVID-19
vaccination campaigns
HIV Tuberculosis
Antimicrobial Resistance
COVID-19
Cancer
Infection Prevention & Control

We view sustainability as a portfolio of complementary initiatives and actions to achieve our long-term goals
19
Develop and maintain a strong portfolio of leading products and solutions that address significant unmet clinical needs, improve outcomes, and reduce costs.
INNOVATION
Leverage our global scale to expand our reach in providing access to affordable medical technologies around the world.
ACCESS
Work across our supply chain to minimize environmental impacts and create more resilient operations, including an enterprise-wide renewable energy strategy.
EFFICIENCY
Foster a purpose-driven culture with a focus on positive impact to all stakeholders, increase diversity, achieve best-in-class associate safety.
EMPOWERMENT
visit bd.com/en-us/company/sustainability-at-bd

Proud to be recognized for our efforts
20
One of seven companies
chosen four or more times

Building on our ESG leadership and advancing our 2030+ sustainability strategy
21
Our Climate Change Targets
Product impactsReduce the environmental impact of our portfolio and address the sustainability needs of our customers.
Climate changeMinimize our contribution to global emissions and utilize our capabilities to address unmet health needs for climate-vulnerable populations.
TransparencyInvite trust by establishing the company as honest and credible in our performance related to environmental, social and governance issues relevant to our business.
Healthy workforceMaintain a healthy and thriving workforce that cultivates our culture of inclusion, safety and well-being.
Supply chain resilienceCreate a supply chain adaptable to disruption and able to contribute to strong environmental and social performance.
Commitment to reduce Scope 1 and 2 GHG emissions 46% by 2030 (from a 2019 baseline) and to be carbon neutral across direct operations by 2040. This science-based target is aligned with 1.5⁰C global emissions reduction pathway.

Our three-pillar BD 2025 strategy positions BD to drive future value creation
22
Double-Digit Total Return
Dividend Yield
MSD = mid-single digits. Total Return = EPS growth plus dividend yield. All financial metrics, revenue growth, operating margin expansion, and EPS are on a FX-neutral, adjusted non-GAAP basis.
Adjusted EPS Growth

In fiscal 2020, we navigated through challenges and ended the year with revenues flat on a currency neutral basis
23
Other Financial Highlights• Adjusted EPS of $10.20
• Increased operating cash flow to $3.5 billion
• Executed $3 billion equity offering
• Reduced net leverage to 3.0x as of 9/30/20
• Executed on six tuck-in acquisitions
• Raised dividend 5.1% on 11/24/20 marking 49th consecutive year of increases
COVID impact represents BD’s estimate of the global COVID-19 pandemic on the Company’s results.
Revenues$ in billion
Segment FY20Reported Y/Y % ∆
FXN Y/Y % ∆
BD Medical $8.7 (4.2)% (3.2)%
BD Life Sciences $4.7 8.7% 9.9%
BD Interventional $3.8 (4.2)% (3.7)%
Total BD $17.7 (1.0)% 0.0%
BD Life Sciences included COVID-19 Diagnostics revenues of $579 million, including BD Veritor revenues of $344 million.
We estimate the net COVID-19 impact to be a negative 330bps, taking into consideration the negative impact of COVID on procedure volumes and the positive impact of COVID diagnostics.

BD innovation, scale and crisp execution has made us an essential partner in enabling the pandemic response globally
Executing on substantial value creation opportunity
• Unmatched global breadth, scale, and reach with a market-leading portfolio
• A focus on meaningful innovation and pipeline expansion
• Continuing to advance our culture and empowering BD associates globally to ensure long-term organizational success
• We view sustainability as a portfolio of complimentary initiatives and actions to achieve our long-term goals
• With a strengthened balance sheet, cash can be directed more toward additional growth opportunities and shareholder return
Building positive momentum and positioned to emerge stronger
Today’s Key Takeaways
24

Preliminary voting results
25

26
Question & Answers

Meeting Adjournment
27

Non-GAAP Reconciliations
28
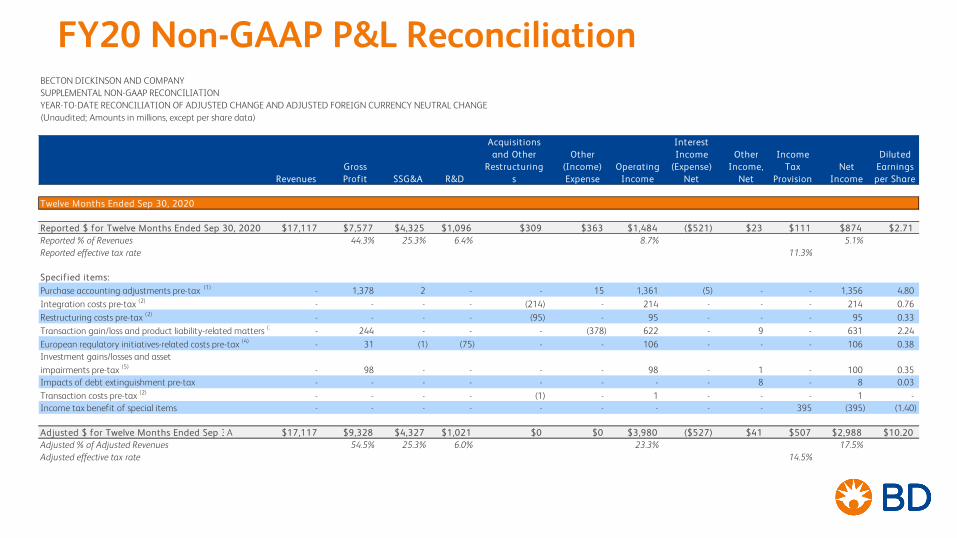
FY20 Non-GAAP P&L ReconciliationBECTON DICKINSON AND COMPANYSUPPLEMENTAL NON-GAAP RECONCILIATIONYEAR-TO-DATE RECONCILIATION OF ADJUSTED CHANGE AND ADJUSTED FOREIGN CURRENCY NEUTRAL CHANGE(Unaudited; Amounts in millions, except per share data)
RevenuesGross Profit SSG&A R&D
Acquisit ions and Other
Restructurings
Other (Income) Expense
Operating Income
Interest Income
(Expense) Net
Other Income,
Net
Income Tax
ProvisionNet
Income
Diluted Earnings
per Share
Twelve Months Ended Sep 30, 2020
Reported $ for Twelve Months Ended Sep 30, 2020 $17,117 $7,577 $4,325 $1,096 $309 $363 $1,484 ($521) $23 $111 $874 $2.71Reported % of Revenues 44.3% 25.3% 6.4% 8.7% 5.1% Reported effective tax rate 11.3%
Specified items:Purchase accounting adjustments pre-tax (1) - 1,378 2 - - 15 1,361 (5) - - 1,356 4.80 Integration costs pre-tax (2) - - - - (214) - 214 - - - 214 0.76 Restructuring costs pre-tax (2) - - - - (95) - 95 - - - 95 0.33 Transaction gain/loss and product liability-related matters (3 - 244 - - - (378) 622 - 9 - 631 2.24 European regulatory initiatives-related costs pre-tax (4) - 31 (1) (75) - - 106 - - - 106 0.38 Investment gains/losses and asset impairments pre-tax (5) - 98 - - - - 98 - 1 - 100 0.35 Impacts of debt extinguishment pre-tax - - - - - - - - 8 - 8 0.03 Transaction costs pre-tax (2) - - - - (1) - 1 - - - 1 - Income tax benefit of special items - - - - - - - - - 395 (395) (1.40)
Adjusted $ for Twelve Months Ended Sep 3 A $17,117 $9,328 $4,327 $1,021 $0 $0 $3,980 ($527) $41 $507 $2,988 $10.20Adjusted % of Adjusted Revenues 54.5% 25.3% 6.0% 23.3% 17.5%Adjusted effective tax rate 14.5%

FY20 Non-GAAP P&L ReconciliationBECTON DICKINSON AND COMPANYSUPPLEMENTAL NON-GAAP RECONCILIATIONYEAR-TO-DATE RECONCILIATION OF ADJUSTED CHANGE AND ADJUSTED FOREIGN CURRENCY NEUTRAL CHANGE(Unaudited; Amounts in millions, except per share data)
Twelve Months Ended Sep 30, 2019
Reported $ for Twelve Months Ended Sep 30, 2019 $17,290 $8,288 $4,332 $1,062 $480 $654 $1,760 ($627) $43 ($57) $1,233 $3.94Reported % of Revenues 47.9% 25.1% 6.1% 10.2% 7.1% Reported effective tax rate -4.8%
Specified items:Purchase accounting adjustments pre-tax (1) - 1,374 (8) - - - 1,382 (5) 122 - 1,499 5.46 Integration costs pre-tax (2) - 25 - - (298) - 323 - - - 323 1.18 Restructuring costs pre-tax (2) - - - - (180) - 180 - - - 180 0.66 Transaction gain/loss and product liability-related matters pre-tax (3) - - 11 - - (654) 643 - 3 - 646 2.35 European regulatory initiatives-related costs pre-tax (4) - 15 (4) (33) - - 51 - - - 51 0.19 Investment gains/losses and asset impairments pre-tax (5) - - - (30) - - 30 - (13) - 17 0.06 Impacts of debt extinguishment pre-tax - - - - - - - (5) 59 - 54 0.20 Hurricane-related (insurance proceeds) recovery costs pre-tax - - - - - - - - (24) - (24) (0.09) Transaction costs pre-tax (2) - - - - (1) - 1 - - - 1 - Income tax benefit of special items - - - - - - - - - 622 (622) (2.26)
Adjusted $ for Twelve Months Ended Sep 3 B $17,290 $9,701 $4,331 $999 ($0) $0 $4,372 ($637) $190 $565 $3,360 $11.68Adjusted % of Revenues 56.1% 25.1% 5.8% 25.3% 19.4%Adjusted effective tax rate 14.4%

FY20 Non-GAAP P&L ReconciliationBECTON DICKINSON AND COMPANYSUPPLEMENTAL NON-GAAP RECONCILIATIONYEAR-TO-DATE RECONCILIATION OF ADJUSTED CHANGE AND ADJUSTED FOREIGN CURRENCY NEUTRAL CHANGE(Unaudited; Amounts in millions, except per share data)
Twelve Months Ended Sep 30, 2020 versus Sep 30, 2019Adjusted $ change C=A-B ($173) ($374) $5 ($22) $0 $0 ($391) $110 ($149) $58 ($372) ($1.48)Adjusted % change D=C/B (1.0%) (3.9%) 0.1% (2.2%) - - (9.0%) 17.3% (78.3%) 10.3% (11.1%) (12.7%)
Foreign currency translation impact E ($168) ($103) $45 $3 $0 $0 ($56) ($1) $0 $8 ($48) ($0.17)
Adjusted foreign currency neutral $ change F=C-E ($5) ($270) ($41) ($25) $0 $0 ($336) $111 ($149) $50 ($324) ($1.31)Adjusted foreign currency neutral % change G=F/B (0.0%) (2.8%) (0.9%) (2.5%) - - (7.7%) 17.4% (78.4%) 8.9% (9.6%) (11.2%)
1. Includes amortization and other adjustments related to the purchase accounting for acquisitions impacting identified intangible assets and valuation of fixed assets and debt."2. Represents integration and restructuring costs associated with acquisitions. "3. Includes amounts recorded to Other operating expense, net to record product liability reserves, including related legal defense costs, of $378 million and $914 million in 2020 and 2019,
respectively. The amount in 2020 also includes a $244 million charge recorded to Cost of products sold related to the estimate of probable future product remediation costs. The amount in 2019 also includes the estimated cumulative costs of a product recall of $75 million recorded to Other operating expense, net, as well as the pre-tax gain of $336 million related to BD's sale of its Advanced Bioprocessing business which was recorded to Other operating expense, net."
4. Represents costs required to develop processes and systems to comply with emerging regulations such as the EUMDR and GDPR."5. Includes charges recorded in Cost of products sold and Research and development expense to write down the carrying values of certain assets. The amount in 2019 also includes an
unrealized gain recorded within Other income, net relating to an investment."

Net leverage reconciliation
32
BECTON, DICKINSON AND COMPANYRECONCILIATION OF NET INCOME (LOSS) TO NON-GAAP ADJUSTED EBITDA - UNAUDITEDAS OF SEPTEMBER 30, 2020(Amounts in millions)
Reported net income (loss) 874$
Depreciation and amortization expense 2,154 Interest expense 528 Provision for (benefit from) income taxes 111 Share-based compensation 244 Transaction and integration costs pre-tax (1) 215 Restructuring and other costs pre-tax (1) 60 Transaction gain/loss, product and other litigation-related matters pre-tax (2) 631 European regulatory initiative-related costs pre-tax (3) 106 Investment gains/losses and asset impairments pre-tax (4) 100 Impacts of debt extinguishment pre-tax 8
Adjusted EBITDA 5,030$
Short-Term Debt 707 Long-Term Debt 17,224 Less: Cash, Cash Equivalents and Short Term Investments (2,845) Net Debt 15,085$
Net Leverage (a) 3.0x
(a) Net Leverage is calculated by dividing Net Debt by Adjusted EBITDA
(1) Primarily represents integration, restructuring and transaction costs associated with acquisitions
(2) Includes amounts recorded to Other operating expense, net to record product liability reserves, including related legal defense costs, of $378 million. The amount also includes a $244 million charge recorded to Cost of products sold related to the estimate of probable future product remediation costs.
(3) Represents costs required to develop processes and systems to comply with emerging regulations such as the EUMDR and GDPR.
(4) Includes charges recorded in Cost of products sold and Research and development expense to write down the carrying values of certain assets.
Amounts may not add due to rounding

33
BD, the BD Logo and Crosser™, GlidePath™, Proxis™, Rotarex™, Securis™, SureStep™, BD VACUTAINER ACCUSTAT™, BD Alaris™, BD Aspirex™, BD Cathena™, BD COR™, BD FACSymphony™, BD FACSDuet™, BD HealthSight™, BD Horizon Brilliant™, BD Hylok™, BD Intevia™, BD Kiestra™, BD Libertas™, BD MAX™, BD Multiguard™, BD Onclarity™, BD PhaSeal™, BD PureWick™, BD Pyxis™, BD ROWA™, BD Synapsys™, BD Trek™, BD Veritor™, BD Vystra™, BD WaveLinQ™ are trademarks of Becton, Dickinson and Company. BodyGuard ColorVision™, T34™, BodyGuard 121 Twins™, BodyGuardQuadro™, MicroSets™, BodyValve™ and BodyComm™ are trademarks of Caesarea Medical Electronics Ltd. © 2021 BD and its subsidiaries. All rights reserved.