23.04.15 WINE 1/23 ¡ tHe WiNe ! How to make wine at home. HOME MADE WINE. By:N¡L.

Winning strategies in wine
Annual review 2012/2013Baarsma Wine Group Holding B.V.


3
Table of contents
5Management of the Group
6Key figures of the Group
7Mission, vision and strategic goals
15Report of the Board of Directors
19Financial overview
Consolidated balance sheet as of 31 March 2013 22
Consolidated profit and loss statement 2012/2013 24
Consolidated cash flow statement 2012/2013 25
26Contact information

BWGH
Baarsma Wine Group Holding (BWGH) is a worldwide wine distributor of quality wines with a fast growing distribution network in all sectors of the wine market in North-West Europe. Established some 30 years ago in the Netherlands, BWGH has evolved into one of the main players in the European wine market.

5
Management of the Group
Board of Directors
Cees de Rade CEO
Tjeerd van der Hoek RA CFO
Supervisory Board Members (through Veenwijk Holding B.V.)
Frans Barel Chairman
Paul Hugenholtz
Frank Trijbels
Corporate Management Team
Ronald van den Berg RA Group Finance Director
Nancy de Vries Corporate HR Manager
Martijn Brander Country Manager Netherlands
Rene Tulner Manager Business to Consumer
Management of the most important group companies
Netherlands Martijn Brander Country Manager
Age ten Brink Finance Manager
Roelof Speckmann Baarsma Wines B.V.
Marcel Campen Operations Manager
Chris Rabie Baarsma South Africa (Pty) Ltd
Christiaan Hintzen Oud Reuchlin & Boelen B.V.
Roelof Speckmann Wine Excel B.V.
Eric Welles Winetracks International B.V.
Ilja Gort La Tulipe Holding B.V.
Bence Nieland La Tulipe Holding B.V.
Business to Consumer Rene Tulner General manager
Matthieu Bletgen RA Finance manager
Annemijn Hofdijk Grand Cru Expertise ‘De Nederlandse Wijnbeurs’ B.V.
Ruud Heuvelmans Leon Colaris B.V.
Jacco Oosterhof Wijnvoordeel International B.V.
Belgium Michel Fryns Hasselt Millesime B.V.B.A.
Ann Marx Finance Manager
United Kingdom Mike Laing John Armit Wines Ltd
Graham Jeffs Finance Manager
Switzerland Christian Häberli Rutishauser Weinkellerei A.G.
Karin Koller Finance Manager
6Annual review 2012/2013baarsma wine group holding
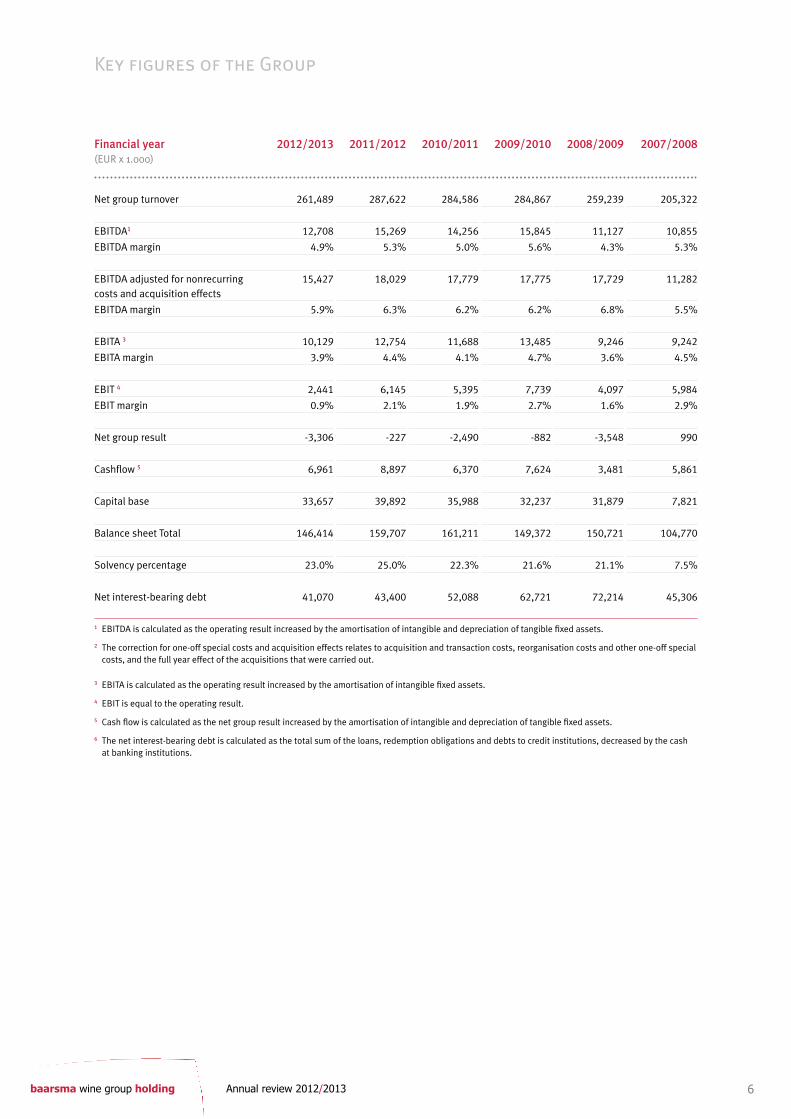
Key figures of the Group
Financial year (EUR x 1.000)
2012/2013 2011/2012 2010/2011 2009/2010 2008/2009 2007/2008
Net group turnover 261,489 287,622 284,586 284,867 259,239 205,322
EBITDA1 12,708 15,269 14,256 15,845 11,127 10,855
EBITDA margin 4.9% 5.3% 5.0% 5.6% 4.3% 5.3%
EBITDA adjusted for nonrecurring costs and acquisition effects
15,427 18,029 17,779 17,775 17,729 11,282
EBITDA margin 5.9% 6.3% 6.2% 6.2% 6.8% 5.5%
EBITA 3 10,129 12,754 11,688 13,485 9,246 9,242
EBITA margin 3.9% 4.4% 4.1% 4.7% 3.6% 4.5%
EBIT 4 2,441 6,145 5,395 7,739 4,097 5,984
EBIT margin 0.9% 2.1% 1.9% 2.7% 1.6% 2.9%
Net group result -3,306 -227 -2,490 -882 -3,548 990
Cashflow 5 6,961 8,897 6,370 7,624 3,481 5,861
Capital base 33,657 39,892 35,988 32,237 31,879 7,821
Balance sheet Total 146,414 159,707 161,211 149,372 150,721 104,770
Solvency percentage 23.0% 25.0% 22.3% 21.6% 21.1% 7.5%
Net interest-bearing debt 41,070 43,400 52,088 62,721 72,214 45,306
1 EBITDA is calculated as the operating result increased by the amortisation of intangible and depreciation of tangible fixed assets.
2 The correction for one-off special costs and acquisition effects relates to acquisition and transaction costs, reorganisation costs and other one-off special costs, and the full year effect of the acquisitions that were carried out.
3 EBITA is calculated as the operating result increased by the amortisation of intangible fixed assets.
4 EBIT is equal to the operating result.
5 Cash flow is calculated as the net group result increased by the amortisation of intangible and depreciation of tangible fixed assets.
6 The net interest-bearing debt is calculated as the total sum of the loans, redemption obligations and debts to credit institutions, decreased by the cash at banking institutions.

7 Annual review 2012/2013 baarsma wine group holding
Structure of the Group
31 March 2013
Profile
Baarsma Wine Group Holding (BWGH) is a worldwide wine distributor of quality wines with a fast growing
distribution network in all sectors of the wine market in North-West Europe. With its refreshing philosophy and
innovative approach, BWGH seeks to make a difference in the competitive world of wines, combining a focus on
results with an informal company culture.
The Group is the leading distributor of wines in the Netherlands, realised by several specialised business units
operating in each channel of the Dutch wine market. Typical of the organisation is the independent status of
every business unit. By combining the forces of the total Group a unique wine strategy and market approach is
realised.
By means of autonomous growth and acquisition, the Group will expand its position even further over the
coming years. The basis for growth is a ratio of profitability that is sufficient to guarantee the continuity of the
Group.
Mission, vision and strategic goals
Holding
Armit Wines Hasselt MillesimeBaarsma Wines
Oud Reuchlin & Boelen
Wine Excel
Wijnvoordeel
Leon Colaris
Wijnbeurs
94 Wines
Baarsma South Africa
Winetracks
Rutishauser
B2CNetherlands
United Kingdom Belgium Switzerland

8Annual review 2012/2013baarsma wine group holding
Mission of the Group
The corporate objective is to become the first choice provider of basic and premium wines in North-West
Europe, to strengthen our market position in this region by selling qualitative wines via dedicated people
and by expanding our distribution network.
In doing so, our ambition is to achieve a sustainable growth in both turnover and in profit to maximise
shareholders’ value.
Core ideologies
• Focus on consumers and brands
• To turn every customer into a friend
• Excellence in reputation, work with passion
• Focus on execution, walk while you talk
• Be in partnership with employees
• Honesty, integrity and ethics in all aspects of business
Group Strategy
• Expanding our distribution network in North-West Europe, especially in Business to consumer
• Maintaining and reinforcing the Group’s competitive position
• Strengthening our position as a partner and preferred supplier for important clients
• Positioning the Group as an ideal partner for brand owners
• Responding quickly to developments in the international market
• Reducing our dependence on certain markets and product groups
Mission, vision and strategic goals


Our Approach

11 Annual review 2012/2013 baarsma wine group holding
Business to Consumer Wijnvoordeel
Our approach is characterised by considerable investments in the Business to Consumer market in North-West
Europe. We have several labels and different propositions on the market. Wijnvoordeel is one of the most
successful labels within the Business to Consumer segment.
Within Baarsma, Wijnvoordeel specialises in the sale of wine through the internet. In 1999, Wijnvoordeel was
the first Dutch wine web shop. Recent years have seen a sensational expansion of Wijnvoordeel as a joint
effort with Baarsma, allowing it to take the leading position in the online sale of wine. Currently Wijnvoordeel
is among the 50 largest internet companies in The Netherlands. A unique achievement for a company that
specialises in wine, especially given the fact that we have to compete with players such as Wehkamp, Bol and
Zalando.
Our strength is to combine a passion for wine with a highly efficient e-commerce approach. Year on year,
innovations quickly follow each other. We maintain a continuous search for the most commercially viable wines,
which we then offer through, for example, the internet, e-mail and social media by means of high-profile
campaigns. Each customer is specifically targeted and his or her every wish catered to. This means that we do
not follow the latest trends but, rather, set them.
Thanks to its spectacular growth, Wijnvoordeel now represents a number of leading brands. Casa Safra is an
excellent example of this, but Queensland Cellars, Skoonuitsig and Pierre Baptist are also extremely popular
with the wine-buying consumer. This year, Wijnvoordeel has once again set the trend with the launch of
Goldish Noir, a red bubbly! The first wine reviewers are calling it the wine sensation of 2013.
The success of Wijnvoordeel has not been limited to the Netherlands. Both Germany and Belgium are already
showing spectacular growth results. Additionally, the innovative know-how of Wijnvoordeel is also used for
other Business Units within Baarsma. The online sale of wine opens up possibilities for the future and we are
particularly proud of the pioneering role of Baarsma in realising these possibilities.
03/04
30,000,000Turnover in Euros
Euro
25,000,000
20,000,000
15,000,000
10,000,000
5,000,000
004/05 05/06 06/07 07/08 08/09 09/10 10/11 11/12 12/13
Date

12Annual review 2012/2013baarsma wine group holding
UNITED KINGDOM
REST OF EUROPE
REST OF THE WORLD
SWITZERLAND
FRANCE
GERMANY
NETHERLANDS
BELGIUM AND LUXEMBOURG
167,8
23,2
6,7
33,2
6,0
30,6
1,2
18,9
Division of Turnover per country
Below, the division of turnover has been represented according to country, channel and brand. It shows the
long-term group strategy of growth in B2C and the growth in the sale of brands. In 2012/13, the upward trend
of increased turnover in B2C and brands was interrupted, in particular due to a drop in sales of Bordeaux wines.
It is expected for 2013/14 that the increase in these segments will return. It is also the Group’s ambition to
spread turnover over several countries. This strategy allows us to reduce the Group’s vulnerability. Additionally,
the growth in B2C and brands will result in increased and permanent profitability.
Geographically
(numbers in EUR x mln)
2012/2013 2011/2012 2010/2011 2009/2010
Netherlands 161,0 167,8 177,5 184,6
United Kingdom 21,8 33,2 36,1 29,5
Belgium & Luxembourg 27,3 23,2 19,4 17,5
Switzerland 28,5 30,6 29,1 26,7
France 0,9 1,2 1,1 3,8
Germany 4,9 6,0 3,5 3,4
Rest of Europe 5,1 6,7 4,9 6,4
Rest of the world 11,9 18,9 12,4 13,0
Total 261,4 287,6 284,0 284,9

13 Annual review 2012/2013 baarsma wine group holding
Turnover per channel
Channels 2012/2013 2011/2012 2010/2011 2009/2010
Retail
Specialist
Catering
Other B2B
B2C
38%
7%
16%
12%
27%
37%
6%
16%
13%
29%
39%
5%
14%
14%
27%
43%
5%
14%
18%
20%
Total 100% 100% 100% 100%
%
Channels 2012/2013 2011/2012 2010/2011 2009/2010
Brands 35% 42% 37% 39%
Other 65% 58% 63% 61%
Total 100% 100% 100% 100%
50
40
30
20
10
0
B2C
B2B
2010/20112011/20122012/2013 2009/2010
90
100
80
70
60
50
40
30
20
10
0
Brands
Other
35
42
37
39
65
58
63
61
11/1212/13 09/1010/11
Channels
Retail
Turnover ratio
Catering
Specialist
15 Annual review 2012/2013 baarsma wine group holding
General
For Baarsma Wine Group, the year under review 2012/13 was strongly influenced by the wine harvests in
Europe. Italy saw the worst harvest in over 60 years, which meant that the quantity of available wine was
drastically reduced and consequently wine prises rose by more than 20%. This had a significant impact on the
cost price of the Group’s largest brand: Canei. In an effort to limit the price increase for the consumer, it was
decided that we would pay a large part of the increased cost price ourselves. This naturally did put pressure on
the Group’s results. Furthermore, the quality of the Bordeaux harvest 2011 paled in comparison to the excellent
years of 2009 and 2010. This meant that Armit’s En-Primeur Campagne 2011 was considerably smaller in
comparison to previous years and the trade in older Bordeaux years declined drastically. The subsequent
decline, therefore, was considerable compared to last year.
On the positive side, Baarsma Wine Group was highly successful in the expansion of its B2C-activities in the
Netherlands, Belgium, Germany & Switzerland. In the B2C segment, both turnover and profitability increased
significantly. Wijnvoordeel managed to strengthen its leading position on the Dutch market and now ranks 45 in
the Twinkle top 100, the list of the largest internet companies in the Netherlands. The turnover of Wijnvoordeel
in Belgium and Germany increased significantly (by 19 %). In addition, the reorganisation of De Wijnbeurs was
completed in 2012 and De Wijnbeurs made a strong contribution to the growth of the results in B2C, in both
the Netherlands and Belgium.
The influence of the European financial crisis and the corresponding low consumer confidence was especially
felt in the Netherlands. The consumer kept a tight rein on the purse strings, which had a negative effect on
the margin mix. Consumers are price conscious. They buy cheaper wines at the supermarket or discount
wine store. In the catering industry, wine is increasingly sold per glass rather than per bottle. B2C, too, saw a
decrease in the average order size. In Switzerland, too, the market was under pressure, in particular due to the
decline in tourism resulting from the strong Swiss Franc, which has made Switzerland A relatively expensive
country to spend your holiday.
The group has implemented reorganisations at various locations within the Group in an effort to make the
company more efficient. This mainly involved combining back-offices and reducing overhead costs. The
corresponding reorganisation costs amounted to € 2.1 mln and the expected annual savings also amounted to
€ 2.1 mln.
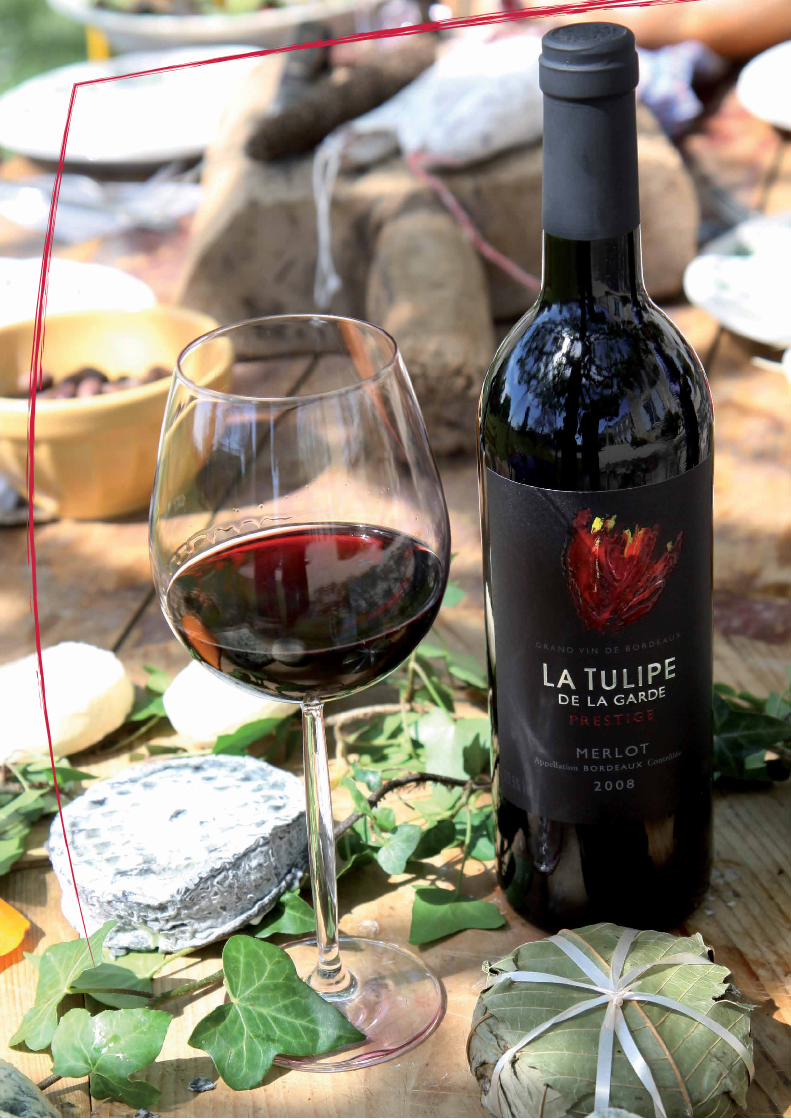
The sale of the wines of La Tulipe, the most recent acquisition, increased by more than 10% in the year under
review. In light of the circumstances mentioned above, this is a truly remarkable performance. Consequently,
the acquisition did not fall short of expectations. The introduction of the new Slurp! wines also proved to be
highly succesful. A further strong increase in turnover of La Tulipe & Slurp! is expected for the coming years.
Against the background of the challenging market circumstances described above, the results of the Group are
satisfactory. In the year under review, the position in B2C was further expanded and the market share in the
on-trade industry increased. Despite the poor harvests and the general low consumer confidence, the Group’s
profitability remained largely the same, thus providing a solid foundation for profit recovery in 2013/2014.
Report of the Board of Directors


17 Annual review 2012/2013 baarsma wine group holding
Results
The results of the Group have decreased in comparison to last year. A turnover of € 261 mln was realised in
the year under review. A decrease of over € 26 mln, caused mainly (€ 20 mln) by the lower sales of Bordeaux
wines at Armit and the cancellation of two large wine contracts with retailers with a very low gross margin.
Additionally, the growth in turnover at B2C, La Tulipe and Hasselt Millesime and the lower turnover in the
on-trade Industry balanced each other out.
The EBITDA in particular was negatively influenced by the lower Bordeaux sales at Armit and increased pressure
on the margins within retail, especially because of the higher cost prices that could not be completely passed on
to the retailers. The margin pressure on Canei was the largest negative contributor here. The contribution from
the on-trade Industry (Oud Reuchlin & Boelen and Rutishauser) declined in comparison to last year.
The strong performance of Wijnvoordeel and Wijnbeurs had a positive influence on the EBITDA and Hasselt
Millesime (strong growth of Cava MVSA) and La Tulipe also contributed to the growth of the EBITDA.
An EBITDA of € 12.7 mln has been reported in the Financial Overview. This is after the deduction of € 2.7 mln
non-recurring costs. In particular, these costs include integration and reorganisation costs. Major items include
the combining of the customer contact centres of Wijnvoordeel and Wijnbeurs in Gorredijk, along with the
provision for the lease obligations of the former head office in Oudeschoot. The consolidated profit and loss
account closes with a net loss of € 3.3 mln. In the previous year under review, the net loss amounted to
€ 0.2 mln.
On pages 12 and 13, the division of turnover has been represented according to country, channel and brand.
It shows the long-term group strategy of growth in B2C and the growth in the sale of brands. In 2012/13, the
upward trend of increased turnover in B2C and brands was interrupted, in particular due to the aforementioned
drop in sales of Bordeaux wines. For 2012/2013, turnover in Switzerland has been reported as other turnover.
This means that a decrease has been reported in the ‘brands’ share. When corrected for this adjustment, the
division brand/other would have been 40%/60%.
Financial year(numbers in EUR x mln)
2012/13 2011/12
Reported net result -3,3 -0,2
Add: result of the participations (no tax effect) 0,7 -0,2
Add: non-recurring costs (after 25% taxes) 2,0 1,7
Add: goodwill amortisation (no tax deduction) 3,3 3,5
Add: interest charges shareholders’ loan (after 25% taxes) 0,4 0,4
Add: impairment IT systems (after 25% taxes) 0,6 -
Net Operational Result 1 3,7 5,2
This overview shows that the company shows good profitability, although the chosen financing structure
(shareholders’ loans instead of equity), the acquisition strategy and the resulting amortisation of goodwill
(the goodwill is basically maintained given the results of the company) and the non-recurring costs have put
the net result under pressure.
1) Net Operational Result is a concept that is not recognised under generally accepted Dutch accounting principles. It involves the reported net result, adjusted for normalisation items, amortised goodwill and interest charges for the subordinated shareholder’s loan. Normalisation items are income or expenditure that results from certain events or transactions that are part of normal business operations, but which must be adjusted in the reported net result because of their nature, volume or incidental occurrence. This is done in order to offer insight into the EBITDA and, more specifically, the EBITDA development.
Report of the Board of Directors

18Annual review 2012/2013baarsma wine group holding
Investments
Intangible fixed assets
This item consists of goodwill, intellectual property rights, operational software and customer bases.
Because of a release of part of the goodwill reported in the previous year and amortisation amounting to
€ 3.2 mln, the item goodwill was reduced by a total of € 3.5 mln in the year under review. € 2.2 mln was
invested in intellectual property rights in the financial year. This mainly involved investments in the acquisition
of customer bases for the B2C branch and the purchase of new software. The amortisation of intellectual
property rights amounted to € 4.6 mln, so that this item was reduced by € 2.3 mln on balance.
Tangible fixed assets
In the financial year, approximately € 1 mln (2011: € 1.4 mln) was invested in tangible fixed assets. This
involved approximately € 0.4 mln of investments at Rutishauser in new machines as well as shop fixtures and
fittings. The amortisation amounted to approximately € 2.6 mln, so that the item tangible fixed assets was
reduced by approximately € 1.7 mln on balance.
Financial fixed assets
This item was reduced by approximately € 0.9 mln, which was mainly caused by lower deferred tax assets.
Operating Capital
Managing working capital control continues to be a focus point within the group. Because of the extensive
product range and the long supply lines from the wine-producing countries, it is of importance that the right
balance has to be found in terms of stock. On the one hand, timely delivery is essential for the company
but, on the other hand, too much stock means higher storage costs, less credit facilities and an increased
risk of obsolete stock. Compared to last year, stock was reduced by EUR 1.6 mln. Stock management, and
consequently the reduction of working capital, have top priority within the group. The business units are
strongly focused on improving the cash-conversion cycle. This cycle is measured continually and targets have
been agreed upon with the management of the business units to improve it even further. The following three
elements are relevant here:
1 Improving the rate of stock turnover
2 Constant credit management to keep the debtor position as low as possible
3 Optimising the terms of payment to our suppliers
The ratios of these three working capital aspects are as follows:
Financial Year 2012/13 2011/12
Stock Days 74 69
Debtor Days 47 47
Creditor Days 113 112
Report by the Board of Directors

19 Annual review 2012/2013 baarsma wine group holding
Debts to participants
Baarsma Wine Group Holding B.V. is a fully-owned subsidiary of Veenwijk Holding B.V. The equity that is
required to finance the Group’s acquisitions has been raised by Baarsma Wine Group’s parent company,
Veenwijk Holding B.V. The debt to the shareholders decreased due to the repayments that were made.
The total debt to the shareholder amounted to € 5.8 mln at the end of the financial year, which has been
fully subordinated and included in the bank guarantee capital of Baarsma Wine Group Holding B.V.
Net interest-bearing debt
The Group aims to structurally reduce the net interest-bearing debt, in order to be less vulnerable to
fluctuations in the interest and credit markets. In the financial year, the net debt position improved from
€ 43.4 mln to € 41.1 mln. Additionally, the purchase price for the acquisition of La Tulipe was paid in the
financial year.
Financial Instruments
Because of our foreign group companies, the Swiss Franc, the British Pound and South-African Rand are
important to the Group. Fluctuations in these currencies have caused changes in the foreign currency value
of the assets and liabilities of the Group compared to the Euro. Additionally, the American Dollar and the
Australian Dollar are currencies that are relevant to us because of our business activities. When buying and
selling, it is our policy to cover exchange rate risks as soon as they occur. To this end, our policy is to use
forward exchange contracts and option structures.
Given the Group’s financing structure, the interest charges are a significant cost item. Debts to credit
institutions are based on variable interest rates. In order to protect itself against large fluctuations in the
financial markets for the medium term, the Group has covered a large part of its interest-bearing debts with
interest swaps and option structures/interest caps.
In order to protect itself against credit risks, the Group has covered a large part of our debtor positions.
Given the nature of the debtors, it is not possible to insure the amounts owed by consumers. Our other debtor
positions are usually covered by our credit insurance.
The Groups uses a cash pool as protection against the liquidity risk. Given the diversity of our clients and the
agreements we have made with them, it will be fairly easy to predict the incoming cash flow. The liquidity
prognoses are consequently reliable, allowing the Group to manage the liquidity risk.
Market Developments
Wine consumption also showed a very small increase this past year. The decrease of the volumes in the
on-trade industry was counterbalanced by increased volumes in retail and B2C. Prices were put under pressure
by a shift in demand for cheaper wines. On the other hand, excise duty increases in the Netherlands, Belgium
and the United Kingdom and the cost price increases in the wine-producing countries pushed the prices up.
On balance, the average price per bottle in retail in the Netherlands stabilised around € 3.
For the next year, the Group expects a moderate development in volume and turnover. The turnover in the
on-trade industry will continue to be under pressure and will slightly increase in retail and B2C. Restoring
consumer confidence is of paramount importance when it comes to boosting the long-term positive trend
towards increased wine volumes and wine prices.
Report of the Board of Directors

20Annual review 2012/2013baarsma wine group holding
Quality
Within the Group, the concept of ‘quality’ is of paramount importance. All the wines marketed by the group
are subject to permanent quality control, using highly reputable external laboratories. Next to quality control,
great value is attached to the quality of the organisation. Various group companies have the appropriate ISO
certificates. Wine Excel and Baarsma Wines have the prominent ‘higher-level’ BRC certificate, which indicates
that our quality has also been independently reviewed.
Future Developments
Personnel and Organisation
The average number of employees decreased from 378 to 372 in the financial year. This means a decrease of
5 employees compared to last year.
Employees are key to the success of the Baarsma Wine Group. They work on the company’s continued growth
every day with passion and customer-focus. Using management development programmes, wine courses and
practical training courses, the Group continues to invest in the personal development of all its employees and,
consequently, in the growth of its organisation.
It is expected that the workforce will also decrease slightly in 2013/2014. In the next financial year, the focus
will be on a further roll-out of talent management.
Investments
Baarsma Wine Group is always looking for suitable acquisition candidates who will blend in with the Group’s
strategy. Using an accurate analysis of the markets in our target area, North-West Europe, the Group
has gained a precise insight into which acquisitions it should make and is now actively approaching these
companies.
Any acquisitions which might result from this could considerably influence the development of the balance sheet
and the profit & loss account.
When financing acquisitions, the Group’s aim is not to raise the leverage-ratio and to apply a financing structure
in which equity and external debts are combined. Additionally, the Group will continue to invest in the further
expansion of the B2C activities in order to boost the autonomous growth of these activities even further.
Report by the Board of Directors

21 Annual review 2012/2013 baarsma wine group holding
Liquidity and Solvency
During the financial year, our solvency decreased slightly from 25% to 23%. The subordinated bank loans from
participants have been included in the solvency calculation. The Group expects a slight increase in solvency
during the next year.
Apart from new acquisitions, the net interest-bearing debt will decrease, which is in line with the agreements
made with the banks.
Expected Turnover and Result
Based on the current market circumstances, the objective for 2013/2014 is to achieve an improvement of the
turnover and the EBITDA of the Group.
Huizen, 20 June 2013
The Board of Directors
On behalf of Alta Beheer B.V. On behalf of Hoeksterpoort Holding B.V.
Cees de Rade Tjeerd van der Hoek RA
Managing Director Managing Director
Ronald van den Berg RA
Managing Director
Report of the Board of Directors

22Annual review 2012/2013baarsma wine group holding
Consolidated balance sheetas of 31 March 2013
(before appropriation of result)
A s s e t s 2013 / EUR x 1.000 2012 / EUR x 1.000
Fixed assets
Intangible fixed assets
Goodwill 37,412 40,865
Intellectual property rights 14,947 17,233
52,359 58,098
Tangible fixed assets
Land and buildings 178 211
Equipment, fixtures and fittings 3,995 4,929
Other fixed assets 1,981 2,693
6,154 7,833
Financial fixed assets
Non-consolidated participations 1,025 1,088
Loans to non-consolidated participations 7 0
Deferred tax assets 3,016 3,828
Other receivables 350 409
4,398 5,325
CURRENT ASSETS
Inventories
Finished goods and goods for resale 39,649 41,144
Prepayments on inventories 2,246 2,324
41,895 43,468
Receivables
Trade receivables 29,077 29,863
Receivables on non-consolidated participations 519 938
Corporate income tax 644 358
Other receivables 1,435 3,149
Prepayments and accrued income 2,311 1,936
33,986 36,244
Cash 7,622 8,739
146,414 159,707
* The above figures were derived from the Financial Statement 2012/2013 of Baarsma Wine Group Holding B.V., on which Deloitte Accountants B.V. issued an unqualified auditor’s report dated 20 June 2013.

23 Annual review 2012/2013 baarsma wine group holding
Consolidated balance sheetas of 31 March 2013
(before appropriation of result)
E q u i t y & L i a b i l i t i e s 2013 / EUR x 1.000 2012 / EUR x 1.000
Group equity
Legal entity share in group equity 19,968 23,756
Third-party share in group equity 7,889 7,698
27,857 * 31,454 *
Provisions
VUT, pension and anniversary provisions 73 123
Deferred tax liabilities 4,210 4,744
Provision for warranties 27 27
Reorganisation 37 80
Other 950 471
5,297 5,445
Long-term liabilities
Loans from shareholders 5,800 * 8,438 *
Amounts owed to banks 34,374 24,993
40,174* 33,431
Current liabilities
Amounts owed to banks 2,551 14,468
Current portion of long-term liabilities 5,967 4,240
Trade creditors 43,720 40,930
Taxes and social security charges 10,349 12,531
Debts to non-consolidated participations 53 552
Debts to participants 2,724 7,539
Other liabilities and accruals 7,722 9,117
73,086 89,377
146,414 159,707
* Capital base to the banks 33,657 39,892
* The above figures were derived from the Financial Statement 2012/2013 of Baarsma Wine Group Holding B.V., on which Deloitte Accountants B.V. issued an unqualified auditor’s report dated 20 June 2013.

24Annual review 2012/2013baarsma wine group holding
Consolidated profit and loss accountover 2012/2013
2012-2013 / EUR x 1.000 2011-2012 / EUR x 1.000
Net turnover 261,489 287,622
Change in inventories of finished goods -1,573 2,343
Total operating income 259,916 289,965
Costs of raw materials and consumables 186,018 214,917
Costs of subcontracted work and other external costs 20,276 18,816
Wages and salaries 21,914 23,112
Social security costs 4,016 4,096
Depreciation and amortisation of intangible and tangible fixed assets 10,161 9,124
Special value adjustments in respect of intangible and tangible fixed asset 106 0
Other operating expenses 14,984 13,755
Total operating expenses 257,475 283,820
Operating result 2,441 6,145
Financial income and expenses -4,881 -5,205
Result before taxation -2,440 940
Taxation on result of ordinary activities -300 -841
Result from participations -681 164
Consolidated result after taxation -3,421 263
Third-party share 115 -490
Result of the legal entity -3,306 -227
* The above figures were derived from the Financial Statement 2012/2013 of Baarsma Wine Group Holding B.V., on which Deloitte Accountants B.V. issued an unqualified auditor’s report dated 20 June 2013.

25 Annual review 2012/2013 baarsma wine group holding
Consolidated cash flow statement2012/2013
(indirect method) 2012-2013 / EUR x 1.000 2011-2012 / EUR x 1.000
Cash flow from operating activities
Operating result 2,441 6,145
Depreciation and other changes in value 10,267 9,124
Acquisition of non-consolidated participations -148 1,537
10,119 10,661
Changes in working capital
Movement in provisions 1,573 -2,341
Accounts receivable 2,544 4,728
Current liabilities -6,119 -5,086
-2,002 -2,699
Cash flow from business activities 10,558 14,107
Interest received 317 691
Dividend received 0 5,646
Corporate income tax -586 -841
-269 5,496
Cash flow from operating activities 10,289 19,603
Cash flow from investment activities
Investments in intangible fixed assets -2,278 -2,836
Disposals of intangible fixed assets 167 260
Investments in tangible fixed assets -952 -1,367
Disposals of tangible fixed assets 0 14
Acquisition of group companies 0 96
Acquisition of non-consolidated participations 357 -5
Investments in other financial fixed assets -990 -4,610
Disposals of financial fixed assets 871 493
Cash flow from investment activities -2,825 -7,955
Cash flow from financing activities
Movements in third-party share capital 306 68
Capital contribution shareholders 0 3,198
Redemption of short-term amounts owed to banks -11,917 -4,773
Withdrawal / redemption long-term debts 8,719 -4,337
Interest expenses -5,200 -5,880
Cash flow from financial activities -8,092 -11,724
Exchange rate results -489 510
Net cash flow(= change in net cash position)
-1,117 434
Net cash position at the start of the financial year 8,739 8,305
Net cash position at the end of the financial year 7,622 8,739
Net cash movement -1,117 434
* The above figures were derived from the Financial Statement 2012/2013 of Baarsma Wine Group Holding B.V., on which Deloitte Accountants B.V. issued an unqualified auditor’s report dated 20 June 2013.

26Annual review 2012/2013baarsma wine group holding
Contact Information
Baarsma Wine Group Holding
Zwaardklamp 14
1271GK Huizen
T +31 (0) 35 626 1270
F +31 (0) 35 626 1271
www.baarsmawinegroup.com
Colofon
Design Miazo
www.miazo.com
Baarsma Wine Group Holding © 2013. All rights reserved.


www.baarsmawinegroup.com
Baarsma Wine Group Holding (BWGH)
is a worldwide wine distributor of
quality wines with a fast growing
distribution network in all sectors
of the wine market in North-West
Europe.
With its refreshing philosophy
and innovative approach, BWGH
seeks to make a difference
in the competitive world of
wines, combining a focus
on results with an informal
company culture.