Annual results 2018 · Capex plan in motorways, extension of Dakar motorway, Adelac acquisition PPP...
83
Annual results 2018 27 th February 2019
Transcript of Annual results 2018 · Capex plan in motorways, extension of Dakar motorway, Adelac acquisition PPP...

Annual results 201827th February 2019
2016-2020 strategic plan deployment and highlights
Benoît de Ruffray
Chairman and Chief Executive Officer
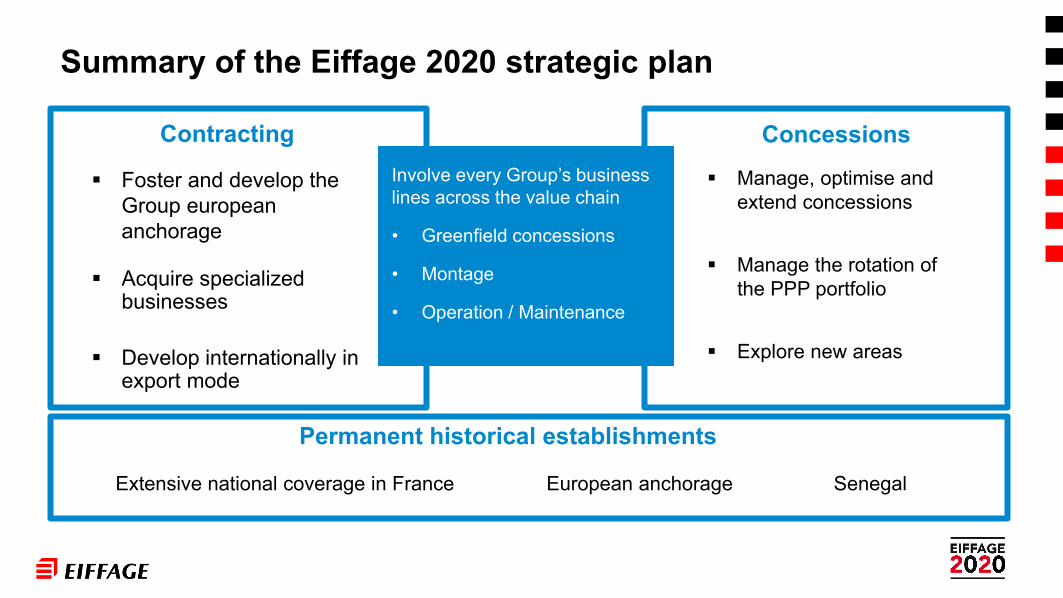
Contracting
Foster and develop the Group europeananchorage
Acquire specialized businesses
Develop internationally in export mode
Summary of the Eiffage 2020 strategic plan
Concessions Manage, optimise and
extend concessions
Manage the rotation of the PPP portfolio
Explore new areas
Involve every Group’s business lines across the value chain
• Greenfield concessions
• Montage
• Operation / Maintenance
Permanent historical establishments
Extensive national coverage in France European anchorage Senegal
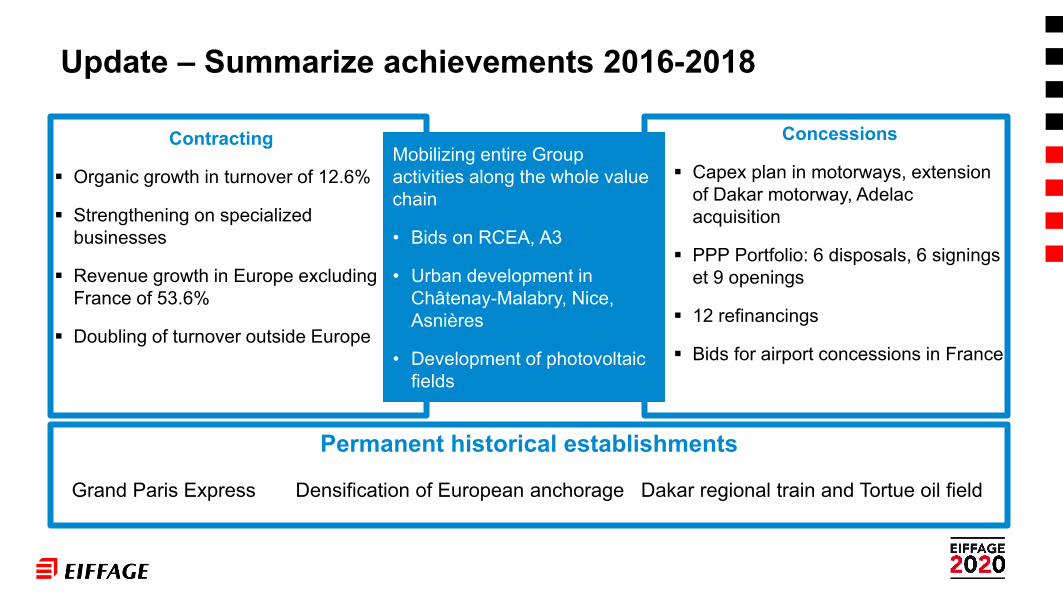
Contracting
Organic growth in turnover of 12.6%
Strengthening on specialized businesses
Revenue growth in Europe excludingFrance of 53.6%
Doubling of turnover outside Europe
Update – Summarize achievements 2016-2018
Concessions
Capex plan in motorways, extension of Dakar motorway, Adelacacquisition
PPP Portfolio: 6 disposals, 6 signings et 9 openings
12 refinancings
Bids for airport concessions in France
Permanent historical establishments
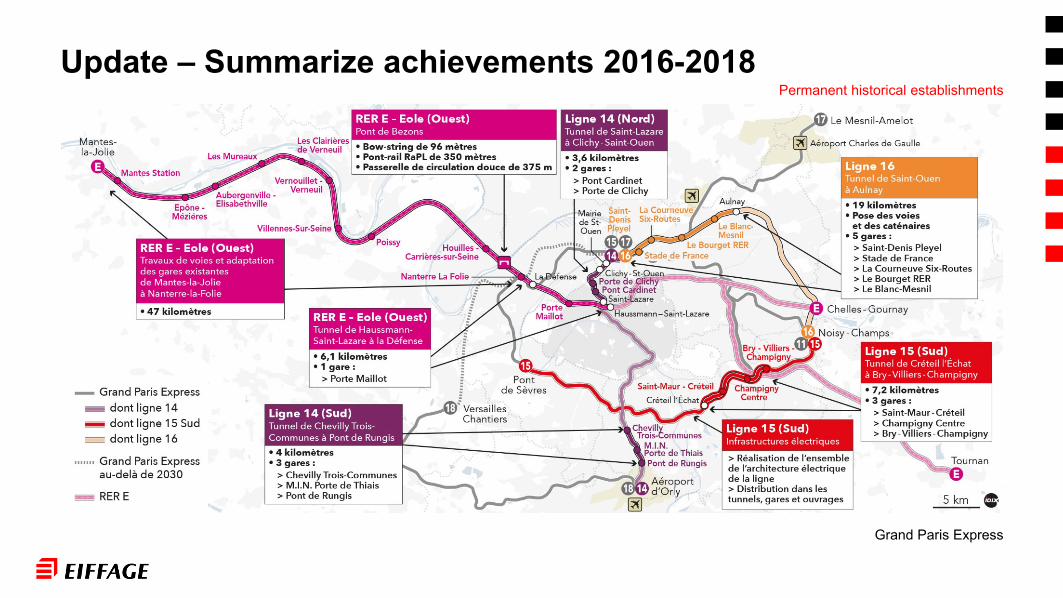
Grand Paris Express
Mobilizing entire Group activities along the whole value chain
• Bids on RCEA, A3
• Urban development in Châtenay-Malabry, Nice, Asnières
• Development of photovoltaic fields
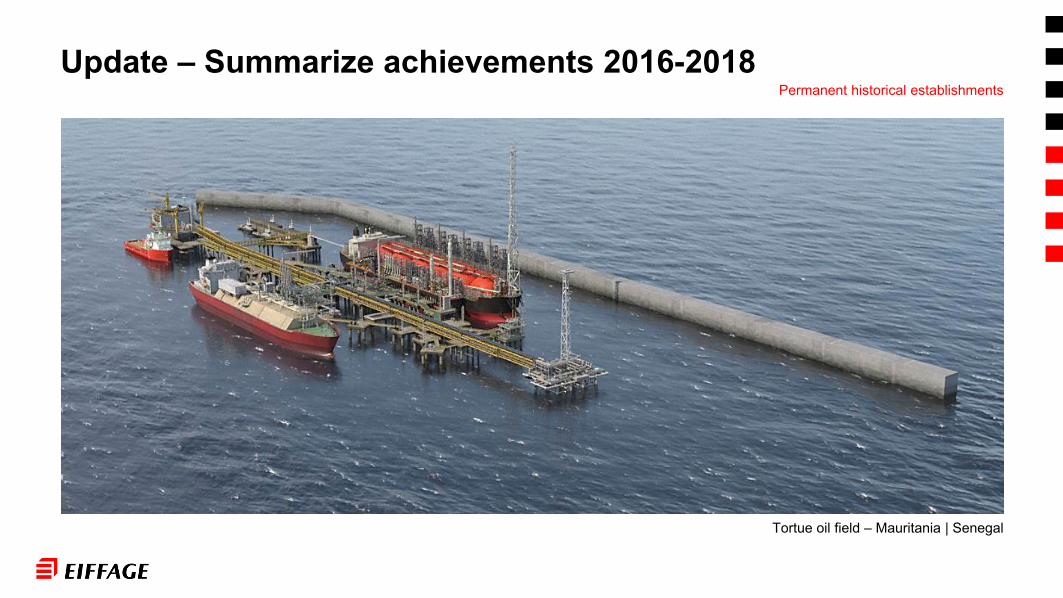
Dakar regional train and Tortue oil field Densification of European anchorage
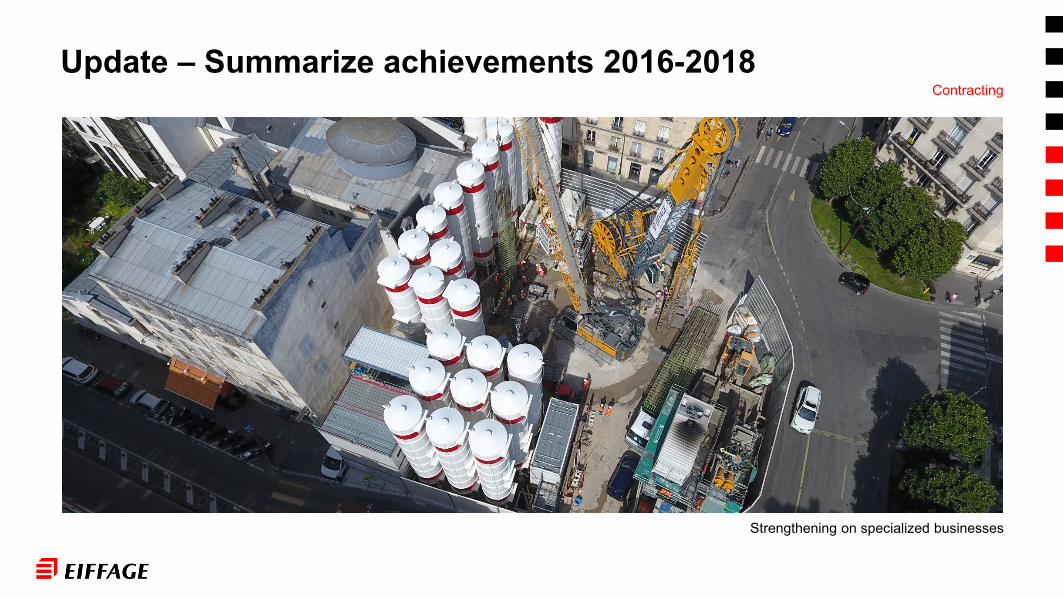
Update – Summarize achievements 2016-2018
Strengthening on specialized businesses
Contracting

Update – Summarize achievements 2016-2018
Doubling of turnover outside Europe
Contracting

Bid on RCEA - France
Update – Summarize achievements 2016-2018

Update – Summarize achievements 2016-2018
Bid on A3 - Germany

Update – Summarize achievements 2016-2018
Urban development in Châtenay-Malabry

Update – Summarize achievements 2016-2018
Development of photovoltaic fields
Huatacondo photovoltaic field- Chile
Update – Summarize achievements 2016-2018
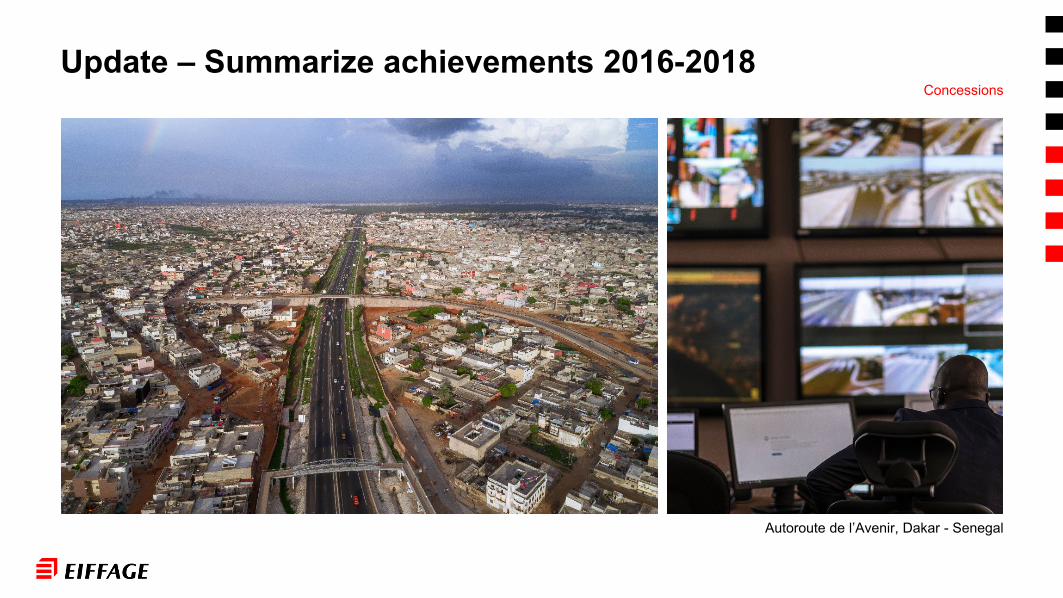
Autoroute de l’Avenir, Dakar - Senegal
Concessions

Update – Summarize achievements 2016-2018
Dakar regional train - Senegal
Permanent historical establishments
Update – Summarize achievements 2016-2018
Tortue oil field – Mauritania | Senegal
Permanent historical establishments
Update – Summarize achievements 2016-2018Permanent historical establishments
Grand Paris Express

Summarize achievements 2016-2018: external growth

Summarize achievements 2016-2018: export
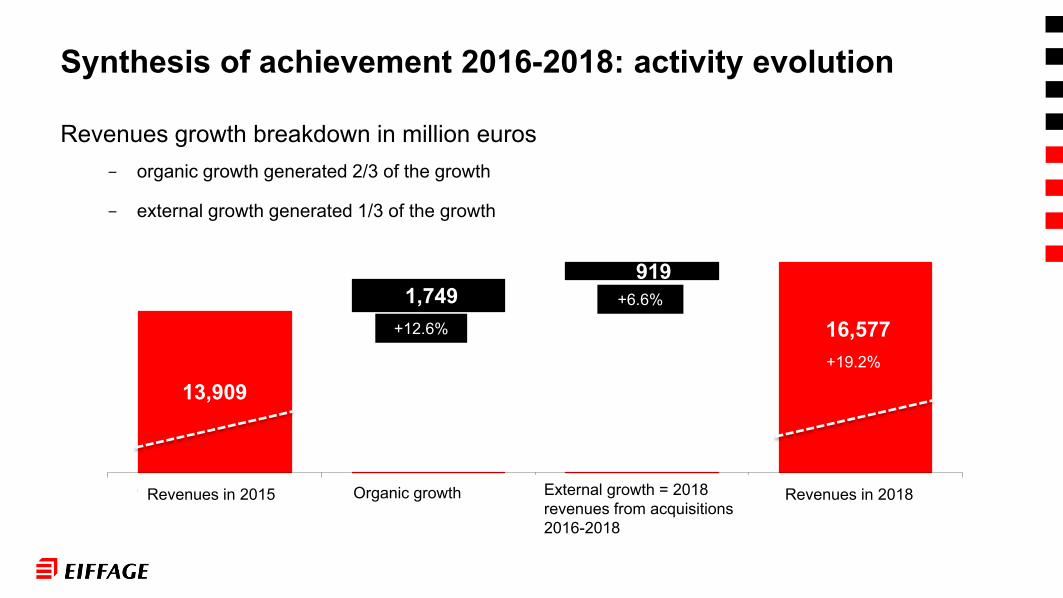
13,909
16,5771 749
919
Chiffre d'affaires 2015 Croissance organique Croissance externe= Chiffre d'affaires 2018 des
acquisitions 2016 - 2018
Chiffre d'affaires 2018
Revenues growth breakdown in million euros- organic growth generated 2/3 of the growth
- external growth generated 1/3 of the growth
Synthesis of achievement 2016-2018: activity evolution
+12.6%
+6.6%
+19.2%
1,749
Revenues in 2015 Organic growth External growth = 2018 revenues from acquisitions 2016-2018
Revenues in 2018
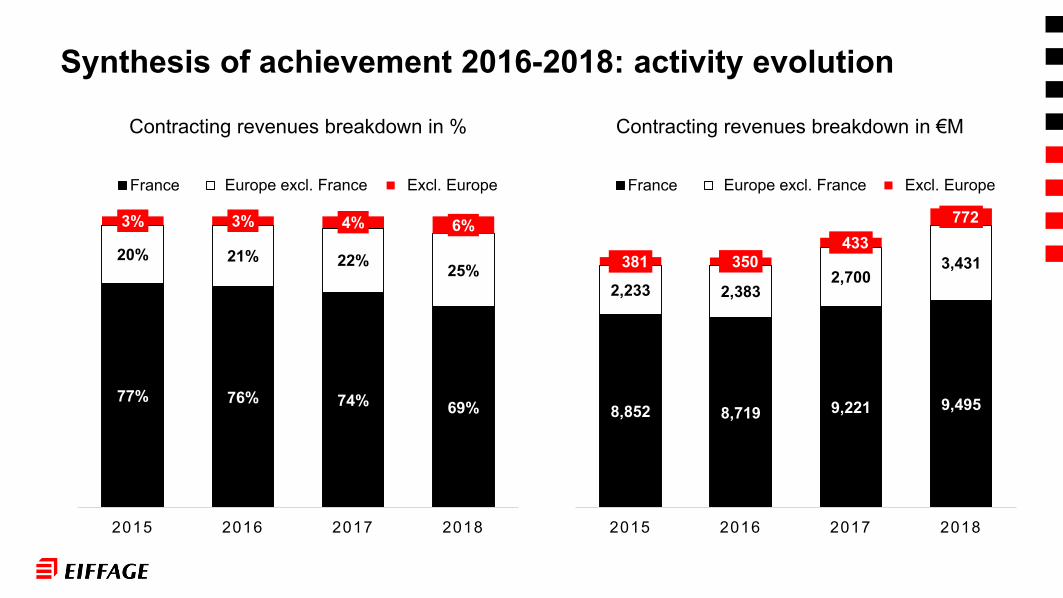
77% 76% 74% 69%
20% 21% 22% 25%
3% 3% 4% 6%
2015 2016 2017 2018
France Europe hors France Hors Europe
Contracting revenues breakdown in %
Synthesis of achievement 2016-2018: activity evolution
8,852 8,719 9,221 9,495
2,233 2,3832,700
3,431381 350 433
772
2015 2016 2017 2018
France Europe hors France Hors Europe
Contracting revenues breakdown in €M
Europe excl. France Excl. Europe Europe excl. France Excl. Europe
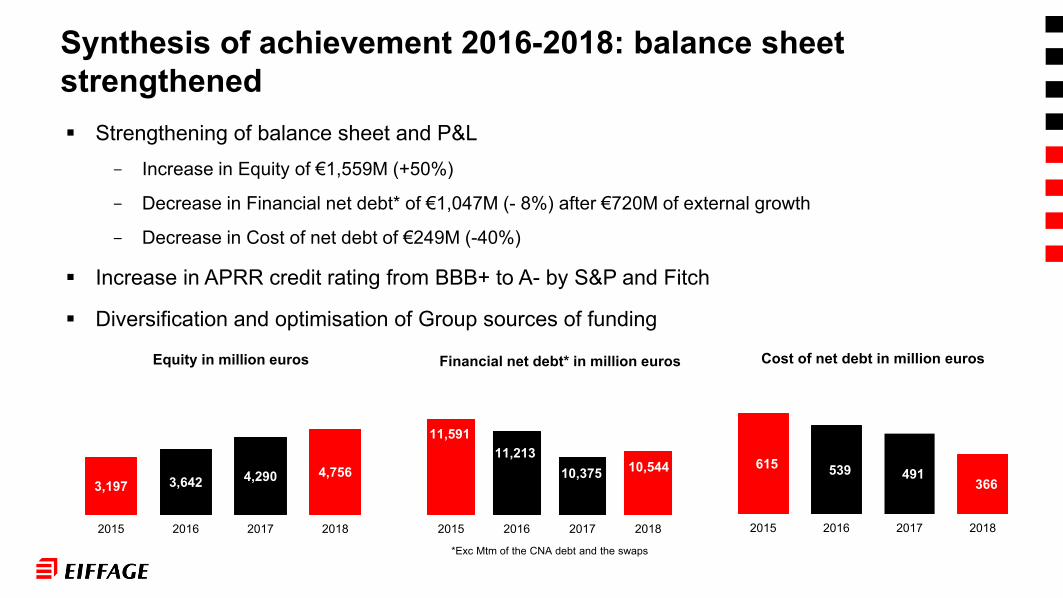
Strengthening of balance sheet and P&L- Increase in Equity of €1,559M (+50%)
- Decrease in Financial net debt* of €1,047M (- 8%) after €720M of external growth
- Decrease in Cost of net debt of €249M (-40%)
Increase in APRR credit rating from BBB+ to A- by S&P and Fitch
Diversification and optimisation of Group sources of funding
Financial net debt* in million euros
11,59111,213
10,375 10,544
2015 2016 2017 2018
*Exc Mtm of the CNA debt and the swaps
Synthesis of achievement 2016-2018: balance sheetstrengthened
615 539 491 366
2015 2016 2017 2018
Cost of net debt in million euros
3,197 3,642 4,290 4,756
2015 2016 2017 2018
x
Equity in million euros

Revenues in million euros+20%
13,909 14,00815,081
16,577
2015 2016 2017 2018
Operating profit in million euros +30%
1,4311,597
1,7321,857
2015 2016 2017 2018
312416*
515*629
2015 2016 2017 2018
Net profit Group share in million euros
*Excluding non-recurring adjustment in deferred tax for +€59M in 2016 and +33M€ in 2017
Doubling of net profit Group share led by- Growth of revenues of 20%
- Increase of operating margin of 30%
- Decrease in cost of net debt of 40%
Synthesis of achievement 2016-2018: improvement in our performance
x2

Highlights
Evolution of revenue in Europe excluding France
Contracting

Highlights
Îlot Perrée building - Paris
Concessions

Highlights
Record reservation of 4,694 housing units in property development
Contracting
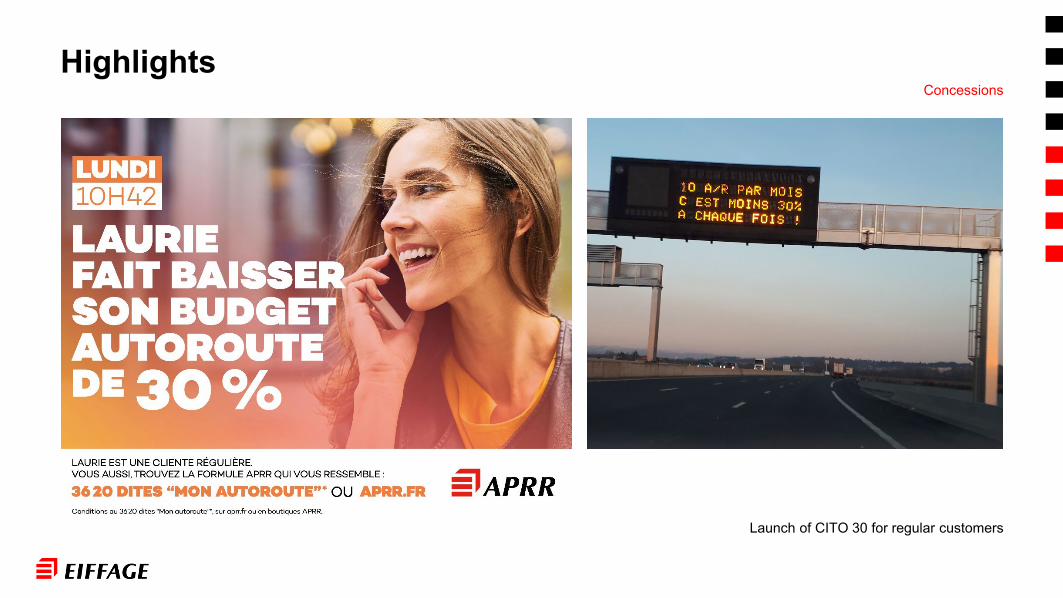
Highlights
Launch of CITO 30 for regular customers
Concessions
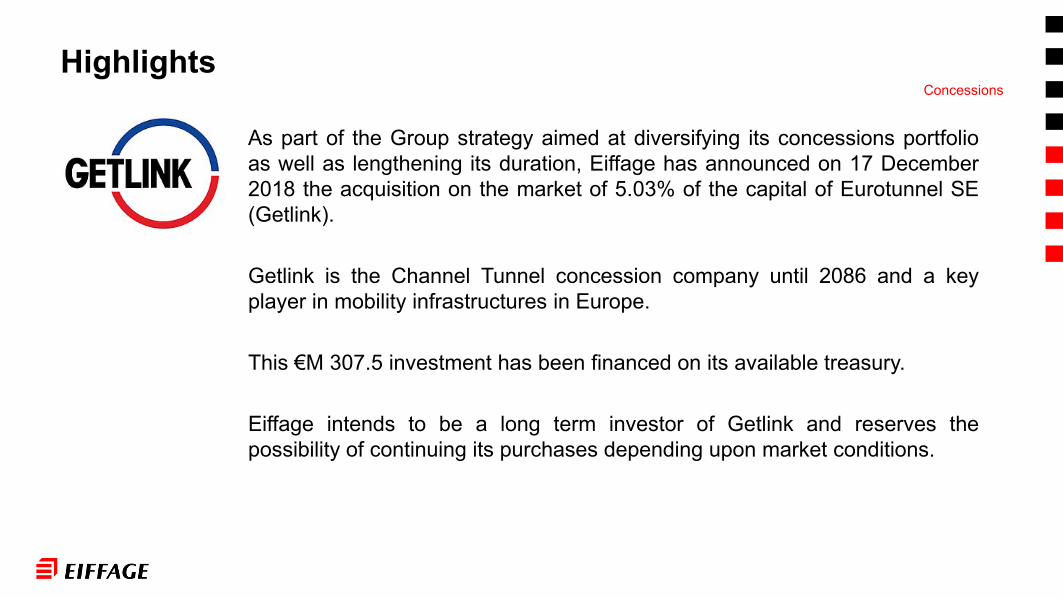
As part of the Group strategy aimed at diversifying its concessions portfolioas well as lengthening its duration, Eiffage has announced on 17 December2018 the acquisition on the market of 5.03% of the capital of Eurotunnel SE(Getlink).
Getlink is the Channel Tunnel concession company until 2086 and a keyplayer in mobility infrastructures in Europe.
This €M 307.5 investment has been financed on its available treasury.
Eiffage intends to be a long term investor of Getlink and reserves thepossibility of continuing its purchases depending upon market conditions.
HighlightsConcessions

Developing the Eiffage brand as an employer brand
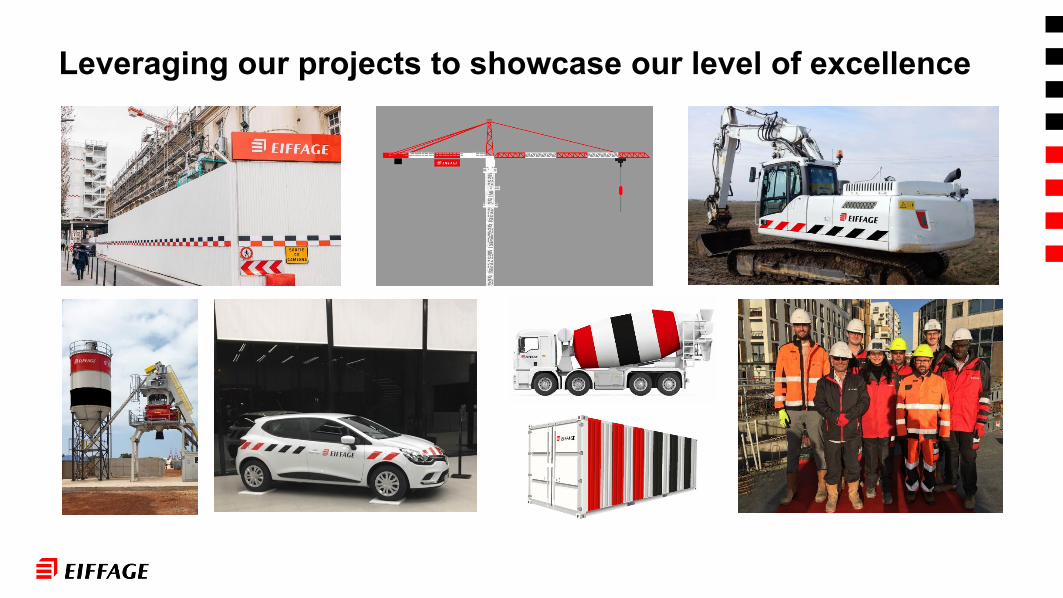
Leveraging our projects to showcase our level of excellence
Supporting our workers through the digital transition

Setting ourselves apart through innovation
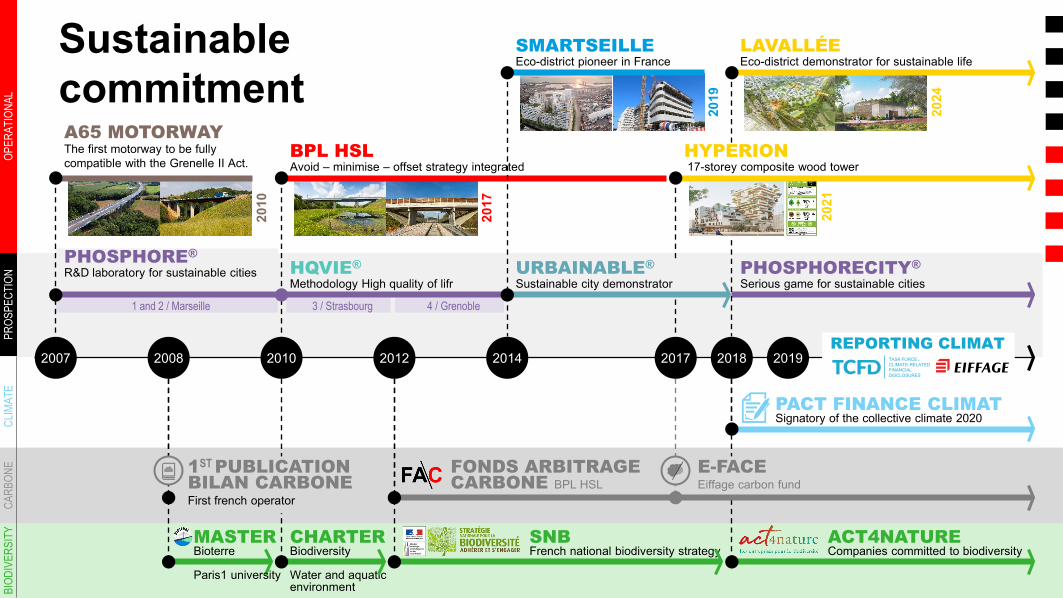
Sustainablecommitment
2024
2019
2010
FONDS ARBITRAGE CARBONE BPL HSL
CHARTERBiodiversity
Water and aquaticenvironment
SNBFrench national biodiversity strategy
ACT4NATURECompanies committed to biodiversity
MASTERBioterre
Paris1 university
A65 MOTORWAYThe first motorway to be fullycompatible with the Grenelle II Act. OP
ERAT
IONA
L
SMARTSEILLEEco-district pioneer in France
LAVALLÉEEco-district demonstrator for sustainable life
2017
BPL HSLAvoid – minimise – offset strategy integrated
HQVIE®Methodology High quality of lifr
3 / Strasbourg 4 / Grenoble1 and 2 / Marseille
PHOSPHORECITY®Serious game for sustainable cities
PHOSPHORE®R&D laboratory for sustainable cities
HYPERION17-storey composite wood tower
2021
URBAINABLE®Sustainable city demonstrator
PACT FINANCE CLIMAT Signatory of the collective climate 2020
1ST PUBLICATION BILAN CARBONE First french operator
E-FACEEiffage carbon fund
2007 2014 2017 2018 20192010 20122008
BIOD
IVER
SITY
CARB
ONE
CLIM
ATE
REPORTING CLIMAT TASK FORCEON
CLIMATE-RELATEDFINANCIALDISCLOSURES
PROS
PECT
ION

Eiffage 2018 Revenue €M
+9.9%
13,987 13,909 14,00815,081
16,577
2014 2015 2016 2017 2018
Order book €bn+15%
11.8 11.4 12.0 12.112.9
2014 2015 2016 2017 2018
Ongoing profit growth - Increase in order book
Operating profit €M+7.2%
1,347 1,4311,597
1,732 1,857
2014 2015 2016 2017 2018
275 312416*
515*629
2014 2015 2016 2017 2018
Net profit Group share €M+22.1%
*Excluding non-recurring adjustment in deferred tax for +€59M in 2016 and +33M€ in 2017
Financial Net debt €M*€M +169
12,014 11,591 11,21310,375 10,544
2014 2015 2016 2017 2018*Exc. Mtm of the CNA debt and the swaps
Change in WCR €M
+47 +46
(95) (99) (125)
2014 2015 2016 2017 2018€M -125
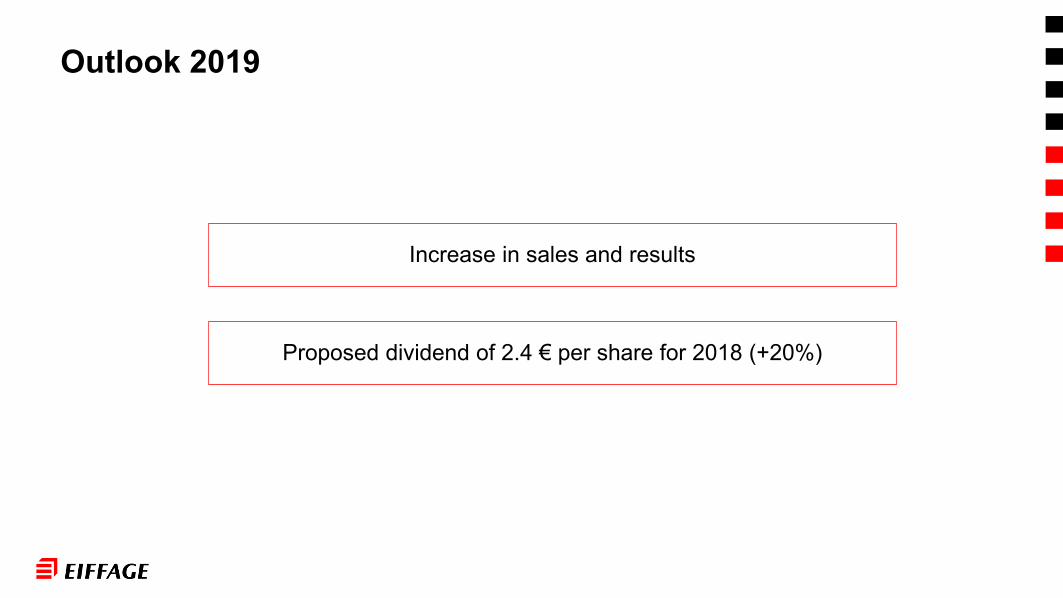
Increase in sales and results
Proposed dividend of 2.4 € per share for 2018 (+20%)
Outlook 2019
Results by business line and financial results
Christian Cassayre
Chief Financial Officer
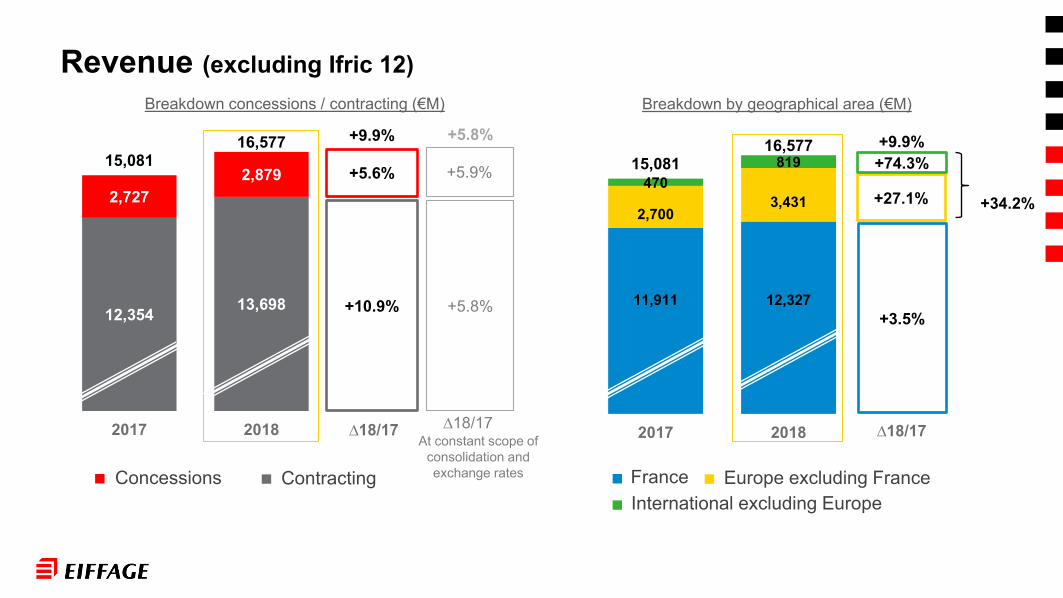
+5.8%
12,354 13,698
2,7272,879
15,08116,577
2017 2018
Revenue (excluding Ifric 12)
+10.9%
+5.6%
Breakdown concessions / contracting (€M)
ContractingConcessions
11,911 12,327
2,7003,431
47081915,081
16,577
2017 2018
+3.5%
+27.1%
Breakdown by geographical area (€M)
+74.3%+9.9% +9.9%
∆18/17 ∆18/17
International excluding EuropeFrance Europe excluding France
+5.8%
+5.9%
+34.2%
At constant scope of consolidation and exchange rates
∆18/17
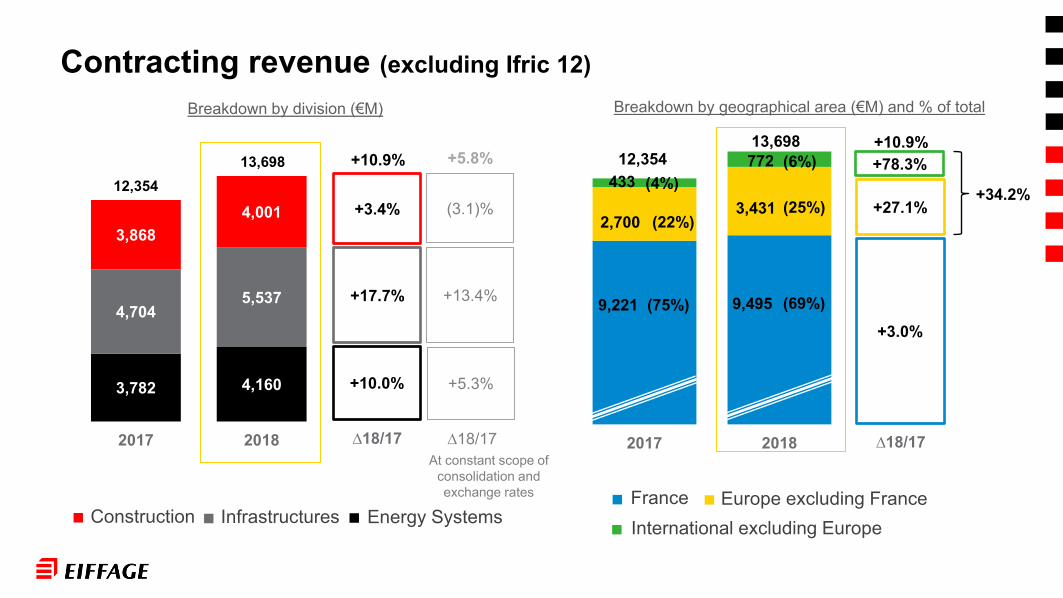
+10.9%
9,221 9,495
2,7003,431
43377212,35413,698
2017 2018
(4%)
(22%)
(75%) (69%)
(25%)
(6%)
Contracting revenue (excluding Ifric 12)Breakdown by geographical area (€M) and % of total
3,782 4,160
4,7045,537
3,8684,001
12,35413,698
2017 2018
+10.0%
+17.7%
+3.4%
Breakdown by division (€M)
Construction Infrastructures Energy Systems
+3.0%
+27.1%
+78.3%+10.9%
∆18/17 ∆18/17
International excluding EuropeFrance Europe excluding France
∆18/17At constant scope of
consolidation and exchange rates
+5.3%
+13.4%
(3.1)%
+5.8%
+34.2%
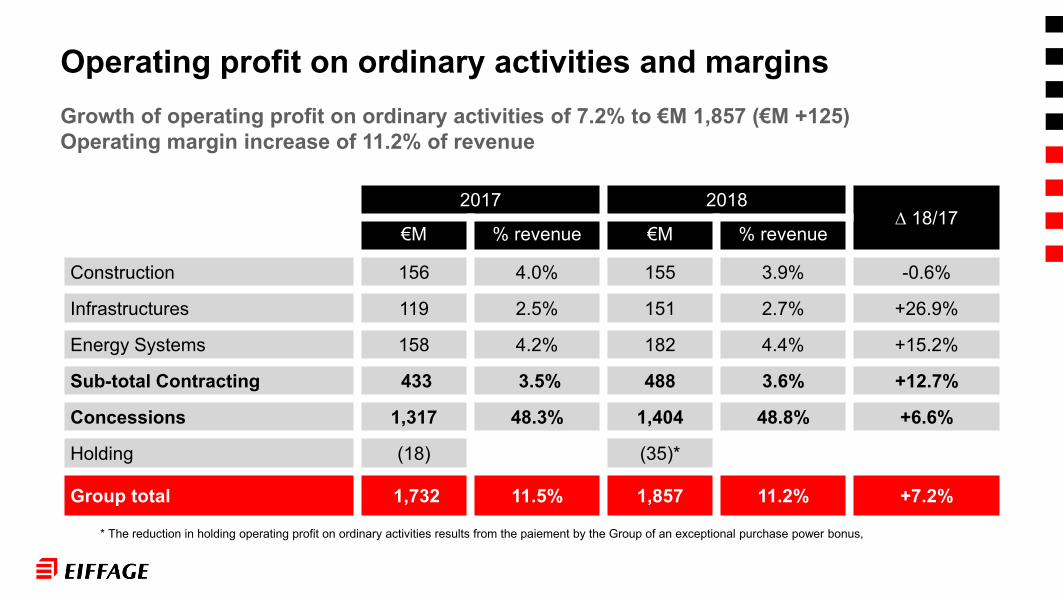
Growth of operating profit on ordinary activities of 7.2% to €M 1,857 (€M +125) Operating margin increase of 11.2% of revenue
Operating profit on ordinary activities and margins
2017 2018∆ 18/17
€M % revenue €M % revenue
Construction 156 4.0% 155 3.9% -0.6%
Infrastructures 119 2.5% 151 2.7% +26.9%
Energy Systems 158 4.2% 182 4.4% +15.2%
Sub-total Contracting 433 3.5% 488 3.6% +12.7%
Concessions 1,317 48.3% 1,404 48.8% +6.6%
Holding (18) (35)*
Group total 1,732 11.5% 1,857 11.2% +7.2%
* The reduction in holding operating profit on ordinary activities results from the paiement by the Group of an exceptional purchase power bonus,

380343
378433
488
3.3%
3.0%
3.3%3.5%
3.6%
2014 2015 2016 2017 2018
Evolution of the operating profit (€M) and operating margin (%)
9851,106
1,2361,317
1,404
41.4%
45.3%
48.4% 48.3%48.8%
2014 2015 2016 2017 2018
ConcessionsContracting
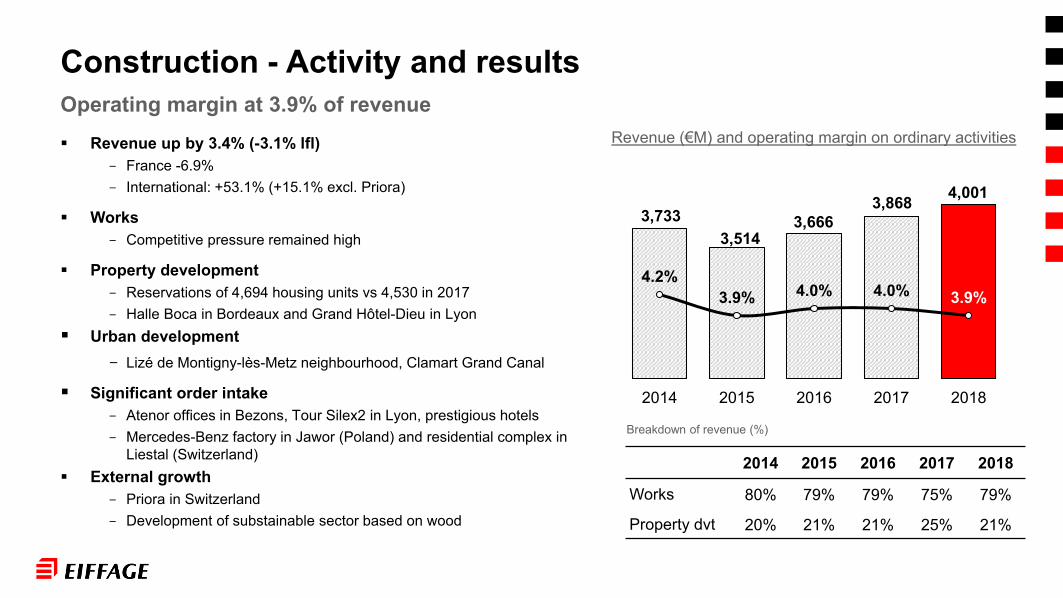
Construction - Activity and results
Revenue up by 3.4% (-3.1% lfl)- France -6.9%- International: +53.1% (+15.1% excl. Priora)
Works- Competitive pressure remained high
Property development- Reservations of 4,694 housing units vs 4,530 in 2017- Halle Boca in Bordeaux and Grand Hôtel-Dieu in Lyon
Urban development- Lizé de Montigny-lès-Metz neighbourhood, Clamart Grand Canal
Significant order intake- Atenor offices in Bezons, Tour Silex2 in Lyon, prestigious hotels- Mercedes-Benz factory in Jawor (Poland) and residential complex in
Liestal (Switzerland) External growth
- Priora in Switzerland- Development of substainable sector based on wood
3,7333,514
3,6663,868 4,001
4.2%3.9% 4.0% 4.0% 3.9%
2014 2015 2016 2017 2018
2014 2015 2016 2017 2018
Works 80% 79% 79% 75% 79%
Property dvt 20% 21% 21% 25% 21%
Breakdown of revenue (%)
Operating margin at 3.9% of revenueRevenue (€M) and operating margin on ordinary activities

Les jardins du Lou - Lyon
Les Jardins de l’Orangerie - Versailles
4,570 4,374 4,3254,704
5,537
2.4%
1.7%
2.2%
2.5%2.7%
2014 2015 2016 2017 2018
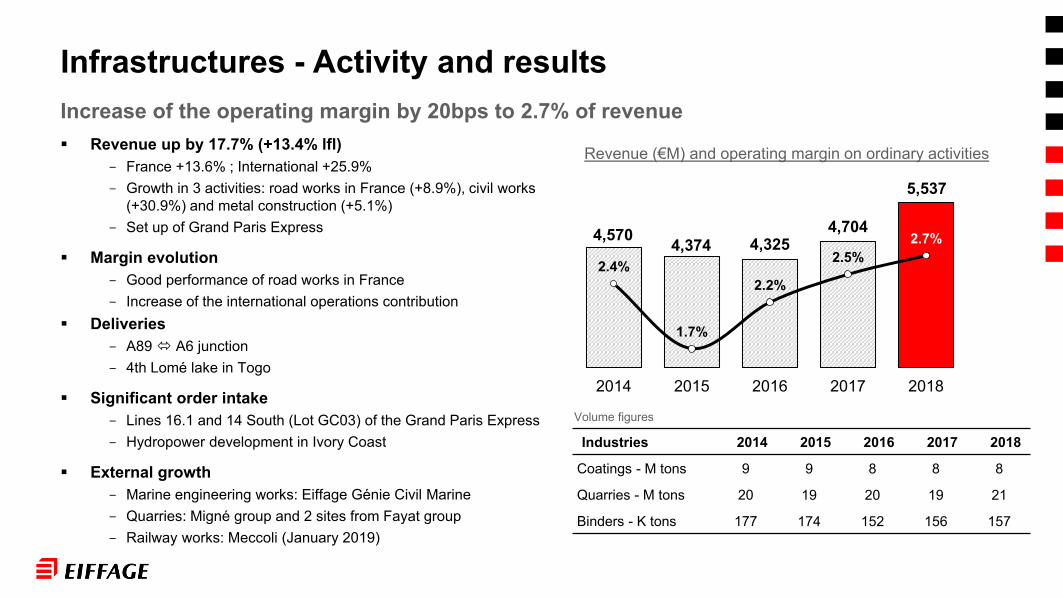
Increase of the operating margin by 20bps to 2.7% of revenue
Infrastructures - Activity and results
Revenue up by 17.7% (+13.4% lfl)- France +13.6% ; International +25.9%- Growth in 3 activities: road works in France (+8.9%), civil works
(+30.9%) and metal construction (+5.1%)- Set up of Grand Paris Express
Margin evolution- Good performance of road works in France- Increase of the international operations contribution
Deliveries- A89 A6 junction- 4th Lomé lake in Togo
Significant order intake- Lines 16.1 and 14 South (Lot GC03) of the Grand Paris Express - Hydropower development in Ivory Coast
External growth- Marine engineering works: Eiffage Génie Civil Marine- Quarries: Migné group and 2 sites from Fayat group- Railway works: Meccoli (January 2019)
Revenue (€M) and operating margin on ordinary activities
Industries 2014 2015 2016 2017 2018
Coatings - M tons 9 9 8 8 8
Quarries - M tons 20 19 20 19 21
Binders - K tons 177 174 152 156 157
Volume figures
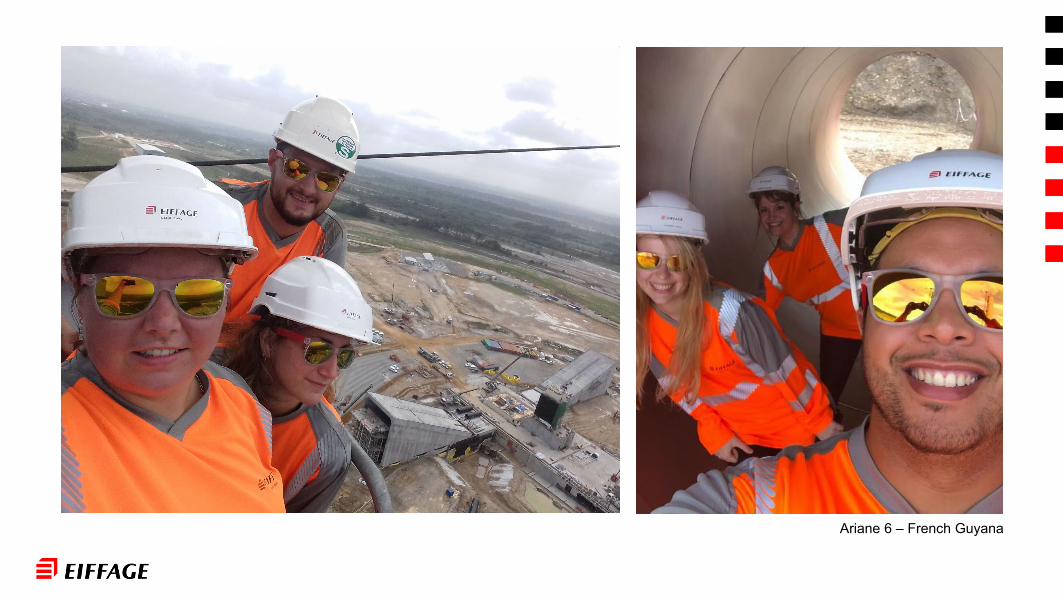
Ariane 6 – French Guyana
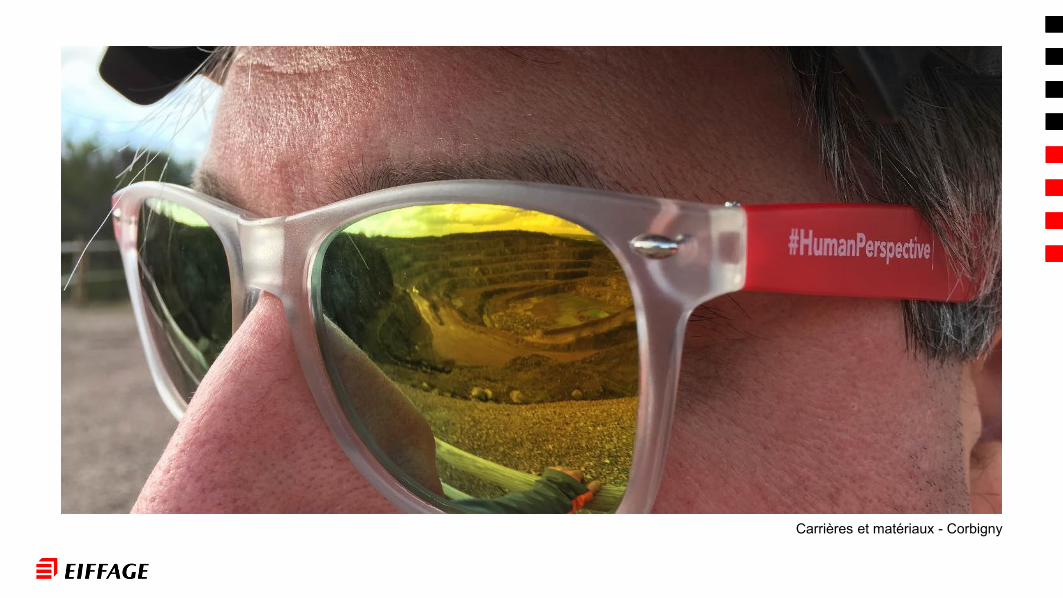
Carrières et matériaux - Corbigny

Energy Systems - Activity and results
3,3063,578
3,4613,782
4,160
3.5%3.7%
4.0%4.2%
4.4%
2014 2015 2016 2017 2018
Increase of the operating margin by 20bps to 4.4% of revenueContinuous growth of the operating margin over the last 5 years
Revenue up by 10.0% (+5.3% lfl)- France +2.4%- International +34.5% (+16.1% lfl)
Increased operating margins- Continued progress in every divisions
Activity- Good standing of the recurring operations- Solar plants in Chile
Order intake- Optic fibre networks deployment- Paradise Park solar plant in Jamaica- 1st success on the Grand Paris Express
External growth- Kropman (Netherlands) - EDS (Spain)
Revenue (€M) and operating margin on ordinary activities
Rollout of dedicated brands to each individual market- Clemessy for industries- Dorsalys for infrastructures and networks- Expercité for cities and collectivities- Terceo for tertiary sector

Lille tube
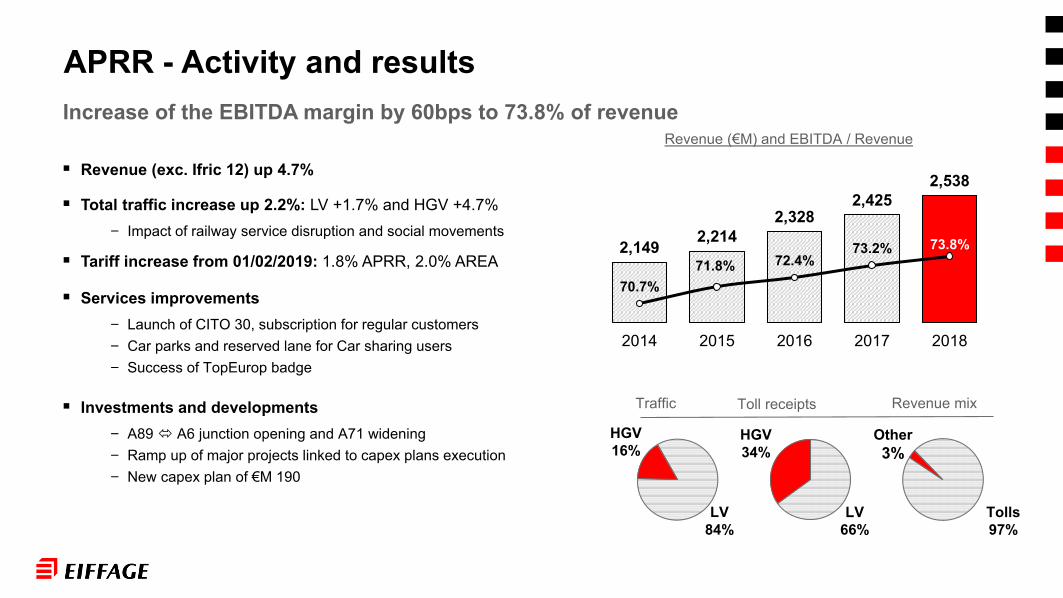
Revenue (exc. Ifric 12) up 4.7%
Total traffic increase up 2.2%: LV +1.7% and HGV +4.7%- Impact of railway service disruption and social movements
Tariff increase from 01/02/2019: 1.8% APRR, 2.0% AREA
Services improvements- Launch of CITO 30, subscription for regular customers- Car parks and reserved lane for Car sharing users- Success of TopEurop badge
Investments and developments- A89 A6 junction opening and A71 widening- Ramp up of major projects linked to capex plans execution- New capex plan of €M 190
Revenue (€M) and EBITDA / Revenue
APRR - Activity and results
2,149 2,2142,328
2,4252,538
70.7%71.8% 72.4%
73.2% 73.8%
2014 2015 2016 2017 2018
Increase of the EBITDA margin by 60bps to 73.8% of revenue
Traffic Toll receipts Revenue mix
HGV16%
LV84%
HGV34%
LV66%
Other3%
Tolls97%

Snow kill

2,378 2,443 2,556 2,727 2,879
41.4%
45.3%
48.4% 48.3% 48.8%
2014 2015 2016 2017 2018
Revenue including APRR up 5.6% (+5.9% lfl)- APRR: +4.7% at €M 2,538 - Motorways concessions (exc. APRR): +11.0% at €M 159
- Other concessions and PPPs: +14.4% at €M 183
Operating margin +6.6% at €M 1,404- APRR and Eiffarie: +6.6% at €M 1,231- Other concessions and PPPs: +6.8% at €M 173
Concessions - Activity and resultsIncrease of the operating margin by 50bps to 48.8% of revenue
Motorways Revenue €M (∆18/17 %) LV Traffic HGV TrafficA65 63 (+8.6%) +3.0% +6.2%Millau Viaduct 50 (+2.3%) (2.6)% +3.1%Autoroute de l’Avenir 46 (+28.8%) +39.8% in transactions
Total 159 (+11.0%)
Revenue (€M) and operating margin on ordinary activities
Portfolio transaction- Opening: Two colleges in Var and University of Nancy
- Signings: Reims Events Centre and Îlot Perrée police station in Paris (February 2019)
- Refinancing of A65 (€M 825)
- High quality sports programming in Pierre Mauroy stadium in Lille
Autoroute de l’Avenir - Senegal
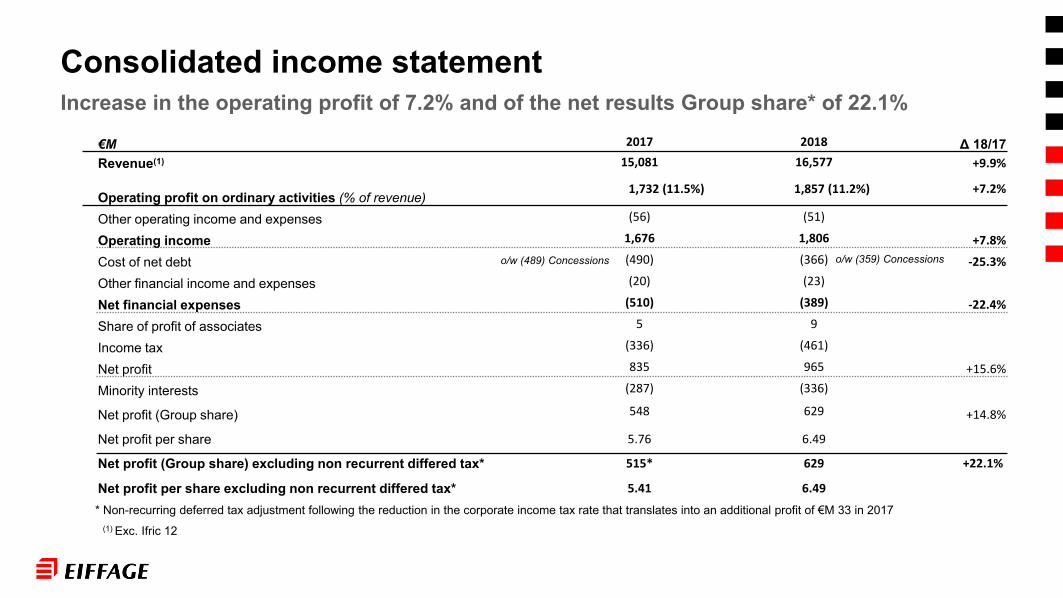
Consolidated income statement
€M 2017 2018 Δ 18/17Revenue(1) 15,081 16,577 +9.9%
Operating profit on ordinary activities (% of revenue)1,732 (11.5%) 1,857 (11.2%) +7.2%
Other operating income and expenses (56) (51)
Operating income 1,676 1,806 +7.8%
Cost of net debt (490) (366) -25.3%
Other financial income and expenses (20) (23)
Net financial expenses (510) (389) -22.4%
Share of profit of associates 5 9
Income tax (336) (461)
Net profit 835 965 +15.6%
Minority interests (287) (336)
Net profit (Group share) 548 629 +14.8%
Net profit per share 5.76 6.49
Net profit (Group share) excluding non recurrent differed tax* 515* 629 +22.1%
Net profit per share excluding non recurrent differed tax* 5.41 6.49
o/w (489) Concessions o/w (359) Concessions
* Non-recurring deferred tax adjustment following the reduction in the corporate income tax rate that translates into an additional profit of €M 33 in 2017(1) Exc. Ifric 12
Increase in the operating profit of 7.2% and of the net results Group share* of 22.1%
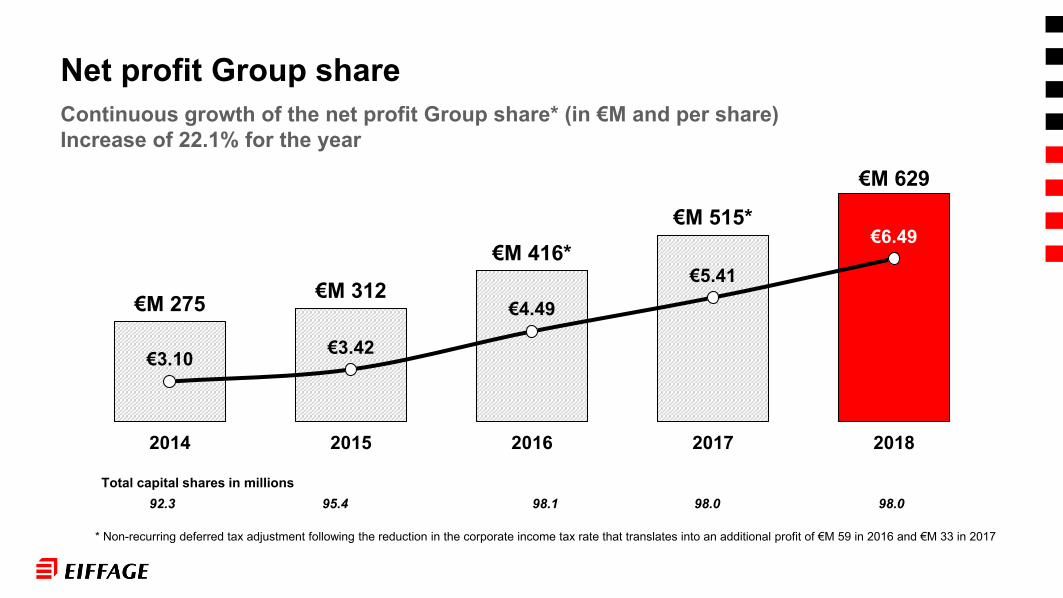
€M 275 €M 312€M 416*
€M 515*
€M 629
€3.10 €3.42
€4.49€5.41
€6.49
2014 2015 2016 2017 2018
Total capital shares in millions92.3 95.4 98.1 98.0 98.0
Continuous growth of the net profit Group share* (in €M and per share)Increase of 22.1% for the year
Net profit Group share
* Non-recurring deferred tax adjustment following the reduction in the corporate income tax rate that translates into an additional profit of €M 59 in 2016 and €M 33 in 2017
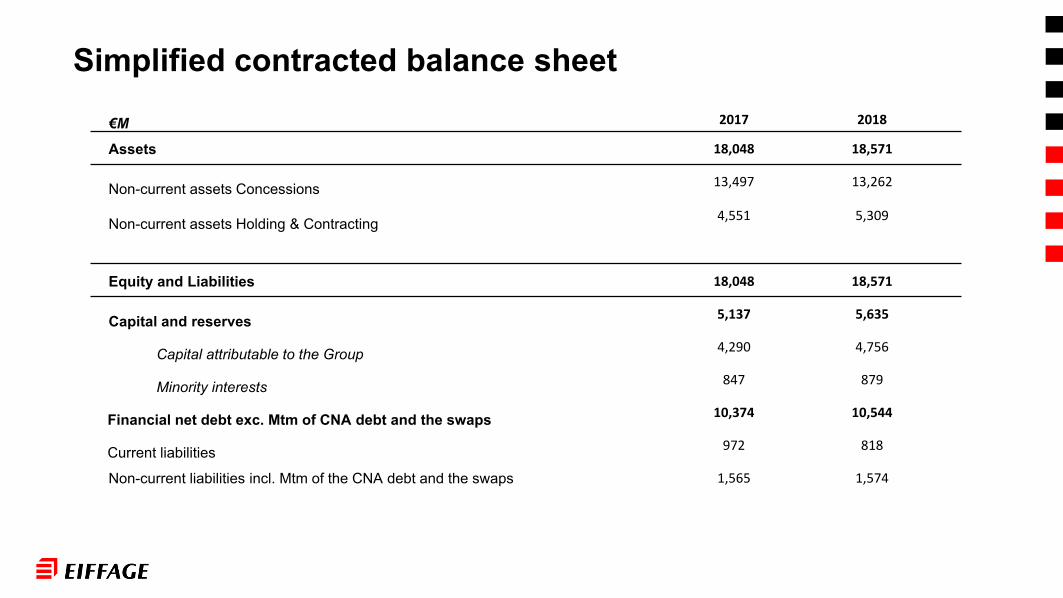
Simplified contracted balance sheet
€M 2017 2018
Assets 18,048 18,571
Non-current assets Concessions 13,497 13,262
Non-current assets Holding & Contracting 4,551 5,309
Equity and Liabilities 18,048 18,571
Capital and reserves 5,137 5,635
Capital attributable to the Group 4,290 4,756
Minority interests 847 879
Financial net debt exc. Mtm of CNA debt and the swaps 10,374 10,544
Current liabilities 972 818
Non-current liabilities incl. Mtm of the CNA debt and the swaps 1,565 1,574

2 602
125
878 197
503 93 220 308 105
528
Acquisitions Concessions
( , )
( )
Acquisitions &
CessionsContracting
Financial net debt evolution
EBITDA Δ WCR
o/w Holding & Contracting €M (107 )
o/w Concessions €M (18)
Interest &taxes paid
Holding & Contracting
ConcessionsInvestments
Dividends &
Capital transactions
10,375
DFN 31/12/2017* DFN 31/12/2018** Exc. Mtm of the CNA debt and the swaps of €M 226 at 31/12/17 and €M 158 at 31/12/18
Variations without flows of funds
(2,488) 99 1,055 159 570 (130) 84 (316) 119
Operation (1,599)
599(1,334)
2017figures
Free cash flow (992)
CAPEX607
10,544
ConcessionsPPP debt
repayment
(pro forma)o/w Holding & Contracting €M (147)
Concessions €M +48
External growth 528In million euros
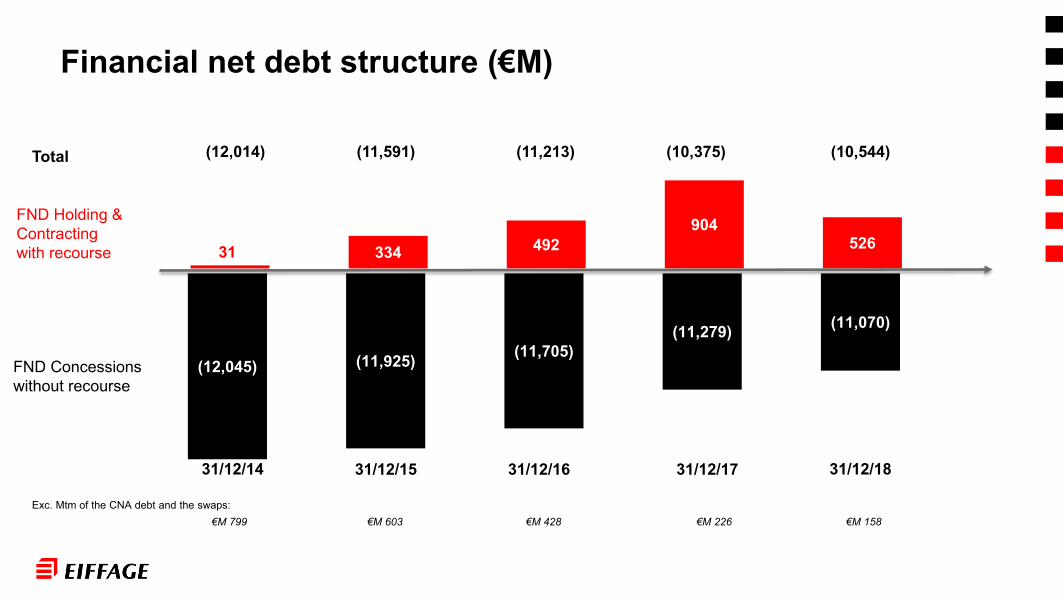
31 334 492904
526
(12,045) (11,925) (11,705)(11,279) (11,070)
31/12/15 31/12/16 31/12/17
(12,014) (11,591) (11,213)
FND Holding & Contractingwith recourse
FND Concessions without recourse
Exc. Mtm of the CNA debt and the swaps:€M 799 €M 603 €M 428 €M 226 €M 158
Financial net debt structure (€M)
Total
31/12/1831/12/14
(10,375) (10,544)
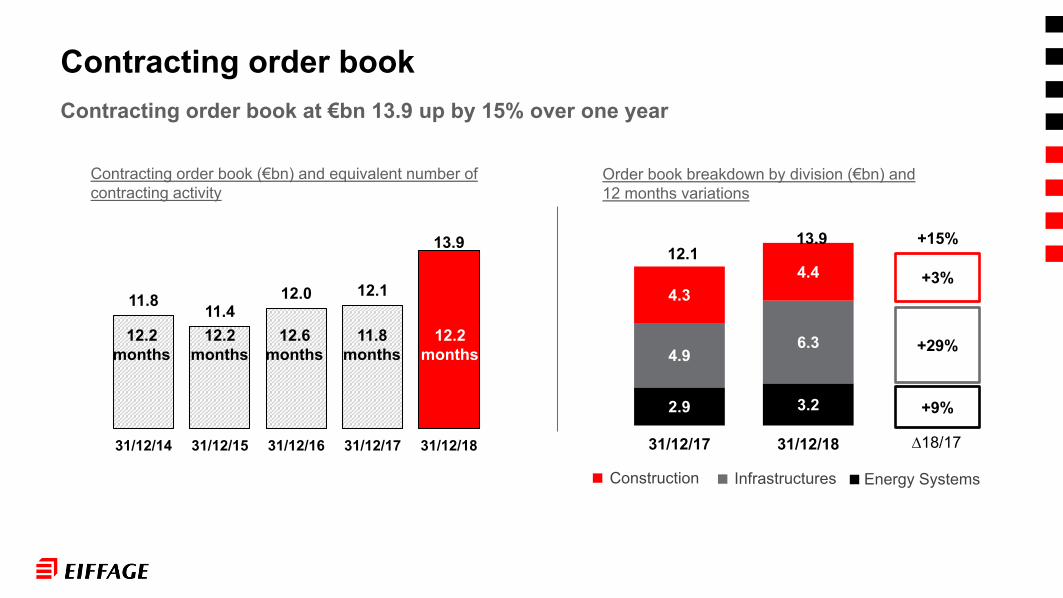
11.8 11.412.0 12.1
13.9
31/12/14 31/12/15 31/12/16 31/12/17 31/12/18
Contracting order book (€bn) and equivalent number of contracting activity
Contracting order book
2.9 3.2
4.96.3
4.34.4
12.113.9
31/12/17 31/12/18
Order book breakdown by division (€bn) and12 months variations
Construction Infrastructures
+9%
+29%
+3%
Contracting order book at €bn 13.9 up by 15% over one year
+15%
∆18/17
12.2months
12.2months
12.6months
11.8months
12.2months
Energy Systems

#HumanPerspective

Appendices
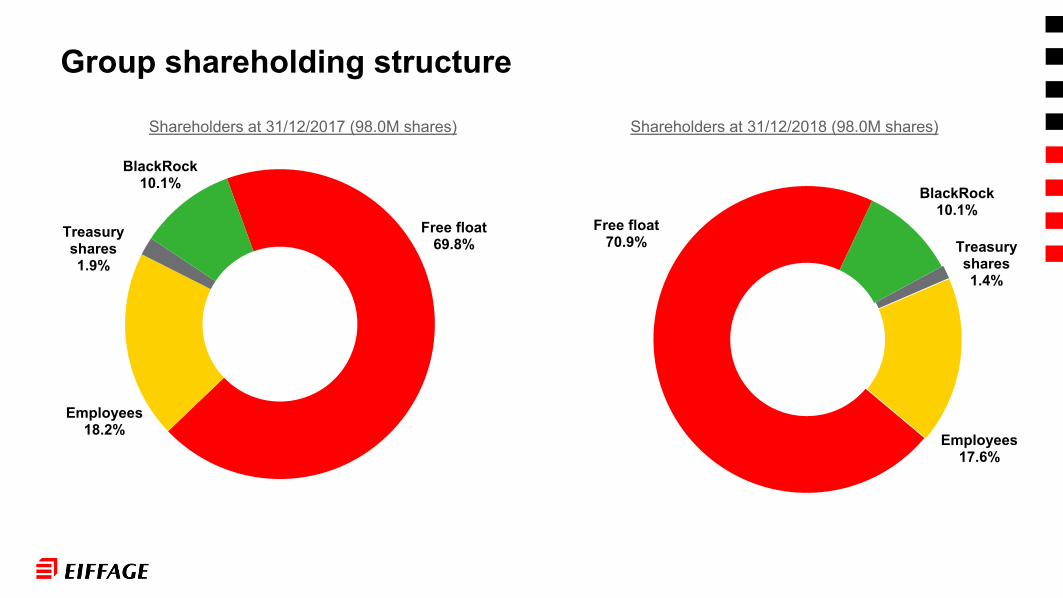
Shareholders at 31/12/2018 (98.0M shares)Shareholders at 31/12/2017 (98.0M shares)
Group shareholding structure
Free float70.9%
BlackRock10.1%
Treasury shares1.4%
Employees17.6%
Free float69.8%
Employees18.2%
Treasury shares1.9%
BlackRock10.1%

Revenue breakdown in Europe excluding France (€M)Revenue breakdown (€M) and Δ 2017 (%)
Revenue (excluding IFRIC 12)
11,911
470
2,700
12,327
819
3,431
France International excludingEurope
Europe excluding France
2017 2018
990
186
864
373
29116 142
898
175
1,061
544
280
156
317
Belgium /Luxembourg
Netherland Germany Spain Switherland Poland Others
2017 2018
Netherlands Switzerland
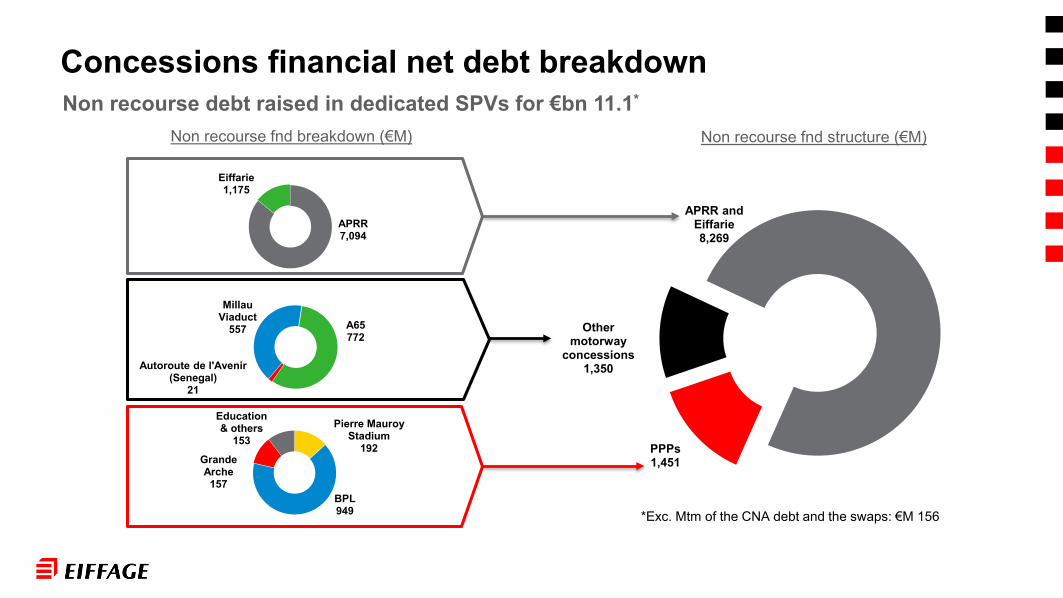
Pierre Mauroy Stadium
192
BPL949
Grande Arche
157
Education & others
153
APRR7,094
Eiffarie1,175
PPPs1,451
Other motorway
concessions1,350
APRR and Eiffarie8,269
Non recourse fnd structure (€M)Non recourse fnd breakdown (€M)
Concessions financial net debt breakdownNon recourse debt raised in dedicated SPVs for €bn 11.1*
Millau Viaduct
557 A65772
Autoroute de l'Avenir (Senegal)
21
*Exc. Mtm of the CNA debt and the swaps: €M 156

Consolidated balance sheet - Assets€M 31/12/2016 31/12/2017 31/12/2018Property, plant and equipment 1,585 1,649 1,853Investment property 4 3 3Fixed assets held under concessions 11,408 11,181 10,981Goodwill on acquisition 2,945 2,995 3,219Other intangible assets 175 182 205Equity-method investments 144 169 171Financial assets on service concessions non-current 1,886 1,680 1,621Other financial assets 219 189 518Deferred tax assets 274 238 247Total non current assets 18,640 18,286 18,818Inventories 728 683 740Trade receivables 4,292 4,977 5,311Current tax receivables 174 206 170Financial assets on service concessions current 19 50 56Other current assets 1,184 1,287 1,577Cash and cash equivalent 4,466 4,537 3,696Asset held for sale - - -Total current assets 10,863 11,740 11,550Total assets 29,503 30,026 30,368
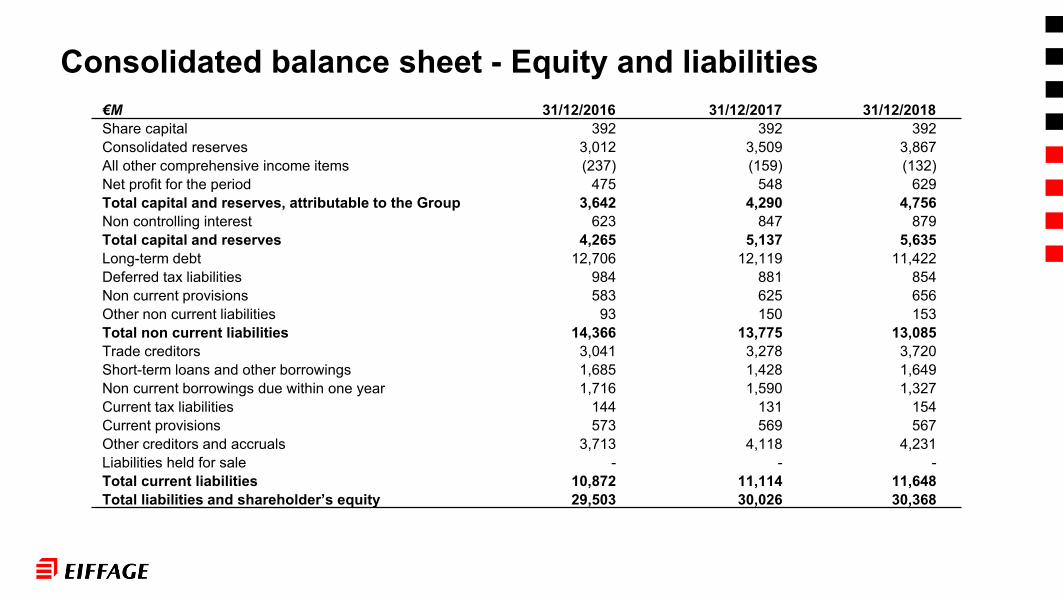
Consolidated balance sheet - Equity and liabilities€M 31/12/2016 31/12/2017 31/12/2018Share capital 392 392 392Consolidated reserves 3,012 3,509 3,867All other comprehensive income items (237) (159) (132)Net profit for the period 475 548 629Total capital and reserves, attributable to the Group 3,642 4,290 4,756Non controlling interest 623 847 879Total capital and reserves 4,265 5,137 5,635Long-term debt 12,706 12,119 11,422Deferred tax liabilities 984 881 854Non current provisions 583 625 656Other non current liabilities 93 150 153Total non current liabilities 14,366 13,775 13,085Trade creditors 3,041 3,278 3,720Short-term loans and other borrowings 1,685 1,428 1,649Non current borrowings due within one year 1,716 1,590 1,327Current tax liabilities 144 131 154Current provisions 573 569 567Other creditors and accruals 3,713 4,118 4,231Liabilities held for sale - - -Total current liabilities 10,872 11,114 11,648Total liabilities and shareholder’s equity 29,503 30,026 30,368
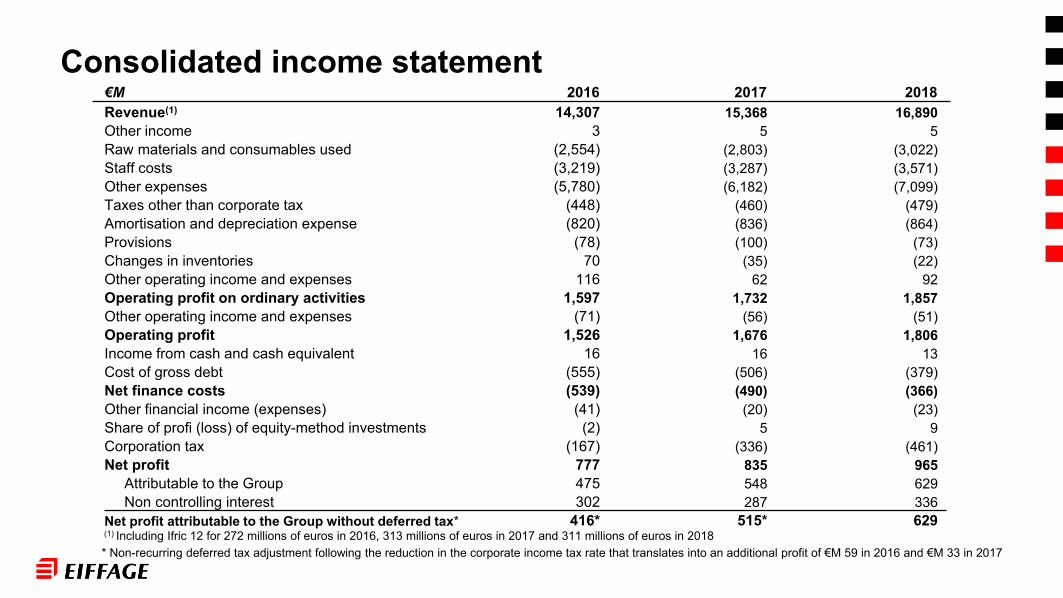
Consolidated income statement €M 2016 2017 2018Revenue(1) 14,307 15,368 16,890Other income 3 5 5Raw materials and consumables used (2,554) (2,803) (3,022)Staff costs (3,219) (3,287) (3,571)Other expenses (5,780) (6,182) (7,099)Taxes other than corporate tax (448) (460) (479)Amortisation and depreciation expense (820) (836) (864)Provisions (78) (100) (73)Changes in inventories 70 (35) (22)Other operating income and expenses 116 62 92Operating profit on ordinary activities 1,597 1,732 1,857Other operating income and expenses (71) (56) (51)Operating profit 1,526 1,676 1,806Income from cash and cash equivalent 16 16 13Cost of gross debt (555) (506) (379)Net finance costs (539) (490) (366)Other financial income (expenses) (41) (20) (23)Share of profi (loss) of equity-method investments (2) 5 9Corporation tax (167) (336) (461)Net profit 777 835 965
Attributable to the Group 475 548 629Non controlling interest 302 287 336
Net profit attributable to the Group without deferred tax* 416* 515* 629(1) Including Ifric 12 for 272 millions of euros in 2016, 313 millions of euros in 2017 and 311 millions of euros in 2018* Non-recurring deferred tax adjustment following the reduction in the corporate income tax rate that translates into an additional profit of €M 59 in 2016 and €M 33 in 2017
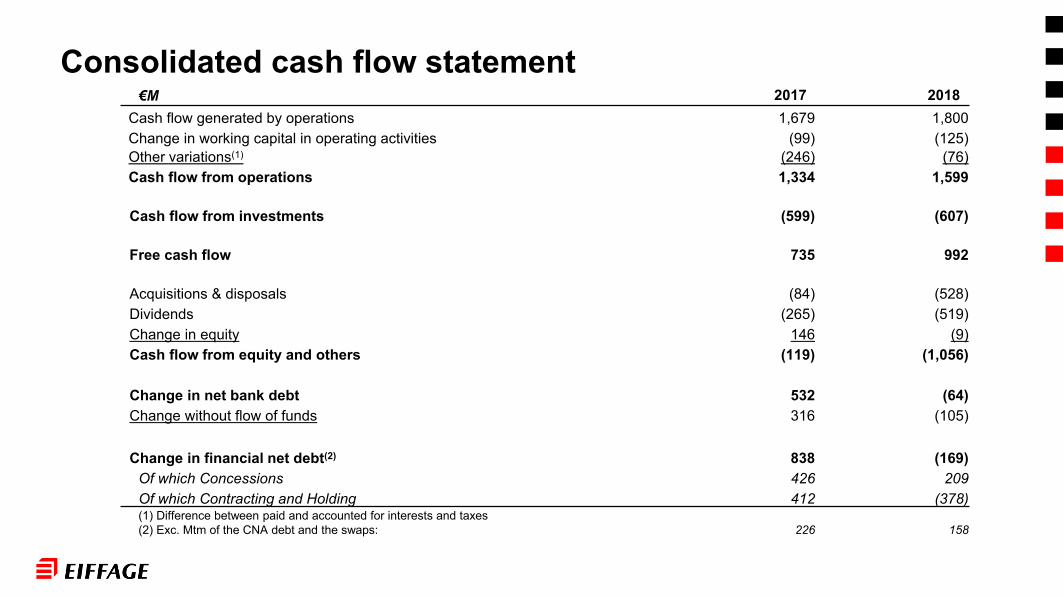
Consolidated cash flow statement €M 2017 2018
Cash flow generated by operations 1,679 1,800Change in working capital in operating activities (99) (125)Other variations(1) (246) (76)Cash flow from operations 1,334 1,599
Cash flow from investments (599) (607)
Free cash flow 735 992
Acquisitions & disposals (84) (528)Dividends (265) (519)Change in equity 146 (9)Cash flow from equity and others (119) (1,056)
Change in net bank debt 532 (64)Change without flow of funds 316 (105)
Change in financial net debt(2) 838 (169)Of which Concessions 426 209Of which Contracting and Holding 412 (378)(1) Difference between paid and accounted for interests and taxes(2) Exc. Mtm of the CNA debt and the swaps: 226 158

Operational Capex
€M 2017 2018
Holding and Contracting net Capex 159 197
Concessions Capex 570 503
PPPs’ and Concessions debt repayment (130) (93)
Total operational Capex 599 607
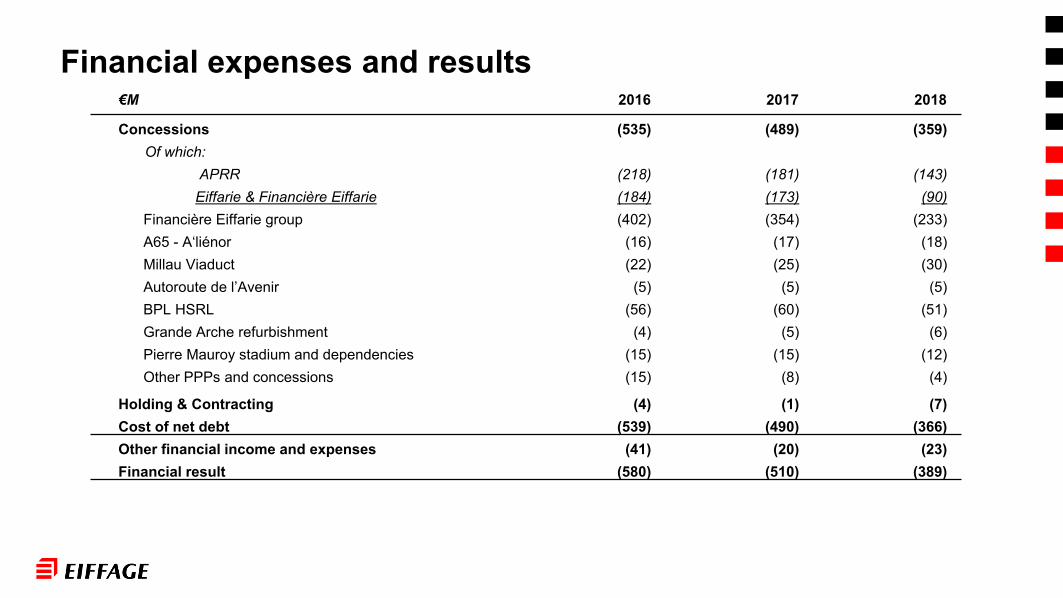
Financial expenses and results€M 2016 2017 2018
Concessions (535) (489) (359)Of which:
APRR (218) (181) (143)Eiffarie & Financière Eiffarie (184) (173) (90)
Financière Eiffarie group (402) (354) (233)A65 - A‘liénor (16) (17) (18)Millau Viaduct (22) (25) (30)Autoroute de l’Avenir (5) (5) (5)BPL HSRL (56) (60) (51)Grande Arche refurbishment (4) (5) (6)Pierre Mauroy stadium and dependencies (15) (15) (12)Other PPPs and concessions (15) (8) (4)
Holding & Contracting (4) (1) (7)Cost of net debt (539) (490) (366)Other financial income and expenses (41) (20) (23)Financial result (580) (510) (389)
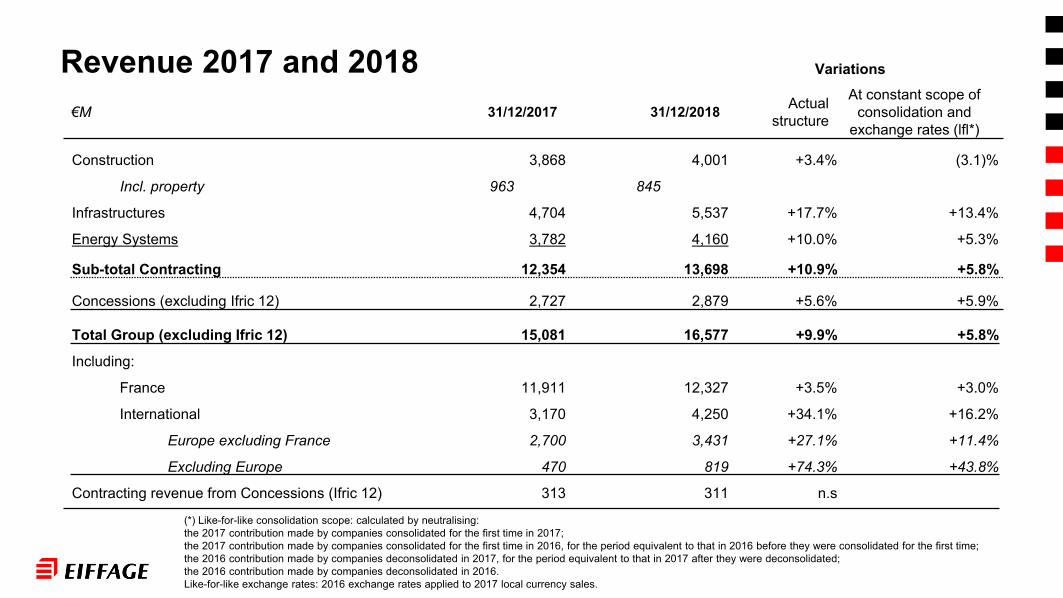
Revenue 2017 and 2018 €M 31/12/2017 31/12/2018 Actual
structure
At constant scope of consolidation and
exchange rates (lfl*)
Construction 3,868 4,001 +3.4% (3.1)%
Incl. property 963 845
Infrastructures 4,704 5,537 +17.7% +13.4%
Energy Systems 3,782 4,160 +10.0% +5.3%
Sub-total Contracting 12,354 13,698 +10.9% +5.8%
Concessions (excluding Ifric 12) 2,727 2,879 +5.6% +5.9%
Total Group (excluding Ifric 12) 15,081 16,577 +9.9% +5.8%
Including:
France 11,911 12,327 +3.5% +3.0%
International 3,170 4,250 +34.1% +16.2%
Europe excluding France 2,700 3,431 +27.1% +11.4%
Excluding Europe 470 819 +74.3% +43.8%
Contracting revenue from Concessions (Ifric 12) 313 311 n.s
(*) Like-for-like consolidation scope: calculated by neutralising:the 2017 contribution made by companies consolidated for the first time in 2017;the 2017 contribution made by companies consolidated for the first time in 2016, for the period equivalent to that in 2016 before they were consolidated for the first time;the 2016 contribution made by companies deconsolidated in 2017, for the period equivalent to that in 2017 after they were deconsolidated;the 2016 contribution made by companies deconsolidated in 2016.Like-for-like exchange rates: 2016 exchange rates applied to 2017 local currency sales.
Variations
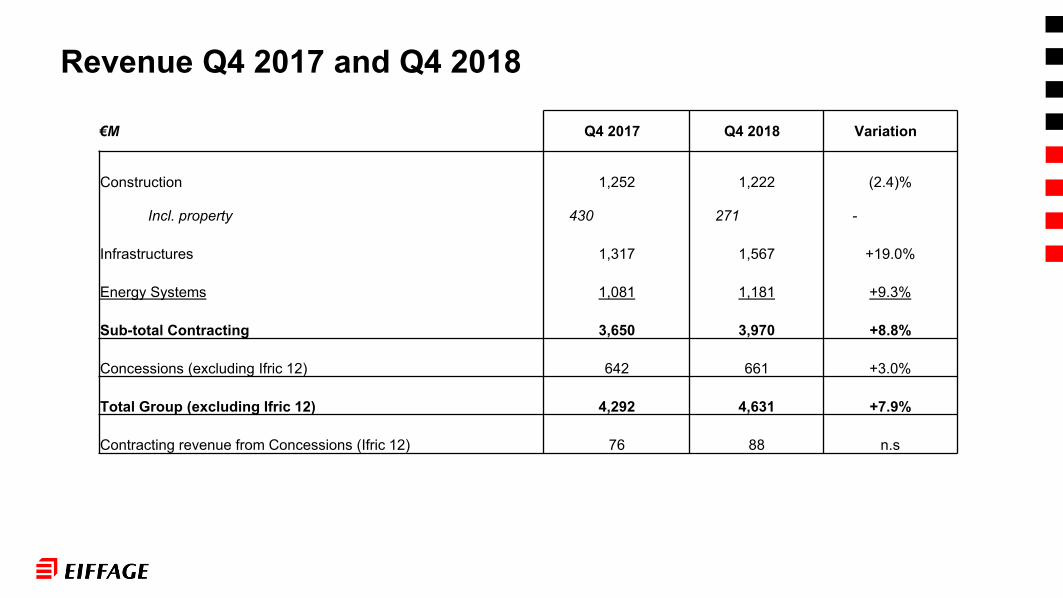
Revenue Q4 2017 and Q4 2018
€M Q4 2017 Q4 2018 Variation
Construction 1,252 1,222 (2.4)%
Incl. property 430 271 -
Infrastructures 1,317 1,567 +19.0%
Energy Systems 1,081 1,181 +9.3%
Sub-total Contracting 3,650 3,970 +8.8%
Concessions (excluding Ifric 12) 642 661 +3.0%
Total Group (excluding Ifric 12) 4,292 4,631 +7.9%
Contracting revenue from Concessions (Ifric 12) 76 88 n.s

Summary revenue, operational profit on ordinary activities and operating margin 2014-2018
Revenue (€M) Operating profit on ordinary activities (€M) Operational margin (%)
2014 2015 2016 2017 2018 2014 2015 2016 2017 2018 2014 2015 2016 2017 2018
Construction 3,733 3,514 3,666 3,868 4,011 156 136 147 156 155 4.2% 3.9% 4.0% 4.0% 3.9%
Infrastructures 4,570 4,374 4,325 4,704 5,537 108 75 93 119 151 2.4% 1.7% 2.2% 2.5% 2.7%
EnergySystems 3,306 3,578 3,461 3,782 4,160 116 132 138 158 182 3.5% 3.7% 4.0% 4.2% 4.4%
Sub-totalContracting 11,609 11,466 11,452 12,354 13,698 380 343 378 433 488 3.3% 3.0% 3.3% 3.5% 3.6%
Concessions 2,378 2,443 2,556 2,727 2,879 985 1,106 1,236 1,317 1,404 41.4% 45.3% 48.4% 48.3% 48.8%
Holding (18) (18) (17) (18) (35)*
Total Group 13,987 13,909 14,008 15,081 16,577 1,347 1,431 1,597 1,732 1,857 9.6% 10.3% 11.4% 11.5% 11.2%
* The reduction in holding operating profit on ordinary activities results from the paiement by the Group of an exceptional purchase power bonus

Private71%
Public29%
Construction
Private80%
Public20%
Energy Systems
Private42%
Public58%
Infrastructures
Contracting - Customer segmentation
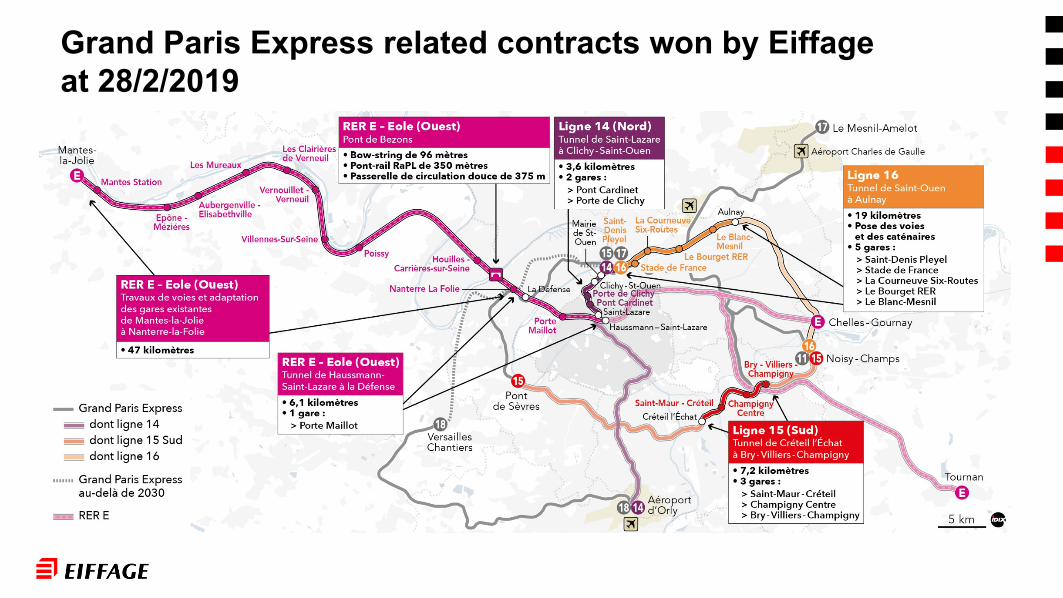
Grand Paris Express related contracts won by Eiffage at 28/2/2019
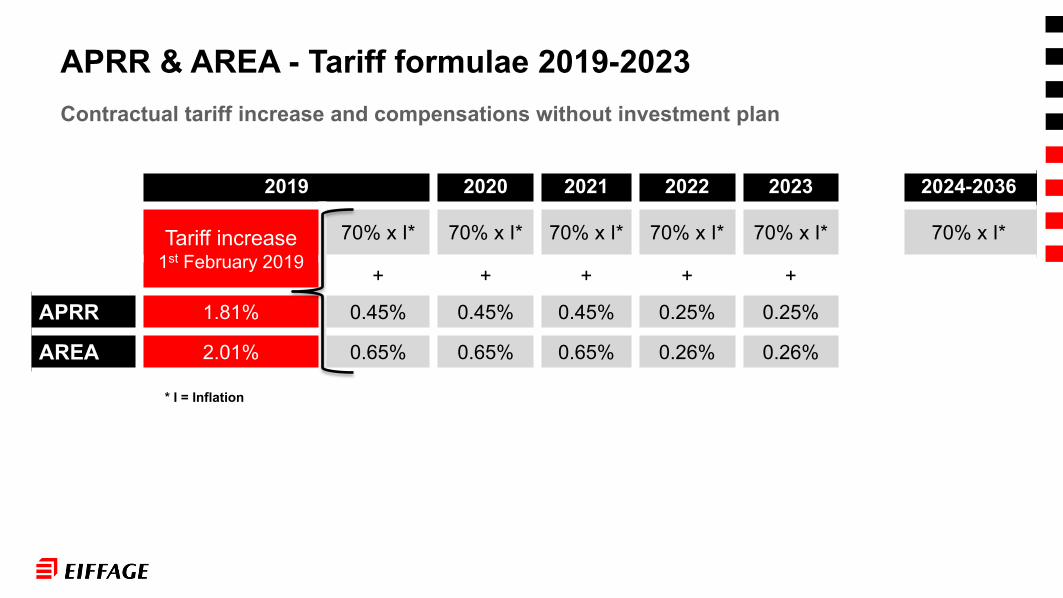
APRR & AREA - Tariff formulae 2019-2023
2019 2020 2021 2022 2023 2024-2036
Tariff increase 1st February 2019
70% x I* 70% x I* 70% x I* 70% x I* 70% x I* 70% x I*
+ + + + +
APRR 1.81% 0.45% 0.45% 0.45% 0.25% 0.25%
AREA 2.01% 0.65% 0.65% 0.65% 0.26% 0.26%
* I = Inflation
Contractual tariff increase and compensations without investment plan
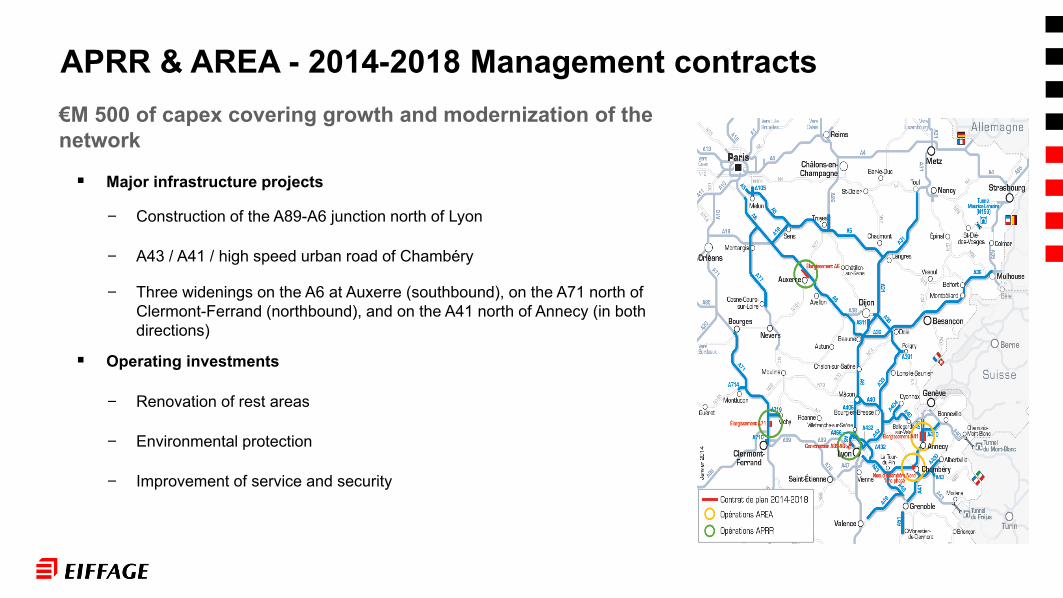
€M 500 of capex covering growth and modernization of the network
Major infrastructure projects
- Construction of the A89-A6 junction north of Lyon
- A43 / A41 / high speed urban road of Chambéry
- Three widenings on the A6 at Auxerre (southbound), on the A71 north of Clermont-Ferrand (northbound), and on the A41 north of Annecy (in both directions)
Operating investments
- Renovation of rest areas
- Environmental protection
- Improvement of service and security
APRR & AREA - 2014-2018 Management contracts
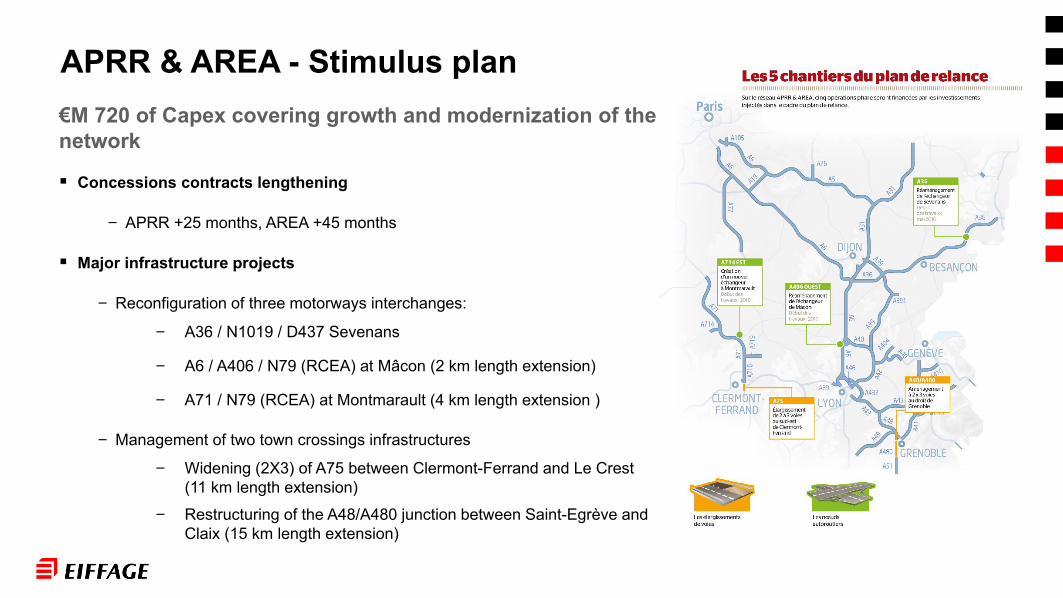
€M 720 of Capex covering growth and modernization of the network
Concessions contracts lengthening
- APRR +25 months, AREA +45 months
Major infrastructure projects
- Reconfiguration of three motorways interchanges:
- A36 / N1019 / D437 Sevenans
- A6 / A406 / N79 (RCEA) at Mâcon (2 km length extension)
- A71 / N79 (RCEA) at Montmarault (4 km length extension )
- Management of two town crossings infrastructures
- Widening (2X3) of A75 between Clermont-Ferrand and Le Crest (11 km length extension)
- Restructuring of the A48/A480 junction between Saint-Egrève and Claix (15 km length extension)
APRR & AREA - Stimulus plan

Exc. Mtm of the CNA debt and the swaps€M 592 €M 431 €M 262 €M 95 €M 11
APRR & Eiffarie - Financial net debt structure (€M)
6,6967,420 7,256 7,143 7,094
2,220 1,246 1,339 1,276 1,175
580396 110
9,4969,062 8,705
8,419 8,269
31/12/2014 31/12/2015 31/12/2016 31/12/2017 31/12/2018
Macquarie quasiequity
Eiffarie
APRR

500 500 500
700 700
500 500
700
500 500 500 500
700
54
103
375
0
100
200
300
400
500
600
700
800
900
1000
2019 2020 2021 2022 2023 2024 2025 2026 2027 2028 2029 2030 2031 2032 2033 2034
APRR - Gross debt profileProfile as at 31/12/2018 (€M)
* Repaid at the end of January 2019 ** due date March 2019
EMTN bonds details at 31/12/18Amount in €M Coupon Maturity Yeld
500 4.875% 21/01/2019 -0.16%500 Eur3m+0.75% 31/03/2019 Floating500 Eur3m+0.70% 03/01/2020 Floating500 2.25% 16/01/2020 -0.05%700 1.125% 15/01/2021 0.04%53 Inflation linked 25/01/2021 /
500 1.50% 15/01/2024 0.59%700 1.875% 15/01/2025 0.83%700 1.125% 09/01/2026 1.00%500 1.25% 06/01/2027 1.04%500 1.50% 25/01/2030 1.42%500 1.875% 06/01/2031 1.52%100 Inflation linked 05/04/2032 /500 1.625% 13/01/2032 1.64%700 1.5% 17/01/2033 1.71%
*
* *
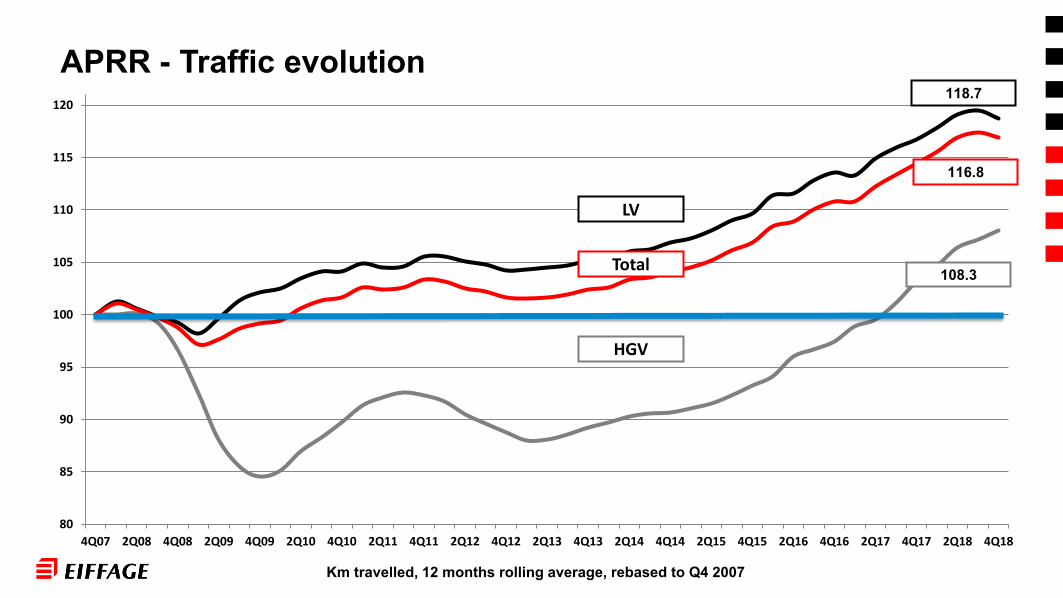
80
85
90
95
100
105
110
115
120
4Q07 2Q08 4Q08 2Q09 4Q09 2Q10 4Q10 2Q11 4Q11 2Q12 4Q12 2Q13 4Q13 2Q14 4Q14 2Q15 4Q15 2Q16 4Q16 2Q17 4Q17 2Q18 4Q18
Km travelled, 12 months rolling average, rebased to Q4 2007
APRR - Traffic evolution
HGV
LV
Total 108.3
118.7
116.8
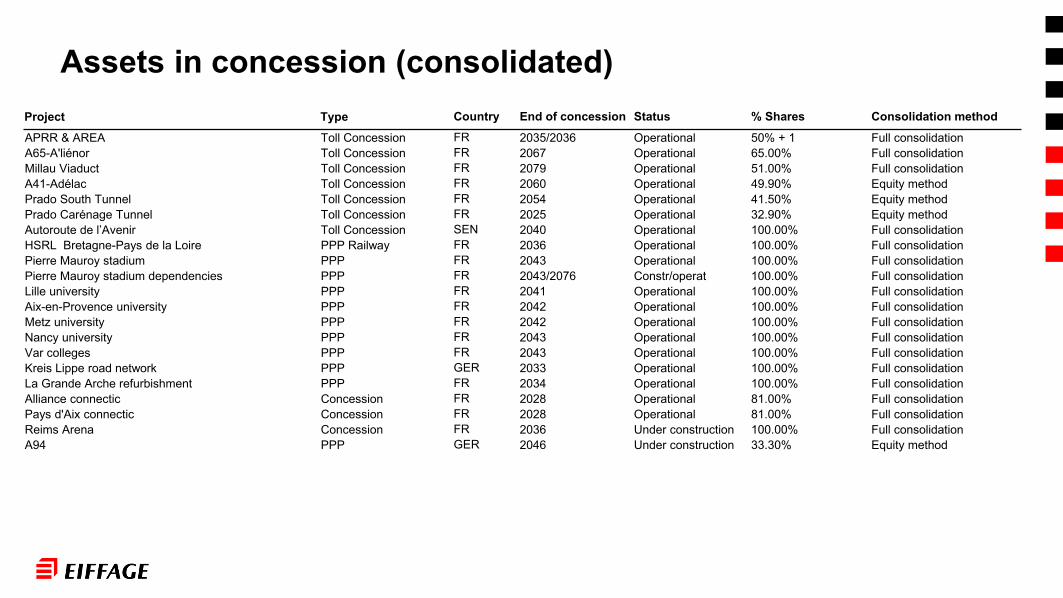
Assets in concession (consolidated)Project Type Country End of concession Status % Shares Consolidation methodAPRR & AREA Toll Concession FR 2035/2036 Operational 50% + 1 Full consolidationA65-A'liénor Toll Concession FR 2067 Operational 65.00% Full consolidationMillau Viaduct Toll Concession FR 2079 Operational 51.00% Full consolidationA41-Adélac Toll Concession FR 2060 Operational 49.90% Equity methodPrado South Tunnel Toll Concession FR 2054 Operational 41.50% Equity methodPrado Carénage Tunnel Toll Concession FR 2025 Operational 32.90% Equity methodAutoroute de l’Avenir Toll Concession SEN 2040 Operational 100.00% Full consolidationHSRL Bretagne-Pays de la Loire PPP Railway FR 2036 Operational 100.00% Full consolidationPierre Mauroy stadium PPP FR 2043 Operational 100.00% Full consolidationPierre Mauroy stadium dependencies PPP FR 2043/2076 Constr/operat 100.00% Full consolidationLille university PPP FR 2041 Operational 100.00% Full consolidationAix-en-Provence university PPP FR 2042 Operational 100.00% Full consolidationMetz university PPP FR 2042 Operational 100.00% Full consolidationNancy university PPP FR 2043 Operational 100.00% Full consolidationVar colleges PPP FR 2043 Operational 100.00% Full consolidationKreis Lippe road network PPP GER 2033 Operational 100.00% Full consolidationLa Grande Arche refurbishment PPP FR 2034 Operational 100.00% Full consolidationAlliance connectic Concession FR 2028 Operational 81.00% Full consolidationPays d'Aix connectic Concession FR 2028 Operational 81.00% Full consolidationReims Arena Concession FR 2036 Under construction 100.00% Full consolidationA94 PPP GER 2046 Under construction 33.30% Equity method
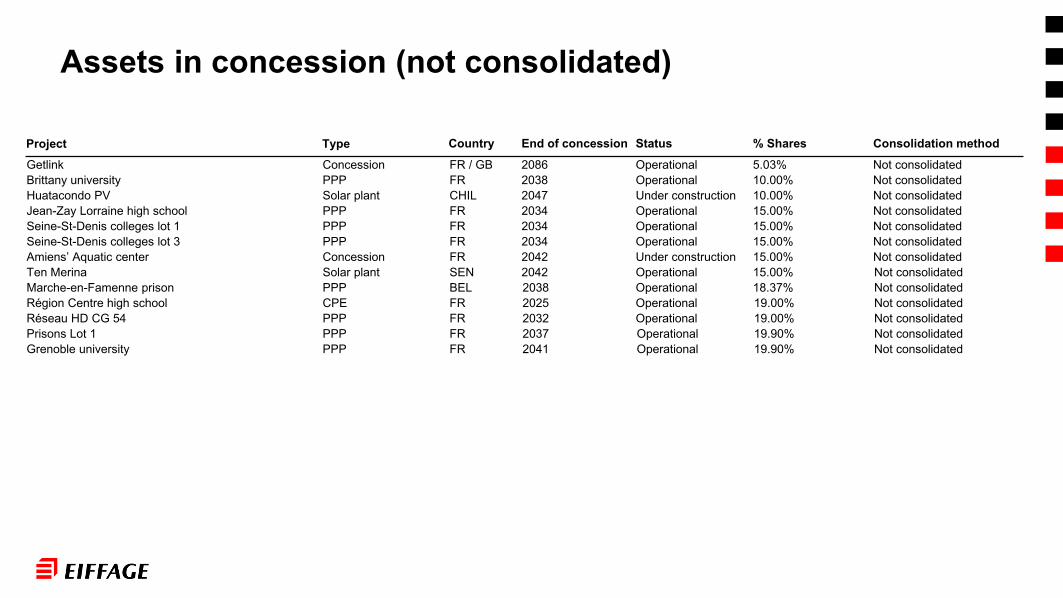
Assets in concession (not consolidated)
Project Type Country End of concession Status % Shares Consolidation methodGetlink Concession FR / GB 2086 Operational 5.03% Not consolidatedBrittany university PPP FR 2038 Operational 10.00% Not consolidatedHuatacondo PV Solar plant CHIL 2047 Under construction 10.00% Not consolidatedJean-Zay Lorraine high school PPP FR 2034 Operational 15.00% Not consolidatedSeine-St-Denis colleges lot 1 PPP FR 2034 Operational 15.00% Not consolidatedSeine-St-Denis colleges lot 3 PPP FR 2034 Operational 15.00% Not consolidatedAmiens’ Aquatic center Concession FR 2042 Under construction 15.00% Not consolidatedTen Merina Solar plant SEN 2042 Operational 15.00% Not consolidatedMarche-en-Famenne prison PPP BEL 2038 Operational 18.37% Not consolidatedRégion Centre high school CPE FR 2025 Operational 19.00% Not consolidatedRéseau HD CG 54 PPP FR 2032 Operational 19.00% Not consolidatedPrisons Lot 1 PPP FR 2037 Operational 19.90% Not consolidatedGrenoble university PPP FR 2041 Operational 19.90% Not consolidated

Assets in concessionCarrying value of assets held under concession (€M)* 31/12/2016 31/12/2017 31/12/2018
APRR & AREA 10,258 10,036 9,835A65 – A’liénor 993 982 973A41 - Adélac 68 73 79Millau viaduct 359 359 355Prado Carénage Tunnel 24 25 25Prado South Tunnel 9 9 23 Autoroute de l’Avenir 103 101 102HSRL Bretagne-Pays de la Loire 1,003 1,112 1,078Grande Arche refurbishment 176 177 171 Pierre Mauroy stadium and dependencies 348 354 367Nancy university 14 39 27 Metz university 29 30 28Lille university 39 38 36 Aix-en-Provence university 57 27 22 Le Plessis-Robinson (92) covered market 10 - -Var colleges 25 71 72Grenoble university 60 - -Jean-Zay high school 55 - -Seine-St-Denis colleges lot 1 & 3 198 - -Others concessions & PPP 60 64 69 National Police HQ - - -Norscut - - -LGV Perpignan-Figueras - - -Total 13,888 13,497 13,262
* Fully consolidated: 100% of asset/ Equity method: Group share
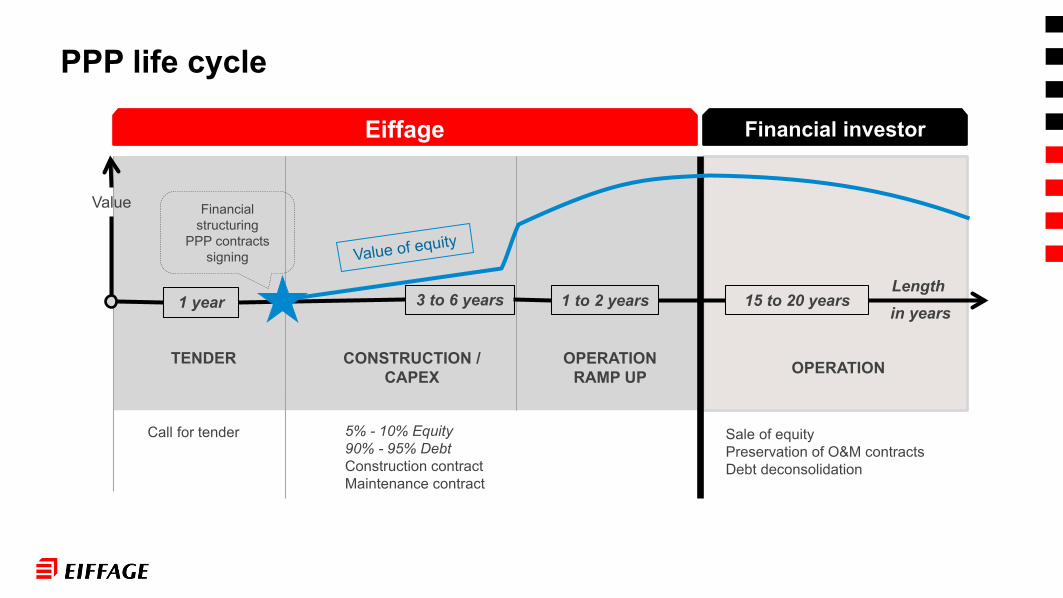
CONSTRUCTION / CAPEX
TENDER OPERATION RAMP UP
PPP life cycle
Eiffage
Call for tender 5% - 10% Equity 90% - 95% DebtConstruction contractMaintenance contract
Sale of equity Preservation of O&M contracts Debt deconsolidation
Financial investor
Lengthin years1 year 3 to 6 years 1 to 2 years 15 to 20 years
Value Financial structuring
PPP contracts signing
OPERATION

2017 published 2017 restated
M€ % M€ %
Construction 153 4.1% 156 4.0%
Infrastructures 119 2.5% 119 2.5%
Energy Systems 158 4.2% 158 4.2%
Sub-total Contracting 430 3.5% 433 3.5%
Concessions 1,317 48.1% 1,317 48.3%
Holding (18) (18)
Total Group 1,729 11.5% 1,732 11.5%
Net profit Group Share* 512 515
2,739 2,727
3,783 3,782
4,704 4,704
3,750 3,868
2017 published 2017 restated
Construction InfrastructuresEnergy Systems Concessions
Revenue €M Operating profit & net profit
14,979 15,081
IFRS 15: revenue, operating profit, net profit
*Excluding non-recurring adjustment in deferred tax for +33M€ in 2017
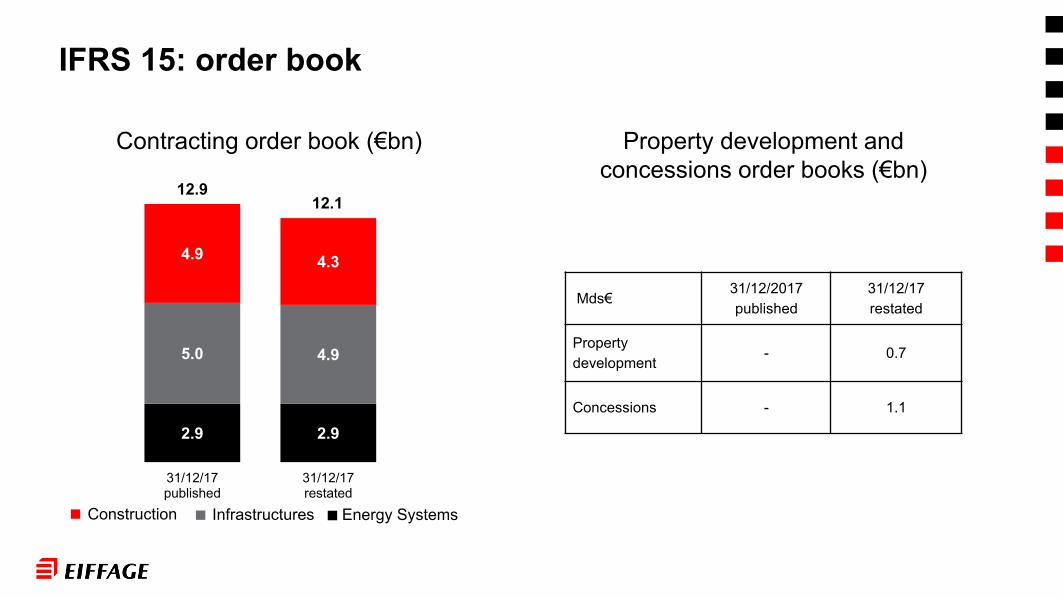
Mds€31/12/2017 published
31/12/17restated
Propertydevelopment
- 0.7
Concessions - 1.1
IFRS 15: order book
Contracting order book (€bn)
Construction Infrastructures Energy Systems
Property development and concessions order books (€bn)
2.9 2.9
5.0 4.9
4.9 4.3
12.912.1
31/12/17published
31/12/17restated