The role of seed/ware potato cooperatives in Ethiopia in ...

Report 546
Annette Pronk, Romke Wustman, Anton Haverkort, Lubbert van den Brink, Bas Janssens & Maureen Schoutsen
Annual Report Topsector Potato India and Ethiopia 2013


Annette Pronk1, Romke Wustman2, Anton Haverkort1, Lubbert van den Brink2, Bas Janssens3 & Maureen Schoutsen2
Plant Research International, part of Wageningen UR
Business Unit Agrosystems Research Report 546 March 2014
Annual Report Topsector Potato India and Ethiopia 2013
Benchmarking potato storage in Gujarat and Punjab Evaluation of the yielding performance of various potato seed lots in Punjab Optimal use of land and water of potatoes for various uses in Gujarat and Punjab Energy costs of potato for various uses in Gujarat and Punjab Possibilities to improve potato production Potato – and potato products – marketing and consumer survey in Delhi NCR
1 Plant Research International (PRI), Wageningen UR 2 Applied Plant Research (PPO), Wageningen UR 3 Agricultural Economics Research Institute (LEI), Wageningen UR

© 2014 Wageningen, Foundation Stichting Dienst Landbouwkundig Onderzoek (DLO) research institute Plant Research International. All rights reserved. No part of this publication may be reproduced, stored in a retrieval system, or transmitted in any form or by any means, electronic, mechanical, photocopying, recording or otherwise, without the prior written permission of the DLO, Plant Research International, Business Unit Agrosystems Research. The Foundation DLO is not responsible for any damage caused by using the content of this report. Copies of this report can be ordered from the (first) author. The costs are € 50 per copy (including handling and administration costs), for which an invoice will be included.
Plant Research International, part of Wageningen UR Business Unit Agrosystems Research Address : P.O. Box 616, 6700 AP Wageningen, The Netherlands : Wageningen Campus, Droevendaalsesteeg 1, Wageningen, The Netherlands Tel. : +31 317 48 04 78 Fax : +31 317 41 80 94 E-mail : [email protected] Internet : www.wageningenUR.nl/en/pri

Table of contents
page
Preface 1
Executive summary 3
1. Introduction 7
2. Benchmarking potato storage in Gujarat and Punjab 9
2.1 Executive summary 9 2.2 Introduction 9 2.3 The potato industry in Gujarat 10 2.4 The potato industry in Punjab 14 2.5 Discussion and conclusions 15 2.6 Suggestions for improvement and R&D in 2013/4 15
3. Evaluation of the yielding performance of various potato seed lots in Punjab 17
3.1 Executive summary 17 3.2 Introduction 17 3.3 Materials and methods 19
3.3.1 Collection of the seed lots 19 3.3.2 Quality assessment of the seed lots 19 3.3.3 The field experiment 19
3.4 Results 21 3.4.1 Information of the collected seed lots 21 3.4.2 Quality of the seed lots 21
3.5 Preliminary conclusions 23
4. Optimal use of land and water of potatoes for various uses in Gujarat and Punjab 25
4.1 Executive summary 25 4.2 Introduction 25 4.3 Materials and methods 25 4.4 Results 27
4.4.1 Results of Gujarat 27 4.4.2 Results of Punjab 29
4.5 Conclusions 31
5. Energy costs of potato for various uses in Gujarat and Punjab 33
5.1 Executive summary 33 5.2 Introduction 33 5.3 Results 35
5.3.1 Results of the interviews 35 5.3.2 Results of modelling CO2 charges of potato crops 37
5.4 Conclusions 40

6. Possibilities to improve potato production 41
6.1 Executive summary 41 6.2 Introduction 42 6.3 Results 42
6.3.1 Results of Gujarat 42 6.3.2 Results of Punjab 44
6.4 Conclusions 47
7. Potato – and potato products – marketing and consumer survey in Delhi NCR 49
7.1 Executive summary 49 7.2 Introduction 50 7.3 Delhi National Capital Region (NCR) 50 7.4 Main Potato flows in Delhi NCR 55 7.5 Processed potatoes: French fries and frozen products 60 7.6 Processed potatoes: Chips and snacks 62 7.7 Concluding remarks 67
References 69
Appendix I. Some prices of potato products 1 p.
Appendix II. Activities potato project India 2011-2013 2 pp.
Appendix III. Activities potato project Ethiopia 2011-2013 1 p.
Appendix IV. A news item in the Punjab paper on the visit of the Dutch team to POSCON 1 p.
Appendix V. A news item of the trial at the Punjab Agricultural University and the visit of the Dutch team 1 p.
Appendix VI. Ludhiana News/Farm experts from Netherlands and Poscon visit PAU 2 pp.
Appendix VII. 1 p.
Appendix VIII. The Tribune 6th Dec 2013 1 p.

1
Preface
The Agricultural Counsellor of the Netherlands Embassy in Delhi initiated a BOCI project ‘Overview of the potato chain in India’ in early 2011. In September 2012 this initiative has been adopted by the Dutch and Indian stake-holders and the Pubic Private Partnership (PPS) was established to facilitate the intensification of collaboration between Dutch and Indian stakeholders of the potato chain. A team of Wageningen UR researchers was commissioned to carry out this project. In 2011, the team collected information from reports, personal files, internet and some Dutch companies and reported the information in 'An overview of the potato sector in India and prospects of Indo & Dutch cooperation'. The team also participated in the Netherlands Trade mission to India (5 & 11 June 2011) and visited the Central Potato Research Institute at Shimla. Furthermore jointly with the Agricultural Counsellor we organized a potato seminar to present our findings on 5 October 2011 in Delhi. Major potato stakeholders both from India and from The Netherlands attended the seminar; total number of participants was about 60 persons. In 2012 and 2013 the team carried out different tasks such as presenting information on various subjects of the Dutch and Indian potato chain to exchange knowledge. In addition, subjects for further investigation were identified. All actions and activities aimed to facilitate collaboration between Dutch and Indian stakeholders. Visits to different locations of India accompanied by Dutch stakeholders, meetings with experts of the Indian potato production chain both stakeholders and researchers, and yield gap analysis were successfully accomplished. The WUR team was steered by the Netherlands Agro Food Technology Centre (NAFTC) in Delhi. The NAFTC was in charge of facilitating the collaboration between the NAFTC DPC (Dutch Potato Centre) members and the WUR researchers. The collaboration with NAFTC is appreciated. This report focuses on India as Ethiopia activities were not conducted in 2013. Corné Kempenaar Coordinator Wageningen UR research team

2
3
Executive summary
A potato yield gap footprinting analysis was conducted in Gujarat and Punjab. Farmers were visited and information was obtained about different aspects of the growing of potatoes. The energy costs of potato production were calculated and compared with energy costs in other potato growing areas. Optimal land and water use were studied by calculating the attainable yields and the irrigation needs for the different cropping systems. Possibilities to improve potato production were suggested. In both states the results of the study were presented and discussed in a workshop.
Benchmarking potato storage in Gujarat and Punjab
The study on potato storage in Gujarat and Punjab aims to describe the present state of the potato storages in both states and to suggest improvements which enhance the performances of present stores by introducing advanced technology for better performance of stores in terms of 1) higher quality of stored potatoes and 2) minimal costs per kg stored potatoes. The present study describes the results of the storage survey conducted in both states from 1 till 12 August 2013 as the first step towards 1) and 2). The survey was arranged in collaboration with the Horticulture departments of both states, the processing industries and store owners in Gujarat, and (seed) potato producers and store owners in Punjab. A total of 17 stores were visited and information was collected from store owners, processors and horticultural department officials. In Gujarat as well as in Punjab, storage owners claim that the lack of financial resources to invest in improvements of the cold storage facilities is due to (too) low rental charges. Presently, cold store owners store many small seed lots. Growers, on the other hand, have little to no awareness of the effects of stores and store management on quality and quality loss of the potatoes and subsequently the yielding performance. As a result, growers do not consider storage as an important part of the production of potatoes from seed to delivery to the buyer and they may consider storage only as a cost that should be minimized. It may also be that growers do not know how to enforce good cold storage as most growers have small lots and limited influence on cold store managers. Growers with small lots oppose bulk stores as their lots will be easily mixed up. To break through this impasse, growers need to become aware of the effects of cold storage on the quality of the potatoes and most important, growers need to be paid for the quality of the delivered potatoes (processing industry, seed and retailers). A present trend appears to be that (large) growers construct their own stores, so taking responsibility for their product with respect to meeting the specifications of processors (and retailers in the near future).
Evaluation of the yielding performance of various potato seed lots in Punjab
A seed potato performance experiment started in October 2013 in Punjab as a result of the findings of the bench mark study earlier that year. The experiment was aimed at the exploration of the variation in yield and quality of fifty seed potato lots of the most common potato variety Kufri Pukhrai and was conducted in collaboration with POSCON (Federation of seed potato growers in Punjab, Jalandhar, India), Punjab Agricultural University (PAU, Ludhina, India) and Wageningen University & Research centre (WUR, Netherlands). Fifty selected seed lots of different cold storage facilities of the potato variety Kufri Pukhrai were planted at a field maintained by PAU. Before planting, seeds were evaluated for a number of quality aspects such as development of the sprouts and diseases. Seeds were planted on 14 October 2013 and cultured according to local practises. The evaluation of the seed showed large differences in quality between the different lots. The majority of the seed lots had a visual quality of 7.5 or higher (scale 1 very bad to 9 very good) and most tubers were quite firm. However, only 19 of the 50 seed lots had the desired size of 30 - 40 mm (comparable with a mean tuber weight of 35 - 55 g). Quality loss was mainly caused by dry and wet rot, physical damage caused by the harvesting machine and thumb nail cracks whereas the other diseases were of minor importance (Black scurf, Silver scurf, Scab, net scurf). Thumb nail cracks develop through rough handling of the potato. The field trial is yet to be evaluated.

4
On the quality aspects of the seed lots, it is concluded that two factors are important: quality loss during storage due to dry and wet rot, which is enhanced by mechanical damage caused by handling, and insufficient grading.
Optimal land and water use
The optimal land and water use was investigated in Gujarat and Punjab in 2013 by interviewing growers. The attainable yields were calculated for the cropping systems of the interviewed farmers and compared with the actual yields. The cropping systems were ware, chips and French fries in Gujarat and seed autumn, ware spring and chips autumn in Punjab. As for irrigation, the irrigation need was compared with the applied irrigation. The attainable yield and the irrigation need were calculated with the LINTUL-potato growth model with actual weather data. The results show that most cropping systems yielded on average 66 to 79% of the attainable yield, indicating that yields can be improved. Irrigation was applied approximately 2 to 3 times the irrigation need. In Gujarat sprinkler irrigation is being replaced by drip irrigation which improves the water use efficiency. A Decision Support System can support improvements further. Although irrigation in Punjab is not known by the growers, furrow irrigation system most likely induced unnecessary over irrigation. Actions to investigate the actual amount of applied irrigation are needed to develop guidelines for improved irrigation strategies. Looking at the water footprint, expressed as the amount of water needed to produce 1 ton of fresh potatoes, differences between the water needed to produce 1 ton of attainable yield of the actual yield were substantial. In Gujarat, about 1.7 times more irrigation was applied than needed to produce 1 ton of attainable fresh potatoes. In Punjab, up to 3.2 times more irrigation was applied than needed to produce 1 ton of attainable fresh potatoes. These results show that the water footprint has scope to be improved. From this study it can be concluded that both yield and water use show room for improvement.
Energy costs of potato for various uses in Gujarat and Punjab
Three potato production systems were studied in the state of Gujarat and four potato production systems were studied in the state of Punjab. In Gujarat the production of fresh ware potatoes and processing potatoes for the chipping and processing potatoes for the French fries industry. In Punjab it concerned seed production and processing potatoes for the chips industry in autumn and ware potato production in spring and autumn. The CO2 footprint was taken as a measure for easy comparison and use was made of the Cool Farm Tool (app.coolfarmtool.org). The cost of production in terms of CO2 consists of that embedded in the seed production including its storage and transport, in the inputs such as chemical fertilizers and biocides, the diesel to run the tractor for land preparation and harvesting and the electricity for pumping irrigation water. Storage costs in terms of CO2 are around 35 kg/t when the store is 25 °C cooler than ambient air and diesel for represent 17.6 kg per 100 km per ton. Producing potato in Gujarat ex-field was calculated at around 280 kg CO2 per ton potato, in Punjab autumn seed around 320 kg, autumn ware 60 kg more as more fertilizer and more irrigation (earlier planting) are responsible for higher CO2 costs of the Punjab autumn ware crop; the Punjab spring ware charges about 370 kg. Producing seed potato in Punjab, storing it for 8 months and then transporting them by truck to West Bengal adds up to almost 1000 kg CO2 per ton potato. Options to reduce costs consists of: • Reduction of seed rate, currently 2.8 ton for French fries potato in Gujarat to 4.2 ton for seed potato
production in Punjab, • Using drip instead of sprinkler irrigation in Gujarat may reduce water use by 29% and energy costs by 37%.
Using Sprinkler or even drip in Punjab rather than flood irrigation ultimately may reduce water use by 60% and energy us by 70%,
• Especially with furrow (over)irrigation in Punjab much fertilizer, notably nitrogen is leached out. As a result in Punjab growers apply about 2x more nitrogen per ton harvested potatoes than in Gujarat. Here changed agricultural practices will reduce costs,
• Modern storage practices with improved stores, especially bulk will strongly reduce storage costs.

5
Possibilities to improve potato production
Potato production systems in Gujarat and Punjab were analysed by means of interviewing farmers and visiting their fields. In both states the actual yield is lower than the attainable yield calculated with the crop growth model LINTUL-potato. For both states it was possible to identify factors that can be improved. The lists of recommendations are preliminary lists, because fields were only visited at the start of the potato growing season. Based on visits later on in the growing season other recommendations could be added to the lists. In Gujarat the following recommendations can be given: • Quality of seed potatoes can be improved. In several visited fields too many plants were missing and rotten
seed pieces were found in fields which had been planted two or three weeks earlier. Most farmers are receiving seed potato lots with a large variation in tuber size. Cutting oversized seed tubers in pieces of 25 - 30 gram is common practise. Cutting of seed potatoes will increase the risk of spreading fungal and bacterial diseases and there is also a risk of ending up with tuber pieces without any sprout. Obtaining small-sized, healthy seed potatoes could solve this problem. In this way also very high amounts of seed potatoes (up to 4.4 ton/ha) could be avoided. Also seed treatment before planting with Moncerene could probably be optimized,
• Fertilization can be improved by analysing the soil and applying fertilizers according to amounts of nutrients available in the soil. Some farmers are giving very high amounts of nitrogen, phosphate and potassium. Production costs can be reduced if these high amounts could be avoided,
• Control of pests and diseases can be improved by introducing modern spraying machines, equipped with a boom with nozzles. Spraying with fungicides and insecticides is done with a knapsack or with a handheld sprayer with a tube connected with a tank mounted on a tractor which is located in front of the field,
• Covering of the crop with pesticides is expected to be irregular. Other possibilities for improving control of pests and diseases are: introducing Decision Support Systems and evaluating the applied fungicides and insecticides,
• Optimizing drip irrigation by determining the availability of water in the soil and combining drip irrigation with fertilization (fertigation).
In Punjab the following recommendations can be given: • Quality of planted seed potatoes and also quality of the produced seed potatoes can be improved by:
• Careful handling of the seed potatoes at harvest, transport, loading and unloading of the store to avoid thumb nail cracks as much as possible,
• Storing seed potatoes in netted bags (instead of jute bags) in improved (traditional) stores with improved air ventilation,
• Treating the seed potatoes with fungicides before storing to reduce the losses caused by Fusarium dry rot,
• Optimizing the control of Rhizoctonia (choice of fungicides, method of application), • Control of pests and diseases can be improved by introducing modern spraying machines, equipped with a
boom with nozzles. Spraying with fungicides and insecticides is mostly done by a gun sprayer mounted on a tractor. The gun is manually or automatically handled. Covering of the crop with pesticides is expected to be irregular. Other possibilities for improving control of pests and diseases are: introducing Decision Support Systems and evaluating the applied fungicides and insecticides,
• Fertilization in Punjab can be improved by analysing the soil and adjusting the applied amounts of nutrients according to the amounts in the soil. Avoiding over-irrigation is also important for the efficient use of fertilizers,
• Fertilization with sea weed extracts, like Australian power, should be evaluated, • Possibilities to replace furrow irrigation by drip irrigation should be studied.
Potato – and potato products – marketing and consumer survey in Delhi NCR
This survey was carried out from 18 - 22 November 2013. The research team has acquired data on flows of potatoes and potato (products) sold in Delhi National Capital Region (NCR) and obtained an impression of consumer consumption preferences (of both potato and potato products). The researchers carried out a number of (>20) in
6
depth interviews with representatives of different stakeholders within the potato supply chain and obtained additional data from a google-search. The population in Delhi NCR (population 2011: 46 million people) will grow yearly with 2.5%. Delhi’s per capita income is amongst the highest of the country. Traded volumes of fresh potatoes on Delhi NCR wholesale markets will stabilize at 1 million tons or decrease slightly: due to changing food habits consumers will prefer prepared potato products instead of fresh potatoes. Supermarkets increase direct buying from cold stores outside Delhi NCR.
Table 1. Consumption of potatoes and potato products in Delhi NCR (in tons, 2011).
Fresh product 1,000,000 Chips (processed product) 23,000 French fries (processed product) 6,680
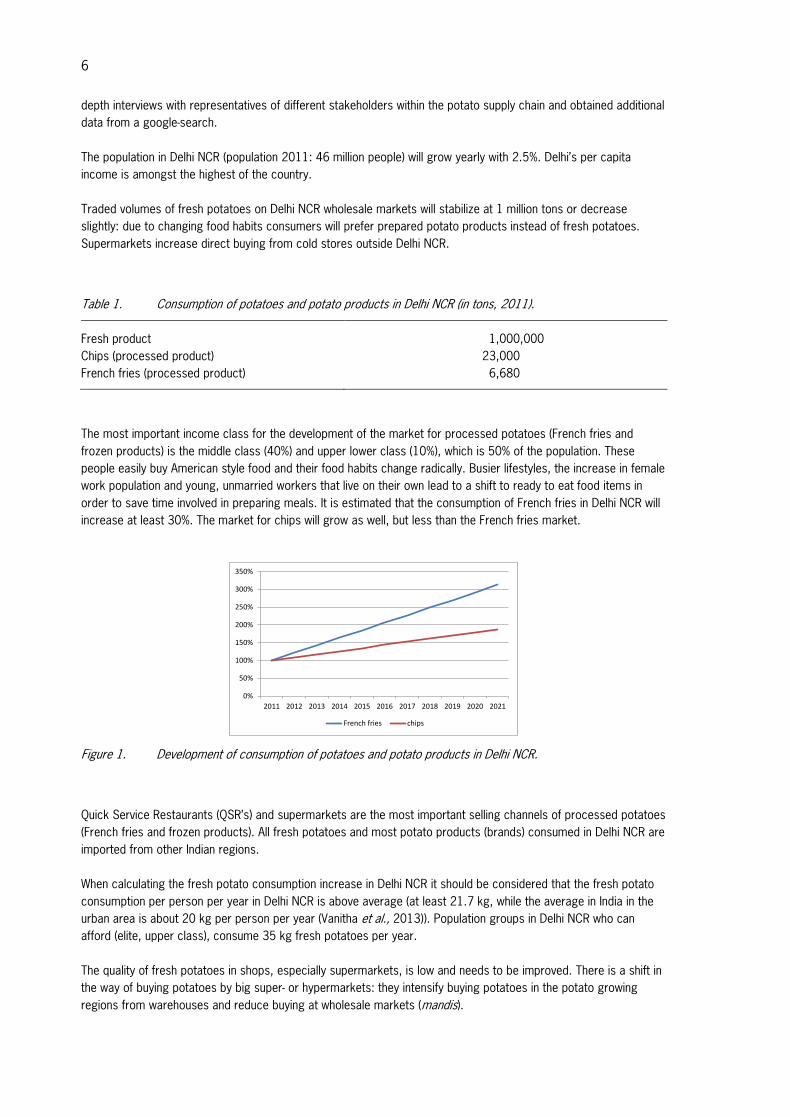
The most important income class for the development of the market for processed potatoes (French fries and frozen products) is the middle class (40%) and upper lower class (10%), which is 50% of the population. These people easily buy American style food and their food habits change radically. Busier lifestyles, the increase in female work population and young, unmarried workers that live on their own lead to a shift to ready to eat food items in order to save time involved in preparing meals. It is estimated that the consumption of French fries in Delhi NCR will increase at least 30%. The market for chips will grow as well, but less than the French fries market.
Figure 1. Development of consumption of potatoes and potato products in Delhi NCR.
Quick Service Restaurants (QSR’s) and supermarkets are the most important selling channels of processed potatoes (French fries and frozen products). All fresh potatoes and most potato products (brands) consumed in Delhi NCR are imported from other Indian regions. When calculating the fresh potato consumption increase in Delhi NCR it should be considered that the fresh potato consumption per person per year in Delhi NCR is above average (at least 21.7 kg, while the average in India in the urban area is about 20 kg per person per year (Vanitha et al., 2013)). Population groups in Delhi NCR who can afford (elite, upper class), consume 35 kg fresh potatoes per year. The quality of fresh potatoes in shops, especially supermarkets, is low and needs to be improved. There is a shift in the way of buying potatoes by big super- or hypermarkets: they intensify buying potatoes in the potato growing regions from warehouses and reduce buying at wholesale markets (mandis).
0%
50%
100%
150%
200%
250%
300%
350%
2011 2012 2013 2014 2015 2016 2017 2018 2019 2020 2021
French fries chips

7
1. Introduction
India holds third position in potato area and second position in total potato production in the world (NHB 2011). About 90% of the crops are grown in the plains during the cooler autumn, winter and early spring seasons; the remaining is grown in summertime at higher elevations most in the lower Himalayas and some in Karnataka. The average national yield is around 23 tons per hectare (Vanitha et al. 2013); the yield level in better performing states varies from 25 – 29 tons per hectare for Punjab and West Bengal in 2012 - 2013 respectively (www.nhrdf.com). Potato has the third position in per capita availability of food crops after rice (1th) and wheat (2nd). About 3% of the national seed requirement originates from the national seed potato multiplication scheme; implying that 97% of the acreage is planted which more or less degenerated seed. Cold storage capacity covers about 50% of the national production, leading to high levels of post-harvest losses after the winter crop harvests. About 1% of the national production is processed into potato chips. The cost of potato production is rather low which provides great future for processing. India is not exporting its potatoes to other countries. The Central Potato Research Institute (CPRI) has a monopoly on variety development and seed production. Imports of foreign varieties and seed is banned although processing companies may negotiate exemptions. Several opportunities for cooperation between Indian and Netherlands companies and institutions were identified. The themes for cooperation are: varietal development; seed production; introduction of Good Agricultural Practices (GAP); improving storage, storage management and processing qualities; yield gap analysis and yield increase goals; production of high quality raw material for potato processing factories. It is suggested that the implementa-tion is to be carried out in a Public Private Partnerships (PPP). More information on the background of India is provided by Wustman et al. (2011). That study proved that a PPS would significantly stimulate the stakeholders market opportunities throughout the potato production chain. As from 2012 the PPS was established and the tasks are being executed. The Netherlands Agro Food Technology Centre (NAFTC) was established to facilitate the collaboration between its (potato) members and he WUR researchers. The WUR team informed NAFTC on all its activities such as visits and workshops. The purpose of the visits and workshops is: • To exchange information and knowledge on the Indian potato production chain, • To perform a yield gap analysis, that is to screen the potato production chain for improvements on cultural
practices, yield and quality, resource use efficiencies and losses, • To initiate collaboration and trade in a number of fields in the potato chain and • To create goodwill aimed at removing bans on import of seed potatoes and potato varieties. A team of Dutch potato specialists was composed to carry out the above presented tasks. Contacts were establis-hed with McCain, POSCON and Punjab Agricultural University (PAU). After a screening of the storage systems of Gujarat and Punjab, initiatives resulted in a field trail to evaluate the yielding performance of various potato seed lots in Punjab in collaboration with PAU. The resource use efficiency of land, water and energy was made possible through interviews with farmers. The interviews were also used to collect information to identify possibilities to improve the potato production. The results were shared with stakeholders, farmers and representatives from Shimla. The December visit has not passed by unnoticed: a Punjab newspaper made an item of the visit of the Dutch team to POSCON (Appendix IV) and several news items appeared from the visit at PAU (Appendix V, VI, VII and VIII). A marketing and consumer survey in Delhi NCR was carried out to investigate the potential of processed potato products for the coming years. An overview of all activities is presented in Appendix II and III.

8

9
2. Benchmarking potato storage in Gujarat and Punjab
Romke Wustman; Wageningen University & Research centre, Applied Plant Research (PPO), the Netherlands Lubbert van den Brink; Wageningen University & Research centre, Applied Plant Research (PPO), the Netherlands
2.1 Executive summary The study on potato storage in Gujarat and Punjab aims to describe the present state of the potato storages in both states and to suggest improvements which enhance the performances of present stores by introducing advanced technology for better performance of stores in terms of 1) higher quality of stored potatoes and 2) minimal costs per kg stored potatoes. The present study describes the results of the storage survey conducted in both states from 1 till 12 August 2013 as the first step towards 1) and 2). The survey was arranged in collaboration with the Horticulture departments of both states, the processing industries and store owners in Gujarat, and (seed) potato producers and store owners in Punjab. A total of 17 stores were visited and information was collected from store owners, processors, horticultural department officials. In Gujarat as well as in Punjab, storage owners claim lack of financial resources to invest on improvements of the cold storage facilities due to (too) low rental charges. Presently, cold store owners store many small seed lots. Growers, on the other hand, have little to no awareness of the effects of stores and store management on quality and quality loss of the potatoes and subsequently the yielding performance. As a result, growers do not consider storage as an important part of the production of potatoes from seed to delivery to the buyer and they may consider storage only as a cost which should be minimized. It may also be that growers do not know how to enforce good cold storage as most growers have small lots and limit influence on cold store managers. Growers with small lots oppose bulk stores as their lots will be easily mixed up. To break through this impasse, growers need to become aware of the effects of cold storage on the quality of the potatoes and most important, growers need to be paid for the quality of the delivered potatoes (processing industry, seed and retailers). A present trend appears to be that (large) growers construct their own stores, so taking responsibility for their product with respect to meeting the specifications of processors (and retailers in the near future).
2.2 Introduction The Action Plan describing the collaboration between India and the Netherlands lists a number of activities in the field of potato. One such activity is the establishment of Centres of Excellence (CoE) for potato in two states: Gujarat and Punjab. The Indian Government is to provide the funding for botch centres; while the Netherlands has developed a plan for the hardware and the knowledge transfer to be implemented in the CoE’s. Part of the Dutch contribution is to describe the present state of the potato storages in both states and to suggest improvements enhancing the performances of present stores and introducing advanced technology for better performance of stores in terms of 1) high quality of stored potatoes and 2) minimal costs per kg stored potatoes. The present study is the first step towards 1) and 2). This report describes the results of the storage survey conducted in both states from 1 till 12 August 2013. The survey was arranged in collaboration with the Horticulture departments of both states, processing industries and store owners in Gujarat and (seed) potato producers and store owners in Punjab. A total of 17 stores were visited and information was collected from store owners, processors, horticultural department officials.

10
2.3 The potato industry in Gujarat Some key figures of the Gujarat potato industry (2012):
Total area under potato cultivation: 80,000 hectares Production: 250,000 tons Hectares under seed potato: 0 Hectares under processing potato: 6,000 hectares Average yield per hectare: 30 tons Stored potatoes: 1,100,000 metric ton Processed: about 150,000 metric ton Marketed: 100% of processed Home consumption: 90% of the total production Processed: Flakes and fries: 3% of the total production Crisps: 9% Storage costs: INR 233 per ton and per month (INR 1,400 per ton for six months)
Potato cold stores in Gujarat
Three categories of potato cold stores (and share of total capacity) in Gujarat were identified: Traditional stores: estimated 75-80% Upgraded traditional stores: estimated 15-20% Stores using advanced technology: estimated 5% Traditional store A traditional potato store is a multi-storied construction, usually having one or two floors dug into the ground (cellar) and the remaining floors above ground level. The floors are separated by slatted floors made of wooden planks. Each store has four to five chambers and a staircase in the centre of each chamber. The cooling machines are mounted on the top floor, the cold air is ‘dropping’ from the top floor to the ground floor. Forced ventilation is lacking. Temperature variation in most traditional stores has been reported to be 3 - 4oC; which is substantial. This may explain a more rapid ageing (senescing sweetening) of potatoes for processing resulting in a decreasing processing quality. The most common storage capacity is 5,000 tons; potato is the only product stored and is kept in 50 kg bags. The use of tightly woven jute bags is decreasing, but these bags are still used in some stores. Ventilation in these tightly woven jute bags is very poor. The use of wider meshed artificial fibre bags is on the rise. The bags are carried in and out of the store by manual labour. The bags are stacked on slatted floors. Careful handling of the bags during loading and unloading is lacking: potatoes are damaged when thrown on the ground or when thrown in trucks. Walking paths are between the stacks. Stacking height is 1.5 up to 1.8 m. Horizontal stack sizes vary from 2 to 8 m; resulting in a stack size of up to 30 tons; without any internal ventilation and temperature measurement within the stack. Only air temperature is measured at a restricted number of positions within the store. One or two thermometers were installed per floor which is too low for adequate temperature recording in the store. Thermometers are mostly not calibrated. Temperature levels are handwritten recorded twice a day. Product temperature is not measured. Cooling machines are manually operated. Energy saving devices are mostly absent. Processing potatoes can be stored in a traditional store from February to August/early September. Storage during a longer period is frequently resulting in inferior (processing) quality. Very few data are available about quality (and variation in quality) of potatoes after storage in a traditional store. Each store has a large area in front of the store for drying, handling at loading and unloading.

11
Figure 2. Some impressions of a traditional cold store with jute bags (left) and a cooling system at the top floor (centre) and an example of an upgraded cold store with bulk storage with forced ventilation (right).
Upgraded store An upgraded store is basically a traditional store with a certain amount of modern equipment: • Occasional temperature measurement in the stored potatoes • Automatic temperature recording • Cooling equipment operation by product temperature • Some kind of forced air ventilation in spaces between the potato stacks (for example vertical ducts mounted to
the wall to force the cold air with ventilators from the top floor to the lower floors more quickly) • Energy saving devices • Humidification devices • Devices for CO2 flushing • Devices for applying CIPC Some upgraded stores have installed a conveyor belt running from the handling area into the top floor. Most upgrading has been done with Indian technology; sometimes technology is imported from the Netherlands or other countries. Potatoes in upgraded stores are always stored in wide messed bags. Compared to traditional stores air circulation in upgraded floors is improved; but the air movement is in fact forced space ventilation and not forced product ventilation. The ventilation systems in some stores are often consisting of small (ceiling type) fans mounted on the ceiling (5th floor) to get the air moving. In general, quality of potatoes originating from upgraded stores is higher than from potatoes from traditional stores. However, only few data are available and such data are restricted for in-company use only. During the survey some chips and French fries baking equipment for processing quality assessment and a colour assessment chart was found. Processing potatoes stored in an upgraded store can be stored from February up to October. A longer storage period often results in a product that is not or less acceptable for processing into French fries. Advanced stores An advanced store is a store constructed along the principles of modern potato stores in NW Europe: forced product ventilation, automation of air and product temperature registration, ventilation and cooling based on product temperature, CO2 control, cooling machines and usage of energy saving features like reduced pumping capacity. Three recently build advanced stores were visited: two bulk stores and one box store. The bulk stores were loaded up to 3 to 3.5 m. The box store used (relatively small) boxes sized 1.5*1.5*0.5= 1.125 m3 content. Pressure spots were found in one of the advanced bulk stores during its first year of operation. The recently constructed advanced stores are being optimized in order to reduce pressure spots. Potatoes for processing into French fries can be stored in an advanced store up to October; tests are currently performed to extend to December.

12
Table 2 summarizes the characteristics for Gujarat and Punjab.
Table 2. Characteristics of the potato cold stores of Gujarat and Punjab (Survey August 2013).
Category
Characteristics Traditional Upgraded Advanced
% share of total volume 40 50 10 Storability February-August February-October February-December Type of stored product Table potatoes Table and processing
potatoes Processing potatoes
Number of floors 4-5 4-5 1 Position cooling machines top floor Top floor Ground floor CO2 flushing occasionally Mostly Always Temperature measurement air Air/product Product Temperature registration manual Manual/computer Computer Steering cooling machine manual Manual/computer Computer CIPC application Standard practice by UPI
contractor Standard practice by UPI contractor
Standard practice by UPI contractor
Product packing Stacks of 50 kg bags Stacks of 50 kg bags Bulk and boxes Humidify occasionally Mostly Always Ventilation system Absent Forced space ventilation Forced product ventilation Energy saving equipment Occasionally Usually Always Estimated tons.m2 floor ground
6 tons 6 tons 2.8 tons
Reported weight loss 10-12% (Feb-Aug) 6-8% (Feb-Oct) 6-8% (Feb-Dec) Weight loss 10-12% 8-10% 6-8% Energy consumption benchmark Higher (more machinery) Higher (more machinery)
Processing potato supply scheme of Gujarat
Field produced potatoes are put on the Gujarat market for about a three months period from January to early April. Supply from cold stores lasts from April till December. So 75% of the Gujarat produced potatoes needs to be cold stored. In the period August – November some field produced potatoes are available from Madhya Pradesh and Karnataka, but according to the processors the quality and price of these potatoes fluctuate too much. They prefer to rely more on potatoes with a good quality supplied from stores. According to the Horticultural Department (Ahmedabad, Gujarat) and Omnivent specialists the traditional cold stores cover about 75 - 80%, the upgraded stores about 15-20% and the advanced stores about 5% of the total capacity. The potato processors are the most quality demanding buyers in the potato sector. Processors need quality raw material year round. Traditional stores cover the supply from February – August; upgraded stores take care of the period February – October. Advanced stores need to cover the remaining period: up to December. It appears the raw material quality during October-December can only be kept at a sufficiently high quality level in (advanced) stores equipped with forced product ventilation, automatic temperature recording, automatic operation of the cooling machines. Some such modern stores have been built in Gujarat since 2011: a small number of bulk stores and a box store. The latter is equipped with CA storage devices; which is expected to be a too expensive system for potato storage. Two of three Gujarati potato processors Balaji chips (crisps) producer and McCain (French fry producer) are very positive on the raw material quality coming from the modern stores during the period October – December. It appears that pro-cessors are willing to pay high store charges for potatoes coming from modern stores in November – December. Processing capacity McCain is about 50,000 tons, processing capacity Balaji is about 80,000 tons per annum.

13
Processors rely for about 25% on product stored in upgraded traditional stores. Another 25% needs to come from stores using advanced technology. The same may held true for high end table potatoes, leading to much greater need of storage capacity in advanced stores. For the future also more upgraded stores will be needed to meet the increased demand of high quality potatoes in the period August – December. Storing potatoes in upgraded stores for a restricted number of months has the advantage of lower energy cost (compared to advanced stores). The demand for advanced stores will increase in the future as because of the specific requirements from processors and high end consumers.
Cold store construction costs and charges
The most common potato cold store in India has a 5,000 tons capacity as the State governments provide a 40% subsidy for such capacity. The costs are summarized in Table 3.
Table 3. Construction costs in Gujarat and Punjab of a 5,000 tons potato cold store.
Gujarat Punjab
Type of store INR Euro1 INR Euro1
Traditional store 6 crore 750,000 6-7 crore 700,000 - 800,000 Upgraded 11 crore 1,300,000 8-9 crore 1,300,000 Advanced (bulk store) 22 crore 2,600,000 11 crore 1,300,000 Advanced (box store)2 - - 13 crore 1,600,000
1 Rate of exchange INR 1 = € 0.0123 (early August 2013). 2 Includes cost of CA equipment.
Labour costs will keep on increasing in the near future. As a consequence mechanization will be introduced in the entire chain: field – store unloading. Gujarat cold storage charges are INR 1.10 per kg for traditionally stored potatoes for 6 months (February – August). McCain pays cold storage owners INR 1.25 per kg for storage in upgraded stores (February-October). The McCain payments go as high as INR 5 per kg for storage in advanced stores during 9-10 months (February – November). The McCain’s policy underlines the importance of getting high quality raw material year round at processing factory gate.
Government support
The Gujarat government provides a 40% subsidy on the construction of (any) potato cold store and 25% reduction on electrical energy for the initial three years of operation.

14
2.4 The potato industry in Punjab Some key figures of the Punjab potato industry (2012):
• Total area under potato cultivation: 89 ,000 ha • Hectares under seed potato: 60,000 ha • Hectares under processing potato: 4,000 (seed potato + processing potato) • Hectares table: 25,000 ha • Average yield per hectare: 22 tons • Stored potatoes: 1,300,000 ton • Processed volume: 116,000 ton • Chips (Pepsico): 96,000 ton • Small players 10,000 ton • Merinot (flakes) 10,000 ton • Home consumption: 30% of total production • Storage costs per kg per month: INR 150 - 175 per kg and per 6 months
Potato cold stores in Punjab
Three categories of potato stores (and share of total capacity) in Punjab were identified: • Traditional stores estimated 50% • Upgraded stores estimated 50% • One store using advanced technology estimated 0.1% Punjab is considered as the seed potato producing state in India. Processing industry is limited to one processor: Pepsico. Pepsico is sourcing from various regions within India. Many seed potato producers run small holdings; leading too small lots for storage during the hot summer months from March – November. Traditional stores 95% of the Punjab cold stores rent out space for (seed potato) growers. Store design in Punjab is very much similar to the Gujarat cold stores. Cold storage rents are INR 75 per 50 kg potato for the period March-October. Storage temperature is maintained at 2oC measured in the air (and thus not in the stored product); with 5oC variation within store; implying a temperature of up to 7oC in the core of potato stacks. The latter temperature will speed up the physiological ageing process of the seed potatoes which may have a yield reducing affect when planted in November (after 8 months of storage). Storage owners state that the rental charges are too low for creating an incentive to invest in better stores. Nevertheless traditional stores have been upgraded with conveyor belts, humidifiers, CO2 flushing equipment and energy saving devices. Upgraded stores Upgraded stores in Punjab were less in number as compared to Gujarat. However, the upgrades were quite similar; wide meshed bags replacing jute bags; introduction of some forced space cooling. Advanced stores A bulk store for processing potatoes (Pepsico) was put into operation in 2012. The bulk store is designed according to the principles applied in North Western European countries; with cooling machines substituting for cold ambient air and a forced ventilation system.
Cold store construction costs and charges
The most common potato cold store in India has a 5,000 tons capacity as the State governments provide a 40% subsidy for such capacity. The costs are summarized in Table 3.

15
Government support
Punjab state government (as Gujarat state government) provides a 40% subsidy on the construction of (any) potato cold store (for maximum storage capacity of 5,000 tons) and 25% reduction on electrical energy for the initial three years of operation.
2.5 Discussion and conclusions In Gujarat as well as in Punjab, storage owners claim lack of financial resources to invest in improvements of the cold storage facilities due to (too) low rental charges. Presently, cold store owners store many small seed lots. Growers, on the other hand, have little to no awareness of the effects of stores and store management on quality and quality loss of the potatoes and subsequently the yielding performance. As a result, growers do not consider storage as an important part of the production of potatoes from seed to delivery to the buyer and they may consider storage only as a cost which should be minimized. Or growers may not know how to enforce good cold storage as most growers have small lots. Growers with small lots oppose bulk stores as their lots will be easily mixed up. To break through this impasse, growers need to become aware of the effects of cold storage on the quality of the potatoes and most important, growers need to be paid for the quality of the delivered potatoes (processing industry, seed and retailers). A present trend appears to be that (large) growers construct their own stores, so taking responsibility for their product with respect to meeting the specifications of processors (and retailers in the near future).
2.6 Suggestions for improvement and R&D in 2013/4 Gujarat Improvements of cold storage facilities are basically twofold: 1. Equipment for upgrading (existing) traditional stores such as:
• Forced product ventilation • Automated product temperature control • Automated cooling • Automated CO2 flushing • CIPC-application • Humidification • Energy saving • Handling equipment for grading, sorting, loading and unloading
2. Construction of advanced stores:
• All modern technology for reducing weight losses and maintaining quality The Dutch potato storage construction companies are highly suitable to facilitate both improvements for their business development in Gujarat: R&D program 2014 Presently processing companies have a problematic supply of raw material from October-December: about 25% of the total annual requirement has too high reducing sugar contents. This may be caused by senescence sweetening of the potatoes; which can be remedied by maintaining lower (around 9-10oC) product temperatures in forced ventilated stores. Modern designed stores offer such opportunity better than upgrading existing cold stores for storage periods up to December. A R&D program focusing on better processing performance of raw material up to the end of a calendar year needs to clarify the best option. Data on performance of processing material for the last three months in each calendar year are not available i.e. are held within company. Knowledge on storage losses is based on truck loads at loading and trucks loads at unloading;

16
detailed observations on storage losses is lacking. The amount of electrical energy for running stores is not recorded; owners pay their bills but showed no interests when interviewed on the kWh consumption. Focal points for R&D starting from early 2014 are: • Perspectives of lowering weight losses • Maintaining processing quality up to December • Energy saving options • Product temperature patterns • Air flow (fan capacities)
Punjab
Suggestions for improvement Two approaches are available for Netherlands potato storage construction companies for their business development in Punjab: 1. Equipment for upgrading (existing) traditional stores:
• Forced product ventilation • Automated product temperature control • Automated cooling • Automated CO2 flushing • Handling equipment for grading, sorting, loading and unloading
2. Construction of advanced stores for processing industries:
• All modern technology for reducing weight losses and maintaining quality. R&D in 2013/4 The effects of storage temperature on potato yield and quality in the following growing season has not been investigated in Punjab. A study on the yielding performance of various seed lots is required as to arrive at more data which should create an incentive in investing in better stores. Collaboration with Punjab Agricultural University (PAU) is initiated to start a seed potato performance experiment in October 2013.
17
3. Evaluation of the yielding performance of various potato seed lots in Punjab
Lubbert van den Brink; Wageningen University & Research centre, Applied Plant Research (PPO), the Netherlands
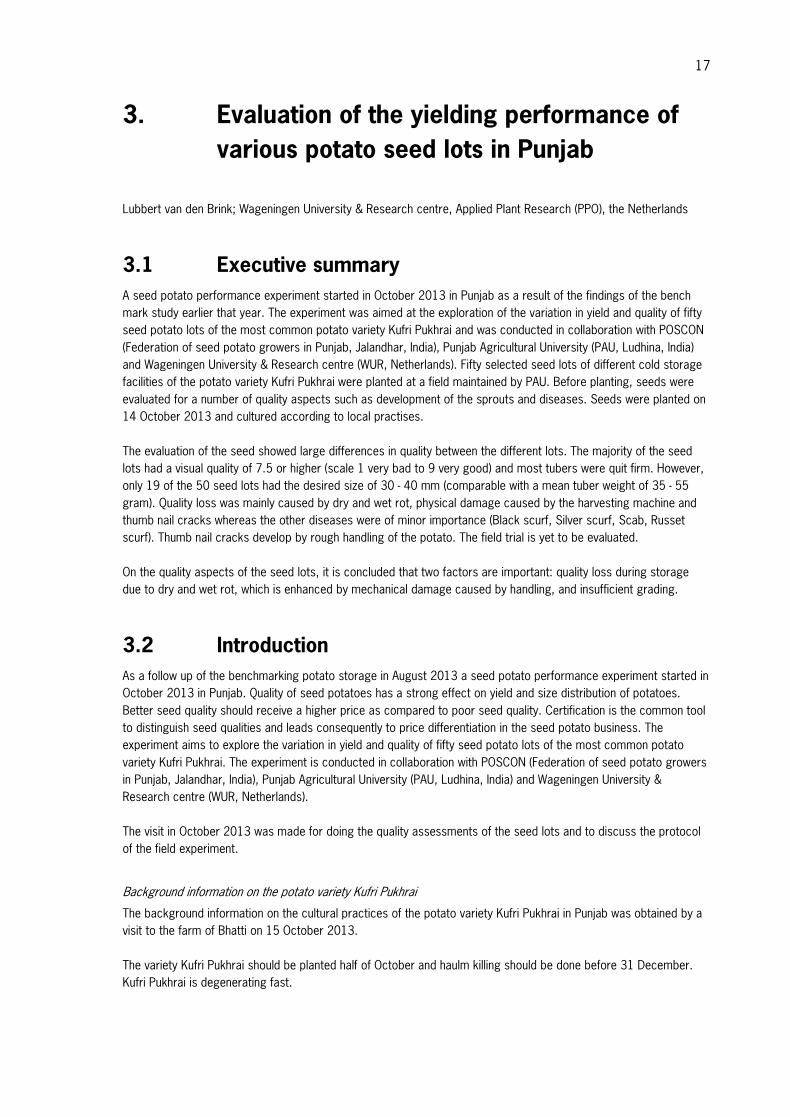
3.1 Executive summary A seed potato performance experiment started in October 2013 in Punjab as a result of the findings of the bench mark study earlier that year. The experiment was aimed at the exploration of the variation in yield and quality of fifty seed potato lots of the most common potato variety Kufri Pukhrai and was conducted in collaboration with POSCON (Federation of seed potato growers in Punjab, Jalandhar, India), Punjab Agricultural University (PAU, Ludhina, India) and Wageningen University & Research centre (WUR, Netherlands). Fifty selected seed lots of different cold storage facilities of the potato variety Kufri Pukhrai were planted at a field maintained by PAU. Before planting, seeds were evaluated for a number of quality aspects such as development of the sprouts and diseases. Seeds were planted on 14 October 2013 and cultured according to local practises. The evaluation of the seed showed large differences in quality between the different lots. The majority of the seed lots had a visual quality of 7.5 or higher (scale 1 very bad to 9 very good) and most tubers were quit firm. However, only 19 of the 50 seed lots had the desired size of 30 - 40 mm (comparable with a mean tuber weight of 35 - 55 gram). Quality loss was mainly caused by dry and wet rot, physical damage caused by the harvesting machine and thumb nail cracks whereas the other diseases were of minor importance (Black scurf, Silver scurf, Scab, Russet scurf). Thumb nail cracks develop by rough handling of the potato. The field trial is yet to be evaluated. On the quality aspects of the seed lots, it is concluded that two factors are important: quality loss during storage due to dry and wet rot, which is enhanced by mechanical damage caused by handling, and insufficient grading.
3.2 Introduction As a follow up of the benchmarking potato storage in August 2013 a seed potato performance experiment started in October 2013 in Punjab. Quality of seed potatoes has a strong effect on yield and size distribution of potatoes. Better seed quality should receive a higher price as compared to poor seed quality. Certification is the common tool to distinguish seed qualities and leads consequently to price differentiation in the seed potato business. The experiment aims to explore the variation in yield and quality of fifty seed potato lots of the most common potato variety Kufri Pukhrai. The experiment is conducted in collaboration with POSCON (Federation of seed potato growers in Punjab, Jalandhar, India), Punjab Agricultural University (PAU, Ludhina, India) and Wageningen University & Research centre (WUR, Netherlands). The visit in October 2013 was made for doing the quality assessments of the seed lots and to discuss the protocol of the field experiment.
Background information on the potato variety Kufri Pukhrai
The background information on the cultural practices of the potato variety Kufri Pukhrai in Punjab was obtained by a visit to the farm of Bhatti on 15 October 2013. The variety Kufri Pukhrai should be planted half of October and haulm killing should be done before 31 December. Kufri Pukhrai is degenerating fast.

18
Haulm killing is done by cutting. After haulm killing skin setting is needed during minimal 3 weeks, maximal 6 weeks, depending on soil temperature. After 3 - 6 weeks potatoes are harvested and put in a heap on the field. These heaps are 1.3 - 1.5 m high and they are covered with rice straw. The period in the heap depends on temperature: low temperature more time is needed. In general in February 15 days and in March 10 days. An important difference between Punjab and the Netherlands is that soil temperature is very low at harvest 2 – 3 °C. This means that skin setting/wound healing is very slow in Punjab. In India only % of seed potatoes is produced under the formal certification system. The certification system does not work, because the inspectors are not competent. Farmers who would deliver seed potatoes with a high quality are selling their potatoes with their own brand. Sometimes there is a large difference in price due to quality/name: for example 1150 IND (=€ 13.97) /bag of 50 kg instead of 650 IND (=€ 7.90)/bag. The production system of Bhatti is as follows: mother plants are bought from CPRI, in-vitro-multiplication and 4 generations in the field. (The number of field generations depends on the variety and on the farmer. The variation is 2 – 12/15). Controlling of virus plants is only done in the field. No ELISA is done. Bhatti is grading before storage in 7 sizes: 20 - 25, 25 - 30, 30 - 35, 35 - 40, 40 - 45, 45 - 50 and 50 – 55 mm. Potatoes bigger than 55m are used for own multiplication or are sold as table potatoes. Most of the time generation 4 is sold. Seed potatoes are not treated with fungicides before storage. Imazalil is not allowed in India. After storage period potatoes are dried on the floor during 1 night. Before putting potatoes in bags rotten tubers are sorted out. There is also equipment of drying in boxes (0.5 m3) with forced ventilation. After drying boxes are emptied on a sorting machine and sorting is done on the machine. According to POSCON black scurf is the most important disease. Silver scurf is important, but less important than black scurf. They do not care so much about dry rot, because the farmers are sorting out. Bhatti is only treating seed potatoes for his own production. Seed potatoes for the market are not treated. Treatment with Moncereen is done by spraying, but also with dipping. According to results of PAU (Dr. Thind) dipping is more effective than spraying, but the difference is small (96% vs. 92%). According to POSCON the risk of spreading of diseases by dipping is not so big. (Bayer is recommending spraying, because in western countries there is a disposal issue). Erwinia is not a problem. CPRI is recommending mercure chloride and also boric acid (According to Thind also maneb is working). Mercure chloride is working as a disinfectant: bacterial diseases are not a problem. Only once in eight years Phytophthora is a problem. There are no other diseases that are important enough for controlling. Depending on aphids populations it is sometimes needed to spray in December. Planting is done by people who are receiving 700 IND (=€ 8.50) per acre (4000 m2). A field of Mr Bhatti was visited. Planting was done by hand on lines that were made in the soil on a distance of 65 cm. Planting density was 20 tubers on 3 m (= 10.3 plants per m2). Several planted tubers were looking not healthy. According to Bhatti emergence of 90% is expected on this field. Irrigation is done every week. Each time furrows are filled until half the height of the ridges. Ridges are built in 2 runs: the first run immediately after planting and the second run 30 - 35 days later (after topdressing with fertilizer). Potatoes are grown after rice, maize, green manure crop or fallow. On some fields every year potatoes are grown. Because of the high temperature in June (51 - 52 °C) solarisation of the soil is occurring. Due to this there are no problems with nematodes or Ralstoria. Most farmers are storing potatoes in jute bags. Only 3 growers are storing in net bags. No fungicides are applied before storage. Sometimes potatoes are also damaged by the hooks used by the people who are transporting potatoes. Transport costs of seed potatoes within India over a distance of 1500 – 1800 km are 5 INR/kg (= 35% of the price).

19
3.3 Materials and methods
3.3.1 Collection of the seed lots
POSCON has collected 56 seed lots from different seed potato growers. The seed potato growers are known to differ considerable in yielding performance. Seed lot size was 200 tubers. Information about the history of the seed lots was collected by POSCON. The following information was recorded: • Name of the grower/store owner (not reported in this report). • Production region/city/village (not reported in this report). • Growing season (date of haulm killing and store loading). • Store temperature pattern from loading till desired storage temperature. • Type of storage system (traditional/upgraded/advanced). • Position of sampled seed within store (store level). • Storage temperature. • Date of unloading. • Storage conditions at central location prior to planting. Collected seed lots were all belonging to the same variety: Kufri Pukhrai. The seed lots were collected in the period 20 – 31 September 2013 from different stores and put into a central low-temperature store.
3.3.2 Quality assessment of the seed lots
On 12 October 2013 the following quality aspects were observed: • Weight of a (ad random) sample of 30 tubers. • Number of sprouts per tuber (mean of 5 random selected tubers). • Development of sprouts of 10 random selected tubers (observed in range 1 – 9; 9 = well developed long
sprouts (ca. 9 mm long); 1 = short, white sprouts (less than 2 mm). • Shrinkage of 10 random selected tubers (observed in range 1 – 9; 9 = no shrinkage, very firm tubers; 5 =
average shrunken tubers). • General impression of the seed lot (observed by 3 persons (Sangha (POSCON), Thind (PAU) and Van den Brink
(WUR)) in range 1 – 9; 9 = very nice (no incidence of diseases) and 1 = very poor (high incidence of diseases). • Incidence of 'thumb nail cracks' observed on 30 washed tubers: % of tubers with thumb nail cracks. • Incidence of black scurf (Rhizoctonia solani) observed on 30 washed tubers: % of tubers with light incidence of
black scurf. • Incidence of silver scurf (Helminthosporium solani) observed on 30 washed tubers: % of tubers with silver
scurf. • Incidence of scab (Streptomyces scabies) observed on 30 washed tubers: % of tubers with scab. • Incidence of Fusarium dry rot (Fusarium spp.) observed on 30 washed tubers: % of tubers with Fusarium dry
rot. • Incidence of wet rot (Erwinia spp) observed on 30 washed tubers: % of tubers with wet rot. • Incidence of net scab (Streptomyces reticuli-scabiei) observed on 30 washed tubers: % of tubers with net
scab. Because of the restricted number of entries that could be planted in the field experiment the total number of 56 was reduced to 50. Some seed lots were skipped because less than 200 tubers were available.
3.3.3 The field experiment
Overall conduct of the field experiment was looked after by the Head Department of Agronomy of PAU. Other departments such as Vegetable Crops, Plant Pathology and Entomology were associated with this experiment.

20
Plant material preparation
On 6 October 2013 samples of 200 tubers of the potato variety Kufri Pukhrai were warmed up (outside air temperature) and delivered to PAU on 8 October 2013. Pre-sprouting was done at PAU in the shade from 8 till 14 October 2013.
Planting of the experiment
On 14 October 2013 the experiment was planted according to the experimental design. On each plots 50 tubers were planted in 5 rows 60 cm from each other. Planting distance in the row: 20 cm. The tubers were planted by hand and after planting Moncerene was sprayed over the tubers. After planting ridges were built with a machine. Before planting 20 ton FYM (Farm yard manure)/acre was applied along with 37.5 kg N, 25 kg P2O5 and 25 kg K2O/acre (1 acre = 4000 m2). At the time of earthing up 37.5 kg N/acre will be given.
Figure 3. Some impressions during planting of the experiment: planting the potatoes (left), the application of Moncerene (centre) and the ridge making (right).
Irrigation and control of pests and diseases
Irrigation and control of pests and diseases will be done as commonly practiced at the experimental station of PAU.
Observations
The following observations will be done during the growing period: • Date of 50% emergence • Date of 90% emergence • Number of emerged plants • Number of stems • Growth vigour (scale: 1 = poor; 9 = best); estimated 6 weeks after planting • Canopy development (% foliage ground cover) at moment of 4 weeks, 8 weeks, 12 weeks after planting • Number of virus affected plants (Leaves should be send in for Elisa) • Number of bacterial disease affected plants • Incidence of foliar diseases (late blight, early blight) at moments of 4 weeks, 6 weeks, 8 weeks, 10 weeks,
12 weeks, 14 weeks after planting • Date of maturity
Harvest
The crop will be harvested at the time that maximal production is reached, estimated in the second half of January 2014. The 3 rows in the middle of each plot (from each row 8 plants; border plants on each end of the row will not be harvested) will be harvested. Tuber size distribution will be determined.

21
3.4 Results
3.4.1 Information of the collected seed lots
There was a large variation in date of haulm killing, date of harvest and date of store loading (Table 4) between the seed lots.
Table 4. The history of the seed lots.
Item asked for Result
Date of haulm killing 9 December 2012 till 13 February Date of harvest 15 January till 27 March Date of store loading 10 February till 2 April Number of days between haulm killing and harvest 10 till 75 days Number of days between harvest and store loading 6 till 53 days
3.4.2 Quality of the seed lots
There was a large variation between seed lots in size of the tubers (Figure 4, left). Only 19 of the 50 seed lots had the desired size of 30 - 40 mm (comparable with a mean tuber weight of 35 - 55 gram).
Figure 4. Number of seed lots within a weight class (left) and per general impression class (right).
There was also a large variation in general impression of the seed lots (Figure 4, right). The majority of the seed lots (29) had a score of 7.5 or higher, but there were also seed lots with a very low score, mainly because of dry rot, wet rot and thumb nail cracks (Figure 5).
Figure 5. Seeds lot with a poor quality (general impression of 3 samples, left), with a good quality (general impression of 9 samples, centre) and an example of thumb nail cracks (right).
02468
10121416
35-45 45-55 55-65 65-75 75-85 85-95 95-105 105-115 115-125Weight class of tubers (gram/tuber)
number of seed lots within a weight class
0
5
10
15
20
25
"2-3" 3.1-4 4.1-5 5.1-6 6.1-7 7.1-8 8.1-9General impression class
number of seed lots per genereal impression class

22
Thumb nail cracks are probably occurring during harvest and handling after harvest (loading on trucks, store loading and unloading). In Punjab potatoes are put in bags of 50 kg. All handling is done by hand. During handling (harvest, storing in the heap on the field, loading in the field, loading in the store, unloading from the store) these bags are fallen/thrown down several times from a height of 1 – 1.5 m. Sometimes it is needed to re-shift the stacks in the store to avoid that the bags in the middle of the stack are stored at a higher temperature than the bags at the outside of the stack. Thumb nail cracks are occurring during handling if the turgor is too high. According to POSCON the variety Kufri Pukhrai is very susceptible to thumb nail cracks.
Figure 6. Number of seed lots per class of dry rot incidence (top left), thumb nail incidence (top right), wet rot incidence (bottom left) and slight black scurf incidence (bottom right).
The other diseases were of minor importance (Figure 6). Black scurf was only found to a slight degree: only tubers on which a trace of black scurf was observed (Figure 6, bottom left). In the Netherlands it is advised to treat seed potatoes with a fungicide against black scurf if the SI-value (Sclerotia index) is higher than 10. There were only 3 seed lots with 23.3% tubers with a slight incidence of black scurf. The SI-value of these lots was 12. The SI-value of all other seed lots were < 10. According to the Dutch advice only 3 of the 50 lots would need a fungicide treatment to control slight black scurf. Silver scurf was hardly found in the seed lots: 1 seed lot with 6.7% tubers with silver scurf and 2 seed lots with 3.3% tubers with silver scurf. This result is in accordance with experiences of PAU: silver scurf is not a very important disease in Punjab. Scab and Russet scurf were only found in a few seed lots: 6 seed lots with 6.7% tubers with scab and 6 seed lots with 3.3% tubers with scab; 2 seed lots with 6.7% tubers wit Russet scurf. The average number of sprouts per tubers ranged from 3.6 till 9.4 (Figure 7). There was not a high correlation between mean tuber weight and number of sprouts per tuber (r = 0.37). Development of sprouts ranged from 2 till 9.
02468
1012141618
0-5 "6-10 "11-20 "21-30 "31-40 "41-50 >50% of tubers with dry rot
number of seed lots per class of dry rot incidence
0
5
10
15
20
25
0-10 11-20 21-30 31-40 41-50 51-60 61-70 71-80 81-90% of tubers with thumb nail cracks
Number of seed lots per class of thumb nail incidence
0
5
10
15
20
25
30
35
0 1-10 11-20 21-30% of tubers with wet rot
Number of seed lots per class of wet rot incidence
0
5
10
15
20
25
0 1-5 6-10 11-20 21-30% of tubers with slight incidence of black scurf
Number of seed lots per class of slight black scurf incidence

23
Figure 7. Number of seed lots per class of number of sprouts per tuber (left) and sprout development (right).
Only small differences were observed in shrinkage of the tubers (Figure 8). In general the tubers were quite firm.
Figure 8. Number of seed lots per class of shrinkage.
3.5 Preliminary conclusions The evaluation of the seed showed large differences in quality between the different lots. The majority of the seed lots had a visual quality of 7.5 or higher (scale 1 very bad to 10 very good) and most tubers were quit firm. However, only 19 of the 50 seed lots had the desired size of 30 - 40 mm (comparable with a mean tuber weight of 35 - 55 gram). Quality loss was mainly caused by dry and wet rot, physical damage caused by the harvesting machine and thumb nail cracks whereas the other diseases were of minor importance (Black scurf, Silver scurf, Scab, net scurf). Thumb nail cracks develop by rough handling of the potato. The field trail is yet to be evaluated. On the quality aspects of the seed lots is therefore yet concluded that quality loss during storage is not the only bottleneck. Seed quality is also poor due to insufficient grading. On the quality aspects of the seed lots, it is concluded that two factors are important: quality loss during storage due to dry and wet rot, which is enhanced by mechanical damage caused by handling, and insufficient grading.
0
5
10
15
20
25
3.6-4.5 4.6-5.5 5.6-6.5 6.6-7.5 7.6-8.5 8.6-9.5Number of sprouts per tuber
Number of seed lots per class of number of sprouts per tuber
02468
1012141618
1.1-2 2.1-3 3.1-4 4.1-5 5.1-6 6.1-7 7.7-8 8.1-9Sprout development
Number of seed lots per class of sprout development
0
5
10
15
20
25
5 6 7 8Shrinkage of tubers (8 = firm; 5 medium)
Number of seed lots per class of shrinkage of tubers

24
25
4. Optimal use of land and water of potatoes for various uses in Gujarat and Punjab
Annette Pronk; Wageningen University & Research centre, Plant Research International (PRI), the Netherlands
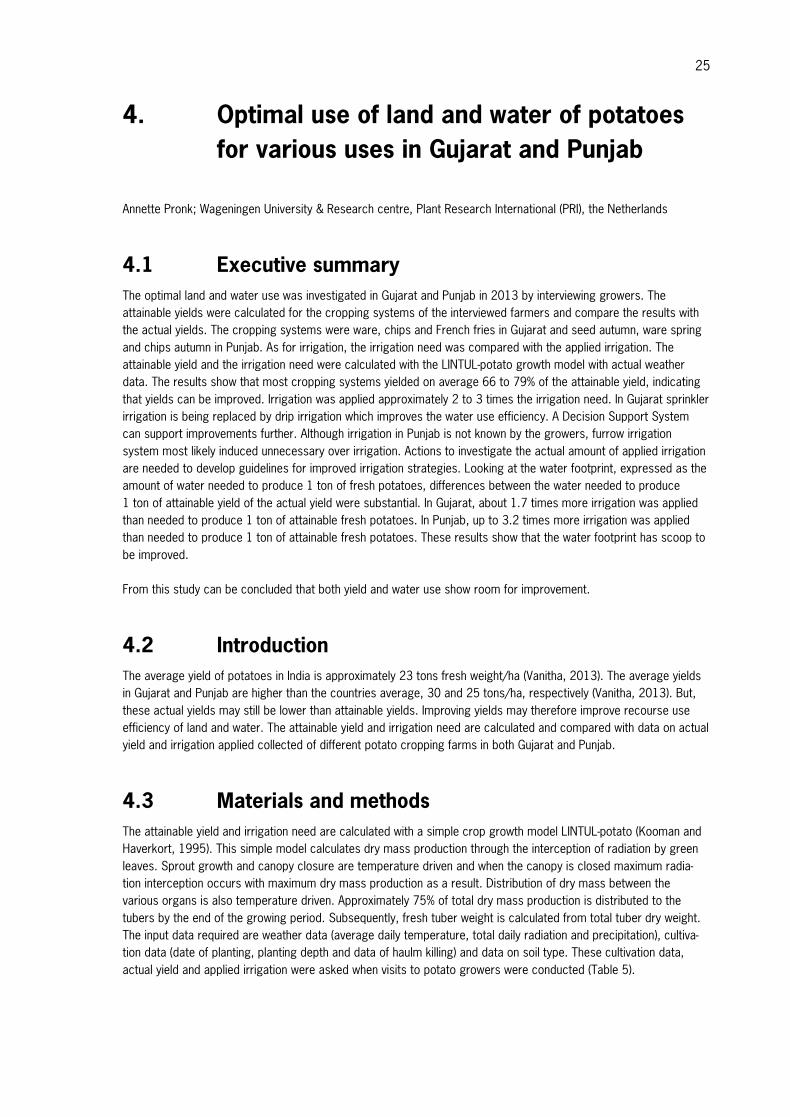
4.1 Executive summary The optimal land and water use was investigated in Gujarat and Punjab in 2013 by interviewing growers. The attainable yields were calculated for the cropping systems of the interviewed farmers and compare the results with the actual yields. The cropping systems were ware, chips and French fries in Gujarat and seed autumn, ware spring and chips autumn in Punjab. As for irrigation, the irrigation need was compared with the applied irrigation. The attainable yield and the irrigation need were calculated with the LINTUL-potato growth model with actual weather data. The results show that most cropping systems yielded on average 66 to 79% of the attainable yield, indicating that yields can be improved. Irrigation was applied approximately 2 to 3 times the irrigation need. In Gujarat sprinkler irrigation is being replaced by drip irrigation which improves the water use efficiency. A Decision Support System can support improvements further. Although irrigation in Punjab is not known by the growers, furrow irrigation system most likely induced unnecessary over irrigation. Actions to investigate the actual amount of applied irrigation are needed to develop guidelines for improved irrigation strategies. Looking at the water footprint, expressed as the amount of water needed to produce 1 ton of fresh potatoes, differences between the water needed to produce 1 ton of attainable yield of the actual yield were substantial. In Gujarat, about 1.7 times more irrigation was applied than needed to produce 1 ton of attainable fresh potatoes. In Punjab, up to 3.2 times more irrigation was applied than needed to produce 1 ton of attainable fresh potatoes. These results show that the water footprint has scoop to be improved. From this study can be concluded that both yield and water use show room for improvement.
4.2 Introduction The average yield of potatoes in India is approximately 23 tons fresh weight/ha (Vanitha, 2013). The average yields in Gujarat and Punjab are higher than the countries average, 30 and 25 tons/ha, respectively (Vanitha, 2013). But, these actual yields may still be lower than attainable yields. Improving yields may therefore improve recourse use efficiency of land and water. The attainable yield and irrigation need are calculated and compared with data on actual yield and irrigation applied collected of different potato cropping farms in both Gujarat and Punjab.
4.3 Materials and methods The attainable yield and irrigation need are calculated with a simple crop growth model LINTUL-potato (Kooman and Haverkort, 1995). This simple model calculates dry mass production through the interception of radiation by green leaves. Sprout growth and canopy closure are temperature driven and when the canopy is closed maximum radia-tion interception occurs with maximum dry mass production as a result. Distribution of dry mass between the various organs is also temperature driven. Approximately 75% of total dry mass production is distributed to the tubers by the end of the growing period. Subsequently, fresh tuber weight is calculated from total tuber dry weight. The input data required are weather data (average daily temperature, total daily radiation and precipitation), cultiva-tion data (date of planting, planting depth and data of haulm killing) and data on soil type. These cultivation data, actual yield and applied irrigation were asked when visits to potato growers were conducted (Table 5).

26
Table 5. The results of the interviewed farmers in Gujarat and Punjab.
Product Ware Chips French fries
Seed autumn
Ware autumn
Ware spring
Chips autumn
State Gujarat Gujarat Gujarat Punjab Punjab Punjab Punjab
Number interviewed 2 2 4 10 2 5 3 Date of planting 11-Nov 11-Oct 11-Aug 17-Oct 1-Oct 17-Feb 15-Oct Planting depth (cm) 10.5 12.5 14.0 8.5 8.8 9.0 9.5 Date of haulm killing 15-Feb 3-Jan 24-Feb 29-Dec 11-Dec 2-May 19-Dec
Yield gross (ton/ha) 44 44 41 22 20.3 19 20 Irrigation applied (mm) 315 318 335 184 260 387 188
In Gujarat, eight growers were interviewed whereas in Punjab 18 growers were interviewed. The growers in Gujarat had ware potatoes (2), potatoes for chips (2) or potatoes for French fries (4); the growers in Punjab had seed potatoes (10), autumn ware potatoes (2), spring ware potatoes (5) and potatoes for chips (3). The amount of irrigation applied in Punjab was not known. The irrigation system in Punjab is furrow irrigation. In furrow irrigation, water is released at one end of the field and distributed through furrows across the field. Growers know the number of times irrigation was applied (Figure 9). A rough estimate of the applied water per irrigation event was made based on information on the schematics of the furrow and the height of the water table during an irrigation event. This amount was estimated at 40 mm. This estimate does not include infiltration of water at the time the irrigation is flooding into the furrow. This has most certainty led to an underestimate of the amount of applied irrigation and the results may therefore show a positive/optimistic result on the efficiency of irrigation.
Figure 9. Potatoes on rows (left) and furrow-irrigated (right) in Punjab.

27
4.4 Results
4.4.1 Results of Gujarat
The average maximum temperature of Gujarat varies between 26 and 37 °C with the highest temperatures in April and May, in the pre-monsoon time (Figure 10, left). The minimum temperature varies between 12 and 26 °C with lowest temperatures in December and January. Precipitation varies between 2 and 321 mm per month. The highest precipitation per month is in July and August. The growing season in Gujarat runs from November till February (Figure 10, right) and the radiation varies between 13 and 21 MJ/m2 per day. The lowest radiation level is found in September and after that it gradually increases during the growing season to 17 MJ/m2 in February at the end of the growing season.
Figure 10. The minimum (T-min, °C) and maximum (T-max, °C) temperature and the cumulative monthly precipitation (Precip., mm, left) and the daily radiation (Radiation, MJ/m2, right) during the year and the growing season of Gujarat.
The collected input data of the eight growers of Gujarat are shown in Table 5. The attainable yield for the three growing systems varies between 57 ton fresh weight/ha for ware potatoes to 64 ton fresh weight/ha for Chips potatoes (Table 6) whereas the actual yield is lower, between 41 ton/ha for French fries to 44 tons/ha for ware and chips potatoes. The ratio between actual and attainable yield ranges from 0.66 to 0.77. This ration is comparable with results of the Dutch potato cropping systems but can still be improved. In comparison, the average yield of potato in Gujarat is approximately 30 ton/ha (Vanitha, 2013). The yields of the interviewed growers ware substantially higher than the states average.
Table 6. Results on the attainable yield, the actual yield and the ratio between actual and attainable yield for ware, chips and French fries potatoes of Gujarat.
Yield (tons fresh/ha)
Ware Chips French fries
Attainable yield (model prediction) 57 64 63 Actual yield 44 44 41 Ratio Actual/Attainable 0.77 0.68 0.66
The irrigation needed to produce the attainable yield is 156 mm for ware potatoes, 194 mm for chips and 181 mm for French fries (Table 7). The actual applied irrigation was higher, between 315 for ware potatoes and 335 for French fries. Ware potatoes received twice as much water as required for attainable yield, chips 1.6 times and French fries 1.9 times the irrigation need for attainable yields.
0
50
100
150
200
250
300
350
0
5
10
15
20
25
30
35
40
Jun Jul Aug Sept Oct Nov Dec Jan Feb Mar Apr May
Prec
ipita
tion
(mm
)
Tem
pera
ture
(C)
Precip.
T-min
T-max
0
5
10
15
20
25
Jun Jul Aug Sept Oct Nov Dec Jan Feb Mar Apr May
Daily
radi
atio
n (M
J/m
2 )
growing season
Radiation
28
Table 7. Results on the irrigation (mm) needed for the attainable yield and the actual yield, and the ratio actual/attainable yield for ware, chips and French fries potatoes of Gujarat.
Irrigation (mm)
Ware Chips French fries
Attainable yield (model prediction) 156 194 181 Actual yield 315 318 335 Ratio Actual/Attainable 2.0 1.64 1.85
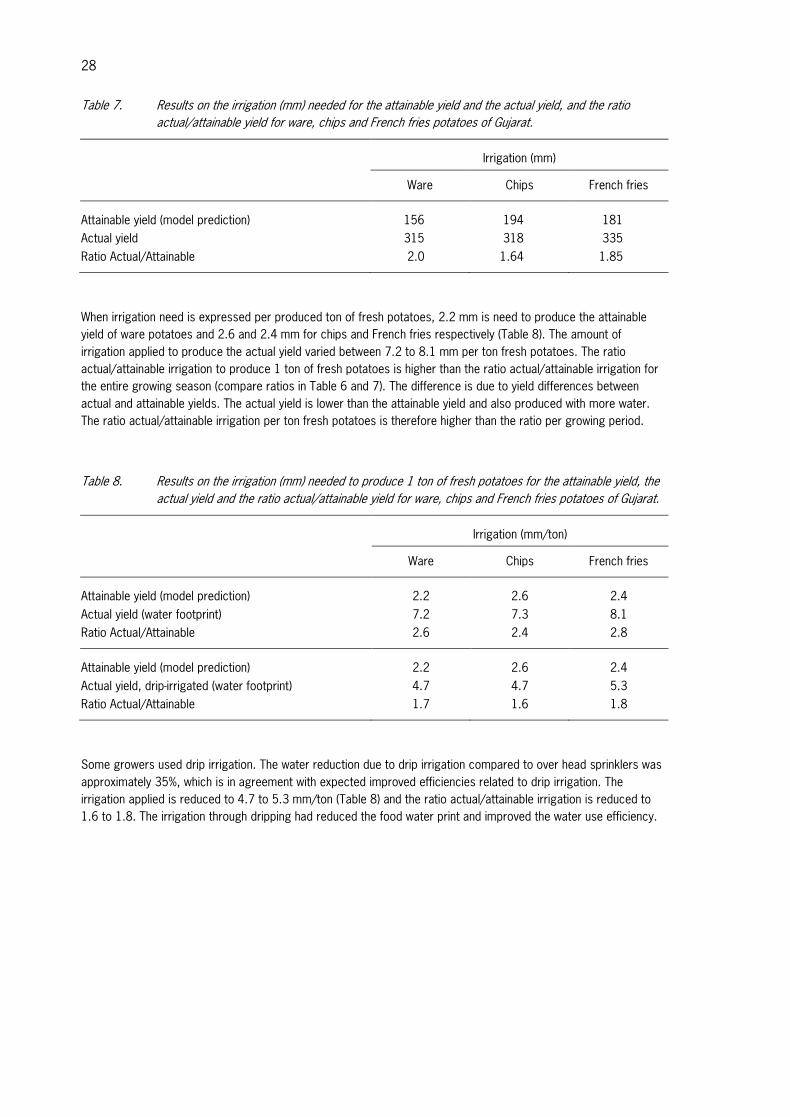
When irrigation need is expressed per produced ton of fresh potatoes, 2.2 mm is need to produce the attainable yield of ware potatoes and 2.6 and 2.4 mm for chips and French fries respectively (Table 8). The amount of irrigation applied to produce the actual yield varied between 7.2 to 8.1 mm per ton fresh potatoes. The ratio actual/attainable irrigation to produce 1 ton of fresh potatoes is higher than the ratio actual/attainable irrigation for the entire growing season (compare ratios in Table 6 and 7). The difference is due to yield differences between actual and attainable yields. The actual yield is lower than the attainable yield and also produced with more water. The ratio actual/attainable irrigation per ton fresh potatoes is therefore higher than the ratio per growing period.
Table 8. Results on the irrigation (mm) needed to produce 1 ton of fresh potatoes for the attainable yield, the actual yield and the ratio actual/attainable yield for ware, chips and French fries potatoes of Gujarat.
Irrigation (mm/ton)
Ware Chips French fries
Attainable yield (model prediction) 2.2 2.6 2.4 Actual yield (water footprint) 7.2 7.3 8.1 Ratio Actual/Attainable 2.6 2.4 2.8
Attainable yield (model prediction) 2.2 2.6 2.4 Actual yield, drip-irrigated (water footprint) 4.7 4.7 5.3 Ratio Actual/Attainable 1.7 1.6 1.8
Some growers used drip irrigation. The water reduction due to drip irrigation compared to over head sprinklers was approximately 35%, which is in agreement with expected improved efficiencies related to drip irrigation. The irrigation applied is reduced to 4.7 to 5.3 mm/ton (Table 8) and the ratio actual/attainable irrigation is reduced to 1.6 to 1.8. The irrigation through dripping had reduced the food water print and improved the water use efficiency.
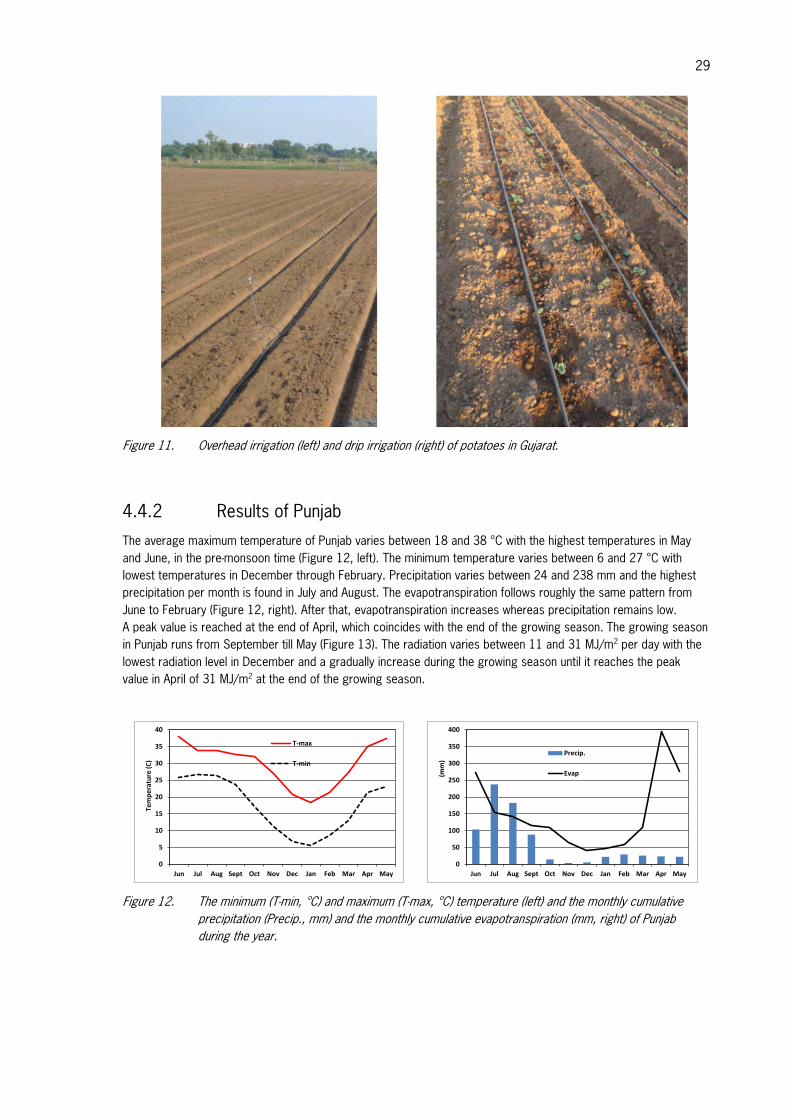
29
Figure 11. Overhead irrigation (left) and drip irrigation (right) of potatoes in Gujarat.
4.4.2 Results of Punjab
The average maximum temperature of Punjab varies between 18 and 38 °C with the highest temperatures in May and June, in the pre-monsoon time (Figure 12, left). The minimum temperature varies between 6 and 27 °C with lowest temperatures in December through February. Precipitation varies between 24 and 238 mm and the highest precipitation per month is found in July and August. The evapotranspiration follows roughly the same pattern from June to February (Figure 12, right). After that, evapotranspiration increases whereas precipitation remains low. A peak value is reached at the end of April, which coincides with the end of the growing season. The growing season in Punjab runs from September till May (Figure 13). The radiation varies between 11 and 31 MJ/m2 per day with the lowest radiation level in December and a gradually increase during the growing season until it reaches the peak value in April of 31 MJ/m2 at the end of the growing season.
Figure 12. The minimum (T-min, °C) and maximum (T-max, °C) temperature (left) and the monthly cumulative precipitation (Precip., mm) and the monthly cumulative evapotranspiration (mm, right) of Punjab during the year.
0
5
10
15
20
25
30
35
40
Jun Jul Aug Sept Oct Nov Dec Jan Feb Mar Apr May
Tem
pera
ture
(C)
T-max
T-min
0
50
100
150
200
250
300
350
400
Jun Jul Aug Sept Oct Nov Dec Jan Feb Mar Apr May
(mm
)
Precip.
Evap
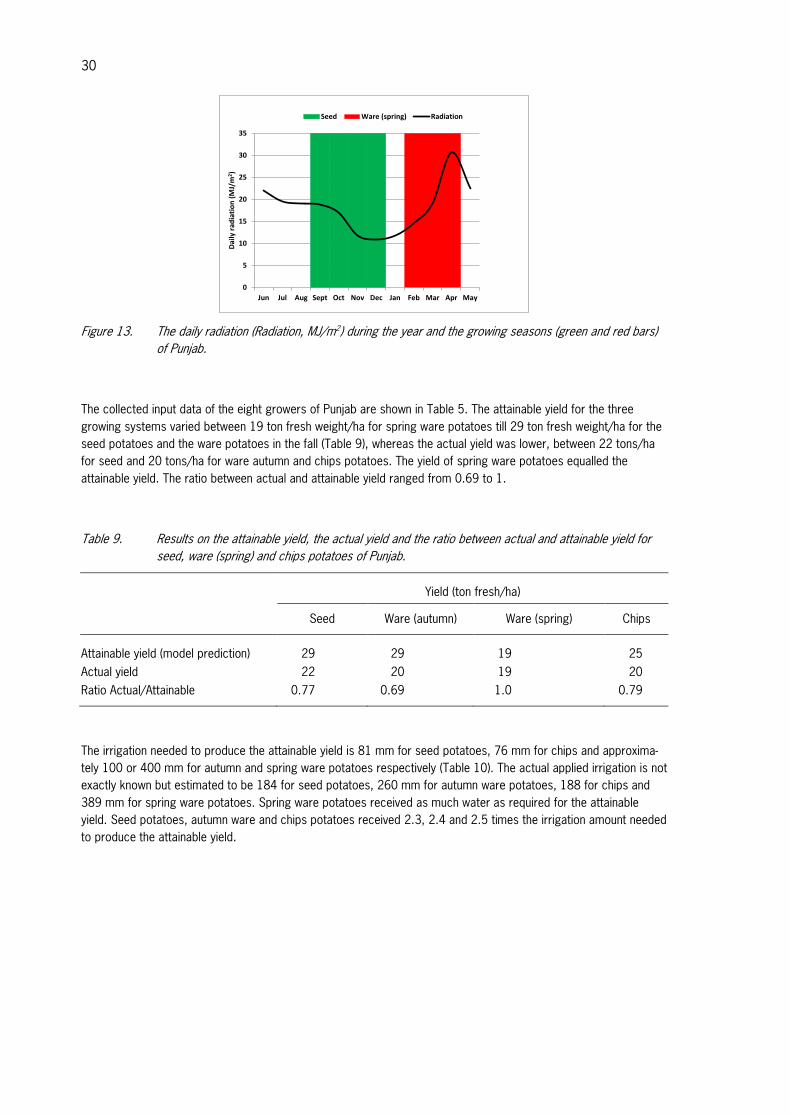
30
Figure 13. The daily radiation (Radiation, MJ/m2) during the year and the growing seasons (green and red bars) of Punjab.
The collected input data of the eight growers of Punjab are shown in Table 5. The attainable yield for the three growing systems varied between 19 ton fresh weight/ha for spring ware potatoes till 29 ton fresh weight/ha for the seed potatoes and the ware potatoes in the fall (Table 9), whereas the actual yield was lower, between 22 tons/ha for seed and 20 tons/ha for ware autumn and chips potatoes. The yield of spring ware potatoes equalled the attainable yield. The ratio between actual and attainable yield ranged from 0.69 to 1.
Table 9. Results on the attainable yield, the actual yield and the ratio between actual and attainable yield for seed, ware (spring) and chips potatoes of Punjab.
Yield (ton fresh/ha)
Seed Ware (autumn) Ware (spring) Chips
Attainable yield (model prediction) 29 29 19 25 Actual yield 22 20 19 20 Ratio Actual/Attainable 0.77 0.69 1.0 0.79
The irrigation needed to produce the attainable yield is 81 mm for seed potatoes, 76 mm for chips and approxima-tely 100 or 400 mm for autumn and spring ware potatoes respectively (Table 10). The actual applied irrigation is not exactly known but estimated to be 184 for seed potatoes, 260 mm for autumn ware potatoes, 188 for chips and 389 mm for spring ware potatoes. Spring ware potatoes received as much water as required for the attainable yield. Seed potatoes, autumn ware and chips potatoes received 2.3, 2.4 and 2.5 times the irrigation amount needed to produce the attainable yield.
0
5
10
15
20
25
30
35
Jun Jul Aug Sept Oct Nov Dec Jan Feb Mar Apr May
Daily
radi
atio
n (M
J/m
2 )
Seed Ware (spring) Radiation

31
Table 10. Results on the irrigation (mm) needed for the attainable yield (ton/ha), the actual yield (ton/ha) and the ratio actual/attainable yield for seed, spring ware spring and chips potatoes of Punjab.
Irrigation (mm)
Seed Ware (autumn) Ware (spring) Chips
Attainable yield (model prediction) 81 107 397 76 Actual yield 184 260 389 188 Ratio Actual/Attainable 2.3 2.4 1.0 2.5
The water footprint is evaluated by the required irrigation (= irrigation need) to produce 1 ton of fresh potatoes (irrigation/ton attainable yield = 81mm/29 tons = 2.8, Table 11). The water footprint of the attainable yield varied between 2.8 for seed potatoes to 21.4 for ware potatoes in the spring (Table 11). The water footprint for the actual yield shows the same pattern, 8.3 mm/ton for seed, 12.8 mm/ton for autumn ware, 9.4 mm/ton for chips and 20.4 mm/ton for spring ware potatoes. This result shows that the water footprint of ware potatoes (both autumn and spring) is much higher than that of seed and chips potatoes. But, the water footprint for spring ware potatoes shows not much potential to be improved as the attainable yield has the same water footprint. The water footprint of seed potatoes, autumn ware potatoes and chips show more potential to be improved than the water footprint of spring ware potatoes as seed, autumn ware and chips are irrigated 2.9 to 3.5 times the required irrigation.
Table 11. Results on the irrigation (mm) needed to produce 1 ton of fresh potatoes for the attainable yield, the actual yield and the ratio actual/attainable yield for seed, ware (autumn), ware (spring) and chips of Punjab.
Irrigation (mm/ton)
Seed Ware (autumn) Ware (spring) Chips
Attainable yield (model prediction) 2.8 3.6 21.4 3.0 Actual yield (water footprint) 8.3 12.8 20.4 9.4 Ratio Actual/Attainable 2.9 3.5 1.0 3.2
4.5 Conclusions In general, the actual yields are below the attainable yields for all investigated cropping systems. Only yields of spring ware potatoes in Punjab have little scoop to be improved. In Gujarat, the actual yield is well above the states average, which suggests that yields can even be improved to a greater extent when looking at the entire state than at the interviewed growers. In Punjab, the states average yield is 25 ton/ha. This yield was not produced by the growers of this study, most likely due to the type of cropping systems. The fall ware potatoes were not included in this study but planting dates for a fall ware crop of 21 September were mentioned. When using this average planting date with a 95 days period of growing days, the attainable yield is estimated at 40 ton/ha. The states average yield of 25 ton/ha (Vanitha, 2013) is than 63% of the attainable yield. The fall ware potatoes are strongly influenced by the market price. The length of the growing period of fall ware potatoes is therefore difficult to generalise and this makes it difficult to identify the actual yield gap. For land use efficiency can be concluded that there is room for improvement as in general the actual yields are below the attainable yields. In Chapter 6 some suggestions are presented on which parameters may contribute to the identified yield gap.

32
The irrigation need to produce the attainable yield is lower than the applied irrigation. Improved irrigation will therefore improve the efficiency of water and subsequently the food water print. In Gujarat, replacing sprinkler irrigation by drip irrigation contributes considerable to the efficient use of water. A decision support system on irrigation applications will help to further improve the water use efficiency and subsequently reduce the food water print. In Punjab, the first step on improved irrigation is to determine the actual application in the different cropping systems. From that, a plan to improve the water footprint needs to be developed and put into place.

33
5. Energy costs of potato for various uses in Gujarat and Punjab
Anton Haverkort; Wageningen University & Research centre, Plant Research International (PRI), the Netherlands
5.1 Executive summary Three potato production systems were studied in the state of Gujarat and four potato production systems were studied in the state of Punjab. In Gujarat the production of fresh ware potatoes and processing potatoes for the chipping and processing potatoes for the French fries industry. In Punjab it concerned seed production and processing potatoes for the chips industry in autumn and ware potato production in spring and autumn. The CO2 footprint was taken as a measure for easy comparison and use was made of the Cool Farm Tool (app.coolfarmtool.org). The cost of production in terms of CO2 consists of that embedded in the seed production including its storage and transport, in the inputs such as chemical fertilizers and biocides, the diesel to run the tractor for land preparation and harvesting and the electricity for pumping irrigation water. Storage costs in terms of CO2 are around 35 kg/ton when the store is 25 °C cooler than ambient air and diesel for represent 17.6 kg per 100 km per ton. Producing potatoes in Gujarat ex-field was calculated at around 280 kg CO2 per ton potato, in Punjab autumn seed around 320 kg, autumn ware 60 kg more as more fertilizer and more irrigation (earlier planting) are responsible for higher CO2 costs of the Punjab autumn ware crop; the Punjab spring ware charges about 370 kg. Producing seed potato in Punjab, storing it for 8 months and then transporting them by truck to West Bengal adds up to almost 1000 kg CO2 per ton potato. Options to reduce costs consists of: • Reduction of seed rate, currently 2.8 for French fries potato in Gujarat to 4.2 ton for seed potato production in
Punjab; • Using drip irrigation instead of sprinkler irrigation in Gujarat may reduce water use by 29% and energy costs by
37%. Using Sprinkler or even drip in Punjab rather than flood irrigation ultimately may reduce water use by 60% and energy us by 70%;
• Especially with furrow (over)irrigation in Punjab much fertilizer, notably nitrogen is leached. As a result in Punjab growers apply about 2x more nitrogen per ton harvested potatoes than in Gujarat. Here changed agricultural practices will also reduce costs;
• Modern storage practices with improved stores, especially bulk will strongly reduce storage costs.
5.2 Introduction Potato production is associated with the use of energy. So it is equally associated with the costs of energy. When potato arrives at its final destination (wholesale) market in the cities for fresh potatoes, at the factory gate for processing potato and at the potato field for seed potatoes the following energy/money costing phases apply: • Production stage at the field (seed, inputs, field operations including irrigation) • Storage for varying durations lasting up to 8 seed potato and up to 10 months for processing • Transport to market, field or factory A proper bench marking tool to address this is the Cool Farm Tool (Haverkort & Hillier 2011). The level of carbon-dioxide (CO2) in the air in the northern hemisphere was 315 parts per million in 1958 and currently it is 400 (0.040%) and continues to rise despite global efforts to reduce it; among others with carbon

34
rights trading between countries and companies. The gas is held responsible for capturing sunlight and transforming it into heat. It serves as a greenhouse gas. Water vapour in the air has the same function and also methane (from cows and rice production and nitrous oxide gases from bacterial soil live). Especially these gases contribute to the greenhouse effect as they are 300 times more effective than carbon dioxide. It is estimated that agriculture is responsible for about 11% of greenhouse gases caused by man. A reduction of greenhouse gas emission by agriculture could be a substantial means of mitigating its effect on climate change. A new tool to calculate the CO2 emitted in the production of crops or animals in agriculture is the Cool farm Tool (CFT) developed by dr. Jon Hillier with co-workers at the University of Aberdeen commissioned by Unilever and dr. Anton Haverkort of Wageningen University, the Netherlands (2011). Recently with the aid of McCain potato agronomists at a few continents dr. Hillier and Haverkort made it potato specific: The CFT-Potato, aired as a web version in October 3013: app.coolfarmtool.org. The tool – an MS Excel spreadsheet – at page one requires the site and country the crop is in. This is important as some countries have a high emission level of electricity production where mainly coal is used (South Africa) whereas e.g. France has a low level as in this country the majority of electricity is from nuclear energy. When using power for water pumping or cooling the carbon load varies according to country. The farmer also has to declare the soil to be sandy, medium or heavy as heavier soils require move diesel to plough and to harvest. Soil organic matter, humidity and acidity are reported as they influence nitrogenous fertilizer break down to volatile compounds and high organic matter soils lose soil carbon when exposed to oxygen and is aggravated by working the land. Fertilizers – total amounts and type - such as ammonium nitrate or urea are noted as well as the sources of potassium, phosphorus and calcium. Organic amendments also can be mentioned such as farm yard cow manure. The grower fills in the number of applications of herbicides, insecticides and fungicides. Based on these data the Tool sums up all the energy that is needed to produce the chemicals in the factory and how much CO2-equivalents of nitrous oxygen is emitted from the soil resulting from fertilization. Subsequently the grower completes a page with all operations such as ploughing, ridging, destining, spraying, spreading, irrigation, on farm transport of materials and tubers and harvesting. The Tool then calculates – based on ASABE data of the American Society of Agricultural and Biological engineers - how much diesel and electricity is used and converts it into kg CO2. Finally the tool asks whether the product is washed, graded, loaded into a store and stored with ventilation and refrigeration and about the use (number and dose) of sprout suppressant. The original Tool originally did not contain information nor questions about irrigation, grading, storage and sprout control. So data were collected from various operations and the tool came up with easy questions such as how many millimetre did you apply in total and for how many weeks did you store and how many degrees was the potato in the store cooler than the average outside temperature. From original data we know how much electricity it costs to irrigate one mm, or to cool potatoes down per degree for one week. Finally the grower has to fill in the yield and the seed rate and the Tool calculates the CO2 emission associated with the production of one ton of potato. In November and December 2013 growers were interviewed in Gujarat and Punjab representing various crop destinations, the results of which are shown in Table 12. Average data of interviews of 8 growers some producing for more than one destination in Gujarat representing 3 production systems: • Producing for the fresh market (2 farms). • Producing for the chips (crisp) processing industry (Balaji and Pepsico, 2 farms). • Producing for the French fries industry (McCain, 4 farms). In Punjab near Jalandhar the following systems were investigated: • Production seed potatoes for farmers (October planting, 10 farms). • Producing for the fresh market (October planting, 2 farms). • Producing for the fresh market (February planting, 5 farms). • Producing for the chips (crisp) processing industry (October planting, 2 farms).

35
Note: this table mainly contains quantitative questions/answers needed to complete the Cool Farm Tool-Potato and the LINTUL growth model to allow footprinting: • Amount of land to produce 1 ton of potatoes. • Amount of water. • Amount of CO2. • Amount of Nitrogen. • ….. The data of Table 12 were input of the Excel Spreadsheet (beta 4) version of the Cool Farm tool (exactly the same as the web based ( app.coolfarmtool.org ) version. The objectives of this study were to identify the energy (CO2) costs of the various parts of the production system till harvest, till the end of the storage period and till final destination has been reached. From this analysis suggestions for adjustments can be made to make the crop more competitive.
5.3 Results
5.3.1 Results of the interviews
Table 12 shows the number of growers interviewed per state (Gujarat and Punjab) and the average Figure of the data supplied by the growers. Some figures that attract attention and have major impact on the footprint: • The considerable distance the seed is transported from Punjab to Gujarat to satisfy the need of the November
planting in Gujarat; • The large difference between the temperature in the store and ambient average day and night temperature
over the whole storage period (up to 8 months) of ware potatoes harvested in January-March both in both states;
• The absence of storage of spring grown potatoes harvested around May 1 in Punjab, sold ex-field immediately to the markets, mainly in greater Delhi;
• Irrigation done by dripping in Gujarat and with flooding in Punjab. The exact amount supplied by flooding was not determined. It is assumed that both systems are optimized with Gujarat using less water but more electricity (?);
• Some of the chipping potatoes for the Pepsico plant in West Bengal travel 2400 km from Punjab; those are not stored and go directly to West Bengal to fill the lull in supply in November-February;
• Similarly almost all seed potatoes for West Bengal are from Punjab.

36
Table 12. Average data of interviews (per hectare, all seed origin from Punjab). Note: this table mainly contains quantitative questions/answers needed to complete the Cool Farm Tool-Potato and the LINTUL growth model to allow footprinting of land and water.
State Gujarat Punjab
Product
Ware Chips French fries Seed autumn
Ware autumn
Ware spring Chips autumn
Number interviewed 2 2 4 10 2 5 3 Seed transport (km) 1150 1150 1150 21.8 21.8 21 40 Yield gross (ton/ha) 43.6 43.8 41.4 22.2 20.3 19.0 20.0 Yield net delivered (ton/ha)
41.1 40.6 40.0 20.7 20.3 18.0 18.7
Distance to market (km) 102 750 162 1813 800 380 125 2400 Seed rate (t/ha) 3.63 2.89 2.86 4.21 4.0 4.0 3.4 Soil Texture Medium Medium Medium Medium Medium Medium Medium Date of planting 11/11 10/11 8/11 17/10 1/10 17/2 15/10 100% emergence 26/11 29/11 28/11 28/10 10/10 15/3 28/10 Planting depth (cm) 10.5 12.5 14 8.5 8.8 9.0 9.5 Soil organic matter (%) Low Low Low <05% <0.5 <0.5 <1% pH 7.8 7.75 7.4 7 7 7.0 7.5 N (kg/ha) 309 282 309 191 250 181 185 P2O5 (kg/ha) 165 224 218 135 143 118 120 K2O (kg/ha) 238 290 276 149 112 140 138 Foliar NPK (kg/ha) + + + 0.8 0 Zn Micro nutrients Zn, CaNO3 0.1 Mg S Manure (t/ha) 15.1 12.9 29.2 6.2 6.2 0 3.33 Type of manure Cow Cow Cow Cow Cow - Cow #Seed treatm. 1.5 2 1.75 1 1 1 1 Soil treatment (kg/ha) 12.5 5.0 0 0 0 0 # Post em. Treatm. 5 7.5 7.3 4.9 4.9 7.3 7 # Chisel plough 2 2 2.5 2.25 2.25 1 6.7 # Disc plough 1.3 1.3 1 # Power harrow 1 1 # Sub-soiling 0.5 0.25 0.2 0.2 0.2 # Moldboard 0.125 Harrowing 1 1 2.2 Planting 1 1 1 0.75 0.75 0.33 0.33 Ridging 1.4 1.4 1 2 Tine harrow 1 1 Manure transport (km) 8 125 23 2.7 2.7 12.5 # Machine sprayer 0 3 3.75 2.25 2.25 6 1 # Fertiliser sprays 0.5 0.5 0.33 # Fertiliser spreads 1.5 1.5 0.83 1 Irrigation (mm) 315 318 335 184 260 387 188 Depth irrigation water (m) 50 53 47.5 30 30 33 31.3 Distance irrigation (m) 80 218 415 0 0 0 0 Irrigation pivot/gun 50-50 50-50 25-75dr Flooding Flooding Flooding Flooding Irrig % electr/dies Electric Electric Electric Electric Electric Electric Electric Date of haulm killing 15/2 1/3 24/2 29/12 11/12 2/5 19/12 # Windrowing 1 1 1 1 1 1 1 On Farm Trans (km) 2 11 2 5.1 5.1 Ex field Ex field

37
State Gujarat Punjab
Product
Ware Chips French fries Seed autumn
Ware autumn
Ware spring Chips autumn
Grading (%) 0 0.5 0 0.3 0.3 0.33 0 Grading Diesel/elect 0 Electric 0 Electric Electric 0 Stored (%) 100 100 100 94.5 0 0 # Months stored 3.75 6 4.75 7.0 0 0 # Degree < ambient 25 21.5 21 30 - - - CIPC # treatments 2 2 2 No - 0 CIPC dose/treatment 40 40 40 No - 0
5.3.2 Results of modelling CO2 charges of potato crops
Inserting the data of Table 12 into the Cool Farm Tool model yields the figures shown in Tables 13 - 15. In these tables the model output data for fertilizer (CO2 associated with fertilizer production in the factory, N2O – laughing gas, back-ground from the soil and that associated with residue of the potato crop) are lumped under the heading 'Fertilizer related'. Some general remarks regarding all 7 crops: Typically in all tables the fertilizer related CO2 load varies between 110 and 150 kg CO2 per ton, • Irrigations with electrical pumps costs about 50 kg CO2 per ton for the autumn and winter crops but almost
double for the Punjab spring crop due to the high evaporative demand in March and April in that region, • Seed costs in terms of CO2 are between about 90 (seed rate of 3 ton/ha) and 125 kg CO2 per ton potato
produced. This is the result of the following calculations: • Production of seed potatoes including harvest but without transport and without storage costs, • Storing the seed for 8 months costs (depending on the temperature difference between store and
ambient average day and night temperature this is 35 kg CO2 per ton per month at 25 degrees Celsius difference,
• Transporting 1 ton of seed for 1150 km, • The sum of these three factors is multiplied by the seed rate and divided by net yield to obtain the seed
related CO2 costs, • Transport costs 175.7 kg CO2 per 1000 km per ton potato. Specific remarks per product Ware potato production for the 'fresh' market out of Gujarat costs 281 kg CO2 until harvest, of which 113 kg for seed production and transport (Table 13). Ware potatoes are distributed to the market throughout the year. So for a few months ex field and then stored at 3 – 4 °C (ambient, not necessarily inside the (jute) bag for 1 - 9 months, 5 months on average). Transport to the market within the area for around 100 adds a modest 18 kg CO2 per ton. Storing for one month while cooling the store from 25 °C ambient (average day and night temperature) to around 2 °C, adds 35 kg per month to CO2 costs. Processing (for chips/crisps) potatoes need less seed potatoes but also yield less therefore showing a moderate (90 kg) footprint for seed, leading to a similar CO2 load as ware potatoes of slightly over 280 kg per ton potato (Table 13). Transporting the tubers for 750 km adds 132 kg amounting to ex-field to factory gate 414 kg. Crisping potatoes are stored at higher temperatures (8 °C rather than 2 °C) than ware potatoes to avoid sugar accumulation costing 27 kg/ton/month (versus 37 for ware). Field production + 8 months storage + transport to the factory for chipping potatoes thus amounts to 630 kg CO2 per ton.

38
Table 13. CO2 of the various components (kg/ton) of the Dutch crisping potato production and three potato production systems in Gujarat.
The Netherlands Gujarat
Crisping, slurry used Ware Chips French fries
Seed production and transport 4.8 113 90 86 Fertiliser related 31.2 109 112 128 Pesticides 12.7 3.5 6.1 5.3 Field Energy Use (excluding irrigation) 15.4 3.9 5.0 4.4 Irrigation 1.0 54.7 58.9 60.4 Grading, cooling, and storage 0.0 0.2 0.0 0.0 Off-site transport 3.8
Total at harvest, no transport/no storage 69 281 282 284
Total including transport1 104 299 414 312 Total transport + 4 months storage 111 439 522 420 Total transport + 8 months storage 117 579 630 528
1 Transport to markets (ware potatoes) or factory (crisping potatoes and French fries).
The French fries potato production is much similar to the production of chipping potatoes (Table 13). The CO2 costs to factory after 8 months of storage are about 100 kg lower of French fries potato due to the greater proximity (600 km closer) of the processing factory. Growers use drip irrigation or overhead sprinklers. Table 14 shows that where a crop uses 450 mm per season when irrigated by sprinkler it only needs 29% less - 320 mm. For drip irrigation less pressure is needed so the energy and financial costs are also less: 48.9 versus 77.6 kg CO2 per ton: a reduction of 37%.
Table 14. Comparison of sprinkler and dripping irrigation for the CO2 load of the various components of Processing Potato Production in Gujarat.
Irrigation system Irrigation applied (mm) kg CO2/ton
Sprinkler 450 77.6 Dripping 320 48.9
Table 13 shows as an example the CO2 costs of chipping potato in the Netherlands. Seed input is much less than in India because of lower amount of seed used per hectare (2.5 versus 3.6 ton/ha), higher yields so the seed costs are ‘diluted’ by more tons and the distance the seed travels (on average not more than 100 km and the CO2 costs to produce 1 ton are also lower (120 kg in the Netherlands against 315 in Punjab (Table 15). Fertilizers are used much less in the Netherlands as most fields receive around 20 ton of manure or slurry of the CO2 is attributed to the animal it produced rather than to the potato crop. Due to frequent rains most crops are hardly or not irrigated. Stores are hardly refrigerated as outside temperatures in winter are often below the temperatures of the store. Hence, ex field chipping potatoes costs 4 x as much to produce in Gujarat as in the Netherlands and delivered to the factory after 8 months even 5.4 times more (630 kg versus 117 kg).
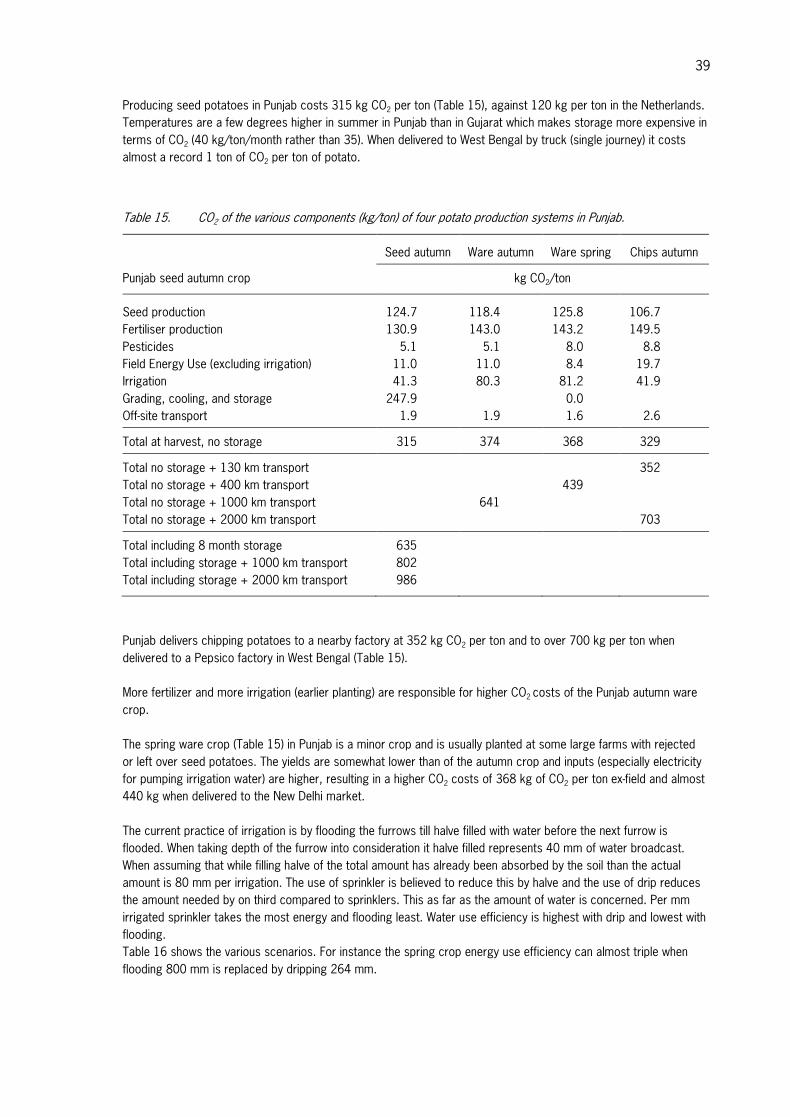
39
Producing seed potatoes in Punjab costs 315 kg CO2 per ton (Table 15), against 120 kg per ton in the Netherlands. Temperatures are a few degrees higher in summer in Punjab than in Gujarat which makes storage more expensive in terms of CO2 (40 kg/ton/month rather than 35). When delivered to West Bengal by truck (single journey) it costs almost a record 1 ton of CO2 per ton of potato.
Table 15. CO2 of the various components (kg/ton) of four potato production systems in Punjab.
Seed autumn Ware autumn Ware spring Chips autumn
Punjab seed autumn crop kg CO2/ton
Seed production 124.7 118.4 125.8 106.7 Fertiliser production 130.9 143.0 143.2 149.5 Pesticides 5.1 5.1 8.0 8.8 Field Energy Use (excluding irrigation) 11.0 11.0 8.4 19.7 Irrigation 41.3 80.3 81.2 41.9 Grading, cooling, and storage 247.9 0.0 Off-site transport 1.9 1.9 1.6 2.6
Total at harvest, no storage 315 374 368 329
Total no storage + 130 km transport 352 Total no storage + 400 km transport 439 Total no storage + 1000 km transport 641 Total no storage + 2000 km transport 703
Total including 8 month storage 635 Total including storage + 1000 km transport 802 Total including storage + 2000 km transport 986
Punjab delivers chipping potatoes to a nearby factory at 352 kg CO2 per ton and to over 700 kg per ton when delivered to a Pepsico factory in West Bengal (Table 15). More fertilizer and more irrigation (earlier planting) are responsible for higher CO2 costs of the Punjab autumn ware crop. The spring ware crop (Table 15) in Punjab is a minor crop and is usually planted at some large farms with rejected or left over seed potatoes. The yields are somewhat lower than of the autumn crop and inputs (especially electricity for pumping irrigation water) are higher, resulting in a higher CO2 costs of 368 kg of CO2 per ton ex-field and almost 440 kg when delivered to the New Delhi market. The current practice of irrigation is by flooding the furrows till halve filled with water before the next furrow is flooded. When taking depth of the furrow into consideration it halve filled represents 40 mm of water broadcast. When assuming that while filling halve of the total amount has already been absorbed by the soil than the actual amount is 80 mm per irrigation. The use of sprinkler is believed to reduce this by halve and the use of drip reduces the amount needed by on third compared to sprinklers. This as far as the amount of water is concerned. Per mm irrigated sprinkler takes the most energy and flooding least. Water use efficiency is highest with drip and lowest with flooding. Table 16 shows the various scenarios. For instance the spring crop energy use efficiency can almost triple when flooding 800 mm is replaced by dripping 264 mm.

40
Table 16. Cool farm tool calculation of various irrigation amounts and methods of application.
Punjab production kg CO2/ton
Irrigation 220 drip 33.3 Currently 220 mm is reported for the Irrigation 220 flooding 41.9 autumn season: 5.5 furrow irrigations Irrigation 220 sprinkler 54.7 at 40 mm/irrigation
Irrigation 440 drip 66.6 Realistic estimate for autumn season Irrigation 440 flooding 83.8 is 80mm per irrigation. Irrigation 440 sprinkler 109.4 Irrigation 2/3 of 440 mm 72.9 Irrigation 1/3 of 440 = 132 mm drip 22.2
Irrigation 800 flooding (spring) 152.4 Estimate for the spring season Irrigation 33% of 800 = 264 mm drip 40.0 crop 10 irrigation at 80 mm
5.4 Conclusions Producing potatoes in Gujarat ex-field was calculated at around 280 kg CO2 per ton potato, in Punjab autumn seed around 320 kg, autumn ware 60 kg more as more fertilizer and more irrigation (earlier planting) are responsible for higher CO2 costs of the Punjab autumn ware crop; the Punjab spring ware charges about 370 kg CO2 per ton potato. Producing seed potato in Punjab, storing it for 8 months and then transporting them by truck to West Bengal adds up to almost 1000 kg CO2 per ton potato. Options to reduce costs consists of: • Reduction of seed rate, currently 2.8 for French fries potato in Gujarat to 4.2 ton for seed potato production in
Punjab; • Using drip irrigation instead of sprinkler irrigation in Gujarat may reduce water use by 29% and energy costs by
37%. Using Sprinkler or even drip in Punjab rather than flood irrigation ultimately may reduce water use by 60% and energy us by 70%;
• Especially with furrow (over)irrigation in Punjab much fertilizer, notably nitrogen is leached. As a result in Punjab growers apply about 2x more nitrogen per ton harvested potatoes than in Gujarat. Here changed practices will also reduce costs;
• Modern storage practices with improved stores, especially bulk will strongly reduce storage costs.
41
6. Possibilities to improve potato production
Lubbert van den Brink; Wageningen University & Research centre, Applied Plant Research (PPO), the Netherlands Romke Wustman; Wageningen University & Research centre, Applied Plant Research (PPO), the Netherlands
6.1 Executive summary Potato production systems in Gujarat and Punjab were analysed by means of interviewing farmers and visiting their fields. In both states the actual yield is lower than the attainable yield calculated with the crop growth model LINTUL-potato. For both states it was possible to identify factors that can be improved. The lists of recommendations are preliminary lists, because fields were only visited at the start of the potato growing season. Based on visits later on in the growing season others recommendations could be added to the lists. In Gujarat the following recommendations can be given: • Quality of seed potatoes can be improved. In several visited field too many plants were missing and rotten
seed pieces were found in fields which had been planted two or three weeks earlier. Most farmers are receiving seed potato lots with a large variation in tuber size. Cutting oversized seed tubers in pieces of 25 - 30 gram is common practise. Cutting of seed potatoes will increase the risk of spreading fungal and bacterial diseases and there is also a risk of ending up with tuber pieces without any sprout. Obtaining small-sized, healthy seed potatoes could solve this problem. In this way also very high amounts of seed potatoes (up to 4.4 ton/ha) could be avoided. Also seed treatment before planting with Moncerene could probably be optimized,
• Fertilization can be improved by analysing the soil and applying fertilizers according to amounts of nutrients available in the soil. Some farmers are giving very high amounts of nitrogen, phosphate and potassium. Production costs can be reduced if these high amounts could be avoided,
• Control of pests and diseases can be improved by introducing modern spraying machines, equipped with a boom with nozzles. Spraying with fungicides and insecticides is done with a knapsack or with a handheld sprayer with a tube connected with a tank mounted on a tractor which is located in front of the field,
• Covering of the crop with pesticides is expected to be irregular. Other possibilities for improving control of pests and diseases are: introducing Decision Support Systems and evaluating the applied fungicides and insecticides,
• Optimizing drip irrigation by determining the availability of water in the soil and combining drip irrigation with fertilization (fertigation).
In Punjab the following recommendations can be given: • Quality of planted seed potatoes and also quality of the produced seed potatoes can be improved by:
• Careful handling of the seed potatoes at harvest, transport, loading and unloading of the store to avoid thumb nail cracks as much as possible,
• Storing seed potatoes in netted bags (instead of jute bags) in improved (traditional) stores with improved air ventilation,
• Treating the seed potatoes with fungicides before storing to reduce the losses caused by Fusarium dry rot,
• Optimizing the control of Rhizoctonia (choice of fungicides, method of application), • Control of pests and diseases can be improved by introducing modern spraying machines, equipped with a
boom with nozzles. Spraying with fungicides and insecticides is mostly done by a gun sprayer mounted on a tractor. The gun is manually or automatically handled. Covering of the crop with pesticides is expected to be irregular. Other possibilities for improving control of pests and diseases are: introducing Decision Support Systems and evaluating the applied fungicides and insecticides,
• Fertilization in Punjab can be improved by analysing the soil and adjusting the applied amounts of nutrients according to the amounts in the soil. Avoiding over-irrigation is also important for the efficient use of fertilizers,
• Fertilization with sea weed extracts, like Australian power, should be evaluated, • Possibilities to replace furrow irrigation by drip irrigation should be studied.

42
6.2 Introduction Farmers in Gujarat and farmers in Punjab were interviewed (Table 12) when visited between 24 November and 7 December 2014. For each farmer a questionnaire was filled out to obtain information about several aspects of the potato production: • Crop rotation, • Obtained yield and losses, • Varieties, • Quality of seed potatoes and treatments of seed potatoes (pre-planting and pre-storage), • Soil conditions (soil type, organic matter %, pH); available information of soil analysis, • Methods of soil tillage, • Planting pattern, depth of planting, methods of planting, • Irrigation methods, applied amount and water quality, • Fertilization (quantities of different nutrients, application methods), • Occurrence of soil borne diseases (for instance nematodes), • Weed control, • Control of pests and diseases; applied fungicides and insecticides, application methods, • Harvesting methods and handling after harvest (transport, storage), • Storage of the harvested product (type of store, temperature, period of storage, treatments during storage). Based on the obtained information and the observations in the fields several preliminary recommendations could be given to improve potato production. The recommendations which are presented in this chapter are based on the first visit. It is possible that additional recommendations could be given after the second and third visit in January and February 2014.
6.3 Results
6.3.1 Results of Gujarat
Actual yield
Yield levels reported by the farmers were rather high: Table: 26 - 50 ton/ha Chips: 40 - 43 ton/ha French fries: 34 - 47 ton/ha In Gujarat planting is done in the first half of November and haulm flailing/killing in the second half of February. The low yield of one of the table potato growers could be explained by an early crop harvest: 65 days (planting beginning of November; harvest beginning of January). The number of growing days of the other crops ranged from 83 till 118 days. The attainable yields for table, chips in Gujarat are respectively 57, 64 and 63 ton/ha (see Chapter 4). So, the yield gap is ranging from 13 - 45% (relative to the attainable yield).
Quality of seed potatoes
Some farmers were satisfied about the quality of the seed potatoes, but other farmers made the following remarks: • Variation in tuber size is too large. • Sometimes mixing up of varieties. • Sometimes rotten tubers and tuber pieces.

43
One farmer mentioned an excellent quality. Chips farmers obtained seed potatoes from seed potato growers producing seed for Pepsico. McCain growers received their seed through McCain. Both companies operate seed multiplications schemes in Punjab. Only one farmer was using farm saved seed (15%). Almost all seed potatoes were originating from Punjab. In the workshop it was mentioned that McCain is trying to grow G3 and G4 generations in Gujarat. This will reduce transport costs and thus seed costs. All farmers, except one, were cutting tubers into pieces of 25 till 30 gram. Most farmers were treating their seed potatoes with Moncerene (control of Rhizoctonia solani) and Mancozeb (assumed to control of Fusarium rot). Some farmers were also treating seed potatoes with the insecticide Imidacloprid. There is a large variation in the amount of planted seed potatoes per ha: 2.0 – 4.4 ton per ha. Cutting of seed potatoes will increase the risk of spreading diseases in the seed potato lot (both: fungal and bacterial diseases). Another disadvantage is the risk of ending up with tuber pieces without any sprout (and as a consequence missing plants). Low plant density was observed in some fields: field emergence estimated at ca. 75%. Sometimes rotten seed pieces were found in fields which had been planted two or three weeks earlier. It can be concluded that the quality of seed potatoes is probably one of the most important constraints in potato production in Gujarat. If too many plants are missing yield will be reduced considerably. Yield could probably be improved by obtaining small-sized seed potatoes. The total amount of seed potatoes could be decreased and it will not be needed to cut seed potatoes.
Fertilization
A large variation was found in the amounts of fertilizers applied by the farmers: Nitrogen: 185 – 352 kg N/ha Phosphate: 113 – 260 kg P2O5/ha Potassium: 225 – 325 kg K2O/ha The applied amounts were not based on soil analysis. The highest amounts of NPK are quite high. Fertigation was not used by the visited farmers. Part of the fertilizers was applied before or at planting, while some farmers were also applying with drip irrigation. The pH of the soil was relatively high: 7.0 to 8.1. In general the soil type is sand/ loamy sand or sandy loam. Most farmers are applying micronutrients: Mg, Mn, Fe, S, Bo. All visited farmers were applying cow manure. The amounts ranged from 5.8 to 50 ton/ha per year. Fertilization can probably be improved by analysing the soil and applying fertilizers according to amounts of nutrients available in the soil. Some farmers are giving very high amounts of nitrogen, phosphate and potassium. Production costs can be reduced if these high amounts could be avoided. Farmers in Gujarat are growing potatoes with drip or sprinkler irrigation. Over-irrigation does probably not occurring. As a consequence leaching of nutrients will be low.
Control of pests and diseases
Two farmers are applying nematicides (carbofuran) to control Melodoigyne. The occurrence of this nematode was related to the crops grown in the period between two potato crops. During the workshop the Research Station of Deesa presented results of research on Melodoigyne. The application of carbofuran was reducing the damage caused by Melodoigyne. According to the Research Station it was not an option for the farmer to grow potatoes less frequently on their fields. It is known that some crops are multiplying Melodoigyne more than other crops. Avoiding these crops could solve this problem.

44
In Gujarat fungal diseases, especially late blight, are less important than in Western Europe. In general, three to four spraying with fungicides are sufficient. Mancozeb was used most frequently. Sometimes cymoxanil (Curzate) or metalaxyl were applied; the latter is a systemic fungicide. One farmer mentioned that more frequent curative fungicides spraying were required with sprinkler irrigation in comparison with drip irrigation. In general, spraying with insecticides is carried out 3 - 4 times. The main insects are: trips, aphids, white flies and army cutworm. Various insecticides are used: imidacloprid, dimethomorf and thiomethoxam. Sometimes seed potatoes are treated with imidacloprid. It is not known if the use of fungicides and insecticides is optimal in Gujarat. Decision Support Systems are not used. The spraying methodology is not optimal. Spraying is carried out with a knapsack or with a handheld sprayer with a tube connected with a tank mounted on a tractor which is located in front of the field. The covering of the crop with pesticides is expected to be irregular. This can be improved by introducing modern sprayers mounted on a tractor (equipped with a boom and nozzles).
Irrigation
Most Gujarat farmers are using drip irrigation. The crop is grown on beds with 2 to 4 rows and 1 or 2 drip lines on a bed. A limited number of farmers were using sprinkler irrigation. Less water is used with drip irrigation as with sprinkler irrigation and also late blight is occurring less frequently. In the future, efficient use of water will become more important. Each year, the water table in the soil is going down.
6.3.2 Results of Punjab
Yield
Yield levels reported by the farmers were at a moderate level: Seed potatoes: 19 - 25 ton/ha Chips potatoes: 19 - 23 ton/ha Ware potatoes (spring crop): 18 - 20 ton/ha The moderate yield level in Punjab is the result of the short growing period in a period of the year with short days. Planting of seed potato crops is done in the second half of October and haulm cutting in the end of December/ beginning of January. Planting of chips potatoes is done in the second half of September haulm cutting is done in the second half of December. This means that crops are growing during 65 -75 days. Ware potatoes as a spring crop are planted in the first half of January and harvested in April, beginning of May. The attainable yields were higher than the actual yields mentioned above (attainable yield seed potatoes: 29 ton/ha; chips potatoes: 25 ton/ha; ware potatoes (spring crop): 19 ton/ha). This means there are probably possibilities to increase potato production or the quality of the harvested potatoes.
Plant density and quality of seed potatoes
Plant density and number of stems on the observed fields were rather satisfactorily. On average plant density of seed potato fields was 8 - 9 plants/m2; number of stems: 20 – 25 stems/m2. On average, planting is done mid-October and crop development was very fast. Two months after planting 90% of the soil is covered with foliage. Percentage of emerged plants was estimated at 90 – 95%. In October 2013 an experiment was started at the Punjab Agricultural University experimental farm in Ludhiana in which fifty seed lots of variety Kufri Pukrah were planted. The seed lots were provided by POSCON and were originating from various farmers/cold stores. The quality of the seed lots was assessed before planting. There was a large variation in quality. There were many seed lots containing tubers affected by Fusarium dry rot (54% of the seed lots were containing more than 10% tubers with dry rot).

45
Related to the above mentioned high incidence of Fusarium dry rot in seed lots the emergence of plants observed in the visited fields on farms was much better than expected. It is possible that the farmers were using better seed lots than the seed lots that were planted in the experiment. It is also possible that the seed tubers with Fusarium dry rot were sorted out prior to or during planting. During the visit it appeared that most farmers are storing seed potatoes in jute bags in traditional stores. Only a few famers store in netted bags in improved traditional stores. Ventilation in jute bags is poor and most traditional stores do not have equipment to obtain optimal ventilation. Fusarium dry rot will increase during storage if ventilation is not optimal. The use of netted bags and improved traditional stores will improve the quality of seed potatoes. Also the (financial) losses caused by sorting out diseased seed potatoes will decrease. In Punjab potatoes are transported and stored in bags of 50 kg. Potatoes are damaged during handling. During the evaluation of the seed lots planted in the experiment in Ludhiana it appeared that 90% of the seed lots were containing more than 10% tubers with thumb nail cracks (Figure 5, right). Thumb nail cracks are gateways for diseases like Fusarium and bacteria like Erwinia to infest the tubers. Thumb nail cracks can be avoided by more careful handling: instructions for the people who are handling the bags, minimizing of handling operations, covering truck floors with soft material (matrasses) to reduce damage.
Figure 14. Fungal diseases found after storage (left), an internal sprouting potato (centre) and Rhitzoctonia (right).
Seed potatoes in Punjab are not treated with fungicides before storage. It should be useful to investigate if seed treatment before storage will be able to reduce the losses caused by Fusarium dry rot and could improve the quality of the sold seed potatoes. A number of fungicides are available to protect seed potatoes against Fusarium solani (Imazalil, Thiabendazole), Phoma (imazalil, Thiabendazole), Fusarium sulphureum (imazalil), and Helminthosporium solani (imazalil). In Punjab seed potatoes are treated against Rhizoctonia solani before planting. Various fungicides are used: Moncerene (in most cases), mercury chloride, boric acid or azoxystrobin. However, despite such treatment a large number of fields with Rhizoctonia infected plants were found during the visit. It is useful to investigate the most effective fungicide for Rhizoctonia control. Some farmers are spraying the fungicide over a thin layer of tubers, while other farmers are dipping the tubers in the fungicide solution. Experience shows that dipping has a risk of spreading diseases within the seed lot. Summarized it can be concluded that the quality of planted seed potatoes and also the produced seed potatoes in Punjab could be probably improved by: • Careful handling of the seed potatoes at harvest, transport, loading and unloading of the store to avoid thumb
nail cracks as much as possible. • Storing seed potatoes in netted bags (instead of jute bags) in improved (traditional) stores (improved
ventilation). • Treating the seed potatoes with fungicides before storing to reduce the losses caused by Fusarium dry rot. • Optimizing the control of Rhizoctonia (choice of fungicides, method of application).

46
Control of pests and diseases
Most Punjabi seed potato growers apply 1 to 2 preventive Mancozeb applications for late blight control. Late blight is an occasional (minor) problem in seasons with cloudy and moist weather in December and January. If late blight is occurring also systemic fungicides are used. In ware potatoes grown in February – May more spraying against late blight are required (4 to 5 times).
Figure 15. Spraying equipment in Gujarat (left) and an application of fungicides in Punjab (right).
Application of fungicides and insecticides is mostly done by a gun sprayer mounted on a tractor (Figure 15). The gun is manually or automatically handled. This method is not optimal. The pesticide covering of the crop is expected to be irregular. This can be improved by introducing modern sprayers mounted on a tractor (equipped with a boom and nozzles). Some farmers are using additives which are added to the fungicides to expand the period that the fungicide is sticking on the leaves. Studies into the effectiveness of stickers have to be looked up. In seed potatoes 1 to 3 sprayings with insecticides are carried out (imidacloprid). It is not known whether the use of fungicides and insecticides is optimal in Punjab. Decision Support Systems are not used.
Fertilization
The amounts of fertilizers applied differed between farmers: Nitrogen: 150 – 223 kg N/ha Phosphate: 112 – 240 kg P2O5/ha Potassium: 132 – 188 kg K2O /ha In general, the applied amounts were not based on soil analysis. Compared to other countries the highest amounts of NPK are rather high. Seed potato crops in other parts of the world are often fertilized with 120 – 140 kg N/ha. In Punjab seed potatoes are grown under furrow irrigation. Leaching of nitrogen and potassium is expected to be high with furrow irrigation. So, it could be expected that required nitrogen and potassium applications would be high in Punjab. During the visit it appeared that some crops had a very dark green foliage colour. This could be a sign that nitrogen fertilization is too high. Nitrogen is applied at two moments: at planting (mostly with the planting machine) and before earthing up the ridges (30 - 40 days after planting). Fertilization in Punjab can be improved by measuring the amounts of nutrients in the soil and adjusting the applied amounts according to these amounts. Avoiding over-irrigation is also important for the efficient use of fertilizers.

47
The pH of the soil is relatively high: 7 till 8. In general the soil type is heavier than in Gujarat: loamy or clay. Some farmers are applying micronutrients: Mg, Mn, Fe, S, Bo and Zn. During the visit only Zn-deficiency symptoms were observed on one field. Organic manure is used by a limited number of farmers due to short supply. Some farmers are applying composted organic manure: 4 till 5 ton/ha per year. Some farmers are applying sea weed extracts (Australian power). It would be worthwhile to investigate whether such inputs are useful.
Irrigation
In Punjab all farmers are using furrow irrigation. The disadvantages of furrow irrigation are the high amounts of water that should be used and also the leaching of nutrients. Water use efficiency with drip irrigation is much better and also leaching of nutrients is much lower. On the long term shortage of water is expected. It could be worthwhile to study the possibilities of introduction of drip irrigation in Punjab.
6.4 Conclusions Potato production systems in Gujarat and Punjab were analysed by means of interviewing farmers and visiting their fields. In both states the actual yield is lower than the attainable yield calculated with the crop growth model LINTUL-potato. For both states it was possible to identify factors that can be improved. The lists of recommendations are preliminary lists, because fields were only visited at the start of the potato growing season. Based on visits later on in the growing season others recommendations could be added to the lists. In Gujarat the following recommendations can be given: • Quality of seed potatoes can be improved. In several visited field too many plants were missing and rotten
seed pieces were found in fields which had been planted two or three weeks earlier. Most farmers are receiving seed potato lots with a large variation in tuber size. Cutting oversized seed tubers in pieces of 25 - 30 g is common practise. Cutting of seed potatoes will increase the risk of spreading fungal and bacterial diseases and there is also a risk of ending up with tuber pieces without any sprout. Obtaining small-sized, healthy seed potatoes could solve this problem. In this way also very high amounts of seed potatoes (up to 4.4 ton/ha) could be avoided. Also seed treatment before planting with Moncerene could probably be optimized.
• Fertilization can be improved by analysing the soil and applying fertilizers according to amounts of nutrients available in the soil. Some farmers are giving very high amounts of nitrogen, phosphate and potassium. Production costs can be reduced if these high amounts could be avoided.
• Control of pests and diseases can be improved by introducing modern spraying machines, equipped with a boom with nozzles. Spraying with fungicides and insecticides is done with a knapsack or with a handheld sprayer with a tube connected with a tank mounted on a tractor which is located in front of the field. Covering of the crop with pesticides is expected to be irregular. Other possibilities for improving control of pests and diseases are: introducing Decision Support Systems and evaluating the applied fungicides and insecticides.
• Optimizing drip irrigation by determining the availability of water in the soil and combining drip irrigation with fertilization (fertigation).
In Punjab the following recommendations can be given: • Quality of planted seed potatoes and also quality of the produced seed potatoes can be improved by:
• Careful handling of the seed potatoes at harvest, transport, loading and unloading of the store to avoid thumb nail cracks as much as possible.
• Storing seed potatoes in netted bags (instead of jute bags) in improved (traditional) stores with improved air ventilation.
• Treating the seed potatoes with fungicides before storing to reduce the losses caused by Fusarium dry rot.
• Optimizing the control of Rhizoctonia (choice of fungicides, method of application).

48
• Control of pests and diseases can be improved by introducing modern spraying machines, equipped with a boom with nozzles. Spraying with fungicides and insecticides is mostly by a gun sprayer mounted on a tractor. The gun is manually or automatically handled. Covering of the crop with pesticides is expected to be irregular. Other possibilities for improving control of pests and diseases are: introducing Decision Support Systems and evaluating the applied fungicides and insecticides.
• Fertilization in Punjab can be improved by analysing the soil and adjusting the applied amounts of nutrients according to the amounts in the soil. Avoiding over-irrigation is also important for the efficient use of fertilizers.
• Fertilization with sea weed extracts, like Australian power, should be evaluated. • Possibilities to replace furrow irrigation by drip irrigation should be studied.

49
7. Potato – and potato products – marketing and consumer survey in Delhi NCR
Bas Janssens; Wageningen University & Research centre, Agricultural Economics Research Institute, the Netherlands Maureen Schoutsen; Wageningen University & Research centre, Applied Plant Research (PPO), the Netherlands Annette Pronk; Wageningen University & Research centre, Plant Research International, the Netherlands
7.1 Executive summary This survey was carried out from 18 - 22 November 2013. The research team has acquired data on flows of potatoes and potato (products) sold in Delhi National Capital Region (NCR) and obtained an impression of consumer consumption preferences (of both potato and potato products). The researchers carried out a number of (>20) in depth interviews with representatives of different stakeholders within the potato supply chain and obtained additional data from a google-search. The population in Delhi NCR (population 2011: 46 million people) will grow yearly with 2.5%. Delhi’s per capita income is amongst the highest of the country. Traded volumes of fresh potatoes on Delhi NCR wholesale markets will stabilize at 1 million tons or decrease slightly: due to changing food habits consumers will prefer prepared potato products instead of fresh potatoes. Supermarkets increase direct buying from cold stores outside Delhi NCR.
Table 17. Consumption of potatoes and potato products in Delhi NCR (in tons, 2011).
Fresh product 1,000,000 Chips (processed product) 23,000 French fries (processed product) 6,680
The most important income class for the development of the market for processed potatoes (French fries and frozen products) is the middle class (40%) and upper lower class (10%), which is 50% of the population. These people easily buy American style food and their food habits change radically. Busier lifestyles, the increase in female work population and young, unmarried workers that live on their own lead to a shift to ready to eat food items in order to save time involved in preparing meals. It is estimated that the consumption of French fries in Delhi NCR will increase at least 30%. The market for chips will grow as well, but less than the French fries market.
Figure 16. Development of consumption of potatoes and potato products in Delhi NCR.
0%
50%
100%
150%
200%
250%
300%
350%
2011 2012 2013 2014 2015 2016 2017 2018 2019 2020 2021
French fries chips
50
Quick Service Restaurants (QSR’s) and supermarkets are the most important selling channels of processed potatoes (French fries and frozen products). All fresh potatoes and most potato products (brands) consumed in Delhi NCR are imported from other Indian regions. When calculating the fresh potato consumption increase in Delhi NCR it should be considered that the fresh potato consumption per person per year in Delhi NCR is above average (at least 21.7 kg, while the average in India in the urban area is about 20 kg per person per year (Vanitha et al. 2013)). Population groups in Delhi NCR who can afford (elite, upper class), consume 35 kg fresh potatoes per year. The quality of fresh potatoes in shops, especially supermarkets, is low and needs to be improved. There is a shift in the way of buying potatoes by big super- or hypermarkets: they intensify buying potatoes in the potato growing regions from warehouses and reduce buying at wholesale markets (mandis).
7.2 Introduction This potato – and potato products - marketing and consumer survey was carried out by a team from Wageningen University and Research centre (Wageningen UR) from 18 - 22 November 2013. The team has acquired data on flows of potatoes and potato (products) sold in Delhi National Capital Region (NCR) and obtained an impression of consumer consumption preferences (of both potato and potato products). The researchers carried out a number of (>20) in depth interviews with representatives of different stakeholders within the potato supply chain (among which potato suppliers, seed potato producers, potato snacks producing companies, consultancy services, (sub-)wholesalers, potato commission agents, supermarkets, street vendors, supermarkets, hotel/restaurants and small processors). Most of the interviews were planned but some of them were spontaneously taken at the food & vegetable markets (called the mandis) that were visited, in shops or in quick service restaurants. Consumers (± 10) were interviewed briefly and at random. The research team was assisted by a representative of the Netherlands Agro, Food & Technology Centre (NAFTC), who also served as an interpreter. The survey results were supplemented by information collected through google search. It should be mentioned that the survey can be seen as a snapshot and the results are more or less time-bound. Dynamics change fast in India, from year to year. However, trends that appear in this chapter certainly give an impression of the market potential of potato and potato products. At the moment of the mission the exchange rate of €1 was INR 82 (18th November 2013).
7.3 Delhi National Capital Region (NCR) Delhi NCR is the region which has a radius of 70 km around the city of New Delhi. The total area is about 30,000 square kilometres (according to data from before July 2013). Delhi NCT National Capital Territory) is part of Delhi NCR. Since July 2013 the NCR is extended by three more districts: Mahendragarh and Bhiwani (both in Haryana) and Bharatpur (Rajasthan). This brings the number of districts in the NCR to 19, with the total area increasing by 34% to 45,887 sq. km. The main factors that explain the development in potato consumption are: 1. Number and growth of population; 2. Potato consumption per person; 3. Income and income development; 4. Changing food habits.

51
Number and growth of population
The growing population (2.5% per year) in Delhi NCR means that the potato consumption increases as well. Yearly around 500,000 young people from the countryside move to Delhi NCR for a job to provide for their livelihood (= 1% of population).
Table 18. Sub-Region Wise Distribution of Population in NCR (2001-2011).
Sub-region Population Share of population (% of population in NCR)
Growth (%)
2001 2011 2001 2011 2011/2001
NCT-Delhi 1,38,50,507 1,67,53,235 37.3 36.4 121.0 Haryana 86,87,050 1,10,37,548 23.4 24.0 127.1 Rajasthan 29,92,592 36,71,999 8.1 8.0 122.7 Uttar Pradesh 1,15,70,117 1,45,84,234 31.2 31.6 126.1 Delhi NCR 3,71,00,266 4,60,49,032 100.0 100.0 124.1
Source: Census of India- 2001, 2011* (Provisional)1.
The population composition of Delhi NCR shows that approximately 50% of the population is below 25 years old (Table 19) and that this is comparable with the population composition of India. In time, the population composition is expected to age as the percentage of young people below 25 years of age, will decrease in 2021 by 6% and the age group older than 30 years will increase by the same percentage (Figure 19).
Table 19. The population composition (%) of India and Delhi NCT (www. censusindia.gov.in/2011census /population_enumeration.aspx).
Age groups India Delhi NCT
0-10 22 20 10-25 30 31 25-35 16 18 35-59 23 25 59 and older 9 7
Total 100 100
1 http://ncrpb.nic.in/pdf_files/Draft%20Revised%20Regional%20Plan%202021/06%20Chapter%204%20
Demographic%20Profile%20and%20Settlement%20Pattern-26%20july%202013.pdf

52
Figure 17. Percentage distribution of projected population by age as on 1st of March 2001, 2011 and 2021 in Delhi (Population projections for India and states 2001-2026, 2006).
Potato consumption per person
Most potatoes in India are consumed as fresh potatoes. The average fresh potato consumption in Delhi NCR is 100 grams of potatoes per person per day for consumers who buy potatoes at supermarkets (Source: personal communication from supermarket procurement managers) (= 2.5 – 3 kg per 4 week = 35 kg per year). The average consumption in the rural areas and urban areas of India is about 20 and 16.4 kg per year respectively (Vanitha et al. 2013). Yearly 1,000,000 tons potatoes are traded at all mandies in Delhi so average consumption of fresh potatoes in Delhi NCR is calculated at least 21.7 kg per capita. It is expected the total potato consumption of Delhi NCR will stay at 1 million ton fresh potatoes and hardly change or decrease slightly in future. Poor people will consume more potatoes while the upper class will prefer French fries instead of fresh potatoes. When an estimate is made of the potato consumption increase in Delhi NCR this current above average consumption of potato should be considered.
Income and income development
The urban share of the total population in Delhi NCR was 97.5% in 2011. In the whole country of India this percentage is 31.1%. Delhi’s per capita income is amongst the highest of the country. The per capita real income is constantly higher than the national average and increased almost two folds at constant prices (Figure 18). It recorded an increase of about 6.9% in Delhi as compared to 2.9% of the national per capita income during 2012 - 13.
Figure 18. Per capita real income of Delhi NCR and India (in INR. hundred thousand and at constant 2004-05 prices). Source: Economic survey of Delhi, 2012-13.
0
2
4
6
8
10
12
2001 2011 2021
0
20
40
60
80
100
120
140
Delhi
India
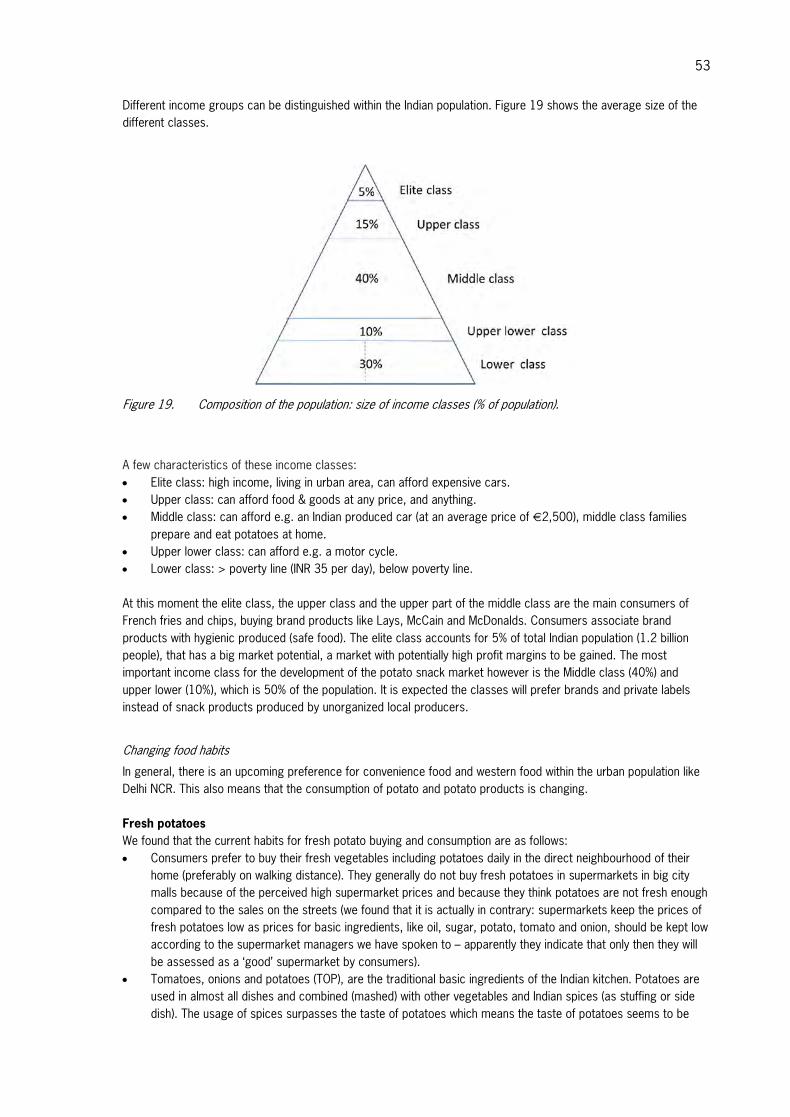
53
Different income groups can be distinguished within the Indian population. Figure 19 shows the average size of the different classes.
Figure 19. Composition of the population: size of income classes (% of population).
A few characteristics of these income classes: • Elite class: high income, living in urban area, can afford expensive cars. • Upper class: can afford food & goods at any price, and anything. • Middle class: can afford e.g. an Indian produced car (at an average price of €2,500), middle class families
prepare and eat potatoes at home. • Upper lower class: can afford e.g. a motor cycle. • Lower class: > poverty line (INR 35 per day), below poverty line.
At this moment the elite class, the upper class and the upper part of the middle class are the main consumers of French fries and chips, buying brand products like Lays, McCain and McDonalds. Consumers associate brand products with hygienic produced (safe food). The elite class accounts for 5% of total Indian population (1.2 billion people), that has a big market potential, a market with potentially high profit margins to be gained. The most important income class for the development of the potato snack market however is the Middle class (40%) and upper lower (10%), which is 50% of the population. It is expected the classes will prefer brands and private labels instead of snack products produced by unorganized local producers.
Changing food habits
In general, there is an upcoming preference for convenience food and western food within the urban population like Delhi NCR. This also means that the consumption of potato and potato products is changing. Fresh potatoes We found that the current habits for fresh potato buying and consumption are as follows: • Consumers prefer to buy their fresh vegetables including potatoes daily in the direct neighbourhood of their
home (preferably on walking distance). They generally do not buy fresh potatoes in supermarkets in big city malls because of the perceived high supermarket prices and because they think potatoes are not fresh enough compared to the sales on the streets (we found that it is actually in contrary: supermarkets keep the prices of fresh potatoes low as prices for basic ingredients, like oil, sugar, potato, tomato and onion, should be kept low according to the supermarket managers we have spoken to – apparently they indicate that only then they will be assessed as a ‘good’ supermarket by consumers).
• Tomatoes, onions and potatoes (TOP), are the traditional basic ingredients of the Indian kitchen. Potatoes are used in almost all dishes and combined (mashed) with other vegetables and Indian spices (as stuffing or side dish). The usage of spices surpasses the taste of potatoes which means the taste of potatoes seems to be

54
hardly a quality item to consumers when they buy potatoes. Price per quantity (INR/kg) is the most important item. Because potato is a traditional ingredient in the Indian kitchen consumer will always buy potatoes; Indian people use 3 cooked meals per day (21 meals per week);
• For health reasons Indian consumers prefer to buy sugar free potatoes. In urban India type 2 diabetes reaches epidemic proportions (2 to 5% of the population, (King et al. 1998) ) which occurs on average 20 years earlier compared to western countries. Sugar consumption is discouraged for people with diabetes type 2 and sugar in potatoes is therefore considered as unhealthy. Besides that, the public view is that sugars are fattening and thus contribute to developing type 2 diabetes;
• During fasting days (at least 20 - 30 days per year) it is permitted to consume potatoes or potato products. • Uttar Pradesh (UP) potatoes are told to be consumers favourite. A supermarket manager indicates that UP is
the original potato area and the soil in this region is light in colour. It is a sandy soil, resulting in bright, clean potatoes. Consumers prefer this. Regions outside UP contain dark soil, resulting in darker potato skins. Besides, UP is also known for its potato varieties.
• Consumers prefer well graded, low sugar potatoes with a long shelf life.
Figure 20. Consumers believe that fresh delivered potatoes (left) at street sellers (centre) are fresher than potatoes in the supermarkets (right).
Processed potatoes – French fries and chips Young people (around 500.000 in Delhi NCR), e.g. the ones that move to Delhi NCR have full time jobs, do not have much time to shop and cook. Many of these young people (the ones that can afford it) go for lunch or dinner to Quick Service Restaurants (QSR’s) twice or thrice a week, but also parents from the middle class families take their family to the QSR about twice a week. Besides, with the breakdown of formal meals, consumers are increasingly tending to eat a number of smaller snacks during the day (grazing) rather than three full meals. Furthermore, in an increasingly fast paced financially well-off society (like the middle class), there is growing demand for snacks that are easy to buy, store and eat, with an increasing number being eaten 'on the move'. According to the industry executives consumers look more and more for convenience in getting pre-cut vegetables and all year round availability. One could say that this trend will probably affect the market for deep frozen potato snacks and French fries as well in the coming years. 'The Indian cooking styles have undergone considerable changes over the past few years owing to the advent of modern technology and several other changes such as urbanization, busier lifestyles, increase in female work population and augmenting nuclear families. People have been increasingly shifting to ready to eat food items in order to save time involved in preparing meals.'2
2 http://www.businesswire.com/news/home/20130814005810/en/Research-Markets-India-Packaged-Food-
Industry-Outlook.

55
'High consumer spending over the years by the young population (more than 31% of the country is below 14 years) and sharp rise in disposable income are driving the Indian organized retail sector’s growth. Even small towns and cities are witnessing a major shift in consumer lifestyle and preferences.'3
7.4 Main Potato flows in Delhi NCR Experts indicate that there are two important flows of potatoes into Delhi NCR: • Fresh potatoes • Processed potatoes:
• French fries and frozen products • Chips and snacks
Figure 21 indicates the major potato flows into and within Delhi NCR.
Figure 21. Major potato flows into and within Delhi NCR (this study).
Experts (B. Vishwanath, S. Kumar) also indicate that 3% of the potatoes is processed into chips and French fries (2.5% chips and at most 0.5% French fries). Other processing activities are the production of potato starch and flour. Table 20 shows the average potato utilization in India.
3 Source: Dun & Bradstreet’s publication ‘Indian Retail Industry: Challenges, Opportunities and Outlook’ (2009)
( http://www.dnb.co.in/IndianRetailIndustry/).
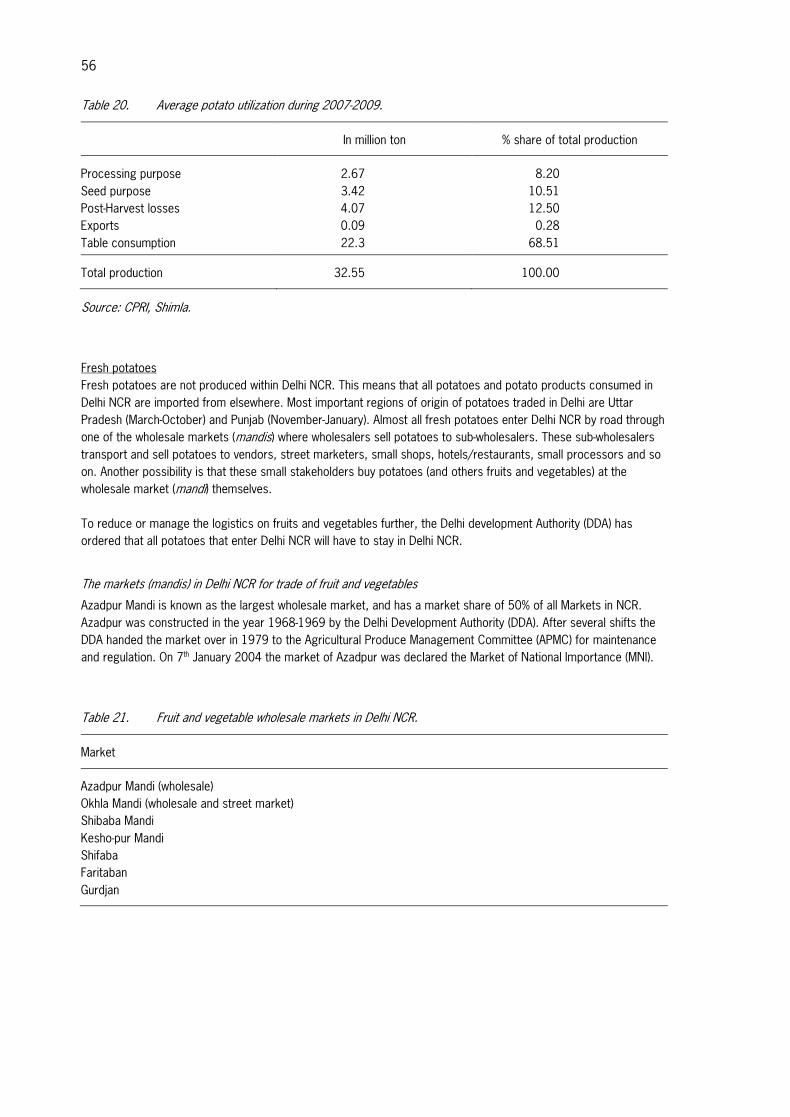
56
Table 20. Average potato utilization during 2007-2009.
In million ton % share of total production
Processing purpose 2.67 8.20 Seed purpose 3.42 10.51 Post-Harvest losses 4.07 12.50 Exports 0.09 0.28 Table consumption 22.3 68.51
Total production 32.55 100.00
Source: CPRI, Shimla.
Fresh potatoes Fresh potatoes are not produced within Delhi NCR. This means that all potatoes and potato products consumed in Delhi NCR are imported from elsewhere. Most important regions of origin of potatoes traded in Delhi are Uttar Pradesh (March-October) and Punjab (November-January). Almost all fresh potatoes enter Delhi NCR by road through one of the wholesale markets (mandis) where wholesalers sell potatoes to sub-wholesalers. These sub-wholesalers transport and sell potatoes to vendors, street marketers, small shops, hotels/restaurants, small processors and so on. Another possibility is that these small stakeholders buy potatoes (and others fruits and vegetables) at the wholesale market (mandi) themselves. To reduce or manage the logistics on fruits and vegetables further, the Delhi development Authority (DDA) has ordered that all potatoes that enter Delhi NCR will have to stay in Delhi NCR.
The markets (mandis) in Delhi NCR for trade of fruit and vegetables
Azadpur Mandi is known as the largest wholesale market, and has a market share of 50% of all Markets in NCR. Azadpur was constructed in the year 1968-1969 by the Delhi Development Authority (DDA). After several shifts the DDA handed the market over in 1979 to the Agricultural Produce Management Committee (APMC) for maintenance and regulation. On 7th January 2004 the market of Azadpur was declared the Market of National Importance (MNI).
Table 21. Fruit and vegetable wholesale markets in Delhi NCR.
Market
Azadpur Mandi (wholesale) Okhla Mandi (wholesale and street market) Shibaba Mandi Kesho-pur Mandi Shifaba Faritaban Gurdjan

57
General information of the Azadpur Madi: • Volumes of the 6 major commodities, including potatoes at Azadpur are presented in Table 22. The year runs
from February till the end of January. • There are 1,703 wholesalers/Traders, 2,357 Commission Agents, 1 Retailer, 15 Palledar (firms renting out
labourers who handle/transport the bags on the market on foot (Prasad 1999) and 127 Grower I Card holders present at the market.
• Potatoes are bagged in 50 kg bags and sold per bag (Table 23). • The peak season of selling potatoes is between November and January with a daily average arrival of ≈
30,000 bags (Figure 22). The minimum daily arrival is 18000 bags in June. There is no storage facility available at the market, so at the end of the day the majority of the potatoes is sold.
• Nearly 91% of the potato arrivals to Azadpur come from Uttar Pradesh, Punjab and Himachal Pradesh. • The rent that has to be paid on the market is INR 45 per bag per day. • Potato varieties sold at the market: Chipsona 1, 2 and 3, Lady Rosetta, Kufri Bahar 3797, Atlanta, Simsona,
Santana, 1533 (for chips), Kurfi Pukhraj (table), Kufri Jhoti. • The market is open from 7 AM to about 2 PM, and is closed on Sundays.
Figure 22. Average monthly arrival of fresh potatoes at Azadpur Mandi, Keshopur Mandi and Shahdara Mandi (2009 – 2013; http://www.delagrimarket.nic.in, accessed on 13 January 2014).
Table 22. Arrival of 6 Major Commodities at Azadpur Mandi (tons/year, including sub-yards).
Commodity 2007-08 2008-09 2009-10 2010-11 2011-12
Apple 849,737 756,086 633,893 823,770 600,025 Banana 215,393 219,545 156,144 155,018 132,892 Mango 260,433 192,389 179,883 224,255 204,758 Potato 533,500 592,115 519,097 545,665 540,858 Onion 412,475 406,038 427,015 400,549 446,047 Tomato 213,243 211,416 209,404 198,691 225,264
(Source: www.apmcazadpurdelhi.com/aboutus.doc , accessed on 13 January 2014).
0
10000
20000
30000
40000
50000
tons
/mon
th
Azadpur Keshopur Shahdara

58
Table 23. An example of the published daily arrivals of potatoes at the Azadpur Mandi (Market Information Bulletin of Friday 10 January 2014, Agricultural Produce Marketing Committee GOVT. OF NCT OF DELHI).
Crop Name of the community of state
Arrival (tons)
Variety Weight
(kg) Type of Packing
Grade/ Size
Wholesale Prices (INR)
Min Max Modal
Potato 1095 PUN/HP/UP/HAR N.C. 50 BAG A 400 450 430 50 BAG B 340 390 360 PUN/KHANNA LR 50 BAG A 520 600 570 50 BAG B 425 500 460 GOLI.LR 50 BAG 250 350 300 PUN/MOGA GOLI.KAT 50 BAG 150 250 200
(Source: www.apmcazadpurdelhi.com/delagrimarket.nic.in, accessed on 13 January 2014).
Total yearly volume fresh potatoes traded on wholesale markets in Delhi is calculated at 1,000,000 tons, about 3,000 tons per day (50% via Azadpur). This means 22 kg potatoes per capita per year enter Delhi NCR via the wholesale markets. Beside this some supermarkets buy directly form warehouses or farmers. Since 1977 Shahdara and Keshopur fruit & vegetables market were the notified sub-yards of Agricultural Produce Marketing Committee (APMC), Azadpur. However, they were separated in1992 and in 2001 respectively. Okhla fruit and vegetable market was developed by the DDA and handed over to APMC Azadpur as its sub-yard in1987. The traders operating from Phool mandi, Daryaganj were shifted to Okhla sub-yard with the view to decongest the walled city. As of now, three major fruit & vegetable markets handling potatoes exist with one sub-yard market (Figure 23).
Figure 23. The establishment of the fruit & vegetable markets of Delhi that sell potatoes (left) and the location within the Delhi NCR region.
During the period we visited Azadpur Mandi (18th of November 2013) potato prices were high compared to previous seasons: INR 14 - 16 per kg for table potatoes and INR 20 per kg for processing potatoes like Lady Rosetta. Figure 24 shows the development of potato wholesale prices in 2011 on different markets in India including Delhi.
Azadpur Mandi1977
Keshopur Mandi2001
Shahdara Mandi1992
Okhla Mandi1987

59
Figure 24. The development of potato wholesale prices in 2011 on different markets in India.
Information from interviews at Azadpur Mandi
Wholesalers • During our visit in November 2013 potatoes come mainly from Punjab and Utter Pradesh (Agra). From Punjab
these are new, fresh potatoes, from UP these are potatoes from cold storage. The potatoes are sold from commissionaires in the states of Punjab and UP. The wholesaler is mostly selling table potatoes, as the potatoes for processing go directly to the processing plants. Wholesalers sell about 75% to the fresh market and 25% processing potatoes for chips and potato products, to small (mostly unorganized) chips producers in the NCR area. However, this ratio depends on the season. In November, the end of the storage season, the prices of the chips potatoes are decreasing (see figure) and the quality is decreasing as well. There are no demands for quality, the sellers will just sell everything. Wholesalers think that storage (in warehouses outside Delhi NCR) is the main problem in the potato chain now. There is a lot of quality loss during storage, as incorrect storage can easily increase the sugar content of processing potatoes which makes them unsuitable for processing of chips. Storage expenses come to INR 1 - 1.5 per kg per month and some wholesalers indicate that some suppliers keep potatoes in storage till prices are high,
• There is a big risk as all the selling is done on trust. Some wholesalers would like to have more security from the buyers,
• Wholesalers sell the fresh potatoes to sub-sellers, local retailers (80%) or supermarkets. Traders • Traders sell table potatoes as well as potatoes for processing (chips). The past years the volume has
stabilized although the products are more sold to buyers within the NRC region, • Some traders have a demand for quality. The size of the potatoes needs to be <45 mm, • For the future: an open market is good and to be achieved. When markets are open, fluctuations occur and
these provide opportunities to make money.
Figure 25. Potatoes arrive and leave by truck (left) the Azadpur Mandi; an interview at the Azadpur Mandi (centre) and a view of offered quality (right).

60
Commission agents • Potatoes are sold through commission agents as well at the Azadpur Mandi. Agents collect potatoes directly
from farmers and bring them to the market. When an agreement is reached, which is on trust of payment, the farmer gets paid and commission agent takes the risk that the buyer is paying off. Agents get a percentage of the price, 6% is mentioned. They visit farmers to take on the job but some contracting is done as well.
Farmer • A farmer visiting the Azadpur market indicated that he has a contract with a processor. He had a surplus which
he could not deliver at the processors plant because the quality was too bad so the potatoes were returned. The farmer was selling his processing potato Lady Rosetta at the market. He has 5 ha and a yield of 30 to 35 tons/ha.
From wholesale market to consumer
To agree about the selling price supplier and buyer at the wholesale market use a newspaper under which they agree upon the price by using their fingers. Buyers of potatoes at the wholesale markets are mostly sub-wholesalers who sell potatoes to small vegetable shops, vendors, hotels and restaurants: a fine-meshed network of vendors, street market, local processors, and small vegetable shops. A vendor at the street market sold old potatoes at INR 30 per kg as well as new ‘Punjab’ potatoes at INR 40 per kg. In the meantime a supermarket offers loose potatoes from storage for INR 29 per kg (special offer). Normally these potatoes are INR 35 per kg. This supermarket chain also sells packages of 2 or 5 kg at an INR 1 per kg lower price than loose potatoes. Sellers at local shops and markets do better grading compared to supermarkets. Potatoes were much better presented in local shops than in supermarkets.
Figure 26. Okhla market is characterized by street markets (left) parallel to the whole sale market (right).
7.5 Processed potatoes: French fries and frozen products
No producing facilities of French fries were found in Delhi NCR. The production of deep frozen products in India increased since McCain started production processing in India. Nowadays McCain processes 300 tons potatoes per day during 300 days per year = 90,000 tons processing capacity per year. 70 - 75% is processed into French fries resulting in about 30,000 tons French fries. McCain’s remaining 25 - 30% raw material is processed into specialties. McCain’s French fries market share is estimated at 75%. A number of (smaller) potato processing companies in India are responsible for the remaining

61
25% French fries. Total French fries production volume is calculated at 40,000 tons per year; which is the equivalent of about 120,000 tons annual raw material requirement. Annual per capita availability of French fries is calculated at 0,033 kg (at a population size of 1.2 billion). The figure of 40,000 tons French fries excludes the import of deep frozen French fries by companies like LambWeston and Simplot (and possibly others). The processing of French fries is allocated to potato producing regions of India which means that all French fries are consumed in Delhi NCR, come from elsewhere.
Table 24. Prices of frozen products (all McCain) in supermarkets.
Product Package net weight (g) Price (INR) Price per kg (INR)
French fries 450 90-100 200-222 French fries 1250 165-170 132-136 Smiles 450 90-100 200-222
Consumption of French fries in Delhi NCR
The consumption of French fries in Delhi NCR will be higher than the average Indian availability (high incomes, young people). To estimate the consumption of French fries consumption in Delhi NCR we use the share of McDonald’s restaurants in Delhi as part of all McDonald’s restaurants in India. In 1996 McDonalds opened its first quick service restaurant in India. Nowadays McDonalds operates 300 QSR’s in India of which 51 in Delhi (16.7%). This means 40,000 tons * 16.7% = 6,680 tons / 34 million inhabitants = annual per capita availability in Delhi NCR is at least 0.197 kg French fries (excluding imports). At this moment a part of the population is not able to buy French Fries anyway. When one assumes that 40% of the population is able to buy French fries nowadays, the availability of French Fries for this group is at least 0.5 kg per consumer per year (excluding specialties and imports). If future incomes will rise in the same way as past years, the consumption of French fries will increase as well. Figures indicate that the production of French fries increases 25 - 30% annually. Estimation for the coming decade: when existing consumers double fries consumption and another 20% of new consumers start French fries consumption of about 0,5 kg per year, the required amount French fries will be at least (6,680 + 6,680 + 3,340 =) 16,700 tons, an increase of at least 250% in 10 years. Taking into account a population growth of 2.5% the amount will be 21,377 tons (total increase will be at least 30% per year).
Increasing number of selling points
All deep-frozen potato products are produced outside Delhi NCR (processing plants are located in potato producing regions nearby potato producers). This means that the total supply of frozen potato products for Delhi NCR is produced elsewhere and ‘imported’ into Delhi NCR. Deep frozen products are sold in big supermarkets with freezer facilities, located in modern bazars (malls) and in local shops with freezing facilities. Other important selling points of fries are Quick Service Restaurants (QSR’s). It is expected that the sales of deep-frozen products in supermarkets will increase coming years by 10% per year and more; smaller shops (like Safal/Mother Dairy; 200 shops in Delhi) will start selling frozen vegetables. Most people don’t buy frozen products in supermarkets like Big Bazaar and Reliance. Nowadays deep frozen products are only taken by elite and upper class people; other classes don’t or hardly have the knowledge of and experience with deep frozen products. Experts expect the sales of deep frozen in supermarkets will increase 10% per year (changing lifestyle).

62
Figure 27. Example of fried potato products on a tourist market (top), the price list of the snacks of Table 25 (left) and a street sale of chips and Crips (right).
Table 25. Example of fried potato products on a tourist market. Prices of the products on the menu (Figure 27, top). For more prices of potato products see Appendix I.
Fried product INR per portion
French fries 80 Masala fries 90 Vega Burger 60 Smiles 80
7.6 Processed potatoes: Chips and snacks Potato chips are estimated to constitute nearly 85% of India’s total market of salty snack food market of about INR 2,500,000,000. The total processing volume of chips in India is estimated at 600,000 tons raw material per year; leading to an annual production volume of about 150,000 tons of potato chips annually. PepsiCo is the market leader in India with a 50% market share; they are processing about 300,000 tons of potatoes into chips annually. Balaji holds the second position with about 100,000 tons. The remaining volume of 200,000 tons is processed by
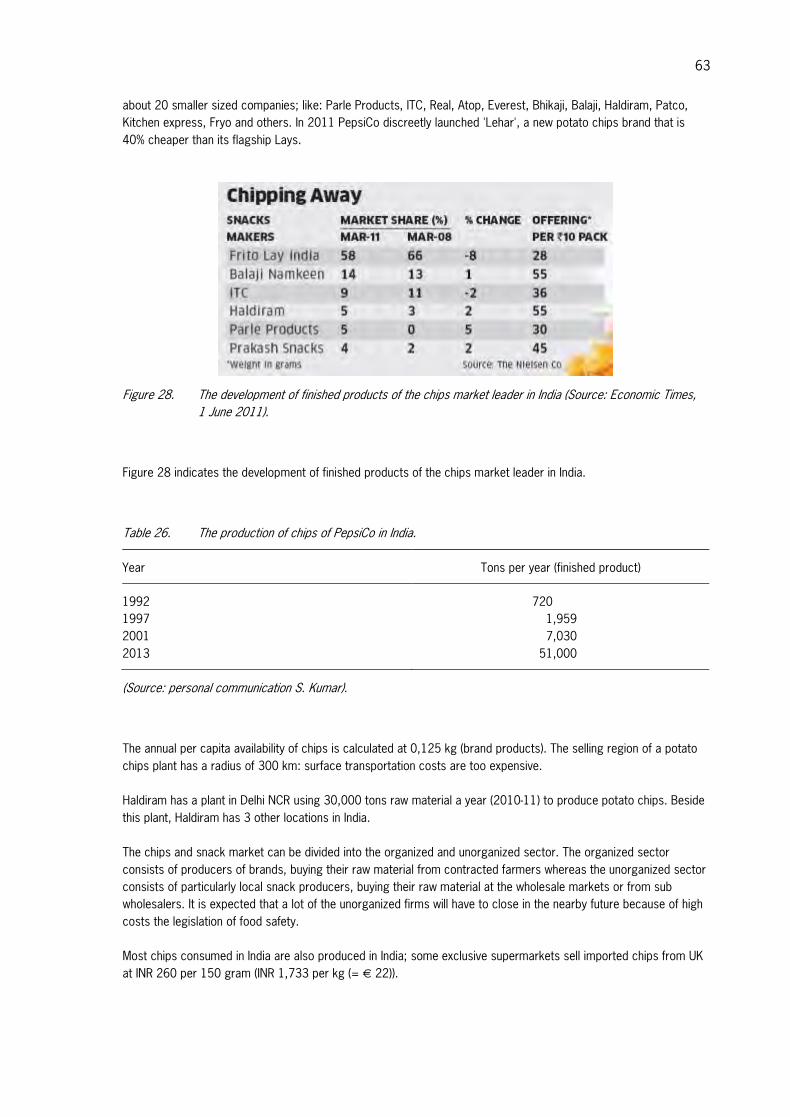
63
about 20 smaller sized companies; like: Parle Products, ITC, Real, Atop, Everest, Bhikaji, Balaji, Haldiram, Patco, Kitchen express, Fryo and others. In 2011 PepsiCo discreetly launched 'Lehar', a new potato chips brand that is 40% cheaper than its flagship Lays.
Figure 28. The development of finished products of the chips market leader in India (Source: Economic Times, 1 June 2011).
Figure 28 indicates the development of finished products of the chips market leader in India.
Table 26. The production of chips of PepsiCo in India.
Year Tons per year (finished product)
1992 720 1997 1,959 2001 7,030 2013 51,000
(Source: personal communication S. Kumar).
The annual per capita availability of chips is calculated at 0,125 kg (brand products). The selling region of a potato chips plant has a radius of 300 km: surface transportation costs are too expensive. Haldiram has a plant in Delhi NCR using 30,000 tons raw material a year (2010-11) to produce potato chips. Beside this plant, Haldiram has 3 other locations in India. The chips and snack market can be divided into the organized and unorganized sector. The organized sector consists of producers of brands, buying their raw material from contracted farmers whereas the unorganized sector consists of particularly local snack producers, buying their raw material at the wholesale markets or from sub wholesalers. It is expected that a lot of the unorganized firms will have to close in the nearby future because of high costs the legislation of food safety. Most chips consumed in India are also produced in India; some exclusive supermarkets sell imported chips from UK at INR 260 per 150 gram (INR 1,733 per kg (= € 22)).

64
Table 27. Raw material requirement for potato chips manufacturing by Haldiram.
Tons per year
Location 2005-06 2007-08 * 2010-11 **
New Delhi 10,800 20,000 30,400 Calcutta 4,800 15,000 22,800 Nagpur 19,200 30,000 45,600 Bikaner 12,000 20,000 30,400
Total 46,800 85,000 129,200
Source: Figure for 2005-06 reconstituted from Pandey and Sarkar, 2005. * = estimates of the company; ** = at 15% acgr (annual compound growth rate). All processed products (fries, chips) are packet and priced (maximum price) by the manufacturer. There are taxes on frozen products, and mostly not on fresh potatoes. Within the NCR there are different tax rates per district.
Chips consumption Delhi NCR
The main consumers of potato chips and wafers are families especially in urban and semi-urban areas. Besides, hotels, restaurants, canteens, army establishments require potato chips in significant quantities. Working parents prefer to buy the branded chips and snacks as they believe that these are prepared hygienically and will provide some amount of energy and nourishment that the children are deprived of because of their parents busy schedules. The chips consumption in urban regions is indicated at 0.5 kg per person, which means a total volume of 23,000 tons chips per year in Delhi NCR. It is expected the consumption of chips will increase in the coming years but less than the increase of French fries. The average growth rate of chips is expected to be 15%.
Retail sector
The Indian retail sector is highly fragmented and the unorganized sector has around 13 million retail outlets that account for around 95-96% of the total Indian retail industry4. The organized sector’s growth potential will increase due to globalization, high economic growth, and changing lifestyle. 'Food & Grocery: initially this segment grew at a slow pace due to the presence of an established retailing system led by kirana stores, a highly-fragmented food supply chain, and the lack of a developed food processing industry. [...]. Post-liberalisation, organized retailers saw a renewed opportunity in the food and grocery segment. [...]'5 In urban regions 10-15% of the population goes shopping in hyper-markets (this concerns busy and educated people with high income: elite and upper class). It is said that this percentage will grow in the near future. It is indicated that 10-20% of the volume of fresh potatoes goes through the supermarket.
Organized retail in Delhi NCR region – key players
Big Bazar accounts for 1/10th of the total organized retail. Other big players are Safal (Mother Dairy Fruit & Vegetable – Safal brand, 4/10th), Reliance fresh (3/10th) and all little ones account for 2/10th of the total organized retail. (Source: personal communication).
4 Source: Dun & Bradstreet’s publication ‘Indian Retail Industry: Challenges, Opportunities and Outlook’ (2009)(
http://www.dnb.co.in/IndianRetailIndustry/). 5 Source: http://www.dnb.co.in/IndianRetailIndustry/

65
There are about 300 Mother Dairy Fruit & Vegetable stores in Delhi NCR region. In an article in The Economic Times, retail, it is mentioned that there are 425 retail stores across the Delhi NCR region and Bangalore.6 This article also mentions that increased price volatility of fresh vegetables and demand for premium, pre-cut vegetables even after the season ends is a boosting demand, helping the organized retail market grow 15 - 20% a year. 'Reliance Retail: Reliance Retail Ltd, a subsidiary of Reliance Industries Ltd, has an aggressive plan to expand its retail network across India. It entered the food and grocery segment in November 2006 through its convenience store format Reliance Fresh. The store offers a range of fruits, vegetables, personal care, home care and kitchen utensils. It focuses on building a strong relationship with the agri-business value chain and sources directly from wholesalers.'7
Futuro Group - Big Bazaar Hypermarket
We have been visiting one of the Big Bazaar Hypermarket branches and spoke to two managers. They indicated that 2 - 3% of the store space of Big Bazar’s hypermarket contains fresh fruits and vegetables. There are around 20 branches of Big Bazaar scattered all over Delhi NCR. These branches all have their own supply managers and store category managers of Fruit & Vegetables. The procurement is done in different ways, depending on the season: • Directly from farmers: when it concerns great quantities; • Through vendors at Azadpur Mandi: when it concerns normal quantities; • Through cold storage managers: this is done increasingly frequent and it is expected that supermarkets will
buy fresh potatoes from cold stores. (Source: personal communication)
Fresh potatoes The fresh produce department is only a small part of the total sales in the hypermarket, namely 5%. Of this section, the proportion potato is 8 - 10%. The total volume of Big Bazaar’s potato sales is 3 tons daily, or 90 - 100 tons per month (for all 20 branches in Delhi NCR). On promotion periods that generally last for 6 - 8 days (in January and August), this sale quantity of 90 - 100 tons can easily be reached within these 6 - 8 days. These days are called the Big Days. Pricing is done through benchmarking. The Fruit & Vegetable category managers go out and look at market prices and prices of competitors. Of course also the costs are taken in consideration. Big Bazaar is trying to price at INR 0.5 lower than its competitor. Prices of fruits and vegetables that are sold in different Big Bazar branches can vary; in ‘fancy’ areas (with a higher percentage of high income people) prices are set a bit higher. And there is another fact influencing the price variety, namely the height of taxes that varies per state, even within Delhi NCR region. This fact influences the prices only little, it is only a small amount of INR 5 per 0.5 kg difference. (Source: personal communication). Unlike frozen products most fresh products are free of taxes. Fresh potatoes are sold in packs of 5 kg, 2 kg and loose. There is a wholesaler on the market who is responsible for and specialized in packaging potatoes for supermarkets. The 50 kg bags that lay in the Big Bazar stores are composed of the smaller packs of 5 or 2 kg. The quality of observed fresh potatoes on street markets, vendors and small shops was on average better than in hypermarkets (better grading, no sprouts, less damages). In the past big supermarkets bought potatoes at Azadpur but nowadays they buy most potatoes directly from cold stores outside Delhi NCR. It is expected the trend to buy directly from cold stores will become practice in future. Supermarkets will only buy at Azadpur when small quantities are needed.
6 Source: http://articles.economictimes.indiatimes.com/2013-08-14/news/41410056_1_safal-vegetables-onion. 7 Source: http://www.dnb.co.in/IndianRetailIndustry/

66
Processed potatoes: French fries and frozen products It can be noted that the category deep frozen in supermarkets is relatively small (about 4 – 8 m2; own observation). The concept of deep frozen is quite new, not yet common, but certainly upcoming. It is expected that there is a 50% growth year on year; the growth of other products is 10 - 12% (Source: personal communication)8. Currently most people do not like processed products like fries. They still prefer fresh products and they go shopping in their own neighbourhood every day.
Figure 29. An example of French fries (left) and Smileys (right).
Hotels and restaurants
Quick Service restaurants
McDonald’s, Domino’s, Pizza Hut, KFC and Nirula’s are the most popular and frequently visited fast food outlets. Hotels and restaurants Most hotels and restaurants which serve traditional Indian food, don’t use big amounts of potatoes. They buy small quantities potatoes from their own suppliers and don’t buy it at wholesale markets. Consumer impressions From the interviews on the street we can mention the following: An upper middle class woman in an urban neighbourhood of Delhi told us that she uses about 5 kg fresh potatoes a week for a 4 person family (two teenagers). She indicates that potato size and no sprouts are important quality-characteristics; variety is unimportant. She always buys fresh potatoes at the local shop Safal; they have fixed prices. In her household deep fried French fries and potato products (like Smileys, Figure 29) are only bought/ prepared for the children. She visits a QSR for lunch or dinner three times a week with her family; chips are consumed twice a week. Two teenager female students at a QSR told us that they visit a QSR twice a week (on average). It is not yet very common that female teenagers have a job in India (Delhi NCR) and the Indian parents provide for the livelihood of their daughters until their marriage, so the parents pay for these QSR visits and snacking. The students also indicate that they don’t cook for themselves at home: their mum does. Two female visitors of a QSR in their late twenties (one Indian woman and a British friend) told us that they visit a QSR once a week. They like to order sandwiches with French fries as a side dish. At home, they do not eat French
8 Retailers indicate that the sale of frozen French fries of brands such as McCain, Sumeru and Al Kabeer is growing
between 30%-40% in their own chains. President & CEO at Spencer's Retail indicates that French fries currently account for almost 70% of the retailer's potato-based frozen snack sales.
67
fries. The British woman lives in the south of India where the electricity to store French fries at home was mentioned to be a problem as power cuts are frequent. No such problems are known by the Indian woman from New Delhi; however, she has no frozen French fries at home. Furthermore, they buy about one bag of chips per week. The Indian woman buys fresh potatoes to prepare the meal. She selects potatoes solely on the size, not too big and not too small and she favours new ones. Damaged potatoes are omitted. Children of the age of 8 - 14 years old were interviewed at the touristic site Qutab Minar. Girls (three different groups of about 4 girls) told they eat chips about 20 times a week, Lays Chips and some times Big Uncle Chips. On the question about French fries they had no idea what it would be. On the question how often they visited a QSR they said about 2 times a week with their family. Boys (2 groups of about 3 boys) told they eat chips about 3 tot 6 times a week. They also mentioned Lays Chips. As the girls, French fries were not known to them.
7.7 Concluding remarks The population in Delhi NCR will grow yearly with 2.5%. Delhi’s per capita income is amongst the highest of the country. The most important income class for the development of the market for processed potatoes (French fries and frozen products) is the middle class (40%) and upper lower class (10%), which is 50% of the population. These people easily buy American style food and their food habits change radically. Busier lifestyles, the increase in female work population and young, unmarried workers that live on their own lead to a shift to ready to eat food items in order to save time involved in preparing meals. It is estimated that the consumption of French fries in Delhi NCR will increase at least 30%. The market for chips will grow as well, but less than the French fries market. Quick Service Restaurants (QSR’s) and supermarkets are the most important selling channels of processed potatoes (French fries and frozen products). All fresh potatoes and most potato products (brands) consumed in Delhi NCR are imported from other Indian regions. When calculating the fresh potato consumption increase in Delhi NCR it should be considered that the fresh potato consumption per person per year in Delhi NCR is above average (35 kg, while the average in India in the urban area is about 20 kg per person per year (Vanitha et al. 2013). The quality of fresh potatoes in shops, especially supermarkets, is low and needs to be improved. There is a shift in the way of buying potatoes by big super- or hypermarkets: they intensify buying potatoes in the potato growing regions from warehouses and reduce buying at wholesale markets (mandis).

68

69
References
Haverkort, A.J. & J.G. Hillier, 2011. Cool Farm Tool - Potato: Model Description and Performance of Four Production Systems. Potato Research 54, 355-369.
King, H., R.E. Aubert & W.H. Herman, 1998. Global burden of diabetes, 1995-2025: Prevalence, numerical estimates, and projections. Diabetes Care 21, 1414-1431.
NHB, 2011. National Horticulture Database 2011.
Prasad, J., 1999. Encyclopaedia of Agricultural Marketing: Market regulation and development: Market regulation and development. Mittal Publications, New Delhi.
Vanitha, S.M., S.N.S. Chaurasia, P.M. Singh & P.S. Naik, 2013. Vegetable Statistics. Vegetable production in India (2000 -2001 to 2010-2011), Indian Institute of Vegetable Research, Varanasi, 250 pp.
Wustman, R., A. Haverkort, X. Zhang & G. Rathee, 2011. An overview of the potato sector in India and prospects of Indo & Dutch cooperation. PPO no. 3250214811, Applied Plant Research, 73 pp.

70

I - 1
Appendix I. Some prices of potato products
Looking at supermarket prices of processed products (in INR, rate d.d. 18th November 2013 of € 0.82 per 100 INR).
Product Weight % of potato INR INR/kg
Deep frozen products
Potato Bites 700 g n.a. 99 141 McCain French Fries 1250 g n.a. 165-170 130 Yummiez French Fries 400 g n.a. 95-100 244 McCains Combi Pack, pack of 3:French Fries, Veggie Nuggets, Aloo Tikki
1350 g n.a. 199 147
Masala Nuggets 400 g n.a. 165 413 Aloo Paratha (chapattis with potato) 400 g n.a. 80-85 206 McCains Smileys, 24 pieces 450 g n.a. 90 – 100 211
Crisps
Potato Papad Badam Lachha 200 g 45 72 360 Aloo Lachha 150 g 52 42 280 Uncle Chips spicy 26 g 100 10 385 Uncle Chips spicy 72 g 100 20 278 Lays Classic Salted 89 g n.a. 30 337 Lays Chips all variants –special offer 180 g n.a. 45 250 Brij Namkeen Aloo chips 180 8 n.a. 60 333 Tyrrels (import UK) 125 8 n.a. 260 1733

I - 2

II - 1
Appendix II. Activities potato project India 2011-2013

II - 2
Year
M
onth
Ac
tiviti
es
WUR
res
earc
hers
Es
timat
ed #
of p
artic
ipan
ts
Fund
ing
2011
N
ov.
Pres
enta
tions
Indi
a D
utch
Pot
ato
sem
inar
, Del
hi
Anto
n Ha
verk
ort,
Rom
ke W
ustm
an
80
EZ B
OC
I
2012
M
ar.
Pres
enta
tion
Indo
Dut
ch P
otat
o se
min
ar, J
alan
dhar
Ro
mke
Wus
tman
70
EZ
G2G
2012
Se
p.
Inte
rvie
win
g In
dian
pot
ato
stak
ehol
ders
, Del
hi
Anto
n Ha
verk
ort,
Rom
ke W
ustm
an
Indi
vidu
al m
eetin
gs
EZ B
OC
I
2012
Se
p.
Pres
enta
tions
at N
AFTC
(FM
E) h
eadq
uart
ers,
Zoe
term
eer
Anto
n Ha
verk
ort,
Rom
ke W
ustm
an
30
EZ B
OC
I
2013
M
ar.
Mee
ting
NAF
TC D
PC m
embe
rs, Z
oete
rmee
r An
ton
Have
rkor
t, C
orné
Kem
pena
ar, R
omke
Wus
tman
20
EZ T
opse
ctor
2013
M
ay
Pres
enta
tions
and
mee
ting
in r
elat
ion
to P
ublic
Priv
ate
part
ners
hip
Pota
to
Indi
a, C
hand
igar
, Ahm
edab
ad, D
elhi
Anto
n Ha
verk
ort,
Rom
ke W
ustm
an
30 p
er m
eetin
g EZ
Top
sect
or
2013
Au
g.
Surv
ey p
otat
o co
ld s
tore
s in
Guj
arat
and
Pun
jab
Lubb
ert v
an d
en B
rink,
Rom
ke W
ustm
an
Indi
vidu
al m
eetin
gs a
t 17
stor
es
EZ T
opse
ctor
2013
Au
g. -
Feb.
201
4 In
itiat
ion
seed
pot
ato
qual
ity p
roje
ct in
Pun
jab
in c
olla
bora
tion
with
NAF
TC,
POSC
ON
, Pun
jab
Agric
ultu
ral U
nive
rsity
Lud
hian
a, W
agen
inge
n UR
Lubb
ert v
an d
en B
rink,
Rom
ke W
ustm
an
Four
par
ties
invo
lved
EZ
Top
sect
or
2013
Se
pt.
Mee
ting
NAF
TC D
PC m
embe
rs, Z
eew
olde
C
orné
Kem
pena
ar, R
omke
Wus
tman
10
EZ
Top
sect
or
2013
N
ov. -
Jan
. 201
5 Pr
opos
al s
tora
ge e
xper
imen
ts p
roce
ssin
g po
tato
es in
Guj
arat
in
colla
bora
tion
with
NAF
TC, M
ooij
Agro
, Om
nive
nt, O
sci B
alaj
ai, M
cCai
n,
Peps
ico,
Pot
ato
Rese
arch
Sta
tion
Dees
a, W
agen
inge
n UR
Lubb
ert v
an d
en B
rink,
Rom
ke W
ustm
an
Eigh
t par
ties
invo
lved
EZ
Top
sect
or
2013
N
ov.
Mar
ketin
g st
udy
pros
pect
s pr
oces
sed
pota
to p
rodu
cts
Del
hi N
CR
Bas
Jans
sens
, Ann
ette
Pro
nk, M
aure
en S
chou
tsen
In
divi
dual
mee
tings
, inc
l.
mee
ting
NAF
TC D
elhi
EZ T
opse
ctor
2013
N
ov. -
Dec
. Su
rvey
and
wor
ksho
p Re
sour
ce e
ffici
ency
pot
ato
crop
s G
ujar
at a
nd P
unja
b An
ton
Have
rkor
t 15
EZ
Top
sect
or
2013
N
ov. -
Dec
. Su
rvey
and
wor
ksho
p At
tain
able
pot
ato
yiel
d ca
lcul
atio
ns G
ujar
at a
nd
Punj
ab
Anne
tte P
ronk
15
EZ
Top
sect
or
2013
N
ov./
Dec
. Su
rvey
and
wor
ksho
p Po
tato
yie
ld g
ap a
naly
sis
Guj
arat
and
Pun
jab
Lubb
ert v
an d
en B
rink,
Rom
ke W
ustm
an
15
EZ T
opse
ctor
2013
N
ov./
Dec
. M
eetin
g N
AFTC
Del
hi
Lubb
ert v
an d
en B
rink,
Rom
ke W
ustm
an, A
nton
Hav
erko
rt, A
nnet
te P
ronk
6 EZ
Top
sect
or

III - 1
Appendix III. Activities potato project Ethiopia 2011-2013
Year Month Activities WUR researchers Estimated # of participants
Funding
2012 Feb. Survey potato sector southern Ethiopia
Anton Haverkort, Flip van Koesveld
Individual meetings EZ BOCI
2012 Jun. Survey potato sector Northern Ethiopia
Romke Wustman Individual meetings EZ BOCI
2012 Sep. Survey late blight control Huub Schepers, Romke Wustman
Individual meetings EZ BOCI
2012 Dec. Regional Potato conference Addis Ababa
Anton Haverkort, Huub Schepers, Romke Wustman
70 EZ BOCI
2012 Dec. Training course Addis Ababa
Anton Haverkort, Huub Schepers, Romke Wustman
25 EZ BOCI

III - 2

IV - 1
Appendix IV. A news item in the Punjab paper on the visit of the Dutch team to POSCON

IV - 2

V - 1
Appendix V. A news item of the trial at the Punjab Agricultural University and the visit of the Dutch team

V - 2

VI - 1
Appendix VI. Ludhiana News/Farm experts from Netherlands and Poscon visit PAU
Vernacular (Punjabi) newspaper 'Ajit' on 8th Dec, 2013. Author(s): Charanjit Singh Saluja
A four-member delegation of farm scientists from Wageningen University, The Netherlands, and a representative of Confederation of Potato Seed Farmers (POSCON), Punjab, visit the Punjab Agricultural University (PAU), Ludhiana on Thursday. Ludhiana, December 5, 2013: A four-member delegation of farm scientists from Wageningen University, The Netherlands, and a representative of Confederation of Potato Seed Farmers (POSCON), Punjab, visited the Punjab Agricultural University (PAU) to monitor the progress of experiments on seed potato quality, underway in the Department of Agronomy, PAU. Jang Bhahadur S. Sangha, Member, Board of Management, PAU, represented POSCON. The delegation members from The Netherlands comprised Romke Wustman, Anton Haverkot, Annette Pronk and Lubbert Van Den Brink. All the visiting members interacted with the senior officials of PAU, Dr S.S. Gosal, Director of Research; Dr P.S. Aulakh, Additional Director of Research (Horticulture); Dr G.S. Buttar, Head, Department of Agronomy and other faculty members of the department. The delegation expressed satisfaction over the conduct of experiments and desired to strengthen the partnership in future. Coordinating the visit, Dr Gosal presented the research highlights of the University. He emphasised on fortifying the collaboration amongPAU, POSCON and Wageningen University, The Netherlands by extending the joint research on potato. Dr Buttar suggested the participation of the post-graduation students of agronomy and other departments in the collaborative research.

VI - 2
Earlier, Dr Aulakh welcomed the officials of the PAU and the visiting members./ ludhiana news online, ludhiana news in English, ludhiana news, ludhiana current news, ludhiana news live, Ludhiana breaking news, Ludhiana headlines, Ludhiana latest news, punjab news, india news

VII - 1
Appendix VII.

VII - 2

VIII - 1
Appendix VIII. The Tribune 6th Dec 2013
PAU NOTES Delegation reviews progress Ludhiana: A four-member delegation of farm scientists from Wageningen University, the Netherlands, and a representative of Confederation of Potato Seed Farmers (POSCON), Punjab, visited Punjab Agricultural University (PAU) to review the progress of experiments on seed potato quality in the department of agronomy, PAU. Jang Bhahadur Singh Sangha, member, board of management, PAU, represented POSCON.

VIII - 2