Annual Report - Parliament of Western Australia · Postal Address: Locked Bag 10 Cloisters Square....
105
Annual Report
Transcript of Annual Report - Parliament of Western Australia · Postal Address: Locked Bag 10 Cloisters Square....

Page i
Annual Report

Produced and Published by
The Department of the Premier and Cabinet
Principal Address:
Governor Stirling Tower
197 St Georges Terrace
PERTH WA 6000
ISSN (Print): 1448–7306
ISSN (Online): 1448–7314
Postal Address:
Locked Bag 10
Cloisters Square
PERTH WA 6850
Telephone: (08) 9222 9888
Fax: (08) 9322 1213
E-mail: [email protected]
Internet: www.dpc.wa.gov.au

Statement of Compliance
For the year ended 30 June 2011
Hon C J Barnett MEc MLA PREMIER
In accordance with section 63 of the Financial Management Act 2006, I hereby submit for your information and presentation to the Parliament, the Annual Report for the Department of the Premier and Cabinet for the financial year ended 30 June 2011.
The Annual Report has been prepared in accordance with the provisions of the Financial Management Act 2006.
Peter Conran DIRECTOR GENERAL
13 September 2011


Contents
Director General’s Foreword 1
The Department 4
Who We Are 4
Senior Executive 5
Functional Structure 8
Our Working Environment 9
What We Do 11
Performance Management Framework 11
Service Areas 12
Legislation Administered 13
Shared Responsibilities 14
Significant Issues 2010–2011 15
How We’re Tracking 17
Outcomes, Services and Performance Information 17
Report on Operations — Services 20
Service 1: Administration of Executive Government Services 20
Service 2: Government Policy Management 30
Disclosures and Legal Compliance 42
Financial Statements 42Additional Key Performance Indicator Information 79Ministerial Directives 86Other Financial Disclosures 86Governance Disclosure 88Other Legal Requirements 89Government Policy Requirements 93Other Corporate Information 94Appendices 96


DPC Annual Report 2010–2011 | Page 1
Director General’s Foreword
The Department of the Premier and Cabinet (the Department) has continued to pursue its key objectives in 2010–11, including the provision of strategic policy advice to the Premier and Cabinet, and collaborative engagement with agencies to deliver the Government’s policy priorities. A significant task for the Department in 2010–11 has been assisting in the development of those close and productive working relationships with the not-for-profit community sector, which are required to deliver high-quality community services. The Delivering Community Services in Partnership policy, released in May 2011, supports the more mature contracting relationship that now exists with the not-for-profit community sector. In the 2011–12 budget, Government committed more than $600 million over four years to support a sustainable not-for-profit sector and the varied and essential services that they deliver.
Government’s reform objectives to develop and sustain the Western Australian economy are supported by the streamlined land and development approval processes implemented in 2010–11. The Department continues to support these reforms in conjunction with service agencies. The transfer on 1 April 2011 of the Office of Native
Title function from the Department of the Attorney General to become part of the specialised Land, Approvals and Native Title Unit recognises the fundamental impact of Native Title on project approvals in Western Australia, and the benefit of closer alignment between Native Title policy and other approvals processes. The Browse agreement finalised in June 2011 with traditional owners was the realisation of a major Government development goal.
In conjunction with several other State agencies, a priority in 2010–11 for the Department was the further development and coordination of the roll-out of the Kimberley Science and Conservation Strategy. These outcomes address the Government’s election commitment to protect the natural and cultural heritage of the Kimberley, while enabling the region to fulfil its economic potential.
The Department has played a critical role over the past year in preparations for the Commonwealth Heads of Government Meeting (CHOGM) in October 2011, involving close cooperation with the Commonwealth and the many State agencies associated with this unprecedented event. The Department has provided advice and support to the Government to meet the objective of making the most of this unique opportunity to showcase Western Australia. Planning for major events coinciding with CHOGM to engage business and the broader community is now well advanced.
The Department continued to engage constructively throughout 2010–11 with Commonwealth Government agencies to ensure that relationships between Western Australia and the Commonwealth foster and support the delivery of services which meet the needs and expectations of the community. A major achievement was the in-principle agreement to the Council of Australian Governments (COAG) National Health Reform following removal of the Commonwealth Goods and Services Tax (GST) retention proposal.

Page 2 | DPC Annual Report 2010–2011
The Department provides important support services to the Premier and Members of Parliament, and in 2010–11 sought to identify improvements in technology support for Members. In addition, the Department is focussing on the relocation to new premises at Dumas House in 2012.
The capacity and commitment of our people to work productively with other agencies and governments, and across sectors, is pleasing, and I look forward to the policy innovation and service improvement that these partnerships will generate in the future.
Our Focus in 2010–11
Delivering Government’s Strategic Priorities
Over the past year, the Department has:
supported the Partnership Forum, chaired by Professor Peter Shergold, as the principal mechanism for communication, collaboration and relationship-building across the public and community sectors, and for reshaping the relationship between the public and community sectors, while addressing key issues around sustainability and capacity;
continued to support the Ministerial Taskforce on Approvals, Development and Sustainability that has established a Lead Agency Framework, which has streamlined the approvals process and helped sustain the pace of economic development;
assisted in the negotiations between the State, traditional owners and Woodside to secure agreement for an onshore Liquified Natural Gas (LNG) processing precinct at James Price Point in the West Kimberley; and
in conjunction with other departments and agencies, supported Western Australia’s participation in the COAG meetings, negotiating new agreements in the areas of Indigenous reform, public hospital services, education investment, legal assistance and biosecurity, while monitoring implementation to avoid encroachment of Commonwealth bureaucracy into the micro-management of areas that are best left to State agencies.
Supporting the Community
During 2010–11, the Department assumed key roles in managing the delivery of support to people affected by a number of natural disasters, including the fires at Toodyay, Lake Clifton, Roleystone and Kelmscott and the Gascoyne River floods. The Department also coordinated the Government’s donations to relief appeals for the Queensland floods, the New Zealand earthquake, the Japan earthquake and tsunami and the Pakistan floods.

DPC Annual Report 2010–2011 | Page 3
The Year Ahead
A highlight of 2011–12 will be CHOGM in October 2011. This will provide a great opportunity to showcase Western Australia to the leaders and delegations of over a quarter of the world’s nations, and the Department will work closely with the Commonwealth and State agencies to ensure the success of this milestone event.
Working with the community sector to build relationships, capacity and frameworks, as well as identifying and developing new models for Government service delivery, will continue to be a priority for the Department in 2011–12. The COAG review of GST arrangements commencing in 2011–12 provides a window of opportunity for a fundamental change in the basis of distribution of GST revenues. Under the present GST arrangements, Western Australia’s share of GST revenue in 2014–15 falls to 33 per cent of that generated by the State, at a time when our contribution to the national economy is rapidly increasing.
To deliver on these and other priorities will require the Department to continue to build its policy capacity at the highest level. I look forward to working with the Department’s many talented people to deliver the high-level policy advice and support required by the Premier and his Government to enable them to best serve the Western Australian community.
Peter ConranDIRECTOR GENERAL

Page 4 | DPC Annual Report 2010–2011
The Department
Who We Are
Responsible Minister The Department reports to the Hon C J Barnett MEc MLA, in his capacity as Premier.
Chief Executive Officer Mr Peter Conran AM is the Chief Executive Officer of the Department appointed under section 45 of the Public Sector Management Act 1994 and also the Accountable Authority, as prescribed in section 52 of the Financial Management Act 2006.
Authority for the Establishment of the Agency The Department was established under the Public Sector Management Act 1994 in 2001.

DPC Annual Report 2010–2011 | Page 5
Senior ExecutiveDirector General, Mr Peter Conran AM Mr Peter Conran commenced as Director General of the Department of the Premier and Cabinet on 28 November 2008. In this capacity, he leads the Department in advising and serving the Premier and Cabinet. Mr Conran has over 30 years of policy and leadership experience within the Western Australian, Northern Territory and Commonwealth Governments. His diverse positions have included Senior Advisor, Cabinet Secretary and Head of the Cabinet Policy Unit within the Office of the Prime Minister. Additionally, he has been Deputy Director General of this Department and Secretary of both the Department of the Chief Minister and the Attorney General’s Department in the Northern Territory.
Deputy Director General: Coordination, Cabinet and Policy Division, Mr David SmithMr Smith has been Deputy Director General, Coordination, since August 2008. Prior to this, he was a member of the corporate executive of the Department of Treasury and Finance, with responsibility for economic policy. Mr Smith was in the Treasury Department in a variety of positions for 12 years. Before this, he gained over 20 years of experience in the Commonwealth public service, including in the Department of the Prime Minister and Cabinet and an overseas posting with the Department of Foreign Affairs and Trade. He has also worked with a private economic consultancy in London.
Deputy Director General: Strategic Issues, Cabinet and Policy Division, Mr Stephen WoodMr Wood commenced as Deputy Director General, Strategic Issues, on 14 December 2009. Prior to this, he was a Commissioner of the Western Australian Industrial Relations Commission for ten years. He was the Deputy Director General of the Department of the Premier and Cabinet from 1997 to 1999; and the Chief Executive, Policy Office, Department of the Premier and Cabinet, from 1995 to 1996. Mr Wood held a variety of positions in the State Department of Productivity and Labour Relations between 1988 and 1993. He also worked in the Commonwealth Public Service for nine years in the Department of Defence, the Public Service Board and Customs. As of 2 May 2011, Mr Wood has been on secondment as acting Director General, Department of State Development.
Assistant Director General: State Administration and Corporate Support, Mr Greg MooreMr Moore was appointed to the position of Assistant Director General, State Administration and Corporate Support, in June 2007. Prior to this appointment, Mr Moore was the Director, State Administration, within the State Administration and Corporate Support Division. Mr Moore has over 40 years of experience in the public sector and prior to joining the Department of the Premier and Cabinet in 1987, he held positions in the Public Service Commission, Office of Industrial Relations and the Department of Labour and Industry.

Page 6 | DPC Annual Report 2010–2011
Assistant Director General: Office of State Security and Emergency Coordination, Mr Geoff HayMr Hay was appointed to the position of Assistant Director General, Security Planning and Coordination, in July 2005, following periods in the positions of Assistant Director General, State Administration, and Assistant Director General, Public Sector Management. Previously, Mr Hay held the position of Assistant Under Treasurer at the Treasury Department. Mr Hay has over 30 years of experience in the public sector and, in addition to the Treasury Department, he has been employed by the Department of Corrective Services and the Fremantle Port Authority.
Director: Constitutional Centre, Ms Betty O’RourkeMs O’Rourke was appointed as Director, Constitutional Centre of Western Australia, in February 2000. Ms O’Rourke had 15 years of experience as a teacher before spending the following six years as Head of Public Programs at the Western Australian Museum.
Director: State Law Publisher, Mr John StrijkMr Strijk was appointed to the position of Manager, State Law Publisher and Government Printer, in June 1996, having previously acted in the position of Director, State Print. Mr Strijk has over 40 years of public sector experience and occupied various positions in the Department of State Services and State Print.
Director: Cabinet Secretariat, Cabinet and Policy Division, Mr Nick HagleyMr Hagley commenced as a Senior Parliamentary Officer in 1989, before moving to the former Minister for Police’s office as Executive Officer in 1995. Returning to the Department, he was appointed Manager of the Parliamentary Services Branch and has also acted as Cabinet Secretary. In 2010, he was appointed Director of the Cabinet Secretariat.
Director: State Administration, Mr Robert KennedyMr Kennedy has worked in public sector agencies for over 15 years in both the State and Commonwealth Government. Most of this time has been in central agencies in policy and administration roles. He joined the Department in 2003 and was appointed Director, State Administration, just prior to the general election in 2008, when he joined the Corporate Executive. Mr Kennedy is currently Acting Director, Office of the Director General, and Ms Kathryn Andrews is Acting Director, State Administration.

DPC Annual Report 2010–2011 | Page 7
Executive Director: Strategic Issues, Ms Rebecca BrownMs Brown has been Executive Director, Strategic Issues Unit, since October 2009. Prior to this, she was a member of the corporate executive of the Department of Treasury and Finance. Ms Brown had been in the Treasury Department in a variety of positions for 12 years. Previously, she had gained five years of experience in the Federal Treasury.
Executive Director: Strategic Review, Mr Stephen HomeMr Home’s appointment as Executive Director, Strategic Review, commenced on 3 May 2010. For nine years prior to this he was Business Manager of the University of Western Australia’s Oral Health Centre. Up until 2001, Mr Home spent over 20 years in the Western Australian public service, holding senior positions in a number of agencies, including the Departments of Productivity and Labour Relations, Fisheries and Education. He was acting Chief Executive of the Department of Productivity and Labour Relations for two years from 1993, and of the Department of Fisheries for three months in 1996. From January 1997–June 2001 he was Executive Director of Human Resources within the Department of Education. Since 2 May 2011, he has acted in the position of Deputy Director General, Strategic Issues.
Executive Director: Intergovernmental Relations, Ms Lyn GenoniMs Genoni was appointed an Executive Director in 2010. She has over 30 years of public sector experience, with more than a decade in the area of Commonwealth and State relations. Ms Genoni commenced her career as an English and Literature teacher, and went on to a succession of policy leadership and management roles — from schooling and skills to workforce development and labour relations — in a number of government agencies. She served as an elected member of the State Council of the Institute of Public Administration Australia (IPAA) for ten years, and was awarded life membership of IPAA WA in 2007.
Executive Director: Land, Approvals and Native Title, Mr John CatlinMr Catlin has a lengthy background in Indigenous issues and resource management policy. Mr Catlin returned to the Department of the Premier and Cabinet in May 2010 after a ten-year absence during which he spent six years as a Member of the National Native Title Tribunal, two years as Manager of the Victorian Government’s Native Title Unit, and a year in the mining industry in Queensland. He previously worked in the Department of the Premier and Cabinet, Department of Indigenous Affairs and the Department of Mines and Petroleum during the 1990s.
Executive Director, Mr Tony RutherfordMr Rutherford was appointed to the position of Executive Director in May 2011. Prior to this appointment, Mr Rutherford had extensive experience in senior policy advisory roles in both State and Commonwealth Government offices and the Institute of Public Affairs, as a public affairs columnist for The West Australian Newspaper, and in a private consulting practice.

Page 8 | DPC Annual Report 2010–2011
Functional Structure
Director GeneralPeter Conran AM
Assistant Director GeneralOffice of State Security and
Emergency CoordinationGeoff Hay
Emergency management policy and coordination services
DirectorState Law Publisher
John StrijkPrinting and publishing services
DirectorConstitutional Centre
Betty O’RourkeConstitutional Centre Programs
Assistant Director GeneralState Administration and Corporate Support
Greg Moore
State AdministrationSupport services to Ministers and Members of Parliament
Support services for matters of State
Corporate SupportInformation Management and TechnologyCorporate InformationDPC Media OfficeHuman ResourcesFinanceAncillary ServicesFacilities ManagementFreedom of Information Coordination
Deputy Directors GeneralCabinet and Policy Division
CoordinationDavid Smith
Strategic IssuesStephen Home (*)
(acting)
Native Title and Indigenous IssuesEnvironment and Natural ResourcesPlanning, Housing and Infrastructure
Economic Audit Committee ImplementationHuman Services Reform
Approvals ReformCOAG, National Enquiries, Treaties
Indian Ocean TerritoriesFederal Regulatory/Governance ModelsPublic Sector Policy and Collaboration
PremierHon Colin Barnett MEc MLA
DirectorCabinet Secretariat
Nick HagleyCabinet Services, Parliamentary
Services, Executive Council
Overseas Offices Ministerial Offices
*The incumbent Deputy Director General, Strategic Issues, Stephen Wood, is currently on secondment. Mr Home has been acting in this position.

DPC Annual Report 2010–2011 | Page 9
Preferred Place of Work
It is the Department’s aim to be recognised for its professionalism and considered as the ‘preferred place of work’, especially for young graduates and highly skilled policy administrators. The Department draws on the expertise available throughout the Western Australian public sector where there is significant experience and maturity in understanding the challenges in changing priorities and implementing Government directions.
The Department also endeavours to be proactive in responding to Government requirements and meeting community expectations. To do so, the Department undertakes to develop its people for the future rather than just to fulfil operational needs. This positive approach is evident through the Department’s corporate policies and workforce planning processes.
Our Working EnvironmentThe Department’s Workforce At 30 June 2011, the Department employed an average 453 full-time equivalent (FTE) employees during 2010-11, compared with 428 FTE the previous year.
One of the Department’s critical functions is to provide support to the Premier and Ministers, the Office of the Leader of the Opposition and 95 Members of the Western Australian State Parliament.
The Department provides administrative support to the Presiding Officers of Parliament who employed an average of 200 FTE electorate officers for Members of Parliament during 2010-11. These electorate offices are located throughout the State.
In addition, the Department provides administrative support to overseas offices in London, Dubai and Tokyo.
Workforce PlanningIn 2010, the Department developed the Department of the Premier and Cabinet Workforce Plan 2010–2014, with an aim ‘to attract and retain the highest quality people’.
An initial key step was to establish structured succession planning, commencing with the development of a succession plan for the Department along with guidelines for management. A thorough assessment and identification of critical key positions and employees within the agency has been completed and the Department is now working towards the provision of management tools to support the succession planning process.
The Department’s successes and activities in this area are shared with the public sector’s Workforce Planning Consultative Committee coordinated by the Public Sector Commission.
DPC Annual Report 2010–2011 | Page 9

Employment OpportunitiesThe Department offers a range of career opportunities in areas of high-level strategic policy development, senior project management, and administrative management in corporate support areas. Opportunities also exist for school-based traineeships, entry-level employment and graduate entry to the Department.
Graduate and Trainee Programs: The graduate and trainee recruitment programs provide excellent opportunities to learn about and work in a central agency at the heart of Government. In 2010–11, the Department recruited three graduates, one full-time trainee in Information Technology, and four school-based trainees.
Graduates and trainees are rotated through the various functional work areas and are provided with specific training and development critical for the roles they undertake. Interested candidates are encouraged to visit the Department’s Internet site, under ‘Work for Us’, for current vacancies.
Supporting People with Disabilities: The Department is committed to providing gainful employment for two Supported Work Teams that are comprised of three people per team, each with different disabilities. The program continued during this year. These teams undertake clerical/administrative work and are supervised by a coordinator, who ensures the employee has the capacity to do the task and it is completed accurately and appropriately.
The key elements in this program are the provision of training and development of people with disabilities in basic administrative skills whilst having access to a standard office environment. Although the work provided to these teams is not complex, it supports the employees’ capacity to pursue future work opportunities. It also allows them to become accustomed to an office environment and the opportunity to interact with others. In 2011, one of these team members was successful in gaining a business traineeship.
Flexible Working Arrangements: The Department supports a healthy work and family lifestyle, and encourages employees to maintain productive relationships in both areas. All employees have access to utilising flexi-time, purchased leave, part-time work and telecommuting arrangements to assist them in achieving a positive work-life balance. These flexible work arrangements are mutually beneficial in maintaining a healthy workforce and to acknowledge an increase in the number of employees with the responsibility of caring for children as well as ageing parents.
Support to the CommunityThe Department has workplace giving arrangements in place to allow employees to make direct pre-tax personal donations from their salary to 15 eligible charities. On a monthly basis, the Department also promotes ‘free dress days’ to raise funds for charitable organisations and various causes nominated by employees. Both activities are well supported by the Department’s employees, and help to raise awareness on the plight of others and simple ways in which staff members can contribute to the wider society.
A Diverse WorkforceIt is the Department’s genuine aim to achieve an inclusive and diverse workplace through appropriate equity and diversity strategies, including encouraging the employment of people with disabilities, people from diverse backgrounds, youth and Indigenous Australians. This is demonstrated by the engagement of the Supported Work Teams to provide a first step in paid employment for people with different disabilities, who are not able to engage in full-time work. The opportunity promotes confidence and develops skills and abilities to enable them to merge into the workforce.
Every year, the Department also provides opportunities for young Aboriginal and Torres Strait Islanders to join the agency through traineeships.
Page 10 | DPC Annual Report 2010–2011

DPC Annual Report 2010–2011 | Page 11
What We DoPerformance Management FrameworkThe Department operates under the guidance of the Strategic Plan 2009–2012. The Strategic Plan outlines the Department’s key functions, and those goals and indicators that are necessary to fulfil those functions to the highest standard. The Department’s Services and Outcomes are structured to achieve those goals, in order to, in turn, achieve the Government Goal of ‘Outcomes Based Service Delivery’.
Key agency goals:
1. Deliver a high level of effective support and policy advice to meet the identified needs of Executive Government.
2. Show leadership and give support to agencies to identify and promote options for innovative service delivery to better reflect community needs.
3. Maximise benefits to Western Australians from engagement with the Commonwealth Government.
4. Strengthen policy capacity across government.
5. Build the capability and commitment of our people, and the support processes and systems to deliver our goals.
Services
1. Administration of Executive Government Services.2. Government Policy Management.
Agency-level outcomes
1. Executive Government receives appropriate support.2. The Premier and Ministers receive high-quality,
rigorous and timely policy support.
Government Goal
Outcomes Based Service DeliveryGreater focus on achieving results in key service areas for the benefit of all Western Australians.
Page 12 | DPC Annual Report 2010–2011
Service Areas
The Two Agency-Level Outcomes Are:
1. Executive Government receives appropriate support.
2. The Premier and Ministers receive high quality, rigorous and timely policy support.
These outcomes directly relate to the purpose and goals set out in the Strategic Plan, and the service structure to deliver these outcomes has been designed around the administrative and policy functions of the Department.
The Department’s Activities also Contribute to the Government Goals:
Financial and Economic Responsibility;
Social and Environmental Responsibility; and
State Building — Major Projects.
Service 1: Administration of Executive Government Services
Administrative support to the Premier, Ministers, the Leader of the Opposition, and Members (and former Members) of Parliament.
Promotion of Western Australia’s interests overseas; management of State occasions, official visits and Constitutional Centre programs.
Publishing services for Parliament and Government.
Service 2: Government Policy Management Policy advice and coordination for the Premier and Cabinet.
Leadership and coordination of cross-agency solutions to complex policy issues.
Management and coordination of input and advice for intergovernmental negotiations with COAG and the Council for Australian Federation.
Support for the Executive Council, Cabinet and Parliament processes.
Emergency management policy advice.
Whole-of-government management and coordination of security incident and emergencies.
Policy research, advice and development through the Land, Approvals and Native Title Unit.
The key effectiveness and efficiency indicators report on the agency-level outcomes undertaken by these services.

DPC Annual Report 2010–2011 | Page 13
Legislation AdministeredThe following is a list of the Acts of Parliament, which are the responsibility of the Premier and are administered by the Department.
Agent General Act 1895Alteration of Statutory Designations Act 1974Armorial Bearings Protection Act 1979Constitution Act 1889Constitution Acts Amendment Act 1899Daylight Saving Act 2006Deputy Governor’s Powers Act 1911Discharged Servicemen’s Badges Act 1967Election of Senators Act 1903Indian Ocean Territories (Administration of Laws) Act 1992Machinery of Government (Miscellaneous Amendments) Act 2006Members of Parliament (Financial Interests) Act 1992Ministers’ Titles Act 1925Mutual Recognition (Western Australia) Act 2001Mutual Recognition (Western Australia) Act 2010Parliamentary and Electorate Staff (Employment) Act 1992Parliamentary Papers Act 1891Parliamentary Privileges Act 1891Returned Servicemen’s Badges Act 1953Royal Commission (Custody of Records) Act 1992Royal Commission into Commercial Activities of Government Act 1992Royal Commissions Act 1968Royal Powers Act 1953Royal Style and Titles Act 1947
Standard Time Act 2005State Flag Act 2006Taxation (Staff Arrangements) Act 1969Terrorism (Commonwealth Powers) Act 2002Trans-Tasman Mutual Recognition (Western Australia) Act 2007
Other Key Legislation Impacting on the Department’s Activities Corruption and Crime Commission Act 2003Disability Services Act 1993Equal Opportunity Act 1984Financial Management Act 2006Freedom of Information Act 1992Industrial Relations Act 1979Minimum Conditions of Employment Act 1993Occupational Safety and Health Act 1984Parliamentary Commissioner Act 1971Public and Bank Holidays Act 1972Public Interest Disclosure Act 2003Public Sector Management Act 1994State Records Act 2000State Supply Commission Act 1991Workers Compensation and Injury Management Act 1981Workers Compensation Reform Act 2004

Page 14 | DPC Annual Report 2010–2011
Shared ResponsibilitiesInitiative Related Outcome
Building a Sustainable Not-for-profit Sector
Support the Partnership Forum, a joint forum of public and community sector Chief Executive Officers, established to progress key initiatives to build a sustainable community sector.
Key reforms to contracting arrangements between public agencies and community sector organisations focused on improving outcomes for the Western Australian community.
Reduce the administrative burden imposed on community sector organisations.
Strengthening Public Sector Policy Capacity and Collaboration
Leading and facilitating the implementation of improved coordination, collaboration and capacity in cross-sector policy development.
Land, Approvals and Native Title (1)
Support the Ministerial Taskforce on Approvals, Development and Sustainability. Streamline approvals processes and remove administrative duplications. Assist, identify and remove structural and institutional impediments to growth relating to major
resource, infrastructure, land and housing projects. Address land and housing availability and affordability to support economic growth.
Land, Approvals and Native Title (2)
Restructure of the Office of Native Title within the Department of the Premier and Cabinet. Streamline Native Title claims management and integrate Government land use interests in
claim mediation via Government Indigenous Land Use Agreements. Identify efficiencies in future Act management by Government agencies, including cultural
heritage management. Assist the Department of Indigenous Affairs in preparing terms of reference for a review of the
Aboriginal Heritage Act 1972 and drafting Due Diligence Heritage Guidelines. Establish:
(a) Inter-Agency Reference Group on Native Title and Aboriginal Heritage; and (b) Native Title Agreement Implementation Group within the Department of the
Premier and Cabinet.
CHOGM 2011 and Associated Events
Provision of security, health, traffic management and other services to assist the Commonwealth Government with the hosting of CHOGM in 2011.
To facilitate participation in the events by the Western Australian community and Western Australian businesses.
To profile Western Australia during CHOGM and to improve Western Australians’ understanding of the Commonwealth.

DPC Annual Report 2010–2011 | Page 15
Significant Issues 2010–2011
Delivering services to the most vulnerable and disadvantaged members of our community through a genuine partnership with the community sector, and reforms to enhance their capacity to deliver those services was a key focus for 2010–11 and will continue in 2011–12. Significant initiatives in this context in 2010–11 were:
support for the Partnership Forum;
coordination of reforms to contracting arrangements between public agencies and community sector organisations and reducing the administrative burden imposed on them; and
supporting community sector organisations to develop as social enterprises.
In 2011–12, the Department will oversee implementation of reforms to ensure sustainable funding and contracting arrangements between Government and the not-for-profit sector.
Reform of approvals processes to ensure that Western Australia remains an attractive investment destination, is a key Government objective. The Ministerial Taskforce on Approvals, Development and Sustainability, supported by the Department, is leading this reform across the public sector.
In 2010–11, the Land, Approvals and Native Title Unit (incorporating the Office of Native Title, transferred from the Department of the Attorney General) was established to consolidate the delivery of advice on land, State and Commonwealth approvals, heritage and Native Title matters. In 2011–12, one of the key objectives is enhancement of the Native Title claim negotiation process to speed up resolution of claims and provide increased economic development opportunities for traditional owners.
Tax reform, GST distribution, royalties revenues and mining taxes are significant issues on which the State is seeking a better deal from the Commonwealth in 2011–12. The report from the review of the GST distribution arrangements, due in September 2012, will be critical in this regard. Without some change in this process, Western Australia’s projected GST relativity falls to 33 per cent by 2014-15, at a time when the State’s contribution to the national economy is increasing.
The recently signed National Health Reform Agreement puts in place health funding arrangements acceptable to Western Australia; in particular, they do not give the Commonwealth control over State funds for health. Implementation of this agreement in 2011–12 will be monitored by the Department, which will take a lead role in developing the legislation.
Page 16 | DPC Annual Report 2010–2011
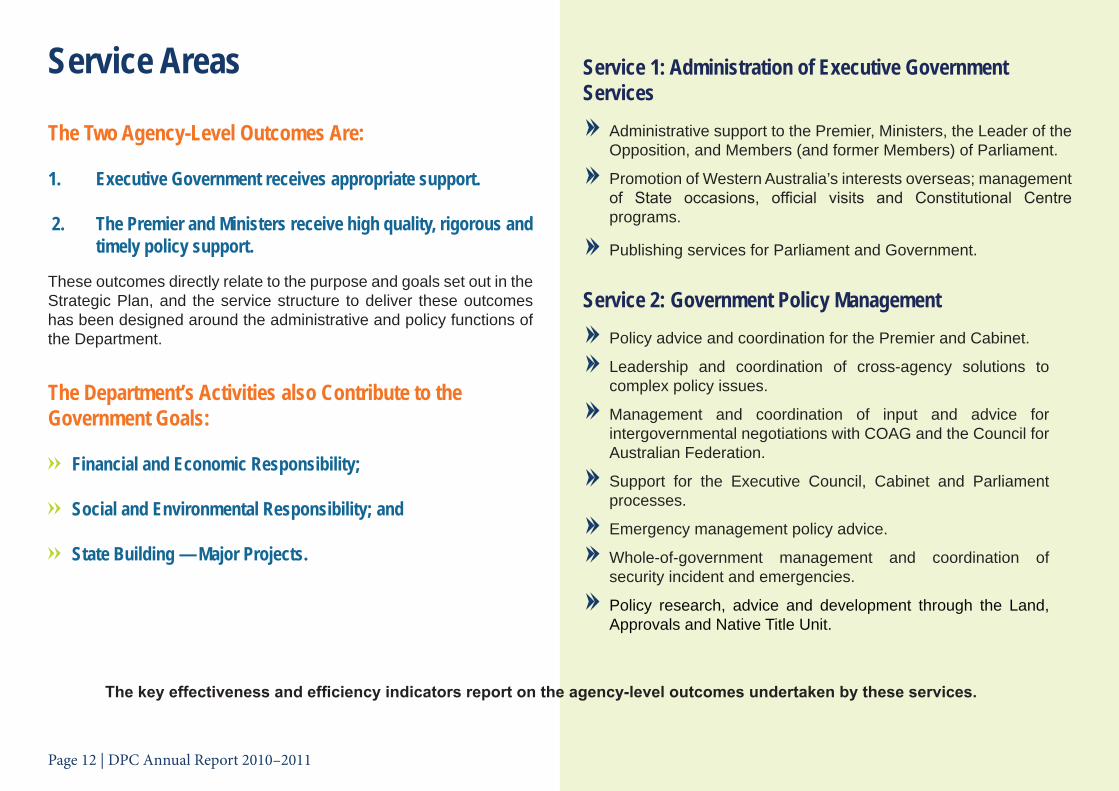
CHOGM, to be held in Perth in October 2011, will be opened by The Queen. The Department will coordinate some security, traffic management and health services for CHOGM and several related events.
An increase in the number of unauthorised boat arrivals in 2010–11 put pressure on State services provided on Christmas Island. These pressures will be reflected in negotiations with the Commonwealth about education services, child protection and the demand for new services.
Implementation of the Kimberley Science and Conservation Strategy by line agencies with responsibility for delivery of specific initiatives will continue in 2011–12. The announcement of $62.6 million over five years will enable implementation of strategies, including new marine parks, conservation reserves, partnerships for on-ground fire, feral animal and weed control, a marine science research program and funding for tourism initiatives and rock art research.
During 2010–11, the State experienced several natural disasters. The Carnarvon/Gascoyne River floods and the Lake Clifton and Perth Hills fires caused widespread damage and loss of property. The Department assisted and continues to assist in the disaster recovery and financial support arrangements, and it supported the independent review of bushfire risk management in the Perth Hills area conducted by Mr Mick Keelty AO APM.
Government accepted the recommendations of the Whithear Report into Public Sector Superannuation arrangements in 2010–11, and will be working with agencies to implement resultant superannuation reform in 2011–12.
Page 16 | DPC Annual Report 2010–2011
DPC Annual Report 2010–2011 | Page 17
How We’re Tracking
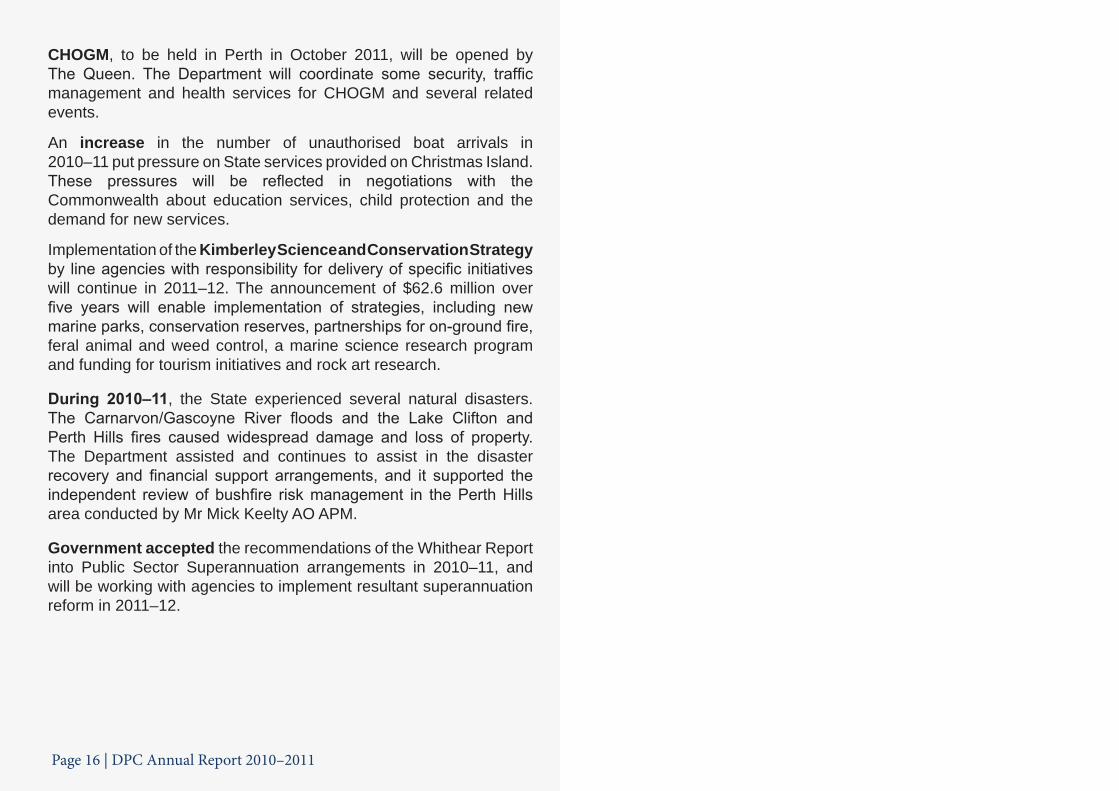
Outcomes, Services and Performance InformationThe details of Actual results against Targets established in the Department’s Annual Resource Agreement with the Premier and the Treasurer are set out in the table below. Explanations of material variances are provided opposite. It should be noted that the 2010–11 data includes the part-year effect of the transfer of the Office of Native Title function on 1 April 2011 from the Department of the Attorney General.
Financial Targets 2010–11 Target$000
2010–11 Actual$000
Variation$000 (1)
Total cost of services (expense limit)(sourced from Income Statement) 113,696 121,152 7,456Net cost of services (sourced from Income Statement) 110,108 117,142 7,034Total equity (sourced from Statement of Financial Position) 22,647 39,284 16,637Net increase/(decrease) in cash held (sourced from Cash Flow Statement) (2,497) 29,399 31,896
No. No. No.Approved full-time equivalent (FTE) staff level (average annual) (1) 690 672 (18)
Further explanations are also contained in Note 33 ‘Explanatory Statement’ to the Financial Statements.
(1) Includes Electorate Office employees. The Department provides administrative support to Electorate Office staff who are employed by the Presiding Officers of Parliament.
Page 18 | DPC Annual Report 2010–2011
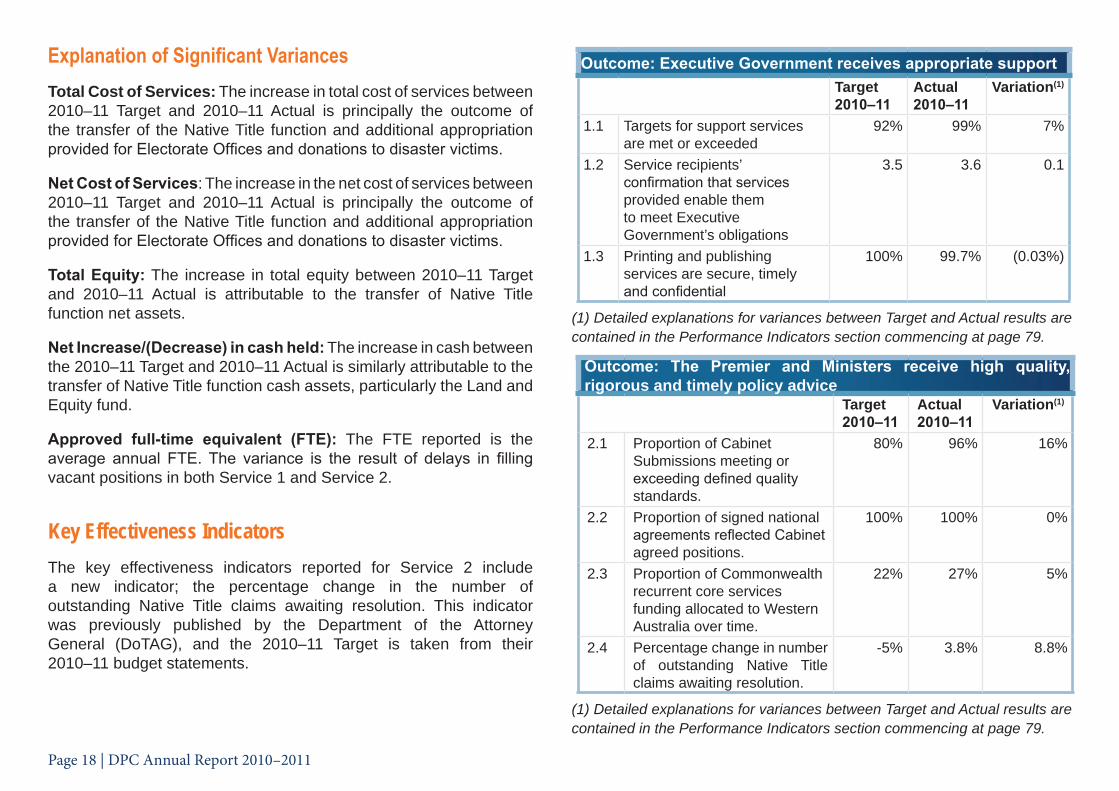
Explanation of Significant VariancesTotal Cost of Services: The increase in total cost of services between 2010–11 Target and 2010–11 Actual is principally the outcome of the transfer of the Native Title function and additional appropriation provided for Electorate Offices and donations to disaster victims.
Net Cost of Services: The increase in the net cost of services between 2010–11 Target and 2010–11 Actual is principally the outcome of the transfer of the Native Title function and additional appropriation provided for Electorate Offices and donations to disaster victims.
Total Equity: The increase in total equity between 2010–11 Target and 2010–11 Actual is attributable to the transfer of Native Title function net assets.
Net Increase/(Decrease) in cash held: The increase in cash between the 2010–11 Target and 2010–11 Actual is similarly attributable to the transfer of Native Title function cash assets, particularly the Land and Equity fund.
Approved full-time equivalent (FTE): The FTE reported is the average annual FTE. The variance is the result of delays in filling vacant positions in both Service 1 and Service 2.
Key Effectiveness IndicatorsThe key effectiveness indicators reported for Service 2 include a new indicator; the percentage change in the number of outstanding Native Title claims awaiting resolution. This indicator was previously published by the Department of the Attorney General (DoTAG), and the 2010–11 Target is taken from their 2010–11 budget statements.
Outcome: Executive Government receives appropriate supportTarget2010–11
Actual2010–11
Variation(1)
1.1 Targets for support services are met or exceeded
92% 99% 7%
1.2 Service recipients’ confirmation that services provided enable them to meet Executive Government’s obligations
3.5 3.6 0.1
1.3 Printing and publishing services are secure, timely and confidential
100% 99.7% (0.03%)
(1) Detailed explanations for variances between Target and Actual results are contained in the Performance Indicators section commencing at page 79.
Outcome: The Premier and Ministers receive high quality, rigorous and timely policy advice
Target2010–11
Actual2010–11
Variation(1)
2.1 Proportion of Cabinet Submissions meeting or exceeding defined quality standards.
80% 96% 16%
2.2 Proportion of signed national agreements reflected Cabinet agreed positions.
100% 100% 0%
2.3 Proportion of Commonwealth recurrent core services funding allocated to Western Australia over time.
22% 27% 5%
2.4 Percentage change in number of outstanding Native Title claims awaiting resolution.
-5% 3.8% 8.8%
(1) Detailed explanations for variances between Target and Actual results are contained in the Performance Indicators section commencing at page 79.

DPC Annual Report 2010–2011 | Page 19
Service: Administration of Executive Government services
Target2010–11
Actual2010–11
Variation(1)
1.4 Average operating cost per Ministerial Office (including Premier’s Office and Leader of the Opposition)
$2,176,292 $2,305,297 $129,005
1.5 Average cost of support provided per Ministerial Office (including Premier’s Office and Leader of the Opposition)
$505,360 $456,408 ($48,952)
1.6 Average cost of representing Western Australia’s interests overseas (per region)
$1,986,414 $1,532,408 ($454,006)
1.7 Average cost of entitlements per Member of Parliament
$314,234 $360,700 $46,466
1.8 Average cost of support provided per Member of Parliament
$21,028 $13,138 ($7,890)
1.9 Average cost per print image produced
$0.41 $0.37 ($0.04)
1) Detailed explanations for variances between Target and Actual results are contained in the Performance Indicators section commencing at page 79.
Service: Government Policy Management
The key efficiency indicators reported for Service 2 include two new indicators, the average cost per Native Title claim managed and the average time taken to achieve resolution of prioritised Native Title claims. These indicators were previously published by DotAG, and the 2010–11 target is taken from their 2010–11 budget statements.
Target2010–11
Actual2010–11
Variation(1)
2.4 Average cost per Cabinet submission assessed
$19,669 $31,878 $12,209
2.5 Average cost per agreement where Cabinet agreed positions are incorporated in final national agreements
$284,741 $1,098,522 $813,781
2.6 Average cost per Native Title application managed
$80,804 $10,998 ($69,806)
2.7 Average time taken to achieve resolution of prioritised Native Title applications.
4.1 yrs 6.9 yrs (2.8 yrs)
1) Detailed explanations for variances between Target and Actual results are contained in the Performance Indicators section commencing at page 79.

Page 20 | DPC Annual Report 2010–2011
Report on Operations — Services
Service 1: Administration of Executive Government ServicesSupport to the PremierThe Premier’s Office is staffed by policy and media support, secretarial, and administrative employees under the guidance of the Chief of Staff.
Policy Officers advise the Premier on policy and related issues, and liaise with State Parliamentary Members, Ministers and staff in the Ministerial and overseas offices.
Premier’s Office staff are the contact and liaison points for matters directly involving the Premier, attend meetings with or on his behalf, and follow up matters arising from those meetings.
Support to Ministers, Policy Advice and Support to Ministerial Offices and the Leader of the OppositionMinisterial Offices form part of the Department and each Minister is provided with appropriate policy and administrative staff. In addition, corporate and specialised support is provided to the offices with dedicated staff to assist with staffing matters, accommodation, air charter services and budget matters.
The Ministerial Merit Panel assesses the merits of any intended staff secondments and appointments to Ministerial Offices. It advises on the classification and salary to be offered to ensure a consistent approach to the appointment process across Ministerial Offices. The Ministerial Merit Panel considered 176 submissions during the year in both formal and out-of-session meetings.
Security
Arrangements for the assessment and monitoring of security measures in Ministers’ offices and private residences were managed throughout the year.
The coordination of the internal security arrangements for Departmental staff located in the Governor Stirling Tower and other departmental accommodation continued.
Transport
Vehicle and driver services for the Premier, Ministers, the Leader of the Opposition, visiting overseas dignitaries and some Parliamentary Office Holders were provided. Administration was also provided for operational leasing facilities for the Public Sector Commission’s and the Department’s vehicles.
DPC Annual Report 2010–2011 | Page 21
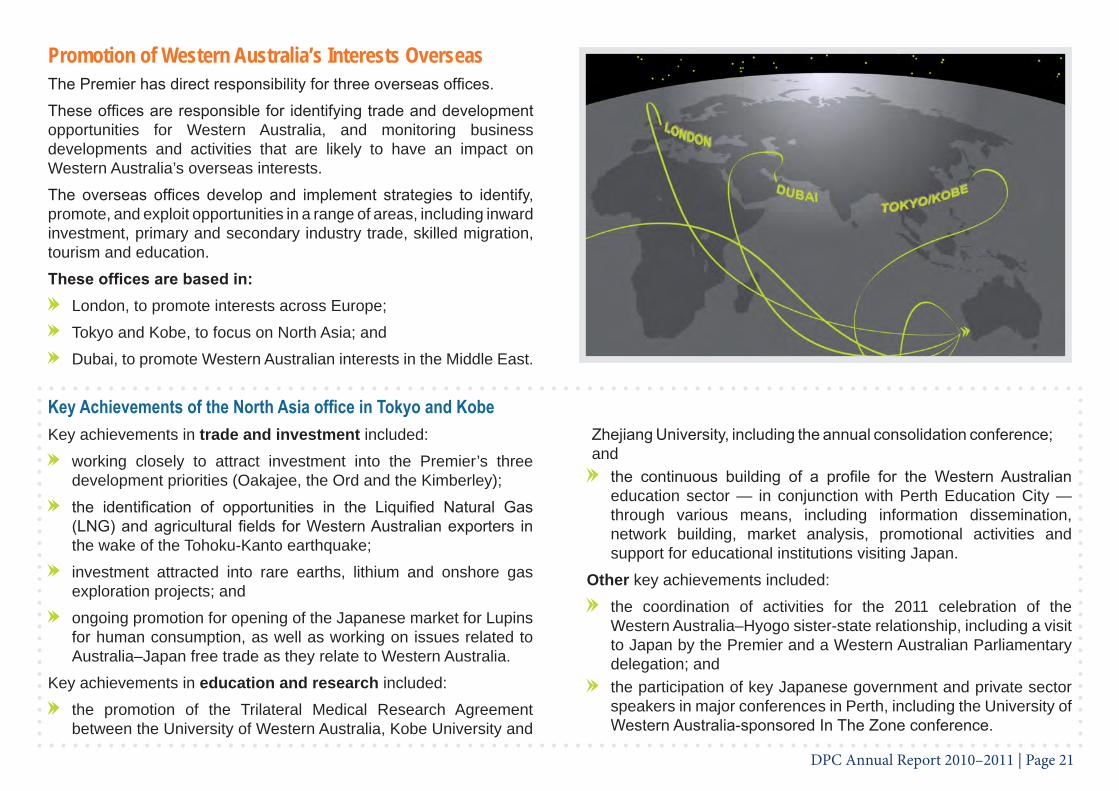
Promotion of Western Australia’s Interests OverseasThe Premier has direct responsibility for three overseas offices.
These offices are responsible for identifying trade and development opportunities for Western Australia, and monitoring business developments and activities that are likely to have an impact on Western Australia’s overseas interests.
The overseas offices develop and implement strategies to identify, promote, and exploit opportunities in a range of areas, including inward investment, primary and secondary industry trade, skilled migration, tourism and education.
These offices are based in: London, to promote interests across Europe;
Tokyo and Kobe, to focus on North Asia; and
Dubai, to promote Western Australian interests in the Middle East.
Key Achievements of the North Asia office in Tokyo and KobeKey achievements in trade and investment included:
working closely to attract investment into the Premier’s three development priorities (Oakajee, the Ord and the Kimberley);
the identification of opportunities in the Liquified Natural Gas (LNG) and agricultural fields for Western Australian exporters in the wake of the Tohoku-Kanto earthquake;
investment attracted into rare earths, lithium and onshore gas exploration projects; and
ongoing promotion for opening of the Japanese market for Lupins for human consumption, as well as working on issues related to Australia–Japan free trade as they relate to Western Australia.
Key achievements in education and research included:
the promotion of the Trilateral Medical Research Agreement between the University of Western Australia, Kobe University and
Zhejiang University, including the annual consolidation conference; and the continuous building of a profile for the Western Australian
education sector — in conjunction with Perth Education City — through various means, including information dissemination, network building, market analysis, promotional activities and support for educational institutions visiting Japan.
Other key achievements included:
the coordination of activities for the 2011 celebration of the Western Australia–Hyogo sister-state relationship, including a visit to Japan by the Premier and a Western Australian Parliamentary delegation; and
the participation of key Japanese government and private sector speakers in major conferences in Perth, including the University of Western Australia-sponsored In The Zone conference.

Page 22 | DPC Annual Report 2010–2011
Key Achievements of the European Office in London
Key achievements in trade and investment included:
planning and participating in the week-long Australia live promotional event, which was designed to raise Australia’s profile as an attractive market for investment and business development;
the continued promotion of Western Australia as a destination for oil, gas and mineral investment, particularly through preparations to bring two separate United Kingdom delegations, a 28-person Dutch delegation, and an eight-person Russian delegation to the Australia Oil and Gas 2011 conference in Perth, exhibiting at Offshore Northern Seas 2010, and participating in the Mines and Money 2010 conference in London;
facilitating the attendance and participation of Western Australian companies in at least 16 oil, gas, minerals, infrastructure and business development specific events;
providing assistance to both Western Australian companies (including those in the agri-food, beverage and fisheries industries) and European companies/organisations regarding market information, coordination of visit programs and general advice on their respective markets; and
promoting Western Australia as a destination for investment in scientific research and innovation, through hosting special events, providing presentations and targeted marketing initiatives.
Key achievements in business tourism and investment included:
the promotion and coordination of CHOGM 2011 in the United Kingdom market, with a focus on the Commonwealth Business Forum and the non-governmental organisation (NGO) sector;
actively promoting Western Australia as a destination for international conferences, cultural events, and business tourism through participation in a number of major industry exhibitions, special events, destination presentations and the undertaking of targeted marketing initiatives;
assisting the Perth Convention Bureau to participate in the bidding process for major congresses through coordinating business trips and meetings in the United Kingdom, providing eight international leads, and assistance in presenting bids for specific events; and
the promotion of Western Australian hotel and tourism infrastructure investment opportunities through close liaison with key Western Australian Government agencies, the creation of an investor database and dissemination of information on key development opportunities to database members, and participation in key meetings and events.
Key achievements in education included:
providing ongoing support to assist Perth Education City and Western Australian educational institutions to identify possible collaboration opportunities with their European counterparts, through the provision of regular market intelligence updates, analysis and networking; and
supporting Western Australian education institutions’ efforts to recruit overseas students, through participation in nine recruitment events across Europe.

DPC Annual Report 2010–2011 | Page 23
Key achievements in skilled migration included:
attending and presenting at 43 significant migration events, including migration expos, as well as information days and seminars held by migration agents in the United Kingdom and Ireland; and
providing ongoing assistance to the Department of Health in maintaining its London Recruitment Bureau (including the provision of office facilities and assistance to staff), enabling the Department to maintain an active recruitment program through the promotion of Western Australia as a desirable location amongst healthcare professionals, and streamlined processing of suitable United Kingdom candidates through to recruitment in Western Australian hospitals.
Other key achievements included:
assisting in the planning for, and providing support during, visits by the Hon Colin Barnett MLA, Premier and Minister for State Development; the Hon Peter Collier MLC, Minister for Training and Workforce Development; Members of Parliament; and key Government agency staff.
Key Achievements of the Middle East Office in Dubai
Key achievements in trade and investment include:
the facilitation of the signing of a Memorandum of Understanding between the Yemen Ministry of Agriculture and Irrigation and the Western Australian Department of Agriculture and Food (DAFWA);
providing assistance to the Saudi Government’s wheat-buying authority, which ultimately culminated in the Saudi Government’s decision to change its import regulations to meet with Western Australian wheat-exporting capabilities;
promoting Western Australia’s animal feed capabilities, which
played a significant role in the first ever order of Western Australian Oaten Hay by the United Arab Emirates;
with DAFWA, arranging for the Abu Dhabi Food and Agriculture Authority to visit Western Australia;
identifying possible investors in the Western Australian agricultural sector through meetings with sovereign fund managers from Qatar, the United Arab Emirates and Saudi Arabia, and identifying possible opportunities for Western Australian organisations in Pakistan;
facilitating the involvement of Western Australian companies in the Middle East’s largest food expo in Dubai;
releasing, or providing support in the release of, the in-depth Middle Eastern Food Industry report, as well as detailed reports on animal feed, wheat and potato seed, and a fruit and vegetable strategy report;
assisting Western Australian company, Austal, in opening a Dubai office and in contract negotiations with the Saudi Ministry of the Interior; and
assisting Western Australian companies to participate in the Big-5 Trade Exhibition.
Key achievements in tourism include:
representing Tourism Western Australia at the Arabian Hotel Investment Conference.
Key achievements in education include:
actively participating in a number of events, including the International Exhibition for Higher Education in Saudi Arabia and the Dawn Education and Pakistan International Education Exhibition Expos in Pakistan, to showcase Western Australia as an education destination.

Page 24 | DPC Annual Report 2010–2011
Management of State Occasions and Official Visits
Events and Visit Management Services
The Department continued its role of planning and coordinating official visits to the State, directing and arranging State hospitality functions and major Government ceremonial and special events, arranging official gifts for presentation by the Premier, providing protocol advice to the Government and the public, and being a focal point for liaison with the Consular Corps.
State Visit Management
The Department was responsible for either leading or assisting Commonwealth departments in organising 24 visit programs during the year. The categories of visits coordinated by the Department were as follows:
2 Heads of Government3 Ministerial28 Ambassadors and High Commissioners3 Official overseas visits by the Premier
Significant visits included those by:
His Excellency Professor Dr Boediono, Vice President of the Republic of Indonesia, 9–10 March 2011.
His Excellency Mr Jia Qinglin, Chairman of the National Committee of the Chinese People’s Political Consultative Conference, People’s Republic of China, 5–7 April 2011.
Assistance was provided with arrangements for the Premier’s official visits to Singapore (October 2010), Japan/Korea (March 2011) and Dubai/United Kingdom/France (June 2011).
Hospitality, Ceremonial and Special Event Management
A total of 29 hospitality, ceremonial and special events, and calls on the Premier, were arranged during the year. These included receptions, dinners and luncheons for distinguished visitors hosted by the Premier or Ministers on his behalf, and community functions associated with Regional Cabinet meetings.
Major events arranged or assisted with during the year included:
the Sundance Memorial Service;
the Premier’s Reception for the Consular Corps;
the State/Civic Welcome Home Reception for Members of the 2010 Australian Commonwealth Games Team; and
the State Reception to Farewell His Excellency the Governor, Dr Ken Michael AC and Mrs Michael.
Throughout the latter part of the year in review, planning took place for the swearing-in ceremony of Malcolm McCusker AO QC, as the 31st Governor of Western Australia on 1 July 2011.
Australian Bravery Decorations Council
Australian Bravery Decorations date from the establishment of the Australian Honours system in 1975. The decorations recognise acts of bravery by those who put themselves in harm’s way to protect the lives or property of others.
The Chief of Protocol is Western Australia’s representative on the Australian Bravery Decorations Council. A total of four awards were made to Western Australians throughout the year.

DPC Annual Report 2010–2011 | Page 25
The swearing-in ceremony of Malcolm McCusker AO QC, 31st Governor of Western Australia, on 1 July 2011. Planning for this event took place later in the year in review.
Image courtesy of Russell Barton (Scene Team).
Future Directions
The Protocol Branch, in conjunction with the Commonwealth Government, will assist in planning for The Queen’s attendance at CHOGM in October 2011.
The Protocol Branch will work in conjunction with the Commonwealth Government on at least four Guest of Government (Heads of Government)visits either preceding or post-CHOGM, and with airport facilitation for the official arrival of all leaders attending CHOGM.
Assistance will be provided in relation to official functions hosted by the Premier during CHOGM.
The Ambassadorial/High Commissioners official visit programme will recommence in February 2012.

Page 26 | DPC Annual Report 2010–2011
Communication of Government Policies and Activities
Department of the Premier and Cabinet Media Office
The Department of the Premier and Cabinet Media Office coordinates and distributes information to media, facilitates liaison between Cabinet Ministers and media outlets, and provides support to Ministerial Advisers.
The Media Office consists of the Media Monitoring Unit, the Administration/Sub Editing Unit and a Government Communications Unit. It is responsible for the coordination of all Government advertising and marketing, as well as the daily Media Monitoring Services for Ministers and many government agencies.
Community Comment Line and Correspondence
Throughout 2010–11, the range of services provided by the Correspondence Branch enabled government agencies, business, community organisations, and the general public to convey their views to the Premier and Western Australian Government via telephone, email and letter.
Departmental officers responded to 1,868 telephone calls to the
Community Comment Line and actioned 39,009 items of correspondence over the year. The telephone numbers and address for the Community Comment Line and Correspondence services are as follows:
Metropolitan: (08) 9222 9449Country (toll free): 1800 198 274Email: [email protected]: 197 St Georges Terrace, Perth, WA, 6000
Administration of EntitlementsThe Department continued to provide support and assistance to Members of Parliament and their staff in the operation of Parliamentary Electorate Offices throughout the State. In particular, the Department provided advice in respect of travel, vehicle and other Members of Parliament entitlements and training for electorate office staff.
The Department facilitated the relocation of one electorate office, with a further four being at various stages of completion. Site visits were routinely conducted to liaise with Members and their staff to determine any general maintenance requirements and to organise furniture and equipment.

DPC Annual Report 2010–2011 | Page 27
Printing and Publishing Service for Parliament and Government
Printing and Publishing Service for Parliament and Government
During 2010–11, State Law Publisher (SLP) processed all the Chamber documents required for the operation of Parliament, including Notice Papers, Hansard and the different versions of Parliamentary Bills as they progressed through the legislative process. Support and assistance was also provided with the Bills and Tabled Papers databases with processing of electronic documents.
As the Government’s ‘official publisher’, the SLP published, ‘under authority’ of the Government Printer, all State legislation and statutory publications. Copies of these publications are available through a retail sales outlet, and an online service at www.slp.wa.gov.au is also provided to enable users to access databases of various legislation materials. Online archival databases provide access to previous versions of legislation and past copies of Government Gazettes.
Electronic Uptake of the Government Gazette
A further 39,000 pages of the Western Australian Government Gazette were scanned and added to the archive database. Free access is provided to the database on the SLP website, which now contains copies of all Government Gazettes published since 1938. This project was initiated due to the age and deteriorating condition of old paper copies of Gazettes held by the SLP.
Copy quality of older Government Gazettes has impeded the take-up rate. However, this project is planned to be continued as resources allow, until all Gazettes have been scanned.
Reprints Program
The reprints program continued over the past financial year and is undertaken jointly with the Parliamentary Counsel’s Office. A total of 111 titles of legislation were consolidated and reprinted for the financial year-to-date.
Titles that have extensive amendments and are in high demand are fast tracked through the reprint process. The selling price of titles is reduced significantly, and titles become far more ‘user friendly’ with all amendments being consolidated. Due to many ‘in-demand’ legislation titles changing on a constant basis, this initiative will continue for the foreseeable future.
Parliamentary SupportTabled PapersDuring the year, the SLP assisted the Parliament with the development and the implementation of a project to capture all tabled papers and make these available for online access, for the purpose of making information more easily accessible by the citizens of Western Australia.
Previously, only some papers tabled were captured and made available; however, the Presiding Officers and Clerks of both Houses of Parliament expressed a desire to capture all tabled papers and make these available online.
All tabled papers for both Houses of Parliament are now captured in electronic form wherever possible and attached to the database by the SLP. Where material is not available electronically, papers will be scanned and converted to electronic format to be added to the database.
Page 28 | DPC Annual Report 2010–2011
Management of Exhibitions and Programs at the Constitutional Centre
The Constitutional Centre (the Centre), unique in Australia, is responsible for helping to educate the community on the Western Australian and Commonwealth Constitutions, and the Federal system of government.
School Education Programs
In addition to the programs conducted in the metropolitan area, the Centre continues to take programs to regional areas of the State with Education Officers visiting areas not covered by current regional staffing. Programs are targeted at primary and secondary students and include free civics education and teacher resources. Since the Centre opened in October 1997, around 95,000 country students and 250,000 metropolitan students have participated in these programs.
As part of CHOGM 2011, the Centre developed and delivered a schools program for years 6–10. For the six months to 30 June 2011, around 12,000 students have undertaken the program. Education staff have visited Esperance, Broome, Port Hedland, Karratha, Kalgoorlie and Geraldton as part of this program, with more regional visits scheduled between July and October. Materials and programs for remote and regional schools continued to be distributed on a loan basis throughout the State.
Public Programs
During the year, the Centre hosted public forums and debates, including ‘The Role of the CCC in the Constitutional System of Western Australia’, ‘Changing Constitutions: Referenda’ and an examination of the High Court decision in the Totani case, ‘State Courts: Independence at last?: Totani.’
The published proceedings of the 2010 forum, ‘Planning for a Republic: The Legal Mechanic’s Perspective’, entitled Constitutional Perspectives on an Australian Republic was launched at the Centre.
The Centre also hosted ‘Behind the Lines’, an exhibition from the National Museum of Australia, exhibiting the year’s best political cartoons from 2010, and the Mature Adults Learning Association that conducted two ten-week seasons of adult education at the Centre.
Website
Traffic on the Centre’s website continues to increase as schools use it as a key teaching resource for civics education programs. With the inclusion of CHOGM resources for schools on the website, nearly two million pages of information were downloaded, which is an increase of around 72 per cent on the previous year.
Other Areas of Responsibility
The Centre is also responsible for maintenance of the ANZAC Website and War Memorial Register. The website, www.anzac.dpc.wa.gov.au, contains the Western Australian Memorial Register — a comprehensive database of 321 war memorials throughout the State. In each entry, there is a description of the memorial and a list of those people commemorated.

DPC Annual Report 2010–2011 | Page 29
Visitors and website usage figures
Visitor figures for the Centre to 30 June 2011
85,284. This is an increase of over 20,000 on the previous year and has occurred in schools programs as a result of the Federal election in 2010 and the Schools CHOGM programs being run State-wide. Additional funding was provided for the CHOGM programs.
Website usage to 30 June 2011
1,893,809 pages downloaded. This is an increase of over 790,000 over the previous year — more than 70 per cent. Usage continues to grow and the sharp rise this year can be attributed to the CHOGM profiles that form part of the schools program being run by the Centre.
81,890
937,587
75,617
1,027,095
64,497
1,102,935
Public Programs Website
Constitutional CentreParticipants and Visitors
2007/08 2008/09 2009/10

Page 30 | DPC Annual Report 2010–2011
Service 2: Government Policy ManagementBuilding a sustainable not-for-profit sector
Partnership Forum
The Department provides executive support to the Partnership Forum, which was established in April 2010. The Forum first met on 16 July 2010, with meetings held quarterly. It is chaired by Professor Peter Shergold.
The purpose of the Partnership Forum is to bring together Directors General and Chief Executive Officers from State Government agencies and the community sector to address issues of mutual concern, and achieve beneficial outcomes for both sectors and for the community.
Over the past year, the Forum has guided a number of reforms to build a more mature relationship between the public and community sectors and deliver improved services and support for those disadvantaged and vulnerable in the Western Australian community. Reforms include:
development of Partnership Principles;
reviewing community sector funding;
development of an implementation and governance framework for funding and contracting reforms;
implementation of the Social Innovation Grants Program; and
initiatives to build capacity for social enterprise.
Sustainable Funding
The Department played the lead role through 2010-11 in the development of the State Government’s policy to sustainably fund the not-for-profit sector. The 2011–12 Budget provided additional funding of $604 million over four years, which was provided to ensure a sustainable not-for-profit sector and to address a shortfall in the amount paid by Government to the sector for the services they provide. This funding comprised:
$491 million, to provide a funding increase to service agreements with the not-for-profit sector, resulting in an average 25 per cent increase to contracts by 2014–15;
$96 million, to continue the Non-Government Human Services Sector Indexation Policy for payments to not-for-profit organisations, recognising the ongoing growth in costs for the not-for-profit sector; and
$18 million, for education, training and support to the public and not-for-profit sectors to ensure the delivery of significant ongoing benefits through streamlined administrative arrangements.

DPC Annual Report 2010–2011 | Page 31
Sustainable Contracting
The Delivering Community Services in Partnership Policy (the Policy) has been developed to improve outcomes for all Western Australians by building and supporting a more mature contracting relationship between the public and not-for-profit sectors. The Policy became effective from 1 July 2011.
Key aspects of the Policy include:
emphasising the need to establish a genuine partnership between government agencies and the not-for-profit sector;
Partnership Forum oversight of the governance of the Policy and its implementation by the public and not-for-profit sectors;
providing an overview of the funding and contracting options available and guidance on when each should be used — to give clarity to the distinction between grants and service agreements;
moving from funding not-for-profit organisations and prescribing inputs, services and costs in contracts, to a focus on achievement of outcomes, delivery of outputs and sustainable prices;
highlighting the need to reduce the unnecessary administrative burden in contracting activities; and
central agency support and guidance to government agencies and not-for-profit organisations in implementing the Policy.
Social Innovation Grants Program
The Social Innovation Grants Program (the Program) was launched in January 2011. The Program recognises the importance of social innovation in Western Australia and the need to develop new ways of delivering services to meet the diverse and complex needs of our community.
The Program provides one-off grants to not-for-profit community sector organisations to develop and trial new ways of delivering community services that produce better outcomes for Western Australians in need.
The Department played a pivotal role in the establishment of the Program through 2010–11, with administration of the Program having been assigned to the Department for Communities.
On 13 July 2011, the Hon Robyn McSweeney MLC, Minister for Community Services, announced the nine successful proposals from the first round of applications.
DPC Annual Report 2010–2011 | Page 31
Page 32 | DPC Annual Report 2010–2011
Natural Disaster Response and AssistanceThe Department has been directly involved in responding to a number of natural disasters during 2010–11.
December 2009 Toodyay Bushfire
In October 2010, the Premier announced a further financial assistance package of up to $10 million for residents directly affected by the December 2009 Toodyay bushfire. The assistance package was jointly funded by the State Government and Western Power, and was managed on the Government’s behalf by the RiskCover Division of the Insurance Commission of Western Australia.
The Department played a lead role in development of the package and, throughout the year, assumed responsibility for ensuring that all claims for assistance were finalised promptly.
January 2011 Lake Clifton Bushfire and February 2011 Roleystone Bushfire
Assistance packages arising from bushfires at Lake Clifton on 1 January 2011 and at Roleystone on the weekend of 5 and 6 February 2011 were also administered by the Department, and most assistance claims had been processed by 30 June.
Arising from the Roleystone fire, the Premier announced an independent review of bushfire risk management in the Perth Hills area. The Department provided full executive and administrative assistance to Mr Mick Keelty AO APM, who conducted the review.
December 2010 Carnarvon/Gascoyne Junction Floods
In December 2010, an unprecedented flooding of the Gascoyne River caused widespread damage to houses, properties and businesses in Carnarvon and Gascoyne Junction. The Department assumed the role of State Recovery Coordinator under the State Government’s natural disaster arrangements and played an important role in ensuring a coordinated relief effort by State and local government and by non-government organisations.

DPC Annual Report 2010–2011 | Page 33
Kimberley Science and Conservation StrategyThe Department has coordinated the development of the Kimberley Science and Conservation Strategy (the Strategy), an election commitment of the Liberal National Government designed to protect the Kimberley’s natural and cultural heritage while allowing the region to fulfil its economic potential. The Kimberley is recognised as one of Australia’s 15 National Biodiversity Hotspots and its marine environment is internationally renowned as one of the world’s most pristine and ecologically diverse.
The Department developed the Strategy through 2010–11 in close cooperation with the Departments of Environment and Conservation; Mines and Petroleum; Fisheries; Regional Development and Lands; Commerce; Indigenous Affairs; and Tourism WA.
On 17 June 2011, the Premier and the Minister for Environment announced the State Government’s commitment of $62.6 million over five years to implement the Strategy’s initiatives, including:
four new marine parks;
a new national park and additional terrestrial conservation reserves;
extensive investment in partnerships delivering fire management, feral animal and weed control at a landscape scale;
training and employment opportunities for Aboriginal rangers and initiatives to assist Indigenous tourism businesses;
a major marine science research program involving the Western Australian Marine Science Institute; and
additional funding for tourism initiatives and rock art research.
The Department will continue to play a key coordination role in the implementation of the Strategy.
Approvals ReformThe Department provided support for the Ministerial Taskforce on Approvals, Development and Sustainability (the Taskforce). Through the Director General Working Group and the Land Availability Working Group, the Taskforce developed and implemented initiatives to improve and streamline the State’s approvals processes so that the pace of economic growth is sustained and its benefits shared by all Western Australians.
Achievements through the Taskforce over the past 12 months include:
consolidation of the Lead Agency Framework which provides transparency, efficiency, and assistance to proponents by nominating an agency to lead in assisting proponents. Currently, 111 projects operate under the Lead Agency Framework;
a revised Framework Guideline published on agency web pages;
strengthening of the Environmental Protection Authority through creation of the Office of Environmental Protection Authority; and
legislative amendments to streamline approvals processes, including amendments to:
the Mining Act 1978;
the Planning and Development Act 2005; and
the Environmental Protection Act 1986.

Page 34 | DPC Annual Report 2010–2011
Other major initiatives on which substantial progress has been made through 2010–11 include:
the Statutory Approvals Tracking System (StATS), which will centralise the tracking and reporting of approvals applications and improve agency accountability and transparency for proponents, has entered the implementation and testing phase with cross-agency support; and
the drafting of an Offset Policy that outlines a process for protecting matters of national and State environmental significance. The Policy is currently being considered by the Minister for Environment and the Department is conducting targeted consultations with key stakeholders.
Land and Housing Availability
Population growth and major resource projects are expected to maintain pressure on the supply of land and associated infrastructure into the long-term. The Department plays a central role with the Land Availability Working Group, which was established to provide a mechanism for a coordinated approach to land development across State Government.
Initiatives overseen by the Working Group through 2010-11 include:
relocation of the Port Hedland Waste Water Treatment Plant and development of residential land in East Port Hedland;
monitoring the progress of land developments at Keralup and Golden Bay to ensure continuity of supply;
supporting the establishment of Pilbara Cities, delivering key initiatives in housing and infrastructure development in the Pilbara; and
developing land and housing indicators to monitor performance and ensure timely delivery of land and housing developments.
Strategic Assessment of the Swan Coastal Plain
In the last three years,15 urban developments in Western Australia, including the Perth and Peel regions of the Swan Coastal plain, have required assessment and approvals arising from matters of national environmental significance (MNES) under the Commonwealth Environment Protection and Biodiversity Conservation Act 1999.
In August 2010, the Government approved negotiations with the Commonwealth on the formulation of a strategic assessment of MNES within the Perth and Peel regions. The Department played a lead role, along with the Departments of Environment and Conservation and Planning.
A draft agreement has now been signed, signifying the intent of the State and Commonwealth Governments to develop a plan to protect MNES and address the actual and potential impacts of development in the Peel and Perth regions. Directions 2031 — Spatial Framework for Perth and Peel provides the broad planning framework.
Intergovernmental RelationsIn 2010–11, the Intergovernmental Relations Unit of the Department supported the Premier for meetings of COAG and Council for Australian Federation.
In 2010-11, there were two meetings of the COAG and two meetings of the Council for Australian Federation.
A range of initiatives were considered by COAG out-of-session.
Six new National Partnership agreements were signed.

DPC Annual Report 2010–2011 | Page 35
The Department coordinated Western Australia’s implementation of COAG agreements through State agencies and provided the formal point of contact for the State’s responses to the COAG Reform Council. This included coordinating State input and comment on 11 reports published by the Council in 2010–11.
In 2010-11, the Department continued to provide support to agencies in promoting Western Australia as a centre for defence industry development, defence servicing and an operational hub. The Department facilitates the Defence Consultative Forum to further strengthen the relationship between Defence and State Government agencies. The coordination of the State Government’s input into Commonwealth consultation on international instruments, including United Nation treaties and free trade agreements was also conducted by the Department.
The Department led negotiations with the Commonwealth in respect to State Government agencies providing services to asylum seekers held in Commonwealth detention centres in Western Australia. Service agreements are being negotiated for provision of education services, child protection, health, police and emergency services.
COAG Health Reform
Following the February 2011 COAG in-principle agreement on national health reform, the Department has supported negotiation of new national arrangements for the transparency, governance and financing of the health and hospital system.
Western Australia had previously rejected health reform proposals requiring Commonwealth retention of the GST, and the associated governance arrangements. The Heads of Agreement reached at the February COAG meeting removed the GST retention requirement and agreed, in principle, to a national funding pool arrangement. This cleared the way for Western Australia to receive $352 million funding for additional hospital services.
The Department managed the subsequent negotiations, seeking to avoid Commonwealth control over or regulation of State funds, both operationally and legislatively, and to ensure functionality for the State’s role in planning, purchasing and delivering public hospital services to Western Australians.
Detailed functional arrangements were developed and new national health reform arrangements were agreed to by all States in August 2011.
Native TitleOn 1 April 2011, the former Office of Native Title was transferred to the Department from the Department of the Attorney General. This recognised Native Title as a fundamental feature of project approvals in Western Australia and that there is scope for greater alignment between Native Title policy and other elements of the approvals process.
The Attorney General continues to be responsible for issues related to Native Title.
The Department has been represented on the Browse Development Group, a high-level State Government committee responsible for overseeing the development of an LNG Precinct for the processing of the Browse Basin reserves at James Price Point on the Dampier Peninsula, 60 km north of Broome.
The Department also plays a key role on the State Government’s negotiation team with the Goolarabooloo Jabirr Jabirr people. Due to successive deadlines for finalisation not being met, on 2 September 2010 the Western Australian Government commenced a land acquisition process to ensure land is available for the Precinct in the required timeframe.
DPC Annual Report 2010–2011 | Page 35

Page 36 | DPC Annual Report 2010–2011
On 6 May 2011, the Goolarabooloo Jabirr Jabirr Native Title party voted to accept the State Government’s and Woodside’s offer and benefits package for the establishment of the Precinct. The Premier and representatives of the Goolarabooloo Jabirr Jabirr people signed and executed agreements on 28 June 2011.
Since April 2011, the priorities for Native Title policy development have been to:
renew emphasis on whole-of-government consultation as part of the negotiation process to resolve Native Title claims; and
apply consistent policies and practices by all Government agencies involved in the management of their obligations under the Aboriginal Heritage Act 1972.
By 30 June 2011, these priorities saw significant progress on the development of a draft Government Indigenous Land Use Agreement to preserve State land interests in Native Title negotiations and on a draft Government Standard Heritage Agreement for use by all government agencies in cultural heritage surveys.
Justice Gilmour delivering the Dambimangari Traditional Owners a copy of the determination recognising their Native Title rights (May 2011).
DPC Annual Report 2010–2011 | Page 37
Reform of State Superannuation On 15 April 2010, the Treasurer announced that the Government had accepted all recommendations of the Whithear Report into Public Sector Superannuation arrangements for the Western Australian State Government.
The Whithear Report found that a proposed mutualisation of the Government Employees Superannuation Board (GESB) was not in the best interests of GESB members or the State, and recommended an alternative model to enable Western Australian public sector employees to have a choice in their superannuation fund. This will refocus GESB to its core business of managing State superannuation schemes and overseeing the delivery of superannuation services to public sector employees and employers.
A Superannuation Reform Implementation Steering Group was established by the Treasurer to oversee the implementation. This Steering Group has been chaired by the Department, which also provided executive and administrative support to it.
The Steering Group comprises senior representatives from the Department of Treasury and Finance, GESB, the Department of Commerce, the Public Sector Commission, the State Solicitor’s Office and UnionsWA. The Group has overseen the establishment of 11 separate projects to address the 18 recommendations of the Whithear Report and is working towards full implementation of all recommendations by March 2012.
Major Projects and State AgreementsNew Perth StadiumOn 28 June 2011, the Premier and the Minister for Sport and Recreation announced Burswood Peninsula as the preferred site for Perth’s new multi-purpose stadium. The Department is participating on the steering committee established to oversee the project with planned completion by 2018.
State Agreements — Iron Ore RoyaltiesDuring 2010, the Department played a lead role in negotiating amendments to State Agreements with BHP Billiton Limited (BHP Billiton) and Rio Tinto Limited (Rio Tinto) that secured increases in iron ore royalty rates paid to the State.
A non-binding Heads of Agreement (HoA) between the State Government and BHP Billiton and Rio Tinto was signed on 21 June 2010, setting out a series of principles and agreed actions to allow the companies to integrate their iron ore production operations in the Pilbara. As part of this HoA, the Iron Ore Agreements Legislation Amendment Act 2010 was granted Royal Assent on 26 August 2010. The Act applied retrospectively to all iron ore production by these companies from July 2010, removing the concessional royalty rates dating back to the 1960s.
The Department managed the ensuing negotiations between the State Government and the companies to vary 12 of their State Agreements to facilitate the rapid expansion of their Pilbara operations and ensure the continuation and enhancement of important and long standing iron ore mining and export operations in this State. Royal Assent was granted to the Iron Ore Agreements Legislation Amendment Act (No 2) 2010 on 10 December 2010, and as agreed in the HoA, BHP Billiton and Rio Tinto made a one-off payment of $350 million to Consolidated Revenue. These monies will assist in the funding of the State’s new Children’s Hospital.

Page 38 | DPC Annual Report 2010–2011
Support for the functions of Cabinet, Executive Council and Parliament
The Cabinet Secretariat staff provided procedural, operational and other services to the Cabinet, including:
programming Cabinet business and setting agendas;
supporting the operation of the Executive Council;
supporting the management of parliamentary business and the legislative program of the Government; and
administrative support to the Economic and Expenditure Reform Cabinet Sub-Committee (EERC).
CabinetThe Cabinet Secretariat continued to:
monitor submissions presented to Cabinet to ensure that they conform with the guidelines set down in the Cabinet Handbook;
ensure that Cabinet members have information relating to issues that may impact on one or more of their agencies through the Cabinet referral process;
provide advice to Ministers, departments and agencies on Cabinet operations and requirements;
record and distribute Cabinet submissions and decisions in a secure manner; and
monitor and record appointments to Government boards and committees and maintain a register of people who have expressed an interest in being appointed to a Government board or committee.
Support was provided for 47 Cabinet meetings, including regional meetings in Merredin, Karratha, Kalgoorlie and Peel. Cabinet considered a total of 856 submissions. Peel Regional Cabinet in session

DPC Annual Report 2010–2011 | Page 39
Government Bills passed 1999–2011
Questions With and Without Notice 1999–2011
Executive CouncilThe services provided include:
supporting the operation of the Executive Council, including 26 regular Executive Council meetings and seven extraordinary meetings at which 792 submissions were considered;
facilitating reconstitutions of the Ministry on 22 November 2010 and 14 December 2010;
arranging the appointment of Parliamentary Secretaries on 4 December 2010; and
coordinating arrangements for the conclusion of the Governor of Western Australia’s term of office, and the appointment of his successor.
Parliament Support was also provided to the Government’s legislative program, including Secretariat support for the Legislation Standing Committee of Cabinet. The Cabinet Secretariat managed the Parliamentary Questions database, coordinating responses to 3,994 Parliamentary Questions on Notice and 1,956 Parliamentary Questions Without Notice.
The 2010 Spring Sittings commenced on 10 August 2010, and the 2011 Autumn sittings concluded on 30 June 2011. Sixty six Government Bills were passed during the year.
Economic and Expenditure Reform Cabinet Sub-CommitteeThe EERC met on 18 occasions and made four determinations out-of-session. It considered 153 reports, including 74 submissions from Ministers. Twenty five matters were also considered by the Treasurer under his delegated authority.
0
500
1000
1500
2000
2500
3000
3500
4000
4500
5000
Questions Without Notice
Questions on Notice
0
10
20
30
40
50
60
70
80
90
Government Bills Passed 1998-2011
Government Bills Passed 1998-2011
DPC Annual Report 2010–2011 | Page 39
Page 40 | DPC Annual Report 2010–2011
Emergency management policy advice, and management and coordination of significant security incidents and emergencies
The Office of State Security and Emergency Coordination (the Office):
Provides advice and support to the Premier on matters associated with security planning and emergency management in Western Australia.
Has representation on the State Emergency Management Committee, the National Counter-Terrorism Committee, the National Emergency Management Committee and a number of related working groups.
Works in partnership with Western Australia Police to ensure that the State meets its obligations under national counter-terrorism arrangements.
Significant areas of work for 2010–11 have included:
Bushfire Relief
Following bushfires at Lake Clifton and in the Perth Hills, the Office liaised with the Shire of Waroona (Lake Clifton) and the City of Armadale (Perth Hills) in regard to the support payments.
The Office also represented the Government on the City of Armadale’s Local Recovery Committee’s Financial Sub-Committee, which was established to make recommendations regarding the distribution of money donated to the Lord Mayor’s Distress Relief Fund.
Bushfire Review
The Office supported the independent review into the Department of Environment and Conservation’s capability to manage major fires, in keeping with recommendations made by the Coroner following the inquest into the 2007 Boorabbin fires, which reported in September 2010.
Flood Relief
Following flooding of the Gascoyne River in December 2010, the Office provided administrative support to the State Recovery Coordinator, appointed to coordinate recovery/restoration activity within the affected area.
Influenza pandemic planning
The Office participated in the State’s review of influenza pandemic planning in light of the experience of the 2009-10 H¹N¹ influenza pandemic, and revised whole-of-government planning and information material.

DPC Annual Report 2010–2011 | Page 41
Commonwealth Heads of Government Meeting (CHOGM)
The Australian Government will host the next CHOGM in Perth from 28-30 October 2011.
The event comprises a series of discussions and forums culminating in a meeting of Heads of Government from the Commonwealth member nations.
While responsibility for hosting CHOGM 2011 rests with the Australian Government, the Western Australian Government will play a major supporting role through the provision of key services, including some aspects of event security, health and emergency services and traffic management, as well as managing some CHOGM-related activities. The Western Australian Government is also organising a number of artistic, cultural and sporting events to coincide with CHOGM 2011.
The Office coordinated the Department’s oversight of the Western Australian Government’s involvement in the event, and facilitated interaction between the Australian and Western Australian Governments and their agencies.
Work was guided by the State Government’s objectives for CHOGM 2011:
A uniquely Western Australian experience for delegates
Maximum exposure of Western Australia
Community and business participation in CHOGM events
The Western Australian community develops a better understanding of the Commonwealth
A safe and secure event

Page 42 | DPC Annual Report 2010–2011
Disclosures and Legal Compliance
Financial Statements

DPC Annual Report 2010–2011 | Page 43
Opinion of the Auditor General
Auditor General
Page 1 of 2
4th Floor Dumas House 2 Havelock Street West Perth 6005 Western Australia Tel: 08 9222 7500 Fax: 08 9322 5664
INDEPENDENT AUDITOR’S REPORT To the Parliament of Western Australia DEPARTMENT OF THE PREMIER AND CABINET Report on the Financial Statements I have audited the accounts and financial statements of the Department of the Premier and Cabinet. The financial statements comprise the Statement of Financial Position as at 30 June 2011, the Statement of Comprehensive Income, Statement of Changes in Equity, Statement of Cash Flows, Schedule of Income and Expenses by Service, Schedule of Assets and Liabilities by Service, and Summary of Consolidated Account Appropriations and Income Estimates for the year then ended, and Notes comprising a summary of significant accounting policies and other explanatory information. Director General’s Responsibility for the Financial Statements The Director General is responsible for keeping proper accounts, and the preparation and fair presentation of the financial statements in accordance with Australian Accounting Standards and the Treasurer’s Instructions, and for such internal control as the Director General determines is necessary to enable the preparation of financial statements that are free from material misstatement, whether due to fraud or error. Auditor’s Responsibility As required by the Auditor General Act 2006, my responsibility is to express an opinion on the financial statements based on my audit. The audit was conducted in accordance with Australian Auditing Standards. Those Standards require compliance with relevant ethical requirements relating to audit engagements and that the audit be planned and performed to obtain reasonable assurance about whether the financial statements are free from material misstatement. An audit involves performing procedures to obtain audit evidence about the amounts and disclosures in the financial statements. The procedures selected depend on the auditor’s judgement, including the assessment of the risks of material misstatement of the financial statements, whether due to fraud or error. In making those risk assessments, the auditor considers internal control relevant to the Department’s preparation and fair presentation of the financial statements in order to design audit procedures that are appropriate in the circumstances. An audit also includes evaluating the appropriateness of the accounting policies used and the reasonableness of accounting estimates made by the Director General, as well as evaluating the overall presentation of the financial statements. I believe that the audit evidence obtained is sufficient and appropriate to provide a basis for my audit opinion. Opinion In my opinion, the financial statements are based on proper accounts and present fairly, in all material respects, the financial position of the Department of the Premier and Cabinet at 30 June 2011 and its financial performance and cash flows for the year then ended. They are in accordance with Australian Accounting Standards and the Treasurer’s Instructions.
Page 2 of 2
Department of the Premier and Cabinet Report on Controls I have audited the controls exercised by the Department of the Premier and Cabinet. The Director General is responsible for ensuring that adequate control is maintained over the receipt, expenditure and investment of money, the acquisition and disposal of public and other property, and the incurring of liabilities in accordance with the Financial Management Act 2006 and the Treasurer’s Instructions, and other relevant written law. As required by the Auditor General Act 2006, my responsibility is to express an opinion on the controls exercised by the Director General based on my audit conducted in accordance with Australian Auditing Standards. Opinion In my opinion, the controls exercised by the Department of the Premier and Cabinet are sufficiently adequate to provide reasonable assurance that the receipt, expenditure and investment of money, the acquisition and disposal of property, and the incurring of liabilities have been in accordance with legislative provisions. Report on the Key Performance Indicators I have audited the key performance indicators of the Department of the Premier and Cabinet. The Director General is responsible for the preparation and fair presentation of the key performance indicators in accordance with the Financial Management Act 2006 and the Treasurer’s Instructions. As required by the Auditor General Act 2006, my responsibility is to express an opinion on the key performance indicators based on my audit conducted in accordance with Australian Auditing Standards. Opinion In my opinion, the key performance indicators of the Department of the Premier and Cabinet are relevant and appropriate to assist users to assess the Department’s performance and fairly represent indicated performance for the year ended 30 June 2011. Independence In conducting this audit, I have complied with the independence requirements of the Auditor General Act 2006 and the Australian Auditing Standards, and other relevant ethical requirements.
COLIN MURPHY AUDITOR GENERAL 9 September 2011
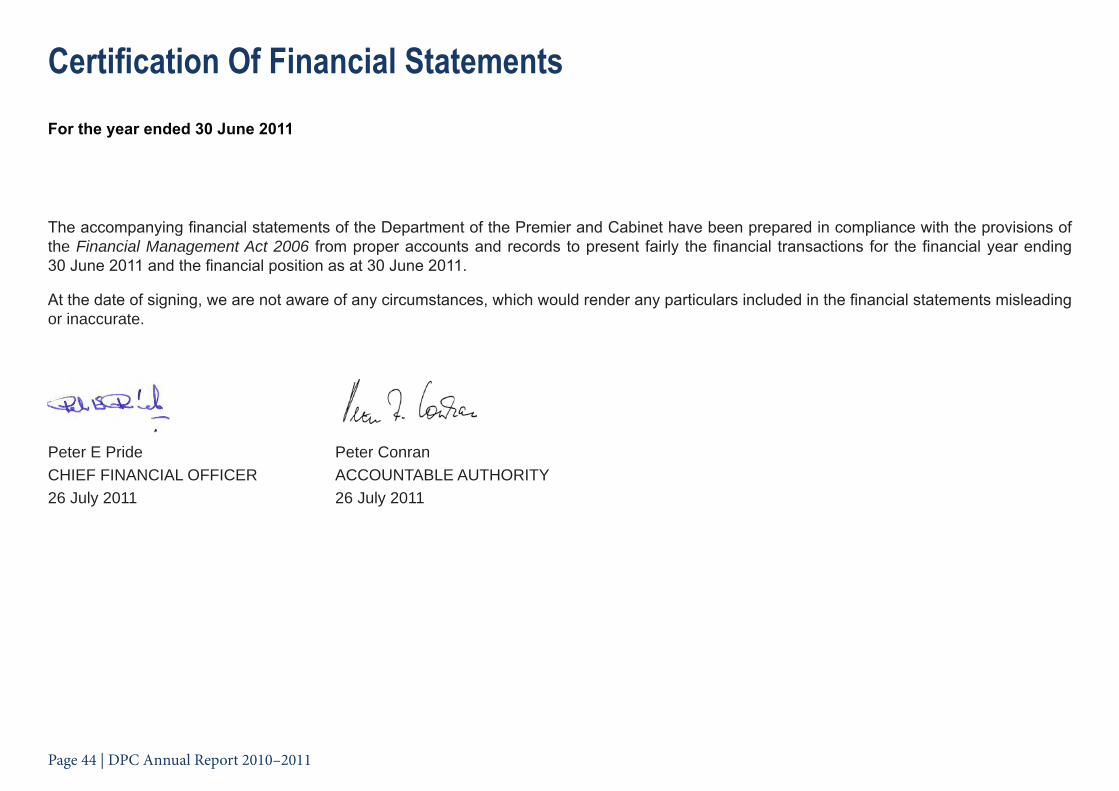
Page 44 | DPC Annual Report 2010–2011
Certification Of Financial StatementsFor the year ended 30 June 2011
The accompanying financial statements of the Department of the Premier and Cabinet have been prepared in compliance with the provisions of the Financial Management Act 2006 from proper accounts and records to present fairly the financial transactions for the financial year ending 30 June 2011 and the financial position as at 30 June 2011.
At the date of signing, we are not aware of any circumstances, which would render any particulars included in the financial statements misleading or inaccurate.
Peter E Pride Peter ConranCHIEF FINANCIAL OFFICER ACCOUNTABLE AUTHORITY26 July 2011 26 July 2011

DPC Annual Report 2010–2011 | Page 45
Statement of Comprehensive Incomefor the year ended 30 June 2011
Note 2011$000
2010$000
COST OF SERVICESExpensesEmployee benefits expense 6 67,523 62,028
Supplies and services 7 25,248 24,194
Depreciation and amortisation expense 8 2,025 2,176
Accommodation expenses 9 18,023 18,527
Grants and subsidies 10 7,493 6,611
Loss on disposal of non-current assets 13 18 180
Losses on Foreign operation translation 322 79
Losses on Hedging 483 386
Other expenses 11 17 71
Total cost of services 121,152 114,252
IncomeRevenue
User charges and fees 12 2,442 2,711
Sales 1,310 1,182
Commonwealth grants and contributions 258 406
Total Revenue 4,010 4,299
Total income other than income from State Government 4,010 4,299
NET COST OF SERVICES 117,142 109,953
INCOME FROM STATE GOVERNMENTService appropriation 110,641 99,414
Resources received free of charge 1,658 1,499
Total income from State Government 14 112,299 100,913
SURPLUS/(DEFICIT) FOR THE PERIOD (4,843) (9,040)
OTHER COMPREHENSIVE INCOMEGain/(Losses) on Foreign exchange recognised directly in equity (2,974) (229)
Total other comprehensive income (2,974) (229)
TOTAL COMPREHENSIVE INCOME FOR THE PERIOD (7,818) (9,269)
Refer to the ‘Schedule of Income and Expenses by Service’. The Statement of Comprehensive Income should be read in conjunction with the accompanying notes.
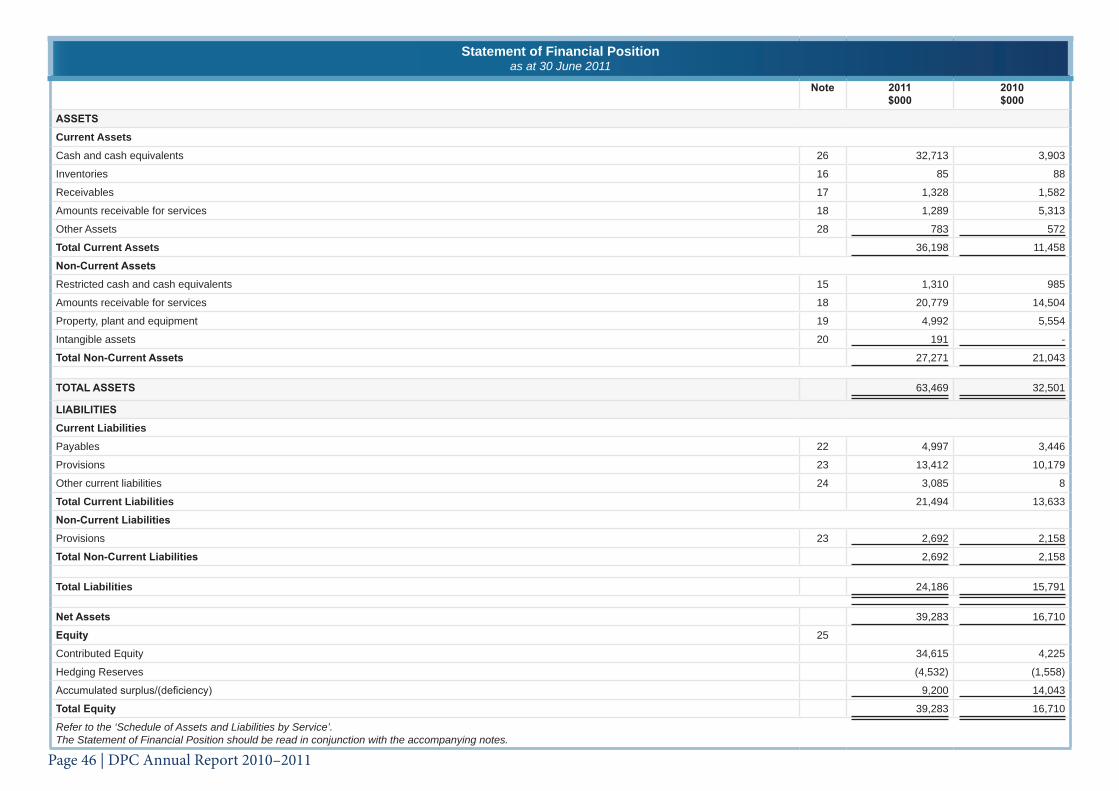
Page 46 | DPC Annual Report 2010–2011
Statement of Financial Positionas at 30 June 2011
Note 2011$000
2010$000
ASSETSCurrent AssetsCash and cash equivalents 26 32,713 3,903
Inventories 16 85 88
Receivables 17 1,328 1,582
Amounts receivable for services 18 1,289 5,313
Other Assets 28 783 572
Total Current Assets 36,198 11,458
Non-Current AssetsRestricted cash and cash equivalents 15 1,310 985
Amounts receivable for services 18 20,779 14,504
Property, plant and equipment 19 4,992 5,554
Intangible assets 20 191 -
Total Non-Current Assets 27,271 21,043
TOTAL ASSETS 63,469 32,501
LIABILITIESCurrent LiabilitiesPayables 22 4,997 3,446
Provisions 23 13,412 10,179
Other current liabilities 24 3,085 8
Total Current Liabilities 21,494 13,633
Non-Current LiabilitiesProvisions 23 2,692 2,158
Total Non-Current Liabilities 2,692 2,158
Total Liabilities 24,186 15,791
Net Assets 39,283 16,710
Equity 25
Contributed Equity 34,615 4,225
Hedging Reserves (4,532) (1,558)
Accumulated surplus/(deficiency) 9,200 14,043
Total Equity 39,283 16,710
Refer to the ‘Schedule of Assets and Liabilities by Service’.The Statement of Financial Position should be read in conjunction with the accompanying notes.

DPC Annual Report 2010–2011 | Page 47
Statement of Changes in Equityfor the year ended 30 June 2011
Note Contributedequity
Reserves AccumulatedSurplus/(deficit)
Totalequity
Balance at 1 July 2009 - (1,329) 23,083 21,754
Total comprehensive income for the year (229) (9,040) (9,269)
Transactions with owners in their capacity as owners: -
Capital appropriations -
Other contributions by owners 2,000 2,000
Distributions to owners 2,225 - 2,225
Changes in Accounting policy or correction of prior period errors -
Total 4,225 (229) (9,040) (5,044)
Balance at 30 June 2010 4,225 (1,558) 14,043 16,710
Balance at 1 July 2010Total comprehensive income for the year (2,974) (4,843) (7,817)
Transactions with owners in their capacity as owners: -
Capital appropriations -
Other contributions by owners 30,390 30,390
Distributions to owners - - -
Changes in Accounting policy or correction of prior period errors -
Total 30,390 (2,974) (4,843) 22,573
Balance at 30 June 2011 34,615 (4,532) 9,200 39,283
The Statement of Changes in Equity should be read in conjunction with the accompanying notes.

Page 48 | DPC Annual Report 2010–2011
Statement of Cash Flowsfor the year ended 30 June 2011
Note 2011$000
2010$000
CASH FLOWS FROM STATE GOVERNMENTService appropriation 107,283 94,973
Holding account drawdowns 2,059 3,481
Capital contributions - -
Non-retained revenue distributed to owners 30,116 (533)
Net cash provided by State Government 139,458 97,921
Utilised as follows:CASH FLOWS FROM OPERATING ACTIVITIESPaymentsEmployee benefits (64,375) (61,281)
Supplies and services (23,428) (22,582)
Accommodation (18,342) (18,300)
Grants and subsidies (7,109) (6,453)
GST payments on purchases (4,553) (4,907)
GST payments to taxation authority (667) (814)
ReceiptsUser charges and fees 1,676 1,487
Sales of goods and services 2,486 2,353
Commonwealth grants and contributions 339 325
GST receipts on sales 651 776
GST receipts from taxation authority 4,518 5,895
Net cash provided by/(used in) operating activities 26 (108,804) (103,501)
CASH FLOWS FROM INVESTING ACTIVITIESProceeds from the sale of non-current physical assets - 98
Purchase of non-current physical assets (1,255) (2,866)
Net cash provided by/(used in) investing activities (1,255) (2,768)
Net increase/(decrease) in cash and cash equivalents 29,399 (8,348)
Cash and cash equivalents at the beginning of period 4,888 13,329
Effects of exchange rate changes on cash balances held in foreign currency (264) (93)
CASH AND CASH EQUIVALENTS AT THE END OF PERIOD 26 34,023 4,888
The Statement of Cash Flows should be read in conjunction with the accompanying notes.

DPC Annual Report 2010–2011 | Page 49
Schedule of Income and Expenses by Servicefor the year ended 30 June 2011
Administration of ExecutiveGovernment Services
Government PolicyManagement
Total
2011$000
2010$000
2011$000
2010$000
2011$000
2010$000
COST OF SERVICESExpensesEmployee benefits expense 57,008 53,155 10,515 8,873 67,523 62,028
Supplies and services 22,124 22,047 3,124 2,147 25,248 24,194
Depreciation and amortisation expense 1,654 1,855 371 321 2,025 2,176
Accommodation expenses 16,057 16,751 1,966 1,776 18,023 18,527
Grants and subsidies 6,818 1,697 675 4,914 7,493 6,611
Loss on disposal of non-current assets 18 180 - - 18 180
Loss on foreign exchange 805 465 - - 805 465
Other expenses 14 65 3 6 17 71
Total cost of services 104,498 96,215 16,654 18,037 121,152 114,252
IncomeUser charges and fees 2,043 2,299 399 412 2,442 2,711
Sales 1,310 1,182 - - 1,310 1,182
Commonwealth grants and contributions - - 258 406 258 406
Total income other than income from State Government 3,353 3,481 657 818 4,010 4,299
NET COST OF SERVICES 101,145 92,734 15,997 17,219 117,142 109,953
INCOME FROM STATE GOVERNMENTService appropriation 95,439 83,498 15,202 15,916 110,641 99,414
Resources received free of charge 1,567 1,426 91 73 1,658 1,499
Total income from State Government 97,006 84,924 15,293 15,989 112,299 100,913
Surplus/(deficit) for the period (4,139) (7,810) (704) (1,230) (4,843) (9,040)

Page 50 | DPC Annual Report 2010–2011
Schedule of Assets and Liabilities by Serviceas at 30 June 2011
Administration of Executive Government Services Government Policy Management Total
2011$000
2010$000
2011$000
2010$000
2011$000
2010$000
ASSETSCurrent assets 32,480 10,561 3,718 897 36,198 11,458
Non-current assets 22,180 17,935 5,091 3,108 27,271 21,043
Total assets 54,660 28,496 8,809 4,005 63,469 32,501
LIABILITIESCurrent liabilities 17,217 11,171 4,277 2,463 21,494 13,634
Total non-current liabilities 2,128 1,733 564 424 2,692 2,157
Total Liabilities 19,345 12,904 4,841 2,887 24,186 15,791
NET ASSETS 35,315 15,592 3,968 1,118 39,283 16,710
The Schedule of Assets and Liabilities by Service should be read in conjunction with the accompanying notes.

DPC Annual Report 2010–2011 | Page 51
Summary of Consolidated Account Appropriations and Income Estimatesfor the year ended 30 June 2011
2011ESTIMATE
$000
2011ACTUAL
$000
VARIANCE$000
2011ACTUAL
$000
2010ACTUAL
$000
VARIANCE$000
DELIVERY OF SERVICESItem 5 Net amount appropriated to deliver services 105,907 103,847 2,060 103,847 97,621 6,226
Section 25 Transfer of service appropriation (a) - 4,925 (4,925) 4,925 - 4,925
Amount Authorised by Other Statutes
- Salaries and Allowances Act 1975 1,857 1,869 (12) 1,869 1,793 76
Total appropriations provided to deliver services 107,764 110,641 ( 2,877) 110,641 99,414 11,227
CAPITALItem 124 Capital Contribution - - - - - -
GRAND TOTAL 107,764 110,641 (2,877) 110,641 99,414 11,227
Details of Expenses by ServiceAdministration of Executive Government Services 99,414 104,498 (5,084) 104,498 96,215 8,283
Government Policy Management 14,282 16,654 (2,372) 16,654 18,037 (1,383)
Total Cost of Services 113,696 121,152 (7,456) 121,152 114,252 6,900
Less total income (3,588) (4,010) 422 (4,010) (4,299) 289
Net Cost of Services 110,108 117,142 (7,034) 117,142 109,953 7,189
Adjustments (2,344) (6,501) 4,157 (6,501) (10,539) 4,038
Total appropriations provided to deliver services 107,764 110,641 (2,877) 110,641 99,414 11,227
Capital ExpenditurePurchase of non-current physical assets 2,059 1,255 804 1,255 2,866 (1,611)
Adjustment for other funding sources (2,059) (1,255) (804) (1,255) (2,866) 1,611
Capital Contribution (appropriation) - - - - - -
Adjustments comprise movements in cash balances and other accrual items such as receivables, payables and superannuation.
Note 33 “Explanatory statement” provides details of any significant variations between estimates and actual results for 2011 and between the actual results for 2010 and 2011.
(a) AASB 1004.57 requires that where activities are transferred from one government agency to another government agency as a result of a restructure of administrative arrangements, the transferee government agency must disclose in the notes to the financial statements the expenses and revenues attributable to the transferred activities for the reporting period, showing separately those expenses and revenues recognised by the transferor government agency during the reporting period.
Page 52 | DPC Annual Report 2010–2011
NOTES TO THE FINANCIAL STATEMENTSfor the year ended 30 June 20111 Australian Accounting Standards
General
The Department’s financial statements for the year ended 30 June 2011 have been prepared in accordance with Australian Accounting Standards. The term ‘Australian Accounting Standards’ refers to Standards and Interpretations issued by the Australian Accounting Standard Board (AASB).
The Department has adopted any applicable, new and revised Australian Accounting Standards from their operative dates.
Early adoption of standards
The Department cannot make an early adoption of an Australian Accounting Standard unless specifically permitted by Treasurer’s Instruction (TI) 1101 Application of Australian Accounting Standards and Other Pronouncements. No Australian Accounting Standards that have been issued or amended, but are not operative, have been adopted early by the Department for the annual reporting period ended 30 June 2011.
2 Summary of Significant Accounting Policies(a) General Statement
The financial statements constitute general purpose financial statements that have been prepared in accordance with Australian Accounting Standards, the Framework, Statements of Accounting Concepts and other authoritative pronouncements of the Australian Accounting Standards Board as applied by the Treasurer’s Instructions. Several of these are modified by the Treasurer’s Instructions to vary application, disclosure, format and wording.
The Financial Management Act 2006 and the Treasurer’s Instructions are legislative provisions governing the preparation of financial statements and take precedence over Accounting Standards, the Framework, Statements of Accounting Concepts and other authoritative pronouncements of the Australian
Accounting Standards Board.
Where modification is required and has a material or significant financial effect upon the reported results, details of that modification and the resulting financial effect are disclosed in the notes to the financial statements.
(b) Basis of Preparation
The financial statements have been prepared on the accrual basis of accounting using the historical cost convention.
The accounting policies adopted in the preparation of the financial statements have been consistently applied throughout all periods presented unless otherwise stated.
The financial statements are presented in Australian dollars and all values are rounded to the nearest thousand dollars ($’000).
Note 4 ‘Judgements made by management in applying accounting policies’ discloses judgements that have been made in the process of applying the Department’s accounting policies that have the most significant effect on the amounts recognised in the financial statements.
Note 5 ‘Key sources of estimation uncertainty’ discloses key assumptions made concerning the future, and other key sources of estimation uncertainty at the end of the reporting period, that have a significant risk of causing a material adjustment to the carrying amounts of assets and liabilities within the next financial year.
(c) Reporting Entity
The reporting entity comprises the Department.
Mission
The Department’s mission is to support the Premier and Cabinet in achieving the Government’s vision for all Western Australians, through leadership and coordination and the promotion of excellence in the public sector.

DPC Annual Report 2010–2011 | Page 53
The Department is predominantly funded by Parliamentary appropriations. The financial statements encompass all funds through which the Department controls resources to carry on its functions.
Services
The Department provides the following services:
Service 1: Administration of Executive Government Services
Service 2: Government Policy Management
(d) Contributed Equity
AASB Interpretations 1038 ‘Contributions by Owners Made to Wholly-Owned Public Sector Entities’ requires transfers, other than as a result of a restructure of administrative arrangements, in the nature of equity contributions to be designated by the Government (the owner) as contributions by owners (at the time of, or prior to transfer) before such transfers can be recognised as equity contributions. Capital contributions (appropriations) have been designated as contributions by owners by Treasurer’s Instruction (TI) 955 “Contributions by Owners made to Wholly Owned Public Sector Entities” and have been credited directly to Contributed Equity.
Transfer of net assets to/from other agencies, other than as a result of a restructure of administrative arrangements, are designated as contributions by owners where the transfers are non-discretionary and non-reciprocal.
See note 25 “Equity”.
(e) Income
Revenue recognition
Revenue is recognised and measured at the fair value of consideration received or receivable. Revenue is recognised for the major business activities as follows:
Sale of goods
Revenue is recognised from the sale of goods and disposal of other assets when the significant risks and rewards of ownership control transfer to the purchaser and can be measured reliably.
Rendering of Services
Revenue is recognised upon the delivery of the service to the client or by reference to the stage of completion of the transaction.
Interest
Revenue is recognised as the interest accrues.
Service Appropriations
Service Appropriations are recognised as revenues in the period in which the Department gains control of the appropriated funds. The Department gains control of appropriated funds at the time those funds are deposited into the Department’s bank account or credited to the amounts receivable for services held at Treasury.
See note 14 “Income from State Government” for further detail.
Net Appropriation Determination
The Treasurer may make a determination providing for prescribed receipts to be retained for services under the control of the Department. In accordance with the determination specified in the 2010-2011 Budget Statements, the Department retained $9.670 million in 2011 ($10.934 million in 2010) from the following:
• Proceeds from fees and charges
• Other departmental revenue
• GST input credits
• GST receipts on sales
Grants, donations, gifts and other non-reciprocal contributions
Revenue is recognised at fair value when the Department obtains control over the assets comprising the contributions which is usually when cash is received.
Other non-reciprocal contributions that are not contributions by owners are recognised at their fair value. Contributions of services are only recognised when a fair value can be reliably determined and the services would be purchased if not donated.
Notes to the Financial Statements

Page 54 | DPC Annual Report 2010–2011
Gains
Gains may be realised or unrealised and are usually recognised on a net basis. These include gains arising on the disposal of non-current assets.
(f) Property, Plant and Equipment
Capitalisation/Expensing of assets
Items of property, plant and equipment costing $5,000 or more are recognised as assets and the cost of utilising assets is expensed (depreciated) over their useful lives. Items of property, plant and equipment costing less than $5,000 are immediately expensed direct to the statement of comprehensive income (other than where they form part of a group of similar items which are significant in total).
Initial recognition and measurement
All items of property, plant and equipment are initially recognised at cost.
For items of property, plant and equipment acquired at no cost or for nominal consideration, the cost is their fair value at the date of acquisition.
Subsequent measurement
The Department does not hold land, buildings or infrastructure assets. As such, items of property, plant and equipment are carried at historical cost less accumulated depreciation and accumulated impairment losses.
Depreciation
All non-current assets having a limited useful life are systematically depreciated over their estimated useful lives in a manner that reflects the consumption of their future economic benefits.
Depreciation is calculated using the straight line method, using rates which are reviewed annually. Estimated useful lives for each class of depreciable asset are:
Furniture and fittings 10 years Plant and equipment 5 years Computer hardware 3 years Office establishment 4 to 10 years
Works of art controlled by the Department are classified as property, plant and equipment. They are anticipated to have very long and indefinite useful lives. Their service potential has not, in any material sense, been consumed during the reporting period and so no depreciation has been recognised.
(g) Intangible Assets
Capitalisation/Expensing of assets
Acquisitions of intangible assets costing $5,000 or more and internally generated intangible assets costing $5,000 or more are capitalised. The cost of utilising the assets is expensed (amortised) over their useful life. Costs incurred below these thresholds are immediately expensed directly to the statement of comprehensive income.
All acquired and internally developed intangible assets are initially recognised at cost. For assets acquired at no cost or for nominal cost, the cost is their fair value at the date of acquisition.
The cost model is applied for subsequent measurement requiring the asset to be carried at cost less any accumulated amortisation and accumulated impairment losses.
Amortisation for intangible assets with finite useful lives is calculated for the period of the expected benefit (estimated useful life) on the straight line basis using rates which are reviewed annually. All intangible assets controlled by the Department have a finite useful life and zero residual value. The expected useful lives for each class of intangible asset are:
Software 3 Years
Computer Software
Software that is an integral part of the related hardware is treated as property, plant and equipment. Software that is not an integral part of the related hardware is treated as an intangible asset. Software costing less than $5,000 is expensed in the year of acquisition.
Website costs
Website costs are charged as expenses when they are incurred unless they relate to the acquisition or development of an asset when they may be capitalised and amortised. Generally, costs in relation to feasibility studies during the planning
Notes to the Financial Statements

DPC Annual Report 2010–2011 | Page 55
phase of a website, and ongoing costs of maintenance during the operating phase are expensed. Costs incurred in building or enhancing a website, to the extent that they represent probable future economic benefits that can be reliably measured, are capitalised.
(h) Impairment of Assets
Property, plant and equipment and intangible assets are tested for any indication of impairment at each balance sheet date. Where there is an indication of impairment, the recoverable amount is estimated. Where the recoverable amount is less than the carrying amount, the asset is considered impaired and is written down to the recoverable amount and an impairment loss is recognised. As the Department is a not-for-profit entity, unless an asset has been identified as a surplus asset, the recoverable amount is the higher of an asset’s fair value less costs to sell and depreciated replacement cost.
The risk of impairment is generally limited to circumstances where an asset’s depreciation is materially understated, where the replacement cost is falling or where there is a significant change in useful life. Each relevant class of assets is reviewed annually to verify that the accumulated depreciation/amortisation reflects the level of consumption or expiration of the asset’s future economic benefits and to evaluate any impairment risk from falling replacement costs.
Intangible assets with an indefinite useful life and intangible assets not yet available for use are tested for impairment at each balance sheet date irrespective of whether there is any indication of impairment.
The recoverable amount of assets identified as surplus assets is the higher of fair value less costs to sell and the present value of future cash flows expected to be derived from the asset. Surplus assets carried at fair value have no risk of material impairment where fair value is determined by reference to market-based evidence. Where fair value is determined by reference to depreciated replacement cost, surplus assets are at risk of impairment and the recoverable amount is measured. Surplus assets at cost are tested for indications of impairment at each balance sheet date.
See note 21 ‘Impairment of assets’ for the outcome of impairment reviews and testing.
See note 2(o) ‘Receivables’ and note 17 ‘Receivables’ for impairment of receivables.
(i) Leases
The Department has entered into a number of operating lease arrangements for the rent of aircraft, office buildings and motor vehicles where the lessor effectively retains all of the risks and benefits incidental to ownership of the items held under the operating leases. Equal instalments of the lease payments are charged to the Income Statement over the lease term as this is representative of the pattern of benefits to be derived from the leased property.
(j) Financial Instruments
In addition to cash, the Department has two categories of financial instruments:
Financial Assets
• Cash and cash equivalents• Restricted cash and cash equivalents• Receivable for services• Amount Receivable for services
Financial Liabilities
• Payables• Other liabilities
Initial recognition and measurement of financial instruments is at fair value which normally equates to the transaction cost or the face value. Subsequent measurement is at amortised cost using the effective interest method.
The fair value of short-term receivables and payables is the transaction cost or the face value because there is no interest applicable and subsequent measure is not required as the effect of discounting is not material.
The Department enters into derivative financial instruments to manage its exposure to foreign exchange rate risk, by way of foreign exchange forward contracts. Further details of derivative financial instruments are disclosed in note 35 to the financial statements.
Derivatives are initially recognised at fair value at the date a derivative contract is entered into and are subsequently remeasured to their fair value at each reporting date. The resulting gain or loss is recognised in profit or loss immediately unless the derivative is designated and effective as a hedging instrument, in which event, the timing of the recognition in profit or loss depends on the nature of the hedge
Notes to the Financial Statements

Page 56 | DPC Annual Report 2010–2011
relationship. The Department designates certain derivatives as either hedges of the fair value of recognised assets or liabilities or firm commitments (fair value hedges), hedges of highly probable forecast transactions or hedges of foreign currency risk of firm commitments (cash flow hedges), or hedges of net investments in foreign operations.
The fair value of hedging derivatives is classified as a non-current asset or a non-current liability if the remaining maturity of the hedge relationship is more than 12 months and as a current asset or a current liability if the remaining maturity of the hedge relationship is less than 12 months.
Derivatives not designated into an effective hedge relationship are classified as a current asset or a current liability.
Hedge accounting
The Department designates certain hedging instruments, which include derivatives, embedded derivatives and non-derivatives in respect of foreign currency risk, as either fair value hedges, cash flow hedges, or hedges of net investments in foreign operations.
“Hedges of foreign exchange risk on firm commitments and highly probable forecast transactions are accounted for as cash flow hedges. At the inception of the hedge relationship the Department documents the relationship between the hedging instrument and hedged item, along with its risk management objectives and its strategy for undertaking various hedge transactions. Furthermore, at the inception of the hedge and on an ongoing basis, the Department documents whether the hedging instrument that is used in a hedging relationship is highly effective in offsetting changes in fair values or cash flows of the hedged item.
Hedge accounting is discontinued when the Department revokes the hedging relationship, the hedging instrument expires or is sold, terminated, or exercised, or no longer qualifies for hedge accounting. Any cumulative gain or loss deferred in equity at that time remains in equity and is recognised when the forecast transaction is ultimately recognised in profit or loss. When a forecast transaction is no longer expected to occur, the cumulative gain or loss that was deferred in equity is recognised immediately in profit or loss.
Note 35 contains details of the fair values of the derivative instruments used for hedging purposes. Movements in the hedging reserve in equity are also detailed in note 25.
(k) Cash and Cash Equivalents
For the purpose of the Cash Flow Statement, cash and cash equivalent includes restricted cash and cash equivalents. These are comprised of cash on hand and short-term deposits with original maturities of three months or less that are readily convertible to a known amount of cash and which are subject to insignificant risk of changes in value.
(l) Accrued Salaries
The accrued salaries suspense account (see note 15 ‘Restricted cash and cash equivalents’) consists of amounts paid annually into a suspense account over a period of 10 financial years to largely meet the additional cash outflow in each 11th year when 27 pay days occur instead of the normal 26. No interest is received on this account.
Accrued salaries (refer note 22 “Payables”) represent the amount due to staff but unpaid at the end of the financial year, as the pay date for the last pay period for that financial year does not coincide with the end of the financial year. Accrued salaries are settled within a fortnight of the financial year end. The Department considers the carrying amount of accrued salaries to be equivalent to its net fair value.
(m) Amounts Receivable for Services (Holding Account)
The Department receives appropriation funding on an accrual basis that recognises the full annual cash and non-cash cost of services. The appropriations are paid partly in cash and partly as an asset (Holding Account receivable) that is accessible on the emergence of the cash funding requirement to cover items such as leave entitlements and asset replacement.
See also note 14 ‘Income from State Government’ and note 18 ‘Amounts receivable for services’.
(n) Inventories
Inventories are measured at the lower of cost and net realisable value. Costs are assigned by the method most appropriate to each particular class of inventory, with the majority being valued on a first in first out basis.
Inventories not held for resale are valued at cost unless they are no longer required, in which case they are valued at net realisable value.
See note 16 ‘Inventories’.
Notes to the Financial Statements

DPC Annual Report 2010–2011 | Page 57
(o) Receivables
Receivables are recognised and carried at original invoice amount less an allowance for uncollectible amounts (i.e. impairment). The collectability of receivables is reviewed on an ongoing basis and any receivables identified as uncollectible are written-off against the allowable amount. The allowance for uncollectible amounts (doubtful debts) is raised when there is objective evidence that the Department will not be able to collect the debts. The carrying amount is equivalent to fair value as it is due for settlement within 30 days.
See note 2(j) ‘Financial Instruments’ and note 17 ‘Receivables’.
(p) Payables
Payables are recognised when the Department becomes obliged to make future payments as a result of a purchase of assets or services. The carrying amount is equivalent to fair value, as they are generally settled within 30 days.
See note 2(j) ‘Financial Instruments’ and note 22 ‘Payables’.
(q) Provisions
Provisions are liabilities of uncertain timing and amount and are recognised where there is a present legal, equitable or constructive obligation as a result of a past event and when the outflow of resources embodying economic benefits is probable and a reliable estimate can be made of the amount of the obligation. Provisions are reviewed at each balance sheet date.
See note 23 ‘Provisions’.
(i) Provisions - Employee Benefits
All annual leave and long service leave provisions are in respect of employees’ services up to the end of the reporting period.
Annual leave
The liability for annual leave expected to be settled within 12 months after the reporting period is recognised and measured at the undiscounted amounts expected to be paid when the liability is settled.
Annual leave not expected to be settled within 12 months after the reporting period is recognised and measured at the present value of amounts expected to be paid when the liabilities are settled using the remuneration rate expected to apply at the time of settlement.
When assessing expected future payments, consideration is given to expected future wage and salary levels, including non-salary components such as employer superannuation contributions, as well as the experience of employee departures and periods of service. The expected future payments are discounted using market yields at the end of the reporting period on national government bonds with terms to maturity that match, as closely as possible, the estimated future cash outflows.
The provision for annual leave is classified as a current liability as the Department does not have an unconditional right to defer settlement of the liability for at least 12 months after the reporting period.
Long service leave
The liability for long service leave expected to be settled within 12 months after the reporting period is recognised and measured at the undiscounted amounts expected to be paid when the liability is settled.
Long service leave not expected to be settled within 12 months after the reporting period is recognised and measured at the present value of amounts expected to be paid when the liabilities are settled using the remuneration rate expected to apply at the time of settlement.
When assessing expected future payments consideration is given to expected future wage and salary levels, including non-salary components such as employer superannuation contributions, as well as the experience of employee departures and periods of service. The expected future payments are discounted using market yields at the end of the reporting period on national government bonds with terms to maturity that match, as closely as possible, the estimated future cash outflows.
Unconditional long service leave provisions are classified as current liabilities as the Department does not have an unconditional right to defer settlement of the liability for at least 12 months after the reporting period. Conditional long service leave provisions are classified as non-current liabilities because the Department has an unconditional right to defer the settlement of the liability until the employee has completed the requisite years of service.
Sick leave
Liabilities for sick leave are recognised when it is probable that sick leave paid in the future will be greater than the entitlement that will accrue in the future.
Past history indicates that on average, sick leave taken each reporting period is
Notes to the Financial Statements

Page 58 | DPC Annual Report 2010–2011
less than the entitlement accrued. This is expected to continue in future periods. Accordingly, it is unlikely that existing accumulated entitlements will be used by employees and no liability for unused sick leave entitlements is recognised. As sick leave is non-vesting, an expense is recognised in the Statement of Comprehensive Income for this leave as it is taken.
Deferred leave
The provision for deferred leave relates to Public Service employees who have entered into an agreement to self-fund an additional 12 months leave in the fifth year of the agreement. The provision recognises the value of salary set aside for employees to be used in the fifth year. This liability is measured on the same basis as annual leave. Deferred leave is reported as a non-current provision until the fifth year.
Purchased leave
The provision for purchased leave relates to Public Service employees who have entered into an agreement to self-fund up to an additional ten weeks leave per calendar year. The provision recognises the value of salary set aside for employees and is measured at the nominal amounts expected to be paid when the liabilities are settled. This liability is measured on the same basis as annual leave.
Superannuation
The Government Employees Superannuation Board (GESB) administers the following superannuation schemes.
Eligible employees contribute to the Pension Scheme, a defined benefit pension scheme closed to new members since 1987, or the Gold State Superannuation Scheme (GSS), a defined benefit lump sum scheme closed to new members since 1995.
The GSS is a defined benefit scheme for the purposes of employees and whole-of-government reporting. However, it is a defined contribution plan for agency purposes because the concurrent contributions (defined contributions made by the Department to GESB extinguishes the agency’s obligations to the related superannuation liability).
The Department has no liabilities under the Pension Scheme or the GSS. The liabilities for the unfunded Pension Scheme and the unfunded GSS transfer benefits attributable to members who transferred from the Pension Scheme, are assumed by the Treasurer. All other GSS obligations are funded by concurrent contributions made by the Department to the GESB.
Employees commencing employment prior to 16 April 2007, who were not members of either the Pension Scheme or the GSS, became non contributory members of the West State Superannuation Scheme (WSS). Employees commencing employment on or after 16 April 2007 became members of the GESB Super Scheme (GESBS). Both of these schemes are accumulation schemes. The Department makes concurrent contributions to GESB on behalf of employees in compliance with the Commonwealth Government’s Superannuation Guarantee (Administration) Act 1992. These contributions extinguish the liability for superannuation charges in respect of the WSS and GESBS.
The GESB makes all benefit payments in respect of the Pension and GSS Schemes, and is recouped by the Treasurer for the employer’s share.
See also note 2(r) ‘Superannuation Expense’.
(ii) Provisions - Other
Employment On-Costs
Employment on-costs, including workers’ compensation insurance, are not employee benefits and are recognised separately as liabilities and expenses when the employment to which they relate has occurred. Employment on-costs are included as part of ‘Other expenses’ and are not included as part of the Department’s ‘Employee benefits expense’. The related liability is included in ‘Employment on-costs provision’.
See note 11 ‘Other expenses and note 23 ‘Provisions’.
(r) Superannuation Expense
The superannuation expense in the Statement of Comprehensive Income comprises of employer contributions paid to the GSS (concurrent contributions), the WSS, and the GESBS. The employer contribution paid to the GESB in respect of the GSS is paid back into the Consolidated Account by the GESB.
(s) Resources Received Free of Charge or for Nominal Cost
Resources received free of charge or for nominal cost that can be reliably measured are recognised as income at fair value. Where the resource received represents a service that the Department would otherwise pay for, a corresponding expense is recognised. Receipts of assets are recognised in the Statement of Financial Position. Assets or services received from other State Government agencies are separately disclosed under Income from State Government in the statement of comprehensive income.
Notes to the Financial Statements

DPC Annual Report 2010–2011 | Page 59
(t) Comparative Figures
Comparative figures are, where appropriate, reclassified to be comparable with the figures presented in the current financial year.
(u) Foreign Currency Translation
The Department has offices in North Asia, Europe and the Middle East.
Transactions denominated in a foreign currency are translated at the rates in existence at the dates of the transactions. Monetary assets and liabilities denominated in foreign currencies are retranslated at the rate of exchange current at balance sheet date. Exchange gains and losses are brought to account in determining the result for the year.
3. Judgements Made by Management in Applying Accounting PoliciesThe judgements that have been used in the process of applying accounting policies have had no material effect on amounts recognised in the financial statements.
4. Key Sources of Estimation UncertaintyThe Department makes key estimates and assumptions concerning the future. These estimates and assumptions are based on historical experience and various other factors that have a significant risk of causing a material adjustment to the carrying amount of assets and liabilities within the next financial year.
Long Service Leave
In calculating the Department’s long service leave provision, several estimations and assumptions have been made. These include expected future salary rates, salary inflation, discount rates, employee retention rates and expected future payments. Any changes in these estimations and assumptions may impact on the carrying amount of the long service leave provision.
5. Disclosure of Change in Accounting Policy and EstimatesInitial Application of an Australian Accounting Standard
The Department has applied the following Australian Accounting Standards effective for annual reporting periods beginning on or after 1 July 2010 that impacted on the Department.
AASB 2009-5
Further Amendments to Australian Accounting Standards arising from the Annual Improvements Project [AASB 5, 8, 101, 107, 117, 118, 136 & 139]
Under amendments to AASB 117, the classification of land elements of all existing leases has been reassessed to determine whether they are in the nature of operating or finance leases. As leases of land and buildings recognised in the financial statements have not been found to significantly expose the Department to the risks/rewards attributable to control of land, no changes to accounting estimates have been included in the Financial Statements and Notes to the Financial Statements.
Under amendments to AASB 107, only expenditures that result in a recognised asset are eligible for classification as investing activities in the Statement of Cash Flows. All investing cashflows reported in the Department’s Statement of Cash Flows relate to increases in recognised assets.
Notes to the Financial Statements

Page 60 | DPC Annual Report 2010–2011
Future Impact of Australian Accounting Standards Not Yet Operative
The Department cannot early adopt an Australian Accounting Standard unless specifically permitted by TI 1101 Application of Australian Accounting Standards and Other Pronouncements. Consequently, the Department has not applied early any following Australian Accounting Standards that have been issued that may impact the Department. Where applicable, the Department plans to apply these Australian Accounting Standards from their application date.
Operativefor
reporting periodsbeginning on/after
AASB 2009-11 Amendments to Australian Accounting Standards arising from AASB 9 [AASB 1, 3, 4, 5, 7, 101, 102, 108, 112, 118, 121, 127, 128, 131, 132, 136, 139, 1023 & 1038 and Interpretations 10 & 12].
The amendment to AASB 7 requires modification to the disclosure of categories of financial assets. The Department does not expect any financial impact when the Standard is first applied. The disclosure of categories of financial assets in the notes will change.
1 Jan 2013
Operativefor
reporting periodsbeginning on/after
AASB 9 Financial Instruments
This Standard supersedes AASB 139 Financial Instruments: Recognition and Measurement, introducing a number of changes to accounting treatments.
The Standard was reissued on 6 Dec 2010 and the Department is currently determining the impact of the Standard. The Department of Treasury and Finance (DTF) has not yet determined the application or the potential impact of the Standard for agencies.
1 Jan 2013
AASB 2010-7 Amendments to Australian Accounting Standards arising from AASB 9 (December 2010) [AASB 1, 3, 4, 5, 7, 101, 102, 108, 112, 118, 120, 121, 127, 128, 131, 132, 136, 137, 139, 1023 & 1038 and Interpretations 2, 5, 10, 12, 19 & 127]
This Amending Standard makes consequential adjustments to other Standards as a result of issuing AASB 9 Financial Instruments in December 2010. DTF has not yet determined the application or the potential impact of the Standard for agencies.
1 Jan 2013
Notes to the Financial Statements

DPC Annual Report 2010–2011 | Page 61
6. Employee Benefits Expense2011$000
2010$000
Wages and salaries(a) 62,392 57,368
Superannuation - defined contribution plans(b) 5,131 4,660
67,523 62,028
(a) Includes the value of the fringe benefit to the employee plus the fringebenefits tax component, leave entitlements including superannuation contribution component.
(b) Defined contribution plans include West State, Gold State and GESB Super Scheme (contributions paid).
Employment on-costs expenses, such as workers’ compensation insurance are included at note 11 ‘Other expenses’. The employment on-costs liability is included at note 23 ‘Provisions’.
7. Supplies and Services2011$000
2010$000
Professional services 5,966 5,019
Consultants - 57
Travel 3,344 2,873
Other staff costs 324 347
Communications 1,817 1,977
Consumables 3,205 2,416
Lease of Aircraft 5,775 6,020
Lease of Motor Vehicle 2,205 2,586
Advertising 16 100
Other administration costs 2,596 2,799
25,248 24,194
8. Depreciation and Amortisation Expense2011$000
2010$000
DepreciationComputer hardware 224 177
Furniture and fittings 83 79
Motor vehicles 24 29
Office equipment 426 439
Office establishment 1,268 1,450
Total depreciation 2,025 2,174
AmortisationIntangible assets
Software - 2
Total amortisation - 2
Total depreciation and amortisation. 2,025 2,176
9. Accommodation Expenses2011$000
2010$000
Lease rentals and outgoings 18,023 18,527
18,023 18,527
10. Grants and Subsidies2011$000
2010$000
Recurrent
Subsidies and community grants 593 31
Government agency grants 2,309 5,054
External grants 4,591 1,526
7,493 6,611
Notes to the Financial Statements

Page 62 | DPC Annual Report 2010–2011
11. Other Expenses2011$000
2010$000
Employment on-costs 17 71
17 71
Includes workers’ compensation insurance and other employment on-costs. The on-costs liability associated with the recognition of annual and long service leave liability is included at note 23 ‘Provisions’. Superannuation contributions accrued as part of the provision for leave are employee benefits and are not included in employment on-costs.
12. User Charges and Fees2011$000
2010$000
Contributions by senior officers to the Government Vehicle Scheme 110 116
Provision of services 1,048 1,192
Recoups 832 994
Sponsorships - 6
Other revenue 452 403
2,442 2,711
13. Net Gain/(Loss) on Disposal of Non-current Assets2011$000
2010$000
Cost of Disposal of Non-Current Assets
Computer hardware and software - -
Artwork - 54
Motor Vehicles - 15
Office equipment 10 11
Office establishment 8 198
18 278
Proceeds from Disposal of Non-Current Assets
Motor Vehicles - 24
Office establishment (0) 74
(0) 98
Net gain/(loss) (18) (180)
14. Income from State Government2011$000
2010$000
Appropriation received during the year:
Service appropriations(a) 110,641 99,414
Resources received free of charge(b)
Determined on the basis of the following estimates provided by agencies:
Department of Education and Training - staff secondment 272 319
Department of Treasury and Finance - lease administration services 718 590
Department of the Attorney General - legal services 466 231
Department of Treasury and Finance - procurement services 186 180
Department of Water - 179
Landgate - spatial and valuation services 16 -
1,658 1,499
112,299 100,913
(a) Service appropriations are accrual amounts reflecting the full cost of services delivered. The appropriation revenue comprises a cash component and a receivable (asset). The receivable (holding account) comprises the depreciation expense for the year and any agreed increase in leave liability during the year.
(b) Where assets or services have been received free of charge or for nominalcost, the Department recognises revenues equivalent to the fair value of the assets and/or the fair value of those services that can be reliably measured and which would have been purchased if they were not donated, and those fair values shall be recognised as assets or expenses, as applicable. Where the contribution of assets or services are in the nature of contributions by owners, the Department makes the adjustment direct to equity.
Notes to the Financial Statements

DPC Annual Report 2010–2011 | Page 63
15. Restricted Cash and Cash Equivalent Assets2011$000
2010$000
Non Current
Accrued salaries suspense account (a) 1,310 985
1,310 985
(a) Amount held in the suspense account is only to be used for the purpose of meeting the 27th pay in a financial year that occurs every 11 years.
16. Inventories2011$000
2010$000
Current
Inventories held for resale:
- Publications 17 17
Inventories not held for resale:
- Stationery stores and material 68 71
85 88
17. Receivables2011$000
2010$000
Current
Receivables 878 1,234
GST receivable 450 348
1,328 1,582
The Department does not hold any collateral as security or other credit enhancements relating to receivables.
See also note 2(o) ‘Receivables’ and note 35 ‘Financial Instruments’
18. Amounts Receivable for Services (Holding Account)2011$000
2010$000
Current 1,289 5,313
Non-current 20,779 14,504
22,068 19,817
Represents the non-cash component of service appropriations. See note 2(m) ‘Amounts Receivable for Services (Holding Account)’. It is restricted in that it can only be used for asset replacement or payment of leave liability.
Notes to the Financial Statements
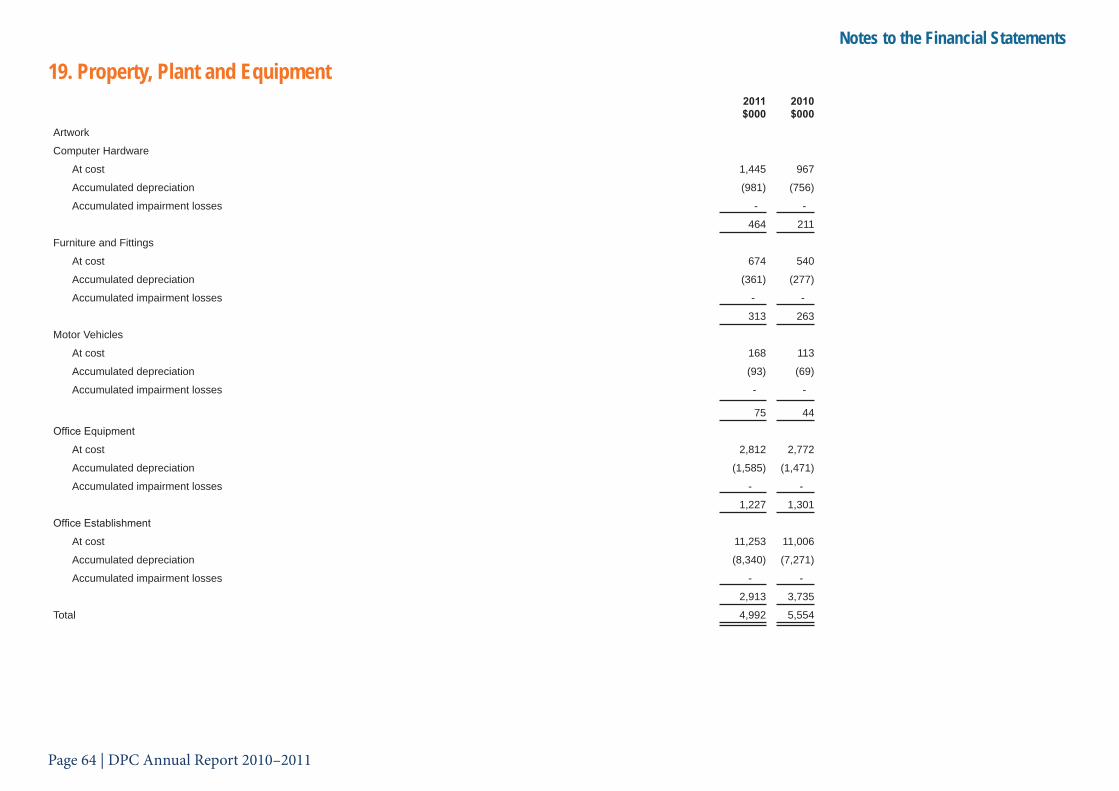
Page 64 | DPC Annual Report 2010–2011
19. Property, Plant and Equipment2011$000
2010$000
Artwork
Computer Hardware
At cost 1,445 967
Accumulated depreciation (981) (756)
Accumulated impairment losses - -
464 211
Furniture and Fittings
At cost 674 540
Accumulated depreciation (361) (277)
Accumulated impairment losses - -
313 263
Motor Vehicles
At cost 168 113
Accumulated depreciation (93) (69)
Accumulated impairment losses - -
75 44
Office Equipment
At cost 2,812 2,772
Accumulated depreciation (1,585) (1,471)
Accumulated impairment losses - -
1,227 1,301
Office Establishment
At cost 11,253 11,006
Accumulated depreciation (8,340) (7,271)
Accumulated impairment losses - -
2,913 3,735
Total 4,992 5,554
Notes to the Financial Statements

DPC Annual Report 2010–2011 | Page 65
19. Property, Plant and Equipment - (cont’d) Reconciliations
Reconciliations of the carrying amounts of plant, equipment and vehicles at the beginning and end of the current and previous financial year are set out below:
Artwork
$000
Computer Hardware
$000
Furniture and Fittings
$000
MotorVehicles
$000
Office Equipment
$000
Office Establishment
$000
Total
$000
2011Carrying amount at start of year
0 211 263 44 1,301 3,735 5,554
Additions - 477 133 55 362 472 1,499
Transfers - - - - - (18) (18)
Disposals - - - - (10) (8) (18)
Depreciation - (224) (83) (24) (426) (1,268) (2,025)
Carrying amount at end of year
- 464 313 75 1,227 2,913 4,992
Artwork
$000
Computer Hardware
$000
Furniture and Fittings
$000
MotorVehicles
$000
Office Equipment
$000
Office Establishment
$000
Total
$000
2010Carrying amount at start of year
54 349 238 88 781 4,572 6,082
Additions 49 178 321 1,473 2,021
Transfers (10) (74) 649 (662) (97)
Disposals (54) - - (15) (11) (198) (278)
Depreciation (177) (79) (29) (439) (1,450) (2,174)
Carrying amount at end of year
0 211 263 44 1,301 3,735 5,554
Notes to the Financial Statements

Page 66 | DPC Annual Report 2010–2011
20. Intangible Assets2011$000
2010$000
Computer Software
At cost 587 396
Accumulated amortisation (396) (396)
Accumulated impairment losses - -
191 -
Reconciliations:
Computer Software
Carrying amount at start of year - 2
Additions 191 -
Disposals - -
Amortisation expense - (2)
Carrying amount at end of year 191 -
21. Impairment of AssetsThere were no indications of impairment of property, plant and equipment, infrastructure and intangible assets at 30 June 2011.
The Department held no goodwill or intangible assets with an indefinite useful life during the reporting period and at reporting date there were no intangible assets not yet available for use.
22. Payables2011$000
2010$000
Current
Trade payables 401 462
Accrued salaries 1,648 771
Accrued expenses 2,948 2,213
4,997 3,446
See also note 2(p) ‘Payables’ and note 35 ‘Financial instruments’.’
23. Provisions2011$000
2010$000
Current
Employee benefits provision
Annual leave(a) 6,457 5,340
Long service leave(b) 6,930 4,825
48/52 leave arrangements 19 9
13,406 10,174
Other provisions
Employment on-costs(d) 6 5
6 5
13,412 10,179
Non-current
Long service leave(b) 2,691 2,128
Deferred salary scheme(c) - 29
2,691 2,157
Other provisions
Employment on-costs(d) 1 1
1 1
2,692 2,158
Notes to the Financial Statements

DPC Annual Report 2010–2011 | Page 67
(a) Annual leave liabilities have been classified as current as there is no unconditional right to defer settlement for at least 12 months after the reporting period. Assessments indicate that actual settlement of the liabilities will occur as follows:
2011$000
2010$000
Within 12 months of the end of the reporting period: 3,670 2,922
More than 12 months after the reporting period: 2,796 2,428
6,466 5,351
(b) Long service leave liabilities have been classified as current where there is no unconditional right to defer settlement for at least 12 months after the reporting period. Assessments indicate that actual settlement of the liabilities will occur as follows:
2011$000
2010$000
Within 12 months of the end of the reporting period 3,352 2,689
More than 12 months after the reporting period 6,279 4,293
9,631 6,981
(c) Deferred salary scheme liabilities have been classified as current where there is no unconditional right to defer settlement for at least 12 months after the reporting period. Actual settlement of the liabilities will occur as follows:
2011$000
2010$000
Within 12 months of the end of the reporting period - -
More than 12 months after the reporting period - 29
- 29
(d) The settlement of annual and long service leave liabilities gives rise to the payment of employment on-costs, including workers’ compensation insurance. The provision is the present value of expected future payments. The associated expense, apart from the unwinding of the discount (finance cost), is disclosed in note 11 ‘Other expenses’.
2011$000
2010$000
Movement in Other Provisions
Employment on-cost provision 6 54
Carrying amount at start of year 1
Additional provisions recognised - (48)
Payments/other sacrifices of economic benefits
Carrying amount at end of year 7 6
24. Other Liabilities2011$000
2010$000
Current
Derivative Financial Liability 3,077 - Other liability 8 8
3,085 8
25. EquityEquity represents the residual interest in the net assets of the Department. The Government holds the equity interest in the Department on behalf of the community. The asset revaluation reserve represents that portion of equity resulting from the revaluation of non-current assets.
2011$000
2010$000
Contributed equityBalance at the start of the year 4,225
Contributions by owners:Transfer of net assets from other agencies(a) 30,390 2,000
Total contributions by owners 30,390 2,000
Distributions to owners:Transfer of net assets to other agencies(b) - 2,225
Total distributions to owners - 2,225
Balance at the end of the year 34,615 4,225
Notes to the Financial Statements

Page 68 | DPC Annual Report 2010–2011
(a) Capital appropriations
TI 955 Contributions by Owners Made to Wholly-Owned Public Sector Entities designates capital appropriations as contributions by owners in accordance with AASB Interpretation 1038 Contributions by Owners Made to Wholly-Owned Public Sector Entities.
(b) Transfer of net assets from other agencies
The Department of the Attorney General - Office of Native Title transferred net assets of $30 million to the Department during the year.
AASB 1004 Contributions requires transfers of net assets as a result of a restructure of administrative arrangements to be accounted for as contributions by owners and distributions to owners.
Where activities are transferred from one agency to another agency as a result of a restructure of administrative arrangements, AASB 1004 (paragraph 57) requires the transferee agency to disclose the expenses and income attributable to the transferred activities for the reporting period, showing separately those expenses and income recognised by the transferor agency during the reporting period. Furthermore, AASB 1004 (paragraph 58) requires disclosures by class for each material transfer of assets and liabilities in relation to a restructure of administrative arrangements, together with the name of the counterparty transferor/transferee agency. In respect of transfers that are individually immaterial, the assets and liabilities are to be disclosed on an aggregate basis.
TI 955 designates non-discretionary and non-reciprocal transfers of net assets between State government agencies that have been designated as contributions by owners in accordance with AASB Interpretation 1038. Where the transferee agency accounts for a non-discretionary and non-reciprocal transfer of net assets as a contribution by owners and the transferor agency accounts for the transfer as a distribution to owners.
A restructure of administrative arrangements resulted in the function of the Office of Native Title being transferred from the Department of the Attorney General to the Department of the Premier and Cabinet with effect 1 April 2011. For the reporting period, the Department of the Attorney General recognised the following expenses, income, assets, and liabilities attributed to the transferred activities:
2011$000
2010$000
ExpensesEmployee benefits expense 2,334 3,050
Supplies and services 1,304 1,761
Depreciation and amortisation expense 26 13
Accommodation expenses 322 415
Grants and subsidies 45,714 17,072
49,700 22,311
IncomeGrants and subsidies - 3,761
Other revenue 100 33
100 3,794
Income from State GovernmentAppropriation - Recurrent 51,534 19,174
Resources received free of charge 226 305
51,760 19,479
AssetsCurrent assets 30,139 28,445
Non-current assets 1,159 1,042
31,298 29,487
LiabilitiesCurrent liabilities 715 1,063
Non-current liabilities 193 194
908 1,257
Hedging ReserveBalance at the start of the year (1,558) (1,329)
Net revaluations increments/(decrements) (2,974) (229)
Balance at the end of the year (4,532) (1,558)
Accumulated surplus/(deficit) (Retained Earnings)Balance at the start of the year 14,043 23,083
Transfer to Contributed Equity - -
Result for the period (4,843) (9,040)
Restated balance at the end of the year 9,200 14,043
Notes to the Financial Statements

DPC Annual Report 2010–2011 | Page 69
26. Notes to the Statement of Cash Flows2011$000
2010$000
Reconciliation of cash
Cash at the end of the financial year as shown in the Cash Flow Statement is reconciled to the related items in the Balance Sheet as follows:
Cash and cash equivalents 32,713 3,903
Restricted cash and cash equivalents (refer to note 15) 1,310 985
34,023 4,888
Reconciliation of net cost of services to net cash flows provided by/(used in) operating activities
Net cost of services (117,142) (109,953)
Non-cash items:
Depreciation and amortisation expense 2,025 2,176
Resources received free of charge 1,658 1,499
Net (gain)/loss on sale of plant and equipment 18 180
Net (gain)/loss on foreign exchange 805 465
(Increase)/decrease in assets:
Current receivables(a) 177 175
Current inventories 3 14
Other current assets (211) 1,376
Increase/(decrease) in liabilities:
Current payables(a) 1,024 (1,661)
Current provisions 2,555 1,887
Non current provisions 341 (727)
Other current liabilities 45 -
Change in GST in receivables/payables(b) (102) 1,068
Net cash provided by/(used in) operating activities (108,804) (103,501)
(a) Note that the Australian Taxation Office (ATO) receivable/payable in respect of GST and the receivable/payable in respect of the sale/purchase of non-current assets are not included in these items as they do not form part of the reconciling items.
(b) This reverses out the GST in receivables and payables.
At the end of the reporting period, the Department had fully drawn on all financing facilities, details of which are disclosed in the financial statements.
27. Resources Provided Free of ChargeDuring the year, the following resources were provided to other agencies free of charge for functions outside the normal operations of the Department:
2011$000
2010$000
Department of Treasury and Finance - Library and Reception Services 461 482
Office of the Public Sector Standards Commissioner - Corporate Services - 85
Public Sector Commission 1,351 1,244
Ombudsman 123 95
1,935 1,906
All the above expenses form part of the Department’s net cost of services.
Notes to the Financial Statements
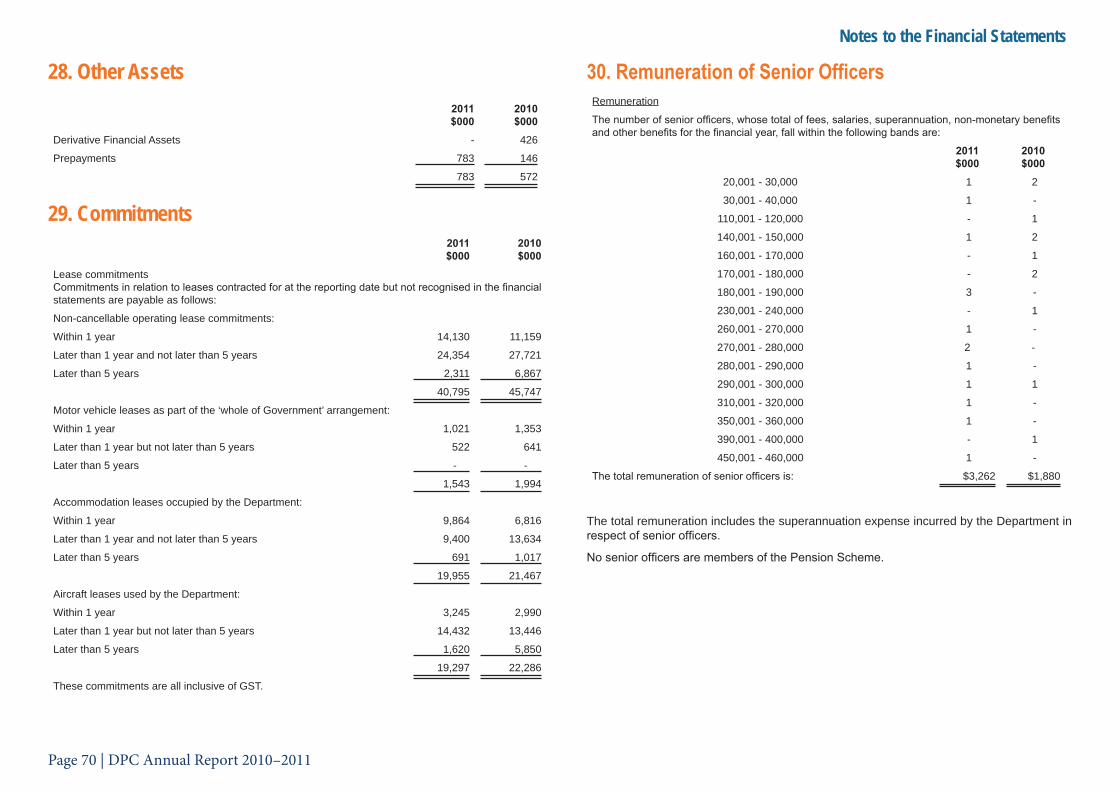
Page 70 | DPC Annual Report 2010–2011
28. Other Assets2011$000
2010$000
Derivative Financial Assets - 426
Prepayments 783 146
783 572
29. Commitments2011$000
2010$000
Lease commitmentsCommitments in relation to leases contracted for at the reporting date but not recognised in the financial statements are payable as follows:
Non-cancellable operating lease commitments:
Within 1 year 14,130 11,159
Later than 1 year and not later than 5 years 24,354 27,721
Later than 5 years 2,311 6,867
40,795 45,747
Motor vehicle leases as part of the ‘whole of Government’ arrangement:
Within 1 year 1,021 1,353
Later than 1 year but not later than 5 years 522 641
Later than 5 years - -
1,543 1,994
Accommodation leases occupied by the Department:
Within 1 year 9,864 6,816
Later than 1 year and not later than 5 years 9,400 13,634
Later than 5 years 691 1,017
19,955 21,467
Aircraft leases used by the Department:
Within 1 year 3,245 2,990
Later than 1 year but not later than 5 years 14,432 13,446
Later than 5 years 1,620 5,850
19,297 22,286
These commitments are all inclusive of GST.
30. Remuneration of Senior OfficersRemuneration
The number of senior officers, whose total of fees, salaries, superannuation, non-monetary benefits and other benefits for the financial year, fall within the following bands are:
2011$000
2010$000
20,001 - 30,000 1 2
30,001 - 40,000 1 -
110,001 - 120,000 - 1
140,001 - 150,000 1 2
160,001 - 170,000 - 1
170,001 - 180,000 - 2
180,001 - 190,000 3 -
230,001 - 240,000 - 1
260,001 - 270,000 1 -
270,001 - 280,000 2 -
280,001 - 290,000 1 -
290,001 - 300,000 1 1
310,001 - 320,000 1 -
350,001 - 360,000 1 -
390,001 - 400,000 - 1
450,001 - 460,000 1 -
The total remuneration of senior officers is: $3,262 $1,880
The total remuneration includes the superannuation expense incurred by the Department in respect of senior officers.
No senior officers are members of the Pension Scheme.
Notes to the Financial Statements

DPC Annual Report 2010–2011 | Page 71
31. Remuneration of AuditorRemuneration payable to the Auditor General for the financial year is as follows:
2011$000
2010$000
Auditing the accounts, financial statements and performance indicators 124 124
32. Supplementary Financial InformationWrite-offs
During the financial year there were amounts written off under the authority of section 48 of the Financial Management Act 2006.
Amounts written off by the Accountable Authority - -
Gifts of public property
Gifts of public property provided by the Department 12 3
33. Explanatory StatementSignificant variations between estimates and actual results for income and expense as presented in the financial statement titled, ‘Summary of Consolidated Fund Appropriations and Income Estimates’ are shown in 33 (a) and 33 (b). Significant variations are considered to be those greater than 10 per cent or $5.0 million.
a) Significant variances between actual results for 2010 and 20112011
Actual$000
2010Actual$000
Variance$000
Total appropriation provided to deliver services for the year
110,641 99,414 11,227
Total appropriations to deliver services for the year increased reflecting the increased expenditure required to fund the transfer to the Department, the Land, Approvals and Native Title Unit and increases in service expenditure explained below.
Service expenditure1. Administration of Executive Government Services
104,498 96,215 8,283
Increases over previous year arise from increased expenditure for CHOGM and natural disaster relief.
2. Government Policy Management 16,654 18,037 (1,383)
Expenditure is lower than the 2011 estimates as expected costs have been delayed to later years.
3. Adjustment (6,501) (10,539) 4,038
Adjustment variance arises primarily from disaster relief and deferral of appropriation along with net donation/grants reduction and completion of the Ravensthorpe Mine closure in 2010.
b) Significant variances between estimates and actuals for 20112011
Estimates$000
2011Actual$000
Variance$000
1. Administration of Executive Government Services
99,414 104,498 (5,084)
The variance can be primarily attributed to the increased contribution to the several disaster relief funds during the year.
2. Adjustments (2,344) (6,501) (4,157)
The variance arises from significant contributions to disaster relief funds during the year.
Notes to the Financial Statements

Page 72 | DPC Annual Report 2010–2011
34. Special Purpose Accounts2011$000
2010$000
The Gerald Frank Brown Memorial Trust
Purpose of the TrustTo hold money: • bequeathed to the Government of Western Australia by Gerald Frank Brown and subsequently appropriated by Parliament; and• received from private organisations and persons for the provision of scholarships and studentships to young persons from the European Union to visit Western Australia and/or young persons
from Western Australia to visit countries within the European Union to undertake approved educational activities for the purpose of promoting and enhancing the social, cultural, historical and economic ties between Western Australia and Europe.
Balance at the start of the year 238 275
Receipts 1 1
Payments (7) (4)
Unrealised gain/(loss) on translation (35) (34)
Balance at the end of the year 197 238
Overseas transactions have been translated in accordance with AASB 121, ‘The Effects of Changes in Foreign Exchange Rates’
Road Trauma Trust Fund
Purpose of the TrustIn accordance with section 12 of the Road Safety Council Act 2002, to receive and hold funds from parliamentary appropriations, one-third of all moneys from photograph-based vehicle infringement (via Department for Planning and Infrastructure and the Department of the Attorney General) and any money lawfully received for the purpose of the Act.
Balance at the start of the year - 2,154
Receipts - 2,723
Payments - (4,877)
Balance at the end of the year - -
Road Trauma Trust Fund was transferred to Main Roads in 2009–10.
Murchison Radio-Astronomy Observatory ILUA - Benefits Package
Purpose of the TrustThe purpose of this account is to hold moneys on behalf of the WY Claim Group pending execution of a Trust Deed under the Murchison Radio-Astronomy Indigenous Land Use Agreement.
Balance at the start of the year 8,424 -
Receipts 106 -
Payments - -
Balance at the end of the year 8,530 -
Murchison Radio-Astronomy Observatory ILUA-Benefits Package Trust Statement was transferred from the Department of the Attorney General at 1 April 2011.
DPC - Donations and BequestsPurpose of the TrustThe purpose of this account is to receive and hold in trust donations and bequests to be applied in such manner as specified by the contributor.
Balance at the start of the year - -
Receipts 564 -
Payments (564) -
Balance at the end of the year - -
The account was set up in March 2011.
Notes to the Financial Statements

DPC Annual Report 2010–2011 | Page 73
35. Financial Instruments(a) Financial Risk Management Objectives and Policies
Financial instruments held by the Department are cash and cash equivalents, restricted cash and cash equivalents, Treasurer’s advances, receivables and payables and forward foreign-exchange contracts. All of the Department’s cash is held in the public bank account (non-interest bearing) apart from restricted cash held in a special purpose account. The Department has limited exposure to financial risks. The Department’s overall risk management program focuses on managing the risks identified below.
Credit risk
Credit risk arises when there is the possibility of the Department’s receivables defaulting on their contractual obligations resulting in financial loss to the Department. The Department measures credit risk on a fair value basis and monitors risk on a regular basis.
The maximum exposure to credit risk at balance sheet date in relation to each class of recognised financial assets is the gross carrying amount of those assets inclusive of any provisions for impairment, as shown in the table at note 35(c).
Credit risk associated with the Department’s financial assets is minimal because the main receivable is the amounts receivable for services (holding account). For receivables other than government, the Department trades only with recognised, creditworthy third parties. The Department has policies in place to ensure that sales of products and services are made to customers with an appropriate credit history. In addition, receivable balances are monitored on an ongoing basis with the result that the Department’s exposure to bad debts is minimal. There are no significant concentrations of credit risk.
Allowance for impairment of financial assets is calculated based on objective evidence such as observable data indicating changes in client credit ratings. For financial assets that are either past due or impaired, refer to Note 17 ‘Receivables’.
Liquidity risk
The Department is exposed to liquidity risk through its trading in the normal course of business. Liquidity risk arises when the Department is unable to meet its financial obligations as they fall due.
The Department has appropriate procedures to manage cash flows, including drawdowns of appropriations by monitoring forecast cash flows to ensure that sufficient funds are available to meet its commitments.
Market risk
There has been no change to the Department’s exposure to market risks or the manner in which it manages and measures the risk.
-Interest
Other than as detailed in the interest rate sensitivity analysis table at note 35(c), the Department is not exposed to interest risk because apart from amounts in restricted cash, all other cash and cash equivalents are non-interest bearing, and have no borrowing other than the Treasurer’s Advance (non-interest bearing).
-Foreign Currency
The Department undertakes certain transactions denominated in foreign currencies, hence exposures to exchange rate fluctuations arise. This is managed within approved policy parameters such as utilising forward foreign exchange contracts to hedge the exchange rate risk arising from foreign currency denominated lease and service contracts.
Forward foreign exchange contracts
The Department has entered into aircraft leases in USD with commitments to purchase aircraft spare parts and meet maintenance costs in USD over the life of the aircraft leases. The Department has entered into forward foreign exchange contracts to hedge the exchange rate risk arising from these anticipated future transactions, which are designated as cash flow hedges. In the circumstances where the Department is unable to designate the forward exchange contracts as a cash flow hedge, the contract by default is categorised as Fair Value Through Profit or Loss (FVTPL).
Notes to the Financial Statements

Page 74 | DPC Annual Report 2010–2011
Cash flow hedge
The effective portion of changes in the fair value of derivatives that are designated and qualify as cash flow hedges are deferred in equity. The gain or loss relating to the ineffective portion is recognised immediately in profit or loss as part of other expenses or other income.
Amounts deferred in equity are recycled in profit or loss in the periods when the hedged item is recognised in profit or loss. However, when the forecast transaction that is hedged results in the recognition of a non-financial asset or a non-financial liability, the gains and losses previously deferred in equity are transferred from equity and included in the initial measurement of the cost of the asset or liability.
2011 Recycled from Equity to Profit or Loss
Balance <1year
1-2years
2-3years
3-4years
4-5years
5-8years
DR 4,578 1,080 920 826 746 683 323
2010 Recycled from Equity to Profit or Loss
Balance <1year
1-2years
2-3years
3-4years
4-5years
5-8years
DR 1,545 424 388 258 193 139 143
As at reporting date, the aggregate amount of unrealised losses under forward foreign exchange contracts deferred in the hedging reserve relating to the exposure on these anticipated future transactions is DR $4,577,856 (2010: $1,545,658). It is anticipated that the purchases will take place during the next 7 years at which stage the amount deferred in equity will be reclassified into profit or loss. The Department updates its forecast of foreign currency exposures at least as often as it performs hedge effectiveness testing and, in accordance with accounting policy, the Department reclassifies from the Cash Flow Reserve to Profit or Loss to the extent that foreign currency hedges are in excess of highly probable forecast transactions.
It is the policy of the Department to enter into forward foreign exchange contracts to cover specific foreign currency payments and receipts to approximately 100 per cent of the exposure generated. To the extent the foreign currency payments and receipts are no longer expected to occur, the Department may from time to time have forward foreign exchange contracts in excess of the forecast foreign currency payments or receipts as originally forecast.
The following table details the forward foreign currency contracts outstanding as at reporting date:
Avg Exchange Rate
Foreign Currency
Purchased
Contract Value Fair Value
2011 $000
2010 $000
2011 $000
2010 $000
2011 $000
2010 $000
2011 $000
2010 $000
Outstanding Contracts
Western Australian Treasury Corporation
< 1 year 0.7692 0.7780 2,269 2,705 2,950 3,477 (751) (162)
1 to 2 years 0.7665 0.7692 2,340 2,269 3,053 2,949 (653) (60)
2 to 3 years 0.7645 0.7667 2,363 2,340 3,091 3,053 (552) 31
3 to 4 years 0.7626 0.7645 2,387 2,363 3,130 3,091 (469) 102
4 to 5 years 0.7586 0.7625 2,917 2,387 3,845 3,130 (487) 159
> 5 years 0.7610 0.7593 1,121 4,038 1,473 5,318 (165) 357
b) Categories of Instruments
In addition to cash and bank overdraft, the carrying amounts of each of the following categories of financial assets and financial liabilities at the balance sheet date are as follows:
2011 $000
2010 $000
Financial AssetsCash and cash equivalents 32,713 3,903
Restricted Cash and cash equivalents 1,310 985
Receivables (a) 878 21,050
Derivatives - Cash Flow - 367
Derivatives - FVTPL - 59
Financial LiabilitiesFinancial liabilities 5,005 3,454
Derivatives - Cash Flow 2,928 -
Derivatives - FVTPL 149 -
(a) The amount of receivables excludes GST recoverable from ATO (statutory receivable).
Notes to the Financial Statements

DPC Annual Report 2010–2011 | Page 75
(c) Financial Instrument DisclosuresCredit Risk, Liquidity Risk and Interest Rate Risk ExposuresThe following table details the Department’s exposure to liquidity risk and interest rate risk at the balance sheet date. The Department’s maximum exposure to credit risk at the balance sheet date is the carrying amount of the financial assets as shown on the following date. The table is based on information provided to senior management of the Department. The contractual maturity amounts in the table are representative of the undiscounted amounts at the balance sheet date. An adjustment for discounting has been made where material.The Department does not hold any collateral as security or other credit enhancements relating to the financial assets it holds.The Department does not hold any financial assets that had to have their terms renegotiated that would have otherwise resulted in them being past due or impaired.
Interest rate exposures and ageing analysis of financial assets(a)
Weightedaverageeffective
interest rate
Interest Rate Exposure Past due but not impaired Impaired financial
lossCarrying Amount
Fixed interest
rate
Variable interest
rate
Non-interest bearing
Up to 3 months
3-12 months 1-2 years 2-5 years More than 5 years
% $000 $000 $000 $000 $000 $000 $000 $000 $000 $00030-Jun-11Financial AssetsCash and cash equivalents 0.060 32,713 - 182 32,531 - - - - - -
Restricted cash and cash equivalents 1,310 - - 1,310 - - - - - -
Receivables 878 - - 878 125 104 - - -
Amounts receivable for services 22,068 - - 22,068 - - - - - -
56,969 - 182 56,787 125 104 - - - -
30-Jun-10Financial AssetsCash and cash equivalents 0.057 3,903 - 252 3,651 - - - - - -
Restricted cash and cash equivalents 985 - - 985 - - - - - -
Receivables 1,234 - - 1,234 278 - - - - -
Amounts receivable for services 19,816 - - 19,816 - - - - - -
Other assets - Derivatives 426 - - 426 - - - - - -
26,364 - 252 26,112 278 - - - - -
(a) The amount of receivables excludes the GST recoverable from the ATO (statutory receivable).
Notes to the Financial Statements

Page 76 | DPC Annual Report 2010–2011
Cont’d
Interest rate exposure and maturity analysis of financial liabilities
Weightedaverageeffective
interest rate
Interest Rate Exposure Maturity date
Carrying Amount
Fixed interest
rate
Variable interest
rate
Non-interest bearing
Adjustment for
discounting
Total Nominal Amount
Up to 3 months
3-12 months
1-2 years 2-5 years More than 5 years
% $000 $000 $000 $000 $000 $000 $000 $000 $000 $00030-Jun-11Financial LiabilitiesPayables 4,997 - - 4,997 - - 4,997 - - - -
Other liabilities 8 - - 8 - - - - - - 8
Other liabilities - Derivatives 3,077 - - 3,077 - - - 751 653 1,508 165
8,082 - - 8,082 - - 4,997 751 653 1,508 173
30-Jun-10Financial LiabilitiesPayables 3,446 - - 3,446 - - 3,446 - - - -
Other liabilities 8 - - 8 - - - - - - 8
3,454 - - 3,454 - 0 3,446 0 0 0 8
Notes to the Financial Statements
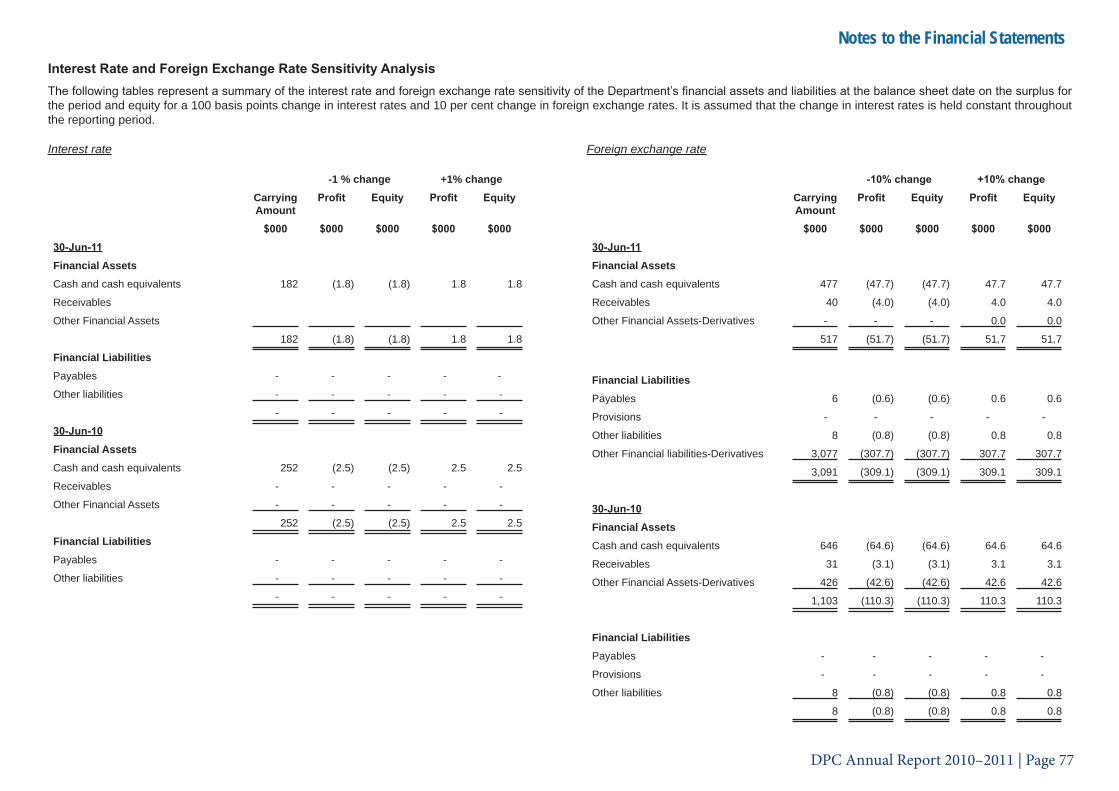
DPC Annual Report 2010–2011 | Page 77
Interest Rate and Foreign Exchange Rate Sensitivity AnalysisThe following tables represent a summary of the interest rate and foreign exchange rate sensitivity of the Department’s financial assets and liabilities at the balance sheet date on the surplus for the period and equity for a 100 basis points change in interest rates and 10 per cent change in foreign exchange rates. It is assumed that the change in interest rates is held constant throughout the reporting period.
Interest rate
-1 % change +1% changeCarrying Amount
Profit Equity Profit Equity
$000 $000 $000 $000 $00030-Jun-11Financial AssetsCash and cash equivalents 182 (1.8) (1.8) 1.8 1.8
Receivables
Other Financial Assets
182 (1.8) (1.8) 1.8 1.8
Financial LiabilitiesPayables - - - - -
Other liabilities - - - - -
- - - - -
30-Jun-10Financial AssetsCash and cash equivalents 252 (2.5) (2.5) 2.5 2.5
Receivables - - - - -
Other Financial Assets - - - - -
252 (2.5) (2.5) 2.5 2.5
Financial LiabilitiesPayables - - - - -
Other liabilities - - - - -
- - - - -
Foreign exchange rate
-10% change +10% changeCarrying Amount
Profit Equity Profit Equity
$000 $000 $000 $000 $00030-Jun-11Financial AssetsCash and cash equivalents 477 (47.7) (47.7) 47.7 47.7
Receivables 40 (4.0) (4.0) 4.0 4.0
Other Financial Assets-Derivatives - - - 0.0 0.0
517 (51.7) (51.7) 51.7 51.7
Financial LiabilitiesPayables 6 (0.6) (0.6) 0.6 0.6
Provisions - - - - -
Other liabilities 8 (0.8) (0.8) 0.8 0.8
Other Financial liabilities-Derivatives 3,077 (307.7) (307.7) 307.7 307.7
3,091 (309.1) (309.1) 309.1 309.1
30-Jun-10Financial AssetsCash and cash equivalents 646 (64.6) (64.6) 64.6 64.6
Receivables 31 (3.1) (3.1) 3.1 3.1
Other Financial Assets-Derivatives 426 (42.6) (42.6) 42.6 42.6
1,103 (110.3) (110.3) 110.3 110.3
Financial LiabilitiesPayables - - - - -
Provisions - - - - -
Other liabilities 8 (0.8) (0.8) 0.8 0.8
8 (0.8) (0.8) 0.8 0.8
Notes to the Financial Statements
Page 78 | DPC Annual Report 2010–2011
Fair Values
All financial assets and liabilities recognised in the balance sheet, whether they are carried at cost or fair value, are recognised at amounts that represent a reasonable approximation of fair value unless otherwise stated in the applicable notes. For financial instruments that are measured at fair value (foreign exchange contracts), they are all classified as Level 2 in accordance with the following table:
Level 1: fair value measurements are those derived from quoted prices (unadjusted) in active markets for identical assets or liabilities.
Level 2: fair value measurements are those derived from inputs other than quoted prices included within Level 1 that are observable from the asset or liability, either directly (as prices) or indirectly (derived from prices).
Level 3: fair value measurements are those derived from valuation techniques that include inputs for the asset or liability that are not based on observable market data (unobservable inputs).
36. Events Occurring After the Balance Sheet DateThere were no significant events affecting the operations of the Department of the Premier and Cabinet after the balance date.
37. Affiliated BodiesSalaries and Allowances Tribunal
The Tribunal, established by section 5 of the Salaries and Allowances Act 1975, is a government affiliated body and is funded via parliamentary appropriation. The Tribunal is not subject to operational control by the Department.
38. Contingent Liabilities and Contingent AssetsContingent Liabilities
An appeal against the dismissal of a claim for damages estimated at $80m was dismissed. The State was successful in its defence of the appeal. There were no contingent liabilities at the report date.
Contaminated sites
Under the Contaminated Sites Act 2003, the Department is required to report known and suspected contaminated sites to the Department of Environment and Conservation (DEC). In accordance with the Act, DEC classifies these sites on the basis of the risk to human health, the environment and environmental values. Where sites are classified as contaminated - remediation required or possibly contaminated - and, investigation is required, the Department may have a liability in respect of investigation or remediation expenses. The Department has no known or suspected contaminated sites.
Contingent Assets
The Appeal against the State was dismissed and costs awarded in favour of the State. The potential net benefit to the State is estimated at $500,000.
Notes to the Financial Statements
DPC Annual Report 2010–2011 | Page 79
Additional Key Performance Indicator Information
Certification of Performance IndicatorsFor the year ended 30 June 2011
I hereby certify that the performance indicators are based on proper records, are relevant and appropriate for assisting users to assess the Department of the Premier and Cabinet’s performance, and fairly represent the performance of the Department of the Premier and Cabinet for the financial year ended 30 June 2011.
Peter Conran
ACCOUNTABLE AUTHORITY
26 July 2011

Page 80 | DPC Annual Report 2010–2011
Performance IndicatorsThe Department delivers services to achieve the Government’s Outcomes Based Service Delivery Goal, ‘Greater focus on achieving results in key service delivery areas for the benefit of all Western Australians’. The Department’s outcome-based management structure has two agency-level outcomes:
Outcome 1: Executive Government receives appropriate support. (Service 1: Administration of Executive Government services)
Outcome 2: The Premier and Ministers receive high quality, rigorous and timely policy advice. (Service 2: Government Policy Management)
The key effectiveness indicators reported against these outcomes were chosen for their ability to enable assessment to be made of the extent to which the Department’s activities are achieving, or have made substantial progress towards achieving the approved agency-level outcomes. As a result of major changes to the outcome-based management structure in 2009–10, only limited prior period comparative data and information is available for these periods. Explanations for each of the indicators follow the tables.
On 1 April 2011, the Native Title function was transferred from the Department of the Attorney General (DotAG), and is reported in Service 2. The performance indicators previously reported by DotAG, reported herein for the fourth quarter 2010–11, are under review.
Effectiveness Indicators
Outcome: Executive government receives appropriate support
2009–10 Actual
2010–11 Target
2010–11 Actual
1.1 Targets for support services are met or exceeded
92% 92% 99%
1.2 Service recipients’ confirmation that services provided enable them to meet Executive Government’s obligations.
3.4 3.5 3.6
1.3 Printing and publishing services are secure, timely and confidential.
99.4% 100% 99.7%
Key Effectiveness Indicator Explanatory Notes
1.1 Targets for support services are met or exceeded.
Data for this indicator is derived from transaction records maintained by the Department on a range of essential services provided to the Premier and Ministers. The timeliness of service targets have been determined by the Department having regard for the resources available to deliver each service, and client expectations, and the indicator reports the percentage of services that were delivered within the designated timeframe. In this regard, all services are considered to be of equal importance.
1.2 Service recipients’ confirmation that services provided enable them to meet Executive Government’s obligations.
This indicator is derived from a survey instrument provided to the Premier’s Office, Ministerial Offices and the Leader of the Opposition’s Office seeking feedback on the extent to which their expectations were met by services provided by the Department. The rating is a value between one and five, where a value of one indicates that services were well below expectations and five that

DPC Annual Report 2010–2011 | Page 81
services were well above expectations, while a value of three indicates that services met expectations. The data is reported in accordance with recommendations of the Australian Bureau of Statistics.
Responses were received from the Office of the Premier and 15 of the 16 Ministerial Offices, as well as the Leader of the Opposition’s Office, with a combined response rate of 94 per cent. Responses to the question seeking a general rating for all services delivered were used for the indicator. The Department is unaware of any circumstances that might have caused the non-respondent to respond differently to those that did.
1.3 Printing and publishing services are secure, timely and confidential.
This indicator reports the extent to which secure, timely and confidential printing and publishing is delivered. Parliamentary documents such as Hansard and Bills must be delivered to the respective Houses of Parliament within certain timeframes. Some documents are not to be publicly released until tabled in Parliament (for example, Royal Commission and Inquiry proceedings), or prior to scheduled publishing dates (for example, Government Gazette). Feedback from key clients and departmental records are used to derive this indicator.
Outcome: The Premier and Ministers receive high quality, rigorous and timely policy advice
2009–10 Actual
2010–11 Target
2010-11 Actual (a)
2010–11 Actual
2.1 Proportion of Cabinet Submissions meeting or exceeding defined quality standards.
97% 80% 96%
2.2 Proportion of signed national agreements reflecting Cabinet agreed positions.
100% 100% 100%
2.3 Level of Commonwealth recurrent core services funding allocated to Western Australia over time.
54% 22% 27%
2.4 Percentage change in the number of outstanding Native Title claims awaiting resolution.
3% -5% 5% 3.8%
(a) Data reported by Department of the Attorney General
Key Effectiveness Indicators Explanatory Notes
2.1 Proportion of Cabinet Submissions meeting or exceeding defined quality standards.
A key Departmental goal is to strengthen the policy capacity across the Government. This will be achieved by working with agencies to help them develop policy skills and competencies and a better understanding of the Government’s policy objectives. The principal avenue for approval of agency-developed Government policy is by way of Cabinet submissions and, for this indicator, the quality of Cabinet policy submissions will be assessed against a checklist covering quality, timeliness and rigour attributes. The indicator reports the percentage of Cabinet submissions assessed as meeting all essential quality elements, and excludes

Page 82 | DPC Annual Report 2010–2011
submissions regarding appointments and similar non-policy matters.
2.2 Proportion of signed national agreements reflecting Cabinet agreed positions.
Ensuring that Western Australian needs and interests are accommodated in national agreements is a Departmental objective to maximise the benefits to Western Australia from engagement with the Commonwealth. Signed national agreements are assessed to determine the extent to which they are consistent with Cabinet’s agreed position on the matters addressed (including any agreement to requirements modified by way of response to Commonwealth negotiations). The indicator is reported as the percentage of all agreements signed in the financial year.
2.3 Level of Commonwealth recurrent core services funding allocated to Western Australia over time.
Maximising financial benefits to Western Australia from engagement with the Commonwealth includes increasing (or at the very least maintaining) the level of Commonwealth funding to the core State service areas of health, education, skills development and training, housing and Indigenous services (excluding GST revenues or other non-core national partnership payments which may be subject to adjustment and/or equalisation) allocated to Western Australia.
Funding of $2,267,498,000 received in 2008–09 is used as the base for this indicator. Data sourced from the Department of Treasury analysis of Commonwealth Budget Paper 3 is compared to the base to report a percentage increase or decrease.
2.4 Percentage change in the number of outstanding Native Title claims awaiting resolution.
The Native Title function was transferred from DotAG on 1 April 2011, and the indicator is that which was previously reported by DotAG for 2009–10 Actual and 2010–11. The 2010–11 Actual applies to three months of operation only. The data for this indicator is sourced from the Native Title Tribunal.
Agency Services and Key Efficiency IndicatorsThe two services, Administration of Executive Government services (Service 1) and Government Policy Management (Service 2) directly support delivery of agency-level outcomes and the Department’s strategic goals.
The key efficiency indicators provide information on the cost of inputs required to deliver outcomes, and include all costs associated with the specific service. To report the total cost of service, corporate and executive support expenses are distributed across services on an FTE basis and incorporated in reported key efficiency indicators. Grants and donations administered, and employee severances paid, are excluded from key efficiency indicators (as appropriate) where these expenses are not considered to be a cost of service delivery.
Service 1: Administration of Executive Government Services The Department’s principal client for these services is the Premier as the Head of Government, Cabinet Ministers and Members of Parliament. Services provided include, but are not limited to:
• administrative support to the Premier;• administrative policy advice and support to the Ministerial Offices
and the Leader of the Opposition;• promotion of Western Australia’s interests overseas;• communication of Government policies and activities; • administration of entitlements for Members and former Members
of Parliament;• management of the State occasions and official visits program;• a secure, confidential and time-critical printing and publishing
service for Parliament and Government; and• management of exhibitions and programs at the Constitutional
Centre.The major activities undertaken in Service 1 are reflected in the following key efficiency indicators. Explanations for each indicator follow the table.

DPC Annual Report 2010–2011 | Page 83
Service: Administration of Executive Government Services2009–10
Actual ($’000s)
2010–11 Target
($’000s)
2010–11 Actual
($’000s)1.4 Average operating cost per
Ministerial Office (including Premier’s Office and Leader of the Opposition).
$2,151 $2,176 $2,305
1.5 Average cost of support provided per Ministerial Office (including Premier’s Office).
$549 $505 $456
1.6 Average cost of representing Western Australia’s interests overseas (per region).
$1,662 $1,986 $1,532
1.7 Average cost of entitlements per Member of Parliament.
$345 $314 $361
1.8 Average cost of support provided per Member of Parliament.
$18 $21 $13
1.9 Average cost per print image produced.
$0.36 $0.41 $0.37
Key Efficiency Indicator Explanatory Notes
1.4 Average operating cost per Ministerial Office (including the Premier’s Office and Leader of the Opposition).
This indicator reports the average operational expense for each office (including the Premier’s Office and Leader of the Opposition) plus a proportion of the cost of executive support and corporate services allocated on an FTE basis. End of contract payments of $1,249,624 in 2009–10 Actual and $171,591 in 2010–11 Actual have been excluded from this efficiency indicator as they are considered to be abnormal.
The increase in the average operating cost per Ministerial Office between 2010–11 Target and 2010–11 Actual is principally the outcome of increased expenditure on Ministerial air charter
and the impact of Ministerial staffing changes following the December 2010 Cabinet reshuffle.
1.5 Average cost of support provided per Ministerial Office (including the Premier’s Office and Leader of the Opposition).
This indicator reports the average expense for all Executive Government support functions per Ministerial Office (including the Premier’s Office and Leader of the Opposition) plus a proportion of the cost of executive support and corporate services allocated on an FTE basis.
The reduction in the average cost of support provided per Ministerial Office when comparing projected 2010–11 Target to 2010–11 Actual is primarily an overestimation of government media expenditure for 2010–11; following the restructure of this function in January 2010, the transfer of the Executive Government function to Service 2 and other expense reductions partially offset by minor increases.
1.6 Average cost of representing Western Australia’s interests overseas (per region).
Overseas Offices are maintained in Europe (London), the Middle East (Dubai) and North Asia (Tokyo and Kobe) to attract foreign investment to Western Australia and promote Western Australian products and services. The indicator is the average operational expense for all regions plus a proportion of the cost of executive support and corporate services allocated on an FTE basis.
The significant reduction in 2010–11 Actual compared with 2010–11 Target is the result of projections made in the framing of the 2010–11 budget to account for a proposed change in the accounting treatment of overseas office operations, resulting in overestimation of the annual overseas office expense.
1.7 Average cost of entitlements per Member of Parliament.
Members’ entitlements determined by the Salaries and Allowances Tribunal and administered by the Department include Electorate Office staffing and operational expenses, a fully serviced motor vehicle, imprest and electorate travel and Former Members’

Page 84 | DPC Annual Report 2010–2011
entitlements. The indicator is the average cost per Member, including executive and corporate support overheads allocated on an FTE basis.
The increase in the average cost of entitlements per Member between 2010–11 Target and 2010–11 Actual is the result of the significant under-projection of Electorate Office expenditure in the 2010–11 budget that was addressed through additional appropriation approved in 2010–11 and forward estimates. Additionally, projected expense for Members Imprest for 2010–11 Target was misclassified to a cost centre reported under the indicator ‘Average cost of support per Member’.
1.8 Average cost of support provided per Member of Parliament.
This indicator reports the average expense for administrative support to Electorate Offices per Member, including a proportion of the cost of executive support and corporate services allocated on an FTE basis.
The reduction in the average cost of support provided per Member between 2010–11 Target and 2010–11 Actual is in part due to the misclassification of projected Members’ Imprest expense for 2010–11 Target to a cost centre reported under this indicator, plus other reductions in operational expense.
1.9 Average cost per print image produced.
This key efficiency indicator is the average cost per printing image. A printing image is a single pass of a document through the printing machine producing an image on one side of the paper. The average cost includes a proportion of the cost of executive support and corporate services allocated on an FTE basis.
Expenditure of $4,203,780 in 2009–10 Actual, $8,435,776 in 2010–11 Target and $10,807,433 in 2010–11 Actual for inquiries, commissions, non-core functions, community service obligations, miscellaneous grants and donations, severances and corporate services provided free of charge to:
• the Public Sector Commission;• the Office of the Public Sector Standards Commissioner (prior to
its amalgamation with the Public Sector Commission);
• the Parliamentary Commissioner for Administrative Investigations (Ombudsman); and
• Department of Treasury
is excluded from the key efficiency indicators reported for this service.
The corporate services costing allocation methodology applied since 1999–2000, to derive the estimated value of corporate services provided free of charge to external client agencies, is subject to regular review to ensure its efficacy.
Service 2: Government Policy Management
The Premier as the Head of Government and Minister for State Development is the principal client for this service. Services provided include, but are not limited to:
• strategic policy advice and coordination to the Premier and Cabinet; leadership and coordination of cross-agency solutions to complex issues;
• managing and coordinating Western Australian Government input into intergovernmental negotiations, and advice on Government positions on federal reform, treaties, defence and other matters raised through COAG and Council for Australian Federation;
• strategic, cross-portfolio advice on land, State and Commonwealth approvals and Indigenous issues;
• support for the functions of Cabinet and Parliament;
• support to the Executive Council; and
• emergency management policy advice to the Premier, Ministers and Government agencies, and whole-of-government management and coordination of significant security incidents and emergencies.

DPC Annual Report 2010–2011 | Page 85
The key efficiency indicators focus on the major activities undertaken to deliver these services and explanations for each indicator follow the table.Outcome: The Premier and Ministers receive high quality, rigorous and timely policy advice
2009–10 Actual
($’000s)
2010–11 Target
($’000s)
2010-11Actual (a)
($’000s)
2010–11 Actual
($’000s)2.4 Average cost per
Cabinet submission assessed.
19 20 32
2.5 Average cost per agreement where Cabinet agreed positions are incorporated in final national agreements.
153 285 1,099
2.6 Average cost per Native Title application managed.
n/a 81 68 11
2.7 Average time taken to achieve resolution of Prioritised Native Title applications.
n/a 4.1 years
3.2 years
6.9 years
(a) Data reported by Department of the Attorney GeneralKey Efficiency Indicators Explanatory Notes2.4 Average cost per Cabinet submission assessed.
This efficiency indicator reports the cost of resources allocated to the assessment and processing of Cabinet submissions, provision of advice and support to agencies and the review and commentary on Cabinet submissions. The average cost includes a proportion of the cost of executive support and corporate services allocated on an FTE basis. The increase in the average cost per Cabinet submission is the outcome of a 20 per cent reduction in the number of Cabinet submissions assessed in 2010–11 when compared with both the 2009–10 Actual and 2010–11 Target. A substantial increase in appropriation in 2010-11 was principally allocated to this activity.
2.5 Average cost per agreement where Cabinet’s agreed positions are incorporated in final national agreements.
The Department’s objective is to ensure, to the extent possible, that national agreements signed by Western Australia are consistent with Cabinet’s agreed position on the subject matter. While from time-to-time there will be national agreements that are accepted and signed by Western Australia that may not completely follow Cabinet’s agreed position; decisions about the content of these agreements made by Ministers at COAG take into account circumstances that might not have been evident in earlier negotiations. In such cases, the agreement is included in those counted for this indicator. The average cost includes a proportion of the cost of executive support and corporate services allocated on an FTE basis.The fourfold increase in the average cost per national agreement is the result of the similar reduction in the number of agreements signed; five rather than the twenty three projected in the 2010–11 Target. In part, this is the outcome of deferral of COAG activities in the first half of 2010–11 during preparation for the 2010 Commonwealth General Election. The first COAG meeting for 2010–11 was held in February 2011.
2.6 Average cost per Native Title application managed.This efficiency indicator was reported by the Native Title function prior to its transfer to the Department. Data published by DotAG has been used as the 2010–11 Target indicator value. Due to methodological differences in deriving the total cost of service, the average cost reported by the Department for this indicator may not be fully comparable with that reported by DotAG, and is in any event limited to expenditure for the fourth quarter of the financial year. The average cost includes a proportion of the cost of executive support and corporate services allocated on an FTE basis.
2.7 Average time taken to achieve resolution of Prioritised Native Title applications.
This efficiency indicator was reported by the Native Title function prior to its transfer to the Department. The 2009–10 Actual and 2010–11 Target data is that published in DoTAG’s 2009–10 Annual Report and 2010–11 Budget Statements.

Page 86 | DPC Annual Report 2010–2011
Ministerial DirectivesTreasurer’s Instruction 902 (12) requires disclosing information on any Ministerial directives relevant to the setting of desired outcomes or operational objectives, the achievement of desired outcomes or operational objectives, investment activities, and financing activities.
The Department did not receive any Ministerial directives during the period 2010–11.
Other Financial Disclosures
Pricing PoliciesFees and charges for publications, Government Gazette advertising and subscription services are generally increased in line with the consumer price index as advised by the Department of Treasury and Finance. Rates are structured to recover all costs, including overheads and labour, and are part of the budget process with increases being approved by the responsible Minister and Department of Treasury and Finance.
Capital Works ExpenditureThe Department’s capital works program is focused principally on asset replacement for the Department and Electorate Offices. In 2010–11, expenditure on capital works amounted to $1.690 million.
Expenditure for 2010–11 was principally incurred in replacing computer and electronic hardware throughout the Department.

DPC Annual Report 2010–2011 | Page 87
Employment and Industrial Relations
Employee ProfileThe annual average FTE figure for the Department was 453, compared to last year’s average of 428 FTEs. The increase is principally due to the transfer of Office of Native Title staff into this Department on 1 April 2011.
Our FTE figure is comprised of 60 per cent permanent employees, 30 per cent fixed-term contract employees, and ten per cent employees in other modes of employment. Ninety four per cent of employees work full-time and six per cent of employees work part-time.
In the electorate offices, 50 per cent of staff are full-time employees with 39 per cent part-time employees. The remaining 11 per cent of employees are hired on a casual or relief basis.
Industrial Relations2010–11 was the year of re-negotiation of Agreements for the Department, and on behalf of the Presiding Officers of Parliament. This year, the Electorate and Research Employees General Agreement 2011 was successfully registered on 28 June 2011.
The Executive Transport Services Employee Agreement 2010 was also registered on 14 March 2011, which replaced the Ministerial Chauffeurs Agreement 2008. In the new agreement, annualised hours was introduced as a key change to previous work arrangements.
During the year, the Joint Consultative Committee (JCC) for Electorate Officers was established. The JCC aims to improve tri-partite communication between the Department, on behalf of the Presiding Officers as the employers, Electorate Officers and union representatives. The JCC is a forum for consultation on issues such as the development of workload management strategies, changes to work practices and industrial issues, where the Union and employees are able to contribute to the decision-making process.

Page 88 | DPC Annual Report 2010–2011
Governance DisclosureConflicts of Interest
During 2010–11, the Department reviewed its Code of Conduct. To support the revised Code, a website providing further information, including policies, factsheets and scenarios about the six principles in the Code was established. The Department has recently released a new Conflicts of Interest Policy and Operational Procedures to support the Code of Conduct, to assist employees to identify and declare any perceived, potential or real conflicts of interests as they arise.
In addition, in accordance with the requirements of the Public Sector Management Act 1994, the Department’s policy and procedures on employment outside Government require all employees to seek permission to engage in both paid and unpaid activities unrelated to their duties. Any conflicts of interest must be identified and addressed by the applicant in his/her submission to the Director General.
Contracts with Senior Officers
At the date of reporting, other than normal contracts of employment of service, no senior officers, or firms of which the senior officers are members, or entities in which senior officers have substantial interests, had any existing or proposed contracts with the Department and senior officers.
Internal Audit
Internal audit services are provided by an external service provider, overseen by the Department’s Internal Audit Committee and a senior officer of the Director General’s Office with Corporate Governance responsibility. The results of all audits are reported to the Director General and the Internal Audit Committee. A senior officer from the Office of the Auditor General attends Internal Audit Committee meetings in an advisory capacity.
The Department’s Internal Audit Committee met twice during the financial year. Ten audits were scheduled and 11 were completed during the financial year 2010-11 (including one audit carried over from 2009-10).
Risk Management
The Department’s updated Risk Management Policy was endorsed by Corporate Executive during 2010-11, and is supported by updated Risk Reference Tables. These risk reference tables are the basis for the development and refinement of functional area risk identification and management. The RiskBase software product is used as the tool to help identity, prioritise and manage risk across the Department, and RiskCover staff have conducted functional area risk assessment workshops to assist designated Risk Coordinators with the development and/or updating of risk management plans.
DPC Annual Report 2010–2011 | Page 89
Other Legal RequirementsStatement of Compliance with the State Records Act 2000 – section 19 and State Records Commission Standards, Standard 2, Principle 6.The Department’s Record Keeping Plan (RKP) has made provisions to accommodate the Standard 2 Principle 5 of the State Records Commission (SRC) Standards, which requires all records are retained and disposed of in accordance with an approved disposal authority. The 2011 disposal authorities for the Department and Ministerial Offices have been submitted to the State Records Office and are subject to approval by the SRC.
The Retention and Disposal Schedule provides a management tool for identifying and determining the retention and disposal of functional records created by the Department. It contains valuable information and guidance to the organisation in respect to the major categories of records it creates. It is therefore an important business tool and assists to guide compliance with legal obligations. The disposal authorities establish the minimum retention requirements for government records, identifying those records that will become State archives and those records that are eligible for destruction when their business value has ceased.
In accordance with SRC Standard 2 Principle 5 the following compliance information is provided:
SRC Requirement Department Compliance ActionWhether an approved records Retention and Disposal Schedule is operating in the organisation
Disposal authorities for the Department and Ministerial Office Records are currently reviewed by the State Records Office and are subjected to the SRC’s approval. Disposal authority for inquiries and general disposal authorities are current.
Identify the records of the Department and their formats The RKP identifies the following types of records: Administrative, Functional, Cabinet, Inquiry and Ministerial. These records can either be in electronic or hard copy format.
Appraisal of records in accordance with SRC Standard 3 Appraisal of former Premier’s gifts resulted in the legal destruction under the General Disposal Authority 6.5.2 of items such as wooden plaques, medallions, plates, paper weights and framed pictures.
Reference and conformance to the appropriate General Disposal Authorities published by the State Records Office
The disposal of common administrative, financial and human resource records are carried out in accordance with the appropriate General Disposal Authorities approved by the SRC.
Page 90 | DPC Annual Report 2010–2011
Statement of Compliance with the State Records Commission Standards, Standard 2 Principle 6In accordance with State Records Commission Standard 2 Principle 6 the following compliance information is provided:
SRC Requirement Department Compliance ActionWhether the efficiency and effectiveness of the organisation’s record keeping systems have been evaluated or alternatively when such evaluation is proposed.
• Record keeping policy documents were evaluated by the SRC last year. The RKP continues to focus on improving compliance with the SRC Standard 8 (Digital Record keeping) especially with the impending relocation to Dumas House. To support compliance with Standard 8, the Department is continuing the ongoing implementation of TRIM (electronic records system) and digitisation of hard-copy records.
• This year 248 sessions and 219 hours of training were provided to support more than 500 licensed TRIM users. The electronic records collection of the former Office of Native Title has been migrated into the TRIM system.
• Records management procedures and the controlled vocabulary are reviewed annually and approved before use.
The nature and extent of the record keeping training program conducted by or for the organisation.
• Participation statistics for the Department are 264 enrolled and 78 per cent complete, while for Ministerial Offices are 216 enrolled and 66 per cent complete; and
• 32 records related to internal publications were produced and published online and in print, including induction books, service updates and training manuals.
Whether the efficiency and effectiveness of the record keeping training program has been reviewed or alternatively when this is planned to be done.
• Last year’s Records Awareness Training (RAT) feedback indicated a high approval rate for the course content and understanding of record keeping roles and responsibilities. The awareness of record keeping is further enhanced with the introduction of the new online Code of Conduct;
• A new survey will be planned after the relocation to Dumas House.Assurance that the organisation’s induction program addresses employee roles and responsibilities in regard to their compliance with the organisation’s RKP.
• In addition to the RAT, the record keeping induction book is annually revised. This induction book is included in the Department’s staff induction package and Intranet.
• Record keeping roles and responsibilities are also included in Principle 6 of the Department’s new Code of Conduct. Through RAT, staff are aware that business records must be captured into the TRIM record keeping system.

DPC Annual Report 2010–2011 | Page 91
Statement of Compliance with the Electoral Act 1907 – section 175ZE (Advertising)Section 175ZE of the Electoral Act 1907 requires the inclusion of a statement detailing all expenditure incurred by, or on behalf of, the agency in the reporting period in relation to advertising agencies, market research, polling, direct mail, and media advertising organisations. Detailed compliance information is provided at Appendix 1.
Statement of Compliance with the Disability Services Act 1993 and Disability Services Regulations 2004The Department’s Disability Access and Inclusion Plan (DAIP) 2007–2011 was developed and lodged with the Disability Services Commission in July 2007.
Strategies related to the six DAIP outcomes have been completed and are subject to review when necessary. The Department has a DAIP Committee in accordance with the requirements of the plan to monitor outcomes.
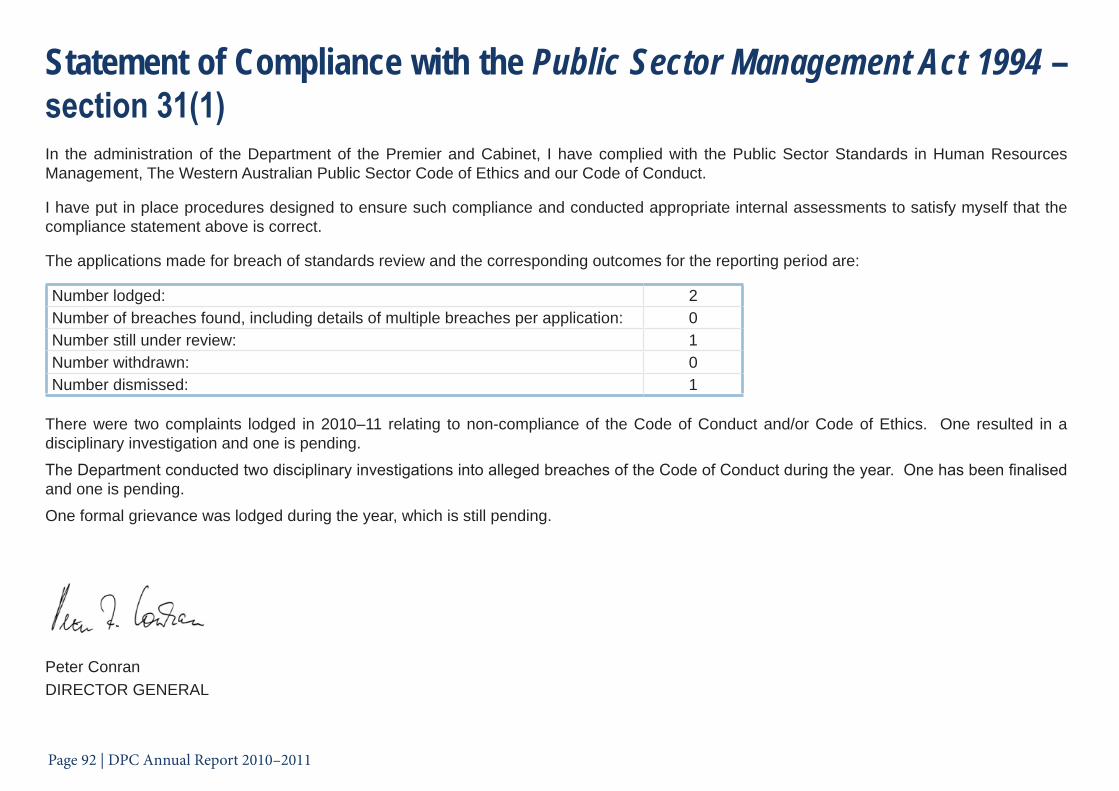
Page 92 | DPC Annual Report 2010–2011
Statement of Compliance with the Public Sector Management Act 1994 – section 31(1)In the administration of the Department of the Premier and Cabinet, I have complied with the Public Sector Standards in Human Resources Management, The Western Australian Public Sector Code of Ethics and our Code of Conduct.
I have put in place procedures designed to ensure such compliance and conducted appropriate internal assessments to satisfy myself that the compliance statement above is correct.
The applications made for breach of standards review and the corresponding outcomes for the reporting period are:
Number lodged: 2Number of breaches found, including details of multiple breaches per application: 0Number still under review: 1Number withdrawn: 0Number dismissed: 1
There were two complaints lodged in 2010–11 relating to non-compliance of the Code of Conduct and/or Code of Ethics. One resulted in a disciplinary investigation and one is pending.
The Department conducted two disciplinary investigations into alleged breaches of the Code of Conduct during the year. One has been finalised and one is pending.
One formal grievance was lodged during the year, which is still pending.
Peter ConranDIRECTOR GENERAL

DPC Annual Report 2010–2011 | Page 93
Government Policy Requirements
Substantive Equality The Department is committed to delivering its services with an understanding that all people are different because they have different needs. Incorporated in the Department’s practices is a requirement to identify the existence of systemic racism and remove all barriers that restrict its ability to achieve the best outcome for the community. In doing so, the Department complies with the Policy Framework for Substantive Equality.
Occupational Safety and Health (OSH) and Injury ManagementThe Department is committed to providing a healthy, safe, and accident free workplace for all its employees, contractors and visitors by complying with the Occupational Safety and Health Act 1984 and Worker’s Compensation and Injury Management Act 1981.
An Occupational Safety and Health (OSH) Committee meets quarterly. During 2010–11, workplace inspections were conducted to identify risks within the Department and only minor risks were reported. Higher-risk workplaces, such as the State Law Publisher, conduct inspections monthly.
During 2010–11, training was conducted for nominated employees to become Departmental OSH representatives.
Occupational Safety and Health Performance IndicatorsIndicator Target 2010–11 Actual 2009–10 Actual 2010–11 VarianceNumber of fatalities 0 0 0 0Lost time injury/diseases incidence rate 0 or 10% reduction on
previous year0 2 2
Lost time injury severity rate 0 or 10% reduction on previous year
0 0 0
Percentage of injured workers returned to work within 28 weeks 100% N/A 100% -Percentage of managers trained in occupational safety, health and injury-management responsibilities.
50% or more Less than 50% Less than 50%

Page 94 | DPC Annual Report 2010–2011
Other Corporate Information
Freedom of Information (FOI)The Department aims to assist the public to access available documents held by the agency at the least possible cost.
Sixty six new valid applications were received during the year. Of these, two applications were transferred in full to another public sector agency for processing and two applications were withdrawn by the applicant. A further five applications were carried over from the previous year.
The table on the next page provides a breakdown of the FOI applications that were finalised during this period. A more comprehensive breakdown of the agency’s statistics is provided in the Information Commissioner of Western Australia’s Annual Report — www.foi.wa.gov.au.
The Department’s FOI Statement is provided at Appendix 3 of this report.
In 2010–11 the Department continued to provide FOI support to the Salaries and Allowances Tribunal and Public Sector Commission, as a bureau service, and training and advice to Ministerial Offices.

DPC Annual Report 2010–2011 | Page 95
FOI Applications
2010/2011 2009/2010Total Total
Carried Over 5 - - 7 - -Received 66 - - 87 - -Total handled 71 - - 94 - -Applications Decided in Year
Personal Information
Non-Personal Information
Personal Information
Non-Personal Information
Full Access 2 1 1 9 2 7Edited Access 42 0 42 45 1 44Deferred Access 0 0 0 1 0 1Section 28 Access 0 0 0 0 0 0Access Refused 12 0 12 23 1 22TOTAL DECISIONS
56 1 55 78 4 74
Transfer to other Agencies
2 - - 8 - -
Withdrawn 2 - - 3 - -Total Applications Finalised
60 - - 89 - -
Carried Forward 11 - - 5 - -

Page 96 | DPC Annual Report 2010–2011
Appendices
Appendix 1Statement of Expenditure - Electoral Act 1907, Section 175ZE
In compliance with section 175ZE of the Electoral Act 1907, the Department of the Premier and Cabinet is required to report on
expenditure incurred during the financial year in relation to advertising agencies, market research organisations, polling organisations,
direct mail organisations and media advertising organisations.
Details are as follows:
(a) Expenditure with Advertising AgenciesAdcorp
Freeway Design
$68,526
(b) Expenditure with Market Research Agencies Nil
(c) Expenditure with Polling Agencies Nil
(d) Expenditure with Direct Mail Agencies Nil
(e) Expenditure with Media Advertising Agencies Nil
TOTAL EXPENDITURE $68,526

DPC Annual Report 2010–2011 | Page 97
Appendix 2Freedom of Information – Information Statement
Freedom of Information Operations
The Freedom of Information Act 1992 (FOI Act), which came into effect on 1 November 1993, created a general right of access to documents held by state and local government agencies. The FOI Act requires agencies to make available details about the kind of information they hold and enables persons to ensure that personal information held by government agencies about them is ‘accurate, complete, up-to-date and not misleading’.
It is the aim of the Department of the Premier and Cabinet to make information available promptly, for the least possible cost, and (wherever possible) documents will be provided outside the FOI process.
Receipt of FOI Applications
FOI applications, payments, correspondence and general inquiries may be directed to the Department’s FOI Coordinator, 28th Floor, 197 St Georges Terrace, Perth, 6000 [Tel: (08) 9222 9409; Fax: (08) 9222 9690]. FOI application forms are available from the Department’s Internet site at www.foi.dpc.wa.gov.au, or by contacting the FOI Coordinator.
Processing of Applications
The Department’s FOI Unit is responsible for administering the processing of FOI applications within the agency. The FOI Coordinator and Assistant FOI Coordinator liaise with the Department’s designated decision makers/internal reviewers to facilitate the processing of all applications in accordance with the FOI Act. The FOI Unit is the initial
contact point for members of the community, applicants, third parties, the Office of the Information Commissioner and other public sector agencies for all FOI-related matters.
Fees and Charges The rate of fees and charges are set under the FOI Act. Apart from the application fee for non-personal information, all charges are discretionary. Details of fees and charges are listed below:
• Personal information about applicant – no fee• Application fee (for non-personal information) – $30.00• Charge for time taken dealing with the application – $30.00 per hour• Charge for access time supervised by staff – $30.00 per hour• Charges for photocopying – $30.00 per hour for staff time and 20c per copy• Charges for staff time in transcribing information from a tape or other device – $30.00 per hour• Charge for duplicating a tape, film or computer information – actual cost• Charge for delivery, packaging and postage – actual cost
Rights of Review The FOI Act provides that applicants who are dissatisfied with a decision of the Department have the right to have that decision reviewed. In accordance with section 40 of the FOI Act, internal review applications should be forwarded in writing to the Department within 30 calendar days after the date of the Department’s initial Notice of Decision.
Following an internal review, if any matter remains in dispute, applicants are advised of their right to request the Information Commissioner to conduct an “external review” of the matter. In certain instances, questions of law that arise in the course of dealing with a complaint may be referred to the Supreme Court. No fees or charges apply to internal or external reviews.

Page 98 | DPC Annual Report 2010–2011
Documents Held by the Agency
The Department can trace its history through records dating back to the colonial settlement of Western Australia. These historical records (archives) are available for research at the State Archives. Records about the Department’s role and responsibilities will continue to be an important part of the State’s history.
The Department’s records are arranged using activities based classification and include information about the following functions and activities:
Cabinet Support
Civics
Community Relations
Community Response (correspondence received by the Premier on current issues)
Contract Management
Elected Members (administrative support matters for elected members of the State Government)
Equipment and Stores
Establishment
Executive Council
Federal Policy
Financial Management
Fleet Management
Governance (legislative and parliamentary processes)
Government Initiatives (projects of the elected government managed by the Department)
Government Priorities
Government Relations
Honours
Information Management
Inquiries
Intergovernmental Relations
International Relations
Ministers’ Support (administrative support matters for Ministers)
National Policy Reform
Native Title
Parliamentary Support
Personnel
Premier’s Support (administrative support matters for the Premier)
Protocol
Property Management
Publication
Royal Commissions
Royal Visits
Security and Emergencies
Strategic Management
Technology and Communications
Treaties
Vice Regal
Broad categories of documents currently available to the public can be accessed through the Department of the Premier and Cabinet’s website at www.dpc.wa.gov.au (publications, quick links) or by telephoning the Department’s Freedom of Information Unit on 9222 9409 or 9222 9414.

DPC Annual Report 2010–2011 | Page 99
The Department’s Library has an extensive collection of information.
The broad subject areas covered by the Library include: auditing, banking and taxation, economics, financial management, human resource planning, public finance, management, performance management, public administration, political science, training/executive development, sustainability and E-Government.
The library is not open to members of the public; however, access to library material can be obtained through inter-library arrangements.
Public Participation in the Formulation of Policy and Performance of Agency Functions
The Department’s primary mission lies in the provision of services to the Premier and Cabinet. The avenues for public participation in the formulation of the agency’s policy making and performance are limited and depend largely upon the nature of the particular portfolios held by the Premier of the day.
How to Apply to Amend Your Personal Information
You can apply to the FOI Coordinator for correction or amendment of any documents containing your personal information.
The application must be in writing, and you must give as much information as you can to show how or why the Department’s records are inaccurate, incomplete, out of date or misleading.
If the Department decides to amend the information, it will usually alter the record or add a further note in relation to the record.
The Department will inform you of its decision and reasons, together with your right of review, if you are not satisfied.