SAA Annual Conference August 15, 2009 Barbara Aikens aikens@si
Upload
phungkhuongCategory
view
216download
0
Annual Report 2012 / 2013

Mr Malusi GigabaMinister of Public Enterprises
Dear Minister
I have the honour of submitting the Annual Report of the Department of Public Enterprises for the period 1 April 2012 to 31 March 2013.
Mr Tshediso MatonaAccounting OfficerDate: 30 August 2013
ContentsPart a: General InformatIon 1. List Of Abbreviations/Acronyms 32. Strategic Overview 5
2.1 Vision 52.2 Mission 52.3 Values 52.4 Strategic Outcome Orientated Goals 52.5 Legislative and Other Mandates 7
3. Organisational Structure 84. Entities Reporting to the Minister 95. Foreword by the Minister 106. Deputy Minister Statement 127. Overview of the Accounting Officer 15
Part B: PerformanCe InformatIon 1. Statement of Responsibility for Performance Information 172. Auditor General’s Report: Predetermined Objectives 173. Overview of Departmental Performance 17
3.1. Service Delivery Environment And Strategy to Improve Performance 173.2. Service Delivery Improvement Plan 183.3. Organisational Environment 183.4. Key Policy Developments and Legislative Changes 19
4. Strategic Outcome Oriented Goals 195. Performance Information by Programme
5.1. Programme 1: Administration 195.2 Programme 2: Legal and Governance 225.3 Programme 3: Portfolio Management and Strategic Partnerships 28
6. Summary of Financial Information6.1. Departmental Receipts 626.2. Programme Expenditure 626.3. Transfer Payments, Excluding Public Entities 636.4. Public Entities 636.5. Conditional Grants and Earmarked Funds Paid 636.6. Conditional Grants and Earmarked Funds Received 64 Not Applicable Conditional Grants and Earmarked Funds Received 64 Not Applicable6.7. Donor Funds 646.8. Capital Investment, Maintenance and Asset Management Plan 64
Part C: GovernanCe1. Introduction 662. Risk Management 663. Fraud and Corruption 664. Minimising Conflict Of Interest 665. Code of Conduct 676. Health Safety and Environmental Issues 677. Internal Control Unit 678. Audit Committee Report 67
Part D: Human resourCe manaGement1. Legislation that Governs Human Resource Management 692. Introduction 693. Human Resource Oversight Statistics 70
3.1. Personnel Related Expenditure 703.2. Employment and Vacancies 723.3. Job Evaluation 743.4. Employment Changes 753.5. Employment Equity 793.6. Performance Rewards 843.7. Foreign Workers 873.8. Leave Utilisation 873.9. Hiv/Aids & Health Promotion Programmes 903.10. Labour Relations 913.11. Skills Development 933.12. Injury on Duty 953.13. Utilisation of Consultants 95
Part e: fInanCIal InformatIonReport of the Audit Committee 1001. Report of the Accounting Officer 1022. Accounting Officers Statement of Responsibility for Annual Financial Statements 1233. Report of the Auditor-General 1244. Appropriation Statement 1275. Notes to the Appropriation Statement 1386. Statement of Financial Performance 1407. Statement of Financial Position 1418. Statement of Changes in Net Assets 1429. Cash Flow Statement 14310. Notes to the Annual Financial Statements (including Accounting policies) 14411. Disclosures Notes to the Annual Financial Statements 16212. Annexures 17213.

Part a: GENERAL INFORMATION

Annual Report Page 3
GENERAL INFORMATION
1. lIst of aBBrevIatIons/aCronYmsAGM Annual General Meeting
AGSA Auditor General of South Africa
AFS Annual Financial Statement
APP Annual Performance Plan
BBBEE Broad Based Black Economic Empowerment
Capex Capital Expenditure
CCPF Climate Change Policy Framework
CFO Chief Financial Officer
CIPM Chief Investment and Portfolio Management
DAe Denel Aerostructure
DEA Department of Environmental Affairs
DHET Department of Higher Education and Training
DoD Department of Defence
DOE Department of Energy
DoS Deed of Settlement
DPE Department of Public Enterprises
DPME Department of Performance Monitoring and Evaluation
DPSA Department of Public Service and Administration
DPW Department of Public Works
DRDLR Department of Rural Development and Land Reform
DST Department of Science and Technology
DTI Department of Trade and Industry
DWA Department of Water Affairs
EIA Environmental Impact Assessment
ERM Enterprise Risk Management
EWSETA Energy and Water Sector Education Training Authority
FET Further Education Training
HRC Human Rights Commission
ICT Information and Communication Technology
IPAP Industrial Policy Action Plan
IPP Independent Power Producer
IRP Integrated Resource Plan
KLF Komatiland Forest
LTTS Long Term Turnaround Strategy
MDS Market Demand Strategy
MOI Memorandum of Incorporation
MOU Memorandum of Understanding
MTEF Medium Term Expenditure Framework

Annual Report Page 4
GENERAL INFORMATION
MTSF Medium Term Strategic Framework
MYPD Multi Year Price Determination
NCPM National Corridor Performance Measure
NDP National Development Plan
NEF National Empowerment Fund
NGP National Growth Path
NSF National Skills Fund
NT National Treasury
PAIA Promotion of Access to Information Act
PBMR Pebble Bed Modular Reactor
PFMA Public Finance Management Act
PICC Presidential Infrastructure Coordinating Commission
PMO Project Management Office
PPA Power Purchase Agreement
PPPFA Preferential Procurement Policy Framework Act
PSJV Pooling and Sharing Joint Venture
PSP Private Sector Participation
R & D Research & Development
RMC Richtersveld Mining Corporation
SAA South African Airways
SAFCOL South African Forestry Company Ltd
SANReN South African National Research Network
SAQA South African Qualification Authority
SAX South African Express
SDIP Service Delivery Improvement Plan
SIPs Strategic Integrated Projects
SITA State Information Technology Agency
SKA Square Kilometer Array Telescope
SMF Significant and Materiality Framework
SMME Small Medium and Micro Enterprises
SCM Supply Chain Management
SOC State Owned Companies
TFR Transnet Freight Rail
TOR Terms of Reference
TPT Transnet Port Terminal
TRE Transnet Rail Engineering
TWG Technical Working Group
UNGC United Nations Global Compact
WWF World Wide Fund
YEP Youth Economic Participation
WACS West Africa Cable System

Annual Report Page 5
GENERAL INFORMATION
2. strateGIC overvIeW
2.1 vision To drive investment, productivity and transformation in the Department’s portfolio of State Owned Companies (SOC), their customers and suppliers so as to unlock growth, drive industrialisation, create jobs and develop skills.
2.2 missionThe State Owned Companies (SOC) are strategic instruments of industrial policy and core players in the New Growth Path (NGP). The Department aims to provide decisive strategic direction to the SOC, so that their businesses are aligned with the national growth strategies arising out of the NGP. It will do this by ensuring that their planning, investments and activities are in line with government Medium Term Strategic Framework (MTSF) and the Minister’s delivery agreement commitments.
2.3 valuesBold – we must dare to be brave.Professional – we must deliver work that reflects a professional level of care and skill.Caring – this must be expressed in how we watch over and support the Department’s people.Integrity – we must do the right thing irrespective of implications.Fun – create an environment where people look forward to coming to work.Passion – we are out to make the South African economy competitive – this requires high passion.Batho Pele principles – guide our engagements with our clients and other stakeholders.
2.4 strategic outcome orientated goalsThe current MTSF 2009-2014 outlines government’s outcomes and strategic priorities needed to be achieved to realise these outcomes. The SOC overseen by the Department contribute to a number of these outcomes including accelerating investment in the economy, promoting industrialisation in particular growth of advanced manufacturing and socio-economic advancement of communities in which they operate. Through its oversight function, the Department ensures that SOC investment and operational activities contribute to these outcomes.
The Minister entered into the Performance Agreement with the President, which outlines his commitments to contribute to the achievement of these outcomes. The Minister of Public Enterprises’ performance agreement forms part of the Delivery Agreement on Outcome 6 which seeks to achieve an efficient, competitive and responsive economic infrastructure network. This forms the core mandate of the Department in the current administration period. In this regard, the progress below reflects achievement by the SOC reporting to the Department:
Ensuring reliable generation, distribution and transmission of electricity In 2005, the government embarked on the build programme to balance the growing demand of electricity against the supply capacity. This included investment into the construction of new coal power stations, return to service of mothballed power stations and the upgrading and expansion of transmission and distribution networks. The capital expenditure programme which include upgrades and capacity expansion is estimated to be between R450 billion and R500 billion for the period ending in 2017. R301 billion will be invested in the capacity expansion programme.

Annual Report Page 6
GENERAL INFORMATION
The capacity expansion programme includes the two coal fired power stations (Medupi and Kusile) that will deliver 9 564MW, Ingula pump storage scheme in Drakensberg that will deliver 1 332MW of hydroelectricity during peak demand periods, as well as the expansion and strengthening of the transmission and distribution network. The progress on the delivery of the programme has been crucial to avert the rolling blackouts last experienced in 2008. Eskom has continued to accelerate expenditure on its current build programme with 65 per cent of construction completed by end of the financial year at Medupi and 22 per cent and 68 per cent completed at Kusile and Ingula, respectively. The delivery of Medupi Unit 6 continues to be a focal point and the full impact of the recent problems will be assessed and recovery plan developed to meet the deadline.
The return to service programme has largely been completed putting much needed additional capacity to the national grid. In the 2012/13 financial year, 260MW of generating capacity was added to the system and 787KM of high voltage transmission lines installed.
In the year under review in terms of Presidential Infrastructure Coordination Committee (PICC), Eskom has been assigned to coordinate Strategic Integrated Projects (SIPs) 8, 9 and 10. These SIPs are focused on introduction of renewable energy, accelerating the generation programme in line with IRP 2010 projections to meet electricity demand of the economy and expansion of transmission and distribution networks to address historical imbalances.
Ensuring the maintenance and strategic expansion of our road and rail network, and the operational efficiency, capacity and competitiveness of our sea ports
Transnet has continued to implement the Market Demand Strategy (MDS) that increased its investment programme to over R300 billion over seven years which commenced in 2011. The MDS is crucial to aggressively drive volume growth and contribute towards the migration of freight from road to rail and improvement of capacity and efficiency of sea ports.
In the year under review, Transnet increased the volumes transported via rail by 5 per cent. Despite the slowing economic and export activities, Transnet has sustained rail volumes above 200 million tons per annum. In the 2012/13 financial year, Transnet increased its investment activity to just below R31 billion compared to R21.5 billion in 2011/12 financial year. The investments undertaken by Transnet and improvement in operational process have contributed to increased efficiencies within the ports and General Freight Business.
Progress has been made to move the transportation of coal from road to Rail. Eskom has completed construction of the Camden and Tutuka containerised coal terminals. The Department has approved the construction of the Majuba heavy haul line project and construction has commenced. In the period under review, 10.1 million tons of coals were transported by rail.
Transnet has been assigned the responsibility of coordinating SIP 1 which is focused on unlocking the northern mineral belt through rapidly expanding rail capacity and SIP 2 on the Durban-Free State-Gauteng Corridor.
Expand access to Information and Communication Technologies (ICT)
Broadband wholesale prices continued to decrease since the entry of Broadband Infraco into the market. Broadband Infraco remains resolute in its endeavour to expanding the availability and affordability of access to electronic communications, including but not limited to underdeveloped and under serviced areas as outlined in its statutory mandate.
In this regard, Broadband Infraco has made progress in ensuring that it is able to provide affordable, reliable and readily available broadband connectivity, partly in order to support projects of national importance such as Square Kilometer Array Telescope (SKA), South African National Research Network (SANReN) and MeerKAT.Significant progress has been made to improve international connectivity and reduce the cost. The West
Annual Report Page 7
GENERAL INFORMATION
Africa Cable System (WACS) was commissioned in the first quarter of 2012/13. The Department continues to engage policy department to ensure that the policy framework is supportive to the expansion of infrastructure investment to improve current access.
Contribution to other outcomes
Decent employment through inclusive growth
Reindustrialisation of the economy is crucial to respond to the challenges of unemployment and accelerating growth. In this regard, the infrastructure spend by SOC has been leveraged to enhance capabilities of existing industries and create new industrial capabilities to increase local content in the build programme. Further, the Department has worked with its SOC to improve the participation of the previously disadvantaged in their value chains.
The turnaround plan being implemented by Denel is fundamental to development of advanced manufacturing as outline in the Industrial Policy Action Plan (IPAP). The company has expanded its order book largely through development of new export markets.
Rural development
Creation of dynamism rural economy that builds on the latent potential of rural economies is crucial for a vibrant, equitable, and sustainable rural communities and food security for all. DPE has two SOC whose activities are primarily in rural areas of the country i.e. SAFCOL and Alexkor.
SAFCOL operations are located in the rural regions of Mpumalanga, Limpopo and Northern Kwazulu Natal. In order to identify socio-economic interventions required for upliftment of the communities, the SOC has concluded social compacts with all the communities surrounding its eighteen plantations. The primary deliverable has been provision of classrooms, school administration blocks, and clinics. Since 2009/10 financial year, when the social compacts were started, SAFCOL has spent R21 million on initiatives flowing from the compact.
Alexkor, which is located in the Richtersveld region of Northern Cape Province, has completed the infrastructure upgrade of Alexandra Bay as part of the Deed of Settlement (DoS) obligations. The construction of road network, stormwater and waste water treatment facilities, installation of water and electricity reticulation system and street lighting, are some of the infrastructure programmes carried out successfully. The programme has been undertaken at a cost of R142 million, which is part of a total allocation of R599 million for settling of DoS obligations.
2.5 legislative and other mandatesDPE exercises shareholder oversight of eight SOC. All the SOC are incorporated as companies in accordance with the provisions of the Companies Act, 2008. Except for Denel, all the SOC are established in terms of their own enabling legislation which sets out the purpose, mandate and objectives for which they were founded. DPE is both the founder and the administrator/custodian of all legislation relating to the establishment of SOC.
In terms of section 63(2) of the Public Finance Management Act 1 of 1999, as amended (the PFMA), the Minister of Public Enterprises has, inter alia, the responsibility of ensuring that the SOC comply with the PFMA legislation and policies of the Department.

Annual Report Page 8
GENERAL INFORMATION
3. orGanIsatIonal struCture
MinisterPublic Enterprises
Deputy MinisterPublic Enterprises
Director-GeneralPublic Enterprises
Programme 2Legal and
Governance
Programme 3Portfolio Management
and StrategicPartnerships
Corporate Management
Programme 1Administration
Energy and BroadbandEnterprises
ManufacturingEnterprises
Strategic Partnerships
Economic Impact and
Policy Alignment
TransportEnterprises

Annual Report Page 9
GENERAL INFORMATION
4. entItIes rePortInG to tHe mInIsterThe table below indicates the entities that report to the Minister.
Name of Entity Legislative Mandate Financial Relationship Nature of Operations
Alexkor Alexkor Limited Act 116 of 1992
Shareholder Alexkor mines diamonds in the Alexander Bay area, including marine mining and land mining.
Aventura Overvaal Resorts Act 127 of 1993
Shareholder Leisure resort company in the process of being liquidated.
Broadband Infraco
Broadband Infraco Act 33 of 2007
Shareholder Broadband Infraco was established as a state-led intervention to introduce competition in the telecommunications market and contribute to increasing access to broadband services including underserviced areas.
Denel None Shareholder Denel supply South Africa’s forces with strategic and sovereign capabilities. It also plays a major role in contributing to the development of South Africa’s advanced manufacturing capabilities.
South African Airways
South African Airways Act 5 of 2007
Shareholder South African Airways is South Africa’s national air carrier owned by Government. It is a full service network operating international, regional and domestic scheduled services.
South African Express
South African Express Act 34 of 2007
Shareholder South African Express operates regional and domestic flights from OR Tambo International Airport in Johannesburg, serving secondary routes in South Africa and Africa.
South African Forestry Company
Management of State Forests Act 128 of 1992
Shareholder South African Forestry Company manages and develops commercial forests. The company’s activities include forestry management and timber harvesting and processing.
Eskom Eskom Conversion Act 13 of 2001
Shareholder Eskom generates 95 per cent of the electricity used in South Africa and 45 per cent of the electricity used in Africa.
Transnet Legal Succession to the South African Transport Services Act 9 of 1989
Shareholder Transnet is the largest and most crucial part of the freight logistics chain that delivers goods to every South African.
Annual Report Page 10
GENERAL INFORMATION
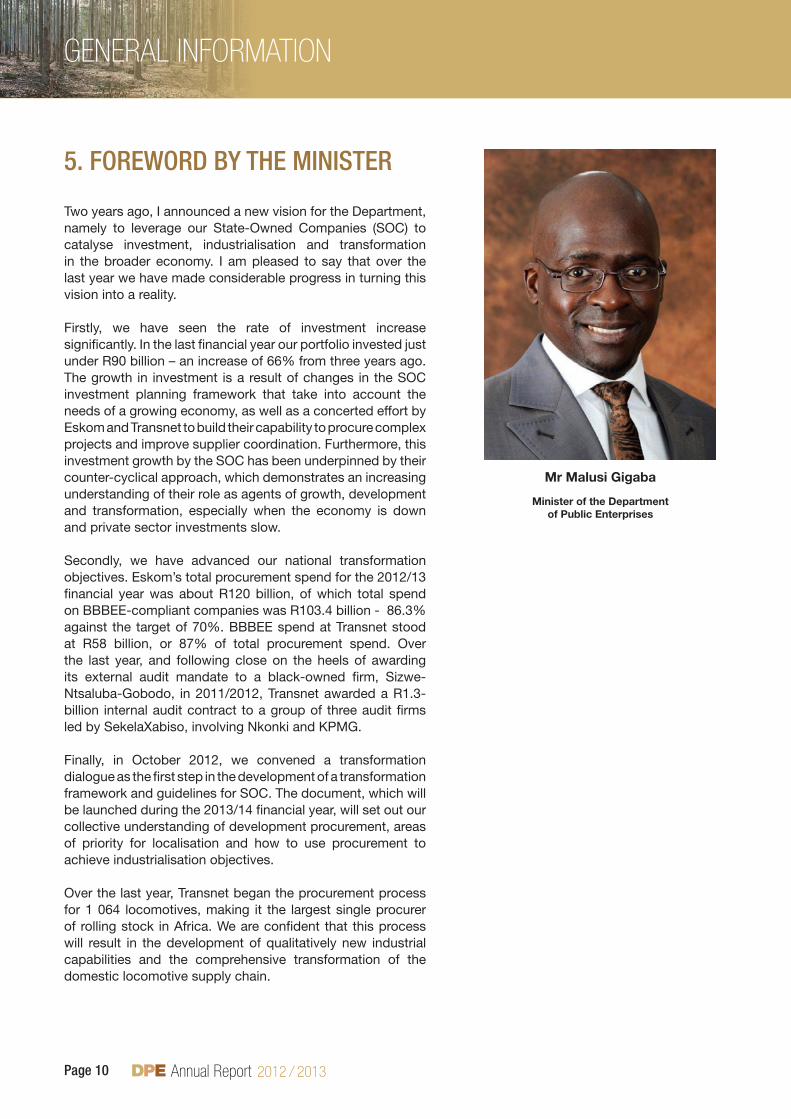
5. foreWorD BY tHe mInIster
Two years ago, I announced a new vision for the Department, namely to leverage our State-Owned Companies (SOC) to catalyse investment, industrialisation and transformation in the broader economy. I am pleased to say that over the last year we have made considerable progress in turning this vision into a reality.
Firstly, we have seen the rate of investment increase significantly. In the last financial year our portfolio invested just under R90 billion – an increase of 66% from three years ago. The growth in investment is a result of changes in the SOC investment planning framework that take into account the needs of a growing economy, as well as a concerted effort by Eskom and Transnet to build their capability to procure complex projects and improve supplier coordination. Furthermore, this investment growth by the SOC has been underpinned by their counter-cyclical approach, which demonstrates an increasing understanding of their role as agents of growth, development and transformation, especially when the economy is down and private sector investments slow.
Secondly, we have advanced our national transformation objectives. Eskom’s total procurement spend for the 2012/13 financial year was about R120 billion, of which total spend on BBBEE-compliant companies was R103.4 billion - 86.3% against the target of 70%. BBBEE spend at Transnet stood at R58 billion, or 87% of total procurement spend. Over the last year, and following close on the heels of awarding its external audit mandate to a black-owned firm, Sizwe-Ntsaluba-Gobodo, in 2011/2012, Transnet awarded a R1.3-billion internal audit contract to a group of three audit firms led by SekelaXabiso, involving Nkonki and KPMG.
Finally, in October 2012, we convened a transformation dialogue as the first step in the development of a transformation framework and guidelines for SOC. The document, which will be launched during the 2013/14 financial year, will set out our collective understanding of development procurement, areas of priority for localisation and how to use procurement to achieve industrialisation objectives.
Over the last year, Transnet began the procurement process for 1 064 locomotives, making it the largest single procurer of rolling stock in Africa. We are confident that this process will result in the development of qualitatively new industrial capabilities and the comprehensive transformation of the domestic locomotive supply chain.
Mr Malusi Gigaba
Minister of the Department of Public Enterprises
Annual Report Page 11
GENERAL INFORMATION
Another significant event was the Supplier Development Summit, hosted by DPE and attended by SOC suppliers, customers and other key stakeholders. The SOC used the summit to communicate their next-generation supplier development, localisation and transformation plans and to explore how they and large companies in strategic sectors can collaborate around supplier development to create a truly national effort. In this way, our downstream linkages are targeted in order to create decent work opportunities and expand the national technical skills base. Over the last year, Denel returned an unaudited profit of R60 million, ending a long period of losses. We have made significant progress in stabilising Broadband Infraco and gearing the company up for considerable growth. SAA had a turbulent year in terms of leadership and overall financial performance. However, we took pride in the staff of the airline who ensured that despite all these challenges, the company retained high levels of operational and technical performance. The awards SAA won as a result elevated the names of both the airline and our country. I salute each and every one of the staff of SAA and South Africa Express for their dedication to their work and their brands.
I am confident that, with the appointment of the new chairperson and CEO, SAA will be stabilised and the company’s turnaround plan successfully implemented. The Department will continue to monitor the situation extremely closely given the low margins in the commercial aviation sector globally.
Our shareholder model is based on activism-oversight, entity stability, policy alignment and economic co-ordination so as to optimise the impact of the SOC in the economy. We also recognise that the dualistic nature of the SOC mandate –straddling commercial and developmental imperatives – poses unique complexities in comparison to the private sector. SOC are expected to fulfil both obligations through their balance sheet. As the Department entrusted with shareholding, we will continue to push for them to ascribe equal priority to development and commercial objectives. Development objectives and industrailisation are one of the justifications for government to retain ownership of strategic sectors in the economy.
During the coming year, we will mobilise our entire SOC portfolio, along with their customers and suppliers, to give added momentum to a comprehensive industrialisation and transformation programme. SOC will be expected to develop set-asides to target women and youth entrepreneurs in their enterprise development programmes and catalytic transformation programmes. We will reach out to our large private sector customers and suppliers in various sectors of the economy to collaborate with the SOC in developmental programmes. Finally, we will also draw on our influence over SOC-related pension funds to provide additional leverage to this process.
I am happy to report that the Department has filled all the vacants Deputy Directors-General posts and Cabinet has approved our candidates. We have been robust in ensuring that all posts are filled within reasonable time to ensure no prolonged acting positions and no disruption to our important work.
I would like to thank the Deputy Minister, Honourable Bulelani Magwanishe, the Director-General, Mr Tshediso Matona, and the vibrant team of Deputy Directors-General and other staff for their support, diligence and dedication to our Department and Government.
Thank you.
Malusi GigabaMinister of the Department of Public Enterprises

Annual Report Page 12
GENERAL INFORMATION
6. foreWorD BY tHe DePutY mInIster
During the year under review, the Department of Public Enterprises engaged communities and strengthened the relations between our State Owned Companies (SOC) and communities. We believe that these engagements have created a platform for dialogue that increases our state-owned enterprises’ awareness of the social dimension of our country and how they can make difference. The dialogue targeted communities where our SOC are operating. In addition to aligning our SOC programmes with those of provinces, the platform served to expose young people to the skills development, enterprise development and work opportunities within our portfolio of SOC We believe that economic transformation, economic development and industralisation are mutually inclusive and that programmes such as our SOC dialogues create an enabling environment for the previously disadvantaged to grow thriving businesses.
Our SOC are strategic drivers of special development programmes that are meant to change the socio-economic landscape of South Africa in particular revival of rural economy. We promote the ethos that SOC contribution to the eradication of poverty, unemployment and social inequality should be discharged through corporate social investment (CSI) in a way that advances sustainable development. By design, CSI is meant to focus on community investments and building social infrastructure as a community asset. This should be based on development philosophy that is community orientated. To ensure consensus and a shared sense of ownership of the development model we are establishing, we have been interacting with provincial governments and social partners. The interactions with social partners and provinces are already bearing fruits. The province of KwaZulu-Natal and Eskom, for instance, hosted a supplier summit led by youth organisations. The engagements with social partners are an ongoing process.
I am pleased with our progress to coordinate the socio-economic contribution of the SOC even though it is at institutional level for now. We have established a forum where managers of the SOC CSI functions and CEOs of SOC foundations can redirect and maximise the developmental impact of SOC in communities. The institutionalisation of the collaborative efforts with SOC foundations will improve resource allocation and support national development programmes. We are confident that through this coordinated approach, we will make the best use of the financial and human resources of all the SOC address immediate social development needs and assist our
Mr Gratitude Magwanishe
Deputy Minister of the Department of Public Enterprises

Annual Report Page 13
GENERAL INFORMATION
SOC to contribute to local economic infrastructure projects. We are busy developing a corporate social investment framework, which will inform the creation of a centralised pool of resources. This is seen as an opportunity for collective planning that will avoid polarisation of interventions . We are furthermore pursuing partnerships with further education and training (FET) colleges, which will see SOC supporting these institutions with funding, teaching material and technical equipment. We are also in conversation with our SOC to ensure that the disposal of their assets benefits universities and FETs in rural areas. Through Eskom and Transnet, we continue to sign memorandums of understanding with individual FET colleges to affirm our commitment to expand engineering skills base .
In addition to the above initiatives, the Department of Public Enterprises led a delegation of three departments, represented by two deputy ministers from Department of Rural Development and Land Reform and Mineral Resources and officials, to the Richtersveld community. Collaboration between the three departments has created jobs and opportunities for young people to receive training relevant to the economic development plans for the area. Alexkor is currently focusing on unlocking the Community Joint Venture value. The planned investment activities will see carat production double from the current 35 000 carats per annum to over 70 000 in the next five years. Over 500 direct jobs are expected to be created.
Our industrial development strategy has identified the forestry industry as a critical sector due to its labour-intensive nature. The sector could contribute to the revival of rural economies through furniture production and support for property markets. The operations of the South African Forestry Company Limited (SAFCOL) are located in rural, impoverished areas. Its business strategy is based on building strong relationships with surrounding communities and using financial contributions to uplift these communities. The Department is presently assessing different business models and institutional structures to find a way for SAFCOL’s human and financial resources to make the biggest possible developmental impact. We will also pursue partnerships with the private sector in all our socio-economic initiatives, ranging from
infrastructure refurbishment, donation of equipment and development of incubator hubs in the coming year.
Following the Cabinet decisions in 2001 and 2010 on PBMR and Aventura respectively, I am pleased to announce that the closure of these two entities, including the disposal and preservation of their assets, is almost finalised.
Our relationships with other departments are bound to be strengthened through, inter alia, discussions with MISA. We are hopeful that SOC graduates who have not been absorbed by their sponsoring companies will be posted to work in MISA projects. This will positively impact on the high rate of youth unemployment. In conclusion I thank the Minister, Mr. Malusi Gigaba, for his leadership, warmth and counsel, the Director-General, Mr Tshediso Matona, for his probing management style, and my colleagues at DPE for their support. I also thank the boards and management teams of the SOC for their support during the past year.
Gratitude MagwanisheDeputy Minister of the Department of Public Enterprises
Annual Report Page 14
GENERAL INFORMATION
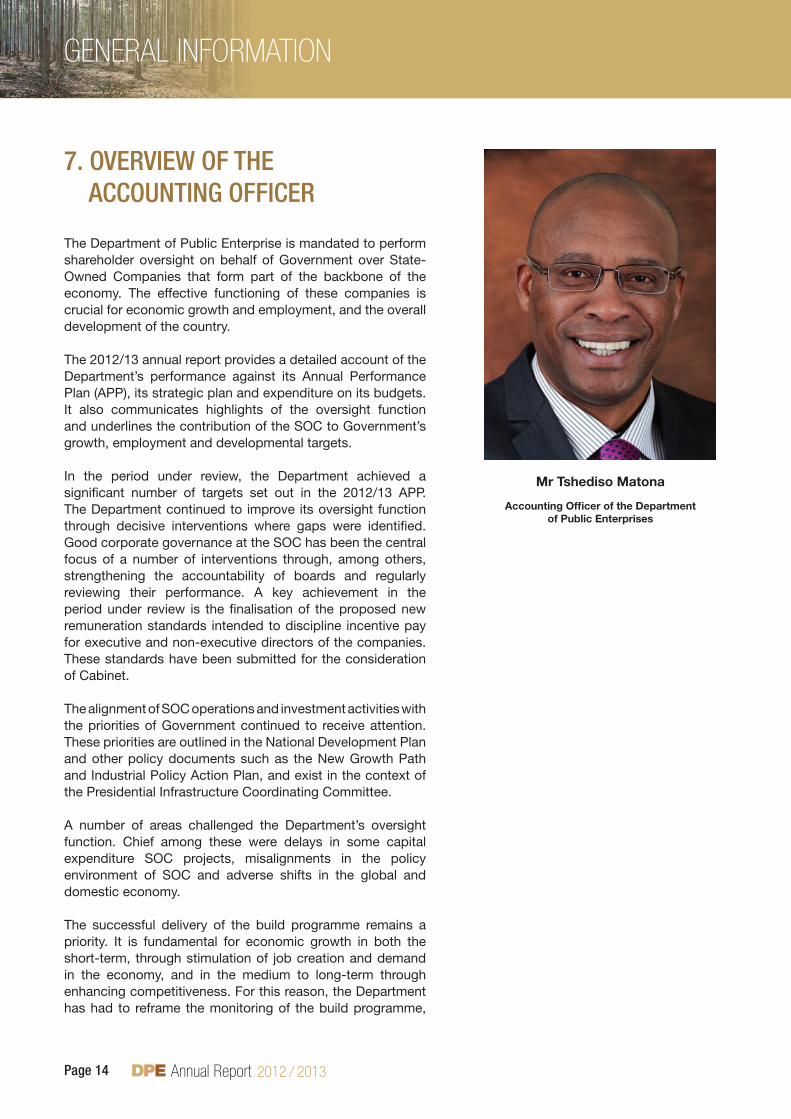
7. overvIeW of tHe aCCountInG offICer
The Department of Public Enterprise is mandated to perform shareholder oversight on behalf of Government over State-Owned Companies that form part of the backbone of the economy. The effective functioning of these companies is crucial for economic growth and employment, and the overall development of the country.
The 2012/13 annual report provides a detailed account of the Department’s performance against its Annual Performance Plan (APP), its strategic plan and expenditure on its budgets. It also communicates highlights of the oversight function and underlines the contribution of the SOC to Government’s growth, employment and developmental targets.
In the period under review, the Department achieved a significant number of targets set out in the 2012/13 APP. The Department continued to improve its oversight function through decisive interventions where gaps were identified. Good corporate governance at the SOC has been the central focus of a number of interventions through, among others, strengthening the accountability of boards and regularly reviewing their performance. A key achievement in the period under review is the finalisation of the proposed new remuneration standards intended to discipline incentive pay for executive and non-executive directors of the companies. These standards have been submitted for the consideration of Cabinet.
The alignment of SOC operations and investment activities with the priorities of Government continued to receive attention. These priorities are outlined in the National Development Plan and other policy documents such as the New Growth Path and Industrial Policy Action Plan, and exist in the context of the Presidential Infrastructure Coordinating Committee.
A number of areas challenged the Department’s oversight function. Chief among these were delays in some capital expenditure SOC projects, misalignments in the policy environment of SOC and adverse shifts in the global and domestic economy.
The successful delivery of the build programme remains a priority. It is fundamental for economic growth in both the short-term, through stimulation of job creation and demand in the economy, and in the medium to long-term through enhancing competitiveness. For this reason, the Department has had to reframe the monitoring of the build programme,
Mr Tshediso Matona
Accounting Officer of the Department of Public Enterprises
Annual Report Page 15
GENERAL INFORMATION
especially Eskom’s projects, as a key focus of its oversight responsibilities. This will entail proactively identifying project risks and ensuring they are promptly addressed. An example of this approach was when Minister Malusi Gigaba brokered a new labour accord among contractors, trade unions and Eskom to prevent further project delays due to labour unrest at the Medupi Power Station construction site.
The continued adverse economic environment has had a profound impact on the financial sustainability of some of the SOC. As a result, the Department has supported the SOC to review their business strategies and models to ensure they remain financially stable and can effectively deliver on their mandates. Subsequently, some companies experienced a turnaround in their profitability and others received increased government support through guarantees.
The capacity of the Department received a modest boost in the period under review through the creation of 12 posts for which National Treasury allocated funding. The additional posts have slightly increased the vacancy rate. The Department is addressing the situation and has made 44 appointments during the financial year under review. The Department will continue to focus on the retention and attraction of critical skills in the senior echelons of its structure.
In conclusion, I wish to thank Minister Malusi Gigaba for his inspirational leadership, Deputy Minister Bulelani Magwanishe for his invaluable support, the Deputy Directors-General, other managers, professionals and all the staff of the Department for their hard work to deliver the performance outlined in this annual report.
Tshediso MatonaAccounting Officer of the Department of Public Enterprises

Part B: PERFORMANcE INFORMATION
Annual Report Page 17
PERFORMANcE INFORMATION
1. statement of resPonsIBIlItY for PerformanCe InformatIon
Statement of Responsibility for Performance Information for the year ended 31 March 2013
The Accounting Officer is responsible for the preparation of the department’s performance information and for the judgements made in this information.
The Accounting Officer is responsible for establishing, and implementing a system of internal control designed to provide reasonable assurance as to the integrity and reliability of performance information.
In my opinion, the performance information fairly reflects the performance information of the department for the financial year ended 31 March 2013.
Tshediso MatonaAccounting Officer of the Department of Public Enterprises
2. auDItor General’s rePort: PreDetermIneD oBJeCtIvesThe AGSA currently performs the necessary audit procedures on the performance information to provide reasonable assurance in the form of an audit conclusion. The audit conclusion on the performance against predetermined objectives is included in the report to management, with material findings being reported under the Predetermined Objectives heading in the Report on other legal and regulatory requirements section of the auditor’s report.
Refer to page 100 of the Report of the Auditor General, published as Part E: Financial Information.
3. overvIeW of DePartmental PerformanCe
3.1 service Delivery environment and strategy to Improve Performance The role of the Department continues to evolve given the expanding role of SOC in the economy. The continued subdued economic activities have placed the build programme by SOC at the centre of the government economic strategy to stimulate economic activities, crowd-in private sector investment and support the goal of reindustrialising the South African economy.

Annual Report Page 18
PERFORMANcE INFORMATION
Enhancing oversight on SOC is crucial to ensure that SOC activities remain aligned to the national priorities. In this regard, the Department needs to rapidly improve its shareholder management model and strengthen its implementation. The current legislative framework is not sufficient to allow the Department to effectively intervene. In the 2013/14 financial year, the Department will work towards finalising the legislation to regulate the oversight function.
In the year under review, Eskom and Transnet have accelerated their investment activities to over R80 billion. The launch of the SIPs, in particular, SIP 1 and SIP 2 has supported the acceleration of the build programme by SOC. In this regard, the Department needed to develop appropriate institutional framework to support the SOC in the coordination of SIPs. New governance structures will be implemented to enhance the coordination of SIPs lead by the SOC reporting to the Department. The launch of the National Development Plan (NDP) has required the Department to reassess its strategic priorities and the investment activities of its SOC to ensure their alignment to the overarching vision outlined in the NDP. While the objectives of the Department and vision of its SOC are aligned to the NDP, continuous assessment of the contribution to the achievement of the NDP vision is crucial.
3.2 service Delivery Improvement PlanThe SOC within the ambit of the Department provide services to the public, which are crucial for the overall competitiveness and growth of the economy and meeting socio-economic needs of communities. Improvements related to provision of these services are captured in the Shareholder Compacts with the SOC and the Department track progress on a quarterly basis. SOC are required to develop plans to improve the provision of these services.
3.3 organisational environment In the 2011/12 financial year, the Department consisted of six programmes, following the organisational review, these were consolidated into three programmes namely:
• Programme1-Administration,• Programme2-LegalandGovernance;and• Programme3-PortfolioManagementandStrategicPartnerships.
Programme 3 now consists of five sub programmes: Energy and Broadband Enterprises; ManufacturingEnterprises; Transport Enterprises; Economic Impact and Policy Alignment and Strategic Partnerships.Previously, these sub programmes were independent programmes with the exception of Strategic Partnerships, which is a new sub programme, and the conversion of the Joint Facility to Economic Impact and Policy Alignment. The changes in the organisational structure have also resulted in an increased number of posts on the establishment. This has been crucial to ease the capacity constraints that have been experienced by the Department over the past financial years. The Department has undergone a recruitment drive to attract the right talent required to carry out its mandate.
While the Department has increased the number of posts in the establishment, retaining and attracting people with the required skills remains a challenge. This is largely due to the current public service remuneration framework that limits the ability of the Department to compete for these skills. The Department is employing alternative strategies to build a pool of these skills through its Graduate and Internship Programmes.

Annual Report Page 19
PERFORMANcE INFORMATION
3.4 Key policy developments and legislative changesSince 2009, the government has developed and implemented policies to support the creation of decent work as the primary objective of economic policy. The increased emphasis on infrastructure as an important job driver, to directly create employment as well as indirectly through improving efficiencies across the economy, places SOC under the Departments supervision at the forefront of the government’s strategy to respond to the current socio-economic challenges.
Greater policy cohesion and supportive policy environment is crucial to drive investment in the economy by SOC. This will continue to inform engagements between the Department and policy Departments to create an environment conducive for SOC to effectively execute their mandates.
The approval of the NDP will shape the current and future plans of the Department including its SOC. The initial work undertaken by the Department showed that its current plans were aligned to the overarching vision of the NDP and the focus is on the implementation of these plans.
4. strateGIC outCome orIenteD GoalsProgress on the Strategic Outcome Oriented Goals is provided under section 2.4 of Part A of this annual report.
5. PerformanCe InformatIon BY ProGramme
5.1 Programme 1: administration Purpose: provide strategic management, direction and administrative support to the department which enables the department to meet its strategic objectives.
Sub programmes
Office of the Director-General is responsible for establishment of effective and efficient systems of financial and risk management and provision of strategic leadership.
Corporate Services is responsible for:Security and Facilities Management which provides a safe and secure environment and internal administration and facilities services to internal customers. Information Management and Technology is responsible for IT infrastructure and support, Records Management and Library Services.
Office of the Chief Financial Officer is responsible for Financial Management Services to ensure compliance with the PFMA and Treasury Regulations and efficient and effective supply chain management services.
Human Resources is responsible for assisting line management to implement operational excellence and developing the Human Capital potential in the department.
Communications isresponsibleforrepositioningthedepartmentasanactivistshareholder;maketheDPEbrandrelevantandmeaningfultoordinarySouthAfricans;impactmediarelationsandmediacommunicationand improve employee engagement.

Annual Report Page 20
PERFORMANcE INFORMATION
Strategic Planning, Monitoring and Evaluation is responsible for coordination, management and oversight ofoutcomesbasedperformancereportingofthedepartment;implementationofperformancemonitoringandevaluation processes for individual programmes and business units as a mechanism for measuring delivery of our strategic objectives and reporting to various stakeholders.
Inter-Governmental and Stakeholder Relations is responsible for coordination, support and provision of advice to the Minister, Deputy Minister, Director-General and the department on matters related to the Inter-Governmental, International and Stakeholder Relations.
Internal Audit assists the Accounting Officer and the Audit Committee in the effective discharge of their responsibilities. The function provides independent analysis, appraisals, recommendations, counsel and information concerning the activities reviewed, with a view to improving accountability and performance.
Office Accommodation is for the devolution of funds from the Department of Public Works (DPW) for the DPE premises.
Strategic Objectives
Sound financial management policies and practices.•High performance culture.•Effective, efficient and timeous recruitment and selection to ensure an adequately capacitated •department.Provide strategic communication support that aligns with the department’s goals and objectives to the •executive leadership.Coordination, management and oversight of outcomes based performance reporting; performance•monitoring and evaluation and reporting to stakeholders.
Strategic objectives and Key achievements
In the period under review, Programme 1 continued to focus on ensuring the appropriate capacitation of the Department and compliance to legislative requirements in terms of the PFMA. In the 2012/13 financial year, 47 new appointments were made in the Department, with most appointments at the senior management level. This increased the filled posts from 172 in the 2011/12 financial year to 200 at the end of the 2012/13 financial year. While the Department’s vacancy rate is higher than the 10 per cent target, the funding of additional posts was approved in the third quarter of 2012/13 financial year and increased the number of vacant positions. If these posts are excluded, the vacancy rate for the year is within the target of 10 per cent.
The Department has continued to strengthen the systems to ensure a sound supply chain environment. The successes of the systems and institutionalisation of 100 per cent adherence to the PFMA resulted in the continued achievement of the clean audit. In the current financial year, the Department spent 99,3 per cent of its budget.
In response to the Outcomes Framework published by the Department of Performance Monitoring and Evaluation (DPME) at the Presidency, the Department has established a dedicated unit to improve planning and monitoring within the Department. In this regard, the Department held quarterly reviews to assess the Department’s performance against the Annual Performance Plan (APP) targets. In order to institutionalise the outcomes based framework within the Department, a workshop was held on the SMART1 principles and was moderated by the World Bank. The Department has embarked on engaging provincial departments to enhance the coordination of the SOC investment activities and the provincial infrastructure plan. In this regard, six provinces have been visited (Gauteng, Northern Cape, Eastern Cape, North West, Free State and KwaZulu-Natal) and the remaining three provinces will be visited in the new financial year. Four of the six provinces have set up teams led by the Deputy Minister of Public Enterprises to ensure alignment of economic plans of the SOC and Provinces.
Annual Report Page 21
PERFORMANcE INFORMATION
In the new financial year projects emanating from consultations with provinces will be announced. While the Department has put systems in place to ensure that suppliers are paid within 30 days, there are some invoices that were paid after 30 days. In the year ahead, the Department will introduce new mechanisms to fast track the processing of invoices to ensure the payment of all invoices within 30 days. The Department will also introduce disciplinary measures for non-compliance.
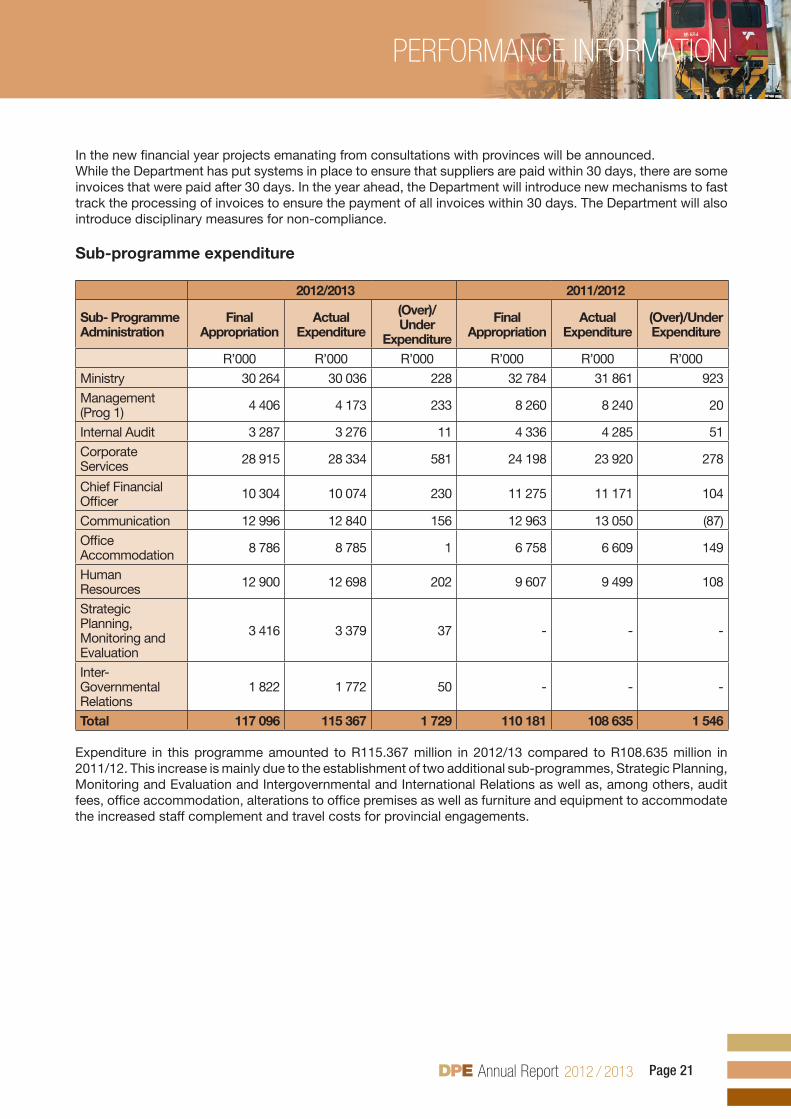
Sub-programme expenditure
2012/2013 2011/2012
Sub- Programme Administration
Final Appropriation
ActualExpenditure
(Over)/Under
Expenditure
Final Appropriation
ActualExpenditure
(Over)/Under Expenditure
R’000 R’000 R’000 R’000 R’000 R’000
Ministry 30 264 30 036 228 32 784 31 861 923
Management (Prog 1) 4 406 4 173 233 8 260 8 240 20
Internal Audit 3 287 3 276 11 4 336 4 285 51
Corporate Services 28 915 28 334 581 24 198 23 920 278
Chief Financial Officer
10 304 10 074 230 11 275 11 171 104
Communication 12 996 12 840 156 12 963 13 050 (87)
Office Accommodation 8 786 8 785 1 6 758 6 609 149
Human Resources 12 900 12 698 202 9 607 9 499 108
Strategic Planning, Monitoring and Evaluation
3 416 3 379 37 - - -
Inter-Governmental Relations
1 822 1 772 50 - - -
Total 117 096 115 367 1 729 110 181 108 635 1 546
Expenditure in this programme amounted to R115.367 million in 2012/13 compared to R108.635 million in 2011/12. This increase is mainly due to the establishment of two additional sub-programmes, Strategic Planning, Monitoring and Evaluation and Intergovernmental and International Relations as well as, among others, audit fees, office accommodation, alterations to office premises as well as furniture and equipment to accommodate the increased staff complement and travel costs for provincial engagements.

Annual Report Page 22
PERFORMANcE INFORMATION
5.2 Programme 2: legal and GovernancePurpose: Provide legal services and corporate governance systems, and facilitate the implementation of all legal aspects of transactions that are strategically important to the department, and state owned companies, and ensure alignment with government’s strategic intent by, amongst others, monitoring the state owned companies’ indicators.
Sub programme
Management • comprises the office of the Deputy Director-General, which provides strategic leadership and management of the programme personnel. Legal provides internal legal services and support to state owned companies. The unit provides legal •services, including transaction and contract management support to the department, and work specifically related to the commercial activities of the sector teams in respect of state owned companies within their oversight. Governance • develops and manages effective corporate governance and shareholder management systems for the department and its portfolio of state owned companies. These includes: risk management, which identifies,reportsonandmonitorsboththeoperationalandshareholderrisks;compliance,whichensuresthat the department establishes and implements systems and processes to ensure the department and its state owned companies comply with legislative, regulatory and supervisory requirements, in line with international best practice; and secretariat, which has the overarching responsibility of recording andtracking the department’s operational and strategic activities to achieve coordination and compliance with decisions and resolutions.
Strategic Objectives
Ensure effective shareholder oversight of all SOC by:
Providing legal services, which includes transaction and contract management support, to the department •as and when required over the Medium Term Expenditure Framework (MTEF) period. Ensuring that risk management processes are embedded throughout the department as and when they are •required over the MTEF period. Addressing constraints on SOC contract negotiations and management to improve commercial competence •and contribute to economic growth and development on a regular basis.Providing assistance on developing and negotiating shareholder compact frameworks annually in terms of •the PFMA.Ensure that SOC and the department comply with the relevant legislation governing their operations, and •applicable laws such as the PFMA, the Public Audit Act (2004), Companies Act (2008), and environmental management, tax, labour, knowledge management, property, intellectual property, information security, procurement and other laws through establishing a structured compliance function within the unit. Providing guidance on appropriate delegation frameworks between the boards and executive management •of SOC on a regular basis. Advising the minister regularly on the appointment of SOC boards of directors and on the processes for •their Annual General Meetings (AGM) and preparation for these meetings, in compliance with the required statutes, reviewing on an annual basis: ownership policy, governance toolkit and guidelines, appointments, remuneration, and performance of the SOC boards and executive management.

Annual Report Page 23
PERFORMANcE INFORMATION
Strategic objectives, performance indicators planned targets and actual achievements
Performance indicators
Programme 2: Legal and GovernanceSub-programme: Legal, Governance, Risk and Compliance
Performance Indicator
Actual Achievement 2011/2012
Planned Target2012/2013
Actual Achievement2012/2013
Deviation from planned target to Actual Achievement for 2012/2013
Comment on deviations
Ensure effective shareholder oversight of all the SOC by providing legal services which includes transaction and contract management support to the Department
Winding up of Diabo Trust
Traced 7545 beneficiaries, 868 of which have been paid. The department is finalising the appointment of a service provider to pay out all remaining beneficiaries in the coming nine months.
Monitor the winding up process and distribution to beneficiaries closure of the matter.
Trust was established in 2003 and it was administered by the trustee until the expired trustee deed (2006). From 2006 to date, DPE has been managing the trust with the assistance of the service provider and 1000 of 5847 beneficiaries were paid.
The contract with the service provider has expired and the 2013/14 financial year will be the year of the winding up of the trust.
Residual funds will be transferred to the national fiscus in line with the PFMA during the 2013/14 financial year.
Winding up of Aventura
The approach to winding-up process reviewed and approved. The Department had the AFS for 2010/11 audited and secured the Master’s directive on the provision of security requirements.
Annual General Meeting to resolve governance matters was held.
Winding up of the company.
Appointment of the liquidator by the Master of the High Court on 14 March 2013.
None None

Annual Report Page 24
PERFORMANcE INFORMATION
Programme 2: Legal and GovernanceSub-programme: Legal, Governance, Risk and Compliance
Performance Indicator
Actual Achievement 2011/2012
Planned Target2012/2013
Actual Achievement2012/2013
Deviation from planned target to Actual Achievement for 2012/2013
Comment on deviations
Compilation of Report to the Human Rights Commission (“HRC”) on the implementation of the Promotion of Access to Information Act (PAIA) 2 of 2000, in the Department
Report on PAIA manual updated
Annual review of the manual and submission of the report to the HRC
Annual review of the manual and the report for 2011/12 were submitted in June 2012
None None
Ensure that the Department and its portfolio of SOC comply with legal, regulatory and risk requirements
Government Shareholder Management Model
None Approval of the Shareholder Management Model by the shareholder
Not achieved Approval of the shareholder management model by the shareholder
The matter has been held in abeyance due to the SOC Presidential Review Committee
Governance Toolbox and Audit
None Ministerial approval of the Governance Toolbox and Audit
Not achieved Legislative changes which necessitated alignment with government process
The revised Toolkit will require consultation with internal governance structures as well as the Governance and Risk Forum and the Chairperson’s Forum
SOC Board and Executive remuneration standards
The DPE was mandated to undertake further closed consultations to implement the recommendations of the Remuneration Panel
Cabinet approval of the remuneration standards
Achieved, however Cabinet requested that the scope of the standards be expanded to include other relevant SOC which are not under the portfolio of the Department.
None None

Annual Report Page 25
PERFORMANcE INFORMATION
Programme 2: Legal and GovernanceSub-programme: Legal, Governance, Risk and Compliance
Performance Indicator
Actual Achievement 2011/2012
Planned Target2012/2013
Actual Achievement2012/2013
Deviation from planned target to Actual Achievement for 2012/2013
Comment on deviations
Shareholder Management Practice
Implementing Companies Act corporate governance tools
Ensure compliance to applicable legislation
Consultation process with SOC on the Memorandum of Incorporation (MOI) completed. Approval by the Minister and implementation of the MOI by the first quarter of 2013/14
None None
Board Performance Framework
Board Performance Framework approved
Approval of the reviewed framework
The Board Performance Framework approved and being used to assess the performance of SOC Boards
None None
Updated Board database
Obtained approval for DPE board database
Obtain Ministerial approval
The database has been updated subsequent to advertisement for nominees
None None
Board Appointment Framework
Implementation of the framework, continuous monitoring and evaluation
Obtain Ministerial approval
The Board appointment methodology is being utilised for the appointment of members to the SOC Boards
None None
Stakeholder Engagements
Approval to re-establish the Governance Forum
Promote effective stakeholder engagement
Meeting for the forums were conducted as per approval.
None None
Annual Report Page 26
PERFORMANcE INFORMATION
Programme 2: Legal and GovernanceSub-programme: Legal, Governance, Risk and Compliance
Performance Indicator
Actual Achievement 2011/2012
Planned Target2012/2013
Actual Achievement2012/2013
Deviation from planned target to Actual Achievement for 2012/2013
Comment on deviations
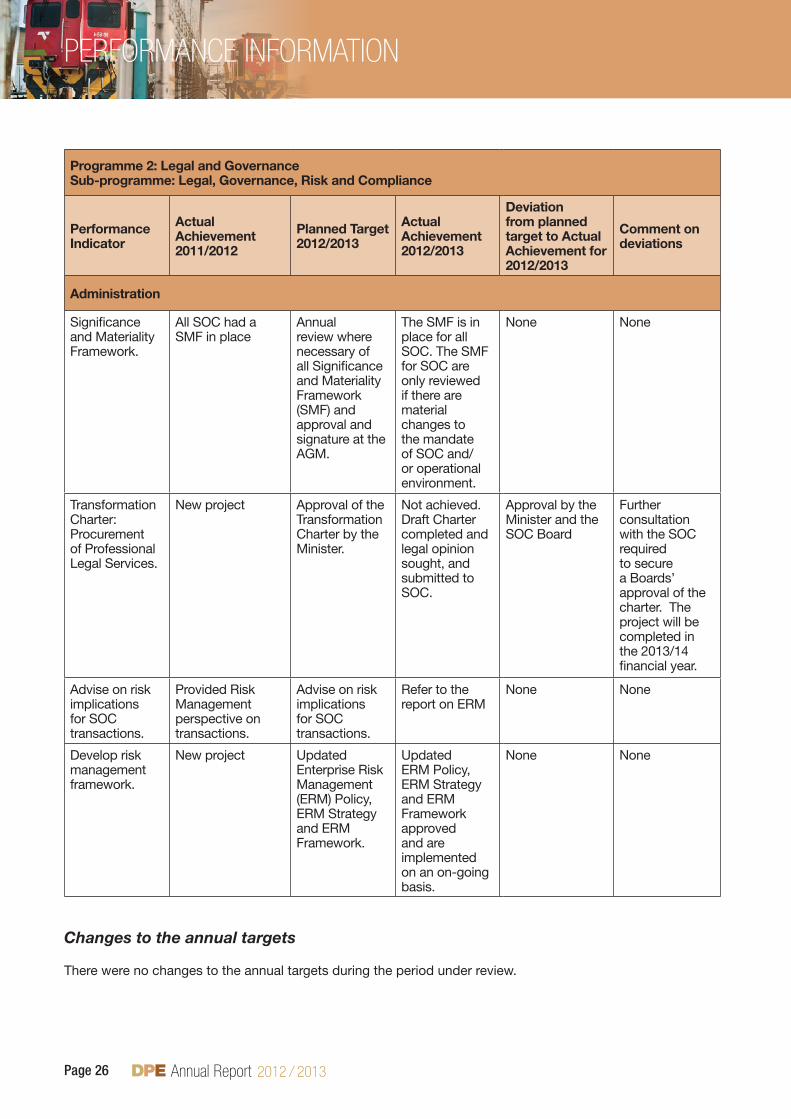
Administration
Significance and Materiality Framework.
All SOC had a SMF in place
Annual review where necessary of all Significance and Materiality Framework (SMF) and approval and signature at the AGM.
The SMF is in place for all SOC. The SMF for SOC are only reviewed if there are material changes to the mandate of SOC and/or operational environment.
None None
Transformation Charter: Procurement of Professional Legal Services.
New project Approval of the Transformation Charter by the Minister.
Not achieved. Draft Charter completed and legal opinion sought, and submitted to SOC.
Approval by the Minister and the SOC Board
Further consultation with the SOC required to secure a Boards’ approval of the charter. The project will be completed in the 2013/14 financial year.
Advise on risk implications for SOC transactions.
Provided Risk Management perspective on transactions.
Advise on risk implications for SOC transactions.
Refer to the report on ERM
None None
Develop risk management framework.
New project Updated Enterprise Risk Management (ERM) Policy, ERM Strategy and ERM Framework.
Updated ERM Policy, ERM Strategy and ERM Framework approved and are implemented on an on-going basis.
None None
Changes to the annual targets
There were no changes to the annual targets during the period under review.

Annual Report Page 27
PERFORMANcE INFORMATION
Strategic Objectives and key achievements
Shareholder Management In November 2012, Cabinet considered the new SOC Remuneration and Incentive Standards for Non-Executive Directors, Executive Directors and Prescribed Officers. This was followed by consultations with national government departments to ensure that the Standards are able to address many of the challenges encountered in the current remuneration model. To this end, the consultation process has been concluded and inputs received being incorporated to further refine the standards before being adopted by Cabinet. The new Standards will require increased accountability and transparency in respect of remuneration and incentives. Since the coming into effect of the Companies Act, 71 of 2008 in May 2011, the Department has developed a framework for the MOI of each SOC. The MOI, previously known as the Memorandum and Articles of Association has been harmonised with the Companies Act and the various tools and frameworks of the Department to enhance shareholder management and oversight of the SOC.
Diabo Share TrustAs at 4 June 2012, the Department was left with approximately 5847 beneficiaries of the Diabo Share Trust to pay out. As at 5 March 2013 when the contract with the Service Provider expired, 1000 of the 5847 had been paid out. The Department has extended the contract with the Service Provider with three months to pay the remaining beneficiaries. The trust will be wound up in the 2013/14 financial year.
AventuraAventura is in the final stages of being wound up. A resolution to this effect was adopted by the board at a special Annual General Meeting held on 28 May 2012. Accordingly, a liquidator for Aventura has been appointed by the Master of the High Court and the company is currently placed under liquidation. Once the liquidation is finalized, the Department will proceed to repeal the Overvaal Resorts Act of 1993, which is the legislation through which Aventura was established.
Sub-programme expenditure
2012/2013 2011/2012
Sub- Programme Legal and Governance
Final Appropriation
ActualExpenditure
(Over)/Under Expenditure
Final Appropriation
ActualExpenditure
(Over)/Under Expenditure
R’000 R’000 R’000 R’000 R’000 R’000
Management 2 346 2 252 94 1 873 1 822 51
Legal 13 586 13 370 216 14 486 12 775 1 711
Governance 8 305 7 855 450 6 420 4 921 1 499
Total 24 237 23 477 760 22 779 19 518 3 261
Expenditure for the programme amounted to R23.477 million in 2012/13 compared to R19.518 million in 2011/12. This increase is mainly due to the strengthening of the Governance unit in respect of the Risk and Compliance components in this sub-programme. However this unit did not achieve the 2 per cent underspending target due to a number of projects been delayed.

Annual Report Page 28
PERFORMANcE INFORMATION
5.3 Programme 3: Portfolio management and strategic PartnershipsPurpose: To align the corporate strategies of the SOC with Government’s strategic intent, and monitor and benchmark their financial and operational performance and capital investment plans. To align shareholder oversight with Government’s overarching economic, social and environmental policies, and build focused strategic partnerships between SOC, strategic customers, suppliers and financial institutions.
2012/2013 2011/2012
Sub-Programme Portfolio Management and Strategic Partnerships
Final Appropriation
ActualExpenditure
(Over)/Under Expenditure
Final Appropriation
ActualExpenditure
(Over)/Under
Expenditure
R’000 R’000 R’000 R’000 R’000 R’000
Energy and Broadband Enterprises
15 948 13 949 1 999 56 678 56 488 190
Manufacturing Enterprises 1 180 151 1 178 268 1 883 123 551 123 423 128
Transport Enterprises 22 049 20 030 2 019 21 606 18 752 2 854
Economic Impact and Policy Alignment
10 722 9 990 732 12 084 11 744 340
Strategic Partnerships 6 555 5 973 582 6 463 7 555 (1 092)
Total 1 235 425 1 228 205 7 220 220 382 217 962 2 420
Expenditure for the programme amounted to R1.228 billion in 2012/13, compared to R217.962 million in 2011/12. This increase is mainly due to the payment for financial assets disbursed to Alexkor and Denel amounting to R1.050 billion. An amount of R118.313 million was furthermore paid to Denel in respect of an indemnity claim to Denel/SAAB Aerostructures.
Detailed information on the five sub-programmes follows:
sub-Programme – energy and Broadband enterprises
Strategic objectives
To strengthen the Department’s oversight role by aligning the shareholder’s strategic intent in relation to the •SOC role in achieving Government objectives in the Energy and ICT sectors.To contribute to the enhancement of SOC performance :•
Evaluating corporate plans and providing advice to boards of directors annually. -Monitoring and benchmarking the implementation of corporate plans and shareholder compacts -quarterly.Assessing shareholder and enterprise risks quarterly and advising boards on areas of concern. -

Annual Report Page 29
PERFORMANcE INFORMATION
Eskom
Support the security of electricity supply by:•Examining Eskom’s maintenance plans, operational practices, distribution efficiency and the reserve -margin.Reviewing regular updates from Eskom and through interaction with utility and stakeholders in the -energy sector.
Monitor the capital investment programme in the public interest by developing and implementing a •framework that emphasises the creation of value added benefits for the economy by end of March 2013.Reduce Eskom’s dependence on funding from the fiscus by monitoring cost escalations for the capital •investment programme, and developing innovative funding arrangements. Leverage Eskom’s capital investment in the development of local supplier industries by monitoring the •implementation of the competitive supplier development programme and evaluating quarterly reports. Support the effective operation of Eskom by regularly engaging with the Department of Energy and the •National Energy Regulator of South Africa on new policies and regulations affecting Eskom.
Pebble Bed Modular Reactor
Implement the Pebble Bed Modular Reactor care and maintenance programme by monitoring the •implementation of intellectual property packaging for preservation, assets handling and the use of cash through weekly status reports.
Broadband Infraco
Ensure that the West Coast submarine cable system is ready for service in the third quarter of 2012 by •monitoring Broadband Infraco’s participation in the West Coast submarine cable system consortium on a quarterly basis. Support increased access to broadband by:•
Monitoring Broadband Infraco’s price reports annually. -Increasing the number of broadband access points in major cities and under-serviced areas from 5 in -2011/12 to 18 in 2014/15 by rolling out the national long-distance infrastructure.
Performance indicators
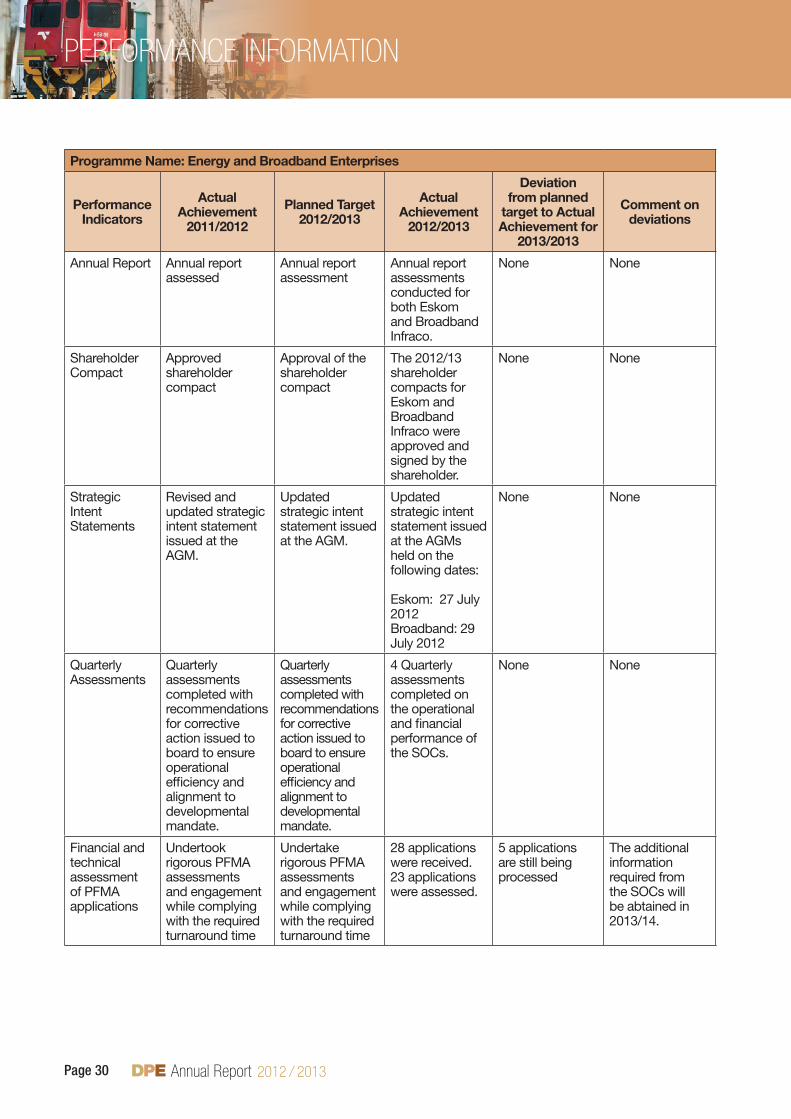
Programme Name: Energy and Broadband Enterprises
Performance Indicators
Actual Achievement
2011/2012
Planned Target2012/2013
Actual Achievement
2012/2013
Deviation from planned
target to Actual Achievement for
2013/2013
Comment on deviations
Provide effective shareholder oversight of Eskom and Broadband Infraco
Corporate Plan
Approved the corporate plan that is aligned to Department and Government developmental objectives.
Approve a corporate plan that is aligned to Department and Government developmental objectives.
Corporate plans for Infraco and Eskom assessed and approved by the Department.
None None
Annual Report Page 30
PERFORMANcE INFORMATION
Programme Name: Energy and Broadband Enterprises
Performance Indicators
Actual Achievement
2011/2012
Planned Target2012/2013
Actual Achievement
2012/2013
Deviation from planned
target to Actual Achievement for
2013/2013
Comment on deviations
Annual Report Annual report assessed
Annual report assessment
Annual report assessments conducted for both Eskom and Broadband Infraco.
None None
Shareholder Compact
Approved shareholder compact
Approval of the shareholder compact
The 2012/13 shareholder compacts for Eskom and Broadband Infraco were approved and signed by the shareholder.
None None
Strategic Intent Statements
Revised and updated strategic intent statement issued at the AGM.
Updated strategic intent statement issued at the AGM.
Updated strategic intent statement issued at the AGMs held on the following dates:
Eskom: 27 July 2012Broadband: 29 July 2012
None None
Quarterly Assessments
Quarterly assessments completed with recommendations for corrective action issued to board to ensure operational efficiency and alignment to developmental mandate.
Quarterly assessments completed with recommendations for corrective action issued to board to ensure operational efficiency and alignment to developmental mandate.
4 Quarterly assessments completed on the operational and financial performance of the SOCs.
None None
Financial andtechnical assessment of PFMA applications
Undertook rigorous PFMA assessments and engagement while complying with the required turnaround time
Undertake rigorous PFMA assessments and engagement while complying with the required turnaround time
28 applications were received. 23 applications were assessed.
5 applications are still being processed
The additional information required from the SOCs will be abtained in 2013/14.
Annual Report Page 31
peRfoRmAnce InfoRmAtIon
Programme Name: Energy and Broadband Enterprises
Performance Indicators
Actual Achievement
2011/2012
Planned Target2012/2013
Actual Achievement
2012/2013
Deviation from planned
target to Actual Achievement for
2013/2013
Comment on deviations
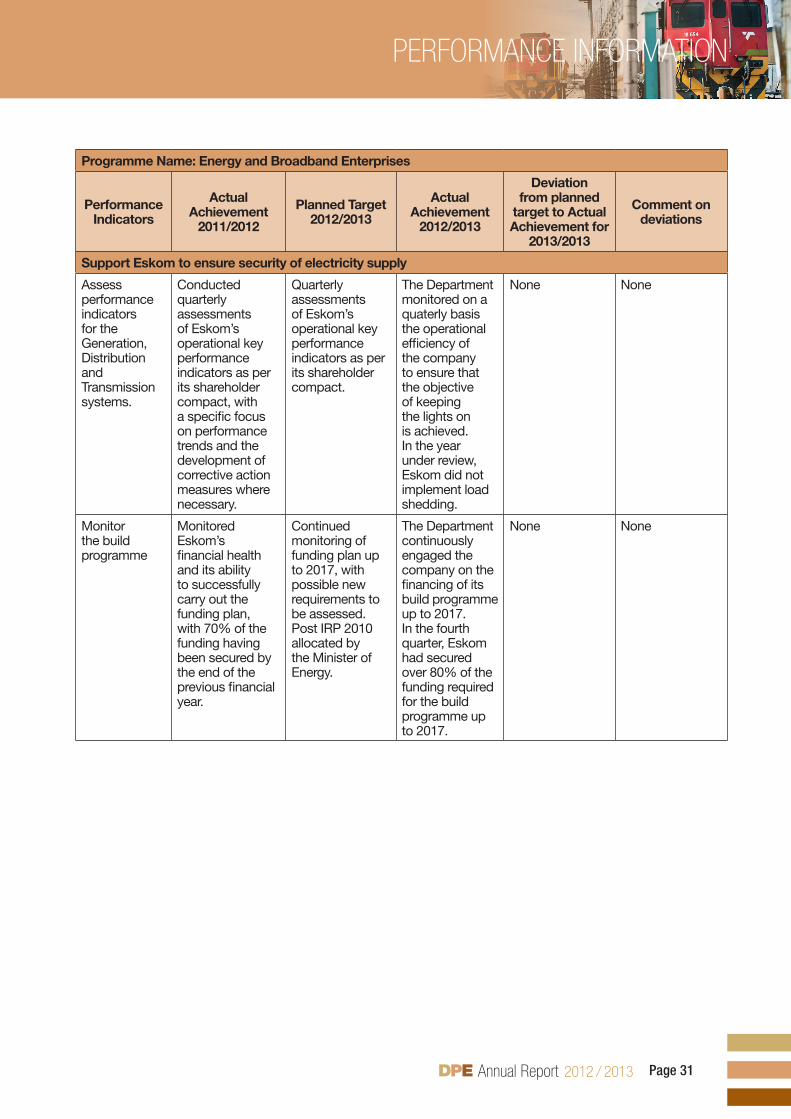
Support Eskom to ensure security of electricity supply
Assess performance indicators for the Generation, Distribution and Transmission systems.
Conducted quarterly assessments of Eskom’s operational key performance indicators as per its shareholder compact, with a specific focus on performance trends and the development of corrective action measures where necessary.
Quarterly assessments of Eskom’s operational key performance indicators as per its shareholder compact.
The Department monitored on a quaterly basis the operational efficiency of the company to ensure that the objective of keeping the lights on is achieved. In the year under review, Eskom did not implement load shedding.
None None
Monitor the build programme
Monitored Eskom’s financial health and its ability to successfully carry out the funding plan, with 70% of the funding having been secured by the end of the previous financial year.
Continued monitoring of funding plan up to 2017, with possible new requirements to be assessed. Post IRP 2010 allocated by the Minister of Energy.
The Department continuously engaged the company on the financing of its build programme up to 2017. In the fourth quarter, Eskom had secured over 80% of the funding required for the build programme up to 2017.
None None

Annual Report Page 32
PERFORMANcE INFORMATION
Programme Name: Energy and Broadband Enterprises
Performance Indicators
Actual Achievement
2011/2012
Planned Target2012/2013
Actual Achievement
2012/2013
Deviation from planned
target to Actual Achievement for
2013/2013
Comment on deviations
Monitored the Eskom build programme delivery up to 2017 and ensured timeous Integrated Resource Plan (IRP2010) allocations beyond 2017.
Quarterly assessment of the implementation of the build programme.
The Department commissioned an independent review of the build programme to assess the current status and propose measures to enhance oversight. The study will be completed in the first quarter of 2013/14 financial year and will inform the Department’s future build programme oversight strategy.
None None
Signed up independent power producers (IPPs) domestically and regionally to supply power within a defined price band to support domestic security of supply and to reduce Eskom’s maintenance backlog. Implementation of the ISMO subsidiary.
Quarterly monitoring of the Power Purchase Programme.
Eskom signed all the available IPPs to help keep the lights on. As at 31 December 2012 Eskom signed IPP Power Purchase Agreement (PPA) that will generate 1 475MW
None None

Annual Report Page 31
peRfoRmAnce InfoRmAtIon
Programme Name: Energy and Broadband Enterprises
Performance Indicators
Actual Achievement
2011/2012
Planned Target2012/2013
Actual Achievement
2012/2013
Deviation from planned
target to Actual Achievement for
2013/2013
Comment on deviations
Support Eskom to ensure security of electricity supply
Assess performance indicators for the Generation, Distribution and Transmission systems.
Conducted quarterly assessments of Eskom’s operational key performance indicators as per its shareholder compact, with a specific focus on performance trends and the development of corrective action measures where necessary.
Quarterly assessments of Eskom’s operational key performance indicators as per its shareholder compact.
The Department monitored on a quaterly basis the operational efficiency of the company to ensure that the objective of keeping the lights on is achieved. In the year under review, Eskom did not implement load shedding.
None None
Monitor the build programme
Monitored Eskom’s financial health and its ability to successfully carry out the funding plan, with 70% of the funding having been secured by the end of the previous financial year.
Continued monitoring of funding plan up to 2017, with possible new requirements to be assessed. Post IRP 2010 allocated by the Minister of Energy.
The Department continuously engaged the company on the financing of its build programme up to 2017. In the fourth quarter, Eskom had secured over 80% of the funding required for the build programme up to 2017.
None None
Annual Report Page 33
PERFORMANcE INFORMATION
Programme Name: Energy and Broadband Enterprises
Performance Indicators
Actual Achievement
2011/2012
Planned Target2012/2013
Actual Achievement
2012/2013
Deviation from planned
target to Actual Achievement for
2013/2013
Comment on deviations
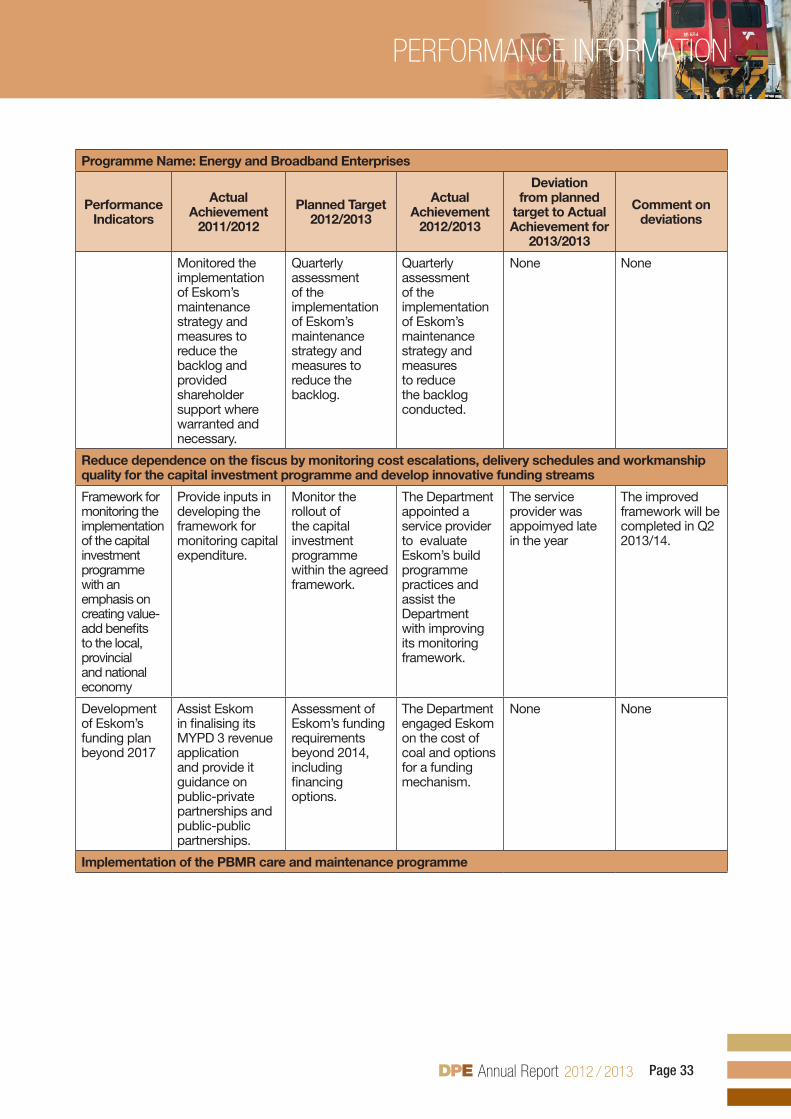
Monitored the implementation of Eskom’s maintenance strategy and measures to reduce the backlog and provided shareholder support where warranted and necessary.
Quarterly assessment of the implementation of Eskom’s maintenance strategy and measures to reduce the backlog.
Quarterly assessment of the implementation of Eskom’s maintenance strategy and measures to reduce the backlog conducted.
None None
Reduce dependence on the fiscus by monitoring cost escalations, delivery schedules and workmanship quality for the capital investment programme and develop innovative funding streams
Framework for monitoring the implementation of the capital investment programme with an emphasis on creating value-add benefits to the local, provincial and national economy
Provide inputs in developing the framework for monitoring capital expenditure.
Monitor the rollout of the capital investment programme within the agreed framework.
The Department appointed a service provider to evaluate Eskom’s build programme practices and assist the Department with improving its monitoring framework.
The service provider was appoimyed late in the year
The improved framework will be completed in Q2 2013/14.
Development of Eskom’s funding plan beyond 2017
Assist Eskom in finalising its MYPD 3 revenue application and provide it guidance on public-private partnerships and public-public partnerships.
Assessment of Eskom’s funding requirements beyond 2014, including financing options.
The Department engaged Eskom on the cost of coal and options for a funding mechanism.
None None
Implementation of the PBMR care and maintenance programme

Annual Report Page 34
PERFORMANcE INFORMATION
Programme Name: Energy and Broadband Enterprises
Performance Indicators
Actual Achievement
2011/2012
Planned Target2012/2013
Actual Achievement
2012/2013
Deviation from planned
target to Actual Achievement for
2013/2013
Comment on deviations
Implementation of the care and maintenance programme
Completed proposals for Eskom to host PBMR.
Cabinet submission to determine the future of the PBMR beyond 31 March 2013.
Prepared a Cabinet memorandum in consultation with the PBMR interdepartmental task team comprising of DOE, DST, NT and the DTI.
Cabinet memorandum was not tabled in cabinet
The interdepartmental task team has to discuss and agree on the recommendations before the memorandum is submitted to Cabinet.
Support increased access to broadband
Infraco long-distance network capex
Finalise the Infraco business model to grow a sustainable business and provide increased broadband access at affordable pricing, specifically to underserviced areas. Infraco to support projects of national importance, such as the SKA, in fulfilment of its legislative mandate.
Quarterly monitoring of the implementation of the long-distance network capex programme.
Achieved. Quarterly monitoring took place.
None None
Ensure that the West Coast submarine cable system (WACS) is ready for service in 2012 by monitoring Broadband Infraco’s participation in the WACS consortium on a quarterly basis.
All components of the cable were delivered and commissioned in the second quarter of the financial year.
Monitor the rollout of the WACS project quarterly to ensure timely commissioning of the cable.
The WACS was commissioned in May 2012.
None None

Annual Report Page 35
PERFORMANcE INFORMATION
Changes to planned targets
In the 2012/13 financial year, the Department reviewed and refined the targets contained in its annual performance plan and made sure that they complied with the SMART principle. The targets for the Energy and Broadband Enterprises were not changed but the Department did refine them to ensure that they are clear and in line with its strategic focus.
Strategic objectives and key achievements
Eskom
In order to ensure its long-term financial sustainability, the Department supported Eskom with its Multi-year Price Determination (MYPD3) application, which determined Eskom’s revenue requirements for the next five years. The Eskom capital expenditure programme added 260MW of additional capacity to the national grid this financial year, built 787km of transmission lines and installed 3 580MVA of transformation capacity. During the financial year, Eskom electrified 144 558 homes.
In the year under review, the Department continued to monitor and support Eskom’s efforts to balance national electricity supply and demand. The utility managed to keep the lights on, including during the African Cup of Nations hosted in 2013. The Department granted Eskom approval to enter into power purchase agreements with 28 renewable energy independent power producers (IPPs), which will generate a combined 1 415.5MW. The Department of Energy’s Peaker Project will add another 1 000MW once operational.
Broadband Infraco
As part of the effort to make Government a key tenant on the infrastructure of Broadband Infraco, the Department facilitated engagement between Broadband Infraco and other key government departments, and discussions with other SOCs for potential collaboration. After an open tendering process, Broadband Infraco was awarded the contract by the State Information Technology Agency (SITA) that contributed to the overall reduction of broadband costs to the State. The Department oversaw the timely commissioning of the WACS which will facilitate international connectivity by linking Africa with Europe through the United Kingdom. Broadband Infraco has a 11.4% stake in the cable system that provides 5.12 terabits per second of broadband speed.
In order to align the shareholder objectives with policy and regulatory objectives, the Department commented extensively on the draft Broadband Policy that is currently being developed by the Department of Communications.
Sub-programme expenditure
2012/2013 2011/2012
Sub- Programme Energy and Broadband Enterprises
Final Appropriation
ActualExpenditure
(Over)/Under Expenditure
Final Appropriation
ActualExpenditure
(Over)/Under Expenditure
R’000 R’000 R’000 R’000 R’000 R’000
Management 1 660 1 533 127 2 809 2 889 (80)
Broadband Infraco 6 106 4 871 1 235 7 462 7 197 265
Eskom and PBMR 8 182 7 540 642 46 407 46 402 5
Total 15 948 13 944 2 004 56 678 56 488 190

Annual Report Page 36
PERFORMANcE INFORMATION
Expenditure in this programme amounted to R13.944 million in 2012/13, compared to R56.488 million in 2011/12. The decrease in expenditure is mainly due to the final transfer payment of R40 million to the Pebble Bed Modular Reactor (PBMR) in 2011/12 for its statutory dismantling, decommissioning and care and maintenance programme, as well as the transfer of the legal component from this unit to Programme 2: Legal and Governance.
sub-Programme – manufacturing enterprisesStrategic objectives To ensure alignment in shareholder strategic intent in relation to SOCs’ roles in achieving objectives in the defence, mining and forestry sectors by annually reviewing enterprise strategies and mandates in the context of political and sectoral policy shifts and alerting the enterprise boards to material deviations. To support the SOCs in delivering their outcomes as set out in the shareholder compacts and corporate plans by identifying appropriate target benchmarks for key performance measures and by analysing quarterly and annual reports.
Denel
Define Denel’s future role and strategic mandate by:•Developing the defence industry stakeholder framework with industry enablers to support Denel’s -business sustainability by 2012/13.Developing a business model to support Denel’s growth by 2012/13. -Reviewing the impact of the current strategic equity partnership on Denel’s sustainability by 2012/13. -
Alekxor
Contribute to the socio-economic development of the region by implementing Alexkor’s strategy to ensure •the company’s long-term viability, and address its environmental rehabilitation and other liabilities by 2012/13.Maintain the sustainability of Alexkor by:•
Developing an evaluation framework and alternative funding mechanisms for Alexkor’s new mining -ventures and beneficiation initiatives to guide investment decisions by 2012/13.Expanding the Alexkor board to its full complement and ensuring it has the requisite skills, experience -and expertise by 2012/13.
Implement the Richtersveld deed of settlement by:•Monitoring the performance of the pooling and sharing joint venture between Alexkor and the Richtersveld -Mining Company, including the prospecting work programme and mining plans.Monitoring the Alexander Bay township infrastructure upgrade and transferring outstanding assets to -the Richtersveld community.
Strengthen the institutional format and operations of the SAFCOL by:•Defining its role and its contribution to rural development and the forestry industry. -Reviewing the SAFCOL board to its full complement and ensuring it has the requisite skills, experience -and expertise. Reviewing the SOC and SAFCOL group structure to ensure the best possible company structure -that will create value and achieve greater business efficiency, functionality and accountability, while minimising costs and duplication.Developing a settlement model to address land claims against Komatiland Forests by 2012/13. -

Annual Report Page 37
PERFORMANcE INFORMATION
Performance Indicators
Sub-Programme: Manufacturing Enterprises
Performance Indicators
Actual Achievement
2011/2012
Planned Target2012/2013
Actual Achievement
2012/2013
Deviation from planned
target to Actual Achievement for
2012/2013
Comment on deviations
1. Shareholder oversight
Strategic Intent statement
Strategic intent statement approved and communicated by Minister at the AGM.
Strategic intent statement communicated by Minister at the AGM.
Strategic intent statement communicated to the board during the 2012/13 AGM.
None None
Shareholder Compact
Shareholder compact agreed and signed by shareholder and the board.
Approval of the shareholder compact.
Shareholder compacts for Denel, Alexkor and SAFCOL approved by the shareholder.
None None
Corporate plan
Corporate plan assessed to determine alignment to the pre-determined objectives, other Government objectives and the long-term viability of the SOC. A communiqué to be sent to the SOC.
Approval of corporate plan.
Corporate plans for Denel and SAFCOL assessed and approved.
Alexkor corporate plan was assessed but not approved in the period under review.
The corporate plan was not assessed as the board took longer than anticipated to revise Alexkor’s KPIs in line with the shareholder compact.
Quarterly assessments
Conducted quarterly assessments of financial and operational performance and progress with strategic objective against predetermined targets. A communiqué was sent to the SOC by the Minister.
Quarterly assessment completed with recommendations for corrective action issued to the board where necessary.
All quarterly reports were assessed.
None None
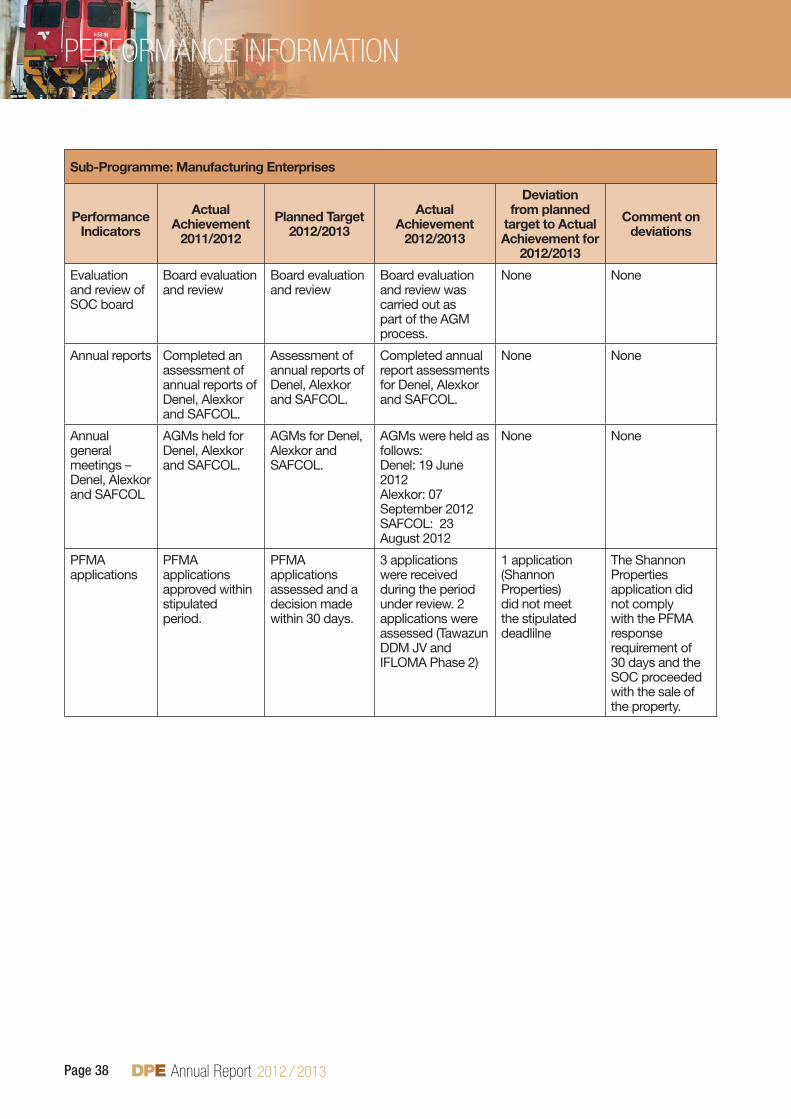
Annual Report Page 38
PERFORMANcE INFORMATION
Sub-Programme: Manufacturing Enterprises
Performance Indicators
Actual Achievement
2011/2012
Planned Target2012/2013
Actual Achievement
2012/2013
Deviation from planned
target to Actual Achievement for
2012/2013
Comment on deviations
Evaluation and review of SOC board
Board evaluation and review
Board evaluation and review
Board evaluation and review was carried out as part of the AGM process.
None None
Annual reports Completed an assessment of annual reports of Denel, Alexkor and SAFCOL.
Assessment of annual reports of Denel, Alexkor and SAFCOL.
Completed annual report assessments for Denel, Alexkor and SAFCOL.
None None
Annual general meetings – Denel, Alexkor and SAFCOL
AGMs held for Denel, Alexkor and SAFCOL.
AGMs for Denel, Alexkor and SAFCOL.
AGMs were held as follows:Denel: 19 June 2012Alexkor: 07 September 2012 SAFCOL: 23 August 2012
None None
PFMA applications
PFMA applications approved within stipulated period.
PFMA applications assessed and a decision made within 30 days.
3 applications were received during the period under review. 2 applications were assessed (Tawazun DDM JV and IFLOMA Phase 2)
1 application (Shannon Properties) did not meet the stipulated deadlilne
The Shannon Properties application did not comply with the PFMA response requirement of 30 days and the SOC proceeded with the sale of the property.
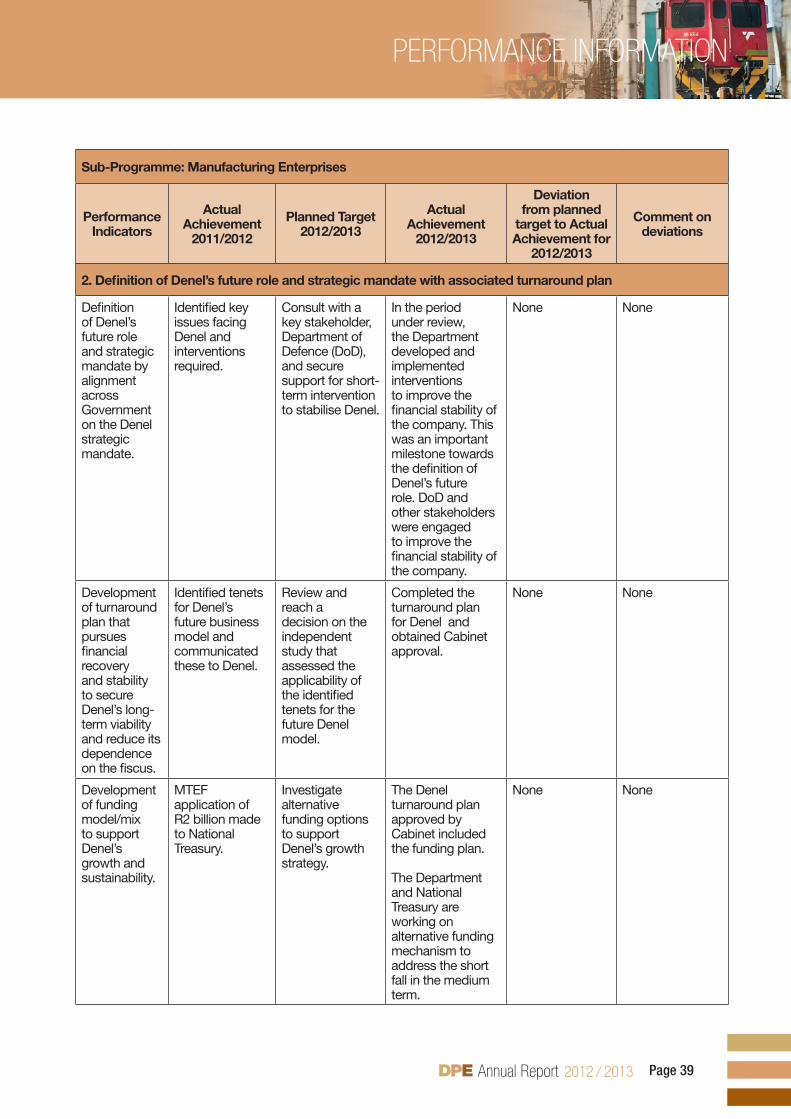
Annual Report Page 39
PERFORMANcE INFORMATION
Sub-Programme: Manufacturing Enterprises
Performance Indicators
Actual Achievement
2011/2012
Planned Target2012/2013
Actual Achievement
2012/2013
Deviation from planned
target to Actual Achievement for
2012/2013
Comment on deviations
2. Definition of Denel’s future role and strategic mandate with associated turnaround plan
Definition of Denel’s future role and strategic mandate by alignment across Government on the Denel strategic mandate.
Identified key issues facing Denel and interventions required.
Consult with a key stakeholder, Department of Defence (DoD), and secure support for short-term intervention to stabilise Denel.
In the period under review, the Department developed and implemented interventions to improve the financial stability of the company. This was an important milestone towards the definition of Denel’s future role. DoD and other stakeholders were engaged to improve the financial stability of the company.
None None
Development of turnaround plan that pursues financial recovery and stability to secure Denel’s long-term viability and reduce its dependence on the fiscus.
Identified tenets for Denel’s future business model and communicated these to Denel.
Review and reach a decision on the independent study that assessed the applicability of the identified tenets for the future Denel model.
Completed the turnaround plan for Denel and obtained Cabinet approval.
None None
Development of funding model/mix to support Denel’s growth and sustainability.
MTEF application of R2 billion made to National Treasury.
Investigate alternative funding options to support Denel’s growth strategy.
The Denel turnaround plan approved by Cabinet included the funding plan.
The Department and National Treasury are working on alternative funding mechanism to address the short fall in the medium term.
None None

Annual Report Page 40
PERFORMANcE INFORMATION
Sub-Programme: Manufacturing Enterprises
Performance Indicators
Actual Achievement
2011/2012
Planned Target2012/2013
Actual Achievement
2012/2013
Deviation from planned
target to Actual Achievement for
2012/2013
Comment on deviations
3. Denel/Defence Industry Support Framework
Denel/defence industry stakeholder framework.
Active engagement in defence industry strategy review forum.
Develop the Denel/defence industry stakeholder framework.
DPE and DoD have agreed to start developing the framework, which will enable consensus amongst stakeholders on Denel’s role.
Stakeholder framework not developed in the year under review.
Due the increased focus on improving the financial sustainability of the company the framework was not concluded.
Assessment of the impact of current strategic equity partnerships on Denel’s sustainability.
Monitor the performance of existing strategic equity partnerships.
Assess the impact of the current strategic equity partnerships on Denel’s sustainability to enable informed input into policy guidelines for private sector participation.
Not achieved Assessment of equity partnerships was deprioritised and the study will be done during the 2013/14 financial year.
The focus in the 2012/13 financial year was on Denel’s sustainability (turnaround plan and funding challenges).
The terms of reference have been compiled and will be approved in Q1 2013/14.
4. Review of the progress of the 2008 Denel end-state Cabinet recommendation
Status update to Cabinet on progress with the 2008 Denel end-state Cabinet recom-mendations.
Assessment of progress made on the 2008 Denel end-state Cabinet recommendations.
Not achieved An update to Cabinet on the 2008 recommendations will be done during the 2013/14 financial year.
The delays in the finalisation of the Defence Review meant that pro-posals could not be formulated with regard to the conclusions that were made in the end state recom-mendations.
Review of Rooivalk programme.
Secure client funding to continue Rooivalk programme.
Undertake an impact assessment of the Rooivalk programme.
The terms of reference were approved in 2012/13.
The study was not completed. It will be finalised during the 2013/14 financial year.
The increased focus on the turnaround plan required the Department to allocate more resources to its finalisation.

Annual Report Page 41
PERFORMANcE INFORMATION
Sub-Programme: Manufacturing Enterprises
Performance Indicators
Actual Achievement
2011/2012
Planned Target2012/2013
Actual Achievement
2012/2013
Deviation from planned
target to Actual Achievement for
2012/2013
Comment on deviations
5. Denel Aerostructures business sustainability
Denel Aero-structures (DAe) business plan
Framework for the resolution of Denel Aero-structures (DAe) business package contract terms on the viability of DAe business completed (financial, operational, technical, programme management).
Assess the revised DAe business plan and the impact of revised work on financial, operational and technical programme management targets.
Achieved. The business has reported a significant reduction in losses compared to previous financial years. This positive trend is being supported by new businesses that are boosting revenues.
The capital injection will provide much needed support and should translate into significantly reduced losses.
None None
Development of funding model and other support mechanisms for DAe business sustainability.
MTEF funding application. Indemnity claim processed.
Investigate alternative funding options to support growth strategy.
Achieved. The turnaround plan for Denel included the DAe business and funding plan.
None None
6. Re-direction of Alexkor’s commercial focus and sustainability
Development of evaluation framework and funding model/mix to guide investment decisions for new mining ventures and downstream beneficiation initiatives.
MTEF funding application submitted for potential new mining ventures.
Develop an evaluation framework and funding model/mix for new ventures.
Not achieved The Department will finalise the redefined role in the first quarter of the 2013/14 financial year.
The evaluation framework could not be developed before the company’s role had been redefined. Identification of new ventures will be informed by the redefined role.

Annual Report Page 42
PERFORMANcE INFORMATION
Sub-Programme: Manufacturing Enterprises
Performance Indicators
Actual Achievement
2011/2012
Planned Target2012/2013
Actual Achievement
2012/2013
Deviation from planned
target to Actual Achievement for
2012/2013
Comment on deviations
7. Alexkor board review
Board evaluation and review
Board evaluation and review
Board evaluation and review
The board review was completed. The board will be strengthened further in view of the additional responsibilities associated with the oversight of the Pooling and Sharing Joint Venture (PSJV) and the re-defined role of the SOC.
None None
8. Oversight of Richtersveld deed of settlement implementation
Performance of PSJV between Alexkor and the Richtersveld Mining Company.
Assess the performance of the PSJV (prospecting plan, work programme, mining plan) to ensure sustainability.
Assess the performance of the PSJV (prospecting plan, work programme, mining plan) to ensure sustainability.
Assess the performance of the PSJV (prospecting plan, work programme, mining plan) to ensure sustainability.
None None
Alexander Bay township infrastructure upgrade and transfer of outstanding assets to the Richtersveld Community.
The Alexander Bay township infrastructure upgrade project was completed.
Outstanding assets to be transferred to the Richtersveld Community in accordance with deed of settlement.
Not achieved. The township infrastructure upgrade was completed in the fourth quarter of 2012/13 financial year.
The township will be handed over during the 2013/14 financial year.
The delay in the completion of the infrastructure upgrade impacted on the timing of the formal handover.
9. Definition of role and institutional form for SAFCOL
SAFCOL’s contributions to rural development and the forestry industry.
Inter-governmental consultation on SAFCOL’s proposed future role.
Develop a strategy for SAFCOL’s future role.
SAFCOL’s future role was defined and consultation with key government departments undertaken.
None None

Annual Report Page 43
PERFORMANcE INFORMATION
Sub-Programme: Manufacturing Enterprises
Performance Indicators
Actual Achievement
2011/2012
Planned Target2012/2013
Actual Achievement
2012/2013
Deviation from planned
target to Actual Achievement for
2012/2013
Comment on deviations
10. Maximising value of current SAFCOL processing assets
Maximise the value of processing assets through brownfield investments and the refurbishment of existing sawmills.
Approval to invest in current processing assets subsequent to an assessment of the 2011 corporate plan.
Assess the viability of the existing custom-cut processing plants and the Timbadola sawmill.
Not achieved Assessment of the viability of the existing custom-cut processing plant and the Timbadola sawmill was not undertaken.
The SOC feasibility study on Timbadola sawmill technology upgrade programme has taken longer than anticipated.The feasibility study is expected to be concluded in the 2013/14 financial year.
11. Transfer of SAFCOL minority shares
Transfer of SAFCOL minority shares to the Department of Rural Development and Land Reform (DRDLR) through Cabinet approval.
Inter-ministerial engagements to fast track the process to transfer shares.
Minority shares transferred to the DRDLR through Cabinet approval.
Not achieved. The Department, in partnership with the National Empowerment Fund (NEF), is developing proposals on the hosting of the minority shares for DRDLR consideration.
The transfer of minority shares to DRDLR
Awaiting a decision from DRDLR on their preparedness to warehouse the shares.

Annual Report Page 44
PERFORMANcE INFORMATION
Sub-Programme: Manufacturing Enterprises
Performance Indicators
Actual Achievement
2011/2012
Planned Target2012/2013
Actual Achievement
2012/2013
Deviation from planned
target to Actual Achievement for
2012/2013
Comment on deviations
12. KLF land claims settlement model
Settlement model to fast track Komatiland Forests (KLF) land claims
Participate in the forestry land claims task team.
Operationalise the KLF land claims task team.
The interdepartmental task team comprising of DPE, DRDLR, DAFF, SAFCOL and DPW has been established. However, the development of a settlement model lies with DRDLR;theotherdepartments provide input and assistance. In the year under review, settlement model options were generated and are being costed
None None
13. Enhancement of SAFCOL development contribution
Reduction of socio-infrastructure backlogs in Mpumalanga, Limpopo and KZN by promoting the use of timber-framed structures in the housing, education and health areas
Pilot projects on timber-framed structures.
Reduction of socio-infrastructure backlogs in areas where SAFCOL operates by promoting the use of timber-framed structures.
7 schools in Mpumalanga were supported through the programme. Education authorities in the provinces that benefited were part of the handover process.Positive feedback was received from these authorities, which provide an important platform to expand the initiative.
None None

Annual Report Page 45
PERFORMANcE INFORMATION
Strategic objectives and key achievements
Alexkor
The Department continued to monitor and oversee the execution of the activities linked to the DoS. These included:
The upgrade of Alexander Bay. The infrastructure upgrade was completed in March 2013 •Capacitation of the Pooling and Sharing Joint Venture. Alexkor’s focus going forward is to ensure the PSJV, •which is a joint venture with the Richtersveld Mining Corporation (RMC), is brought to a sustainable carat production level.Facilitate the transfer of residential properties to the Richtersveld community, which is planned for the 2• nd quarter of 2013/14 financial year.
In line with its enabling legislation, Alexkor is developing a strategy to access opportunities beyond alluvial diamond mining. The process will be concluded in the second quarter of the 2013/14 financial year. The strategy will seek to balance the company’s long-term viability against contributing to the socio-economic upliftment and development of the Richtersveld and Namaqualand regions.
In the current reporting period, the Department submitted a request for R350 million to National Treasury. It was approved to address the following obligations and liabilities: an environmental rehabilitation liability at Alexander Bay mine, payment to the Richtersveld Property Holding Company to secure Alexkor’s right of occupation of the transferred residential properties for a period of 10 years, and a post-retirement medical aid liability.
Denel
The Department monitored and had oversight of the development and Cabinet approval of the turnaround plan for the SOC. The turnaround plan implementation is showing satisfactory outcomes with the SOC recording positive financial results. The projection is that this trend will be maintained. Despite the challenging trading environment, the business outlook is positive. Denel is pursuing a strategy of forming strategic collaborations and joint ventures with local and international companies in the defence sector. The R700-million recapitalisation of the company has improved its gearing ratio.
The Department has directed the SOC to improve investment in technology development to ensure a sustainable product portfolio in future. The expenditure will further enable Denel to attract bright young minds, which is critical to the sustainability of the business. The core technical expertise is ageing due to lack of investment in talent development.
SAFCOL
The Department finalised the new role for the SOC. It is due to be presented to Cabinet during the first quarter of the 2013/14 financial year. To execute the SOC’s new role and enable effective oversight, its board of directors has been augmented with the requisite skills. The SOC will be repositioned to be an agent for rural economic development in the parts of Limpopo, Mpumalanga and Northern Kwazulu-Natal where it has its operations.The Department continued to engage the Department of Rural Development and Land Reform (DRDLR) to ensure the resolution of land claims on SAFCOL’s land. Some 61% of the forestry plantations are subject to land claims, a situation that is hampering the SOC’s long-term planning. In the interim, SAFCOL is positioning itself as a preferred development partner for claimant communities to ensure the land is not lost to other forms of agriculture.
In addition, the Department continued to engage with DRDLR regarding the transfer from SAFCOL of minority shareholdings. DRDLR remains the destination of the shareholding and needs to develop the capacity to warehouse the shares, which is expected to be transferred during the 2013/14 financial year. The Department has engaged with other stakeholders to find an interim solution, as the shareholding is proving to be a liability for SAFCOL.
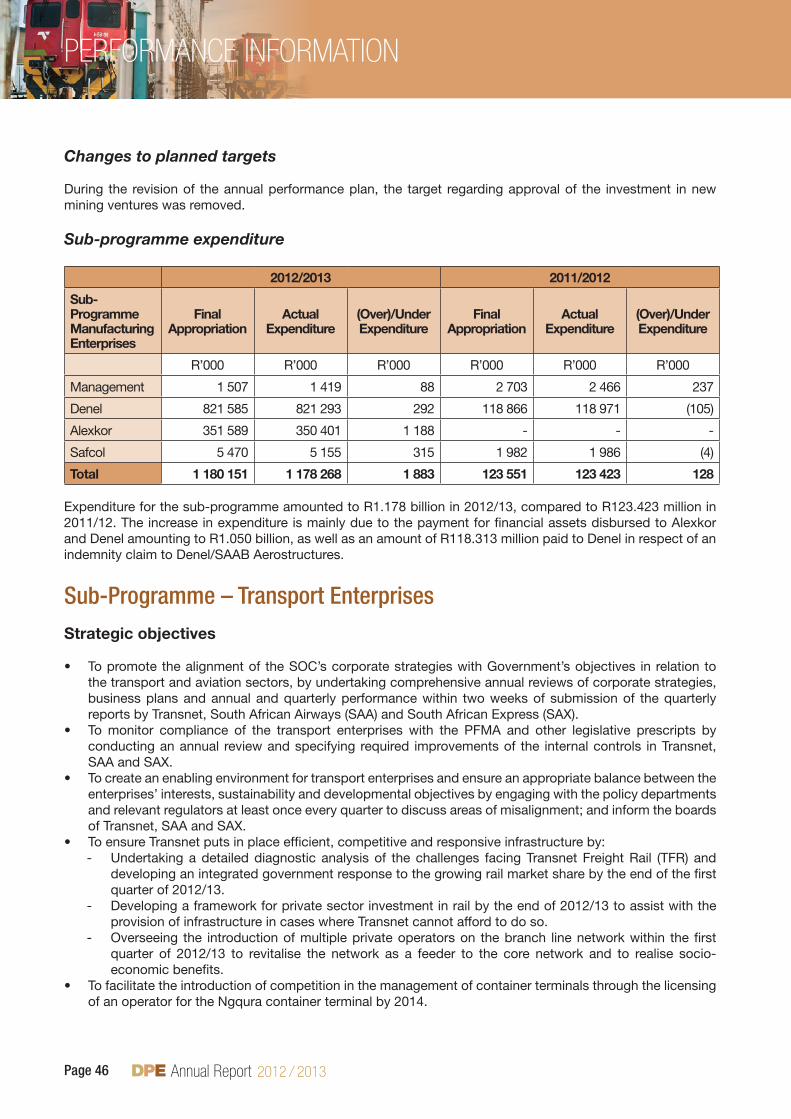
Annual Report Page 46
PERFORMANcE INFORMATION
Changes to planned targets
During the revision of the annual performance plan, the target regarding approval of the investment in new mining ventures was removed.
Sub-programme expenditure
2012/2013 2011/2012
Sub- Programme Manufacturing Enterprises
Final Appropriation
ActualExpenditure
(Over)/Under Expenditure
Final Appropriation
ActualExpenditure
(Over)/Under Expenditure
R’000 R’000 R’000 R’000 R’000 R’000
Management 1 507 1 419 88 2 703 2 466 237
Denel 821 585 821 293 292 118 866 118 971 (105)
Alexkor 351 589 350 401 1 188 - - -
Safcol 5 470 5 155 315 1 982 1 986 (4)
Total 1 180 151 1 178 268 1 883 123 551 123 423 128
Expenditure for the sub-programme amounted to R1.178 billion in 2012/13, compared to R123.423 million in 2011/12. The increase in expenditure is mainly due to the payment for financial assets disbursed to Alexkor and Denel amounting to R1.050 billion, as well as an amount of R118.313 million paid to Denel in respect of an indemnity claim to Denel/SAAB Aerostructures.
sub-Programme – transport enterprises
Strategic objectives
To promote the alignment of the SOC’s corporate strategies with Government’s objectives in relation to •the transport and aviation sectors, by undertaking comprehensive annual reviews of corporate strategies, business plans and annual and quarterly performance within two weeks of submission of the quarterly reports by Transnet, South African Airways (SAA) and South African Express (SAX).To monitor compliance of the transport enterprises with the PFMA and other legislative prescripts by •conducting an annual review and specifying required improvements of the internal controls in Transnet, SAA and SAX.To create an enabling environment for transport enterprises and ensure an appropriate balance between the •enterprises’ interests, sustainability and developmental objectives by engaging with the policy departments andrelevantregulatorsatleastonceeveryquartertodiscussareasofmisalignment;andinformtheboardsof Transnet, SAA and SAX. To ensure Transnet puts in place efficient, competitive and responsive infrastructure by:•
Undertaking a detailed diagnostic analysis of the challenges facing Transnet Freight Rail (TFR) and -developing an integrated government response to the growing rail market share by the end of the first quarter of 2012/13.Developing a framework for private sector investment in rail by the end of 2012/13 to assist with the -provision of infrastructure in cases where Transnet cannot afford to do so.Overseeing the introduction of multiple private operators on the branch line network within the first -quarter of 2012/13 to revitalise the network as a feeder to the core network and to realise socio-economic benefits.
To facilitate the introduction of competition in the management of container terminals through the licensing •of an operator for the Ngqura container terminal by 2014.

Annual Report Page 47
PERFORMANcE INFORMATION
To ensure the global competitiveness of the South African freight logistics industry by implementing •national corridor performance tools and indicators to quantify the operational efficiency of freight corridors in 2012/13.To optimise the economic impact of infrastructure investments by monitoring the rollout of Transnet’s capital •expenditure programme on a quarterly and annual basis to assess any significant deviations from corporate plans, potential cost overruns and time delays on major capital projects, and taking the necessary action.To monitor the implementation of the competitive supplier development programme to leverage Transnet’s •locomotive fleet procurement for the development of local railway supplier industries, by evaluating progress towards achieving localisation targets in the quarterly and annual Transnet reports.
South African Airways and South African Express
Support SAA and SAX to achieve sustainable levels of profitability and liquidity in 2012/13 by:•Overseeing the implementation of the initiatives relating to the R1.6-billion guarantee to SAA. -Assessing the required levels of capitalisation of SAA and SAX. -Undertaking a comprehensive review of the SAA business model. -
Enhance government’s airlift objectives by facilitating approval of the government strategy for SAA in •Cabinet, including key success factors to achieve a stronger brand by June 2012.Support SAA to establish South African Airways Technical as a regional maintenance, repair and operations •centre of excellence, by facilitating the approval of the business case in Cabinet and enabling legislation, if necessary, in the second quarter of 2012/13.
Performance indicators
Programme / Sub programme: Transport Enterprises
Effective shareholder oversight of SAA, SAX and Transnet
Performance Indicator
Actual Achievement
2011/2012
Planned Target2012/2013
Actual Achievement
2012/2013
Deviation from planned target
to Actual Achievement for 2012/2013
Comment on deviations
Signed shareholder compact
Concluded shareholder compacts for Transnet, SAA and SAX.
Shareholder compacts approved.
Transnet shareholder compact signed
None None
Not achieved SAA: The shareholder did not support the 2012/13 shareholder compact as the company had planned for a bigger loss. The Department engaged with the company to identify measures to minimise the loss in the current financial year.
The shareholder did not agree to the shareholder compact within the stipulated timeframe.
The 2012/13 targets could not be agreed at the beginning of the financial year due to the Department not accepting SAA’s proposal to budget for a loss.

Annual Report Page 48
PERFORMANcE INFORMATION
Programme / Sub programme: Transport Enterprises
Effective shareholder oversight of SAA, SAX and Transnet
Performance Indicator
Actual Achievement
2011/2012
Planned Target2012/2013
Actual Achievement
2012/2013
Deviation from planned target
to Actual Achievement for 2012/2013
Comment on deviations
SAX: the shareholder compact was approved by the shareholder but not accepted by the board.
Shareholder compact not signed by the board.
SAX requested a downward revision, due to the worsening economic environment, of the targets that were previously agreed as the basis for the fleet renewal programme. As a result, the company was assessed based on the shareholder compact signed by the shareholder.
Quarterly Reports Assessed
Completed assessment of quarterly performance reports and accompanying investor briefs where required.
Assess of quarterly performance reports and prepare investor briefs if required.
4 quarterly financial and operational performance reports were assessed.
None None
Assessment of Annual Reports
Analysis and assessment of the annual reports completed.
Assessment of annual reports.
Transnet and SAA annual reports assessed.
Assessment of SAX not completed.
Delays in the finalisation of SAX’s annual financial statements meant that the target could not be achieved.
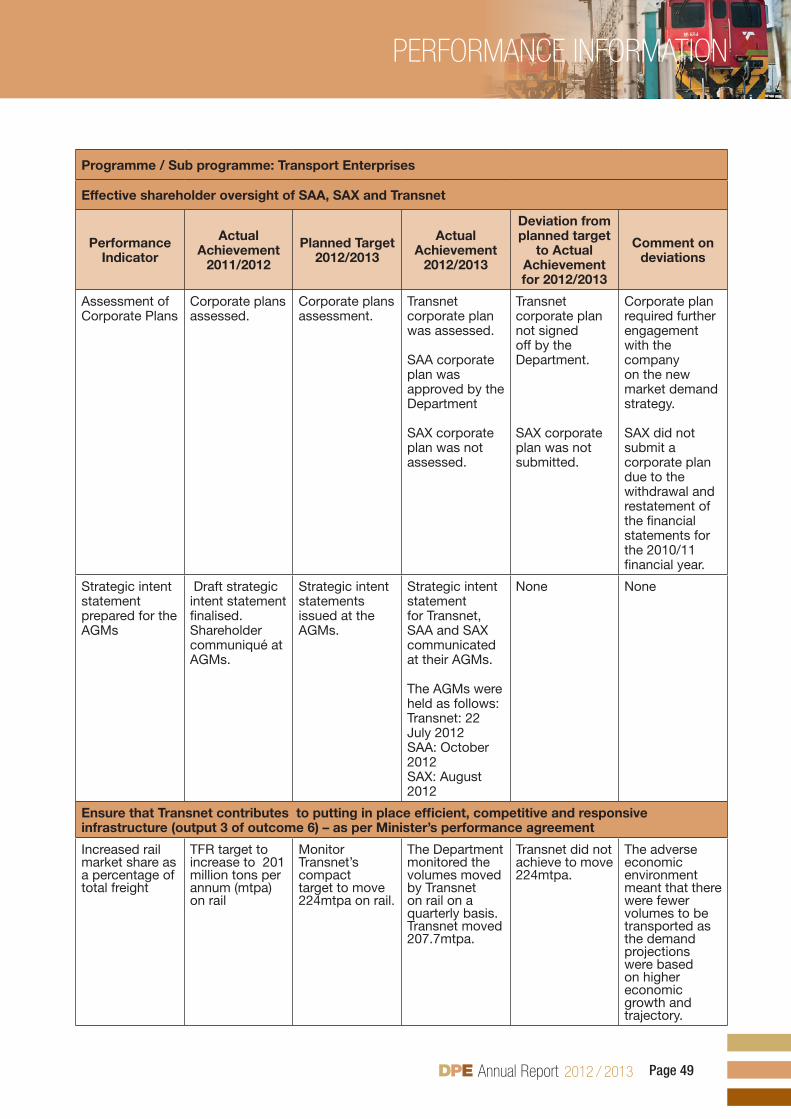
Annual Report Page 49
PERFORMANcE INFORMATION
Programme / Sub programme: Transport Enterprises
Effective shareholder oversight of SAA, SAX and Transnet
Performance Indicator
Actual Achievement
2011/2012
Planned Target2012/2013
Actual Achievement
2012/2013
Deviation from planned target
to Actual Achievement for 2012/2013
Comment on deviations
Assessment of Corporate Plans
Corporate plans assessed.
Corporate plans assessment.
Transnet corporate plan was assessed. SAA corporate plan was approved by the Department
SAX corporate plan was not assessed.
Transnet corporate plan not signed off by the Department.
SAX corporate plan was not submitted.
Corporate plan required further engagement with the company on the new market demand strategy.
SAX did not submit a corporate plan due to the withdrawal and restatement of the financial statements for the 2010/11 financial year.
Strategic intent statement prepared for the AGMs
Draft strategic intent statement finalised. Shareholder communiqué at AGMs.
Strategic intent statements issued at the AGMs.
Strategic intent statement for Transnet, SAA and SAX communicated at their AGMs.
The AGMs were held as follows:Transnet: 22 July 2012SAA: October 2012SAX: August 2012
None None
Ensure that Transnet contributes to putting in place efficient, competitive and responsive infrastructure (output 3 of outcome 6) – as per Minister’s performance agreement
Increased rail market share as a percentage of total freight
TFR target to increase to 201 million tons per annum (mtpa) on rail
Monitor Transnet’s compact target to move 224mtpa on rail.
The Department monitored the volumes moved by Transnet on rail on a quarterly basis. Transnet moved 207.7mtpa.
Transnet did not achieve to move 224mtpa.
The adverse economic environment meant that there were fewer volumes to be transported as the demand projections were based on higher economic growth and trajectory.

Annual Report Page 50
PERFORMANcE INFORMATION
Programme / Sub programme: Transport Enterprises
Effective shareholder oversight of SAA, SAX and Transnet
Performance Indicator
Actual Achievement
2011/2012
Planned Target2012/2013
Actual Achievement
2012/2013
Deviation from planned target
to Actual Achievement for 2012/2013
Comment on deviations
Private Sector Participation (PSP) framework finalised.
Draft PSP framework developed.
PSP framework approved by Cabinet.
Not achieved PSP framework not submitted to Cabinet for approval.
Towards the end of the 2012/13 financial year, the Department embarked on the development of the PSP that will be applicable to all the SOCs. Current work on the Transnet PSP was halted pending the finalisation of the overarching framework.
Multiple branch line operators.
3 branch line opportunities identified for concessions.
At least 3 private operators on branch lines.
Transnet engaged on the enhanced strategy/model for branch lines.
Target dates for private operators on the branch lines postponed to 2016.
Branch line enhanced model has been completed but not yet approved. The operationalisation of the private concession is a protracted process that is expected to be completed by the end of the 2015/16 financial year.
Licensed operator for the Ngqura container terminal.
Cabinet approval of interim license for Transnet Port Terminals to operate the Ngqura container terminal.
Facilitate request for proposals to be issued to commence the competitive process.
A Section 56 project plan has been completed by Transnet. The Department will monitor progress as part of shareholder oversight in the period ahead.
Issue the request for proposals.
The protracted discussion with the policy department on the approach for the licensing of the operator impacted on the achievement of the target.

Annual Report Page 51
PERFORMANcE INFORMATION
Programme / Sub programme: Transport Enterprises
Effective shareholder oversight of SAA, SAX and Transnet
Performance Indicator
Actual Achievement
2011/2012
Planned Target2012/2013
Actual Achievement
2012/2013
Deviation from planned target
to Actual Achievement for 2012/2013
Comment on deviations
Incremental improvements in ports productivity.
Achieved 24 crane moves per hour at DCT.
Target to achieve at least 28 gross crane moves per hour at DCT.
The Department monitored the operational efficiencies at the ports Transnet achieved 28.4 crane moves per hour at DCT.
None None
Develop national corridor performance measurement (NCPM) tools and indicators
Operational efficiency of strategic freight corridors.
NCPM rolled out on three corridors (export coal, export iron ore and export manganese).
NCPM system acceptance on all corridors.
100% acceptance achieved.
None None
Improve investment in transport infrastructure
Accelerated investment in fit-for-purpose transport infrastructure and monitoring thereof.
Assess Transnet’s infrastructure plan and monitor Transnet’s R110-billion capital expenditure (capex) programme
Monitor Transnet’s increased capex investment. Approval of R300 billion capex.
The Department monitored capex progress on a quarterly basis. Transnet spent R29.7bn against the budget of R31.0bn.
None None
Development of a long-term, integrated transport infrastructure network plan
Transport infrastructure network plan.
Drafted terms of reference for the long-term freight network plan.
Study on freight network plan initiated.
Preliminary TOR drafted but not approved.
TOR not approved.
Further consultation on the TOR required with stakeholders (DoT).
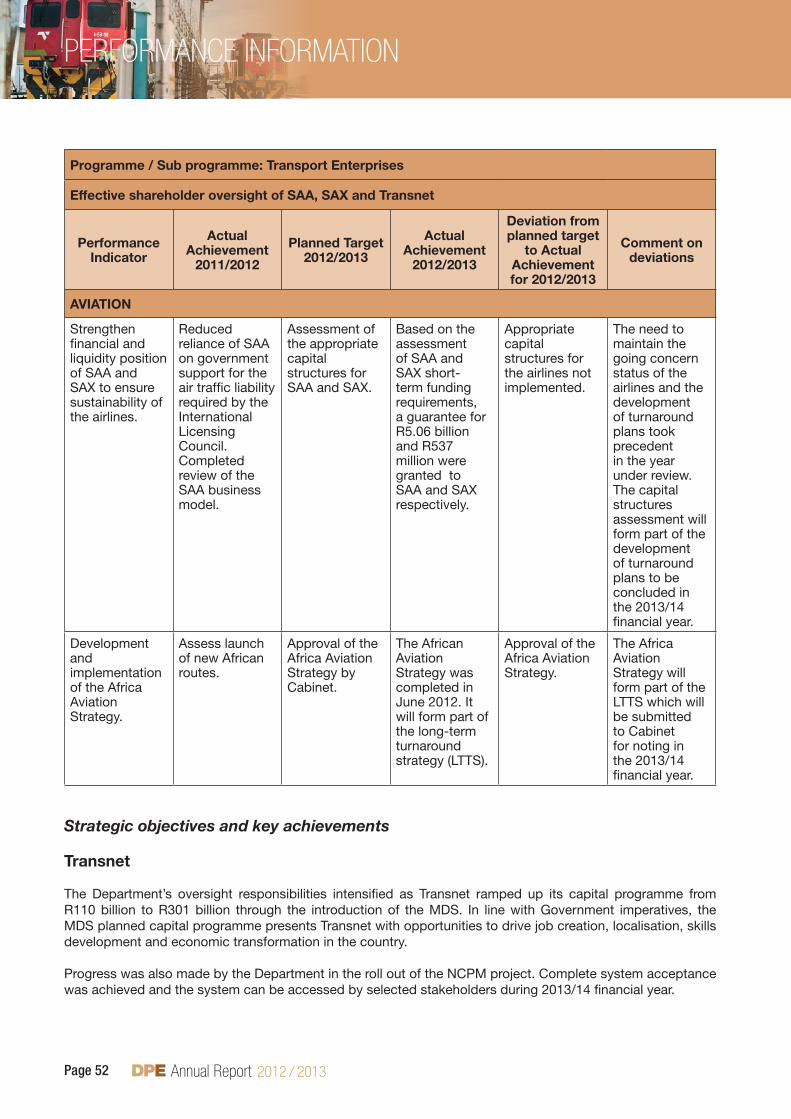
Annual Report Page 52
PERFORMANcE INFORMATION
Programme / Sub programme: Transport Enterprises
Effective shareholder oversight of SAA, SAX and Transnet
Performance Indicator
Actual Achievement
2011/2012
Planned Target2012/2013
Actual Achievement
2012/2013
Deviation from planned target
to Actual Achievement for 2012/2013
Comment on deviations
AVIATION
Strengthen financial and liquidity position of SAA and SAX to ensure sustainability of the airlines.
Reduced reliance of SAA on government support for the air traffic liability required by the International Licensing Council.Completed review of the SAA business model.
Assessment of the appropriate capital structures for SAA and SAX.
Based on the assessment of SAA and SAX short-term funding requirements, a guarantee for R5.06 billion and R537 million were granted to SAA and SAX respectively.
Appropriate capital structures for the airlines not implemented.
The need to maintain the going concern status of the airlines and the development of turnaround plans took precedent in the year under review. The capital structures assessment will form part of the development of turnaround plans to be concluded in the 2013/14 financial year.
Development and implementation of the Africa Aviation Strategy.
Assess launch of new African routes.
Approval of the Africa Aviation Strategy by Cabinet.
The African Aviation Strategy was completed in June 2012. It will form part of the long-term turnaround strategy (LTTS).
Approval of the Africa Aviation Strategy.
The Africa Aviation Strategy will form part of the LTTS which will be submitted to Cabinet for noting in the 2013/14 financial year.
Strategic objectives and key achievements
Transnet
The Department’s oversight responsibilities intensified as Transnet ramped up its capital programme from R110 billion to R301 billion through the introduction of the MDS. In line with Government imperatives, the MDS planned capital programme presents Transnet with opportunities to drive job creation, localisation, skills development and economic transformation in the country.
Progress was also made by the Department in the roll out of the NCPM project. Complete system acceptance was achieved and the system can be accessed by selected stakeholders during 2013/14 financial year.
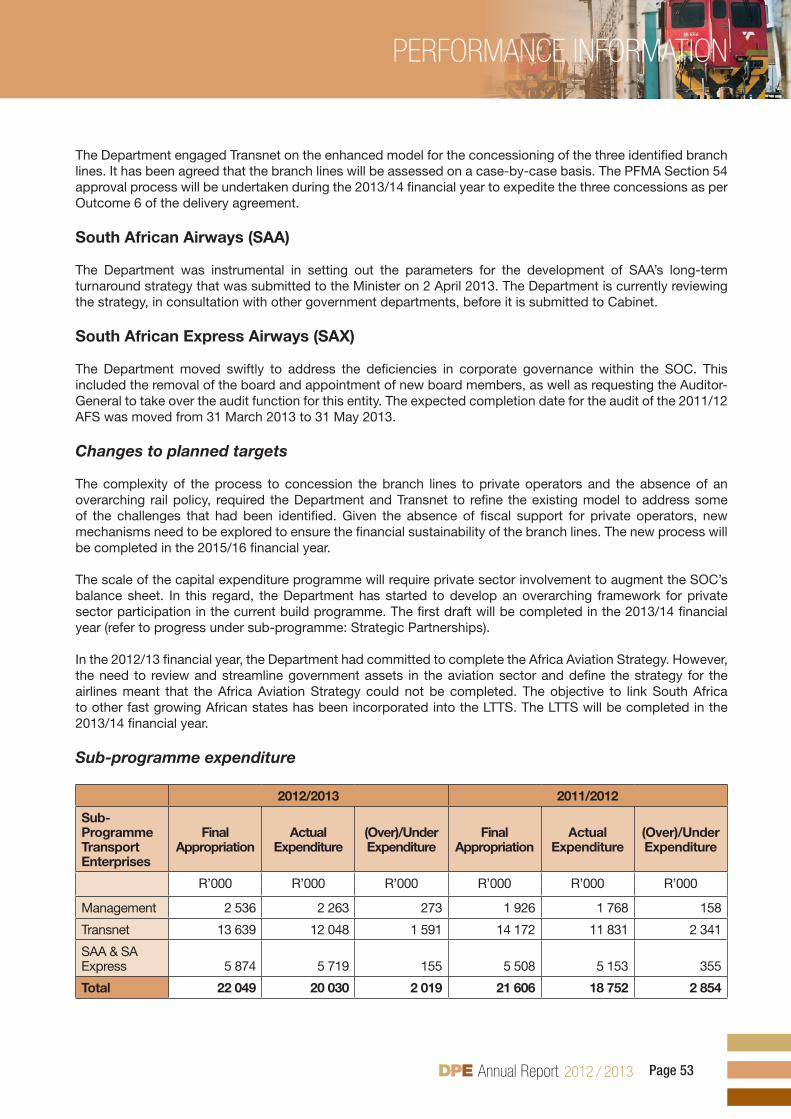
Annual Report Page 53
PERFORMANcE INFORMATION
The Department engaged Transnet on the enhanced model for the concessioning of the three identified branch lines. It has been agreed that the branch lines will be assessed on a case-by-case basis. The PFMA Section 54 approval process will be undertaken during the 2013/14 financial year to expedite the three concessions as per Outcome 6 of the delivery agreement.
South African Airways (SAA)
The Department was instrumental in setting out the parameters for the development of SAA’s long-term turnaround strategy that was submitted to the Minister on 2 April 2013. The Department is currently reviewing the strategy, in consultation with other government departments, before it is submitted to Cabinet.
South African Express Airways (SAX)
The Department moved swiftly to address the deficiencies in corporate governance within the SOC. This included the removal of the board and appointment of new board members, as well as requesting the Auditor-General to take over the audit function for this entity. The expected completion date for the audit of the 2011/12 AFS was moved from 31 March 2013 to 31 May 2013.
Changes to planned targets
The complexity of the process to concession the branch lines to private operators and the absence of an overarching rail policy, required the Department and Transnet to refine the existing model to address some of the challenges that had been identified. Given the absence of fiscal support for private operators, new mechanisms need to be explored to ensure the financial sustainability of the branch lines. The new process will be completed in the 2015/16 financial year.
The scale of the capital expenditure programme will require private sector involvement to augment the SOC’s balance sheet. In this regard, the Department has started to develop an overarching framework for private sector participation in the current build programme. The first draft will be completed in the 2013/14 financial year (refer to progress under sub-programme: Strategic Partnerships).
In the 2012/13 financial year, the Department had committed to complete the Africa Aviation Strategy. However, the need to review and streamline government assets in the aviation sector and define the strategy for the airlines meant that the Africa Aviation Strategy could not be completed. The objective to link South Africa to other fast growing African states has been incorporated into the LTTS. The LTTS will be completed in the 2013/14 financial year.
Sub-programme expenditure
2012/2013 2011/2012
Sub- Programme Transport Enterprises
Final Appropriation
ActualExpenditure
(Over)/Under Expenditure
Final Appropriation
ActualExpenditure
(Over)/Under Expenditure
R’000 R’000 R’000 R’000 R’000 R’000
Management 2 536 2 263 273 1 926 1 768 158
Transnet 13 639 12 048 1 591 14 172 11 831 2 341
SAA & SA Express 5 874 5 719 155 5 508 5 153 355
Total 22 049 20 030 2 019 21 606 18 752 2 854
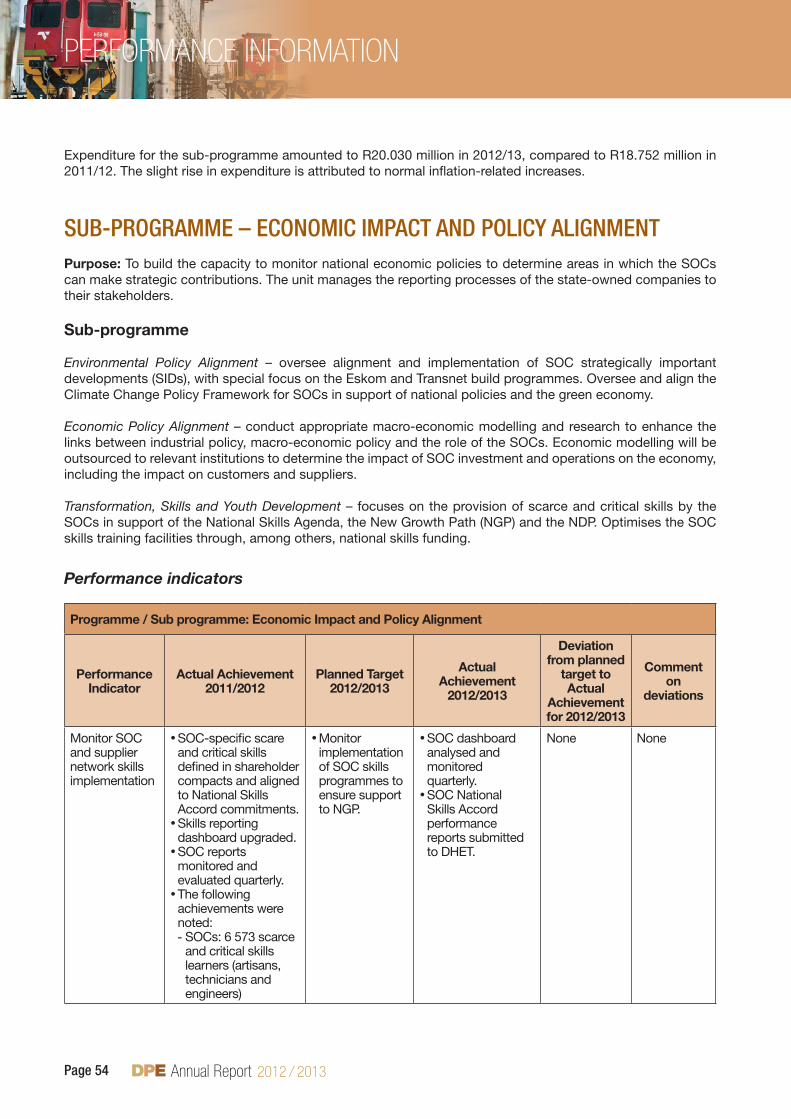
Annual Report Page 54
PERFORMANcE INFORMATION
Expenditure for the sub-programme amounted to R20.030 million in 2012/13, compared to R18.752 million in 2011/12. The slight rise in expenditure is attributed to normal inflation-related increases.
suB-ProGramme – eConomIC ImPaCt anD PolICY alIGnmentPurpose: To build the capacity to monitor national economic policies to determine areas in which the SOCs can make strategic contributions. The unit manages the reporting processes of the state-owned companies to their stakeholders.
Sub-programme
Environmental Policy Alignment – oversee alignment and implementation of SOC strategically important developments (SIDs), with special focus on the Eskom and Transnet build programmes. Oversee and align the Climate Change Policy Framework for SOCs in support of national policies and the green economy.
Economic Policy Alignment – conduct appropriate macro-economic modelling and research to enhance the links between industrial policy, macro-economic policy and the role of the SOCs. Economic modelling will be outsourced to relevant institutions to determine the impact of SOC investment and operations on the economy, including the impact on customers and suppliers.
Transformation, Skills and Youth Development – focuses on the provision of scarce and critical skills by the SOCs in support of the National Skills Agenda, the New Growth Path (NGP) and the NDP. Optimises the SOC skills training facilities through, among others, national skills funding.
Programme / Sub programme: Economic Impact and Policy Alignment
Performance Indicator
Actual Achievement 2011/2012
Planned Target2012/2013
Actual Achievement
2012/2013
Deviation from planned
target to Actual
Achievement for 2012/2013
Comment on
deviations
Monitor SOC and supplier network skills implementation
SOC-specific scare •and critical skills defined in shareholder compacts and aligned to National Skills Accord commitments.Skills reporting •dashboard upgraded.SOC reports •monitored and evaluated quarterly. The following •achievements were noted:
SOCs: 6 573 scarce - and critical skills learners (artisans, technicians and engineers)
Monitor •implementation of SOC skills programmes to ensure support to NGP.
SOC dashboard •analysed and monitored quarterly.SOC National •Skills Accord performance reports submitted to DHET.
None None
Performance indicators

Annual Report Page 55
PERFORMANcE INFORMATION
Programme / Sub programme: Economic Impact and Policy Alignment
Performance Indicator
Actual Achievement 2011/2012
Planned Target2012/2013
Actual Achievement
2012/2013
Deviation from planned
target to Actual
Achievement for 2012/2013
Comment on
deviations
Eskom suppliers - support youth development in the form of 5 209 trade skills learners and graduates gaining work exposure.
Establish partnership with Department of Higher Education and Training (DHET) to optimise SOC training facilities to increase national skills pool
Collaboration •between DPE and DHET to enable SOC to support for the national agenda.SOC artisan •and technician development sub-committee established and work plan implemented to optimise SOC training facilities.Contributed to •technical working group (TWG) that is part of the FET task team to strengthen the FET sector.Inputs made to the •EWSETA sector skills plan and supported its initiatives.FET NCV •programmes aligned to SAQA electrical and welding trades.Submitted Transnet’s •application for funds from the NSF to train an additional 2 000 artisan learners for the national pool to DHET for approval.Facilitated due •diligence by DHET/NSF at Transnet Koedoespoort School of Engineering to guide NSF project evaluation process.
Obtain funds •from NSF to optimise SOC training facilities.
R175 million •approved by National Skills Fund (NSF) for Transnet to train 1 000 artisans for the national pool.Coordinated SOC/•DPE Skills Forum and SOC artisan and technician development sub-committee to support national skills agenda.SOC learner •management system study undertaken and reporting framework created for development of a SOC learner management registration system to enhance dashboard reporting.
None None

Annual Report Page 56
PERFORMANcE INFORMATION
Programme / Sub programme: Economic Impact and Policy Alignment
Performance Indicator
Actual Achievement 2011/2012
Planned Target2012/2013
Actual Achievement
2012/2013
Deviation from planned
target to Actual
Achievement for 2012/2013
Comment on
deviations
Monitor SOC transformation (B-BBEE and employment equity), job creation, youth initiatives and disposal of non-core property
Concluded SOC •employment equity and youth baseline reports to quantify contribution towards NGP.DPE Youth Economic •Participation Programme launched in support of NGP.DPE/SOC •employment reports consolidated and incorporated in DPME employment report in support of NGP.
Transformation •indicators included in shareholder compacts and monitored quarterly via dashboard.
Monitoring SOC •youth economic participation initiatives.SOC job •creation indicators included in shareholder compacts and monitored quarterly via dashboard.
DPE/SOC •Transformation Dialogue and report completed.SOC socio-•economic indicators incorporated in 2013/14 SOC shareholder compacts. YEP draft strategy •and 3-year action plan completed.YEP 2013/14 •programme and priorities developed and approved.Analysed SOC •employment equity eeport and established new baseline.
None None
Monitor environmental impact assessments for strategically important developments and develop and implement Climate Change Policy Framework for SOCs
EIAs monitored •and analysed via dashboard. Intervention by minister sought regarding issues with Transnet and Eskom projects.SOE fund monitored •and DPE-DEA-Eskom MoU in process of being reviewed.
Engage DEA •to revise DPE-DEA-Eskom MoU.
Quarterly •monitoring of EIAs and intervention sought by Minister/DG where appropriate.Draft MoU between •DPE-DEA and DWA prepared for comment.
None None
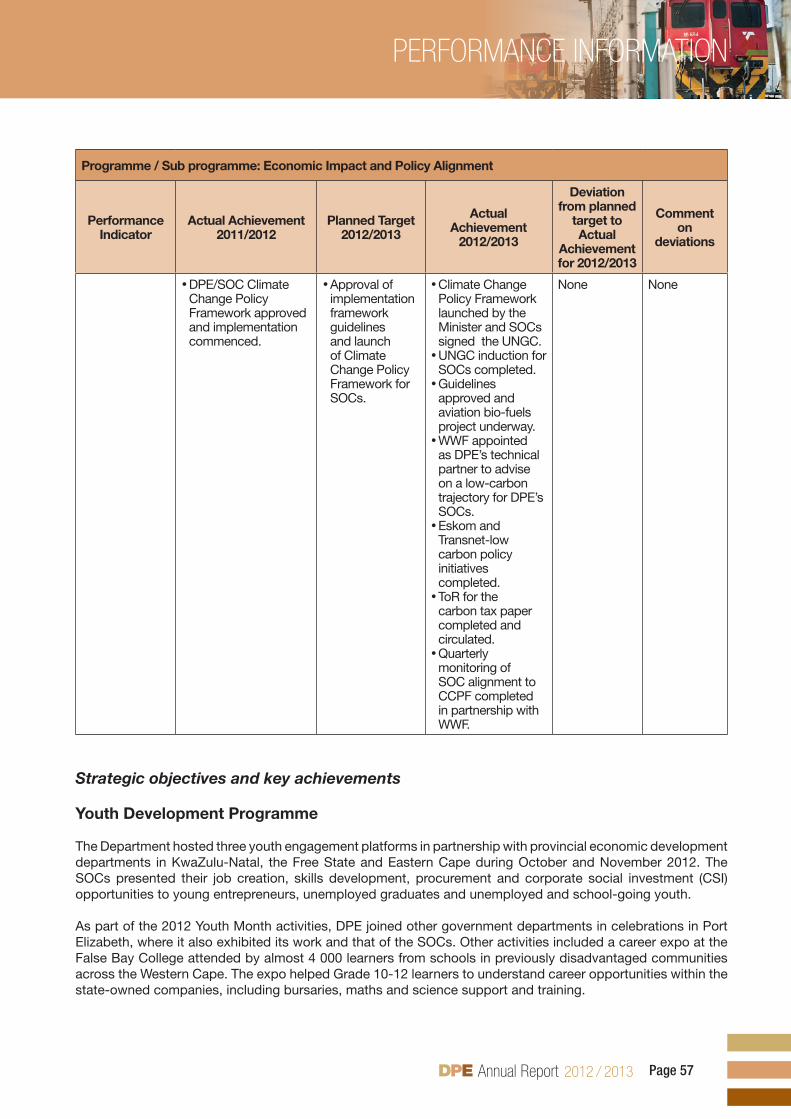
Annual Report Page 57
PERFORMANcE INFORMATION
Programme / Sub programme: Economic Impact and Policy Alignment
Performance Indicator
Actual Achievement 2011/2012
Planned Target2012/2013
Actual Achievement
2012/2013
Deviation from planned
target to Actual
Achievement for 2012/2013
Comment on
deviations
DPE/SOC Climate •Change Policy Framework approved and implementation commenced.
Approval of •implementation framework guidelines and launch of Climate Change Policy Framework for SOCs.
Climate Change •Policy Framework launched by the Minister and SOCs signed the UNGC.UNGC induction for •SOCs completed.Guidelines •approved and aviation bio-fuels project underway. WWF appointed •as DPE’s technical partner to advise on a low-carbon trajectory for DPE’s SOCs.Eskom and •Transnet-low carbon policy initiatives completed.ToR for the •carbon tax paper completed and circulated.Quarterly •monitoring of SOC alignment to CCPF completed in partnership with WWF.
None None
Strategic objectives and key achievements
Youth Development Programme
The Department hosted three youth engagement platforms in partnership with provincial economic development departments in KwaZulu-Natal, the Free State and Eastern Cape during October and November 2012. The SOCs presented their job creation, skills development, procurement and corporate social investment (CSI) opportunities to young entrepreneurs, unemployed graduates and unemployed and school-going youth.
As part of the 2012 Youth Month activities, DPE joined other government departments in celebrations in Port Elizabeth, where it also exhibited its work and that of the SOCs. Other activities included a career expo at the False Bay College attended by almost 4 000 learners from schools in previously disadvantaged communities across the Western Cape. The expo helped Grade 10-12 learners to understand career opportunities within the state-owned companies, including bursaries, maths and science support and training.
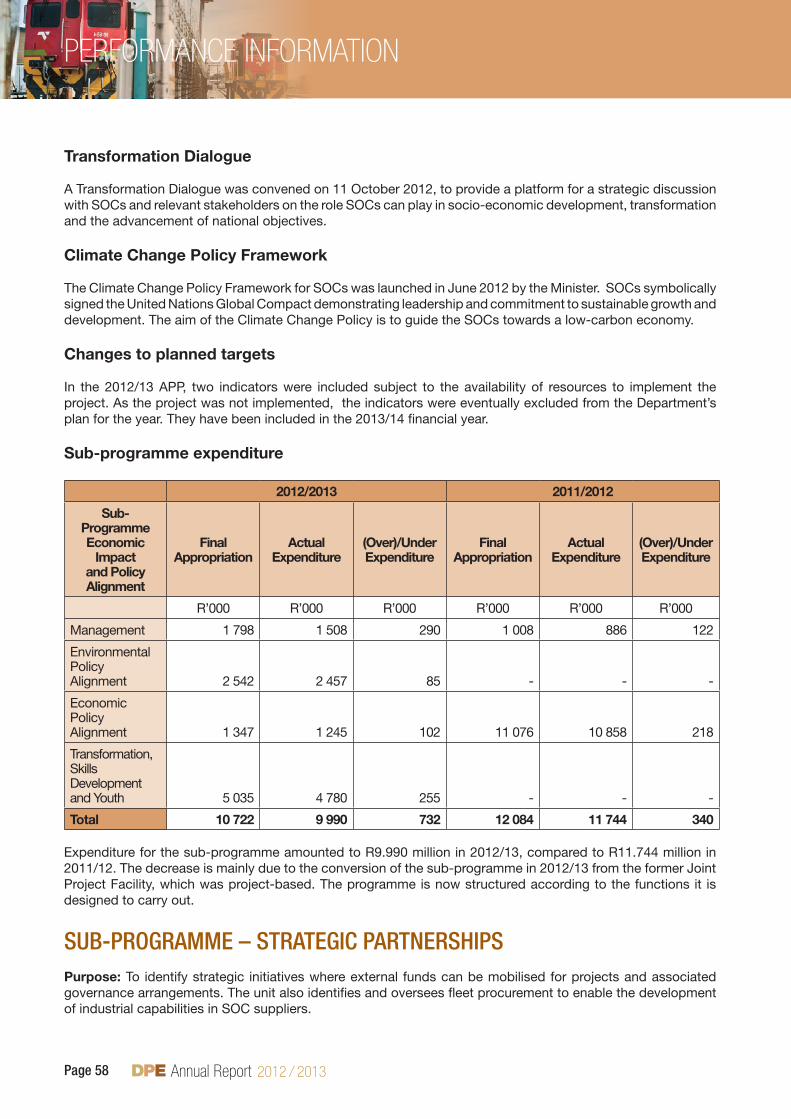
Annual Report Page 58
PERFORMANcE INFORMATION
Transformation Dialogue
A Transformation Dialogue was convened on 11 October 2012, to provide a platform for a strategic discussion with SOCs and relevant stakeholders on the role SOCs can play in socio-economic development, transformation and the advancement of national objectives.
Climate Change Policy Framework
The Climate Change Policy Framework for SOCs was launched in June 2012 by the Minister. SOCs symbolically signed the United Nations Global Compact demonstrating leadership and commitment to sustainable growth and development. The aim of the Climate Change Policy is to guide the SOCs towards a low-carbon economy.
Changes to planned targets
In the 2012/13 APP, two indicators were included subject to the availability of resources to implement the project. As the project was not implemented, the indicators were eventually excluded from the Department’s plan for the year. They have been included in the 2013/14 financial year.
Sub-programme expenditure
2012/2013 2011/2012
Sub- Programme Economic
Impact and Policy Alignment
Final Appropriation
ActualExpenditure
(Over)/Under Expenditure
Final Appropriation
ActualExpenditure
(Over)/Under Expenditure
R’000 R’000 R’000 R’000 R’000 R’000
Management 1 798 1 508 290 1 008 886 122
Environmental Policy Alignment 2 542 2 457 85 - - -
Economic Policy Alignment 1 347 1 245 102 11 076 10 858 218
Transformation, Skills Development and Youth 5 035 4 780 255 - - -
Total 10 722 9 990 732 12 084 11 744 340
Expenditure for the sub-programme amounted to R9.990 million in 2012/13, compared to R11.744 million in 2011/12. The decrease is mainly due to the conversion of the sub-programme in 2012/13 from the former Joint Project Facility, which was project-based. The programme is now structured according to the functions it is designed to carry out.
suB-ProGramme – strateGIC PartnersHIPsPurpose: To identify strategic initiatives where external funds can be mobilised for projects and associated governance arrangements. The unit also identifies and oversees fleet procurement to enable the development of industrial capabilities in SOC suppliers.

Annual Report Page 59
PERFORMANcE INFORMATION
Sub-programme
Management – comprises of the office of the Deputy Director-General, which leads and manages the programme personnel.Project Oversight – define catalytic investments to be driven by DPE and oversee project implementation from pre-feasibility to completion, including the design of relevant compacts. Funding Mechanisms - develop innovative funding structures and design associated compacts with relevant partners. Strategic Relationships – develop overarching procurement leverage policies, oversee SOC fleet procurement design and implementation, and develop and implement capability building programmes and institutions.
Performance indicators
Programme / Sub-programme: Strategic Partnerships
Performance Indicator
Actual Achievement
2011/2012
Planned Target2012/2013
Actual Achievement
2012/2013
Deviation from planned target
to Actual Achievement for 2012/2013
Comment on deviations
Establishment of the Project Management Office
New project commenced in 2012/13
Assess different business models for the project management office (PMO).
Developed the scope and business model for the PMO.
None None
PSP Framework New project. To commence
Private sector participation framework approved.
Draft PSP framework developed.
Approval of the PSP framework.
The PSP framework has been reviewed and the new draft submitted to the relevant stakeholders for inputs.
Fleet procurement implemented by Transnet
Design of locomotive fleet procurement process by Transnet.
Monitor the implementation of Transnet’s fleet procurement process.
Comprehensive •evaluation undertaken and areas of non-alignment identified.Study •completed in collaboration with Transnet and the Department of Trade and Industry to determine the respective roles of Transnet Rail Engineering and the private sector, and to establish a more comprehensive component-level and export-driven localisation strategy.
None None

Annual Report Page 60
PERFORMANcE INFORMATION
Programme / Sub-programme: Strategic Partnerships
Performance Indicator
Actual Achievement
2011/2012
Planned Target2012/2013
Actual Achievement
2012/2013
Deviation from planned target
to Actual Achievement for 2012/2013
Comment on deviations
Continuous expansion of SOC supplier development programme (Eskom and Transnet).
Continuous dialogue with and evaluation of SOC supplier development planning process and output.
Monitor implementation of supplier development plans by SOCs.
Eskom and •Transnet supplier development plans reviewed and approved for implementation. Next-generation •supplier development plans launched during the Supplier Development Summit hosted by the Minister on 14 and 15 March 2013.Implementation •of plans underway by Eskom and Transnet, but subject to resolution of exemption of the SOCs from PPPFA clauses.
None None
Strategic objectives and key achievements
SOC Supplier Development Summit
The DPE held a Supplier Development, Localisation and Transformation Summit on 14 and 15 March 2013. It was attended by Eskom and Transnet suppliers, customers and other key stakeholders. Eskom and Transnet launched their next-generation supplier development plans and highlighted the products and services that have been prioritised for investment by industry in their supplier development, localisation and transformation strategies. They also gave suppliers insight into how these products and services will be procured to realise the objectives. The outcomes of the summit were as follows:
The SOC suppliers formed an interim steering committee as a first step to organise themselves into a •representative body (SOC Supplier Association) that will enable better communication between suppliers, top decision-makers in government and the SOCs to ensure government support is optimised. A collaborative supplier development initiative was established under Eskom’s leadership and involving •Transnet and key players in the mining sector. The initiative will focus on the development of the pumps and valves industry in South Africa, as well as a joint strategic sourcing skills development initiative. In addition, Transnet is exploring the establishment of a supplier development fund in collaboration with •key players in the mining industry. The fund will enable the development of local manufacturers to produce components used by both Transnet and the mining industry, which are currently being imported.

Annual Report Page 61
PERFORMANcE INFORMATION
SOC Automotive Industry Competitiveness Forum
The Industrial Policy Action Plan (IPAP) regards the automotive sector as a development priority. The sector is a centre of manufacturing excellence in South Africa through its introduction of global cutting-edge manufacturing and supply chain management technologies. However, a range of economic infrastructure challenges impacts the competitiveness of the sector. Particularly Eskom and Transnet service provision could be improved to support its growth.
The Minister of Public Enterprises hosted the SOC Automotive Industry Competitiveness Forum on 20 September 2012 with three key objectives:
To promote collaboration between SOCs and the automotive industry to ensure that infrastructure capacity •and service delivery enhance competitiveness and to enable increased investment in infrastructure and in the cluster as a whole. To send a clear signal to investors that SOCs will respond to their needs within sensible commercial •constraints. To identify priority automotive cluster infrastructure-related projects that will be overseen by the Minister of •Public Enterprises.
Changes to planned targets
There were no changes to the planned outputs. The launch of the SIPs, in particular SIP 1 and 2, required the Department to design a new institutional structure to oversee their coordination. This work has been allocated under the Strategic Partnership programme.
Sub-programme expenditure
2012/2013 2011/2012
Sub- Programme
Strategic Partnerships
Final Appropriation
ActualExpenditure
(Over)/Under
Expenditure
Final Appropriation
ActualExpenditure
(Over)/Under
Expenditure
R’000 R’000 R’000 R’000 R’000 R’000
Management 4 496 4 364 132 6 463 7 555 (1 092)
Project Oversight 416 328 88 - - -
Funding Mechanisms 100 - 100 - - -
Supplier Relationships 1 543 1 281 262 - - -
Total 6 555 5 973 582 6 463 7 555 (1 092)
Expenditure for the sub-programme amounted to R5.973 million in 2012/13, compared to R7.555 million in 2011/12. The sub-programme was established in the 2012/13 financial year. The decrease in expenditure is based on historic figures drawn from the office of the Chief Investment Portfolio Management (CIPM) in Programme 1 from where a number of functions were allocated to this unit. The 2011/12 figures indicate an over expenditure due to the fact that the CIPM was a sub-sub-programme of the management sub-programme in Programme 1. Overall expenditure in that sub-programme was not compromised.

Annual Report Page 62
PERFORMANcE INFORMATION
6. summarY of fInanCIal InformatIon
6.1 Departmental receipts
2012/2013 2011/2012
Departmental receipts Estimate
Actual Amount
Collected
(Over)/Under Collection Estimate Actual
Amount Collected
(Over)/Under Collection
R’000 R’000 R’000 R’000 R’000 R’000
Sale of goods and services other than capital assets 56 58 (2) 38 53 (15)
Interest, dividends and rent on land 18 12 6 6 5 1
Sale of capital assets - - - 1 8 (7)
Financial transactions in assets and liabilities 502 467 35 54 - 54
Total 576 537 39 99 66 33
Collection of departmental revenue
Revenue collection is not a core function of the Department and therefore it has no specific plan in place in this regard. Any revenue collected by the Department and reported under Note 2 of the financial statements is of an incidental nature, such as parking fees, interest received on debts, sale of redundant capital assets and interest on bank accounts. Capital assets, such as computers, are first offered to schools. Should it not be required, the equipment is auctioned to staff.
6.2 Programme expenditure
2012/2013 2011/2012
Programme Final Appropriation
ActualExpenditure
(Over)/Under Expenditure
Final Appropriation
ActualExpenditure
(Over)/Under
Expenditure
R’000 R’000 R’000 R’000 R’000 R’000
Administration 117 096 115 367 1 729 110 181 108 635 1 546
Legal and Governance 24 237 23 477 760 22 779 19 518 3 261
Portfolio Management and Strategic Partnerships 1 235 425 1 228 205 7 220 220 382 217 962 2 420
Total 1 376 758 1 367 049 9 709 353 342 346 115 7 227

Annual Report Page 63
PERFORMANcE INFORMATION
The increase of R1.023 billion in the annual appropriation, from R353.342 million to R1.377 billion, is mainly as a result of an increase in payments for financial assets and a transfer payment to state-owned companies.Under spending amounting to R9.7 million was recorded in the 2012/13 financial year. This amount consists mainly of current expenditure in the operational budget on two line items. Firstly, compensation of employees was underspent by R6 million (5.36% of budget) as a result of posts not filled due to the scarcity of specialist skills in the market. Secondly, goods and services was underspent by R3.7 million (3.91% of budget) due to projects delays caused by capacity constraints. The Department has requested an R1.8-million rollover from the 2012/13 goods and services budget from National Treasury to complete three projects in the new financial year. The Department spent 99.3% of its budget, bringing it within the 2% spending target.
6.3 transfer payments, excluding public entities None
6.4 Public entitiesOrganisations to whom payments for financial assets and transfer payments have been made:
Entity Total Budget R’000
Expenditure R’000
Remaining Budget R’000
% Of Total Budget Used
Alexkor (payment for financial assets) 350 000 350 000 - 100
Denel (payment for financial assets) 700 000 700 000 - 100
Denel (indemnity claim) 118 313 118 313 - 100
The transfer to Denel, amounting to R118 312 954, was disbursed in November 2012. Refer to Annexure 1A •of the annual financial statements.The payment for financial assets (transfer) to Denel, amounting to R700 million, was disbursed in two •tranches: R400 million in December 2012 and R300 million in March 2013. The payment for financial assets (transfer) to Alexkor, amounting to R350 million, was disbursed in December •2012.
Refer to Note 6 of the annual financial statements – Payments for Financial Assets.
The Department does not exercise control over the accounting arrangements of the SOC within its portfolio, except to approve the appointment of external auditors.
The achievements of the entities are reported in their annual reports, which are separately tabled at Parliament.
6.5 Conditional grants and earmarked funds paid
Earmarked funds
Alexkor R350 millionDenel R700 millionRefer to section to 6.4 for details on the transfers.

Annual Report Page 64
PERFORMANcE INFORMATION
6.6 Conditional grants and earmarked funds received Not applicable
6.7 Donor funds Not applicable.
6.8 Capital investment, maintenance and asset management plan The Department does not have any major capital and/or investment infrastructure projects.
Asset management is dealt with under Section 11 of the Accounting Officer’s Report.

Part C: GOvERNANcE

Annual Report Page 66
GOvERNANcE
1. IntroDuCtIonThe department has established systems and governance structures to oversee its processes and improve accountability. These systems and structures are crucial in promoting good governance within the Department and ensure that the Department complies with legislative requirements.
2. rIsK manaGement The Department continued its implementation of an integrated system of risk management in accordance with the Enterprise Risk Management (ERM) Framework. The framework enables the Department to effectively manage key risks that could prevent it from achieving its objectives. The Department’s exco, chaired by the Director-General, fulfilled the role of the Risk Management Committee and was supported by the Audit Committee in effectively overseeing the management of key risks.
The ERM Framework, the Risk Management Strategy, Policy and Compliance Policy were reviewed and approved. The Department’s legislative universe has been established and is monitored continuously to ensure compliance with relevant legislation, policies and regulations. Business unit risks were assessed and a register for each unit is maintained. In addition, shareholder risks were identified and are monitored and mitigated on an on-going basis. The Department continued to conduct assessments of SOC PFMA applications, quarterly reports and corporate plans in order to identify and mitigate risks that government is exposed to as a result of the SOCs’ activities. Exco is satisfied that the Department maintained an effective, efficient and transparent system of risk management that is consistent with the requirements of the PFMA and the Public Sector Risk Management Maturity Model as issued by National Treasury.
3. frauD anD CorruPtIon The Department’s fraud and prevention plan (integrated fraud and anti-corruption strategy) was reviewed during the financial year under review. The policy will be approved and implemented during 2013/14 financial year.
Internal Audit is the custodian of the whistle-blowing policy and is also responsible for the administration of the internal confidential reporting box. Internal Audit, in consultation with the accounting officer, oversees the resolution of all whistle-blowing cases.
All cases raised through the confidential reporting box in the current financial year, were effectively resolved. Internal Audit reports quarterly to the Audit Committee on the whistle-blowing logs and the resolution of cases. During the year under review, the Department did not receive cases from the fraud and anti-corruption hotline and there has not been any forensic investigation.
4. mInImIsInG ConflICt of InterestThe Department operates within an approved delegation of authority framework. Both the financial and human resource delegations were reviewed for approval and implementation during 2013/14 financial year.
All senior management staff members are expected to complete financial disclosure forms annually for reporting to the Public Service Commission. All completed forms are also vetted by Internal Audit for potential conflicts of interests before submitting to the executive authority.
The Department has an approved gift policy that outlines the procedures to be followed before an official can accept any gifts in his or her capacity as a public servant. One of the measures put in place requires the

Annual Report Page 67
GOvERNANcE
accounting officer to approve the acceptance of the gift. Such approval is granted after taking into consideration the nature of work, the environment the official operates in and whether or not the official is conflicted or will be conflicted. Upon approval the gift is disclosed in the gift register, which is co-ordinated by the Communications unit.
All members of the Bid Adjudication Committee, Bid Evaluation Committee, Audit Committee and the Executive Committee must declare their interests before proceeding with the meeting agendas. In the event of any conflict a member will be excused for either part of the meeting or the entire proceedings, depending on the nature of the issue being discussed.
It is standard practice for all new employees to sign the Department’s code of ethics. Some employees also have to sign confidentiality agreements, depending on the information they have access to. All employees undergo a security check, conducted by the State Security Agency.
5. CoDe of ConDuCt In the 2013/14 financial year, Human Resources will facilitate training and awareness on the Government code of conduct and integrity management framework. The programme will address incidents of corruption, management of conflict of interest, public servants undertaking additional employment and receiving remuneration without prior approval and public servants doing business with the State.
6. HealtH safetY anD envIronmental IssuesRefer to the Accounting Officer’s Report, Section 8, Occupational Health and Safety.
7. Internal Control unItThe Department has an Internal Audit unit, which reports administratively to the accounting officer and functionally to the Audit Committee. The Internal Audit unit consists of a chief audit executive and an audit manager and has a co-sourcing arrangement with a registered firm of accountants and auditors. The strategic objective of the unit is to provide objective assurance to management and the Audit Committee that internal control, risk management and governance processes are adequate and effective. Internal Audit also provides consulting services to the Department as and when necessary.
During the year under review, the Internal Audit unit executed its risk-based operational plan and issued reports to management with recommendations to address identified weaknesses. The unit also tracked implementation of management actions quarterly and reported results to the Executive Committee and the Audit Committee.
A concerted effort was made to coordinate work with other assurance providers. This was achieved by ensuring that quarterly reporting on combined assurance is adequate and effective and also by managing the internal control dashboard on behalf of the Auditor-General. The Audit Committee received quarterly reports on both the combined assurance and the implementation of management commitments on the internal control dashboard.
The Internal Audit function received a “generally conforms” rating in the external quality assessment of the unit
8. auDIt CommIttee rePortRefer to the Annual Financial Statement Part E of the Annual Report.
Part D: HuMAN REsOuRcE
MANAGEMENT

Annual Report Page 69
HuMAN REsOuRcE MANAGEMENT
1. leGIslatIon tHat Governs Human resourCe manaGement The information provided in this part is prescribed by the Public Service Regulations (Chapter 1, Part III J.3 and J.4).
2. IntroDuCtIon The structure of the Department was reviewed and approved by the DPSA and National Treasury. As a result the establishment increased to 210 through the creation of 12 funded posts in September. The establishment is at 220 for 2013/14 and will increase to 227 for subsequent years.
The Department’s vacancy rate was 11.1% at the end of August 2012. However, the funding approval for 12 additional posts that was received at the end of August 2012, increased the vacancy rate at the end September 2012 to 15.34%. The Department appointed 47 new employees, compared to 25 in 2011/2012. This reduced the vacancy rate as at 31 March 2013 to 11.9%. During this period 18 officials resigned. Recruitment timelines are monitored and adhered to, to ensure that the Department maintains its vacancy rate below 10%.
The high turnover of critical and core staff, who are attracted primarily to the SOCs by highly competitive remuneration packages, remains a challenge. Advanced strategies to attract and retain critical talent are currently being explored. These include a new model to reposition the Department to fulfil its oversight role more effectively and in line with best practice and the Presidential Review Commission report on the management of SOCs.
The Department continuously monitors and aligns its performance management processes to improve its effectiveness according to the DPSA compliance directive.
The Department continues to implement the Cabinet’s decision that senior management levels should reflect a 50/50 gender representation and that 2% of staff should be persons with disabilities. For the year under review the Department improved women representation to 41% and persons with disabilities to 3%.
The Department’s wellness programmes were reviewed in consultation with all stakeholders to effectively implement health and wellness policies.The Department adhered to the guidelines that disciplinary matters should be concluded within three months and grievances within 30 days.

Annual Report Page 70
HuMAN REsOuRcE MANAGEMENT
3. Human resourCe oversIGHt statIstICs
3.1 Personnel-related expenditure
Table 3.1.1 Personnel expenditure by programme
ProgrammeTotal
Expenditure (R’000)
Personnel Expenditure
(R’000)
Training Expenditure
(R’000)
Professional and Special
Services Expenditure
(R’000)
Personnel Expenditure
as a % of total
expenditure
Average personnel cost per
employee (R’000)
Administration 115 367 56 714 1 069 8 013 49 300
Legal and Governance 21 706 14 111 170 5 388 65 75
Portfolio Management and Strategic Partnerships
1 228 205 34 502 385 16 383 2.8 183
Total 1 367 049 105 327 1 624 29 784 7.7 558
Table 3.1.2 Personnel costs by salary band
Salary bandPersonnel
expenditure (R’000)
% of total personnel cost No. of employees
Average personnel cost per employee
(R’000)
Lower skilled (levels 1-2) 0 0 0 0
Skilled (level 3-5) 1 543 1.4 9 171
Highly skilled production (levels 6-8) 13 181 12.5 52 253
Highly skilled supervision (levels 9-12) 23 089 21.9 46 502
Senior and top management (levels 13-16)
23 061 21.4 10 2306
Contract (Levels 1-2) 0 0 0 0
Contract (Levels 3-5) 0 0 0 0
Contract (Levels 6-8) 1 206 1.1 5 241
Contract (Levels 9-12) 2 593 2.4 4 648
Contract (Levels 13-16) 36 837 34.7 59 624 356
Periodic remuneration 3 836 3.6 49 78 286
Abnormal appointment 0 0 0 0
Total 105 346 100 234 450 197

Annual Report Page 71
HuMAN REsOuRcE MANAGEMENT
Table 3.1.3 Salaries, overtime, home owners’ allowances and medical aid by programme
Programme
Salaries Overtime Home Owners’ Allowance Medical Aid
Amount (R’000
Salaries as a % of personnel
costs
Amount (R’000)
Overtime as a % of personnel
costs
Amount (R’000)
HOA as a % of
personnel costs
Amount (R’000)
Medical aid as a % of
personnel costs
Administration 41 623 73.4 462 0.8 834 1.5 1 290 2.3
Legal and Governance 11 683 82.8 1 0 90 0.6 206 1.5
Portfolio Management and Strategic Partnerships
26 516 76.8 6 0 617 1.8 522 1.5
Total 79 822 75.7 469 0.4 1 541 1.5 2 018 1.9
Table 3.1.4 Salaries, overtime, home owners’ allowance and medical aid by salary band
Salary Bands
Salaries Overtime Home Owners’ Allowance Medical Aid
Amount (R’000)
Salaries as a % of personnel
costs
Amount (R’000)
Overtime as a % of personnel
costs
Amount (R’000)
HOA as a % of
personnel costs
Amount (R’000)
Medical aid as a % of
personnel costs
Skilled (level 1-2) 0 0 0 0 0 0 0 0
Skilled (level 3-5) 952 61.7 62 4 97 6.3 123 8
Highly skilled production (levels 6-8)
9 759 74 254 1.9 506 3.8 764 5.8
Highly skilled supervision (levels 9-12)
18 804 81.4 152 0.7 292 1.2 560 2.4
Senior management (level 13-16)
50 307 214.1 0 0 647 2.8 570 2.5
Total 79 822 73.9 468 0.4 1 542 1.5 2 017 1.9

Annual Report Page 72
HuMAN REsOuRcE MANAGEMENT
3.2 employment and vacanciesTable 3.2.1 Employment and vacancies by programme
Programme
Number of posts on approved
establishment
Number of posts filled Vacancy rate
Number of employees
additional to the establishment
Administration: permanent 115 108 6.1 2
Legal and Governance: permanent 22 20 9.1 0
Portfolio management and strategic partnerships: permanent
73 57 21.9 0
Total 210 185 11.9 2
Table 3.2.2 Employment and vacancies by salary band
Salary band
Number of posts on approved
establishment
Number of posts filled Vacancy rate
Number of employees
additional to the establishment
Lower skilled (levels 1-2) 0 0 0 0
Skilled (levels 3-5) 9 9 0 0
Highly skilled production (levels 6-8) 58 56 3.4 2
Highly skilled supervision (levels 9-12) 60 51 15 0
Senior management (levels 13-16) 83 69 13.8 0
Total 210 185 11.9 2

Annual Report Page 73
HuMAN REsOuRcE MANAGEMENT
Table 3.2.3 Employment and vacancies by critical occupations
Critical occupation
Number of posts on approved
establishment
Number of posts filled Vacancy rate
Number of employees additional
to the establishment
Administration-related: permanent 65 57 12.3 0
Client information clerks (switchboard, reception information clerks): permanent
3 3 0 0
Communication and information related: permanent 3 3 0 0
Finance and related professionals: permanent 9 8 11.1 0
Financial clerks and credit controllers: permanent 6 6 0 0
Food services aids and waiters: permanent 3 3 0 0
Head of department/chief executive officer: permanent 1 1 0 0
Human resources, organisational development and related professionals: permanent
7 7 0 0
Information technology related: permanent 6 4 33.3 0
Library, mail and related clerks: permanent 6 6 0 2
Logistical support personnel: permanent 7 7 0 0
Messengers, porters and delivery staff: permanent 7 7 0 0
Security officers: permanent 4 4 0 0
Senior managers: permanent 83 69 16.9 0
Total 210 185 11.9 2
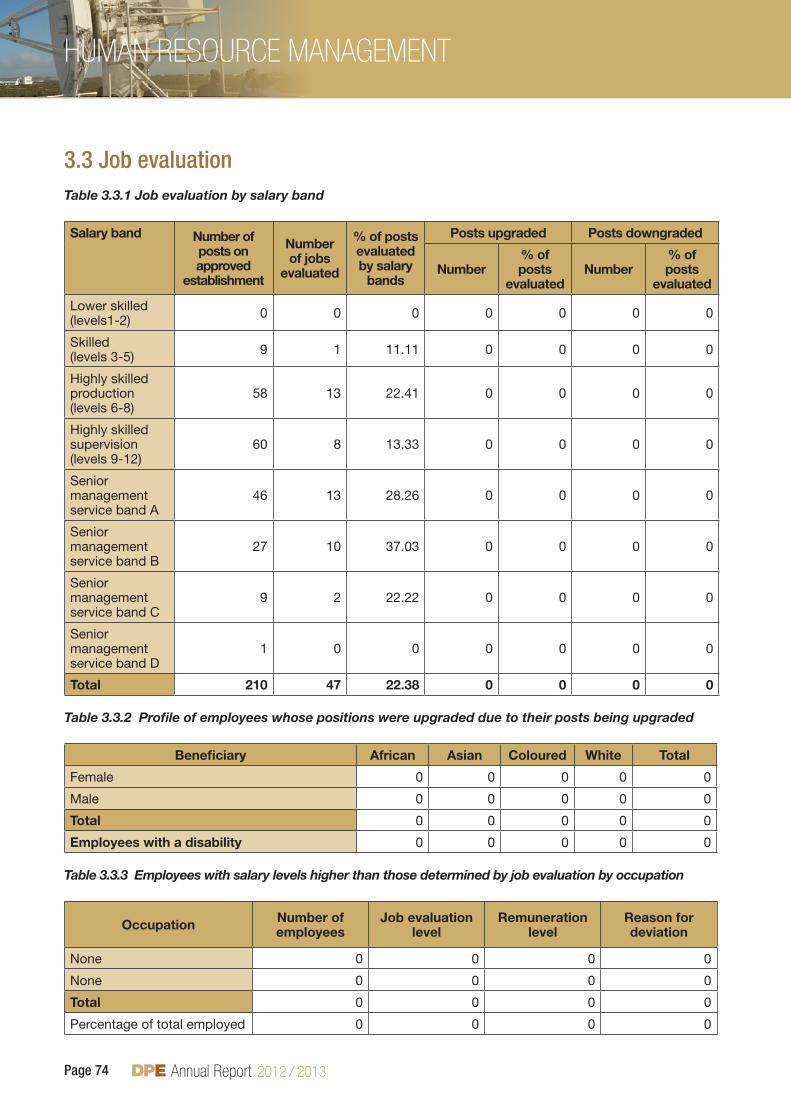
Annual Report Page 74
HuMAN REsOuRcE MANAGEMENT
3.3 Job evaluationTable 3.3.1 Job evaluation by salary band
Salary band Number of posts on approved
establishment
Number of jobs
evaluated
% of posts evaluated by salary
bands
Posts upgraded Posts downgraded
Number% of posts
evaluatedNumber
% of posts
evaluated
Lower skilled (levels1-2) 0 0 0 0 0 0 0
Skilled (levels 3-5) 9 1 11.11 0 0 0 0
Highly skilled production (levels 6-8)
58 13 22.41 0 0 0 0
Highly skilled supervision(levels 9-12)
60 8 13.33 0 0 0 0
Senior management service band A
46 13 28.26 0 0 0 0
Senior management service band B
27 10 37.03 0 0 0 0
Senior management service band C
9 2 22.22 0 0 0 0
Senior management service band D
1 0 0 0 0 0 0
Total 210 47 22.38 0 0 0 0
Table 3.3.2 Profile of employees whose positions were upgraded due to their posts being upgraded
Beneficiary African Asian Coloured White Total
Female 0 0 0 0 0
Male 0 0 0 0 0
Total 0 0 0 0 0
Employees with a disability 0 0 0 0 0
Table 3.3.3 Employees with salary levels higher than those determined by job evaluation by occupation
Occupation Number of employees
Job evaluation level
Remuneration level
Reason for deviation
None 0 0 0 0
None 0 0 0 0
Total 0 0 0 0
Percentage of total employed 0 0 0 0

Annual Report Page 75
HuMAN REsOuRcE MANAGEMENT
The following table summarises the beneficiaries of the above in terms of race, gender and disability.
Table 3.3.4 Profile of employees who have salary levels higher than those determined by job evaluation
Beneficiary African Asian Coloured White Total
Female 0 0 0 0 0
Male 0 0 0 0 0
Total 0 0 0 0 0
Employees with a disability 0 0 0 0 0
Total number of employees whose remuneration exceeded the grade determined by job evaluation in 2012/13 0
3.4 employment changesTable 3.4.1 Annual turnover rates by salary band
Salary band
Number of employees at beginning of period-April
2012
Appointments and transfers
into the department
Terminations and transfers
out of the department
Turnover rate
Lower skilled (levels 1-2) 0 0 0 0
Skilled (levels 3-5) 9 0 0 0
Highly skilled production (levels 6-8) 52 9 5 9.6
Highly skilled supervision (levels 9-12) 51 8 5 9.8
Senior management service band A 1 0 0 0
Senior management service band B 30 13 3 10
Senior management service band C 18 5 3 16.7
Senior management service band D 5 2 2 40
Contracts 0 0 0 0
Total 166 37 18 10.8

Annual Report Page 76
HuMAN REsOuRcE MANAGEMENT
Table 3.4.2 Annual turnover rates by critical occupation
Critical occupation
Number of employees at beginning of period-April
2012
Appointments and transfers
into the department
Terminations and transfers
out of the department
Turnover rate
Administration-related: permanent 64 9 7 10.9
Client information clerks (switchboard, reception, information clerks): permanent
3 0 0 0
Communication and information related: permanent 2 1 1 50
Finance and related professionals: permanent 7 1 1 14.3
Financial clerks and credit controllers: permanent 4 2 1 25
Food services aids and waiters: permanent 3 0 0 0
Head of department/chief executive officer: permanent 1 0 0 0
Human resources, organisational development and related professionals: permanent
5 1 0 0
Information technology related: permanent 2 2 0 0
Library, mail and related clerks, permanent 6 0 0 0
Logistical support personnel: permanent 5 0 0 0
Messengers, porters and delivery staff: permanent 6 1 0 0
Security officers: permanent 4 0 0 0
Senior managers: permanent 54 20 8 14.8
Total 166 37 18 10.8
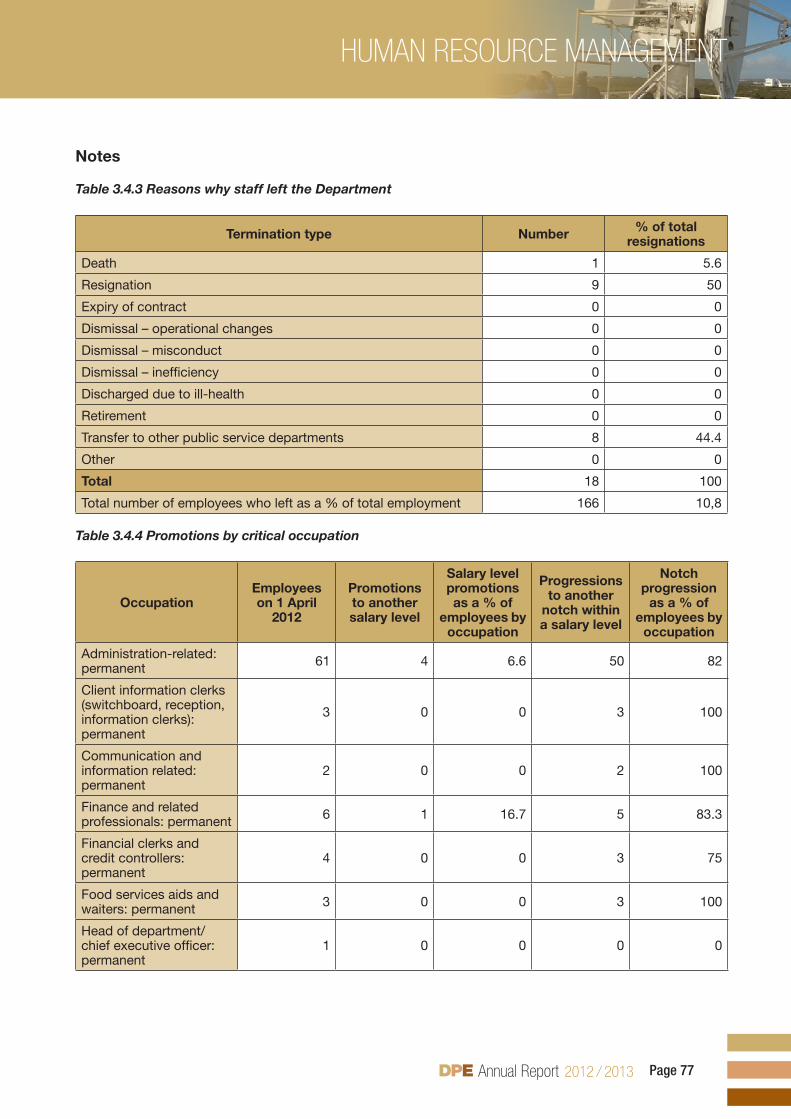
Annual Report Page 77
HuMAN REsOuRcE MANAGEMENT
Notes
Table 3.4.3 Reasons why staff left the Department
Termination type Number % of total resignations
Death 1 5.6
Resignation 9 50
Expiry of contract 0 0
Dismissal – operational changes 0 0
Dismissal – misconduct 0 0
Dismissal – inefficiency 0 0
Discharged due to ill-health 0 0
Retirement 0 0
Transfer to other public service departments 8 44.4
Other 0 0
Total 18 100
Total number of employees who left as a % of total employment 166 10,8
Table 3.4.4 Promotions by critical occupation
OccupationEmployees on 1 April
2012
Promotions to another salary level
Salary level promotions as a % of
employees by occupation
Progressions to another
notch within a salary level
Notch progression
as a % of employees by
occupation
Administration-related: permanent 61 4 6.6 50 82
Client information clerks (switchboard, reception, information clerks): permanent
3 0 0 3 100
Communication and information related: permanent
2 0 0 2 100
Finance and related professionals: permanent 6 1 16.7 5 83.3
Financial clerks and credit controllers: permanent
4 0 0 3 75
Food services aids and waiters: permanent 3 0 0 3 100
Head of department/chief executive officer: permanent
1 0 0 0 0

Annual Report Page 78
HuMAN REsOuRcE MANAGEMENT
OccupationEmployees on 1 April
2012
Promotions to another salary level
Salary level promotions as a % of
employees by occupation
Progressions to another
notch within a salary level
Notch progression
as a % of employees by
occupation
Human resources, organisational development and related professionals: permanent
7 1 14.3 6 85.7
Information technology related: permanent 2 0 0 2 100
Library, mail and related clerks: permanent 6 0 0 5 83.3
Logistical support personnel: permanent 7 0 0 6 85.7
Messengers, porters and delivery staff: permanent 6 0 0 1 16.7
Security officers: permanent 4 0 0 4 100
Senior managers: permanent 54 4 7.4 49 90.7
Total 166 10 6 139 83.7
Table 3.4.5 Promotions by salary band
Salary Band Employees on 1 April 2012
Promotions to another salary
level
Salary band promotions as a % of
employees by salary level
Progressions to another
notch within a salary level
Notch progression as
a % ofemployees by salary bands
Lower skilled (levels 1-2) 0 0 0 0 0
Skilled (levels3-5) 9 0 0 9 100
Highly skilled production (levels 6-8)
52 2 3.8 40 76.9
Highly skilled supervision (levels 9-12)
51 4 7.8 41 80.4
Senior management (levels 13-16)
54 4 7.4 49 90.7
Total 166 10 6 139 83.7

Annual Report Page 79
HuMAN REsOuRcE MANAGEMENT
3.5 employment equity Table 3.5.1 Total number of employees (including employees with disabilities) in each of the following occupational categories as at 31 March 2013
Occupational category
Male Female Total
African Coloured Indian White African Coloured Indian White
Legislators, senior officials and managers
32 4 3 2 20 2 3 3 69
Professionals 10 0 1 0 13 1 1 4 30
Technicians and associate professionals
10 1 0 0 7 1 0 2 21
Clerks 13 0 0 0 33 2 0 1 49
Service and sales workers 0 0 0 0 3 0 0 0 3
Skilled agriculture and fishery workers
0 0 0 0 0 0 0 0 0
Craft and related trades workers
0 0 0 0 0 0 0 0 0
Plant and machine operators and assemblers
0 0 0 0 0 0 0 0 0
Elementary occupations 9 0 0 0 4 0 0 0 13
Total 74 5 4 2 80 6 4 10 185
Employees with disabilities
2 0 0 1 0 0 0 3 6

Annual Report Page 80
HuMAN REsOuRcE MANAGEMENT
Table 3.5.2 Total number of employees (including employees with disabilities) in each of the following occupational bands on 31 March 2013
Occupational Band
Male Female
African Coloured Indian White African Coloured Indian White Total
Top management(levels 15-16)
3 0 0 0 4 0 0 0 7
Senior management(levels 13-14)
29 4 3 2 16 2 3 3 62
Professionally qualified and experienced specialists and mid-management(levels 9-12)
20 1 1 0 20 2 1 6 51
Skilled technical and academically qualified workers, junior management, supervisors, foremen and superintendents (levels 7-8)
13 0 0 0 33 2 0 1 49
Semi-skilled and discretionary decision making(levels 4-6)
9 0 0 0 7 0 0 0 16
Unskilled and defined decision making(levels 1-3)
0 0 0 0 0 0 0 0 0
Total 74 5 4 2 80 6 4 10 185

Annual Report Page 81
HuMAN REsOuRcE MANAGEMENT
Table 3.5.3 Recruitment
Occupational Band
Male Female
African Coloured Indian White African Coloured Indian White Total
Top management (levels 15-16)
1 0 0 0 1 0 0 0 2
Senior management (levels 13-14)
14 2 1 0 4 0 1 0 22
Professionally qualified and experienced specialists and mid-management (levels 9-12)
3 0 0 0 6 0 0 0 9
Skilled technical and academically qualified workers, junior management, supervisors, foremen and superintendents (levels 7-8)
5 0 0 0 7 0 0 1 13
Semi-skilled and discretionary decision making (levels 4-6)
1 0 0 0 0 0 0 0 1
Unskilled and defined decision making (levels 1-3)
0 0 0 0 0 0 0 0 0
Total 24 2 1 0 18 0 1 1 47
Employees with disabilities
1 0 0 0 0 0 0 0 1
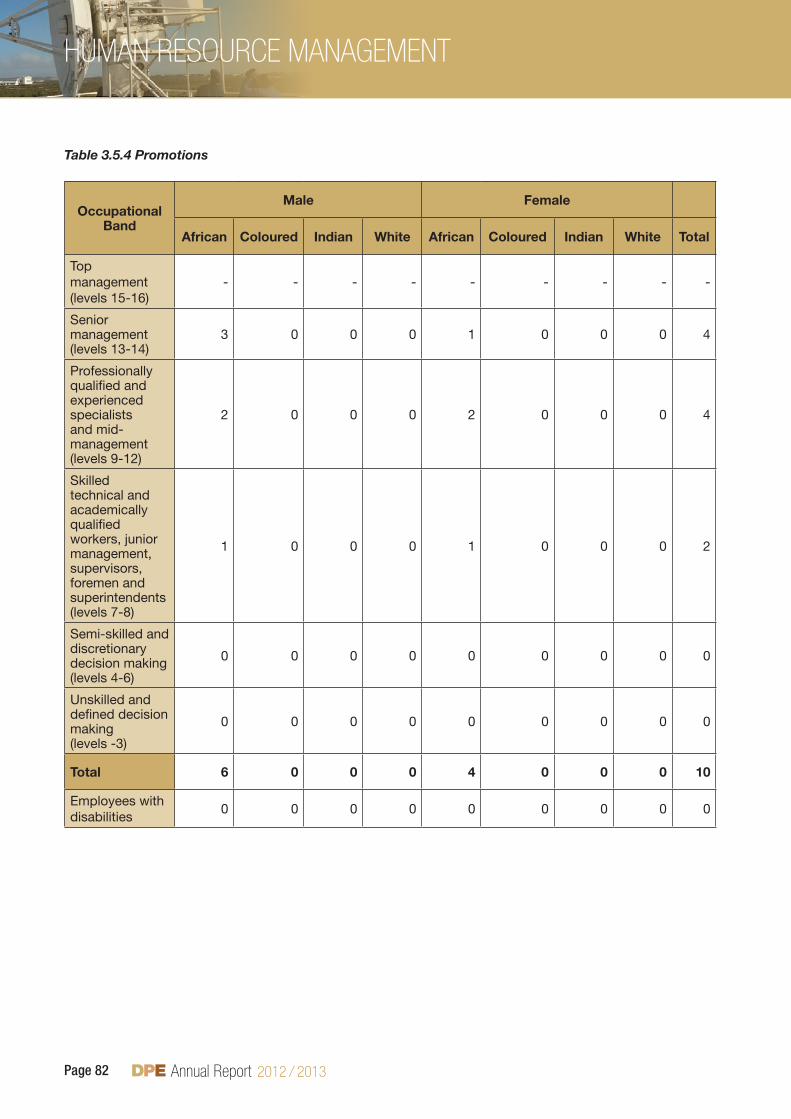
Annual Report Page 82
HuMAN REsOuRcE MANAGEMENT
Table 3.5.4 Promotions
Occupational Band
Male Female
African Coloured Indian White African Coloured Indian White Total
Top management (levels 15-16)
- - - - - - - - -
Senior management (levels 13-14)
3 0 0 0 1 0 0 0 4
Professionally qualified and experienced specialists and mid-management (levels 9-12)
2 0 0 0 2 0 0 0 4
Skilled technical and academically qualified workers, junior management, supervisors, foremen and superintendents (levels 7-8)
1 0 0 0 1 0 0 0 2
Semi-skilled and discretionary decision making (levels 4-6)
0 0 0 0 0 0 0 0 0
Unskilled and defined decision making (levels -3)
0 0 0 0 0 0 0 0 0
Total 6 0 0 0 4 0 0 0 10
Employees with disabilities
0 0 0 0 0 0 0 0 0

Annual Report Page 83
HuMAN REsOuRcE MANAGEMENT
Table 3.5.5 Terminations
Occupational Band
Male Female
African Coloured Indian White African Coloured Indian White Total
Top management (levels 15-16) 0 1 0 0 1 0 0 0 2
Senior management (levels 13-14) 6 0 0 0 0 0 0 0 6
Professionally qualified and experienced specialists and mid-management (levels 9-12)
2 0 0 0 1 0 0 0 3
Skilled technical and academically qualified workers, junior management, supervisors, foremen and superintendents (levels 7-8)
3 0 0 0 4 0 0 0 7
Semi-skilled and discretionary decision making (levels 4-6)
0 0 0 0 0 0 0 0 0
Unskilled and defined decision making (levels 1-3)
0 0 0 0 0 0 0 0 0
Total 11 1 0 0 6 0 0 0 18
Employees with disabilities 1 0 0 0 0 0 0 0 1
Table 3.5.6 Disciplinary action
Disciplinary actionMale Female
African Coloured Indian White African Coloured Indian White Total
Provocation •leading to un- procedural action. Late coming and •assault
0 0 0 0 2 0 0 0 2
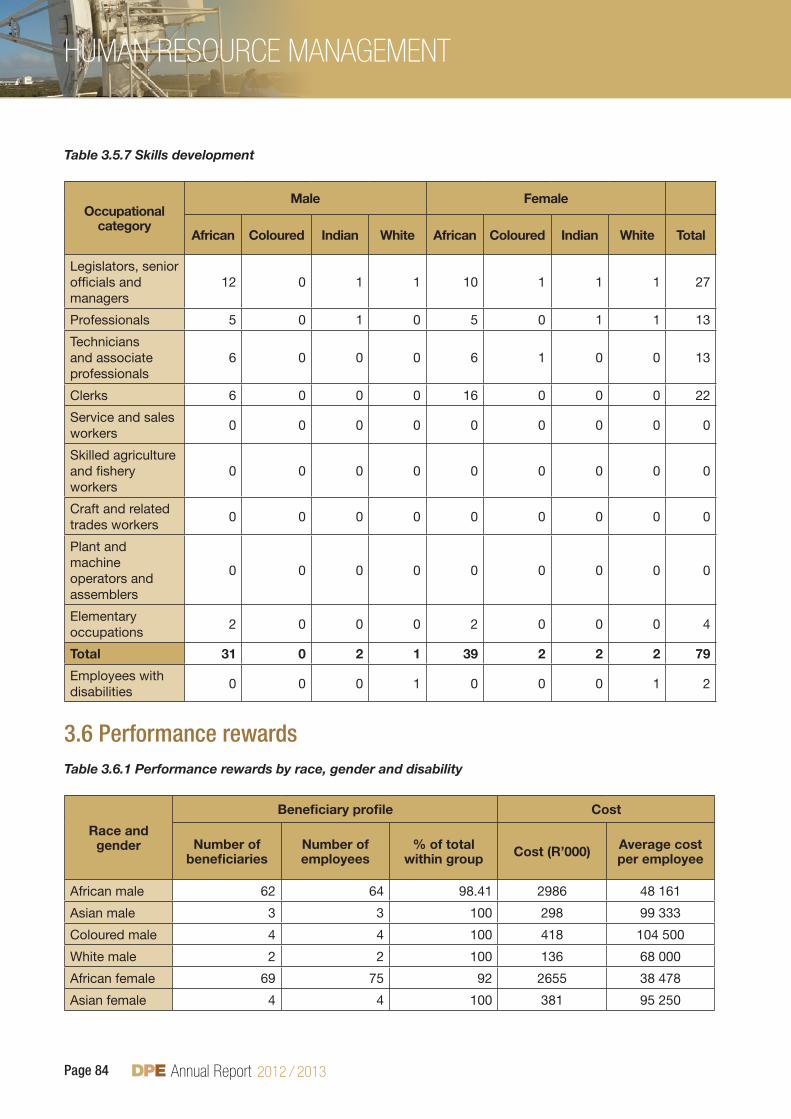
Annual Report Page 84
HuMAN REsOuRcE MANAGEMENT
Table 3.5.7 Skills development
Occupational category
Male Female
African Coloured Indian White African Coloured Indian White Total
Legislators, senior officials and managers
12 0 1 1 10 1 1 1 27
Professionals 5 0 1 0 5 0 1 1 13
Technicians and associate professionals
6 0 0 0 6 1 0 0 13
Clerks 6 0 0 0 16 0 0 0 22
Service and sales workers
0 0 0 0 0 0 0 0 0
Skilled agriculture and fishery workers
0 0 0 0 0 0 0 0 0
Craft and related trades workers
0 0 0 0 0 0 0 0 0
Plant and machine operators and assemblers
0 0 0 0 0 0 0 0 0
Elementary occupations
2 0 0 0 2 0 0 0 4
Total 31 0 2 1 39 2 2 2 79
Employees with disabilities
0 0 0 1 0 0 0 1 2
3.6 Performance rewardsTable 3.6.1 Performance rewards by race, gender and disability
Race and gender
Beneficiary profile Cost
Number of beneficiaries
Number of employees
% of total within group Cost (R’000) Average cost
per employee
African male 62 64 98.41 2986 48 161
Asian male 3 3 100 298 99 333
Coloured male 4 4 100 418 104 500
White male 2 2 100 136 68 000
African female 69 75 92 2655 38 478
Asian female 4 4 100 381 95 250

Annual Report Page 85
HuMAN REsOuRcE MANAGEMENT
Race and gender
Beneficiary profile Cost
Number of beneficiaries
Number of employees
% of total within group Cost (R’000) Average cost
per employee
Coloured female
4 4 80 177 44 250
White female 8 8 100 562 70 250
Total 156 165 95 7613 568 222
Table 3.6.2 Performance rewards by salary band for personnel below senior management service
Salary band
Beneficiary profile Cost
Number of beneficiaries
Number of employees
% of total within salary
bands
Total Cost (R’000)
Average cost per
employee
Total cost as a % of the total
personnel expenditure
Lower skilled (levels 1-2) 0 0 0 0 0 0
Skilled (levels 3-5) 9 9 100 108 12 000 7
Highly skilled production (levels 6-8)
49 52 94 879 17 939 6.10
Highly skilled supervision (levels 9-12)
49 50 96 2170 44 286 8.442
Total 107 111 95 3157 74 225 21.54 Table 3.6.3 Performance rewards by critical occupation
Critical occupation
Beneficiary profile Cost
Number of beneficiaries
Number of employees
% of total within occupation
Total Cost (R’000)
Average cost per
employee
Administration-related 51 53 96 1500 29 412
Client information clerks (switchboard, reception. information clerks)
3 3 100 40 13 333
Communication and information related 2 3 67 70 35 000
Finance and related professionals 11 11 100 387 35 181
Financial clerks and credit controllers 10 10 100 300 30 000
Food services aids and waiters 3 3 100 40 13 333

Annual Report Page 86
HuMAN REsOuRcE MANAGEMENT
Critical occupation
Beneficiary profile Cost
Number of beneficiaries
Number of employees
% of total within occupation
Total Cost (R’000)
Average cost per
employee
Head of department/chief executive officer 0 1 0 0 0
Human resources, organisational development and related professionals
7 7 100 330 47 143
Information technology related 2 2 100 60 30 000
Library, mail and related clerks 6 6 100 175 29 167
Logistical support personnel 2 2 100 55 27 500
Messengers, porters and delivery staff 6 6 100 100 16 667
Security officers 4 4 100 100 25 000
Senior managers 49 54 92.4 4456 90 939
Total 156 165 94.5 7613 422 675
Table 3.6.4 Performance related rewards (cash bonus) by salary band for senior management service
Salary band
Beneficiary profile Cost
Number of beneficiaries
Number of employees
% of total within salary
bands
Total Cost (R’000)
Average cost per
employee
Total cost as a % of the total
personnel expenditure
Band A 29 31 93.5 2297 79 206 3.83
Band B 17 18 94.4 1668 98 117 2.78
Band C 3 5 60 491 163 666 0.81
Band D 0 1 0 0 0 0
Total 49 54 92.4 4456 340 989 7.42

Annual Report Page 87
HuMAN REsOuRcE MANAGEMENT
3.7 foreign workersTable 3.7.1 Foreign workers by salary band
Salary Band01 April 2012 31 March 2013 Change
Number % of total Number % of total Number % Change
Lower skilled (levels 1-5) 0 0 0 0 0 0
Highly skilled production (Levels 6-8)
0 0 0 0 0 0
Highly skilled supervision (Levels 9-12)
0 0 0 0 0 0
Contract (levela 9-12) 0 0 0 0 0 0
Contract (levels 13-16) 3 100 3 100 0 0
Total 3 100 3 100 0 0
Table 3.7.2 Foreign workers by major occupation
Major occupation
01 April 2012 31 March 2013 Change
Number % of total Number % of total Number % Change
Professionals and managers
3 100 3 100 0 0
Total 3 100 3 100 0 0
3.8 leave utilisation Table 3.8.1 Sick leave
Salary band Total days
% Days with
medical certificate
Number of employees using sick
leave
% of total employees using sick
leave
Average days per employee
Estimated cost
(R’000)
Lower skilled (levels 1-2)
Skilled(levels 3-5) 39 100 5 4.3 8 14
Highly skilled production(levels 6-8) 298 80.5 41 35.7 7 187
Highly skilled supervision (levels 9 -12) 226 81.4 35 30.4 6 354
Top and senior management (levels 13-16) 187 10.7 34 29.6 6 580
Total 750 81.7 115 100 7 1135
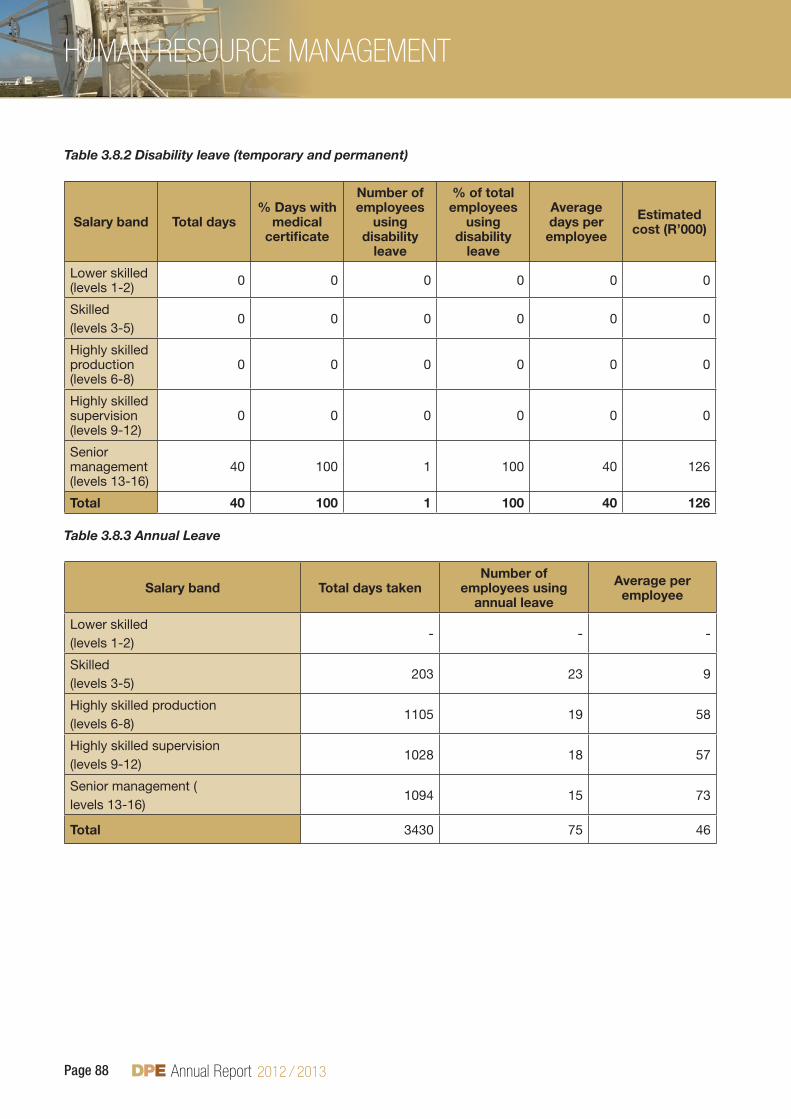
Annual Report Page 88
HuMAN REsOuRcE MANAGEMENT
Table 3.8.2 Disability leave (temporary and permanent)
Salary band Total days % Days with
medical certificate
Number of employees
using disability
leave
% of total employees
using disability
leave
Average days per employee
Estimated cost (R’000)
Lower skilled (levels 1-2) 0 0 0 0 0 0
Skilled (levels 3-5)
0 0 0 0 0 0
Highly skilled production (levels 6-8)
0 0 0 0 0 0
Highly skilled supervision (levels 9-12)
0 0 0 0 0 0
Senior management (levels 13-16)
40 100 1 100 40 126
Total 40 100 1 100 40 126
Table 3.8.3 Annual Leave
Salary band Total days takenNumber of
employees using annual leave
Average per employee
Lower skilled (levels 1-2)
- - -
Skilled (levels 3-5)
203 23 9
Highly skilled production (levels 6-8)
1105 19 58
Highly skilled supervision(levels 9-12)
1028 18 57
Senior management (levels 13-16)
1094 15 73
Total 3430 75 46

Annual Report Page 89
HuMAN REsOuRcE MANAGEMENT
Table 3.8.4 Capped leave
Salary bandTotal days of capped leave
taken
Number of employees using
capped leave
Average number of days taken per
employee
Average capped leave per
employee as at 31 March
Lower skilled
(levels 1-2) 0 0 0 0
Skilled
(levels 3-5) 0 0 0 0
Highly skilled production
(levels 6-8) 0 0 0 0
Highly skilled supervision
(levels 9-12) 0 0 0 0
Senior management (levels 13-16) 2 1 2 50
Total 2 1 2 50
Table 3.8.5 Leave pay-outs
Reason Total amount (R’000)
Number of employees
Average per employee
(R’000)
Leave pay-out for 2011/12 due to non-utilisation of leave in the previous cycle 0 0 0
Capped leave pay-outs on termination of service for 2012/13 0 0 0
Current leave pay-out on termination of service for 2012/13 220 993.76 7 31 570.53
Total 220 993.76 7 31 570.53
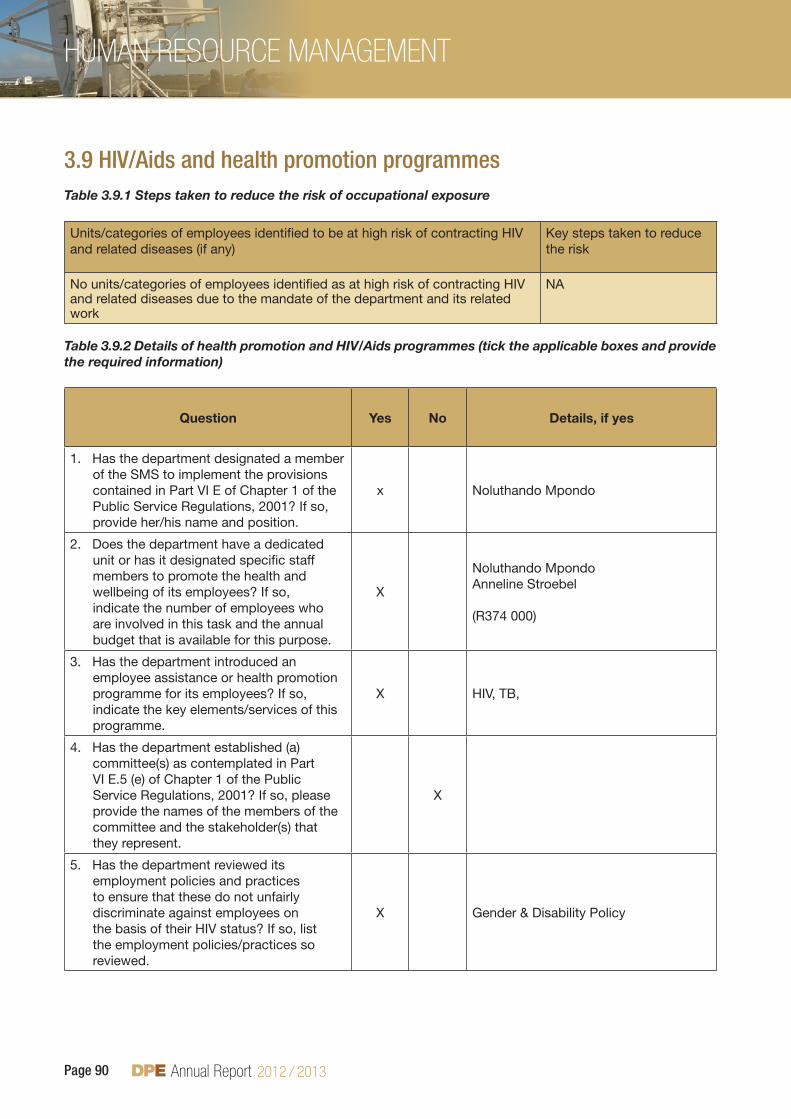
Annual Report Page 90
HuMAN REsOuRcE MANAGEMENT
3.9 HIv/aids and health promotion programmesTable 3.9.1 Steps taken to reduce the risk of occupational exposure
Units/categories of employees identified to be at high risk of contracting HIV and related diseases (if any)
Key steps taken to reduce the risk
No units/categories of employees identified as at high risk of contracting HIV and related diseases due to the mandate of the department and its related work
NA
Table 3.9.2 Details of health promotion and HIV/Aids programmes (tick the applicable boxes and provide the required information)
Question Yes No Details, if yes
1. Has the department designated a member of the SMS to implement the provisions contained in Part VI E of Chapter 1 of the Public Service Regulations, 2001? If so, provide her/his name and position.
x Noluthando Mpondo
2. Does the department have a dedicated unit or has it designated specific staff members to promote the health and wellbeing of its employees? If so, indicate the number of employees who are involved in this task and the annual budget that is available for this purpose.
X
Noluthando MpondoAnneline Stroebel
(R374 000)
3. Has the department introduced an employee assistance or health promotion programme for its employees? If so, indicate the key elements/services of this programme.
X HIV, TB,
4. Has the department established (a) committee(s) as contemplated in Part VI E.5 (e) of Chapter 1 of the Public Service Regulations, 2001? If so, please provide the names of the members of the committee and the stakeholder(s) that they represent.
X
5. Has the department reviewed its employment policies and practices to ensure that these do not unfairly discriminate against employees on the basis of their HIV status? If so, list the employment policies/practices so reviewed.
X Gender & Disability Policy

Annual Report Page 91
HuMAN REsOuRcE MANAGEMENT
Question Yes No Details, if yes
6. Has the department introduced measures to protect HIV-positive employees or those perceived to be HIV-positive from discrimination? If so, list the key elements of these measures.
X A service provider has been appointed to assist patient
7. Does the department encourage its employees to undergo voluntary counselling and testing? If so, list the results that you have you achieved.
X VCT is done by independent bodies and kept confidential
8. Has the department developed measures/indicators to monitor & evaluate the impact of its health promotion programme? If so, list these measures/indicators.
X GEMS provides this service
3.10 labour relationsTable 3.10.1 Collective agreements
Subject Matter Date
None
Table 3.10.2 Misconduct and disciplinary hearings finalised
Outcomes of disciplinary hearings Number % of total
Correctional counselling 0 0
Verbal warning 1 0.5
Written warning 1 0.5
Final written warning 1 0.5
Suspended without pay 0 0
Fine 0 0
Demotion 0 0
Dismissal 0 0
Not guilty 0 0
Case withdrawn 0 0
Total 3 1.5

Annual Report Page 92
HuMAN REsOuRcE MANAGEMENT
Table 3.10.3 Types of misconduct addressed at disciplinary hearings
Type of misconduct (based on annexure A) Number % of total
Late coming 1 0.5
Incitement into un-procedural conduct 1 0.5
Assault 1 0.5
Total 3 1.5
Table 3.10.4 Grievances lodged
Number % of Total
Number of grievances resolved 1 0.5
Number of grievances not resolved 0 0
Total number of grievances lodged 1 0.5
Table 3.10.5 Disputes lodged
Number % of Total
Number of disputes upheld 2 100
Number of disputes dismissed 0 0
Total number of disputes lodged 2 100
Table 3.10.6 Strike action
Total number of persons working days lost 0
Total cost of working days lost 0
Amount (R’000) recovered as a result of no work no pay 0
Table 3.10.7 Precautionary suspensions
Number of people suspended 0
Number of people whose suspension exceeded 30 days 0
Average number of days suspended 0
Cost (R’000) of suspension 0

Annual Report Page 93
HuMAN REsOuRcE MANAGEMENT
3.11 skills developmentTable 3.11.1 Training needs identified
Occupational category Gender
Number of employees
as at 1 April 2012
Training needs identified at start of the reporting period
Learnerships
Skills programmes & other short
courses
Other forms of training
Total
Legislators, senior officials and managers
Female 29 0 11 45 56
Male 40 0 7 38 45
ProfessionalsFemale 20 0 8 21 29
Male 12 0 6 12 18
Technicians and associate professionals
Female 10 0 10 14 24
Male 13 0 7 16 23
Clerks Female 31 0 43 36 79
Male 14 0 8 12 20
Service and sales workers
Female 0 0 0 0 0
Male 0 0 0 0 0
Skilled agriculture and fishery workers
Female 0 0 0 0 0
Male 0 0 0 0 0
Craft and related trades workers
Female 0 0 0 0 0
Male 0 0 3 6 9
Plant and machine operators and assemblers
Female 0 0 1 2 3
Male 0 0 0 0 0
Elementary occupations
Female 7 0 0 0 0
Male 9 0 0 0 0
Sub-totalFemale 0 0 0 0 0
Male 0 0 0 0 0
Total 185 0 104 202 306

Annual Report Page 94
HuMAN REsOuRcE MANAGEMENT
Table 3.11.2 Training provided for the period
Occupational category Gender
Number of employees as at 1 April
2012
Training provided within the reporting period
Learnerships
Skills programmes & other short
courses
Other forms of training
Total
Legislators, senior officials and managers
Female 29 0 25 11 36
Male 40 0 15 30 45
ProfessionalsFemale 20 0 6 11 17
Male 12 0 4 7 11
Technicians and associate professionals
Female 10 0 19 4 23
Male 13 0 7 1 8
Clerks Female 31 0 30 50 80
Male 14 0 15 35 50
Service and sales workers
Female 0 0 0 0 0
Male 0 0 0 0 0
Skilled agriculture and fishery workers
Female 0 0 0 0 0
Male 0 0 0 0 0
Craft and related trades workers
Female 0 0 0 0 0
Male 0 0 0 0 0
Plant and machine operators and assemblers
Female 0 0 0 0 0
Male 0 0 0 0 0
Elementary occupations
Female 7 0 10 3 13
Male 9 0 1 2 3
Sub-totalFemale 0 0 90 79 169
Male 0 0 42 75 117
Total 185 0 264 308 572

Annual Report Page 95
HuMAN REsOuRcE MANAGEMENT
3.12 Injury on dutyThe following table provides basic information on injuries on duty.
Table 3.12.1 Injury on duty
Nature of injury on duty Number % of total
Required basic medical attention only 3 100
Temporary total disablement 0 0
Permanent disablement 0 0
Fatal 0 0
Total 3 100
3.13 use of consultantsTable 3.13.1: Report on consultant appointments using appropriated funds
Project Title
Total number of
consultants that worked
on the project
Duration:work days
Contract value in
Rand
High-level retrospective review of the Pebble Bed Modular Reactor Project 5 60 660 361
Eskom’s Build Programme Practices 4 60 279 984
National Corridor Performance Measurement 5 264 5 220 631
Ports and Rail Freight Operational Benchmark Indicators 3 264 612 864
Freight Rail Reforms Phase II 3 264 604 913
SAA diagnostic study 5 150 1 674 098
DPE Transformation Dialogue 1 25 58 083
SOC learner profile 4 150 915 677
YEP strategy and action plan 3 100 318 060
Manual on Promotion of Access to Information Act 2 26 54 567
Remuneration standards 2 182 967 231
Corporate Governance Protocol 3 91 186 905
Role profiles and performance management auditing 1 120 34 536
Job evaluations 3 30 296 682
Skills audit 2 60 13 798
Employee survey 2 35 103 283
Independent performance assessment of the Department 1 10 103 270
Development and enhancement of Isibuko/Smartclient dashboard 3 160 1 208 302

Annual Report Page 96
HuMAN REsOuRcE MANAGEMENT
Project Title
Total number of
consultants that worked
on the project
Duration:work days
Contract value in
Rand
Developing a strategy for SAFCOL in terms of its future role within a developmental state and institutional form in the forestry industry
6 153 430 920
Audit of the Denel SAAB Indemnity Claim 5 14 390 365
Total 63 2218 14 134 530
Table 3.13.2: Analysis of consultant appointments using appropriated funds, in terms of historically disadvantaged individuals (HDIs)
Project title
Percentage ownership
by HDI groups
Percentage management
by HDI groups
Number of consultants
from HDI groups that worked on the project
Hig- level retrospective review of the Pebble Bed Modular Reactor Project 6.5 6.5 3
Eskom;sBuildProgrammePractices(AecomDavisLangdonSA (Pty) Ltd) 20 40.74 1
National Corridor Performance Measurement .05 .05 0
Ports and Rail Freight Operational Benchmark Indicators .05 .05 0
Freight Rail Reforms Phase II UNIVERSITY UNIVERSITY UNIVERSITY
SAA diagnostic study International company
International company 1
Space planning and project management 16 16 1
DPE Transformation Dialogue 100 100 1
SOC learner profile 100 100 3
YEP strategy and action plan 100 100 3
Manual on Promotion of Access to Information Act .05 .05 2
Remuneration standards 24.18 24.18 1
The Protocol 0 0 0
Role profiles and performance management auditing 100 100 1
Job evaluations 80 80 0
Skills audit 0 0 1
Employee survey 5 5 0
Independent performance assessment of the Department 0 0 0
Development and enhancement of Isibuko/Smartclient dashboard 40 4 0

Annual Report Page 97
HuMAN REsOuRcE MANAGEMENT
Project title
Percentage ownership
by HDI groups
Percentage management
by HDI groups
Number of consultants
from HDI groups that worked on the project
Developing and formulating a strategy for SAFCOL in terms of its future role within a developmental state and institutional form in the forestry industry
UNIVERSITY UNIVERSITY UNIVERSITY
Audit of the Denel SAAB Indemnity Claim .05 .05 2

Part e: FINANcIAL INFORMATIONANNuAL FINANcIAL sTATEMENTs FOR dEPARTMENT OF PubLIc ENTERPRIsEsFOR THE yEAR ENdEd 31 MARcH 2013
Annual Report Page 99
FINANcIAL INFORMATION
taBle of ContentsReport of the Audit Committee 100
Report of the Accounting Officer 102
Accounting Officers Statement of Responsibility for Annual Financial Statements 123
Report of the Auditor-General 124
Appropriation Statement 127
Notes to the Appropriation Statement 138
Statement of Financial Performance 140
Statement of Financial Position 141
Statement of Changes in Net Assets 142
Cash Flow Statement 143
Notes to the Annual Financial Statements (including Accounting policies) 144
Disclosures Notes to the Annual Financial Statements 162
Annexures 172

Annual Report Page 100
FINANcIAL INFORMATION
1. rePort of tHe auDIt CommIttee for tHe Year enDeD 31 marCH 2013
IntroductionWe are pleased to present our report for the financial year ended 31 March 2013.
membership and attendance:The Audit Committee consists of the members listed below. All the Audit Committee members are indepen-dent, which is in line with the industry corporate governance practice. During the year under review, the Audit committee held four (4) meetings as per approved terms of reference.
Name of Member Number of Meetings Attended
Zienzile Musamirapamwe (Chairperson) 4/4
Mattie Joubert 3/4
Jerry Sithole 4/4
audit Committee responsibilityThe Audit Committee do hereby reports that it has complied with its responsibilities arising from Section 38 (1) (a) (ii) of the Public Finance Management Act and Treasury Regulation 3.1.13. The Audit Committee also reports that it has adopted appropriate formal terms of reference as its Audit Committee Charter, has regulated its affairs in compliance with this charter and has discharged all its responsibilities as contained therein.
the effectiveness of Internal ControlThe review of the effectiveness of the system of internal control by the Audit Committee is informed by reports submitted by Internal Audit and Management, which are responsible for the development and maintenance of the internal control system. Internal Audit provides the Audit Committee and Management with assurance that the internal controls are adequate and effective and that key control deficiencies are adequately and timeously addressed. This is achieved through review and challenge of audit reports, management controls self-assessment (Auditor-General Dashboard), combined assurance reports which are submitted to the Audit Committee quarterly.
The strength of the control environment is further evidenced by the clean audit award from the Auditor-General received during 2011/2012 financial year. The Department has for eight years consistently achieved clean audits.
The Audit Committee approved the risk-based Internal Audit three year rolling plan and one year operational plan. Below are reviews which were completed, in line with the approved operational plan:
ReviewoftheDepartment’squarterlyperformanceassessmentreports;Trackingofmanagement’sactionplans;ReviewofinternalcontrolsandprocessesoverfinancialStatementsClosure;Reviewoftheadequacyandeffectivenessofcontrolsoverfinancialmanagementprocesses;Review of the accuracy, completeness and reliability of unaudited Annual Financial Statements and the annualreport;Reviewofsupplychainandassetmanagementprocesses;Reviewoftheadequacyandeffectivenessofcontrolsovershareholderoversightprocesses;InformationTechnologyGeneralControlsreview;Reviewofcontrolsoveradministrationofrecruitmentagencies;andAd-hoc management requests.

Annual Report Page 101
FINANcIAL INFORMATION
TheCommitteedoesnothavemajorconcernstoreport;allreportedcontrolweaknesses,withinthescopeoftheCommittee’s responsibility as outlined in the approved Charter, received proper attention. Control deficiencies are continuously being addressed by Management through detailed action plans, which are monitored by Internal Audit and the Audit Committee, for effective and timely implementation, through an issue tracking system. The Committee continued to monitor progress on the implementation plan for the internal risk management and compliance functions to ensure effective oversight of the Department’s risk profile.
In-Year management and monthly/Quarterly reportsThe department has been reporting monthly and quarterly to the Treasury as is required by the PFMA. The Audit Committee is satisfied with the content and quality of quarterly reports prepared and issued by the Accounting Officer of the Department during the year under review.
evaluation of financial statementsThe Committee has reviewed the annual financial statements prepared by the department.
auditor General’s reportThe Audit Committee has reviewed the Auditor General’s Report including the Management Report and we concur with the audit opinion expressed. All the control deficiencies in the Auditor General’s Report have been noted. A risk mitigation plan is being developed and all issues will be tracked by the Audit Committee through the issue tracking reporting process.
Ms Zienzile Musamirapamwe Chairperson: Audit CommitteeDepartment of Public Enterprises
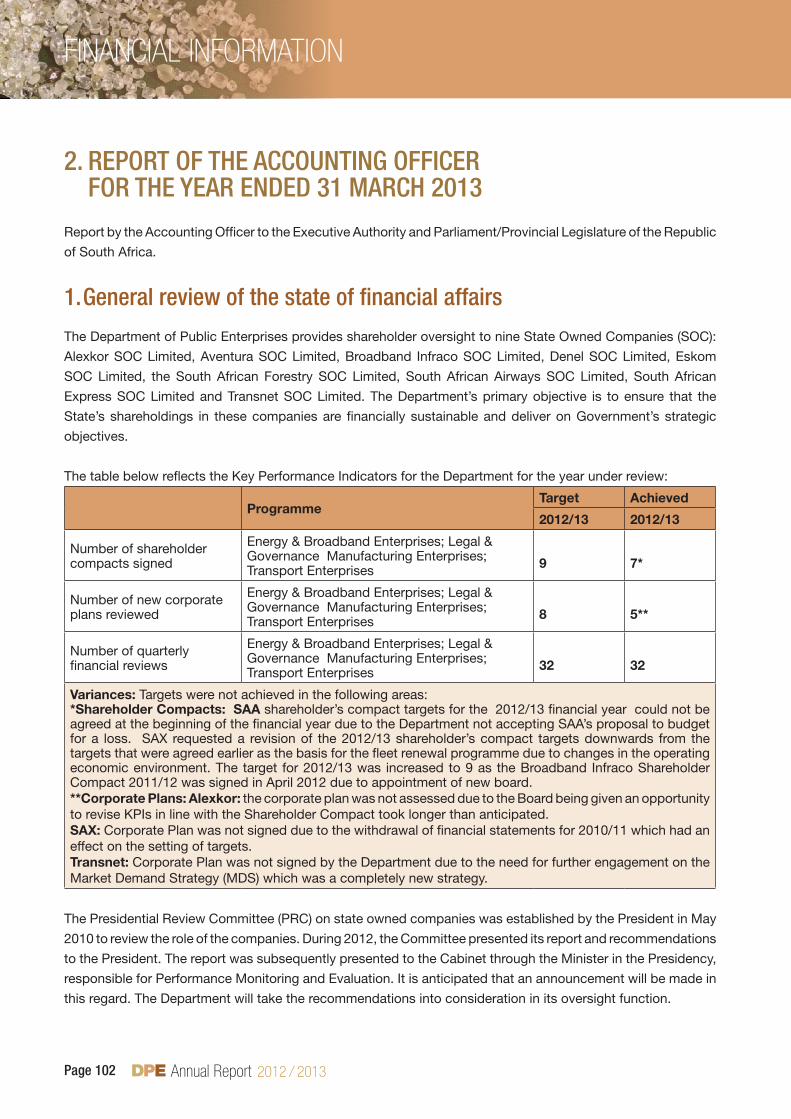
Annual Report Page 102
FINANcIAL INFORMATION
2. rePort of tHe aCCountInG offICer for tHe Year enDeD 31 marCH 2013
Report by the Accounting Officer to the Executive Authority and Parliament/Provincial Legislature of the Republic
of South Africa.
General review of the state of financial affairs1.
The Department of Public Enterprises provides shareholder oversight to nine State Owned Companies (SOC):
Alexkor SOC Limited, Aventura SOC Limited, Broadband Infraco SOC Limited, Denel SOC Limited, Eskom
SOC Limited, the South African Forestry SOC Limited, South African Airways SOC Limited, South African
Express SOC Limited and Transnet SOC Limited. The Department’s primary objective is to ensure that the
State’s shareholdings in these companies are financially sustainable and deliver on Government’s strategic
objectives.
The table below reflects the Key Performance Indicators for the Department for the year under review:
Programme Target Achieved
2012/13 2012/13
Number of shareholder compacts signed
Energy&BroadbandEnterprises;Legal&GovernanceManufacturingEnterprises;Transport Enterprises 9 7*
Number of new corporate plans reviewed
Energy&BroadbandEnterprises;Legal&GovernanceManufacturingEnterprises;Transport Enterprises 8 5**
Number of quarterly financial reviews
Energy&BroadbandEnterprises;Legal&GovernanceManufacturingEnterprises;Transport Enterprises 32 32
Variances: Targets were not achieved in the following areas: *Shareholder Compacts: SAA shareholder’s compact targets for the 2012/13 financial year could not be agreed at the beginning of the financial year due to the Department not accepting SAA’s proposal to budget for a loss. SAX requested a revision of the 2012/13 shareholder’s compact targets downwards from the targets that were agreed earlier as the basis for the fleet renewal programme due to changes in the operating economic environment. The target for 2012/13 was increased to 9 as the Broadband Infraco Shareholder Compact 2011/12 was signed in April 2012 due to appointment of new board. **Corporate Plans: Alexkor: the corporate plan was not assessed due to the Board being given an opportunity to revise KPIs in line with the Shareholder Compact took longer than anticipated. SAX: Corporate Plan was not signed due to the withdrawal of financial statements for 2010/11 which had an effect on the setting of targets. Transnet: Corporate Plan was not signed by the Department due to the need for further engagement on the Market Demand Strategy (MDS) which was a completely new strategy.
The Presidential Review Committee (PRC) on state owned companies was established by the President in May
2010 to review the role of the companies. During 2012, the Committee presented its report and recommendations
to the President. The report was subsequently presented to the Cabinet through the Minister in the Presidency,
responsible for Performance Monitoring and Evaluation. It is anticipated that an announcement will be made in
this regard. The Department will take the recommendations into consideration in its oversight function.
Annual Report Page 103
FINANcIAL INFORMATION
The launch of the National Development Plan in the 2012/13 financial year required the Department to assess
its strategic priorities and ensure their alignment to the overarching vision outlined in the Plan. In this regard,
the Department completed the alignment process which showed that the Departments objectives are aligned
to the National vision.
Further to the launch of the Presidential Infrastructure Coordination Commission and its governance structures
in 2011/12 financial year, the Department has worked with its SOC to develop the Business Plans for the
Strategic Integrated Projects (SIPs). The launch of the SIPs has increased the need for the Department to
improved its capacity to oversee large infrastructure projects.
significant events that have taken place and projects
undertaken during the year SOC Supplier Development Summit
The DPE held a Supplier Development, Localisation and Transformation Summit on 14 and 15 March 2013. This
was attended by Eskom and Transnet suppliers, customers and other key stakeholders. Eskom and Transnet
launched their next generation Supplier Development Plans and communicated those products and services that
have been prioritised for investment by industry in their supplier development, localisation and transformation
strategies as well as giving suppliers insight into how these products and services will be procured to realise
these objectives. The Summit also explored how the SOC and large companies (in sectors such as mining)
can collaborate around supplier development, localisation and transformation to create a consolidated and
sustained demand requirement against which national industry can invest and develop.
SOC Automotive Industry Competitiveness Forum
The automotive sector is one of the priority sectors in the Industrial Policy Action Plan. The sector forms the core
part of productive sectors in the economy. There are a range of challenges relating to economic infrastructure
provision which impacts the competitiveness of the sector. There is scope to improve the services provided
by SOC (Eskom and Transnet). Consequently, the Minister of Public Enterprises launched an SOC Automotive
Industry Competitiveness Forum on 20 September 2012 with three key objectives in mind:
To promote collaboration between SOC and the automotive industry to ensure that infrastructure capacity
and service delivery enhances competitiveness and to enable increased investment in both infrastructure
and in the cluster as a whole.
To send a clear signal to investors that SOC will be responsive to their needs within sensible commercial
constraints.
To enable the identification of priority automotive cluster infrastructure related projects that will be overseen
by the Minister of Public Enterprises.
The Forum is chaired by the DPE and has as its core members, the Departments’ of Public Enterprises and
Trade and Industry, Eskom, Transnet and the National Association of Automobile Manufacturers of South Africa
(NAAMSA) and its affiliates. The DPE is the facilitator of a partnership building process between the SOC and
the automotive industry as well as providing support for removing bottlenecks through mobilising broader
government resources.

Annual Report Page 104
FINANcIAL INFORMATION
Executive Leadership Programme
The DPE hosted the second Executive Leadership Programme in South Africa from 9 to 10 September 2012
with the theme “State Owned Companies and Industrial Policy in the Context of the Global Financial Crisis”.
stakeholder engagement
Provincial/ Stakeholder Engagements: Six provinces have been engaged (Gauteng, Northern Cape, Eastern Cape, North West, Free State and KwaZulu-
Natal) and the remaining three provinces will be engaged in the new financial year. Four of the six provinces
have set up teams led by the Deputy Minister to ensure alignment of economic plans of the SOC and Provinces
and in the new financial year projects will be announced.
SIP Provincial Engagements Stakeholder engagement for SIP2 to define the objectives, funding requirements and priority projects were
undertaken with business, provincial and local Governments as well as communities in Free State and KwaZulu
Natal. Gauteng will take place in June 2013. The stakeholder engagement for SIP1 will commence in June
2013.
Minister’s intervention to address industrial action at Medupi and KusileThe Minister intervened to address the industrial action which led to 10 weeks of no productivity at the Medupi
construction site. The intervention led to an agreement and commitment from all stakeholders to return to work
immediately and ensure stability on the site. The parties also agreed to review the agreement that governs the
employer and employee relations on site to address concerns that were raised.
Youth Development ProgrammeThree youth engagement platforms were held in partnership with provincial economic development departments
in Kwa-Zulu Natal, Free State and Eastern Cape between October and November 2012. SOC presented
their job-creation, skills development, procurement and CSI opportunities to young entrepreneurs, unemployed
graduates and unemployed and school-going youth.
Engagements were held with SOC to secure their support of the department’s youth programme. This included
consultation with Transnet, Denel and Eskom Foundation to understand their Corporate Social Investment and
its impact on youth.
Transformation Dialogue A Transformation Dialogue was convened on 11 October 2012, to provide a platform for a strategic discussion
with SOC and relevant stakeholders on the role of SOC towards socio-economic development, transformation
and the advancement of national objectives.
Climate Change Policy Framework The Climate Change Policy Framework for SOC was launched in June 2012 by the Minister and SOC symbolically
signed onto the United Nations Global Compact demonstrating leadership and commitment to sustainable
growth and development. The aim of the Climate Change Policy is to guide the SOC towards a transition to a
low carbon economy.
Annual Report Page 105
FINANcIAL INFORMATION
Launch of the Transnet Market Demand Strategy (MDS)The President of the Republic of South Africa, His Excellency Jacob G Zuma introduced the Market Demand
Strategy (MDS) in his State of the Nation address. The president emphasised the R300billion capital investment
programme as an essential component of the country’s growth and development strategy which must contribute
towards, job creation, skills development and industrialisation. In response to this call, the Department initiated
an analysis of what would be required to support the Planning and implementation of the MDS. Through its
oversight function the Department monitors the implementation of the strategy on a quarterly basis.
Facilitation of R5 billion SAA GuaranteeThe Department reviewed the financial requirements for SAA and consequently issued a R5 billion guarantee in
order for SAA to finalise the preparation and submission of the 2011/12 Annual Financial Statements as a going
concern as well as assist SAA with working capital requirements.
Shareholder Management Guarantee and share office guidelines were developed, outlining a framework for issuing government guarantees,
adequate monitoring and reporting on government guarantees, shareholder agreements, shareholder loans and
share subscriptions, and provision of administrative practices for effective management of these instruments.
In November 2012 the Cabinet considered the new SOC Remuneration and Incentive Standards for Non-
Executive Directors, Executive Directors and Prescribed Officers. This was followed by consultations with national
government departments to ensure that the Standards are able to address many of the challenges encountered
in the current model. To this end, the views and concerns expressed have been taken into consideration and the
Department is in the process of finalising the revised Remuneration Standards to Cabinet for approval. The new
Standards will require increased accountability and transparency in respect of remuneration and incentives.
Since the coming into effect of the Companies Act, 71 of 2008 in May 2011, the Department has developed
a framework for the Memorandum of Incorporation (MOI) of each SOC. The MOI, previously known as the
Memorandum and Articles of Association has been harmonised with the Companies Act and the various tools
and frameworks of the Department to enhance shareholder management and oversight of the SOCs.
Diabo Share TrustAs at 4 June 2012, the Department was left with approximately 5847 beneficiaries of the Diabo Share Trust
to pay out. As at 5 March 2013 when the contract with the Service Provider expired, 1000 of the 5847 had
been paid out. The Department has extended the contract with the Service Provider for up to three months
to pay the remaining beneficiaries. The notice to wind up the trust will be advertised nationwide to inform the
beneficiaries.
AventuraThe liquidator for Aventura has been appointed by the Master of the High Court and, Aventura is currently
placed under liquidation. Once the liquidation is finalized, the Department will proceed to repeal the Overvaal
Resorts Act of 1993, which is the legislation through which Aventura was established.

Annual Report Page 106
FINANcIAL INFORMATION
Eskom In order to ensure Eskom’s long term financial sustainability, the Department supported Eskom with its Multi
Year Price Determination (MYPD3) which determines Eskom’s revenue for the next five years.
The Department continues to monitor and support Eskom which has so far succeeded in managing the national
supply/demand ensuring that the lights are kept on, including during the African Cup of Nations hosted in 2013.
The Department granted approval for Eskom to enter into power purchase agreements with 28 Renewable
Energy Independent Power Producers (IPPs) which will generate a combined 1 415.5 MW and the Department
of Energy Peaker Project which will add another 1000 MW once operational.
Broadband Infraco As part of the effort to make government a key tenant on the infrastructure of Broadband Infraco, the Department
assisted Broadband Infraco to engage with key government departments and SOC for potential collaboration.
After an open tendering process, Broadband Infraco was awarded tender by the State Information Technology
Agency (SITA) to directly provide services eliminating intermediaries which will ensure overall reduction of the
broadband costs to the State. The Department oversaw timely commissioning of the West African Cable System
(WACS) which will enhance international connectivity linking Africa with Europe through the United Kingdom.
In order to align the shareholder objectives with policy and regulatory objectives, the Department made
extensive input on the draft Broadband Policy which is currently being developed by the Department of
Communications.
The Department has continued to support the Broadband Infraco to implement a revenue diversification initiative
to address the current losses.
Alexkor The Department continued to monitor and oversee the execution of the activities linked to the Deed of Settlement
(DOS). Amongst these were:
upgrade of Alexander Bay. The infrastructure upgrade was completed in March 2013 and the warranty •
period, which provides for repairing of defects identified, runs for twelve (12) months.
capacitation of the Pooling and Sharing Joint Venture. Alexkor’s core focus going forward is to ensure the •
Pooling and Sharing Joint Venture (PSJV), which is a joint venture with the Richtersveld Mining Corporation
(RMC) is brought to a sustainable carat production level.
facilitation for transfer of residential properties to the Richtersveld Community, which is planned for Quarter •
2 of 2013/14.
In the current reporting period, the Department submitted a request for R350 million to National Treasury which
was approved, to address the following obligations and liabilities: an environmental rehabilitation liability at
Alexander Bay; the Richtersveld Property Holding Company to secure Alexkor’s right of occupation of the
transferredresidentialpropertiesforaperiodoften(10)years;andpost-retirementmedicalaidliability.
Denel The Department monitored and had oversight of the development and Cabinet approval of the turnaround
plan for the SOC. The turnaround plan implementation has improved financial performance of the company in
the past two financial years. The current projection is that the positive trend will be maintained going forward.
Annual Report Page 107
FINANcIAL INFORMATION
In addition, as a result of the R700 million recapitalisation allocated in 2012/13 the company anticipates
improvement in its gearing ratio.
The Department has directed the SOC to improve investment in technology development or research and
development (R&D), in order to ensure sustainable product portfolio going into the future. The expenditure will
further enable Denel to attract bright young minds, which is critical to the sustainability of the business, as the
core technical expertise is ageing due to lack of investment in talent development.
SAFCOL The Department finalised the new role for the SOC which is due to be presented to Cabinet during Quarter 1 of
2013/14. In order to enable execution of the new role, the Board of Directors of the SOC has been augmented
with requisite skills to enable effective oversight. The SOC will be positioned to be an agent for rural economic
development in the Limpopo, Mpumalanga and Northern Kwazulu Natal regions where it has its operations.
The Department continued to engage the Department of Rural Development and Land Reform (DRDLR) to
ensure the resolution of land claims on SAFCOL land (61% of the forestry plantations are subject to land claims)
which is hampering the long-term planning of the SOC. In the interim SAFCOL is positioning itself as a preferred
development partner for claimant communities. Forestry needs to be promoted with the communities to ensure
the land is not lost to other forms of agriculture, as sawlogs security of supply to aid economic development is
critical for the regions and the country.
In addition, the Department continued to engage with DRDLR with respect to the transfer from SAFCOL of minority
shareholdings. DRDLR remains the destination of the shareholding and the capacitation of the Department to
warehouse the shares is expected to be concluded during 2013/14 financial year. Furthermore, the Department
has engaged with other stakeholders to ensure that an interim solution is found, as the shareholding is proving
to be a liability for SAFCOL.
Transnet The Department’s oversight responsibilities intensified as Transnet ramped up its capital expansion programme
from R110 billion to R301 billion through the introduction of the Market Demand Strategy (MDS). In line with
Government objectives, the MDS planned capital programme presents Transnet with opportunities to drive job
creation, localisation, skills development and economic transformation in our country.
The Department has completed the roll out of the National Corridor Performance Measurement (NCPM) project,
100% system acceptance was achieved and stakeholders will have access to the system in 2013/14.
The Department had further engagements with Transnet on the enhanced model for the concessioning of the
three identified branch lines and it has been agreed that each branch line will be assessed on a case by case
basis. It is expected that the Section 54 approval process in terms of the PFMA Section 54 will be undertaken
during the 2013/14 financial year to expedite the concessioning.

Annual Report Page 108
FINANcIAL INFORMATION
South African Airways The Department was instrumental in setting out the parameters for the development of SAA’s Long Term
Turnaround Strategy based on the diagnostic review conducted by the Department in August 2012, to establish
the root causes of SAA’s inability to operate on a sustainable basis, as the Company is currently making a loss.
This was submitted to the Minister on 2 April 2013. The strategy is currently being reviewed by the Department
in consultation with other stakeholders.
South African Express Airways The Department moved swiftly to address the deficiencies in corporate governance within the SOC. This
included the removal of the Board and appointment of the new board as well as requesting the Auditor General
to take over the audit function for this entity. The audit of the 2011/12 Annual Financial Statements is expected
to be completed by 31 May 2013.
Cross Cutting initiatives The Department conducted a parliamentary learning programme for the Portfolio Committee on Public
Enterprises in September 2012.
Litigation
Nabera v Government of RSA & AlexkorNabera instituted legal action against Alexkor and the National Government in 2004 for alleged amounts resultant
from a contract in terms of which Nabera managed Alexkor’s mining assets and operations for a period of two
years 1999 - 2001. Claims were instituted by Nabera, namely a claim for management fees alleged to be due in
terms of the contract, as well as alleged value added to the mining assets over the management period. Alexkor
and the National Government opposed the claims and to date Nabera has not set the matter down for hearing.
Therefore, the matter is still pending.
Aventura and the State v Mikanto PropertiesMikanto Properties launched application proceedings in the High Court of South Africa in October 2002 seeking
to interdict Aventura from effecting transfer of eight (8) properties to Forever Resorts. The Department and
Aventura lodged opposing affidavits. Mikanto did not take the matter any further more so that Mikanto’s attorney
of record withdrew.
Paharpur/Londoloza Consortium v SAFCOL and the Department.This is a claim that arose in March 2009 for damages against Government and SAFCOL by the Consortium for
out-of-pocket expenses in the preparation of the tender which was subsequently withdrawn by Government.
The parties are in discussion for an out of court settlement.
Equity Alliance (Pty) Ltd vs Government of RSAThis is a claim that was instituted in April 2009 by Equity Alliance against the Government for the purchase
of shares from Transnet in June 2002. The claim is based on an alleged oral assurance and guarantee given
by the former officials of the Department stating that, the ramp handling agreement between Equity Alliance
and the Airports Company of South Africa (ACSA) will on termination be extended. ACSA did not extend the
agreement and consequently, Equity Alliance and the Serco Group instituted a legal action claiming to have

Annual Report Page 109
FINANcIAL INFORMATION
suffered damages as a result of the termination of the ramp handling agreement. Pleadings have closed and
Equity Alliance is currently trying to set the matter down.
Sable Hills vs Aventura and the Minister of Public EnterprisesSable Hills (Pty) Ltd instituted action against Aventura, Mikanto (Mzingiza) Trading and the Minister. Summons
were received on 28 June 2011.The claim is for rectification of the sale agreement and transfer of properties
allegedly sold by Government and Aventura to Sable Hills in 2002 but later transferred to Mikanto (Mzingiza.)
The relief that Sable Hills seeks is that Mikanto (Msingiza), the Minister and Aventura should be ordered to
transfer the properties claimed to Sable Hills. The matter is still pending.
Comair vs SAAComair has brought an application against SAA, Ministers of Public Enterprises, Finance, Transport and
Government of South Africa challenging the granting of the R5 billion Guarantee issued by Government on
behalf of SAA. Comair is contending that the granting of such Guarantee was both unconstitutional and unlawful
and should therefore be reviewed and set aside. Government and SAA are opposing the matter.
Thompson vs Transnet, Transnet Pension Funds, National Treasury,
Public Enterprises and othersMr Thompson a former employee of Transnet, has brought an application on the inadequacy of pension
benefits received from the Transnet Pension Funds. Transnet, the Transnet Pension Funds and Government
are opposing the matter.
Ronny Mohapi vs Public Enterprises, Trade and Industry and National TreasuryMr Mohapi approached the equality court to complain that Government (represented by Public Enterprises,
Trade and Industry and National Treasury) discriminated against him in his endeavour to join Government’s
internship programme. He sought to be placed on internship programme of either National Treasury, Trade and
Industry alternatively compensation by Public Enterprises for an amount of R800 000.00. The Department has
filed an opposing affidavit with the Equality Court in the matter.
Vuyisile Kona vs Public Enterprises, SAA and Trade and IndustryMr Kona is a former Non-Executive Director and Chairperson of SAA whose services were terminated in February
2013. Mr Kona is challenging the validity of the termination of his services and he seeks that the decision should
be reviewed and set aside. The Department is opposing the matter.
Messrs Pretorius and Kruger vs Transnet, Transnet Pension Funds, Ministers of Public
Enterprises and Finance and Government of RSAMessrs Pretorius and Kruger, pensioners of the Transnet Pension Funds have served the Department with
court papers, regarding their intention to bring class action against Transnet Pension Funds. The applicants are
contesting the adequacy of benefits received by pensioners from the Transnet Pension Funds. They attribute
the alleged inadequacy to mismanagement of such Pension Funds by Transnet, Transnet Pension Funds and
Government. The Department is opposing the matter.

Annual Report Page 110
FINANcIAL INFORMATION
Mr Vermooten vs Public EnterprisesMr Vermooten, a former consultant to the Department engaged on contractual basis instituted proceedings
against the Department in the GPSSBC in 2011 claiming unfair dismissal when his contract expired and was
not renewed. The Department contended that Mr Vermooten was not an employee of the Department and could
not claim unfair dismissal. The GPSSBC found in favour of Mr Vermooten on the issue and the Department took
it on review with the labour court. Mr Vermooten is not pursuing the matter any further.
By Choice Catering CC v Department of Public EnterprisesPlaintiff claims damages against the Department of R119 574.60 for alleged breach of contract alternatively,
R75 245.70 for alleged loss of profit on the 18 November 2009. The Department is defending the matter.
An assessment was carried out to identify contingent liabilities that could arise out of the above litigation. Refer
to Annexure 3B of the Annexures to the Annual Financial Statements.
spending trends
Departmental Revenue and Expenditure
Collection of Departmental revenue Revenue collection is not a core function of the Department and therefore there is no specific plan in place in this regard. However, any revenue collected by the Department, and reported under Note 2 of the Financial Statements, is of an incidental nature such as parking fees, interest received on debts, sale of redundant capital assets and interest on bank accounts. Capital assets such as computers are initially offered to schools, and in the event that they are not required are auctioned to staff.
expenditure per Department and Programme The Department of Public Enterprises’ voted budget for 2012/13 amounted to R1.377 billion, which was al-located to the following Programmes
Programme 1: Administration•Programme 2: Legal and Governance•Programme 3: Portfolio Management and Strategic Partnerships •
The following table provides a summary of actual expenditure incurred vs budget appropriated per programme
for the 2012/3 and 2011/12 financial years:
Programme
2012/13 2011/2012
Final Appropriation
R’000
ActualExpenditure
R’000
Expenditure as % of final appropriation
Final Appropriation
R’000
ActualExpenditure
R’000
1: Administration 117 096 115 367 98.5% 110 181 108 635
2. Legal and Governance 24 237 23 477 96.9% 22 779 19 518
3: Portfolio Management
Strategic Partnerships
1 235 425 1 228 205 99.4% 220 382 217 962
Total 1 376 758 1 367 049 99.3% 353 342 346 115

Annual Report Page 111
FINANcIAL INFORMATION
The increase of R1.023 billion in the annual appropriation from R353.342 million to R1.377 billion is mainly as a result of an increase in payments for financial assets and a transfer payment to State Owned Companies.
Underspending amounting to R9.7 million was recorded in the 2012/13 financial year. This amount is mainly made up of current expenditure in the operational budget was under Compensation of Employees amounting to R6 million (5.36% of budget) as a result of some posts not having been filled due to scarcity of specialist skills in the market, as well as Goods and Services amounting to R3.7 million (3.91% of budget) which arose due to some projects having been delayed due to capacity constraints. The Department has requested rollovers from the 2012/13 Goods and Services budget from National Treasury for three projects amounting to R1.8 million in order for them to be completed in the new financial year. The Department spent 99.3% of its budget which was within its 2% spending target.
Programme 1: Administration: Provides overarching management and key supporting functions and
processes in order for the Department to achieve its strategic objectives. The programme consists of the
Ministry, Management (Office of the Director-General and the Deputy Director-General Corporate Management),
Corporate Services (Information Management and Technology and Security and Facilities Management),
Human Resources, Communications, Office of the Chief Financial Officer, Intergovernmental and International
Relations, Strategic Planning Monitoring and Evaluation, Internal Audit and Office Accommodation.
Expenditure in this programme amounted to R115.367 million in 2012/13 compared to R108.635 million in
2011/12. This increase is mainly due to the establishment of two additional sub-programmes, Strategic Planning,
Monitoring and Evaluation and Intergovernmental and International Relations as well as, among others, audit
fees, office accommodation, alterations to office premises as well as furniture and equipment to accommodate
the increased staff complement and travel costs for provincial engagements.
Programme 2: Legal and Governance: Provides systems that align state owned enterprises with
corporate governance best practice and Government’s strategic intent.
Expenditure for the programme amounted to R23.477 million in 2012/13 compared to R19.518 million in 2011/12.
This increase is mainly due to the strengthening of the Governance unit in respect of the Risk and Compliance
components in this sub-programme. However this unit did not achieve the 2 per cent underspending target due
to a number of projects been delayed.
Programme 3: Portfolio Management and Strategic Partnerships: Expenditure for the programme amounted to R1.228 billion in 2012/13 compared to R217.962 million in 2011/12.
This increase is mainly due to the payment for financial assets disbursed to Alexkor and Denel amounting to
R1.050 billion, as well as an amount of R118.313 million to Denel in respect of an indemnity claim to Denel/
SAAB Aerostructures.
A breakdown of expenditure per sub-programme is provided below.
Sub-Programme: Energy and Broadband Enterprises: Aligns the corporate strategies and
performance of Eskom, Pebble Bed Modular Reactor (PBMR) and Broadband Infraco with Government’s
strategic intent and performance targets.
Expenditure in this programme amounted to R13.944 million in 2012/13 compared to R56.488 million in
2011/12. The decrease in expenditure in this sub-programme is mainly due to the final transfer payment to

Annual Report Page 112
FINANcIAL INFORMATION
the Pebble Bed Modular Reactor (PBMR) in 2011/12 amounting to R40 million for the statutory dismantling,
decommissioning and care and maintenance programme, as well as the transfer of the legal component from
this unit to Programme 2: Legal and Governance.
Sub-Programme: Manufacturing Enterprises: Aligns the corporate strategies and performance of
Denel, SAFCOL and Alexkor with Government’s strategic intent and performance targets. It develops proposals
for the State Owned Companies role in advanced manufacturing.
Expenditure for the sub-programme amounted to R1.178 billion in 2012/13 compared to R123.423 million in
2011/12. The increase in expenditure in this sub-programme is mainly due to the payment for financial assets
disbursed to Alexkor and Denel amounting to R1.050 billion, as well as an amount of R118.313 million to Denel
in respect of an indemnity claim to Denel/SAAB Aerostructures.
Sub-Programme: Transport Enterprises: Aligns the corporate strategies and performance of South
African Airways (SAA), South African Express (SAX) and Transnet with Government’s strategic intent and
performance targets.
Expenditure for the sub-programme amounted to R20.030 million in 2012/13 compared to R18.752 million
in 2011/12. The slight increase in expenditure in this sub-programme is attributed to normal inflation related
increases.
Sub-Programme: Economic Impact and Policy Alignment: aligns Shareholder oversight of SOC
in relation to overarching government economic, social and environmental policies, and implements strategic
interventions to contribute towards achievement of national objectives in support of economic growth and
transformation.
Expenditure for the sub-programme amounted to R9.990 million in 2012/13 compared to R11.744 million in
2011/12. The decrease in expenditure in this sub-programme is mainly due to the conversion of the sub-
programme in 2012/13 from the former Joint Project Facility which was project based, the programme is now
structured according to the functions it is designed to carry out.
Sub-Programme: Strategic Partnerships: Establishes and builds focused strategic partnerships
between the state owned companies, strategic customers, suppliers and financial institutions.
Expenditure for the sub-programme amounted to R5.973 million in 2012/13 compared to R7.555 million in
2011/12. The sub-programme was established in the 2012/13 financial year. The decrease in expenditure is due
to historical figures drawn from the Office of the Chief Investment Portfolio Management (CIPM) in Programme
1 where a number of functions were allocated to this unit. In 2011/12 over expenditure is reflected against these
historical figures due to the fact that the CIPM was a sub-sub-programme in the sub programme: management
in programme 1 and the overall expenditure in that sub programme was not compromised.

Annual Report Page 113
FINANcIAL INFORMATION
Virements per programme
ProgrammeAdjusted
AppropriationR’000
VirementsR’000
Final Appropriation
R’000
Actual Expenditure
R’000
VarianceR’000
1: Administration 108 546 8 550 117 096 115 367 1 729
2. Legal and Governance 26 237 (2 000) 24 237 23 477 760
3: Portfolio Management Strategic Partnerships 1 241 975 (6 550) 1 235 425 1 228 205 7 220
Total 1 376 758 - 1 376 758 1 367 049 9 709
Financial implications
Per Programme
R8 550 200 has been • addedtoProgramme1Administration;
R2 000 000 has been • deducted fromProgramme2LegalandGovernance;and
R6 550 200 has been • deducted from Programme 3 Portfolio Management and Strategic
Partnerships.
Economic classification R159500hasbeendeductedfromCompensationofEmployees;•
R159500hasbeenaddedtoTransferPayments;•
R688700hasbeendeductedfromGoodsandServices;•
R680700hasbeenaddedtoCapitalAssets;•
R8000 has been added to Financial Assets and Liabilities.•
The virements between the programmes (main divisions of the Vote) were necessary to accommodate additional
expenditure in Programme 1 mainly due to the establishment of two additional sub-programmes, Strategic
Planning, Monitoring and Evaluation and Intergovernmental and International Relations as well as, among
others, audit fees, office accommodation, alterations to office premises as well as furniture and equipment to
accommodate the increased staff complement and travel costs for provincial engagements.
The virements do not exceed 8% as specified in section 43 (2) of the PFMA.
The virements were approved by the Accounting Officer.
services rendered by the Department2.
2.1 The nature of the Department is such that no specific services are rendered.
2.2 Tariff policyThe Department does not render services for which a tariff can be charged.
2.3 Free ServicesThe Department does not render any free services.

Annual Report Page 114
FINANcIAL INFORMATION
2.4 Inventories This is disclosed under Annexure 6 of the Annual Financial Statements.
Capacity constraints3.
In the 2011/12 financial year, the Department conducted an organisational review which intended to ensure that
the Department was appropriately structured and capacitated to deliver on its Strategic Plan and meaningfully
contribute to the achievement of outcomes. The outcomes of the review, which included the re-organisation
of existing units and creation of new units was implemented in the year under review. As a result of this, the
Department has expanded the number of posts in its establishment which provides the required capacity in
order for the Department to deliver on its mandate. The establishment will increase to 220 in 2013/14 and
further increase to 227 posts for the outer years of the MTEF.
The Department is still challenged by the high turnover of its critical and core staff as a result of highly competitive
remuneration packages offered by the private sector and the SOC. Advanced strategies on the attraction and
retention of critical talents are currently explored including, considering a new model, which will reposition and
enable the Department to effectively fulfil the oversight role in line with best practices.
The Department continues to create a talent pool for its critical and scarce skills by means of its Graduate
Development and Internship Programmes, as well as the training and development of existing employees at
middle management and lower levels.
utilisation of donor funds4. The Department did not make use of any donor funding.
trading entities and public entities5.
This is reported in the main body of the Annual Report under the overview of the Portfolio of Entities reporting
to the Minister. Financial information, which includes profits and losses, is reported under Annexures 2A and
2B of the Annual Financial Statements. Guarantees are reported under Annexure 3A of the Annual Financial
Statements.
organisations to whom payments for financial assets and 6. transfer payments have been made
Entity Total Budget
R’000Expenditure
R’000
Remaining BudgetR’000
% of Total Budget Used
Alexkor (payment for financial assets) 350 000 350 000 - 100
Denel (payment for financial assets) 700 000 700 000 - 100
Denel (indemnity claim) 118 313 118 313 - 100

Annual Report Page 115
FINANcIAL INFORMATION
The transfer to Denel amounting to R118 312 954 in respect of Denel’s indemnity claim was disbursed in •
November 2012. Refer Annexure 1A of the Annual Financial Statements.
The payment for financial assets (transfer) to Denel amounting to R700 million was disbursed in two tranches, •
R400 million in December 2012 and the remaining R300 million in March 2013.
The payment for financial assets (transfer) to Alexkor amounting R350 million was disbursed in December •
2012.
Refer Note 6 of the Annual Financial Statements – Payments for Financial Assets.
The Department does not exercise control over accounting arrangements in respect of the SOC within its
portfolio save and except for the approval of the appointment of external auditors.
Public private partnerships (PPP)7.
The Department did not enter into any Public Private Partnership agreements during the 2012/13 financial
year.
Corporate Governance arrangements8.
Risk Management approach The Department continued its implementation of an integrated system of risk management in accordance
with its Enterprise Risk Management (ERM) Framework to enable it to effectively manage key risks that could
prevent it from achieving its objectives. The Department’s EXCO, chaired by the Director-General, fulfilled the
role of the Risk Management Committee and was supported by the Audit Committee in effectively overseeing
the management of key risks.
The ERM Framework, the Risk Management Strategy, Policy and Compliance Policy were reviewed and
approved. The Department’s legislative universe has been established and is being monitored on an ongoing
basis, thereby ensuring compliance to relevant legislation, policies and regulations. Business unit risks were
assessed and a register for each unit is maintained. In addition, shareholder risks were identified, monitored
and mitigated on an ongoing basis. The Department continued to conduct assessments on SOC PFMA
applications, quarterly reports and corporate plans in order to identify and mitigate risks that government is
exposed to as a result of activities undertaken by the SOC. EXCO is satisfied that the Department maintained
an effective, efficient and transparent system of risk management that is consistent with the requirements of the
PFMA and the Public Sector Risk Management Maturity Model as issued by the National Treasury.
Fraud Prevention Initiatives The Department’s fraud and prevention plan (integrated fraud and anti-corruption strategy) was reviewed in the
financial year under review. Approval and implementation of the reviewed policy will take effect in the 2013/14
financial year.
Internal audit is the custodian of the whistle-blowing policy and is also responsible for the administration of
the internal confidentiality reporting box. Internal Audit in consultation with the Accounting Officer oversees
resolutions of all whistle-blowing cases.
Annual Report Page 116
FINANcIAL INFORMATION
All cases reported through the confidential reporting box, in the current financial year, have been effectively
resolved. Internal Audit also reports on whistle blow logs and the resolution thereof, every quarter to the Audit
Committee.
During the year under review, the Department did not receive cases from the fraud and anti-corruption hotline
and there has not been any forensic investigation.
Internal Audit, Audit Committee and Internal controls
Internal AuditThe Department has an Internal Audit Unit, which reports administratively to the Accounting Officer and
functionally to the Audit Committee. The Internal Audit unit consists of a Chief Audit Executive, Audit Manager
and a co-sourcing arrangement with a registered firm accountants and auditors. The strategic objective of the
unit is to provide an objective assurance to the Management and Audit Committee that internal controls, risk
management and governance processes are adequate and effective. Internal Audit also provides consulting
services to the Department as and when necessary.
During the year under review the Internal Audit unit executed its risk based operational plan and issued
reports to Management with recommendations to address identified weaknesses. The unit has also tracked
implementation of management actions quarterly and reported results to the Executive Committee and the
Audit Committee.
A concerted effort was made to ensure proper co-ordination of work with other assurance providers. This was
achieved by the ensuring that quarterly reporting on combined assurance is adequate and effective and also
managing the Internal Control Dashboard. Reporting on both the combined assurance and the implementation
of management commitments on the Internal Control dashboard was done quarterly to Audit Committee after
rigorously engaging with Management.
Audit Committee The Audit Committee complies with its responsibilities arising from Section 38 (1) (a) (ii) of the Public Finance
Management Act and Treasury Regulation 3.1.13. The Audit Committee adopted appropriate formal terms
of reference as its Audit Committee Charter and has regulated its affairs in compliance with this charter and
discharged all its responsibilities as contained therein. All the Audit Committee members are independent,
including the Chairperson.
Internal controls and In-year Management and Monthly/Quarterly Reporting are reported in the Audit Report.
Requirements listed in S38 and 40 of the Public Finance Management Act
as well as principle 2.17 of the King III report. The Accounting Officer of the Department has complied with all the applicable requirements listed in Sections
38 and 40 of the PFMA which is indicative by the Department having received 9 consecutive clean audits,
as well as applying the general principles in clauses 51 to 60 of principle 2.17 of the King III Report (where
applicable in the public sector).

Annual Report Page 117
FINANcIAL INFORMATION
Information ManagementThe Department commenced with the development of an IT Governance Framework in 2012/13, however,
completion of the framework was delayed as DPSA issued a national ICT Governance Framework to be
implemented by all departments. Accordingly, the Department’s Framework will be finalised in 2013/14 financial
year.
Other Governance StructuresThe Department has the following internal governance structures which meet fortnightly, monthly or quarterly
depending on the Committees terms of reference:
Strategic Management Committee, chaired by the Minister•
Executive Committee (institutional and strategic) chaired by the Director-General•
Operations Committee, chaired by the Chief Financial Officer •
Operations Sub-Committee, chaired by the Director: Administration and Facilities•
Human Resources Development Committee, chaired by the Head: Human Resources•
Bid Adjudication Committee, chaired by Director: Legal Counsel•
Budget Committee, chaired by the Director: Financial Management•
All members of the above committees, with the exception of the Human Resources Development Committee
and the Budget Committee, are required to declare their interests prior to proceeding with the meeting agenda.
In the event of any conflict being identified, the member will be excused for the relevant part of the meeting or
the entire meeting whichever is applicable, depending on the nature of the issue being discussed.
These committees meet on a regular basis throughout the year which deal with the Department’s internal
governance, strategic and operational matters, e.g. policies, budget, supply chain management and compliance
issues.
In addition the Department has established the following fora with the SOC:
Chairpersons’ Forum (including CEOs)•
Governance and Risk Forum •
Isibuko Dashboard user Forum•
These fora meet on a regular basis throughout the year for strategic and operational oversight of SOC governance
and performance.
The Department operates within an approved delegation of authority framework. All SMS members are required
on an annual basis to declare and complete their financial disclosure forms for reporting to the DPSA. The
Department has extended the requirement for declaration of interests to all employees below SMS level as a
governance mechanism to allow for management of all potential conflicts of interests among public servants.
All employees are required to sign confidentiality agreements and are vetted for security clearance by the State
Security Agency.

Annual Report Page 118
FINANcIAL INFORMATION
Occupational Health and Safety The Department is committed to the health and safety of its employees and the public. The approved
Occupational Health and Safety (OHS) policy is currently under implementation.
The Department embarked on the following initiatives in 2012/13 to enhance the overall health, safety and
environmental issues facing the organization:
A joint Security & OHS Committee with newly approved terms of reference has been established.•
Members of the Committee have been formally appointed and were issued with appointment letters.•
Training on Health & Safety compliance has been provided.•
Safety equipment has been procured.•
Emergency Evacuation drills have been conducted.•
Health & Safety inspections are conducted on an ongoing basis.•
All new employees are inducted on departmental Health & Safety matters including Emergency Evacuation •
Procedures.
activities to be discontinued9. None
new activities10. Two new sub-programmes were established in Programme 1 in 2012/13 namely:
Strategic Planning Monitoring and Evaluation The Department identified the need to establish a unit dedicated to the facilitation and management of the
strategic planning process and the annual performance plan based on the requirements of the Framework for
Strategic Plan and Annual Performance Plans from National Treasury, as this process evolved and reporting
requirements intensified. The unit is responsible for coordination, management and oversight of outcomes
basedperformance reportingof thedepartment; implementationofperformancemonitoringandevaluation
processes for individual programmes and business units as a mechanism for measuring delivery of our strategic
objectives;andreportingtovariousstakeholders.
Intergovernmental and International Relations: This unit was established to improve engagement between the Department and its stakeholders in particular
provincial governments. It is responsible for coordination, support and provision of advice to the Minister, Deputy
Minister, Director-General and the department on matters related to the Inter-Governmental, International and
Stakeholder Relations.
The funding for these activities were re-aligned within the budget of the revised establishment.
In the 2013/14 financial year, Human Resources will facilitate training and awareness on the Government code
of conduct and integrity management framework, which will address incidents of corruption, management of
conflict of interest, public servants undertaking additional employment and receiving remuneration without prior
approval and public servants doing business with the State.
Annual Report Page 119
FINANcIAL INFORMATION
asset management 11.
The Department conducted two full asset counts, one of which was conducted by independent officials, •
during the period under review.
All assets are captured on LOGIS on a personnel inventory basis to ensure control of assets.•
All assets in the department are purchased and accounted for on LOGIS.•
The department has complied with the Asset Management Reform milestones.•
Capital Assets: During the year under review the Department disposed of unserviceable and redundant assets as well as •
writing off thefts and losses (R125 941.16) at original cost value as per the asset register amounting to R621
930.96. Refer notes 29.2 and 29.5 respectively to the Annual Financial Statements for disposals of Capital
Assets.
Minor Assets: During the year under review the Department disposed of unserviceable and redundant assets as well as •
writing off thefts and losses (R4 131.07) at original cost value as per the asset register amounting to R73
087. Refer note 29.4 to the Annual Financial Statements for disposals of Minor Assets.
Inventories12.
The department has one store that consists mainly of stationery. The inventories on hand as at 31 March 2013
are valued at the weighted cost price amounting to R23 012.94.
During the year under review the department continued to implement its strategy of procuring consumables
and stationery on a needs basis. The amount reflected at year end has decreased relative to the previous year’s
closing balance of R33 920.33 due to the distribution to units on receipt of stationery and consumables. Refer
Annexure 6 of the Annual Financial Statements.
events after the reporting date 13.
The Department incurred Fruitless Expenditure amounting to R55 863.81 in respect of cancellation fees for
a venue that was booked for a Senior Officials Dialogue Forum on SOC which was to have been hosted by
the Department on 25 March 2013 preceding the BRICS Summit on 26 and 27 March 2013. The event was
cancelled based on a directive from the Department of International Relations and Co-operation. Refer note 28
of the Annual Financial Statements
Annual Report Page 120
FINANcIAL INFORMATION
Information on predetermined objectives14.
The Department has a Performance Management Policy in place to regulate the performance management
process. The purpose of this policy is to provide guidelines and standards on which the performance of DPE
can be measured and managed towards the achievement of its strategic objectives. The policy is explicit
with regard to the performance cycle, accountability documents and performance information as well as the
processes to be followed within the Department.
This policy is in line with the Framework for Managing Performance Information provided by the National Treasury,
and is currently being aligned to the new Framework for Strategic Plans and Annual Performance Plans issued
by National Treasury in August 2010. This framework for strategic plans and annual performance plans outlines
key concepts that should guide institutions when developing strategic plans and annual performance plans
andprovidestimeframesforsubmission,tablingandreportingonthesedocuments;clarifiestherelationship
betweeninstitutions,policydevelopmentsandbudgets;detailsanddefineskeyconceptsandinformationto
be reported on in specific sections of the plans.
To improve performance monitoring and reporting within the Department, workshops have been organised
to train senior management on SMART principles and outcomes based planning. The development of the
2013/14 Annual Performance Plan (APP) has been approved and presented to the Portfolio Committee of Public
Enterprises. The Department will monitor progress on the implementation of the APP on a quarterly basis.
Process and timelines for Managing Programme Performance Annual Strategic Planning Workshop and development of framework for annual Business Plan – December/•
January
Strategic Plan and Annual Performance Plan printed and tabled in Parliament – March•
Quarterly reporting per programme and consolidated quarterly report for the Department within 30 days •
of the end of each quarter – approved by the Accounting Officer and submitted to the Minister, Audit
Committee, National Treasury and Department of Performance Monitoring and Evaluation
Mid-term Review Workshop to assess performance against targets and where necessary re-prioritise – •
October/November
Department’s performance reported in Annual Report – August •
Programme performance linked to employee performanceThe performance of programmes is linked to employee performance by means of signed performance •
agreements with balanced scorecards which tie in with the Department’s Annual Performance Plan – April/
May annually
Mid-year reviews are conducted with each employee where their delivery against KPI’s are evaluated – •
September/October
Year end appraisals are conducted with all employees – April/May•

Annual Report Page 121
FINANcIAL INFORMATION
Financial reporting is provided on a monthly basis to the Executive Authority and the Accounting Officer. This
includes the overall financial status of the Department as well as the individual programmes, which enables the
Department to closely monitor the expenditure trends in the units and to implement corrective action where
necessary.
Performance Oversight - State Owned Companies
The Department has an obligation to review the performance of SOC. In terms of Treasury Regulation 29.3,
procedures for quarterly reporting to the executive authority in order to facilitate effective performance monitoring,
evaluation and corrective action must be established. This includes setting up reporting systems allowing
regular monitoring and assessment of SOC performance. To review performance effectively, the Department
must first ensure that it has access to accurate and relevant information on a timely basis to enable continuous
performance evaluation and, when necessary, communicate its concerns to the SOC.
An electronic business intelligence dashboard system, the Isibuko Dashboard has been implemented to allow
for timely reporting by SOC, to monitor trends in financial and operational performance, capital investment
programme, environmental impact assessments, socio-economic issues, governance and skills development
to enhance detection, mitigation and monitoring of enterprise and cross-cutting shareholder risks on an ongoing
basis. Ongoing monitoring ensures early identification of problems and opportunities. It allows the Department
to react promptly on underperformance or on significant changes in the SOC environment that may impact its
performance. It also allows a focus on priorities.
The Minister issues investor briefs to the SOC Boards on a quarterly basis on emerging SOC performance
trends and, in particular, highlights the required corrective action in the event of any deviation from the agreed
key performance areas and indicators. A response to the investor brief is required from the Board within a month
indicating measures to address highlighted concerns or mitigate emerging risks. If no response is received, this
will be indicated at the AGM.
sCoPa resolutions15. The Department did not have any resolutions issued by SCOPA.
Prior modifications to audit reports16. There were no findings in the Auditor General’s Report of 2011/12.
exemptions and deviations received from the national treasury17. None
Interim financial statements 18.
The Department submits its Interim Financial Statements to the Office of the Accountant General on a quarterly
basis as required by National Treasury. The Department did not receive any queries from National Treasury on
these for the period under review.

Annual Report Page 122
FINANcIAL INFORMATION
other 19.
There are no material circumstances to be reported that will have an effect on the understanding of the financial
state of affairs of the Department.
approval20. The Annual Financial Statements set out on pages 127 to 182 have been approved by the Accounting Officer.
Tshediso MatonaDirector-General
Date: 31 July 2013

Annual Report Page 123
FINANcIAL INFORMATION
3. aCCountInG offICers statement of resPonsIBIlItY for annual fInanCIal statements for tHe Year enDeD 31 marCH 2013Statement of Responsibility for the Annual Financial Statements for the year ended 31 March 2013
The Accounting Officer is responsible for the preparation of the department’s annual financial statements and for the judgements made in this information.
The Accounting Officer is responsible for establishing, and implementing a system of internal control de-signed to provide reasonable assurance as to the integrity and reliability of the annual financial statements.
In my opinion, the financial statements fairly reflect the operations of the department for the financial year ended 31 March 2013.
The external auditors are engaged to express an independent opinion on the Annual financial Statements of the Department.
The Department of Public Enterprises Annual Financial Statements for the year ended 31 March 2013 have been examined by the external auditors and their report is presented on page 33.
The Annual Financial Statements of the Department set out on page 127 to page 182 have been approved.
Mr Tshediso MatonaACCOUNTING OFFICER
Department of Public EnterprisesDate: 31 July 2013

Annual Report Page 124
FINANcIAL INFORMATION
4. rePort of tHe auDItor-General for tHe Year enDeD 31 marCH 2013rePort of tHe auDItor-General to ParlIament on vote no. 11: DePartment of PuBlIC enterPrIsesrePort on tHe fInanCIal statements
Introduction
I have audited the financial statements of Department of Public Enterprises set out on pages 138 to 202, 1. which comprise the appropriation statement, the statement of financial position as at 31 March 2013, the statement of financial performance, statement of changes in net assets and the cash flow statement for the year then ended, and the notes, comprising a summary of significant accounting policies and other explanatory information.
Accounting officer
The accounting officer is responsible for the preparation of these financial statements in accordance with 2. the Departmental Financial Reporting Framework prescribed by the National Treasury with the requirements of the Public Finance Management Act of South Africa, 1999 (Act No.1 of 1999) (PFMA) and for such internal control as the accounting officer determines is necessary to enable the preparation of financial statements that are free from material misstatement, whether due to fraud or error
Auditor-General’s responsibility
My responsibility is to express an opinion on these financial statements based on my audit. I conducted my 3. audit in accordance with the Public Audit Act of South Africa, 2004 (Act No. 25 of 2004) (PAA), the General Notice issued in terms thereof and International Standards on Auditing. Those standards require that I comply with ethical requirements and plan and perform the audit to obtain reasonable assurance about whether the financial statements are free from material misstatement.
An audit involves performing procedures to obtain audit evidence about the amounts and disclosures 4. in the financial statements. The procedures selected depend on the auditor’s judgement, including the assessment of the risks of material misstatement of the financial statements, whether due to fraud or error. In making those risk assessments, the auditor considers internal control relevant to the entity’s preparation of the financial statements in order to design audit procedures that are appropriate in the circumstances, but not for the purpose of expressing an opinion on the effectiveness of the entity’s internal control. An audit also includes evaluating the appropriateness of accounting policies used and the reasonableness of accounting estimates made by management, as well as evaluating the overall presentation of the financial statements.
I believe that the audit evidence I have obtained is sufficient and appropriate to provide a basis for my 5. audit opinion.
Opinion
In my opinion, the financial statements present fairly, in all material respects, the financial position of the 6. Department of Public Enterprises as at 31 March 2013 and its financial performance and cash flows for the year then ended in accordance with the Departmental Financial Reporting Framework prescribed by the National Treasury and the requirements of the PFMA.

Annual Report Page 125
FINANcIAL INFORMATION
Emphasis of matter
I draw attention to the matter below. My opinion is not modified in respect of this matter:7. Restatement of corresponding figures
As disclosed in note 12 and 27 to the financial statements, the corresponding figures for the prior year 8. balance sheet date have been restated as a result of an error discovered during the 2012/2013 in the financial statements of the Department of Public Enterprises and for the year ended 2011/2012
Additional matters
Financial reporting framework
The financial reporting framework prescribed by the National Treasury and applied by the department is 9. a compliance framework. Thus my opinion would have reflected that the financial statements had been properly prepared instead of fairly presented as required by section 20(2)(a) of the PAA, which requires me to express an opinion on the fair presentation of the financial statements of the department.
Unaudited supplementary schedules
The supplementary information set out on pages 76 to 100 does not form part of the financial statements 10. and is presented as additional information. I have not audited this schedule and, accordingly, I do not express an opinion thereon.
REPORT ON OTHER LEGAL AND REGULATORY REQUIREMENTS
In accordance with the PAA and the General Notice issued in terms thereof, I report the following findings 11. relevant to performance against predetermined objectives, compliance with laws and regulations and internal control, but not for the purpose of expressing an opinion
Predetermined objectives
I performed procedures to obtain evidence about the usefulness and reliability of the information in the 12. report on predetermined information as set out on pages 23 to 69 of the annual report.
The reported performance against predetermined objectives was evaluated against the overall criteria 13. of usefulness and reliability. The usefulness of information in the annual performance report relates to whether it is presented in accordance with the National Treasury annual reporting principles and whether the reported performance is consistent with the planned objectives. The usefulness of information further relates to whether indicators and targets are measurable (i.e. well defined, verifiable, specific, measurable and time bound) and relevant as required by the National Treasury Framework for managing programme performance information.
The reliability of the information in respect of the selected programmes is assessed to determine whether it adequately reflects the facts (i.e. whether it is valid, accurate and complete).
There were no material findings on the information on predetermined objectives concerning the usefulness 14. and reliability of the information.
Additional matter
Although no material findings concerning the usefulness and reliability of the performance information was 15. identified in the information on predetermined objectives, I draw attention to the following matter:

Annual Report Page 126
FINANcIAL INFORMATION
Achievement of planned targets
Of the 81 planned targets, 26 were not achieved during the year under review. This represents 32% (>20%) 16. of total planned targets that were not achieved during the year. This was as a result of the institution not considering relevant systems and evidential requirements during the annual strategic planning process.
Compliance with laws and regulations
I performed procedures to obtain evidence that the entity has complied with applicable laws and regulations 17. regarding financial matters, financial management and other related matters. My findings on material non-compliance with specific matters in key applicable laws and regulations as set out in the General Notice issued in terms of the PAA are as follows:
Financial management
The financial statements submitted for auditing were not prepared in accordance with the prescribed 18. financial reporting framework and/or supported by full and proper records as required by section 40(1) (a) of the Public Finance Management Act. Material misstatements on key management personnel, impairments, investments and litigations were identified by the auditors in the submitted financial statement and were subsequently corrected, resulting in the financial statements receiving an unqualified audit opinion.
Internal control
I considered internal control relevant to my audit of the financial statements, information on predetermined 19. objectives and compliance with laws and regulations. The matters reported below under the fundamentals of internal control are limited to the significant deficiencies that resulted in the findings on compliance with laws and regulations included in this report.
Financial management
The financial statements submitted for auditing were not fully prepared in accordance with the prescribed 20. financial reporting framework and/or supported by full and proper records as required by section 40(1) (a) of the Public Finance Management Act. Material misstatement on impairments was identified by the auditors in the submitted financial statement and were subsequently corrected, resulting in the financial statements receiving an unqualified audit opinion
Regular, accurate and complete financial reports
The DPE did not fully prepare regular, accurate and complete financial reports that are supported and 21. evidenced in reliable information. This lead to an understatement of key management personnel, contingent liabilities and investments.
Pretoria31 July 2013

Annual Report Page 127
FINANcIAL INFORMATIONA
pp
rop
riat
ion
per
pro
gra
mm
e
2012
/13
2011
/12
AP
PR
OP
RIA
TIO
N
STA
TEM
EN
TA
djus
ted
A
ppro
pria
tion
Shi
ftin
g of
Fu
nds
Vire
men
tFi
nal
App
ropr
iatio
nA
ctua
l E
xpen
ditu
reVa
rian
ce
Exp
endi
ture
as
% o
f fin
al
appr
opria
tion
Fina
l A
ppro
pria
tion
Act
ual
Exp
endi
ture
R’0
00R
’000
R’0
00R
’000
R’0
00R
’000
%R
’000
R’0
001.
A
DM
INIS
TR
AT
ION
Cur
rent
pay
men
t10
6 30
1(1
78)
7 95
711
4 08
011
2 39
01
690
98.5
%10
5 32
410
3 83
5Tr
ansf
ers
and
sub
sid
ies
152
-83
235
227
896
.6%
753
723
Pay
men
t fo
r ca
pita
l as
sets
2 09
317
051
02
773
2 74
231
98.9
%4
071
4 07
1
Pay
men
t fo
r fin
anci
al
asse
ts-
8-
88
-10
0.0%
336
108
546
-8
550
117
096
115
367
1 72
911
0 18
110
8 63
5
2.
LEG
AL
AN
D
GO
VE
RN
AN
CE
Cur
rent
pay
men
t 26
237
-(2
028
)24
209
23 4
5075
996
.9%
22 7
7919
518
Tran
sfer
s an
d s
ubsi
die
s-
-28
2827
196
.4%
--
Pay
men
t fo
r ca
pita
l as
sets
--
--
--
--
-
Pay
men
t fo
r fin
anci
al
asse
ts-
--
--
--
--
26 2
37-
(2 0
00)
24 2
3723
477
760
22 7
7919
518
3.
PO
RT
FOLI
O
MA
NA
GE
ME
NT
A
ND
ST
RA
TE
GIC
PA
RT
NE
RS
HIP
Cur
rent
pay
men
t 73
638
-(6
598
)67
040
59 8
217
219
89.3
%64
127
61 7
07Tr
ansf
ers
and
sub
sid
ies
118
337
-48
118
385
118
384
110
0.0%
156
255
156
255
Pay
men
t fo
r ca
pita
l as
sets
--
--
--
--
-
Pay
men
t fo
r fin
anci
al
asse
ts1
050
000
--
1 05
0 00
01
050
000
-10
0.0%
--
1 24
1 97
5-
(6 5
50)
1 23
5 42
51
228
205
7 22
022
0 38
221
7 96
2
TO
TAL
1 37
6 75
8-
-1
376
758
1 36
7 04
99
709
99.3
%35
3 34
234
6 11
5
5. aPProPrIatIon statement for tHe Year enDeD 31 marCH 2013

Annual Report Page 128
FINANcIAL INFORMATION
2012
/13
2011
/12
Fina
l A
ppro
pria
tion
Act
ual
Exp
endi
ture
Fina
l A
ppro
pria
tion
Act
ual
Exp
endi
ture
TO
TAL
(bro
ught
fo
rwar
d)
1 37
6 75
81
367
049
9 70
999
.3%
353
342
346
115
Rec
onc
iliat
ion
wit
h st
atem
ent
of
fina
ncia
l per
form
ance
AD
D
Dep
artm
enta
l rec
eip
ts53
766
Aid
ass
ista
nce
5 93
713
471
Act
ual a
mo
unts
per
sta
tem
ent
of
fina
ncia
l per
form
ance
(t
ota
l rev
enue
)1
383
232
366
879
AD
D
Aid
ass
ista
nce
11 1
357
185
Act
ual a
mo
unts
per
sta
tem
ent
of
fina
ncia
l per
form
ance
(t
ota
l exp
end
itur
e)1
378
184
353
300

Annual Report Page 129
FINANcIAL INFORMATION
App
ropr
iatio
n pe
r ec
onom
ic c
lass
ifica
tion
2012
/13
2011
/12
Adj
uste
d
App
ropr
iatio
nS
hifti
ng o
f Fu
nds
Vire
men
tFi
nal
App
ropr
iatio
nA
ctua
l E
xpen
ditu
reVa
rianc
eE
xpen
ditu
re
as %
of fi
nal
appr
opria
tion
Fina
l A
ppro
pria
tion
Act
ual
expe
nditu
re
R’0
00R
’000
R’0
00R
’000
R’0
00R
’000
%R
’000
R’0
00
Cur
rent
pay
men
ts
Com
pens
atio
n of
em
ploy
ees
111
475
-(1
59)
111
316
105
327
5 98
994
.6%
100
017
96 1
58
Goo
ds a
nd s
ervi
ces
94 7
01(1
79)
(510
)94
012
90 3
343
678
96.1
%92
213
88 9
02
Tran
sfer
s an
d
subs
idie
s
Pub
lic c
orpo
ratio
ns a
nd
priv
ate
ente
rpris
es11
8 31
3-
-11
8 31
311
8 31
3-
100.
0%15
6 25
515
6 25
5
Hou
seho
lds
76-
159
235
232
398
.7%
--
Gift
s an
d do
natio
ns10
0-
-10
093
793
.0%
753
723
Pay
men
ts fo
r ca
pita
l as
sets
Mac
hine
ry a
nd
equi
pmen
t2
061
109
510
2 68
02
649
3198
.8%
3 92
13
922
Sof
twar
e an
d ot
her
inta
ngib
le a
sset
s32
62-
9493
198
.9%
150
149
Pay
men
ts fo
r fin
anci
al
asse
ts1
050
000
8-
1 05
0 00
81
050
008
-10
0.0%
336
Tota
l1
376
758
--
1 37
6 75
81
367
049
9 70
999
.3%
353
342
346
115

Annual Report Page 130
FINANcIAL INFORMATION20
12/1
320
11/1
2
Det
ail p
er p
rog
ram
me
1:
Ad
min
istr
atio
n
Adj
uste
d
App
ropr
iatio
nS
hift
ing
of
Fund
sVi
rem
ent
Fina
l A
ppro
pria
tion
Act
ual
Exp
endi
ture
Vari
ance
Exp
endi
ture
as
% o
f fina
l ap
prop
riat
ion
Fina
l A
ppro
pria
tion
Act
ual
expe
nditu
re
R’0
00R
’000
R’0
00R
’000
R’0
00R
’000
%R
’000
R’0
001.
1 M
INIS
TR
YC
urre
nt p
aym
ent
28 6
5471
188
030
245
30 0
1722
899
.2%
31 3
7330
450
Tran
sfer
s an
d
sub
sid
ies
--
55
5-
100.
0%-
-
Pay
men
t fo
r ca
pita
l as
sets
77
-14
14-
100.
0%1
411
1 41
1
Pay
men
t fo
r fin
anci
al
asse
ts-
--
--
--
--
1.2
MA
NA
GE
ME
NT
(P
RO
G 1
)C
urre
nt p
aym
ent
6 52
0(2
161
)(5
)4
354
4 12
123
394
.68
102
8 08
2Tr
ansf
ers
and
su
bsi
die
s44
--
4444
-10
0.0%
--
Pay
men
t fo
r ca
pita
l as
sets
-8
-8
8-
100.
0%15
815
8
Pay
men
t fo
r fin
anci
al
asse
ts-
--
--
--
--
1.3
INT
ER
NA
L A
UD
ITC
urre
nt p
aym
ent
3 67
7(7
30)
340
3 28
73
276
1199
.7%
4 33
64
285
Tran
sfer
s an
d
sub
sid
ies
--
--
--
--
-
Pay
men
t fo
r ca
pita
l as
sets
--
--
--
--
-
Pay
men
t fo
r fin
anci
al
asse
ts-
--
--
--
--
1.4
CO
RP
OR
AT
E
SE
RV
ICE
SC
urre
nt p
aym
ent
22 5
4494
03
035
26 5
1925
967
552
97.9
%21
696
21 4
18Tr
ansf
ers
and
su
bsi
die
s-
--
--
--
--
Pay
men
t fo
r ca
pita
l as
sets
1 91
112
036
52
396
2 36
729
98.8
%2
502
2 50
2
Pay
men
t fo
r fin
anci
al
asse
ts-
--
--
--
--
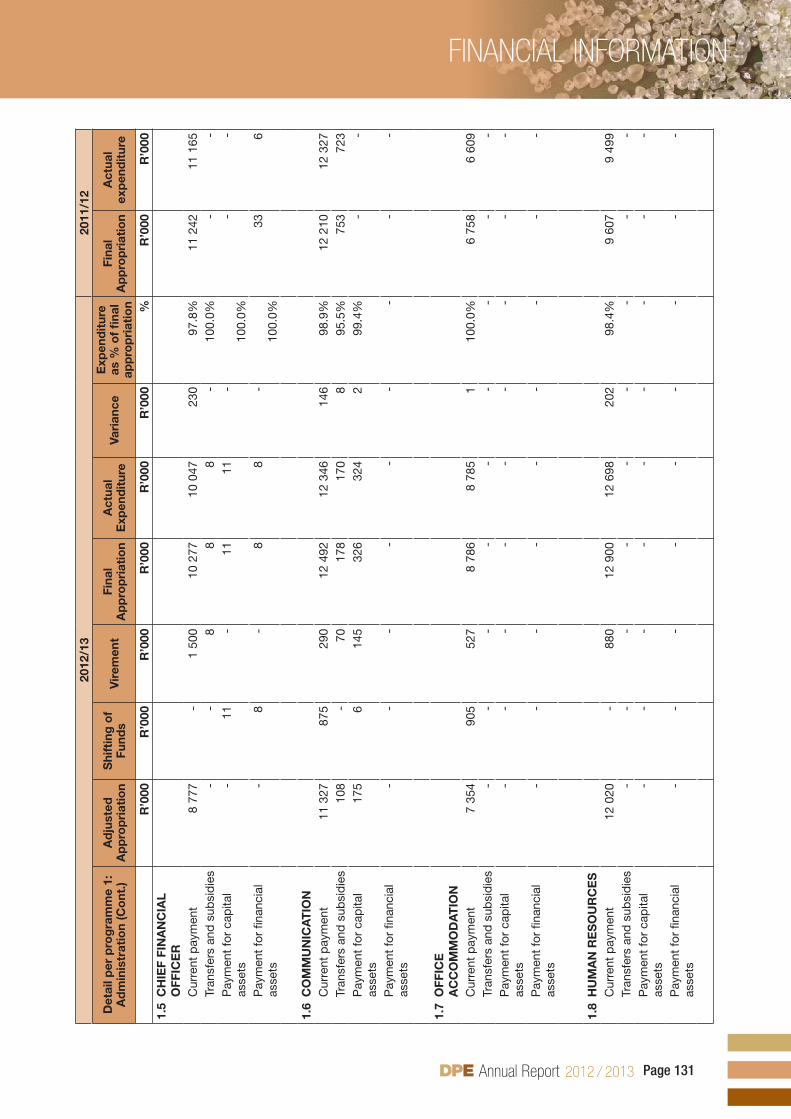
Annual Report Page 131
FINANcIAL INFORMATION20
12/1
320
11/1
2
Det
ail p
er p
rog
ram
me
1:
Ad
min
istr
atio
n (C
ont
.)
A
dju
sted
A
pp
rop
riat
ion
Shi
ftin
g o
f Fu
nds
Vir
emen
tFi
nal
Ap
pro
pri
atio
nA
ctua
l E
xpen
dit
ure
Vari
ance
Exp
end
itur
e as
% o
f fi
nal
app
rop
riat
ion
Fina
l A
pp
rop
riat
ion
Act
ual
exp
end
itur
e
R’0
00R
’000
R’0
00R
’000
R’0
00R
’000
%R
’000
R’0
001.
5 C
HIE
F FI
NA
NC
IAL
OFF
ICE
RC
urre
nt p
aym
ent
8 77
7-
1 50
010
277
10 0
4723
097
.8%
11 2
4211
165
Tran
sfer
s an
d s
ubsi
die
s-
-8
88
-10
0.0%
--
Pay
men
t fo
r ca
pita
l as
sets
-11
-11
11-
100.
0%-
-
Pay
men
t fo
r fin
anci
al
asse
ts-
8-
88
-10
0.0%
336
1.6
CO
MM
UN
ICA
TIO
NC
urre
nt p
aym
ent
11 3
2787
529
012
492
12 3
4614
698
.9%
12 2
1012
327
Tran
sfer
s an
d s
ubsi
die
s10
8-
7017
817
08
95.5
%75
372
3P
aym
ent
for
cap
ital
asse
ts17
56
145
326
324
299
.4%
--
Pay
men
t fo
r fin
anci
al
asse
ts-
--
--
--
--
1.7
OFF
ICE
A
CC
OM
MO
DA
TIO
NC
urre
nt p
aym
ent
7 35
490
552
78
786
8 78
51
100.
0%6
758
6 60
9Tr
ansf
ers
and
sub
sid
ies
--
--
--
--
-P
aym
ent
for
cap
ital
asse
ts-
--
--
--
--
Pay
men
t fo
r fin
anci
al
asse
ts-
--
--
--
--
1.8
HU
MA
N R
ES
OU
RC
ES
Cur
rent
pay
men
t12
020
-88
012
900
12 6
9820
298
.4%
9 60
79
499
Tran
sfer
s an
d s
ubsi
die
s-
--
--
--
--
Pay
men
t fo
r ca
pita
l as
sets
--
--
--
--
-
Pay
men
t fo
r fin
anci
al
asse
ts-
--
--
--
--

Annual Report Page 132
FINANcIAL INFORMATION
2012
/13
2011
/12
Det
ail p
er p
rog
ram
me
1:
Ad
min
istr
atio
n (C
ont
.)
A
dju
sted
A
pp
rop
riat
ion
Shi
ftin
g o
f Fu
nds
Vir
emen
tFi
nal
Ap
pro
pri
atio
nA
ctua
l E
xpen
ditu
reVa
rian
ceE
xpen
ditu
re
as %
of fi
nal
app
rop
riat
ion
Fina
l A
pp
rop
riat
ion
Act
ual
exp
end
iture
R’0
00R
’000
R’0
00R
’000
R’0
00R
’000
%R
’000
R’0
00
1.9
ST
RA
TE
GIC
PLA
NN
ING
, M
ON
ITO
RIN
G A
ND
E
VALU
AT
ION
Cur
rent
pay
men
t3
846
(668
)22
03
398
3 36
137
98.9
%-
-
Tran
sfer
s an
d s
ubsi
die
s-
--
--
--
--
Pay
men
t for
cap
ital a
sset
s-
18-
1818
-10
0.0%
--
Pay
men
t for
fina
ncia
l ass
ets
--
--
--
--
-
1.10
INT
ER
GO
VE
RN
ME
NTA
L R
ELA
TIO
NS
Cur
rent
pay
men
t1
582
(50)
290
1 82
21
772
5097
.3%
--
Tran
sfer
s an
d s
ubsi
die
s-
--
--
--
--
Pay
men
t for
cap
ital a
sset
s-
--
--
--
--
Pay
men
t for
fina
ncia
l ass
ets
--
--
--
--
-
Tota
l10
8 54
6-
8 55
011
7 09
611
5 36
71
729
98.5
%11
0 18
110
8 63
5

Annual Report Page 133
FINANcIAL INFORMATION
2012
/13
2011
/12
Eco
nom
ic c
lass
ifica
tio
nA
dju
sted
A
pp
rop
riat
ion
Shi
ftin
g o
f Fu
nds
Vir
emen
tFi
nal
Ap
pro
pri
atio
nA
ctua
l E
xpen
dit
ure
Vari
ance
Exp
end
itur
e as
% o
f fi
nal
app
rop
riat
ion
Fina
l A
pp
rop
riat
ion
Act
ual
exp
end
itur
e
R’0
00R
’000
R’0
00R
’000
R’0
00R
’000
%R
’000
R’0
00C
urre
nt p
aym
ents
Com
pen
satio
n of
em
plo
yees
54 4
90-
3 58
558
075
56 7
141
361
97.7
%51
279
51 2
87G
ood
s an
d s
ervi
ces
51 8
11(1
79)
4 37
256
004
55 6
7632
894
.4%
54 0
4552
548
Tran
sfer
s an
d s
ubsi
die
s to
:P
ublic
cor
por
atio
ns a
nd
priv
ate
ente
rpris
es-
--
--
--
--
Hou
seho
lds
52-
8313
513
41
99.3
%-
-G
ifts
and
don
atio
ns10
0-
-10
093
793
.0%
753
723
Pay
men
t fo
r c
apita
l ass
ets
Mac
hine
ry a
nd e
qui
pm
ent
2 06
110
951
02
680
2 64
931
98.8
%3
921
3 92
2S
oftw
are
and
oth
er in
tang
ible
as
sets
3262
-94
931
98.3
%15
014
9
Pay
men
ts fo
r fin
anci
al a
sset
s-
8-
88
-10
0.0%
336
Tota
l10
8 54
6-
8 55
011
7 09
611
5 36
71
729
98.5
%11
0 18
110
8 63
5

Annual Report Page 134
FINANcIAL INFORMATION
2012
/13
2011
/12
Det
ail p
er s
ub-p
rog
ram
me
2: L
egal
and
Go
vern
ance
Ad
just
ed
Ap
pro
pri
atio
nS
hift
ing
of
Fund
sV
irem
ent
Fina
l A
pp
rop
riat
ion
Act
ual
Exp
end
itur
eVa
rian
ceE
xpen
dit
ure
as %
of
fina
l ap
pro
pri
atio
n
Fina
l A
pp
rop
riat
ion
Act
ual
exp
end
itur
e
R’0
00R
’000
R’0
00R
’000
R’0
00R
’000
%R
’000
R’0
002.
1 M
AN
AG
EM
EN
T (P
RO
G
2)C
urre
nt p
aym
ent
2 31
531
-2
346
2 25
294
96.0
%1
873
1 82
2Tr
ansf
ers
and
sub
sid
ies
--
--
--
--
-P
aym
ent
for
cap
ital
asse
ts-
--
--
--
--
Pay
men
t fo
r fin
anci
al
asse
ts-
--
--
--
--
2.2
LEG
AL
Cur
rent
pay
men
t15
893
(330
)(2
000
)13
563
13 3
4821
598
.4%
14 4
8612
775
Tran
sfer
s an
d s
ubsi
die
s-
-23
2322
195
.7%
--
Pay
men
t fo
r ca
pita
l as
sets
--
--
--
--
-
Pay
men
t fo
r fin
anci
al
asse
ts-
--
--
--
--
2.3
GO
VE
RN
AN
CE
Cur
rent
pay
men
t8
029
229
(28)
8 30
07
850
450
94.6
%6
420
4 92
1Tr
ansf
ers
and
sub
sid
ies
--
55
5-
100.
0%-
-P
aym
ent
for
cap
ital
asse
ts-
--
--
--
--
Pay
men
t fo
r fin
anci
al
asse
ts-
--
--
--
--
Tota
l26
237
-(2
000
)24
237
23 4
7776
096
.9%
22 7
7919
518

Annual Report Page 135
FINANcIAL INFORMATION
2012
/13
2011
/12
Eco
nom
ic c
lass
ifica
tio
nA
dju
sted
A
pp
rop
riat
ion
Shi
ftin
g o
f Fu
nds
Vir
emen
tFi
nal
Ap
pro
pri
atio
nA
ctua
l E
xpen
dit
ure
Vari
ance
Exp
end
itur
e as
% o
f fi
nal
app
rop
riat
ion
Fina
l A
pp
rop
riat
ion
Act
ual
exp
end
itur
e
R’0
00R
’000
R’0
00R
’000
R’0
00R
’000
%R
’000
R’0
00C
urre
nt p
aym
ents
Com
pen
satio
n of
em
plo
yees
14 3
93-
(28)
14 3
6514
111
254
98.2
%15
801
13 2
06
Goo
ds
and
ser
vice
s11
844
-(2
000
)9
844
9 33
950
594
.9%
6 97
86
312
Tran
sfer
s an
d s
ubsi
die
s to
:P
ublic
cor
por
atio
ns a
nd
priv
ate
ente
rpris
es-
--
--
--
--
Hou
seho
lds
--
2828
271
96.4
%-
-G
ifts
and
don
atio
ns-
--
--
--
--
Pay
men
t fo
r c
apita
l ass
ets
Mac
hine
ry a
nd e
qui
pm
ent
--
--
--
--
-S
oftw
are
and
oth
er
inta
ngib
le a
sset
s-
--
--
--
--
Pay
men
ts fo
r fin
anci
al
asse
ts-
--
--
--
--
Tota
l26
237
-(2
000
)24
237
23 4
7776
096
.9%
22 7
7919
518

Annual Report Page 136
FINANcIAL INFORMATION20
12/1
320
11/1
2D
etai
l per
sub
-pro
gra
mm
e 3:
P
ort
folio
Man
agem
ent
and
S
trat
egic
Par
tner
ship
s
Ad
just
ed
Ap
pro
pri
atio
nS
hift
ing
of
Fund
sV
irem
ent
Fina
l A
pp
rop
riat
ion
Act
ual
Exp
end
itur
eVa
rian
ceE
xpen
dit
ure
as %
of
fina
l ap
pro
pri
atio
n
Fina
l A
pp
rop
riat
ion
Act
ual
exp
end
itur
e
R’0
00R
’000
R’0
00R
’000
R’0
00R
’000
%R
’000
R’0
003.
1 E
nerg
y an
d B
road
ban
d
E
nter
pri
ses
Cur
rent
pay
men
t16
766
-(8
90)
15 8
7613
873
2 00
387
.4%
16 6
7816
488
Tran
sfer
s an
d s
ubsi
die
s24
-48
7271
198
.6%
40 0
0040
000
Pay
men
t fo
r ca
pita
l ass
ets
--
--
--
--
Pay
men
t fo
r fin
anci
al a
sset
s-
--
--
--
-
3.2
Man
ufac
turi
ng E
nter
pri
ses
Cur
rent
pay
men
t14
178
(1 7
00)
(640
)11
838
9 95
51
883
84.1
%7
296
7 16
8Tr
ansf
ers
and
sub
sid
ies
118
313
--
118
313
118
313
-10
0.0%
116
525
116
255
Pay
men
t fo
r ca
pita
l ass
ets
--
--
--
--
-P
aym
ent
for
finan
cial
ass
ets
1 05
0 00
0-
-1
050
000
1 05
0 00
0-
100.
0%-
-
3.3
Tran
spo
rt E
nter
pri
ses
Cur
rent
pay
men
t19
787
3 00
0(7
38)
22 0
4920
030
2 01
990
.8%
21 0
6618
752
Tran
sfer
s an
d s
ubsi
die
s-
--
--
--
--
Pay
men
t fo
r ca
pita
l ass
ets
--
--
--
--
-P
aym
ent
for
finan
cial
ass
ets
--
--
--
--
-
3.4
Eco
nom
ic Im
pac
t an
d
Po
licy
Alig
nmen
tC
urre
nt p
aym
ent
15 0
52(1
000
)(3
330
)10
722
9 99
073
293
.2%
12 0
8411
744
Tran
sfer
s an
d s
ubsi
die
s-
--
--
--
--
Pay
men
t fo
r ca
pita
l ass
ets
--
--
--
--
-P
aym
ent
for
finan
cial
ass
ets
--
--
--
--
-
3.5
Str
ateg
ic P
artn
ersh
ips
Cur
rent
pay
men
t7
855
(300
)(1
000
)6
555
5 97
358
291
.2%
6 46
37
555
Tran
sfer
s an
d s
ubsi
die
s-
--
--
--
--
Pay
men
t fo
r ca
pita
l ass
ets
--
--
--
--
-P
aym
ent
for
finan
cial
ass
ets
--
--
--
--
-
Tota
l1
241
975
-(6
550
)1
235
425
1 22
8 20
57
220
99.4
%22
0 38
221
7 96
2

Annual Report Page 137
FINANcIAL INFORMATION
2012
/13
2011
/12
Eco
nom
ic c
lass
ifica
tio
nA
dju
sted
A
pp
rop
riat
ion
Shi
ftin
g o
f Fu
nds
Vir
emen
tFi
nal
Ap
pro
pri
atio
nA
ctua
l E
xpen
dit
ure
Vari
ance
Exp
end
itur
e as
% o
f fi
nal
app
rop
riat
ion
Fina
l A
pp
rop
riat
ion
Act
ual
exp
end
itur
e
R’0
00R
’000
R’0
00R
’000
R’0
00R
’000
%R
’000
R’0
00C
urre
nt p
aym
ents
Com
pen
satio
n of
em
plo
yees
42 5
92-
(3 7
16)
38 8
7634
502
4 37
488
.8%
32 9
3731
665
Goo
ds
and
ser
vice
s31
046
-(2
882
)28
164
25 3
192
845
89.9
%31
190
30 0
42
Tran
sfer
s an
d s
ubsi
die
s to
:P
ublic
cor
por
atio
ns a
nd
priv
ate
ente
rpris
es11
8 31
3-
-11
8 31
311
8 31
3-
100.
0%15
6 25
515
6 25
5
Hou
seho
lds
24-
4872
711
98.6
%-
-G
ifts
and
don
atio
ns-
--
--
--
--
Pay
men
t fo
r c
apita
l ass
ets
Mac
hine
ry a
nd e
qui
pm
ent
--
--
--
--
-S
oftw
are
and
oth
er in
tang
ible
as
sets
--
--
--
--
-
Pay
men
ts fo
r fin
anci
al a
sset
s1
050
000
--
1 05
0 00
01
050
000
-10
0.0%
--
Tota
l1
241
975
-(6
550
)1
235
425
1 22
8 20
57
220
99.4
%22
0 38
221
7 96
2

Annual Report Page 138
FINANcIAL INFORMATION
6. notes to tHe aPProPrIatIon statement for tHe Year enDeD 31 marCH 2013
Detail of transfers and subsidies as per Appropriation Act (after Virement):1.
Detail of these transactions can be viewed in the note on Transfers and subsidies, disclosure notes and Annexure 1 (A-D) to the Annual Financial Statements.
Detail of specifically and exclusively appropriated amounts voted (after Virement):2.
Detail of these transactions can be viewed in note 1 (Annual Appropriation) to the Annual Financial Statements.
Detail on payments for financial assets3.
Detail of these transactions per programme can be viewed in the note 6 on Payments for financial assets to the Annual Financial Statements.
Explanations of material variances from Amounts Voted (after Virement):4.
4.1 Per programme Final Appropriation
Actual Expenditure
Variance R’000
Variance as a % of Final
Appropriation
Administration 117 096 115 367 1 729 1.5%
Legal and Governance 24 237 23 477 760 3.1%
Portfolio Management and Strategic Partnerships
1 235 425 1 228 205 7 220 0.6%
1 376 758 1 367 049 9 709 0.7%
Underspending amounting to R9.7 million was recorded in the 2012/13 financial year. This amount is mainly made up of current expenditure in the operational budget was under Compensation of Employees amounting to R6 million (5.36% of budget) as a result of some posts not having been filled due to scarcity of specialist skills in the market, as well as Goods and Services amounting to R3.7 million (3.91% of budget) which arose due to some projects having been delayed due to capacity constraints. The Department has requested rollovers from the 2012/13 Goods and Services budget from National Treasury for three projects amounting to R1.8 million in order for them to be completed in the new financial year. The Department spent 99.3% of its budget which was within its 2% spending target.
Programme 2: Legal and Governance:
The underspending was mainly on Goods and services, due to some projects been delayed.

Annual Report Page 139
FINANcIAL INFORMATION
4.2 Per economic classification Final Appropriation
Actual Expenditure Variance
Variance as a % of Final
Appropriation
R’000 R’000 R’000 R’000
Current payments
Compensation of employees 111 316 105 327 5 989 5.4%
Goods and services 94 012 90 334 3 678 3.9%
Transfers and subsidies
Public corporations and private enterprises 118 313 118 313 - -
Households 235 232 3 1.3%
Gifts and donations 100 93 7 7.0%
Payments for capital assets
Machinery and equipment 2 680 2 649 31 1.2%
Software and other intangible assets 94 93 1 1.1%
Payments for financial assets 1 050 008 1 050 008 - -
1 376 758 1 367 049 9 709 0.7%
Compensation of employees’ underspending is as a result of some posts not having been filled due to scarcity of specialist skills in the market, as well as under-spending under goods and services which arose due to some projects having been delayed due to capacity constraints.

Annual Report Page 140
FINANcIAL INFORMATION
7. statement of fInanCIal PerformanCe for tHe Year enDeD 31 marCH 2013PERFORMANCE Note 2012/13 2011/12
R’000 R’000REVENUEAnnual appropriation 1 1 376 758 353 342Departmental revenue 2 537 66Aid assistance 3 5 937 13 471
TOTAL REVENUE 1 383 232 366 879
EXPENDITURECurrent expenditureCompensation of employees 4 105 327 96 158Goods and services 5 90 334 88 902Aid assistance 3 11 135 7 185Total current expenditure 206 796 192 245
Transfers and subsidiesTransfers and subsidies 7 118 638 156 978Total transfers and subsidies 118 638 156 978
Expenditure for capital assetsTangible capital assets 8 2 649 3 922Software and other intangible assets 8 93 149Total expenditure for capital assets 2 742 4 071
Payments for financial assets 6 1 050 008 6
TOTAL EXPENDITURE 1 378 184 353 300
SURPLUS/(DEFICIT) FOR THE YEAR 5 048 13 579
Reconciliation of Net Surplus/(Deficit) for the yearVoted funds 9 709 7 227Annual appropriation 14 9 709 7 227Departmental revenue and NRF Receipts 15 537 66Aid assistance 3 (5 198) 6 286SURPLUS/(DEFICIT) FOR THE YEAR 5 048 13 579

Annual Report Page 141
FINANcIAL INFORMATION
8. statement of fInanCIal PosItIon as at 31 marCH 2013POSITION Note 2012/13 2011/12
R’000 R’000ASSETS
Current assets 126 999 129 963Cash and cash equivalents 9 126 370 128 876Prepayments and advances 10 35 752Receivables 11 594 335 Non-current assets 24 799 585 24 099 585Investments 12 23 448 455 22 748 455Loans 13 1 351 130 1 351 130 TOTAL ASSETS 24 926 584 24 229 548
LIABILITIES
Current liabilities 126 999 129 963Voted funds to be surrendered to the Revenue Fund 14 9 709 7 227Departmental revenue and NRF Receipts to be surrendered to the Revenue Fund
15 10 (52)
Payables 16 1 491 1 801Aid assistance unutilised 3 115 789 120 987 TOTAL LIABILITIES 126 999 129 963
NET ASSETS 24 799 585 24 099 585
Represented by:Capitalisation reserve 24 799 585 24 099 585
TOTAL 24 799 585 24 099 585

Annual Report Page 142
FINANcIAL INFORMATION
9. statement of CHanGes In net assets for tHe Year enDeD 31 marCH 2013
NET ASSETS Note 2012/13 2011/12R’000 R’000
Capitalisation ReservesOpening balance 24 099 585 24 099 585Transfers:Movement in Equity 700 000 -Closing balance 24 799 585 24 099 585
TOTAL 12 24 799 585 24 099 585
The movement in equity reflects R700 million, notwithstanding the payment of financial assets being R 1.050 million. The difference arises from the fact that Alexkor received a payment for the purchase of equity amounting to R350 million, as no shares had been issued as at 31 March 2013. It is anticipated that these shares will be issued in 2013/14.

Annual Report Page 143
FINANcIAL INFORMATION
10. CasH floW for tHe Year enDeD 31 marCH 2013CASH FLOW Note 2012/13 2011/12
R’000 R’000CASH FLOWS FROM OPERATING ACTIVITIESReceipts 1 383 232 366 871Annual appropriated funds received 1.1 1 376 758 353 342Departmental revenue received 2 537 58Aid assistance received 3 5 937 13 471
Net (increase)/decrease in working capital 148 1 085Surrendered to Revenue Fund (7 702) (15 682)Surrendered to RDP Fund/Donor - (4 774)Current payments (206 796) (192 245)Payments for financial assets (1 050 008) (6)Transfers and subsidies paid (118 638) (156 978)Net cash flow available from operating activities 17 236 (1 729)
CASH FLOWS FROM INVESTING ACTIVITIESPayments for capital assets 8 (2 742) (4 071)Proceeds from sale of capital assets 2.3 - 8(Increase)/decrease in investments (700 000) -Net cash flows from investing activities (702 742) (4 063)
CASH FLOWS FROM FINANCING ACTIVITIESIncrease/(decrease) in net assets 700 000 -Net cash flows from financing activities 700 000 -
Net increase/(decrease) in cash and cash equivalents (2 506) (5 792)
Cash and cash equivalents at beginning of period 128 876 134 668
Cash and cash equivalents at end of period 18 126 370 128 876
Annual Report Page 144
FINANcIAL INFORMATION
11. notes to tHe annual fInanCIal statements aCCountInG PolICIes for tHe Year enDeD 31 marCH 2013
The Financial Statements have been prepared in accordance with the following policies, which have been applied consistently in all material aspects, unless otherwise indicated. However, where appropriate and meaningful, additional information has been disclosed to enhance the usefulness of the Financial Statements and to comply with the statutory requirements of the Public Finance Management Act, Act 1 of 1999 (as amended by Act 29 of 1999), and the Treasury Regulations issued in terms of the Act and the Division of Revenue Act, Act 1 of 2010.
Presentation of the Financial Statements1.
Basis of preparation1.1 The financial statements have been prepared on a modified cash basis of accounting.
Under this basis, the effects of transactions and other events are recognised in the financial records when the resulting cash is received or paid. The “modification” results from the recognition of certain near-cash balances in the financial statements as well as the revaluation of foreign investments and loans and the recognition of resulting revaluation gains and losses.
In addition supplementary information is provided in the disclosure notes to the financial statements where it is deemed to be useful to the users of the financial statements.
Presentation currency1.1 All amounts have been presented in the currency of the South African Rand (R) which is also the functional currency of the department.
Rounding1.2 Unless otherwise stated all financial figures have been rounded to the nearest one thousand Rand (R’000).
Comparative figures1.3
Prior period comparative information has been presented in the current year’s financial statements. Where necessary figures included in the prior period financial statements have been reclassified to ensure that the format in which the information is presented is consistent with the format of the current year’s financial statements.
Comparative figures - Appropriation Statement1.4
A comparison between actual amounts and final appropriation per major classification of expenditure is included in the Appropriation Statement.
Revenue2.
Appropriated funds2.1 Appropriated funds comprises of departmental allocations as well as direct charges against revenue fund (i.e. statutory appropriation).
Appropriated funds are recognised in the financial records on the date the appropriation becomes effective. Adjustments made in terms of the adjustments budget process are recognised in the financial records on the date the adjustments become effective.
Unexpended appropriated funds are surrendered to the National/Provincial Revenue Fund. Any amounts owing to the National/Provincial Revenue Fund at the end of the financial year are recognised as payable in the statement of financial position.
Any amount due from the National/Provincial Revenue Fund at the end of the financial year is recognised as a receivable in the statement of financial position.
Annual Report Page 145
FINANcIAL INFORMATION
Departmental revenue2.2 All departmental revenue is recognised in the statement of financial performance when received and is subsequently paid into the National/Provincial Revenue Fund, unless stated otherwise.
Any amount owing to the National/Provincial Revenue Fund at the end if the financial year is recognised as a payable in the statement of financial position.
No accrual is made for amounts receivable from the last receipt date to the end of the reporting period. These amounts are however disclosed in the disclosure notes to the annual financial statements.
Direct Exchequer receipts2.3 All direct exchequer receipts are recognised in the statement of financial performance when the cash is received and is subsequently paid into the National/Provincial Revenue Fund, unless stated otherwise.
Any amount owing to the National/Provincial Revenue Funds at the end of the financial year is recognised as a payable in the statement of financial position.
Direct Exchequer payments2.4 All direct exchequer payments are recognised in the statement of financial performance when final authorisation for payment is effected on the system (by no later than 31 March of each year).
Aid assistance2.5 Aids assistance is recognised as revenue when received
All in-kind aid assistance is disclosed at fair value on the date of receipt in the annexures to the Annual Financial Statements
The cash payments made during the year relating to aid assistance projects are recognised as expenditure in the statement of financial performance when final authorisation for payments is effected on the system (by no later than 31 March of each year)
The value of the assistance expensed prior to the receipt of funds is recognised as a receivable in the statement of financial position.
Inappropriately expensed amounts using aid assistance and any unutilised amounts are recognised as payables in the statement of financial position.
All CARA funds received must be recorded as revenue when funds are received. The cash payments made during the year relating to CARA earmarked projects are recognised as expenditure in the statement of financial performance when final authorisation for payments effected on the system (by no later then 31 March of each year)
Inappropriately expensed amounts using CARA funds are recognised as payables in the statement of financial position. Any unutilised amounts are transferred to retained funds as they are not surrendered to the revenue fund.
Expenditure3.
Compensation of employees3.1
Salaries and wages3.1.1 Salaries and wages are expensed in the statement of financial performance when the final authorisation for payment is effected on the system (by no later than 31 March of each year).
Other employee benefits that give rise to a present legal or constructive obligation are disclosed in the disclosure notes to the financial statements at its face value and are not recognised in the statement of financial performance or position.

Annual Report Page 146
FINANcIAL INFORMATION
Employee costs are capitalised to the cost of a capital project when an employee spends more than 50% of his/her time on the project. These payments form part of expenditure for capital assets in the statement of financial performance.
Social contributions3.1.2 Employer contributions to post employment benefit plans in respect of current employees are expensed in the statement of financial performance when the final authorisation for payment is effected on the system (by no later than 31 March of each year).
No provision is made for retirement benefits in the financial statements of the department. Any potential liabilities are disclosed in the financial statements of the National Revenue Fund and not in the financial statements of the employer department.
Employer contributions made by the department for certain of its ex-employees (such as medical benefits) are classified as transfers to households in the statement of financial performance.
Goods and services3.2 Payments made during the year for goods and/or services are recognised as an expense in the statement of financial performance when the final authorisation for payment is effected on the system (by no later than 31 March of each year).
The expense is classified as capital if the goods and/or services were acquired for a capital project or if the total purchase price exceeds the capitalisation threshold (currently R5, 000). All other expenditures are classified as current.
Rental paid for the use of buildings or other fixed structures is classified as goods and services and not as rent on land.
Interest and rent on land3.3 Interest and rental payments are recognised as an expense in the statement of financial performance when the final authorisation for payment is effected on the system (by no later than 31 March of each year). This item excludes rental for the use of buildings or other fixed structures. If it is not possible to distinguish between payment for the use of land and the fixed structures on it, the whole amount should be recorded under goods and services.
Payments for financial assets3.4 Debts are written off when identified as irrecoverable. Debts written-off are limited to the amount of savings and/or underspending of appropriated funds. The write off occurs at year-end or when funds are available. No provision is made for irrecoverable amounts but an estimate is included in the disclosure notes to the financial statements.
All other losses are recognised when authorisation has been granted for the recognition thereof.
Transfers and subsidies3.5 Transfers and subsidies are recognised as an expense when the final authorisation for payment is effected on the system (by no later than 31 March of each year).
Unauthorised expenditure3.6 When confirmed unauthorised expenditure is recognised as an asset in the statement of financial position until such time as the expenditure is either approved by the relevant authority, recovered from the responsible person or written off as irrecoverable in the statement of financial performance.
Unauthorised expenditure approved with funding is derecognised from the statement of financial position when the unauthorised expenditure is approved and the related funds are received.
Where the amount is approved without funding it is recognised as expenditure in the statement of financial performance on the date stipulated in the Act.
Annual Report Page 147
FINANcIAL INFORMATION
Fruitless and wasteful expenditure3.7
Fruitless and wasteful expenditure is recognised as expenditure in the statement of financial performance according to the nature of the payment and not as a separate line item on the face of the statement. If the expenditure is recoverable it is treated as an asset until it is recovered from the responsible person or written off as irrecoverable in the statement of financial performance.
Irregular expenditure3.8
Irregular expenditure is recognised as expenditure in the statement of financial performance. If the expenditure is not condoned by the relevant authority it is treated as an asset until it is recovered or written off as irrecoverable.
Assets4.
Cash and cash equivalents4.1 Cash and cash equivalents are carried in the statement of financial position at cost.
Bank overdrafts are shown separately on the face of the statement of financial position.
For the purposes of the cash flow statement, cash and cash equivalents comprise cash on hand, deposits held, other short-term highly liquid investments and bank overdrafts.
Other financial assets4.2 Other financial assets are carried in the statement of financial position at cost.
Prepayments and advances4.3 Amounts prepaid or advanced are recognised in the statement of financial position when the payments are made and are derecognised as and when the goods/services are received or the funds are utilised.
Prepayments and advances outstanding at the end of the year are carried in the statement of financial position at cost.
Receivables4.4 Receivables included in the statement of financial position arise from cash payments made that are recoverable from another party (including departmental employees) and are derecognised upon recovery or write-off.
Receivables outstanding at year-end are carried in the statement of financial position at cost plus any accrued interest. Amounts that are potentially irrecoverable are included in the disclosure notes.
Investments4.5 Capitalised investments are shown at cost in the statement of financial position.
Investments are tested for an impairment loss whenever events or changes in circumstances indicate that the investment may be impaired. Any impairment loss is included in the disclosure notes.
Loans4.6 Loans are recognised in the statement of financial position when the cash is paid to the beneficiary. Loans that are outstanding at year-end are carried in the statement of financial position at cost plus accrued interest.
Amounts that are potentially irrecoverable are included in the disclosure notes.
Inventory4.7 Inventories that qualify for recognition must be initially reflected at cost. Where inventories are acquired at no cost, or for nominal consideration, their cost shall be their fair value at the date of acquisition.
All inventory items at year-end are reflected using the weighted average cost or FIFO cost formula.

Annual Report Page 148
FINANcIAL INFORMATION
Capital assets4.8
Movable assets4.8.1
Initial recognitionA capital asset is recorded in the asset register on receipt of the item at cost. Cost of an asset is defined as the total cost of acquisition. Where the cost cannot be determined accurately, the movable capital asset is stated at fair value. Where fair value cannot be determined, the capital asset is included in the asset register at R1.
All assets acquired prior to 1 April 2002 are included in the register at R1.
Subsequent recognitionSubsequent expenditure of a capital nature is recorded in the statement of financial performance as “expenditure for capital assets” and is capitalised in the asset register of the department on completion of the project.
Repairs and maintenance is expensed as current “goods and services” in the statement of financial performance.
Immovable assets4.8.2
Initial recognitionA capital asset is recorded on receipt of the item at cost. Cost of an asset is defined as the total cost of acquisition. Where the cost cannot be determined accurately, the immovable capital asset is stated at R1 unless the fair value for the asset has been reliably estimated.
Subsequent recognitionWork-in-progress of a capital nature is recorded in the statement of financial performance as “expenditure for capital assets”. On completion, the total cost of the project is included in the asset register of the department that is accountable for the asset.
Repairs and maintenance is expensed as current “goods and services” in the statement of financial performance.
Intangible assets4.8.3
Initial recognitionAn intangible asset is recorded in the asset register on receipt of the item at cost. Cost of an intangible asset is defined as the total cost of acquisition. Where the cost cannot be determined accurately, the intangible asset is stated at fair value. Where fair value cannot be determined, the intangible asset is included in the asset register at R1.
All intangible assets acquired prior to 1 April 2002 can be included in the asset register at R1.*
Subsequent expenditureSubsequent expenditure of a capital nature is recorded in the statement of financial performance as “expenditure for capital asset” and is capitalised in the asset register of the department.
Maintenance is expensed as current “goods and services” in the statement of financial performance.
Liabilities5.
Payables5.1 Recognised payables mainly comprise of amounts owing to other governmental entities. These payables are carried at cost in the statement of financial position.

Annual Report Page 149
FINANcIAL INFORMATION
Contingent liabilities5.2 Contingent liabilities are included in the disclosure notes to the financial statements when it is possible that economic benefits will flow from the department, or when an outflow of economic benefits or service potential is probable but cannot be measured reliably.
Contingent assets5.3 Contingent assets are included in the disclosure notes to the financial statements when it is probable that an inflow of economic benefits will flow to the entity.
Commitments5.4 Commitments are not recognised in the statement of financial position as a liability or as expenditure in the statement of financial performance but are included in the disclosure notes.
Accruals5.5 Accruals are not recognised in the statement of financial position as a liability or as expenditure in the statement of financial performance but are included in the disclosure notes.
Employee benefits5.6 Short-term employee benefits that give rise to a present legal or constructive obligation are disclosed in the disclosure notes to the financial statements. These amounts are not recognised in the statement of financial performance or the statement of financial position.
Lease commitments5.7
Finance leaseFinance leases are not recognised as assets and liabilities in the statement of financial position. Finance lease payments are recognised as a capital expense in the statement of financial performance and are not apportioned between the capital and the interest portions. The total finance lease payment is disclosed in the disclosure notes to the financial statements.
Operating leaseOperating lease payments are recognised as an expense in the statement of financial performance. The operating lease commitments are disclosed in the disclosure notes to the financial statement.
Impairment5.8 The department tests for impairment where there is an indication that a receivable, loan or investment may be impaired. An assessment of whether there is an indication of possible impairment is done at each reporting date. An estimate is made for doubtful loans and receivables based on a review of all outstanding amounts at year-end. Impairments on investments are calculated as being the difference between the carrying amount and the present value of the expected future cash flows / service potential flowing from the instrument.
Provisions5.9 Provisions are disclosed when there is a present legal or constructive obligation to forfeit economic benefits as a result of events in the past and it is probable that an outflow of resources embodying economic benefits will be required to settle the obligation and a reliable estimate of the obligation can be made.
Receivables for departmental revenue6.
Receivables for departmental revenue are disclosed in the disclosure notes to the annual financial statements. These receivables are written off when identified as irrecoverable and are disclosed separately.

Annual Report Page 150
FINANcIAL INFORMATION
Net Assets7.
Capitalisation reserve7.1 The capitalisation reserve comprises of financial assets and/or liabilities originating in a prior reporting period but which are recognised in the statement of financial position for the first time in the current reporting period. Amounts are recognised in the capitalisation reserves when identified in the current period and are transferred to the National/Provincial Revenue Fund when the underlying asset is disposed and the related funds are received.
Recoverable revenue7.2
Amounts are recognised as recoverable revenue when a payment made in a previous financial year becomes recoverable from a debtor in the current financial year. Amounts are either transferred to the National/Provincial Revenue Fund when recovered or are transferred to the statement of financial performance when written-off.
Related party transactions8.
Specific information with regards to related party transactions is included in the disclosure notes.
Key management personnel9.
Compensation paid to key management personnel including their family members where relevant, is included in the disclosure notes.
Public private partnerships10.
A description of the PPP arrangement, the contract fees and current and capital expenditure relating to the PPP arrangement is included in the disclosure notes.

Annual Report Page 151
FINANcIAL INFORMATION
11. notes to tHe annual fInanCIal statements for tHe Year enDeD 31 marCH 2013
Annual Appropriation 1.
1.1 Annual AppropriationIncluded are funds appropriated in terms of the Appropriation Act (and the Adjustments Appropriation Act) for National Departments (Voted funds) and Provincial Departments:
2012/13 2011/12
Final Appropriation
Actual Funds Received
Funds not requested/
not received
Appropriationreceived
R’000 R’000 R’000 R’000
Administration 117 096 117 096 - 110 181
Legal and Governance 24 237 24 237 - 22 779
Portfolio Management and Strategic Partnerships 1 235 425 1 235 425 - 220 382
Total 1 376 758 1 376 758 - 353 342
Departmental Revenue 2.
Note 2012/13 2011/12
R’000 R’000
Sales of goods and services other than capital assets 2.1 58 53
Interest, dividends and rent on land 2.2 12 5
Sales of capital assets 2.3 - 8
Transactions in financial assets and liabilities 2.4 467 -
Departmental revenue collected 537 66
Sales of goods and services other than capital assets2.1
Sales of goods and services produced by the department 58 51
Sales by market establishment 37 35
Other sales 21 16
Sales of scrap, waste and other used current goods - 2
Total 2 58 53
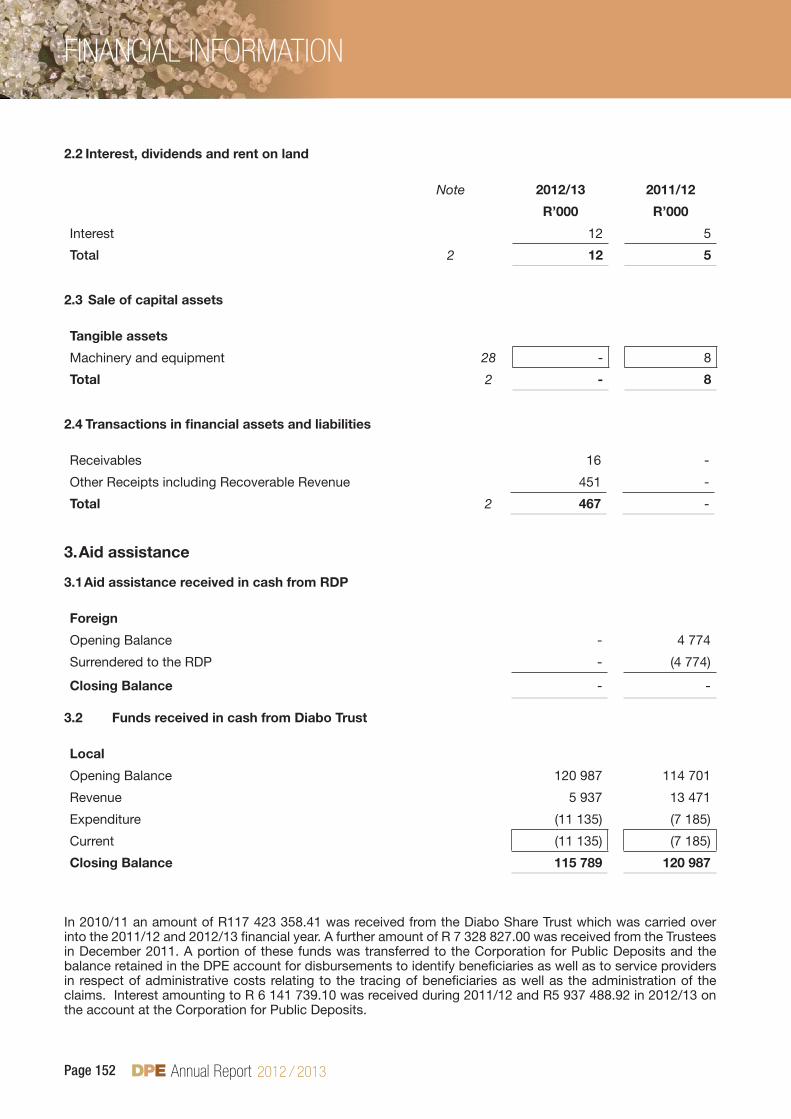
Annual Report Page 152
FINANcIAL INFORMATION
Interest, dividends and rent on land 2.2
Note 2012/13 2011/12
R’000 R’000
Interest 12 5
Total 2 12 5
Sale of capital assets2.3
Tangible assets
Machinery and equipment 28 - 8
Total 2 - 8
Transactions in financial assets and liabilities2.4
Receivables 16 -
Other Receipts including Recoverable Revenue 451 -
Total 2 467 -
Aid assistance3.
Aid assistance received in cash from RDP3.1
Foreign
Opening Balance - 4 774
Surrendered to the RDP - (4 774)
Closing Balance - -
Funds received in cash from Diabo Trust3.2
Local
Opening Balance 120 987 114 701
Revenue 5 937 13 471
Expenditure (11 135) (7 185)
Current (11 135) (7 185)
Closing Balance 115 789 120 987
In 2010/11 an amount of R117 423 358.41 was received from the Diabo Share Trust which was carried over into the 2011/12 and 2012/13 financial year. A further amount of R 7 328 827.00 was received from the Trustees in December 2011. A portion of these funds was transferred to the Corporation for Public Deposits and the balance retained in the DPE account for disbursements to identify beneficiaries as well as to service providers in respect of administrative costs relating to the tracing of beneficiaries as well as the administration of the claims. Interest amounting to R 6 141 739.10 was received during 2011/12 and R5 937 488.92 in 2012/13 on the account at the Corporation for Public Deposits.

Annual Report Page 153
FINANcIAL INFORMATION
Total assistance3.3
2012/13 2011/12
R’000 R’000
Opening Balance 120 987 119 475
Revenue 5 937 13 471
Expenditure (11 135) (7 185)
Current (11 135) (7 185)
Surrendered / Transferred to retained funds - (4 774)
Closing Balance 115 789 120 987
Analysis of balance3.4
Aid assistance unutilised 115 789 120 987
Other sources 115 789 120 987
Closing balance 115 789 120 987
Compensation of employees4.
Salaries and Wages4.1
Basic salary 61 742 58 345
Performance award 7 584 6 952
Service Based 29 123
Compensative/circumstantial 2 711 2 076
Periodic payments 2 159 575
Other non-pensionable allowances 23 035 21 537
Total 97 260 89 608
Social contributions4.2
Employer contributions
Pension 6 013 4 703
Medical 2 045 1 772
Bargaining council 9 75
Total 8 067 6 550
Total compensation of employees 105 327 96 158
Average number of employees 185 168

Annual Report Page 154
FINANcIAL INFORMATION
Goods and services 5. Note 2012/13 2011/12
R’000 R’000
Administrative fees 866 130
Advertising 1 962 1779
Assets less then R5,000 5.1 444 363
Bursaries (employees) 393 629
Catering 1 341 1135
Communication 3 741 3 286
Computer services 5.2 3 078 2 726
Consultants, contractors and agency/outsourced services 5.3 29 785 32 764
Entertainment 32 62
Audit cost – external 5.4 1 908 4 117
Fleet services 805 765
Inventory 5.5 2 960 2 238
Operating leases 1 814 1 720
Property payments 5.6 9 137 6 884
Travel and subsistence 5.7 23 499 24 328
Venues and facilities 3 327 1 937
Training and staff development 1 624 2 396
Other operating expenditure 5.8 3 618 1 643
Total 90 334 88 902
Assets less than R5,0005.1
Tangible assets 438 349
Machinery and equipment 438 349
Intangible assets 6 14
Total 5 444 363
Computer services5.2
SITA computer services 1 497 1 077
External computer service providers 1 581 1 649
Total 5 3 078 2 726

Annual Report Page 155
FINANcIAL INFORMATION
Consultants, contractors and agency/outsourced services5.3
Note 2012/13 2011/12
R’000 R’000
Business and advisory services 22 901 26 814
Legal costs 522 2 397
Contractors 2 252 1 011
Agency and support/outsourced services 4 110 2 542
Total 5 29 785 32 764
Audit cost – External 5.4
Regularity audits 1 908 2 126
Performance audits - 1 991
Total 5 1 908 4 117
Inventory5.5
Food and food supplies 112 122
Fuel, oil and gas 20 -
Other consumables 58 25
Materials and supplies 65 61
Stationery and printing 2 693 2 028
Medical supplies - 2
Medicine 12 -
Total 5 2 960 2 238
Property payments5.6
Municipal services 3 049 1 417
Property management fees 5 735 5 192
Other 353 275
Total 5 9 137 6 884
Travel and subsistence5.7
Local 22 903 24 328
Foreign 596 -
Total 5 23 499 24 328

Annual Report Page 156
FINANcIAL INFORMATION
Other operating expenditure5.8
Note 2012/13 2011/12
R’000 R’000
Learnerships 2 005 967
Professional bodies, membership and subscription fees 500 349
Resettlement costs 174 17
Other 939 310
Total 5 3 618 1 643
Payments for financial assets6. Purchase of equity 1 050 000 -
Debts written off 6.1 8 6
Total 1 050 008 6
Debts written off6.1
Nature of debts written off
Staff Debt 8 6
Total 8 6
Total debt written off 6 8 6
Transfers and subsidies7. Note
Public corporations and private enterprises Annex 1A 118 313 156 255
Households Annex 1B 232 -
Gifts, donations and sponsorships made Annex 1D 93 723
Total 118 638 156 978
Expenditure for capital assets 8.
Tangible assets 2 649 3 922
Machinery and equipment 29 2 649 3 922
Software and other intangible assets 93 149
Computer software 30 93 149
Total 2 742 4 071
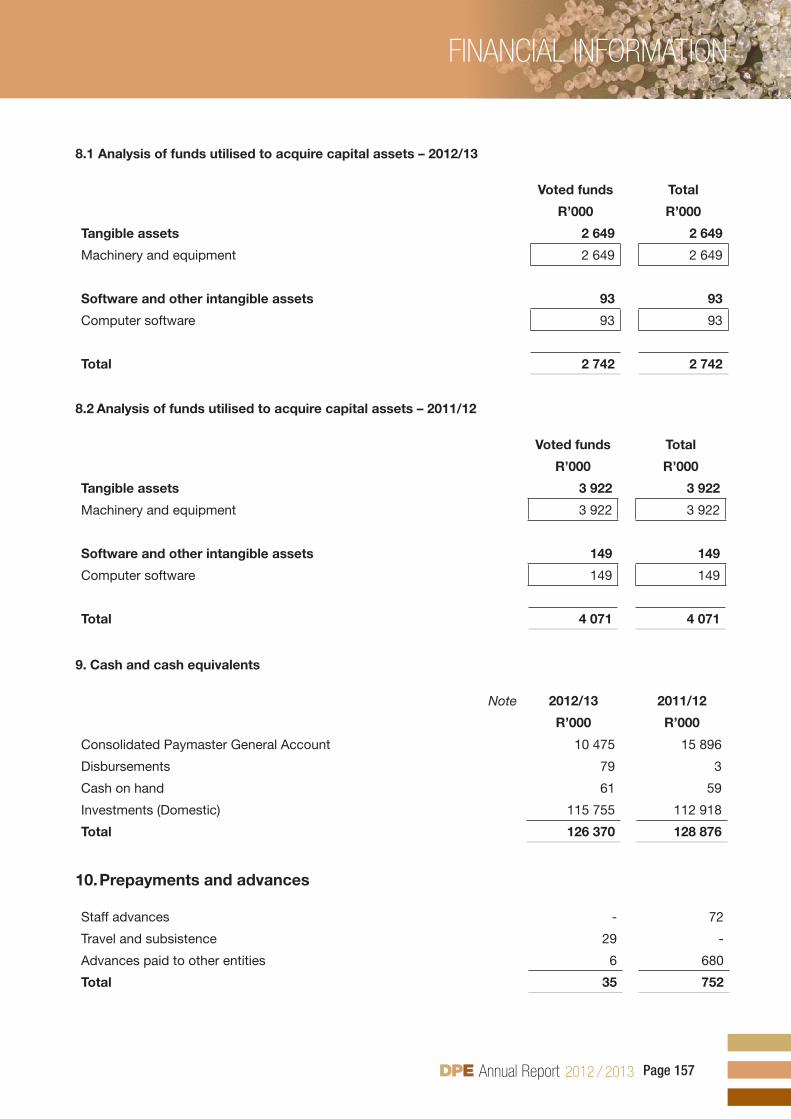
Annual Report Page 157
FINANcIAL INFORMATION
Analysis of funds utilised to acquire capital assets – 2012/138.1
Voted funds Total
R’000 R’000
Tangible assets 2 649 2 649
Machinery and equipment 2 649 2 649
Software and other intangible assets 93 93
Computer software 93 93
Total 2 742 2 742
Analysis of funds utilised to acquire capital assets – 2011/128.2
Voted funds Total
R’000 R’000
Tangible assets 3 922 3 922
Machinery and equipment 3 922 3 922
Software and other intangible assets 149 149
Computer software 149 149
Total 4 071 4 071
Cash and cash equivalents9.
Note 2012/13 2011/12
R’000 R’000
Consolidated Paymaster General Account 10 475 15 896
Disbursements 79 3
Cash on hand 61 59
Investments (Domestic) 115 755 112 918
Total 126 370 128 876
Prepayments and advances10.
Staff advances - 72
Travel and subsistence 29 -
Advances paid to other entities 6 680
Total 35 752

Annual Report Page 158
FINANcIAL INFORMATION
Advances paid10.1
Note 2012/13 2011/12
R’000 R’000
National departments Annex 7A 6 680
Total 11 6 680
Receivables11.
2012/13 2011/12
R’000 R’000 R’000 R’000 R’000
Note
Less than one year
One to three years
Older than three
yearsTotal Total
Claims recoverable11.1
Annex 4
176 36 - 212 36
Recoverable expenditure 11.2 111 - 15 126 59
Staff debt 11.3 121 75 60 256 225
Other debtors 11.4 - - - - 15
Total 408 111 75 594 335
Claims recoverable11.1
Note 2012/13 2011/12
R’000 R’000
National departments 212 36
Total 11 212 36
Recoverable expenditure (disallowance accounts)11.2
Diners Club 106 42
Cellphone Expenditure 15 15
Other 5 2
Total 11 126 59
Staff debt11.3
Bursaries 51 110
Other 205 115
Total 11 256 225
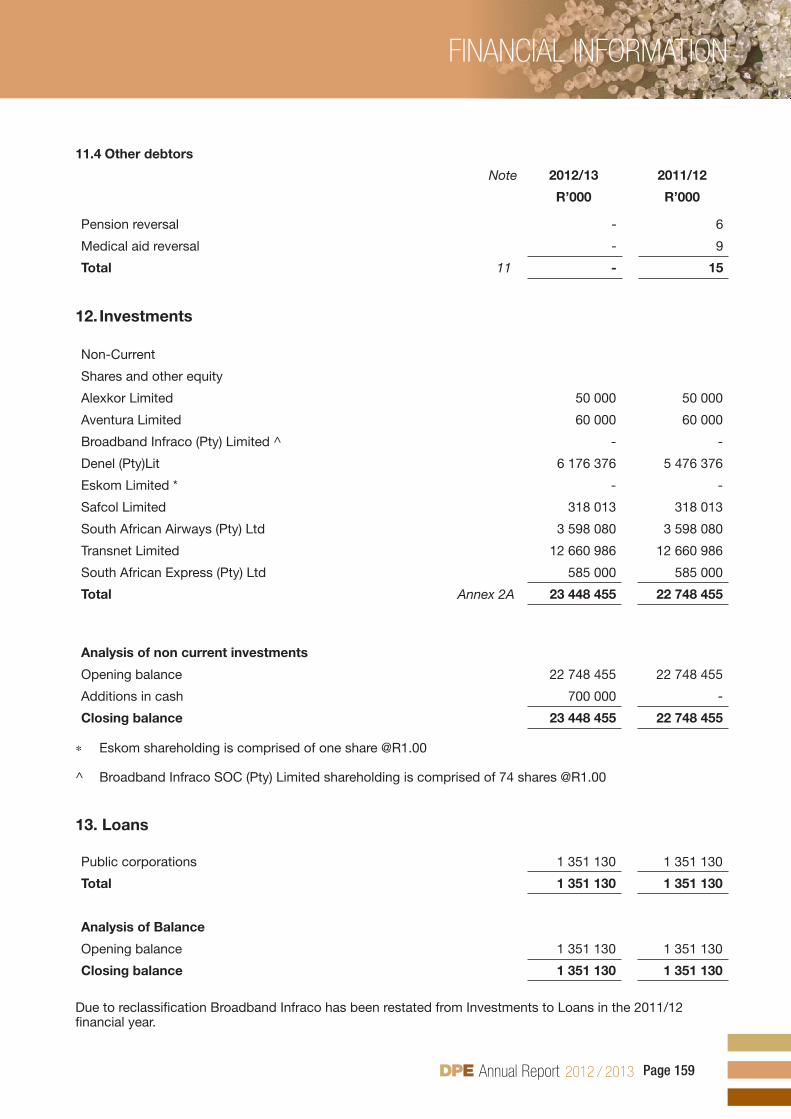
Annual Report Page 159
FINANcIAL INFORMATION
Other debtors11.4
Note 2012/13 2011/12
R’000 R’000
Pension reversal - 6
Medical aid reversal - 9
Total 11 - 15
Investments12. 13.
Non-Current
Shares and other equity
Alexkor Limited 50 000 50 000
Aventura Limited 60 000 60 000
Broadband Infraco (Pty) Limited ^ - -
Denel (Pty)Lit 6 176 376 5 476 376
Eskom Limited * - -
Safcol Limited 318 013 318 013
South African Airways (Pty) Ltd 3 598 080 3 598 080
Transnet Limited 12 660 986 12 660 986
South African Express (Pty) Ltd 585 000 585 000
Total Annex 2A 23 448 455 22 748 455
Analysis of non current investments
Opening balance 22 748 455 22 748 455
Additions in cash 700 000 -
Closing balance 23 448 455 22 748 455
Eskom shareholding is comprised of one share @R1.00∗
^ Broadband Infraco SOC (Pty) Limited shareholding is comprised of 74 shares @R1.00
13. Loans
Public corporations 1 351 130 1 351 130
Total 1 351 130 1 351 130
Analysis of Balance
Opening balance 1 351 130 1 351 130
Closing balance 1 351 130 1 351 130
Due to reclassification Broadband Infraco has been restated from Investments to Loans in the 2011/12 financial year.

Annual Report Page 160
FINANcIAL INFORMATION
Voted funds to be surrendered to the Revenue Fund14. Note 2012/13 2011/12
R’000 R’000
Opening balance 7 227 15 548
Transfer from statement of financial performance 9 709 7 227
Paid during the year (7 227) (15 548)
Closing balance 9 709 7 227
Departmental revenue and NRF Receipts to be surrendered to the Revenue Fund15.
Opening balance (52) 16
Transfer from Statement of Financial Performance 537 66
Paid during the year (475) (134)
Closing balance 10 (52)
Payables – current16.
Advances received 16.1 1 446 1 446
Clearing accounts 16.2 45 31
Other payables 16.3 - 324
Total 1 491 1 801
Advances received16.1
Description
Public Entities Annex 7B 1 446 1 446
Total 16 1 446 1 446
Clearing accounts16.2
Description
SARS 45 31
Total 16 45 31
Other payables16.3
Description
Intervista – foreign payment returned by SARB - 324
Total 16 - 324

Annual Report Page 161
FINANcIAL INFORMATION
Net cash flow available from operating activities17.
Note 2012/13 2011/12
R’000 R’000
Net surplus/(deficit) as per Statement of Financial Performance 5 048 13 579
Add back non cash/cash movements not deemed operating activities
(4 812) (15 308)
(Increase)/decrease in receivables – current (259) 1 190
(Increase)/decrease in prepayments and advances 717 (340)
Increase/(decrease) in payables – current (310) 235
Proceeds from sale of capital assets - (8)
Expenditure on capital assets 2 742 4 071
Surrenders to Revenue Fund (7 702) (15 682)
Surrenders to RDP Fund/Donor - (4 774)
Net cash flow generated by operating activities 236 (1 729)
Reconciliation of cash and cash equivalents for cash flow purposes18.
Consolidated Paymaster General account 10 475 15 896
Disbursements 79 3
Cash on hand 61 59
Cash with commercial banks (Local) 115 755 112 918
Total 126 370 128 876

Annual Report Page 162
FINANcIAL INFORMATION
12. DIsClosure notes to tHe annual fInanCIal statements for tHe Year enDeD 31 marCH 2013These amounts are not recognised in the Annual Financial Statements and are disclosed to enhance the usefulness of the Annual Financial Statements.
Contingent liabilities and contingent assets19.
Contingent liabilities19.1
Note 2012/13 2011/12
R’000 R’000
Liable to Nature
Housing loan guarantees Employees Annex 3A
52 52
Other guarantees Annex 3A
111 938 382 84 359 171
Claims against the department Annex 3B
5 276 757 5 276 638
Other departments (interdepartmental unconfirmed balances) Annex 5 119 7 972
Total 117 215 310 89 643 833
According to section 70 of the PFMA, Act 1 of 1999 (as amended by Act 29 of 1999) the Department is responsible for the reporting on all guarantees that were issued to Public Entities under its control. Any payment under a guarantee will be a direct charge against the National Revenue fund via the Department.
Commitments20.
Note 2012/13 2011/12
R’000 R’000
Current expenditure
Approved and contracted 17 890 12 589
Approved but not contracted 3 480 -
Total Commitments 21 370 12 589
An amount of R 5 732 880 is included in the above for commitments longer than one year.
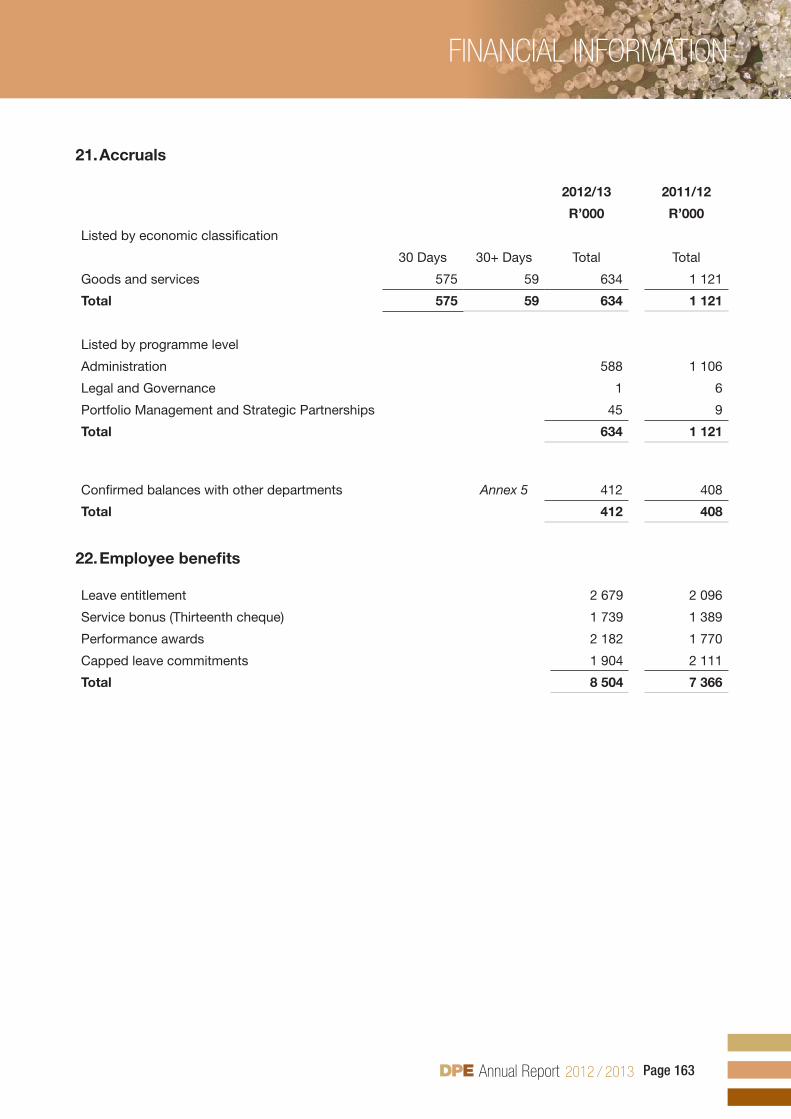
Annual Report Page 163
FINANcIAL INFORMATION
Accruals21.
2012/13 2011/12
R’000 R’000
Listed by economic classification
30 Days 30+ Days Total Total
Goods and services 575 59 634 1 121
Total 575 59 634 1 121
Listed by programme level
Administration 588 1 106
Legal and Governance 1 6
Portfolio Management and Strategic Partnerships 45 9
Total 634 1 121
Confirmed balances with other departments Annex 5 412 408
Total 412 408
Employee benefits22.
Leave entitlement 2 679 2 096
Service bonus (Thirteenth cheque) 1 739 1 389
Performance awards 2 182 1 770
Capped leave commitments 1 904 2 111
Total 8 504 7 366

Annual Report Page 164
FINANcIAL INFORMATION
Lease commitments23.
Operating leases expenditure23.1
2012/13
Machinery and
equipment Total
Not later than 1 year 466 466
Later than 1 year and not later than 5 years 489 489
Total lease commitments 955 955
2011/12
Machinery and
equipment Total
Not later than 1 year 861 861
Later than 1 year and not later than 5 years 40 40
Total lease commitments 901 901
Fruitless and wasteful expenditure24.
Reconciliation of fruitless and wasteful expenditure 24.1
Note 2012/13 2011/12
R’000 R’000
Opening balance - 4
Fruitless and wasteful expenditure relating to current year 4 -
Less: Amounts resolved (4) -
Less: Amounts transferred to receivables for recovery - (4)
Fruitless and wasteful expenditure awaiting resolution - -
Analysis of Current year’s fruitless and wasteful expenditure 24.2
Incident Disciplinary steps taken/criminal proceedings
2012/13
R’000
No show bookings for accommodation with valid reasons provided by officials. None 4
Total 4

Annual Report Page 165
FINANcIAL INFORMATION
Related party transactions25.
Payments made Note 2012/13 2011/12
R’000 R’000
Transactions in financial assets and liabilities 1 050 000 -
Transfers 118 313 156 255
Total 1 168 313 156 255
Other
Guarantees issued/received 28 593 940 11 342 432
Total 28 593 940 11 342 432
Related parties are considered to be all the State Owned Companies under the Department’s control. Transfers consist of transfers and subsidies and payment for financial assets.
Key management personnel26.
No. of Individuals 2012/13 2011/12
R’000 R’000
Political office bearers (provide detail below) 2 5 554 3 337
Officials: (Minister and two Dep. Ministers)
Level 15 to 16 12 6 799 11 460
Level 14 (incl. level 13 that were acting at level 14) 26 21 467 13 554
Total 40 33 820 28 351
Impairment27.
Impairment
Investments 1 224 659 2 458 286
Total 1 224 659 2 458 286
The impairments are estimates as these figures are based on provisional amounts and are still subject to the SOE External Audit Process and may change during this process.
At the beginning of 2008/09, the Aventura investment was fully impaired to R60 million.
The Alexkor investment was fully impaired to R50 million in 2008/09.
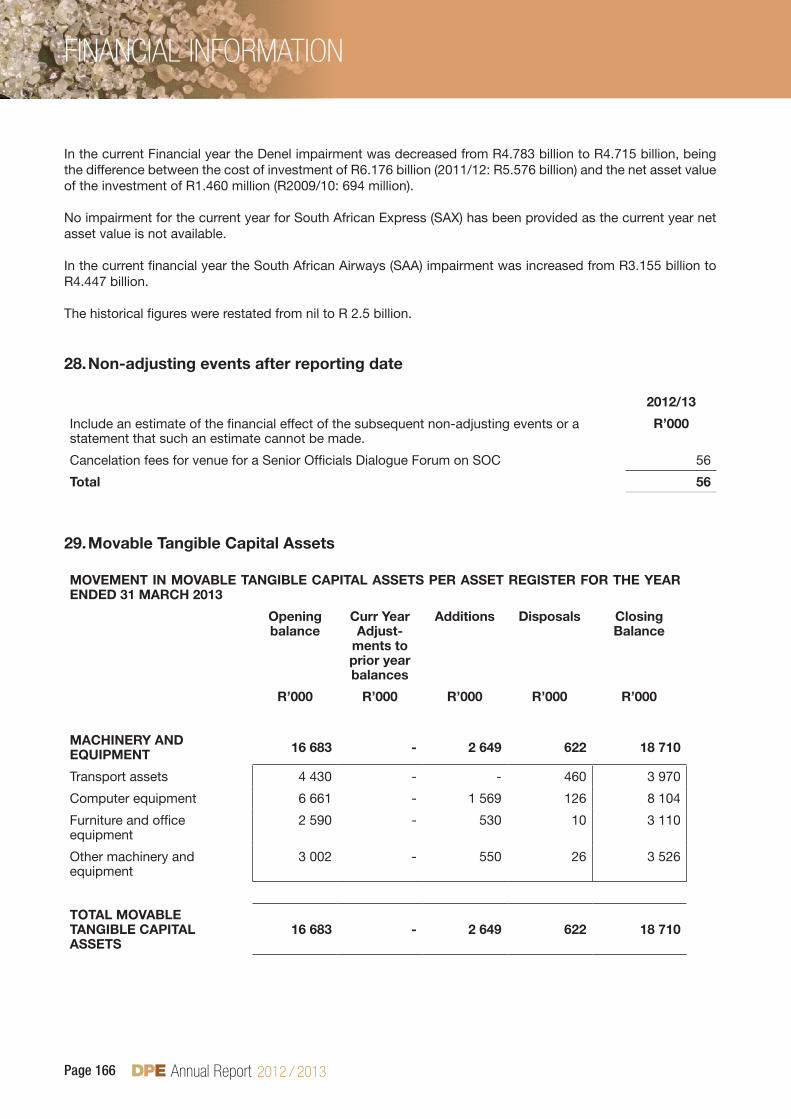
Annual Report Page 166
FINANcIAL INFORMATION
In the current Financial year the Denel impairment was decreased from R4.783 billion to R4.715 billion, being the difference between the cost of investment of R6.176 billion (2011/12: R5.576 billion) and the net asset value of the investment of R1.460 million (R2009/10: 694 million).
No impairment for the current year for South African Express (SAX) has been provided as the current year net asset value is not available.
In the current financial year the South African Airways (SAA) impairment was increased from R3.155 billion to R4.447 billion.
The historical figures were restated from nil to R 2.5 billion.
Non-adjusting events after reporting date28.
2012/13
Include an estimate of the financial effect of the subsequent non-adjusting events or a statement that such an estimate cannot be made.
R’000
Cancelation fees for venue for a Senior Officials Dialogue Forum on SOC 56
Total 56
Movable Tangible Capital Assets29.
MOVEMENT IN MOVABLE TANGIBLE CAPITAL ASSETS PER ASSET REGISTER FOR THE YEAR ENDED 31 MARCH 2013
Opening balance
Curr Year Adjust-
ments to prior year balances
Additions Disposals Closing Balance
R’000 R’000 R’000 R’000 R’000
MACHINERY AND EQUIPMENT 16 683 - 2 649 622 18 710
Transport assets 4 430 - - 460 3 970
Computer equipment 6 661 - 1 569 126 8 104
Furniture and office equipment
2 590 - 530 10 3 110
Other machinery and equipment
3 002 - 550 26 3 526
TOTAL MOVABLE TANGIBLE CAPITAL ASSETS
16 683 - 2 649 622 18 710

Annual Report Page 167
FINANcIAL INFORMATION
29.1 Additions
ADDITIONS TO MOVABLE TANGIBLE CAPITAL ASSETS PER ASSET REGISTER FOR THE YEAR ENDED 31 MARCH 2013
Cash Non-cash (Capital Work in
Progress current
costs and finance lease
payments)
Received current, not paid
(Paid current
year, received
prior year)
Total
R’000 R’000 R’000 R’000 R’000
MACHINERY AND EQUIPMENT 2 649 - - - 2 649
Transport assets - - - - -
Computer equipment 1 569 - - - 1 569
Furniture and office equipment 530 - - - 530
Other machinery and equipment 550 - - - 550
TOTAL ADDITIONS TO MOVABLE TANGIBLE CAPITAL ASSETS 2 649 - - - 2 649
29.2 Disposals
DISPOSALS OF MOVABLE TANGIBLE CAPITAL ASSETS PER ASSET REGISTER FOR THE YEAR ENDED 31 MARCH 2013
Sold for cash
Transfer out or
destroyed or
scrapped
Total disposals
Cash Received
Actual
R’000 R’000 R’000 R’000
MACHINERY AND EQUIPMENT - 622 622 -
Transport assets - 460 460 -
Computer equipment - 126 126 -
Furniture and office equipment - 10 10 -
Other machinery and equipment - 26 26 -
TOTAL DISPOSAL OF MOVABLE TANGIBLE CAPITAL ASSETS - 622 622 -

Annual Report Page 168
FINANcIAL INFORMATION
29.3 Movement for 2011/12
MOVEMENT IN MOVABLE TANGIBLE CAPITAL ASSETS PER ASSET REGISTER FOR THE YEAR ENDED 31 MARCH 2012
Opening balance
Additions Disposals Closing balance
R’000 R’000 R’000 R’000
MACHINERY AND EQUIPMENT 14 734 3 922 1 973 16 683
Transport assets 3 253 1 569 392 4 430
Computer equipment 6 354 1 672 1 365 6 661
Furniture and office equipment 2 486 181 77 2 590
Other machinery and equipment 2 641 500 139 3 002
TOTAL MOVABLE TANGIBLE ASSETS 14 734 3 922 1 973 16 683
29.4 Minor assets
MOVEMENT IN MINOR ASSETS PER THE ASSET REGISTER FOR THE YEAR ENDED AS AT 31 MARCH 2013
Intangible assets
Machinery and
equipment
Total
R’000 R’000 R’000
Opening balance 36 3 433 3 469
Additions 6 656 662
Disposals - 73 73
TOTAL MINOR ASSETS 42 4 016 4 058
Intangible assets
Machinery and
equipment
Total
Number of R1 minor assets - 183 183
Number of minor assets at cost 13 3 083 3 096
TOTAL NUMBER OF MINOR ASSETS 13 3 266 3 279

Annual Report Page 169
FINANcIAL INFORMATION
MOVEMENT IN MINOR ASSETS PER THE ASSET REGISTER FOR THE YEAR ENDED AS AT 31 MARCH 2012
Intangible assets
Machinery and
equipment
Total
R’000 R’000 R’000
Opening balance 22 3 301 3 323
Additions 14 351 365
Disposals - 219 219
TOTAL MINOR ASSETS 36 3 433 3 469
Intangible assets
Machinery and
equipment
Total
Number of R1 minor assets - 176 176
Number of minor assets at cost 11 2 250 2 261
TOTAL NUMBER OF MINOR ASSETS 11 2 426 2 437
29.5 Movable assets written off
MOVABLE ASSETS WRITTEN OFF FOR THE YEAR ENDED AS AT 31 MARCH 2013
Intangible assets
Machinery and
equipment
Total
R’000 R’000 R’000
Assets written off - 126 126
TOTAL MOVABLE ASSETS WRITTEN OFF - 126 126
MOVABLE ASSETS WRITTEN OFF FOR THE YEAR ENDED AS AT 31 MARCH 2012
Intangible assets
Machinery and
equipment
Total
R’000 R’000 R’000
Assets written off - 193 193
TOTAL MOVABLE ASSETS WRITTEN OFF - 193 193

Annual Report Page 170
FINANcIAL INFORMATION
Intangible Capital Assets30.
MOVEMENT IN INTANGIBLE CAPITAL ASSETS PER ASSET REGISTER FOR THE YEAR ENDED 31 MARCH 2013
Opening balance
Current Year
Adjust-ments to prior year balances
Additions Disposals Closing Balance
R’000 R’000 R’000 R’000 R’000
COMPUTER SOFTWARE 1 615 - 93 - 1 708
TOTAL INTANGIBLE CAPITAL ASSETS 1 615 - 93 - 1 708
30.1 Additions
ADDITIONS TO INTANGIBLE CAPITAL ASSETS PER ASSET REGISTER FOR THE YEAR ENDED 31 MARCH 2013
Cash Non-Cash (Develop-ment work in progress
– current costs)
Received current
year, not paid(Paid
current year,
received prior year)
Total
R’000 R’000 R’000 R’000 R’000
COMPUTER SOFTWARE 93 - - - 93
TOTAL ADDITIONS TO INTANGIBLE CAPITAL ASSETS 93 - - - 93
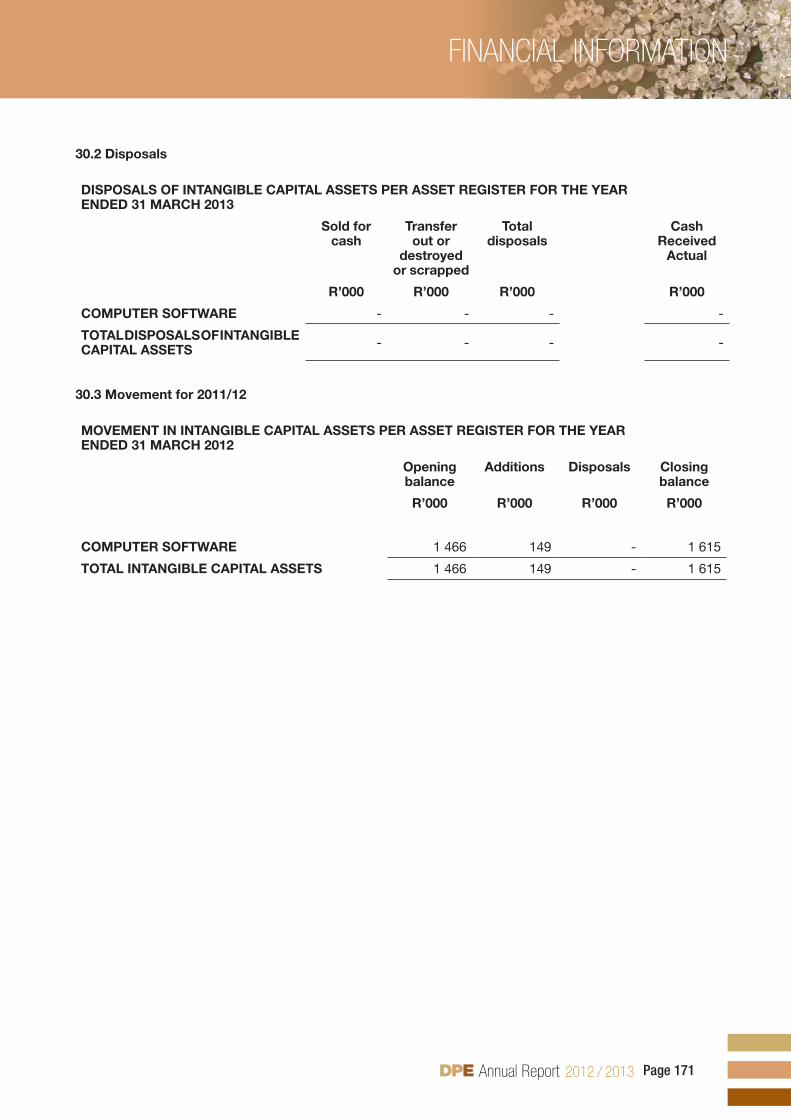
Annual Report Page 171
FINANcIAL INFORMATION
30.2 Disposals
DISPOSALS OF INTANGIBLE CAPITAL ASSETS PER ASSET REGISTER FOR THE YEAR ENDED 31 MARCH 2013
Sold for cash
Transfer out or
destroyed or scrapped
Total disposals
Cash Received
Actual
R’000 R’000 R’000 R’000
COMPUTER SOFTWARE - - - -
TOTAL DISPOSALS OF INTANGIBLE CAPITAL ASSETS - - - -
30.3 Movement for 2011/12
MOVEMENT IN INTANGIBLE CAPITAL ASSETS PER ASSET REGISTER FOR THE YEAR ENDED 31 MARCH 2012
Opening balance
Additions Disposals Closing balance
R’000 R’000 R’000 R’000
COMPUTER SOFTWARE 1 466 149 - 1 615
TOTAL INTANGIBLE CAPITAL ASSETS 1 466 149 - 1 615
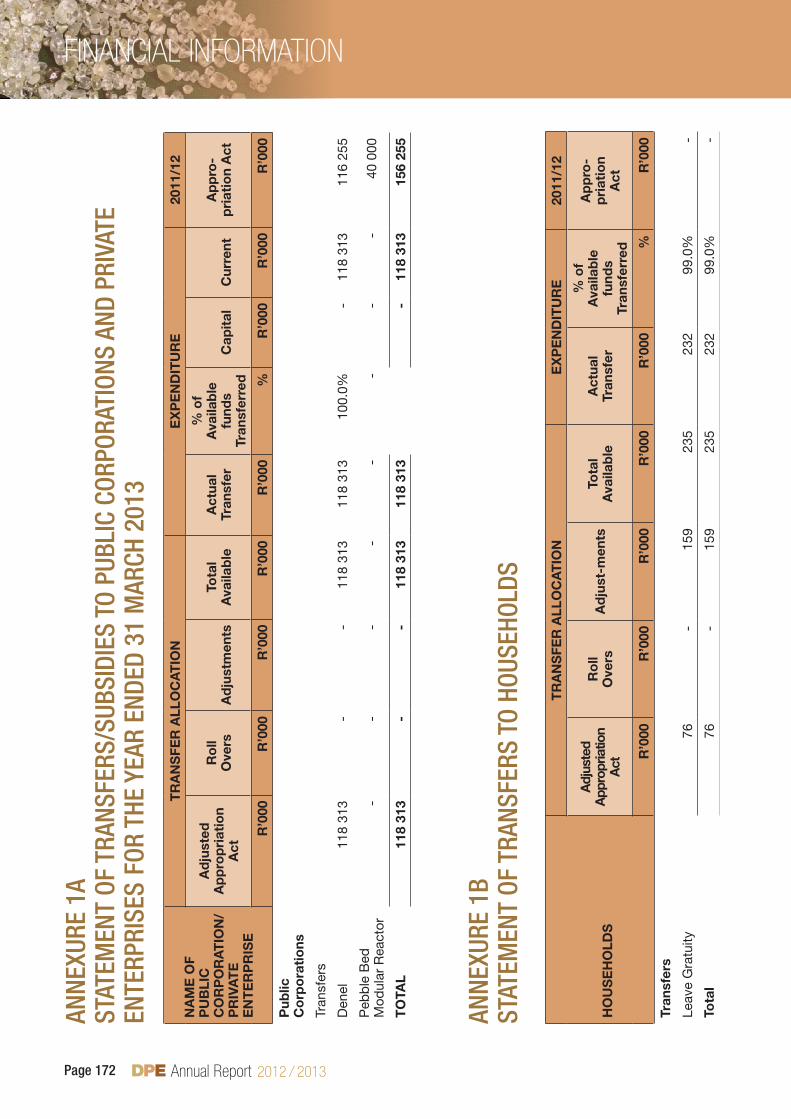
Annual Report Page 172
FINANcIAL INFORMATIONan
neXu
re 1
ast
atem
ent
of t
rans
fers
/suB
sIDI
es t
o Pu
BlIC
Cor
Pora
tIon
s an
D Pr
Ivat
e en
terP
rIse
s fo
r tH
e Ye
ar e
nDeD
31
mar
CH 2
013
NA
ME
OF
PU
BLI
C
CO
RP
OR
AT
ION
/P
RIV
AT
E
EN
TE
RP
RIS
E
TR
AN
SFE
R A
LLO
CA
TIO
NE
XP
EN
DIT
UR
E20
11/1
2
Ad
just
edA
pp
rop
riat
ion
Act
Ro
ll O
vers
A
dju
stm
ents
Tota
l A
vaila
ble
Act
ual
Tran
sfer
% o
f A
vaila
ble
fu
nds
Tran
sfer
red
C
apit
al
Cur
rent
Ap
pro
-p
riat
ion
Act
R’0
00R
’000
R’0
00R
’000
R’0
00%
R’0
00R
’000
R’0
00
Pub
lic
Co
rpo
rati
ons
Tran
sfer
s
Den
el11
8 31
3-
-11
8 31
311
8 31
310
0.0%
-11
8 31
311
6 25
5
Peb
ble
Bed
M
odul
ar R
eact
or-
--
--
--
-40
000
TO
TAL
118
313
--
118
313
118
313
-11
8 31
315
6 25
5
anne
Xure
1B
stat
emen
t of
tra
nsfe
rs t
o Ho
useH
olDs
HO
US
EH
OLD
S
TR
AN
SFE
R A
LLO
CA
TIO
NE
XP
EN
DIT
UR
E20
11/1
2
Adj
uste
dA
ppro
pria
tion
Act
Ro
ll O
vers
Ad
just
-men
tsTo
tal
Ava
ilab
leA
ctua
l Tr
ansf
er
% o
f A
vaila
ble
fu
nds
Tran
sfer
red
Ap
pro
-p
riat
ion
Act
R’0
00R
’000
R’0
00R
’000
R’0
00%
R’0
00
Tran
sfer
s
Leav
e G
ratu
ity76
-15
923
523
299
.0%
-
Tota
l76
-15
923
523
299
.0%
-

Annual Report Page 173
FINANcIAL INFORMATIONan
neXu
re 1
Cst
atem
ent
of G
Ifts
, Don
atIo
ns a
nD s
Pons
orsH
IPs
reCe
IveD
for
tHe
Year
enD
eD 3
1 m
arCH
201
3 N
AM
E O
F O
RG
AN
ISA
TIO
NN
AT
UR
E O
F G
IFT,
DO
NA
TIO
N O
R S
PO
NS
OR
SH
IP20
12/1
320
11/1
2
R’0
00R
’000
Rec
eive
d in
kin
d
Del
oitt
e.S
pon
sors
hip
for
the
Dep
artm
ent’s
Bud
get
Vote
Coc
ktai
l Eve
nt a
nd B
usin
ess
Bre
akfa
st46
2-
TO
TAL
462
-
anne
Xure
1D
stat
emen
t of
GIf
ts, D
onat
Ions
anD
sPo
nsor
sHIP
s m
aDe
anD
rem
mIs
sIon
s,
refu
nDs
anD
PaYm
ents
maD
e as
an
aCt
of G
raCe
NAT
UR
E O
F G
IFT,
DO
NAT
ION
OR
SP
ON
SO
RS
HIP
(Gro
up m
ajor
cat
egor
ies
but
list
mat
eria
l ite
ms
incl
udin
g na
me
of o
rgan
isat
ion
2012
/13
2011
/12
R’0
00R
’000
Pai
d in
cas
h
16 d
ays
of a
ctiv
ism
aga
inst
wom
en a
nd c
hild
ab
use
-63
0
Pre
toria
Car
e fo
r th
e A
ged
-31
Sou
th A
fric
an N
atio
nal C
ounc
il fo
r th
e B
lind
-31
Food
and
Tre
es fo
r A
fric
a31
-
Blin
d S
A31
-
Tshw
ane
Sch
ool o
f Mus
ic31
-
Oth
er-
31
TO
TAL
9372
3
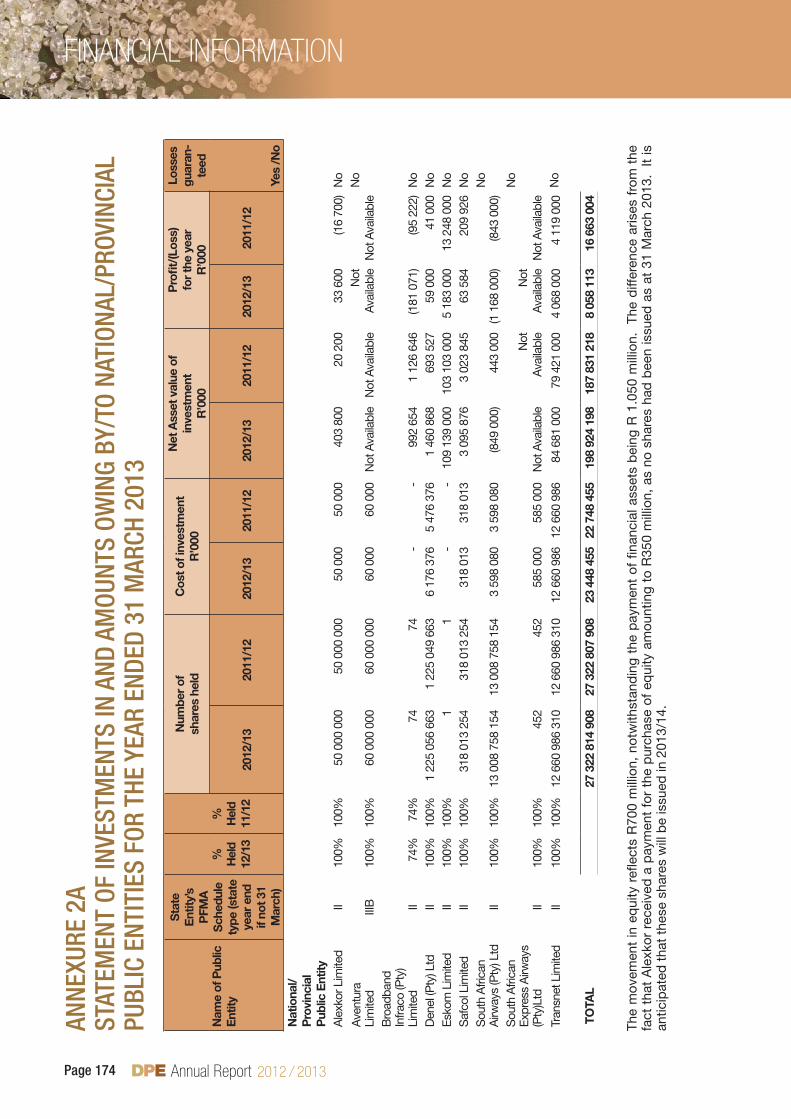
Annual Report Page 174
FINANcIAL INFORMATIONan
neXu
re 2
ast
atem
ent
of In
vest
men
ts In
anD
am
ount
s oW
InG
BY/t
o na
tIon
al/P
rovI
nCIa
l Pu
BlIC
ent
ItIe
s fo
r tH
e Ye
ar e
nDeD
31
mar
CH 2
013
Nam
e of
Pub
lic
Ent
ity
Sta
te
Ent
ity’s
P
FMA
S
ched
ule
type
(sta
te
year
end
if
not 3
1 M
arch
)
%
Hel
d
12/1
3
%
Hel
d
11/1
2
Num
ber
of
shar
es h
eld
Cos
t of i
nves
tmen
tR
’000
Net
Ass
et v
alue
of
inve
stm
ent
R’0
00
Pro
fit/(
Loss
) fo
r th
e ye
arR
’000
Loss
es
guar
an-
teed
2012
/13
2011
/12
2012
/13
2011
/12
2012
/13
2011
/12
2012
/13
2011
/12
Yes
/No
Nat
iona
l/P
rovi
ncia
l P
ublic
Ent
ityA
lexk
or L
imite
dII
100%
100%
50 0
00 0
0050
000
000
50 0
0050
000
403
800
20 2
0033
600
(16
700)
No
Ave
ntur
a Li
mite
dIII
B10
0%10
0%60
000
000
60 0
00 0
0060
000
60 0
00N
ot A
vaila
ble
Not
Ava
ilabl
eN
ot
Ava
ilabl
eN
ot A
vaila
ble
No
Bro
adba
nd
Infra
co (P
ty)
Lim
ited
II74
%74
%74
74-
-99
2 65
41
126
646
(181
071
)(9
5 22
2)N
oD
enel
(Pty
) Ltd
II10
0%10
0%1
225
056
663
1 22
5 04
9 66
36
176
376
5 47
6 37
61
460
868
693
527
59 0
0041
000
No
Esko
m L
imite
dII
100%
100%
11
--
109
139
000
103
103
000
5 18
3 00
013
248
000
No
Saf
col L
imite
dII
100%
100%
318
013
254
318
013
254
318
013
318
013
3 09
5 87
63
023
845
63 5
8420
9 92
6N
oS
outh
Afri
can
Airw
ays
(Pty
) Ltd
II10
0%10
0%13
008
758
154
13 0
08 7
58 1
543
598
080
3 59
8 08
0(8
49 0
00)
443
000
(1 1
68 0
00)
(843
000
)N
o
Sou
th A
frica
n Ex
pres
s A
irway
s (P
ty)L
tdII
100%
100%
452
452
585
000
585
000
Not
Ava
ilabl
eN
ot
Ava
ilabl
eN
ot
Ava
ilabl
eN
ot A
vaila
ble
No
Tran
snet
Lim
ited
II
100%
100%
12 6
60 9
86 3
1012
660
986
310
12 6
60 9
8612
660
986
84 6
81 0
0079
421
000
4 06
8 00
04
119
000
No
TO
TAL
27 3
22 8
14 9
0827
322
807
908
23 4
48 4
5522
748
455
198
924
198
187
831
218
8 05
8 11
316
663
004
The
mov
emen
t in
eq
uity
refl
ects
R70
0 m
illio
n, n
otw
ithst
and
ing
the
pay
men
t of
fina
ncia
l ass
ets
bei
ng R
1.0
50 m
illio
n.
The
diff
eren
ce a
rises
fro
m t
he
fact
tha
t A
lexk
or r
ecei
ved
a p
aym
ent
for
the
pur
chas
e of
eq
uity
am
ount
ing
to R
350
mill
ion,
as
no s
hare
s ha
d b
een
issu
ed a
s at
31
Mar
ch 2
013.
It
is
antic
ipat
ed t
hat
thes
e sh
ares
will
be
issu
ed in
201
3/14
.

Annual Report Page 175
FINANcIAL INFORMATION
The amount reflected in Department’s financial statements differs from the amount reflected in South African Express Airways’ financial statements due to using different accounting frameworks. The State Owned Companies report in terms of International Financial Reporting Standards (IFRS) and The Department uses Modified Cash Basis of Accounting in terms of the Financial Reporting Framework.
Department’s Financial Statements
SAX’ Financial Statements
Modified Cash Basis of Accounting
IFRS Accounting
Shares valued @ Convertible loan
Paid R140 million to acquire SAX shares R57 million -
and acquire loan - R357 million
Transferred R445 million Recapitalize SAX R445 million -
Total R585 million R502 million R357 million
Due to reclassification Broadband Infraco has been restated from Investments to Loans in the 2011/12 financial year.
The net asset value of investment and profit/loss for the year ended 31 March 2012 is based on provisional amounts and is still subject to the SOCs External Audit Processes, and may change during the process.

Annual Report Page 176
FINANcIAL INFORMATIONan
neXu
re 2
Bst
atem
ent
of In
vest
men
ts In
anD
am
ount
s oW
InG
BY/t
o en
tItI
es (C
ontI
nueD
)fo
r tH
e Ye
ar e
nDeD
31
mar
CH 2
013
Nam
e o
f P
ublic
Ent
ity
Nat
ure
of
bus
ines
s
Co
st o
f in
vest
men
tR
’000
Net
Ass
et v
alue
of
Inve
stm
ent
Am
oun
ts o
win
g t
o
Ent
itie
sR
’000
Am
oun
ts o
win
g b
y E
ntit
ies
R’0
00R
’000
2012
/13
2011
/12
2012
/13
2011
/12
2012
/13
2011
/12
2012
/13
2011
/12
Co
ntro
lled
ent
itie
s
Ale
xkor
Lim
ited
Min
ing
50 0
0050
000
403
800
20 2
00-
--
-
Ave
ntur
a Li
mite
dLe
isur
e60
000
60 0
00N
ot
Ava
ilab
leN
ot
Ava
ilab
le-
--
-
Bro
adb
and
Infr
aco
(Pty
) Li
mite
dIC
T S
ecto
r-
-99
2 65
41
126
646
--
1 35
1 13
01
351
130
Den
el (P
ty) L
tdM
anuf
actu
ring
of A
rms
6 17
6 37
65
476
376
1 46
0 86
869
3 52
7-
--
-
Esk
om L
imite
dE
nerg
y-
-10
9 13
9 00
010
3 10
3 00
0-
--
-
Saf
col L
imite
dFo
rest
ry31
8 01
331
8 01
33
095
876
3 02
3 84
5-
--
-
Sou
th A
fric
an A
irway
s (P
ty) L
tdTr
ansp
ort
3 59
8 08
03
598
080
(849
000
)44
3 00
0-
-62
708
62 7
08
Sou
th A
fric
an E
xpre
ss
Airw
ays
(Pty
)Ltd
Tran
spor
t58
5 00
058
5 00
0N
ot
Ava
ilab
leN
ot
Ava
ilab
le-
--
-
Tran
snet
Lim
ited
Tr
ansp
ort
12 6
60 9
8612
660
986
84 6
81 0
0079
421
000
--
--
TO
TAL
23
448
455
22 7
48 4
5519
8 92
4 19
818
7 83
1 21
8-
-1
413
838
1 41
3 83
8

Annual Report Page 177
FINANcIAL INFORMATIONan
neXu
re 3
ast
atem
ent
of f
Inan
CIal
Gua
rant
ees
Issu
eD
as a
t 31
mar
CH 2
013
– lo
Cal
Gua
rant
or
inst
itutio
nG
uara
ntee
in
resp
ect o
f
Ori
gina
l gu
aran
teed
ca
pita
l am
ount
Ope
ning
ba
lanc
e 1
Apr
il 20
12
Gua
rant
ees
draw
dow
nsdu
ring
the
year
Gua
rant
ees
repa
ymen
ts/
canc
elle
d/
redu
ced/
re
leas
ed
duri
ng th
e ye
ar
Rev
alua
tions
Clo
sing
ba
lanc
e31
Mar
ch
2013
Gua
rant
eed
in
tere
st fo
r ye
ar e
nded
31
Mar
ch
2013
Rea
lised
lo
sses
not
re
cove
rabl
e i.e
. cla
ims
paid
out
R’0
00R
’000
R’0
00R
’000
R’0
00R
’000
R’0
00R
’000
Hou
sing
Firs
t Nat
iona
l B
ank
Em
ploy
ees
6215
--
-15
--
NE
DC
OR
Em
ploy
ees
9037
--
-37
--
Sub
tota
l15
252
--
-52
--
Oth
er
SA
AS
AA
reca
pita
lisat
ion
1 30
0 00
01
300
000
--
-1
300
000
--
Fina
ncia
l sus
tain
abili
ty
^1
600
000
-38
8 00
0-
-38
8 00
0-
-
Goi
ng C
once
rn5
006
000
-55
0 00
0-
-55
0 00
0
SA
XC
onve
nant
s br
each
ed43
9 00
0-
439
000
--
439
000
Wor
king
Cap
ital
100
000
-10
0 00
0-
-10
0 00
0
Den
elD
NG
04
Bon
d42
0 00
042
0 00
0-
420
000
--
DN
G 0
2 B
ond
880
000
880
000
-88
0 00
0-
-
DN
G R
550m
Bon
d55
0 00
055
0 00
0-
550
000
--
Not
e P
rogr
amm
e1
850
000
-1
850
000
--
1 85
0 00
0
Esk
omE
skom
bon
ds –
ES
33N
ote
114
202
874
9 11
2 36
7-
-23
315
241
Esk
om b
onds
– E
S26
Not
e 1
16 0
14 0
3444
8 45
412
5 47
2-
16 3
37 0
16
Esk
om b
onds
– E
S23
Not
e 1
11 8
63 3
9886
693
207
424
-11
742
667
Esk
om b
onds
– E
S18
Not
e 1
9 83
4 33
214
3 46
239
7 72
7-
9 58
0 06
7
Esk
om b
onds
– E
S15
Not
e 1
4 65
2 19
715
4 00
710
1 33
0-
4 70
4 87
4
Esk
om b
onds
– E
L15
Not
e 1
5 00
0 00
0-
--
5 00
0 00
0
Esk
om b
onds
– E
L28
Not
e 1
-3
000
000
--
3 00
0 00
0
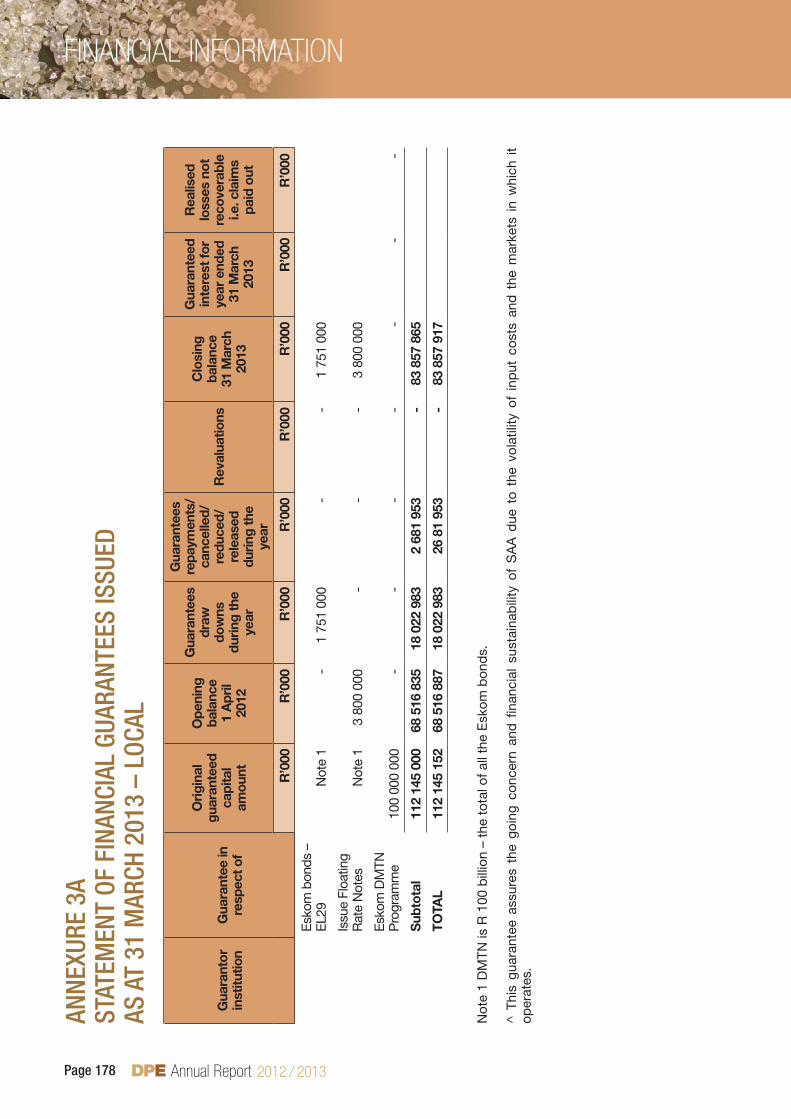
Annual Report Page 178
FINANcIAL INFORMATIONan
neXu
re 3
ast
atem
ent
of f
Inan
CIal
Gua
rant
ees
Issu
eD
as a
t 31
mar
CH 2
013
– lo
Cal
Gua
rant
or
inst
itutio
nG
uara
ntee
in
resp
ect o
f
Ori
gina
l gu
aran
teed
ca
pita
l am
ount
Ope
ning
ba
lanc
e 1
Apr
il 20
12
Gua
rant
ees
draw
do
wns
duri
ng th
e ye
ar
Gua
rant
ees
repa
ymen
ts/
canc
elle
d/
redu
ced/
re
leas
ed
duri
ng th
e ye
ar
Rev
alua
tions
Clo
sing
ba
lanc
e31
Mar
ch
2013
Gua
rant
eed
in
tere
st fo
r ye
ar e
nded
31
Mar
ch
2013
Rea
lised
lo
sses
not
re
cove
rabl
e i.e
. cla
ims
paid
out
R’0
00R
’000
R’0
00R
’000
R’0
00R
’000
R’0
00R
’000
Esk
om b
onds
–
EL2
9N
ote
1-
1 75
1 00
0-
-1
751
000
Issu
e Fl
oatin
g R
ate
Not
esN
ote
13
800
000
--
-3
800
000
Esk
om D
MTN
P
rogr
amm
e10
0 00
0 00
0-
--
--
--
Sub
tota
l11
2 14
5 00
068
516
835
18 0
22 9
832
681
953
-83
857
865
TOTA
L11
2 14
5 15
268
516
887
18 0
22 9
8326
81
953
-83
857
917
Not
e 1
DM
TN is
R 1
00 b
illio
n –
the
tota
l of a
ll th
e E
skom
bon
ds.
^ T
his
guar
ante
e as
sure
s th
e go
ing
conc
ern
and
fina
ncia
l su
stai
nab
ility
of
SA
A d
ue t
o th
e vo
latil
ity o
f in
put
cos
ts a
nd t
he m
arke
ts i
n w
hich
it
oper
ates
.

Annual Report Page 179
FINANcIAL INFORMATIONan
neXu
re 3
a (c
ontin
ued)
stat
emen
t of
fIn
anCI
al G
uara
ntee
s Is
sueD
as
at
31 m
arCH
201
3 –
fore
IGn
Gua
rant
or
inst
itutio
nG
uara
ntee
in
resp
ect o
f
Orig
inal
gu
aran
teed
ca
pita
l am
ount
Ope
ning
ba
lanc
e 1
Apr
il 20
12
Gua
rant
ees
draw
dow
nsdu
ring
the
year
Gua
rant
ees
repa
ymen
ts/
canc
elle
d/
redu
ced/
re
leas
ed
durin
g th
e ye
ar
Rev
alua
tions
Clo
sing
ba
lanc
e31
Mar
ch
2013
Gua
rant
eed
in
tere
st fo
r ye
ar e
nded
31
Mar
ch
2013
Rea
lised
lo
sses
not
re
cove
rabl
e i.e
. cla
ims
paid
out
R’0
00R
’000
R’0
00R
’000
R’0
00R
’000
R’0
00R
’000
Oth
er
Tran
snet
Euro
-Ran
d
med
ium
term
no
te (T
ranc
he
1) #
2 00
0 00
02
000
000
--
-2
000
000
Euro
-Ran
d
med
ium
term
no
te (T
ranc
he
2) #
1 50
0 00
01
500
000
--
-1
500
000
Esko
mA
FDB
Loa
n (E
uro)
10 2
62 4
5757
9 22
02
868
092
-40
3 91
13
851
223
AFD
B L
oan
(ZA
R)
10 6
30 0
005
315
398
4 61
6 70
4-
-9
932
102
Wor
ldba
nk lo
an27
770
625
5 97
2 74
83
086
161
-1
481
187
10 5
40 0
96-
AFD
B U
SD
R
enew
able
s2
145
202
--
--
--
AFD
B U
SD
R
enew
able
s80
9 51
0-
--
--
-
US
D R
enew
able
s1
992
925
--
--
--
Tota
l57
110
719
15 3
67 3
6610
570
957
-1
885
098
27 8
23 4
2125
7 09
6
# Th
e E
uro-
Ran
d m
ediu
m t
erm
not
es (T
rans
net)
are
Ran
d d
enom
inat
ed fo
reig
n lo
ans
and
the
refo
re n
ot s
ubje
cted
to
curr
ency
rev
alua
tions
.
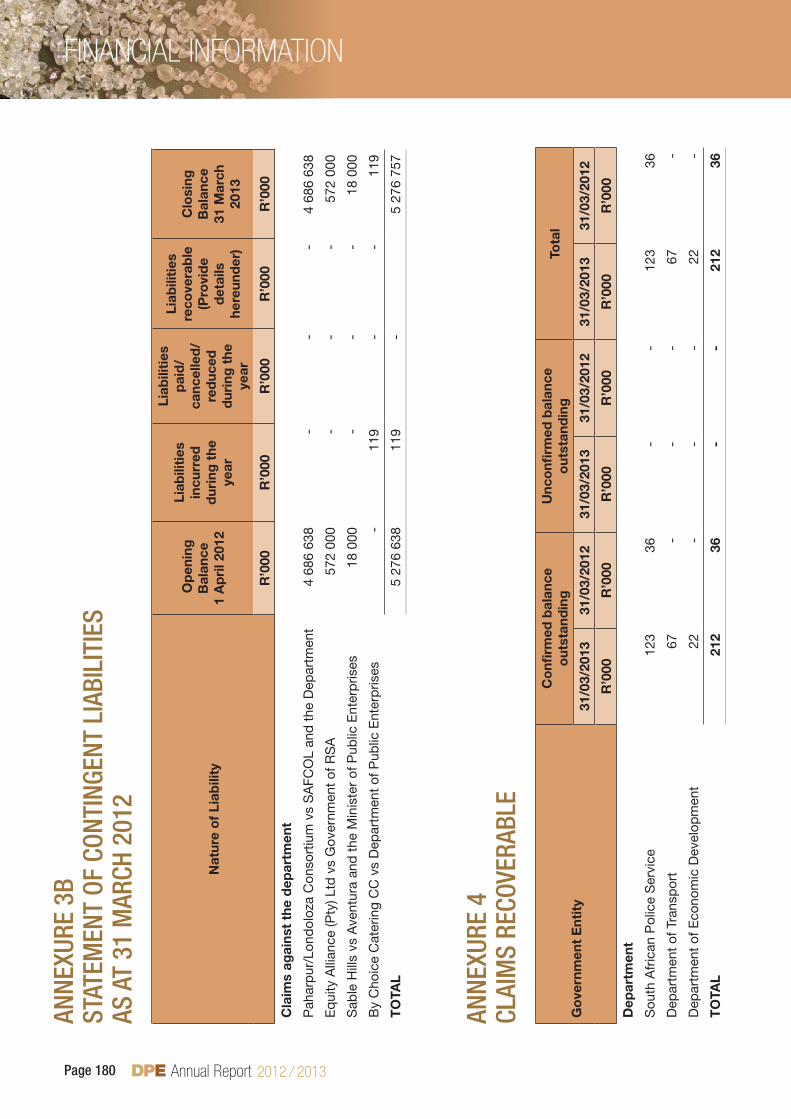
Annual Report Page 180
FINANcIAL INFORMATIONan
neXu
re 3
Bst
atem
ent
of C
ontI
nGen
t lI
aBIl
ItIe
s as
at
31 m
arCH
201
2
Nat
ure
of
Liab
ility
Op
enin
gB
alan
ce1
Ap
ril 2
012
Liab
iliti
es
incu
rred
d
urin
g t
he
year
Liab
iliti
es
pai
d/
canc
elle
d/
red
uced
d
urin
g t
he
year
Liab
iliti
es
reco
vera
ble
(P
rovi
de
det
ails
he
reun
der
)
C
losi
ngB
alan
ce31
Mar
ch
2013
R’0
00R
’000
R’0
00R
’000
R’0
00
Cla
ims
agai
nst
the
dep
artm
ent
Pah
arp
ur/L
ond
oloz
a C
onso
rtiu
m v
s S
AFC
OL
and
the
Dep
artm
ent
4 68
6 63
8-
--
4 68
6 63
8
Eq
uity
Alli
ance
(Pty
) Ltd
vs
Gov
ernm
ent
of R
SA
572
000
--
-57
2 00
0
Sab
le H
ills
vs A
vent
ura
and
the
Min
iste
r of
Pub
lic E
nter
pris
es18
000
--
-18
000
By
Cho
ice
Cat
erin
g C
C v
s D
epar
tmen
t of
Pub
lic E
nter
pris
es-
119
--
119
TO
TAL
5 27
6 63
811
9-
5 27
6 75
7
anne
Xure
4Cl
aIm
s re
Cove
raBl
e
Go
vern
men
t E
ntit
y
Co
nfirm
ed b
alan
ce
out
stan
din
gU
nco
nfirm
ed b
alan
ce
out
stan
din
gTo
tal
31/0
3/20
1331
/03/
2012
31/0
3/20
1331
/03/
2012
31/0
3/20
1331
/03/
2012
R’0
00R
’000
R’0
00R
’000
R’0
00R
’000
Dep
artm
ent
Sou
th A
fric
an P
olic
e S
ervi
ce12
336
--
123
36
Dep
artm
ent
of T
rans
por
t67
--
-67
-
Dep
artm
ent
of E
cono
mic
Dev
elop
men
t22
--
-22
-
TO
TAL
212
36-
-21
236
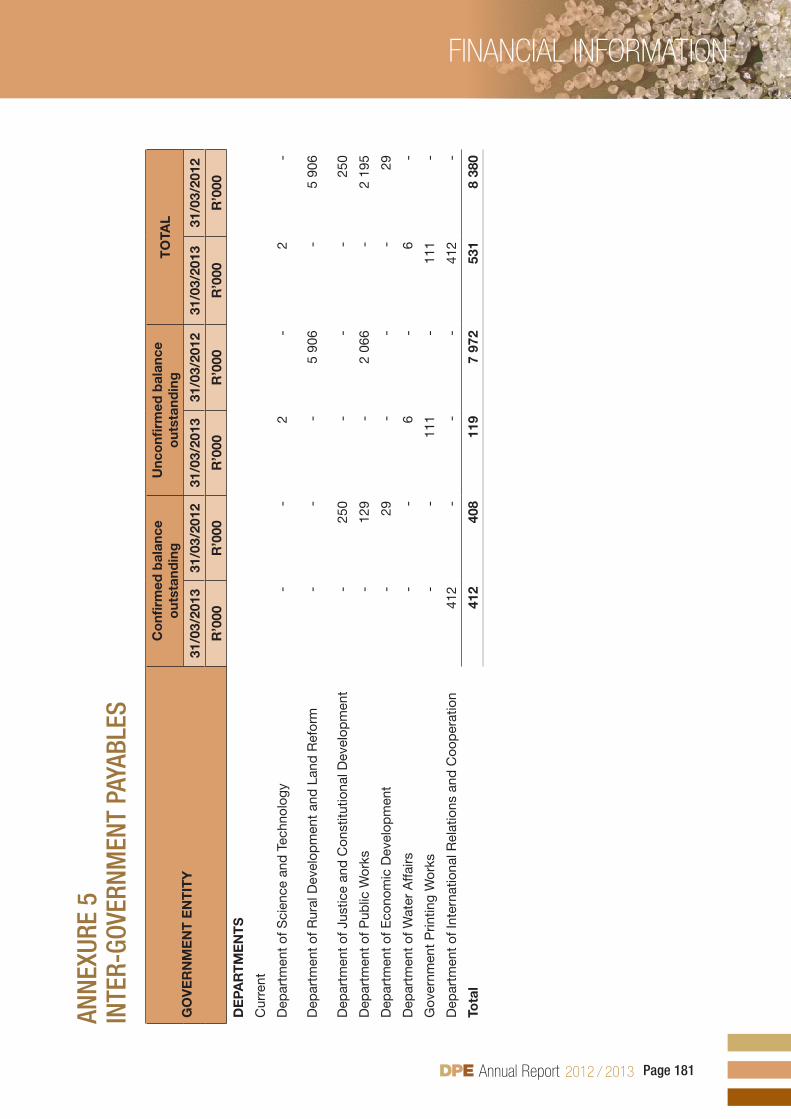
Annual Report Page 181
FINANcIAL INFORMATIONan
neXu
re 5
Inte
r-Go
vern
men
t Pa
YaBl
es
GO
VE
RN
ME
NT
EN
TIT
Y
Co
nfirm
ed b
alan
ce
out
stan
din
gU
nco
nfirm
ed b
alan
ce
out
stan
din
gT
OTA
L
31/0
3/20
1331
/03/
2012
31/0
3/20
1331
/03/
2012
31/0
3/20
1331
/03/
2012
R’0
00R
’000
R’0
00R
’000
R’0
00R
’000
DE
PAR
TM
EN
TS
Cur
rent
Dep
artm
ent
of S
cien
ce a
nd T
echn
olog
y-
-2
-2
-
Dep
artm
ent
of R
ural
Dev
elop
men
t an
d L
and
Ref
orm
--
-5
906
-5
906
Dep
artm
ent
of J
ustic
e an
d C
onst
itutio
nal D
evel
opm
ent
-25
0-
--
250
Dep
artm
ent
of P
ublic
Wor
ks-
129
-2
066
-2
195
Dep
artm
ent
of E
cono
mic
Dev
elop
men
t-
29-
--
29
Dep
artm
ent
of W
ater
Affa
irs-
-6
-6
-
Gov
ernm
ent
Prin
ting
Wor
ks-
-11
1-
111
-
Dep
artm
ent
of In
tern
atio
nal R
elat
ions
and
Coo
per
atio
n41
2-
--
412
-
Tota
l41
240
811
97
972
531
8 38
0

Annual Report Page 182
FINANcIAL INFORMATION
anneXure 6InventorY
InventoryNote Quantity 2012/13 Quantity 2011/12
R’000 R’000
Opening balance 180 34 67 10
Add/(Less): Adjustments to prior year balance - - - 16
Add: Additions/Purchases - Cash 20 863 1 003 30 529 768
(Less): Issues (20 859) (1 010) (30 416) (761)
Add/(Less): Adjustments - (4) - 1
Closing balance 184 23 180 34
anneXure 7aInter-entItY aDvanCes (note 10)
GOVERNMENT ENTITY
Confirmed balance outstanding
Unconfirmed balance outstanding
TOTAL
31/03/2013 31/03/2012 31/03/2013 31/03/2012 31/03/2013 31/03/2012
R’000 R’000 R’000 R’000 R’000 R’000
DEPARTMENTS
Current
Department of International Relations and Cooperation
6 680 - - 6 680
Total 6 680 - - 6 680
anneXure 7BInter-entItY aDvanCes reCeIveD (note 15)
GOVERNMENT ENTITY
Confirmed balance outstanding
Unconfirmed balance outstanding
TOTAL
31/03/2013 31/03/2012 31/03/2013 31/03/2012 31/03/2013 31/03/2012
R’000 R’000 R’000 R’000 R’000 R’000
PUBLICE ENTITIES
Current
16 Days activism against women and child abuse 1 446 1 446 - - 1 446 1 446
Total 1 446 1 446 - - 1 446 1 446

NOTEs

NOTEs
RP226/2013ISBN: 978-0-621-42088-3
Suite 301, Infotech Building, 1090 Arcadia Street, 0083 Private bag X 15Hatfield0028
Pretoria Tel: 012 431 1000 Fax: 086 501 2624
Cape Town Tel: 021 469 6760 Fax: 021 461 1741
www.dpe.gov.za