Annual Report 2018 - shinkawa.com€¦ · applications with the spread of cloud computing, IoT and...
28
For the Year Ended March 31, 2018 Annual Report 2018
Transcript of Annual Report 2018 - shinkawa.com€¦ · applications with the spread of cloud computing, IoT and...
For the Year Ended March 31, 2018
Annual Report 2018
010_0288501373006.indd 2 2018/09/05 10:16:41
<SHASHI> is …
Contents
a word we coined which means “Resolution of Vision as a company.”Shinkawa celebrated its 50th anniversary in August, 2009. At this turning point, we decided to establish <SHASHI> composed of a Corporate Mission and an Action Philosophy which are aimed at producing a forward technological leap in the coming 50 years.
ChallengeWe value the spirit to keep challenging assumed limits.It is important to have the courage not to fear failure and the passion never to give up while having a sense of purpose.We believe that to continue challenging our limits will transform our dreams, ideals and hopes into reality.
ChangeWe value openness to changing times and surrounding realities, and in turn change ourselves in corresponding ways.It is important to think and act subjectively while adopting a broad view and flexible thinking, determining the cause of change and future direction.We believe that we can open up new opportunities through our continuous openness to change.
CollaborationWe value the spirit of collaboration to work together in concert.We have a diversity of backgrounds such as nationalities, experiences, sense of values, etc. That’s what makes it important to share common goals and to be interconnected at work.We believe that thinking and working together will elicit a joy of accomplishment and feeling of trust, eventually resulting in accomplishment of a major goal which could never have been achieved by one person.
Shinkawa will cultivate robot technology and continue to suggest cutting-edge technology to realize a society where people can dream and hope while exercising creativity, and also realize an environment where people can challenge their limits.
“Shinkawa leads in robot technology to contribute to society which allows the human being to be more creative.”Corporate Mission
We move forward by fulfilling our commitments below without being bound by superficial events and customary practices, pursuing “what the essence is” with sincerity.
We think it is important to have the attitude of constantly pursuing the essence at the base of every action.Action Philosophy
SHASHI / Contents 1
Financial Highlights 2
Top Message 3
Special Feature 4
Review of Management 7
Research and Development Activities 9
Commitment to CSR 10
Corporate Governance 11
Directors, Operating Officers and Corporate Auditors 14
Main Risks and Uncertainties 15
Financial Summary 17
Financial Data 19
Product Introduction 23
Group Companies 24
History of SHINKAWA 25
Corporate Information / Investor Information 26
Annual Report 2018
1
010_0288501373006.indd 1 2018/09/05 10:16:41
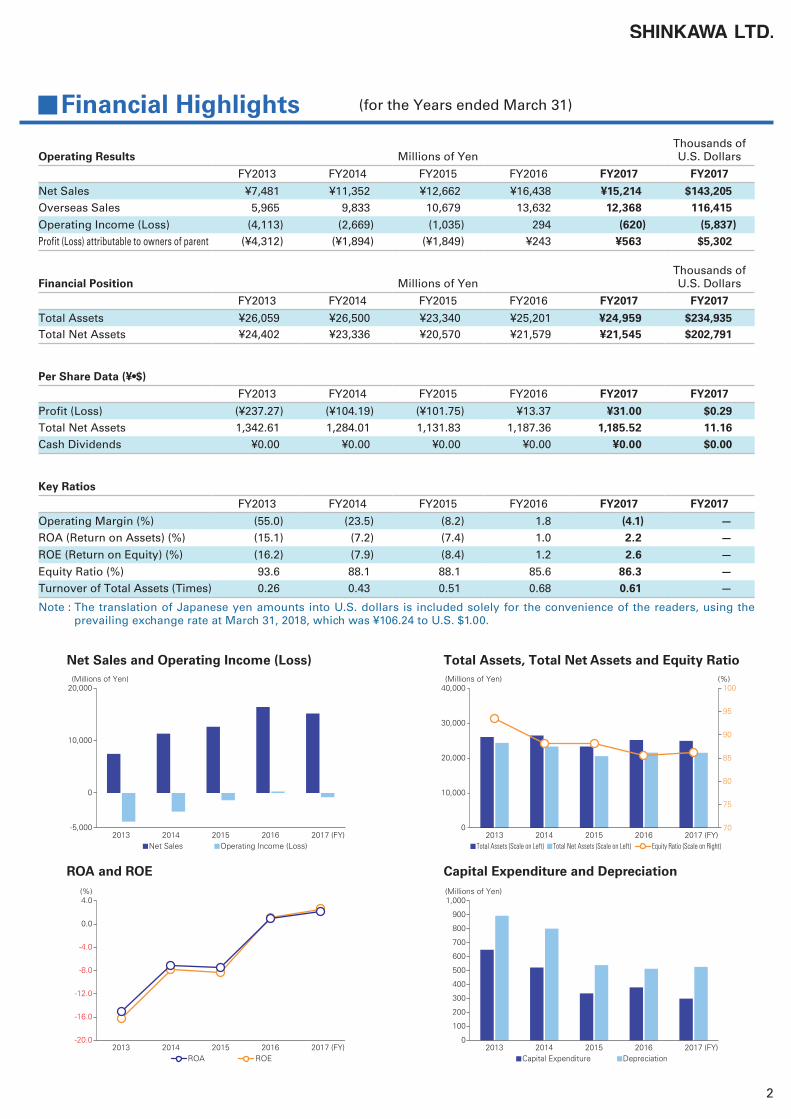
Financial Highlights (for the Years ended March 31)
Operating Results Millions of YenThousands of U.S. Dollars
FY2013 FY2014 FY2015 FY2016 FY2017 FY2017
Net Sales ¥7,481 ¥11,352 ¥12,662 ¥16,438 ¥15,214 $143,205 Overseas Sales 5,965 9,833 10,679 13,632 12,368 116,415
Operating Income (Loss) (4,113) (2,669) (1,035) 294 (620) (5,837)Profit (Loss) attributable to owners of parent (¥4,312) (¥1,894) (¥1,849) ¥243 ¥563 $5,302
Financial Position Millions of YenThousands of U.S. Dollars
FY2013 FY2014 FY2015 FY2016 FY2017 FY2017
Total Assets ¥26,059 ¥26,500 ¥23,340 ¥25,201 ¥24,959 $234,935 Total Net Assets ¥24,402 ¥23,336 ¥20,570 ¥21,579 ¥21,545 $202,791
Per Share Data (¥•$)
FY2013 FY2014 FY2015 FY2016 FY2017 FY2017
Profit (Loss) (¥237.27) (¥104.19) (¥101.75) ¥13.37 ¥31.00 $0.29 Total Net Assets 1,342.61 1,284.01 1,131.83 1,187.36 1,185.52 11.16 Cash Dividends ¥0.00 ¥0.00 ¥0.00 ¥0.00 ¥0.00 $0.00
Key Ratios
FY2013 FY2014 FY2015 FY2016 FY2017 FY2017
Operating Margin (%) (55.0) (23.5) (8.2) 1.8 (4.1) —ROA (Return on Assets) (%) (15.1) (7.2) (7.4) 1.0 2.2 —
ROE (Return on Equity) (%) (16.2) (7.9) (8.4) 1.2 2.6 —
Equity Ratio (%) 93.6 88.1 88.1 85.6 86.3 —Turnover of Total Assets (Times) 0.26 0.43 0.51 0.68 0.61 —
Note : The translation of Japanese yen amounts into U.S. dollars is included solely for the convenience of the readers, using the prevailing exchange rate at March 31, 2018, which was ¥106.24 to U.S. $1.00.
Net Sales and Operating Income (Loss)
ROA and ROE
Total Assets, Total Net Assets and Equity Ratio
Capital Expenditure and Depreciation
-5,0002013
Net Sales
(Millions of Yen)
Operating Income (Loss)2014 2015 2016 2017 (FY)
0
10,000
20,000
2013
(%)
2014 2015 2016 2017 (FY)ROEROA
-20.0
-16.0
-12.0
-8.0
-4.0
0.0
4.0
02013
Total Assets (Scale on Left)
(Millions of Yen) (%)
Total Net Assets (Scale on Left)2014 2015 2016 2017 (FY)
40,000
10,000
20,000
30,000
Equity Ratio (Scale on Right)
70
75
80
85
90
95
100
2013Capital Expenditure
(Millions of Yen)
Depreciation2014 2015 2016 2017 (FY)
0
100
200
300
400
500
600
700
800
900
1,000
2
010_0288501373006.indd 2 2018/09/05 10:16:42
Top Message
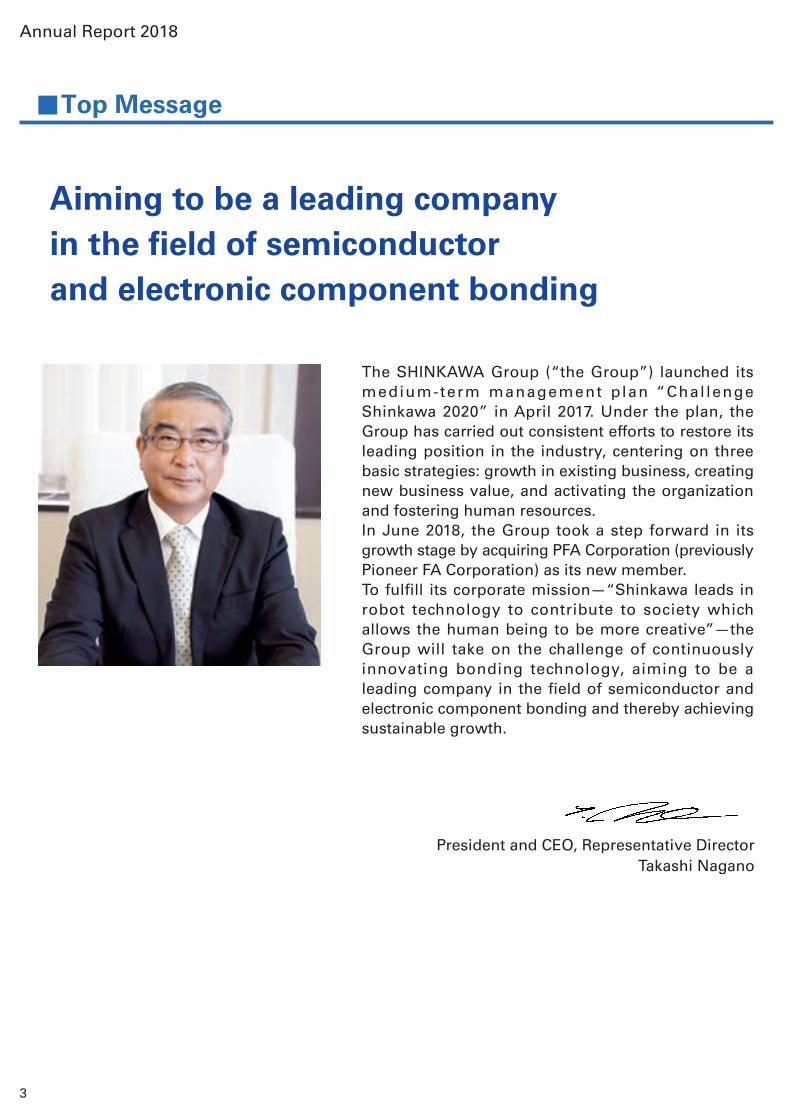
Aiming to be a leading company in the field of semiconductor and electronic component bonding
The SHINKAWA Group (“the Group”) launched its medium-term management plan “Chal lenge Shinkawa 2020” in April 2017. Under the plan, the Group has carried out consistent efforts to restore its leading position in the industry, centering on three basic strategies: growth in existing business, creating new business value, and activating the organization and fostering human resources.In June 2018, the Group took a step forward in its growth stage by acquiring PFA Corporation (previously Pioneer FA Corporation) as its new member.To fulfill its corporate mission—“Shinkawa leads in robot technology to contribute to society which allows the human being to be more creative”—the Group will take on the challenge of continuously innovating bonding technology, aiming to be a leading company in the field of semiconductor and electronic component bonding and thereby achieving sustainable growth.
President and CEO, Representative DirectorTakashi Nagano
Annual Report 2018
3
010_0288501373006.indd 3 2018/09/05 10:16:42
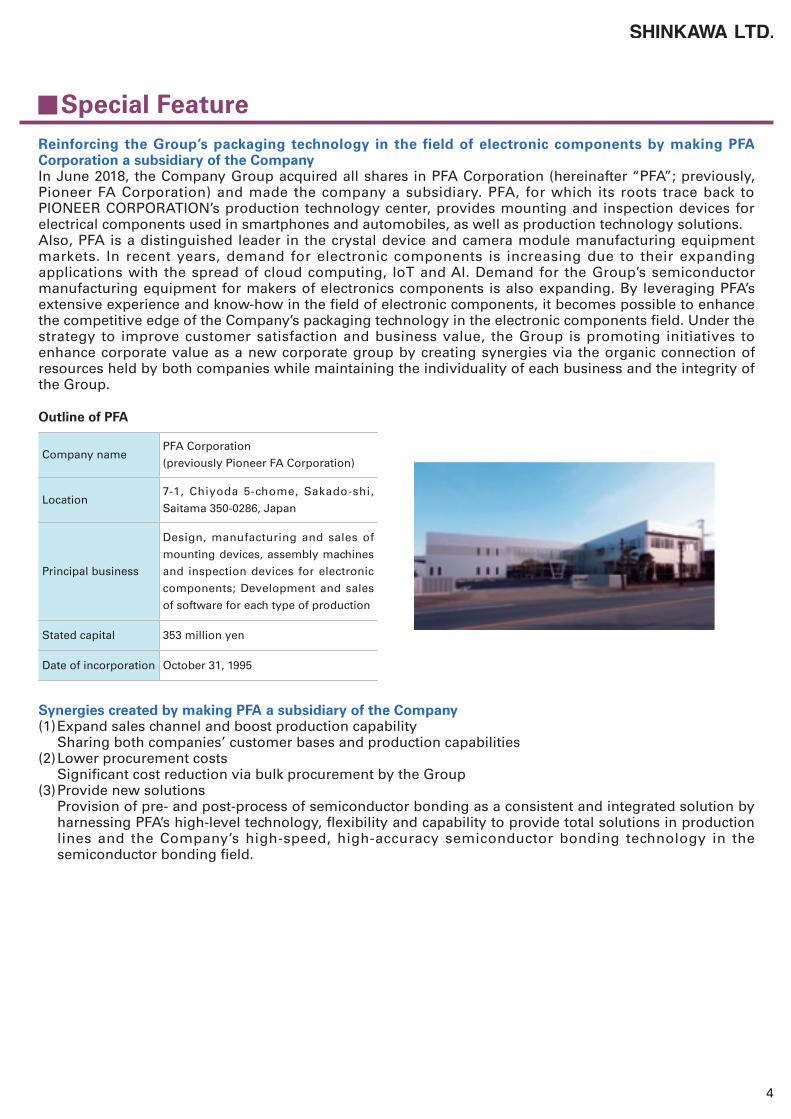
Special FeatureReinforcing the Group’s packaging technology in the field of electronic components by making PFA Corporation a subsidiary of the CompanyIn June 2018, the Company Group acquired all shares in PFA Corporation (hereinafter “PFA”; previously, Pioneer FA Corporation) and made the company a subsidiary. PFA, for which its roots trace back to PIONEER CORPORATION’s production technology center, provides mounting and inspection devices for electrical components used in smartphones and automobiles, as well as production technology solutions.Also, PFA is a distinguished leader in the crystal device and camera module manufacturing equipment markets. In recent years, demand for electronic components is increasing due to their expanding applications with the spread of cloud computing, IoT and AI. Demand for the Group’s semiconductor manufacturing equipment for makers of electronics components is also expanding. By leveraging PFA’s extensive experience and know-how in the field of electronic components, it becomes possible to enhance the competitive edge of the Company’s packaging technology in the electronic components field. Under the strategy to improve customer satisfaction and business value, the Group is promoting initiatives to enhance corporate value as a new corporate group by creating synergies via the organic connection of resources held by both companies while maintaining the individuality of each business and the integrity of the Group.
Synergies created by making PFA a subsidiary of the Company(1) Expand sales channel and boost production capability
Sharing both companies’ customer bases and production capabilities(2) Lower procurement costs
Significant cost reduction via bulk procurement by the Group(3) Provide new solutions
Provision of pre- and post-process of semiconductor bonding as a consistent and integrated solution by harnessing PFA’s high-level technology, flexibility and capability to provide total solutions in production lines and the Company’s high-speed, high-accuracy semiconductor bonding technology in the semiconductor bonding field.
Outline of PFA
Company namePFA Corporation
(previously Pioneer FA Corporation)
Location7-1, Chiyoda 5-chome, Sakado-shi,
Saitama 350-0286, Japan
Principal business
Design, manufacturing and sales of
mounting devices, assembly machines
and inspection devices for electronic
components; Development and sales
of software for each type of production
Stated capital 353 million yen
Date of incorporation October 31, 1995
4
010_0288501373006.indd 4 2018/09/05 10:16:42
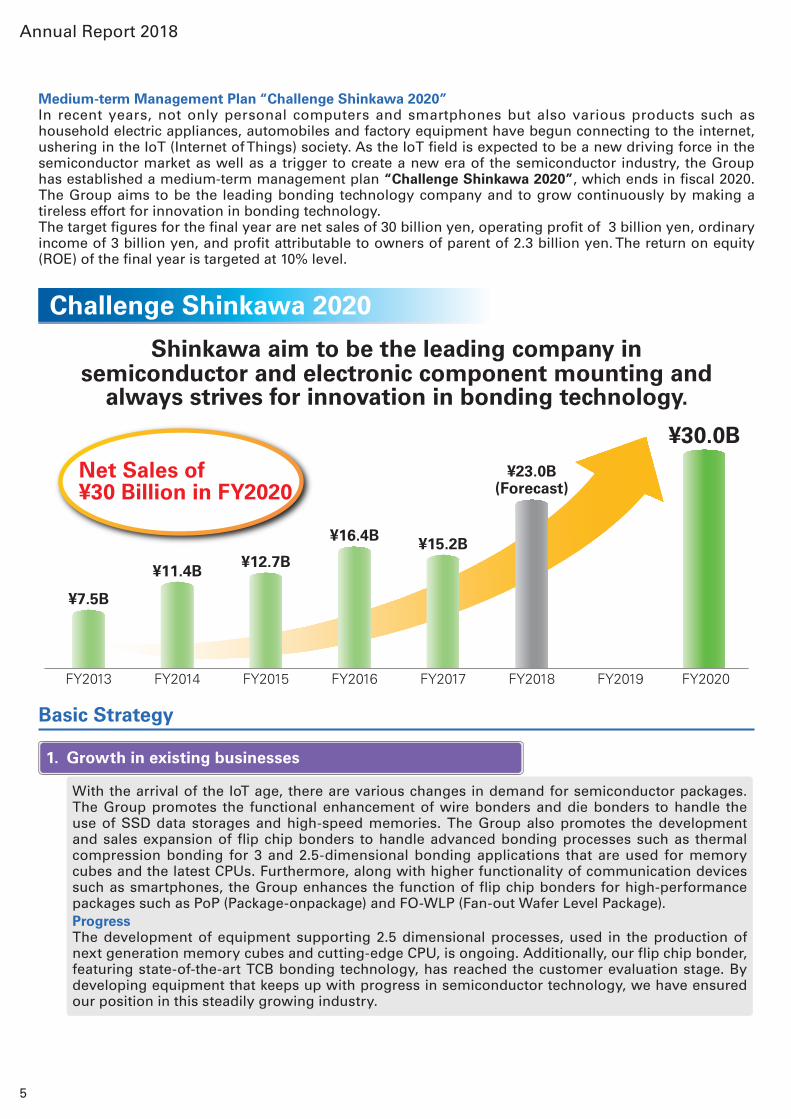
Medium-term Management Plan “Challenge Shinkawa 2020”In recent years, not only personal computers and smartphones but also various products such as household electric appliances, automobiles and factory equipment have begun connecting to the internet, ushering in the IoT (Internet of Things) society. As the IoT field is expected to be a new driving force in the semiconductor market as well as a trigger to create a new era of the semiconductor industry, the Group has established a medium-term management plan “Challenge Shinkawa 2020”, which ends in fiscal 2020. The Group aims to be the leading bonding technology company and to grow continuously by making a tireless effort for innovation in bonding technology.The target figures for the final year are net sales of 30 billion yen, operating profit of 3 billion yen, ordinary income of 3 billion yen, and profit attributable to owners of parent of 2.3 billion yen. The return on equity (ROE) of the final year is targeted at 10% level.
Shinkawa aim to be the leading company in semiconductor and electronic component mounting and
always strives for innovation in bonding technology.
Challenge Shinkawa 2020
With the arrival of the IoT age, there are various changes in demand for semiconductor packages. The Group promotes the functional enhancement of wire bonders and die bonders to handle the use of SSD data storages and high-speed memories. The Group also promotes the development and sales expansion of flip chip bonders to handle advanced bonding processes such as thermal compression bonding for 3 and 2.5-dimensional bonding applications that are used for memory cubes and the latest CPUs. Furthermore, along with higher functionality of communication devices such as smartphones, the Group enhances the function of flip chip bonders for high-performance packages such as PoP (Package-onpackage) and FO-WLP (Fan-out Wafer Level Package).ProgressThe development of equipment supporting 2.5 dimensional processes, used in the production of next generation memory cubes and cutting-edge CPU, is ongoing. Additionally, our flip chip bonder, featuring state-of-the-art TCB bonding technology, has reached the customer evaluation stage. By developing equipment that keeps up with progress in semiconductor technology, we have ensured our position in this steadily growing industry.
1. Growth in existing businesses
¥7.5B
¥11.4B¥12.7B
¥16.4B ¥15.2B
¥23.0B(Forecast)
¥30.0B
FY2013 FY2014 FY2015 FY2016 FY2017 FY2018 FY2019 FY2020
Net Sales of¥30 Billion in FY2020
Basic Strategy
Annual Report 2018
5
010_0288501373006.indd 5 2018/09/05 10:16:42

The Group, under the concept of “Shinkawa Smart Bonding Solution,” continues the development of solution technologies that incorporate the IoT function into the semiconductor assembly process. The Group will increase customer satisfaction and its associated value by promoting intelligent machines (with enhanced sensing function), intelligent networks (with enhanced data collection and analysis functions), and intelligent processes (with know-how embedded in software), as well as proposing solutions ahead of challenges triggered by progress of the IoT society.ProgressAs we move forward into the age of IoT, we are not only making progress on automating our machines, but also towards automating the factory process as a whole (referred to as Factory Automation, hereinafter “FA”). In order to strengthen our FA capabilities, the group has acquired PFA Corporation (previously known as Pioneer FA Corporation) as a fully owned subsidiary, a corporation with over 30 years of history and experience in the field of FA. With the ongoing development of Shinkawa Smart Bonding Solution, we are aiming to increase customer satisfaction and corporate value via total solution offerings.
In order to transform the Group into an organization that demonstrates creativity, it is necessary to secure various talents. In addition to providing a stage where excellent talents from all over the world play an active role, the Group focuses on human resource development including raising employees’ awareness. ProgressWith the goals of building an environment that encourages the expression of creativity, and the acquisition and growth of global talent, the Business Process Re-engineering Department is aiming to improve the implementation and mobility of internal systems. The introduction of a business unit structure and transformation of the organizational structure is currently underway.
3. Activating organization and fostering human resources
2. Creating new business value
Environment
• Creating a life cycle of products (Expansion of secondhand and refurbishment business)
• Reduction of Co2 emissions from product use (Less power consumption)
• Reduction of Co2 emissions from production
• Environmentally conscious products and services
Society
• Customer support• Occupational safety and health
• Work–life balance• Improvement of working environment of overseas suppliers
• Contribution to local societies• Promoting diversity
Governance
• Corporate Governance and internal control
• Global management system• Directors’ remuneration and incentive
• Composition of board of directors
• Thorough compliance• Risk management and visualization of potential risks
• Business continuity planning (BCP)
• Information security
Approach ESG
6
010_0288501373006.indd 6 2018/09/05 10:16:42
Results of Operations for the Fiscal Year ended March 31, 2018
Review of Management
During the fiscal year ended March 31, 2018, the global economy was on an expanding trend owing to steady growth of the employment and income environment of the United States and Europe as well as acceleration of consumer spending, although there have been growing concerns about geopolitical risks and protectionist policies.The economies of China and emerging countries were also generally stable based on strong external demand and an increase in exports supported by the favorable trend of the global economy. In the electronics industry, along with the spread of IoT, investments in high-speed wireless communications continued, and capital investment for automotive devices and discrete devices also grew favorably. On the other hand, although the Chinese smartphone market was expected to expand with the introduction of new products, demand for mobile-related products was weak due to an inventory adjustment triggered by a decrease in consumer spending. In addition, there has been no change in long-term expectations for vigorous demand for NAND flash supported by larger capacity smartphone and SSD servers. However, capital investments by memory makers were delayed due to concerns about short-term supply-demand balance of NAND flash.
Under these circumstances, the SHINKAWA group has promoted new products to existing customers, carried out a sales plan targeting specific markets, and focused on obtaining new customers. Limited results were achieved such as market penetration of flip chip bonder YSB55w and bump bonder SBB-5200. However, they did not contribute significantly to overall sales due to other reasons such as prolonged performance evaluations on the package bonder FPB-1 series. Moreover, longer-than-usual procurement lead-time of key parts has slowed down the production of die bonders and flip chip bonders, resulting in failure to meet the sales target. Securing the supply chain has been more important in this business environment. As for the consolidated performance of the Group for the fiscal year ended March 31, 2018, net sales decreased 7.4% from the corresponding period of the previous fiscal year to 15,214 million yen. An operating loss of 6 2 0 million yen was recorded compared with an operating profit of 294 million yen for the previous fiscal year and an ordinary loss of 488 million yen was posted compared with an ordinary profit of 432 million yen a year earlier. As a result, profit attributable to owners of parent increased by 131.8% from the previous year to 563 million yen.
Operating Results for the Fiscal Year Ended March 31, 20181. Net salesNet sales in fiscal 2017 were 15,214 million yen, a 7.4% decrease compared with the last fiscal year. Domestic sales amounted to 2,846 million yen, a 1.4% increase compared with last fiscal year, and foreign sales were 12,368 million yen, a 9.3% decrease. The Group saw a decrease in net sales due to weak mobile-related demand in the memory market and delayed production of die bonders and flip chip bonders because of prolonged lead time for the procurement of key parts.
2. Cost of SalesCost of sales was 1 0,4 9 2 million yen and the cost of sales ratio deteriorated by 1.7% points from the previous consolidated fiscal year to 69.0%.
3. Selling, General and Administrative ExpensesSelling, general and administrative expenses in fiscal 2017 were 5,342 million yen, a 5.3% increase compared with the last fiscal year. With the arrival of the IoT age, there has been an increase in testing and research expenses to enhance device functions and develop new models. In addition, employee salaries and bonuses have increased to reinforce the human resources necessary for the revitalization of the organization.
4. Operating Profit/LossThe Company posted an operating loss of 620 million yen compared with an operating profit of 294 million yen recorded in the last fiscal year.
5. Non-operating IncomeThe Company posted a non-operating income of 145 million yen compared with a non-operating income of 140 million yen recorded in the last fiscal year. The foreign exchange gain of 61 million yen was mainly recorded.
6. Non-operating ExpensesNon-operat ing expenses were 14 mil l ion yen compared with 2 mill ion yen for the previous consolidated fiscal year and major recorded sales discount of 9 million yen.
7. Extraordinary IncomeExtraordinary income was 1,108 million yen. A gain on sales of investment securities of 1,108 million yen was recorded due to the sale of cross-held shares.
8. Profit/Loss attributable to owners of parentAs a result of the factors above, the Company posted a current term profit attributable to owners of parent in fiscal 2 0 1 7 were 5 6 3 million yen, a 1 3 1.8% increase compared with the last fiscal year. Current term net profit per share was 31.00 yen.
Annual Report 2018
7
010_0288501373006.indd 7 2018/09/05 10:16:42
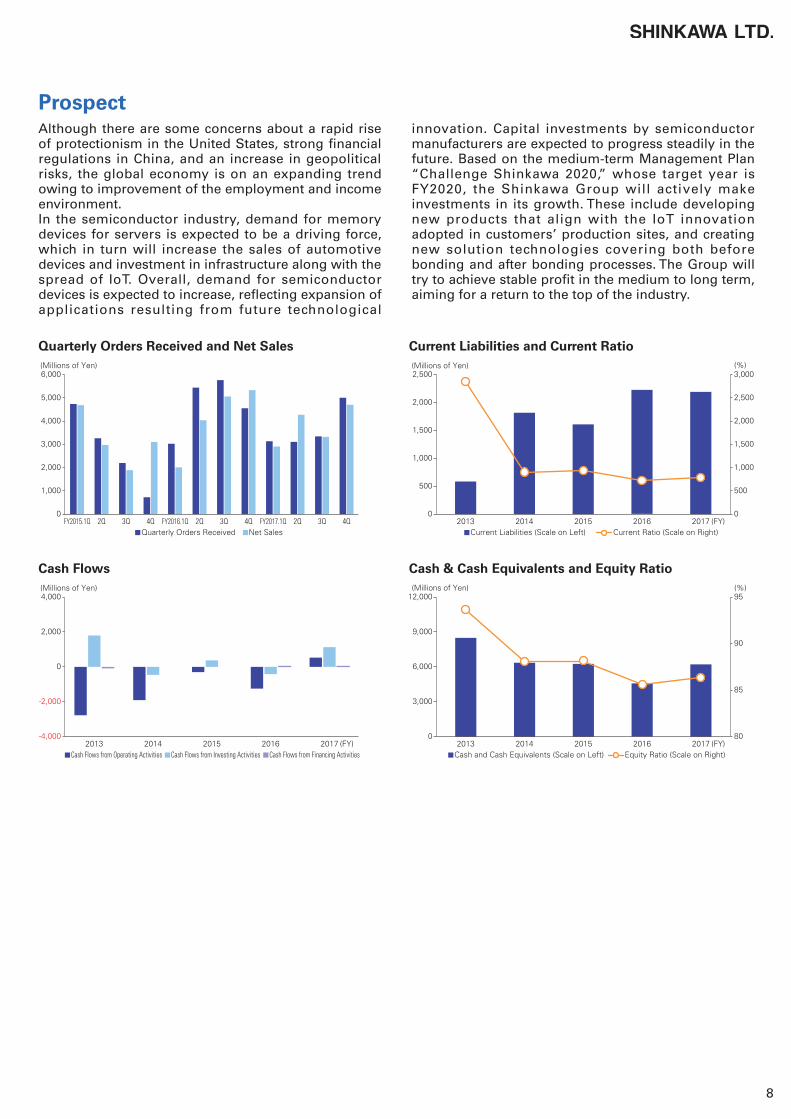
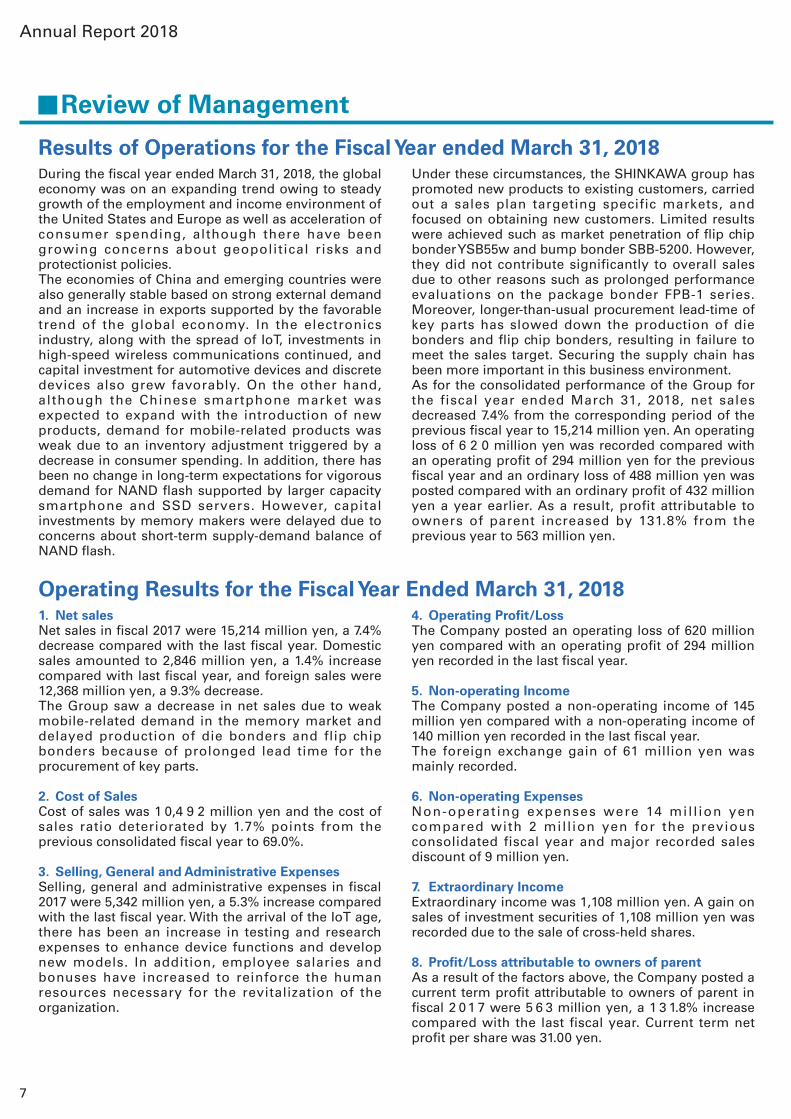
ProspectAlthough there are some concerns about a rapid rise of protectionism in the United States, strong financial regulations in China, and an increase in geopolitical risks, the global economy is on an expanding trend owing to improvement of the employment and income environment.In the semiconductor industry, demand for memory devices for servers is expected to be a driving force, which in turn will increase the sales of automotive devices and investment in infrastructure along with the spread of IoT. Overall, demand for semiconductor devices is expected to increase, reflecting expansion of applications resulting from future technological
innovation. Capital investments by semiconductor manufacturers are expected to progress steadily in the future. Based on the medium-term Management Plan “Challenge Shinkawa 2020,” whose target year is FY2020, the Shinkawa Group will actively make investments in its growth. These include developing new products that align with the IoT innovation adopted in customers’ production sites, and creating new solution technologies covering both before bonding and after bonding processes. The Group will try to achieve stable profit in the medium to long term, aiming for a return to the top of the industry.
Current Liabilities and Current Ratio
2016 2017 (FY)201520142013Current Liabilities (Scale on Left) Current Ratio (Scale on Right)
0
500
1,000
1,500
2,000
2,500
3,000(Millions of Yen) (%)
0
500
1,000
1,500
2,000
2,500
Cash & Cash Equivalents and Equity Ratio
2016 2017 (FY)201520142013Cash and Cash Equivalents (Scale on Left) Equity Ratio (Scale on Right)
80
85
90
95(Millions of Yen)
0
3,000
6,000
9,000
12,000(%)
Quarterly Orders Received and Net Sales
Quarterly Orders Received
(Millions of Yen)
Net Sales
0
2,000
3,000
1,000
4,000
5,000
6,000
4Q3Q2QFY2016.1Q 4Q3Q2QFY2017.1Q4Q3Q2QFY2015.1Q
Cash Flows(Millions of Yen)
-4,000
-2,000
0
2,000
4,000
Cash Flows from Operating Activities Cash Flows from Investing Activities Cash Flows from Financing Activities2016 2017 (FY)201520142013
8
010_0288501373006.indd 8 2018/09/05 10:16:42
Research and Development Activities
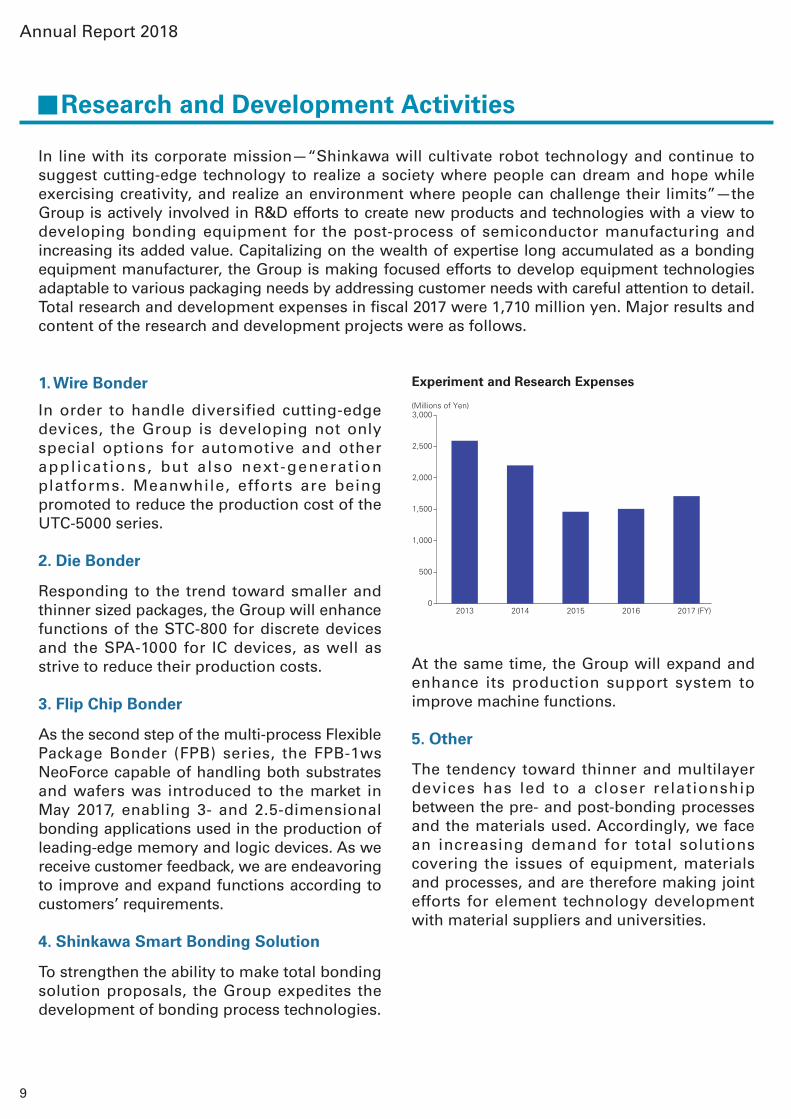
In line with its corporate mission—“Shinkawa will cultivate robot technology and continue to suggest cutting-edge technology to realize a society where people can dream and hope while exercising creativity, and realize an environment where people can challenge their limits”—the Group is actively involved in R&D efforts to create new products and technologies with a view to developing bonding equipment for the post-process of semiconductor manufacturing and increasing its added value. Capitalizing on the wealth of expertise long accumulated as a bonding equipment manufacturer, the Group is making focused efforts to develop equipment technologies adaptable to various packaging needs by addressing customer needs with careful attention to detail.Total research and development expenses in fiscal 2017 were 1,710 million yen. Major results and content of the research and development projects were as follows.
Experiment and Research Expenses
5. Other
The tendency toward thinner and multilayer devices has led to a closer relationship between the pre- and post-bonding processes and the materials used. Accordingly, we face an increasing demand for total solutions covering the issues of equipment, materials and processes, and are therefore making joint efforts for element technology development with material suppliers and universities.
2. Die Bonder
Responding to the trend toward smaller and thinner sized packages, the Group will enhance functions of the STC-800 for discrete devices and the SPA-1000 for IC devices, as well as strive to reduce their production costs.
3. Flip Chip Bonder
As the second step of the multi-process Flexible Package Bonder (FPB) series, the FPB-1ws NeoForce capable of handling both substrates and wafers was introduced to the market in May 2017, enabling 3- and 2.5-dimensional bonding applications used in the production of leading-edge memory and logic devices. As we receive customer feedback, we are endeavoring to improve and expand functions according to customers’ requirements.
4. Shinkawa Smart Bonding Solution
To strengthen the ability to make total bonding solution proposals, the Group expedites the development of bonding process technologies.
2013
(Millions of Yen)
2014 2015 2016 2017 (FY)0
500
1,000
1,500
2,000
2,500
3,000
1. Wire Bonder
In order to handle diversified cutting-edge devices, the Group is developing not only special options for automotive and other appl icat ions, but also next-generat ion platforms. Meanwhile, efforts are being promoted to reduce the production cost of the UTC-5000 series.
At the same time, the Group will expand and enhance its production support system to improve machine functions.
Annual Report 2018
9
010_0288501373006.indd 9 2018/09/05 10:16:42

Commitment to CSR
Environmental PolicySHINKAWA LTD. is committed to engage in protection of global environment through activities based on the following environmental mission and action guideline.
Environmental Mission
Business organization is created by the stage called earth and the players called human beings, so threats to earth and human beings means the menace to the existence of business organization.Therefore, we will undertake the task of protecting nature, which includes conservation
of biodiversity and environment surrounding the human beings based on our action guidel ine in a l l areas of our business operations such as research, development, designing, manufacturing, sales and after-sales service of semiconductor manufacturing equipment.
Action Guideline1. We will establish “SHINKAWA Environmental Management System” and work on prevention
of pollution and continuous improvement of the system.2. We will observe the regulations and other requirements related to environment.3. We will intensively promote the followings: 1) Saving of natural resources and energy as well as recycling. 2) Active engagement in technical development and research of eco-friendly products.
Occupational Safety and Health PolicySHINKAWA LTD. will be engaged in activities aimed for occupational safety and health based on the following occupational safety and health missions and action guideline.
Occupational Safety and Health Mission
Under the management phi losophy of “SHINKAWA LTD. wil l lead the robotic technology to guide to the society to where people can maximize their creative ability”, we will take occupational safety and health as the priority in all areas of our business operation including research, development, designing,
manufacturing, sales and after-sales service of semiconductor manufacturing equipment, etc. And we will work on building a safe and comfortable working environment as well as sustaining and promoting physical and mental health based on our action guideline.
Action Guideline1. We will establish “SHINKAWA Occupational Safety and Health Management System” and
work on prevention of injury and sickness, as well as continuous improvement of the system.
2. We will observe the regulations and other requirements related to occupational safety and health.
3. We will strive to eliminate the risk of injuries and sickness resulting from industrial accidents such as caught in machinery, and natural disasters such as earthquake.
4. We will make efforts in sustaining and promoting physical and mental health in order for all employees to maximize their ability respectively.
10
010_0288501373006.indd 10 2018/09/05 10:16:42

Corporate Governance
Basic PhilosophyFor the purpose of raising efficiency and transparency of the management as well as of ensuring soundness and compliance of its business activities, the Group makes a continual effort to maintain and strengthen an internal control system that is treated as one of the most important tasks of the management. By creating an appropriate structure of governance, we believe we can control various uncertain factors surrounding the Group and ensure the continuity of active conduct of business and maximization of the corporate value.
Corporate Governance SystemThe Company has a Board of Corporate Auditors.
Election/Dismissal
President
Operating Officers
Executive Meeting
Administrative Management Div.Individual Departments/
Group Companies
Audit Dept.
Proposal/Report
Supervision/Instruction Audit
Internal AuditSupervision/Instruction
Board of Directors
AuditAdvisory/Report
Supervision/Instruction
Board of Auditors Accounting Auditors
Election/Dismissal
Identify cross-organizational risks and implement company wide correspondence, implement
compliance awareness/education campaign
Internal Audit Report
Audit
Cooperation
Supervision/Instruction
Internal Audit Report
Proposal/Report
Proposal/Report
Proposal/Report
Proposal/Report
Proposal/Report
Cooperation
Nomination Advisory CommitteeCompensation Advisory Committee
Supervision/Instruction
Supervision/Instruction
Supervision/Instruction
Supervision/Decision Making
Business Execution
Election/Dismissal Election/Dismissal Election/Dismissal
Shareholders’ Meeting
Annual Report 2018
11
010_0288501373006.indd 11 2018/09/05 10:16:42
Board of DirectorsSHINKAWA’s Board of Directors is composed of five members, two of whom are appointed from outside the Company. The Nomination Advisory Committee and the Remuneration Advisory Committee, each consists of two Outside Directors and one Representative Director. The Company has also incorporated corporate officer system, making a clear distinction between the management/supervision function of the management on the one hand and the function of ensuring that b u s i n e s s i s c o n d u c t e d a c c o r d i n g t o t h e management policy on the other. In addition to regularly scheduled Board meetings held once every month, extraordinary meetings are held as and when required. The Board meets to deliberate on and determine matters of importance and to overview and supervise the status of operating execution. During the 2017 fiscal year, the Board of Directors met on a total of 19 occasions. In addition to the Board of Directors, a Management Meeting is held on a regular basis twice each month. This meeting is attended by the President, general managers of head office divisions and department general managers.
Board of Corporate AuditorsThe Board of Corporate Auditors is composed of three members, all of whom are appointed from outside the Company. During the 2017 fiscal year, the Board of Corporate Auditors met a total of 1 4 times. In addition to formulating audit policies and plans, the Board deliberates on matters concerning important auditing operations. Corporate Auditors attend meetings of the Board of Directors,
exchange opinions with the Representative Director, review important documents including requests for approval and resolutions by the Board of Directors. Drawing on evaluations of the business and financial condition of the Company, Corporate Auditors also conduct audits of the execution of duties by directors particularly in the context of statutory and regulatory compliance and val idi ty. Turning to subsidiary companies, Corporate Auditors communicate with directors and corporate auditors and demand reports from subsidiaries when needed. In the event an issue of concern is uncovered, information is shared with the Internal Control Department with steps taken to ensure a resolution and improvement.Corporate Auditors receive and deliberate on the results of accounting audits working closely with Accounting Auditors to monitor the independence and adequacy of each audit . Furthermore, Accounting Auditors and the Internal Audit Department maintain close-knit ties, mutually exchanging information and opinions as and when required. Through these means, every effort is made to enhance the efficiency and efficacy of audits.
Accounting AuditorsThe Company concluded an audit agreement with ARK MEIJI AUDIT & Co. based on the Corporate Law Audit and Financial Instruments and Exchange Act. ARK MEIJI AUDIT & Co. accordingly conducts an independent accounting audit of the Company. There is no special vested interest between the Company and the Accounting Auditors or its executive officers.
Internal Control SystemThe Company has put in place an internal control system as set out below pursuant to the Companies Act as well as the Ordinance for Enforcement of the Companies Act.
1. The system for securing job execut ion compliance by directors and employees with laws and regulations as well as the Company Statute
We shall establish the “Code of Conduct for the SHINKAWA Group” so that all the board members and employees of the entire Group shall perform their jobs in compliance with laws, regulations, the Company Statute and the norms of society.In order to attain a thorough understanding, the president shall also control the Companywide promotion of compliance having instituted the basic rules of compliance. Moreover, the education of employees shall be conducted mainly through the Personnel & Administration Department.The Audit Department under the direct control of the president shall audit the degree of compliance i n c o l l a b o r a t i o n w i t h t h e P e r s o n n e l & Administration Department. We shall create an
internal reporting system with the aim of deterring questionable behavior and conduct in terms of laws, regulations, the Company Statute and the norms of society, prepare contact points for internal reporting both inside and outside the Company to allow all the board members and employees to report information directly, and ensure that reporters will not receive detrimental treatment because of such reporting.By establishing and promoting these systems, we shall take organized responses to block any r e l a t i o n s h i p s w i t h a n t i s o c i a l f o r c e s a n d organizations. In the face of unacceptable demands from antisocial forces and organizations, we shall strive to cut-off relations and prevent damage by cooperating with the police and other law enforcement authorities mainly through the Personnel & Administration Department as the controlling division.
12
010_0288501373006.indd 12 2018/09/05 10:16:42

2. Systems concerning the maintenance and control of information related to job execution by directors
We shall record and keep information related to decision making and job execution by directors in the form of printed or electronic documents (hereinafter collectively referred to as “documents”) pursuant to the rules relating to document control.These documents shall be made available for inspection by directors and corporate auditors at any time pursuant to the rules relating to document control.
3. Regulations and other systems concerning the management of risk of loss
In accordance with the risk management rules, each department and each company of the SHINKAWA Group shall manage any risks derived from the operations they are responsible for, whereas the status of cross-organizational risks and Companywide responses shall be managed by the Corporate Planning Department.
4. The system of ensuring that directors execute their duties in an efficient manner
We have adopted the operating officer system to ensure that decision-making is undertaken in a swift and agile manner and to clarify responsibilities with respect to the execution of duties.In the context of operating execution function in accordance with decisions of the Board of Directors, the rules relating to management authority clearly define the responsibilities and authority of each officer. In this manner, the Company has taken steps to build a system that is conducive to the appropriate and eff icient execution of duties.In addition, specific objectives and targets are set for each division and department. The Board of Directors regularly reviews that status of progress and results. This helps raise the probability of achieving established objectives and goals and securing efficient Group-wide operations.
5. System to secure the appropriateness of the Company ’s operations as well as of the Company Group including its subsidiaries
(1) The department in charge of internal control for the entire Group shall be the Corporate Planning Department, which provides necessary guidance and support to each Group Company to enhance the effectiveness of internal control and the efficiency of business execution at each Group Company.
(2) Regarding compliance and risk management, the Company’s department in charge of compliance and risk management shall conduct activities covering the entire Group.
(3) The internal reporting system shall be applied to each Group company.
(4) The rules for decision making on business execution at the Company’s subsidiaries shall be put in place, and the Company shall have its subsidiaries report the status of their business execution and financial position regularly.
6. In the event corporate auditors request that employees be assigned to assist in their duties; matters related to the relevant employees, matters related to the independence of such employees from directors, and matters related to ensuring the effectiveness of the instructions given to such employees.
In the event employees are required to assist in the duties of corporate auditors, we shall assign employees who have the ability and knowledge to examine the operations of the Company. The employees shall not be subject to instruction and/or order of directors and others insofar as their capacity to assist in the duties of corporate auditors is concerned. Personnel transfers and other employee conditions regarding such employees shall be subject to prior approval by the board of corporate auditors.
7. Systems for directors and employees of the Company and its subsidiaries to report to corporate auditors, systems for other reporting to corporate auditors, and systems to ensure that reporters will not receive detrimental treatment because of such reporting
All the board members and employees of the SHINKAWA Group shall report to the board of corporate auditors without delay on important matters that have a significant impact on the Company and the Company Group, the degree to which internal audits have been implemented in addition to matters designated by law. Methods of reporting (reporter, recipient of report, timing of report , e tc . ) shal l be determined through consultation between directors and the board of corporate auditors.The SHINKAWA Group shall not treat reporters in a detrimental way because of their providing related information to the corporate auditors.
8. Other sys tems to secure the e f fec t i ve implementation of audits by corporate auditors
We shall provide active support for the preparation of an appropriate environment that allows audits by corporate auditors, and arrange regular meetings for the exchange of opinions between the board of corporate auditors and representative directors.The Company shall cover the necessary expenses for audit duties such as using external advisors who support the corporate auditors’ audit duties in case it is deemed necessary by the corporate auditors.
Annual Report 2018
13
010_0288501373006.indd 13 2018/09/05 10:16:42

Directors, Operating Officers and Corporate AuditorsDirectors and Operating Officers
Corporate Auditors
Chief Technical Officer, Executive Vice President
Norimasa NagataJoined in January 2013Director in Charge of Engineering Div., Global Operation Div.,Shinjuku Technical Center and General Manager, Shinjuku Technical Center
Director
Ichiro AnjoOutside Director
Operating Officer
Tetsuya SakumaJoined in March 1982General Manager, Global Operation Div.
Operating Officer
Lee Ho SeongJoined in April 1990Shinkawa Korea Co., Ltd. President
Operating OfficerYasuhisa MiyataJoined in June 2018President and Representative Director of PFA Corporation
Senior Operating Officer
Noboru FujinoJoined in April 1980General Manager, Engineering Div.
Audit & Supervisory Board Member
Koji SekiguchiAudit & Supervisory Board Member
Masaki Yoshino
Audit & Supervisory Board Member
Mariko Mitsuya
President and CEO,Representative Director
Takashi NaganoJoined in March 1981
Chief Financial Officer, Director
Takuya MoriJoined in March 1983General Manager, Administrative Management Div.
Operating Officer
Hirotoshi TashimaJoined in March 1984General Manager, Sales Div.
Operating Officer
Fumihiko OokaJoined in April 2016Shinkawa Manufacturing Asia Co., Ltd. President and Shinkawa (Thailand) Co., Ltd. President
Director
Yuichi KawakamiOutside Director
Operating Officer
Hiroshi MunakataJoined in December 2016Deputy General Manager, Engineering Div. and Deputy General Manager, Shinjuku Technical Center
14
010_0288501373006.indd 14 2018/09/05 10:16:46
Main Risks and Uncertainties
1. Changes in the semiconductor marketThe Group manufactures and sells semiconductor manufacturing equipment. The demand for semiconductor manufacturing equipment is influenced by fluctuations in the semiconductor market, the trend of semiconductor manufacturers’ capital investments and other factors.Our Group strives to maintain solid fiscal standing and is currently conducting a range of measures to radically reorganize the cost structure and fortify the product lineup with a view to boost its competitive power, but since ours is a single segment enterprise, these market fluctuation may have a disadvantageous impact on the Group’s financial standing and business performance.
2. Exchange rate fluctuationsIn the 2016 fiscal year, the proportion of foreign sales among net sales of the Group was 82.9%. As the Group also intends to expand the number of its overseas bases centering on the Asian countries, we expect a further increase in the foreign currency transactions in the future.Pr e s e n t l y, t h e n o n - y e n f o r e i g n c u rr e n c y transactions are denominated in U.S. dollars, and fluctuations in the yen/dollar exchange rate may affect the f inancial standing and business performance of the Group.
3. Uncertainties related to product developmentOur Group makes a continuous effort to develop original technology in response to the latest technological innovations and needs of the market, but the results of product development are accompanied by a number of uncertainties stemming from various factors including the changes in the product life cycle, and segmentation of clients’ needs.In such cases as when the Group cannot develop new technologies and new products in a timely manner, o r when i t cannot deve lop new technologies precisely matching the direction of the current market competition, it may affect the financial standing and business performance of the Group.
4. Worsening of conditions for raw material procurement
The products of the Group are made by assembling i n t h e c o m p a ny v a r i e d u n i t s p r o c e s s e d /manufactured by external suppliers, and since production of such units requires the manufacturer
to have the proprietary technology of our Group, in procurement we depend on a small number of specific suppliers.During the phases when there is a substantial increase of production by the Group, there are cases when the capacity of production on the suppliers side temporarily cannot keep up with the increase, resulting in the state of procurement becoming unstable.The Group may also be influenced by financial health and other changes happening to its suppliers. These factors may affect the financial standing and business performance of the Group.
5. Major quality claimsOne of the permanent tasks of the Group is to maintain and enhance the stability and reliability of our products, taking all possible care to ensure a thorough quality control. Nevertheless, there may be cases when due to unforeseen defects or flaws the Group is sued under product liability and has to fulfill its duty for compensation.When the cost of such duty cannot be covered by insurance, it may affect the financial standing and business performance of the Group.
6. Lawsuits related to intellectual property rights, etc.
The Group strives to protect and control various kinds of intellectual property rights including such measures as acquiring the patent rights for the proprietary technology developed by the Group.At the same time, in product development, we make an effort not to infringe on intellectual property rights and other rights owned by third parties.However, when a third party fraudulently uses the technology the Group owns intellectual property rights for, or when a legal action is taken against the Group by a third party for infringement of its intellectual property rights, it may affect the financial standing and business performance of the Group.
7. Uncertainties related to mergers and acquisitions and business collaborations
As the globalization of the economy is intensifying w i t h e c o n o m i c f l u c t u a t i o n s a n d m a r k e t competition, the Group will expand its range of businesses by promoting M&As and business alliances with companies that can generate synergies with the Group’s technologies. In such a
Below are the main risks and uncertainties SHINKAWA is exposed to in the business environment surrounding the Group that can substantially influence judgment of the investors.Please note that all forward-looking statements listed in this section are based on the current assumptions of the Group as of the end of June, 2018.
Annual Report 2018
15
010_0288501373006.indd 15 2018/09/05 10:16:47
case, the Group shall check with due diligence the financial standing and other details of the company concerned beforehand and identify the risks, but if after acquisition the company is unexpectedly found to have debts, or when there is no synergic effect due to changes of business environment or other factors, such cases may affect the financial standing and business performance of the Group.
8. Changes of regulationsThe Group is influenced not only by laws and regulat ions of Japan, but a lso by var ious regulations and approval procedures peculiar to the countries of the clients who purchase and use the products of the Group.Although the Group strives to strictly observe these legal restrictions by maintaining a system of compliance, in cases where the Group has to bear substantial costs as a result of revisions or enforcements of new laws, ordinances, or regulations in the future, such cases may affect the financial standing and business performance of the Group.
9. Leakage of important informationThe SHINKAWA Group handles important information related to its business partners and personal information of officers and employees of the Group while conducting business activities. To protect such information, we are striving to manage such information thoroughly by improving the compliance system, including related rules, establishing an information security system, and conducting activities to educate officers and employees.However, despite all such measures we take, should any leakage of customer information or personal information occur due to an unexpected situation, liability for damage compensation might occur and/or the Group might lose the trust of society, which could affect the Group’s financial position and operating results.
10. Occurrence of natural disasters, wars, terrorist attacks, accidents, etc.
In cases when earthquakes, floods, or other natural disasters, wars, terrorist attacks, epidemics of infectious diseases, radioactive contamination, or computer virus attacks happen in areas in and outside the country, in which bases of our Group are located, the Group may be forced to suspend its business activity. Also, when the Group has to bear the restoration expenses for products, components, or plant and equipment that were damaged during natural or man-caused disasters, it may affect the financial standing and business performance of the Group.
11. Notes on Important Events Related to Going Concern Assumption
The Group has reported an operating loss, ordinary loss and loss attributable to owners of parent in recent fiscal years, mostly due to prolonged periods of product development and evaluation and a relatively high ratio of fixed cost to net sales. Under such c i rcumstances , the Company experienced important events relating to the going concern assumption.
16
010_0288501373006.indd 16 2018/09/05 10:16:47
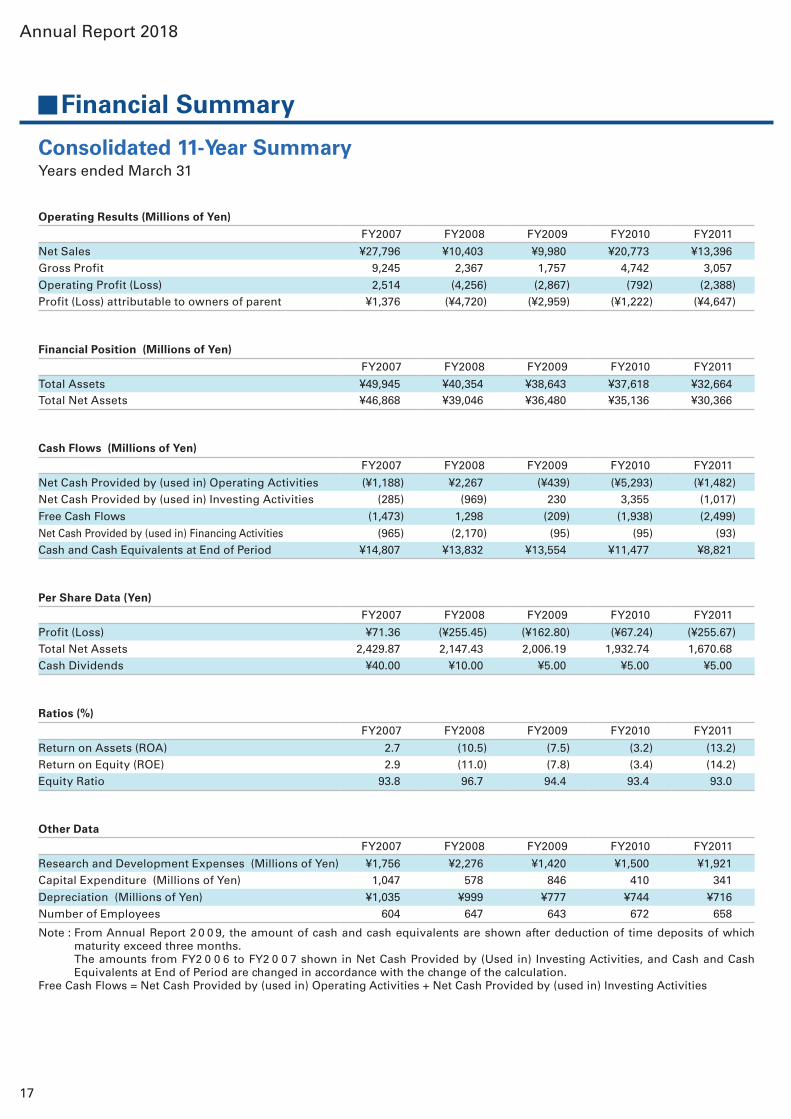
Consolidated 11-Year SummaryYears ended March 31
Financial Summary
Operating Results (Millions of Yen)
FY2007 FY2008 FY2009 FY2010 FY2011
Net Sales ¥27,796 ¥10,403 ¥9,980 ¥20,773 ¥13,396 Gross Profit 9,245 2,367 1,757 4,742 3,057
Operating Profit (Loss) 2,514 (4,256) (2,867) (792) (2,388)Profit (Loss) attributable to owners of parent ¥1,376 (¥4,720) (¥2,959) (¥1,222) (¥4,647)
Other Data
FY2007 FY2008 FY2009 FY2010 FY2011
Research and Development Expenses (Millions of Yen) ¥1,756 ¥2,276 ¥1,420 ¥1,500 ¥1,921 Capital Expenditure (Millions of Yen) 1,047 578 846 410 341
Depreciation (Millions of Yen) ¥1,035 ¥999 ¥777 ¥744 ¥716 Number of Employees 604 647 643 672 658
Per Share Data (Yen)
FY2007 FY2008 FY2009 FY2010 FY2011
Profit (Loss) ¥71.36 (¥255.45) (¥162.80) (¥67.24) (¥255.67)Total Net Assets 2,429.87 2,147.43 2,006.19 1,932.74 1,670.68 Cash Dividends ¥40.00 ¥10.00 ¥5.00 ¥5.00 ¥5.00
Ratios (%)
FY2007 FY2008 FY2009 FY2010 FY2011
Return on Assets (ROA) 2.7 (10.5) (7.5) (3.2) (13.2)Return on Equity (ROE) 2.9 (11.0) (7.8) (3.4) (14.2)Equity Ratio 93.8 96.7 94.4 93.4 93.0
Financial Position (Millions of Yen)
FY2007 FY2008 FY2009 FY2010 FY2011
Total Assets ¥49,945 ¥40,354 ¥38,643 ¥37,618 ¥32,664 Total Net Assets ¥46,868 ¥39,046 ¥36,480 ¥35,136 ¥30,366
Cash Flows (Millions of Yen)
FY2007 FY2008 FY2009 FY2010 FY2011
Net Cash Provided by (used in) Operating Activities (¥1,188) ¥2,267 (¥439) (¥5,293) (¥1,482)Net Cash Provided by (used in) Investing Activities (285) (969) 230 3,355 (1,017)
Free Cash Flows (1,473) 1,298 (209) (1,938) (2,499)
Net Cash Provided by (used in) Financing Activities (965) (2,170) (95) (95) (93)Cash and Cash Equivalents at End of Period ¥14,807 ¥13,832 ¥13,554 ¥11,477 ¥8,821
Note : From Annual Report 2 0 0 9, the amount of cash and cash equivalents are shown after deduction of time deposits of which maturity exceed three months.
The amounts from FY2 0 0 6 to FY2 0 0 7 shown in Net Cash Provided by (Used in) Investing Activities, and Cash and Cash Equivalents at End of Period are changed in accordance with the change of the calculation.
Free Cash Flows = Net Cash Provided by (used in) Operating Activities + Net Cash Provided by (used in) Investing Activities
Annual Report 2018
17
010_0288501373006.indd 17 2018/09/05 10:16:47
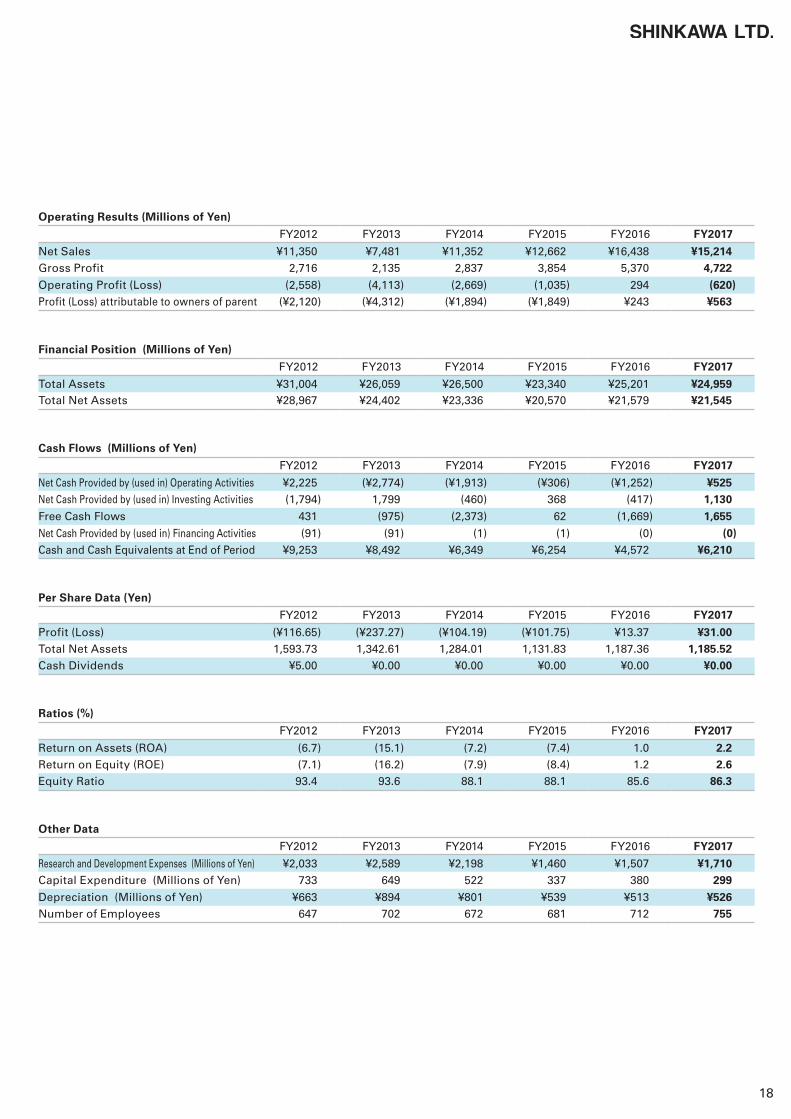
Operating Results (Millions of Yen)
FY2012 FY2013 FY2014 FY2015 FY2016 FY2017
Net Sales ¥11,350 ¥7,481 ¥11,352 ¥12,662 ¥16,438 ¥15,214 Gross Profit 2,716 2,135 2,837 3,854 5,370 4,722
Operating Profit (Loss) (2,558) (4,113) (2,669) (1,035) 294 (620)Profit (Loss) attributable to owners of parent (¥2,120) (¥4,312) (¥1,894) (¥1,849) ¥243 ¥563
Other Data
FY2012 FY2013 FY2014 FY2015 FY2016 FY2017
Research and Development Expenses (Millions of Yen) ¥2,033 ¥2,589 ¥2,198 ¥1,460 ¥1,507 ¥1,710 Capital Expenditure (Millions of Yen) 733 649 522 337 380 299
Depreciation (Millions of Yen) ¥663 ¥894 ¥801 ¥539 ¥513 ¥526 Number of Employees 647 702 672 681 712 755
Per Share Data (Yen)
FY2012 FY2013 FY2014 FY2015 FY2016 FY2017
Profit (Loss) (¥116.65) (¥237.27) (¥104.19) (¥101.75) ¥13.37 ¥31.00 Total Net Assets 1,593.73 1,342.61 1,284.01 1,131.83 1,187.36 1,185.52 Cash Dividends ¥5.00 ¥0.00 ¥0.00 ¥0.00 ¥0.00 ¥0.00
Ratios (%)
FY2012 FY2013 FY2014 FY2015 FY2016 FY2017
Return on Assets (ROA) (6.7) (15.1) (7.2) (7.4) 1.0 2.2 Return on Equity (ROE) (7.1) (16.2) (7.9) (8.4) 1.2 2.6 Equity Ratio 93.4 93.6 88.1 88.1 85.6 86.3
Financial Position (Millions of Yen)
FY2012 FY2013 FY2014 FY2015 FY2016 FY2017
Total Assets ¥31,004 ¥26,059 ¥26,500 ¥23,340 ¥25,201 ¥24,959 Total Net Assets ¥28,967 ¥24,402 ¥23,336 ¥20,570 ¥21,579 ¥21,545
Cash Flows (Millions of Yen)
FY2012 FY2013 FY2014 FY2015 FY2016 FY2017
Net Cash Provided by (used in) Operating Activities ¥2,225 (¥2,774) (¥1,913) (¥306) (¥1,252) ¥525 Net Cash Provided by (used in) Investing Activities (1,794) 1,799 (460) 368 (417) 1,130
Free Cash Flows 431 (975) (2,373) 62 (1,669) 1,655
Net Cash Provided by (used in) Financing Activities (91) (91) (1) (1) (0) (0)Cash and Cash Equivalents at End of Period ¥9,253 ¥8,492 ¥6,349 ¥6,254 ¥4,572 ¥6,210
18
010_0288501373006.indd 18 2018/09/05 10:16:47
Financial Data
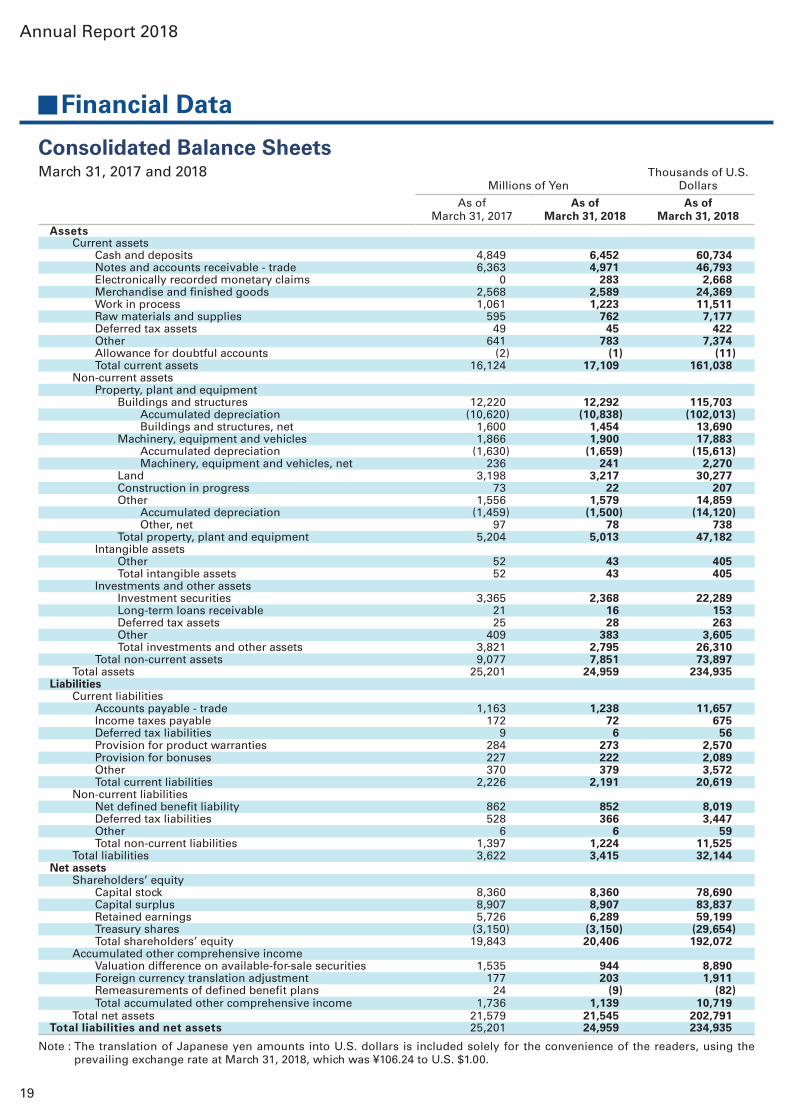
Consolidated Balance Sheets
Millions of YenThousands of U.S.
Dollars
As of March 31, 2017
As of March 31, 2018
As of March 31, 2018
AssetsCurrent assets
Cash and deposits 4,849 6,452 60,734 Notes and accounts receivable - trade 6,363 4,971 46,793 Electronically recorded monetary claims 0 283 2,668 Merchandise and finished goods 2,568 2,589 24,369 Work in process 1,061 1,223 11,511 Raw materials and supplies 595 762 7,177 Deferred tax assets 49 45 422 Other 641 783 7,374 Allowance for doubtful accounts (2) (1) (11)Total current assets 16,124 17,109 161,038
Non-current assetsProperty, plant and equipment
Buildings and structures 12,220 12,292 115,703 Accumulated depreciation (10,620) (10,838) (102,013)Buildings and structures, net 1,600 1,454 13,690
Machinery, equipment and vehicles 1,866 1,900 17,883 Accumulated depreciation (1,630) (1,659) (15,613)Machinery, equipment and vehicles, net 236 241 2,270
Land 3,198 3,217 30,277 Construction in progress 73 22 207 Other 1,556 1,579 14,859
Accumulated depreciation (1,459) (1,500) (14,120)Other, net 97 78 738
Total property, plant and equipment 5,204 5,013 47,182 Intangible assets
Other 52 43 405 Total intangible assets 52 43 405
Investments and other assetsInvestment securities 3,365 2,368 22,289 Long-term loans receivable 21 16 153 Deferred tax assets 25 28 263 Other 409 383 3,605 Total investments and other assets 3,821 2,795 26,310
Total non-current assets 9,077 7,851 73,897 Total assets 25,201 24,959 234,935
LiabilitiesCurrent liabilities
Accounts payable - trade 1,163 1,238 11,657 Income taxes payable 172 72 675 Deferred tax liabilities 9 6 56 Provision for product warranties 284 273 2,570 Provision for bonuses 227 222 2,089 Other 370 379 3,572 Total current liabilities 2,226 2,191 20,619
Non-current liabilitiesNet defined benefit liability 862 852 8,019 Deferred tax liabilities 528 366 3,447 Other 6 6 59 Total non-current liabilities 1,397 1,224 11,525
Total liabilities 3,622 3,415 32,144 Net assets
Shareholders’ equityCapital stock 8,360 8,360 78,690 Capital surplus 8,907 8,907 83,837 Retained earnings 5,726 6,289 59,199 Treasury shares (3,150) (3,150) (29,654)Total shareholders’ equity 19,843 20,406 192,072
Accumulated other comprehensive incomeValuation difference on available-for-sale securities 1,535 944 8,890 Foreign currency translation adjustment 177 203 1,911 Remeasurements of defined benefit plans 24 (9) (82)Total accumulated other comprehensive income 1,736 1,139 10,719
Total net assets 21,579 21,545 202,791 Total liabilities and net assets 25,201 24,959 234,935
March 31, 2017 and 2018
Note : The translation of Japanese yen amounts into U.S. dollars is included solely for the convenience of the readers, using the prevailing exchange rate at March 31, 2018, which was ¥106.24 to U.S. $1.00.
Annual Report 2018
19
010_0288501373006.indd 19 2018/09/05 10:16:47
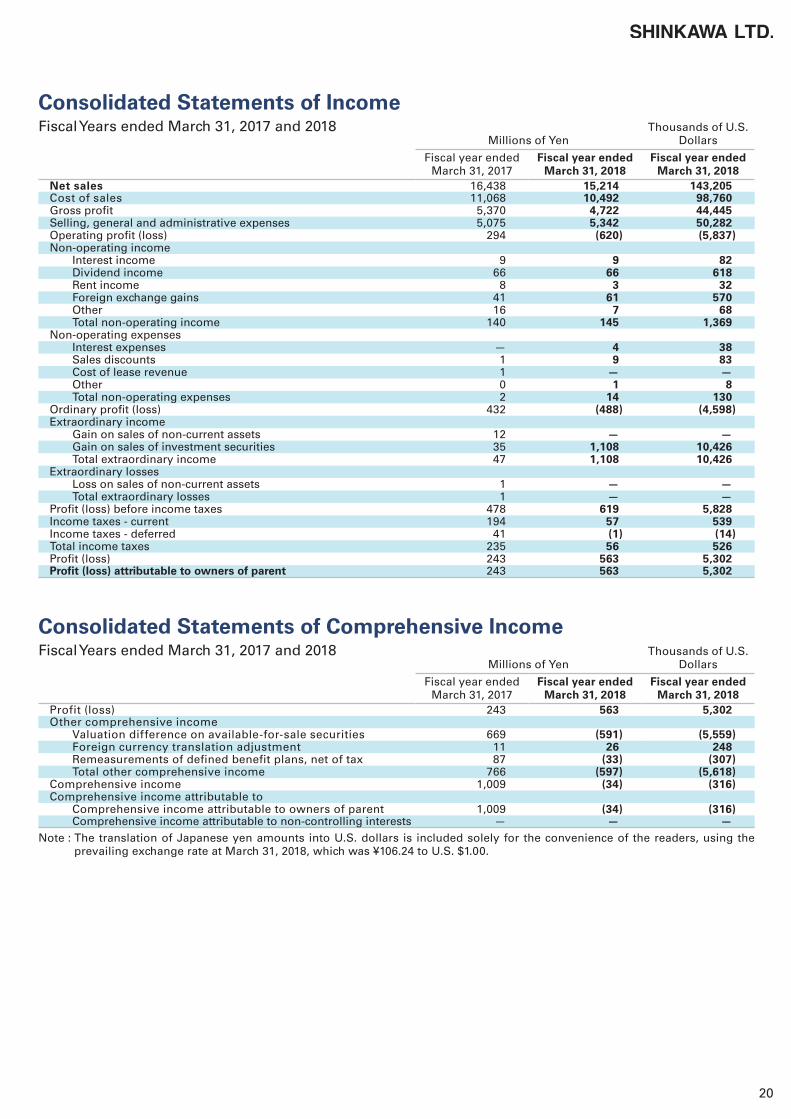
Consolidated Statements of Income
Millions of YenThousands of U.S.
Dollars
Fiscal year ended March 31, 2017
Fiscal year ended March 31, 2018
Fiscal year ended March 31, 2018
Net sales 16,438 15,214 143,205 Cost of sales 11,068 10,492 98,760 Gross profit 5,370 4,722 44,445 Selling, general and administrative expenses 5,075 5,342 50,282 Operating profit (loss) 294 (620) (5,837)Non-operating income
Interest income 9 9 82 Dividend income 66 66 618 Rent income 8 3 32 Foreign exchange gains 41 61 570 Other 16 7 68 Total non-operating income 140 145 1,369
Non-operating expensesInterest expenses — 4 38 Sales discounts 1 9 83 Cost of lease revenue 1 — —Other 0 1 8 Total non-operating expenses 2 14 130
Ordinary profit (loss) 432 (488) (4,598)Extraordinary income
Gain on sales of non-current assets 12 — —Gain on sales of investment securities 35 1,108 10,426 Total extraordinary income 47 1,108 10,426
Extraordinary lossesLoss on sales of non-current assets 1 — —Total extraordinary losses 1 — —
Profit (loss) before income taxes 478 619 5,828 Income taxes - current 194 57 539 Income taxes - deferred 41 (1) (14)Total income taxes 235 56 526 Profit (loss) 243 563 5,302 Profit (loss) attributable to owners of parent 243 563 5,302
Fiscal Years ended March 31, 2017 and 2018
Consolidated Statements of Comprehensive Income
Millions of YenThousands of U.S.
Dollars
Fiscal year ended March 31, 2017
Fiscal year ended March 31, 2018
Fiscal year ended March 31, 2018
Profit (loss) 243 563 5,302 Other comprehensive income
Valuation difference on available-for-sale securities 669 (591) (5,559)Foreign currency translation adjustment 11 26 248 Remeasurements of defined benefit plans, net of tax 87 (33) (307)Total other comprehensive income 766 (597) (5,618)
Comprehensive income 1,009 (34) (316)Comprehensive income attributable to
Comprehensive income attributable to owners of parent 1,009 (34) (316)Comprehensive income attributable to non-controlling interests — — —
Fiscal Years ended March 31, 2017 and 2018
Note : The translation of Japanese yen amounts into U.S. dollars is included solely for the convenience of the readers, using the prevailing exchange rate at March 31, 2018, which was ¥106.24 to U.S. $1.00.
20
010_0288501373006.indd 20 2018/09/05 10:16:47
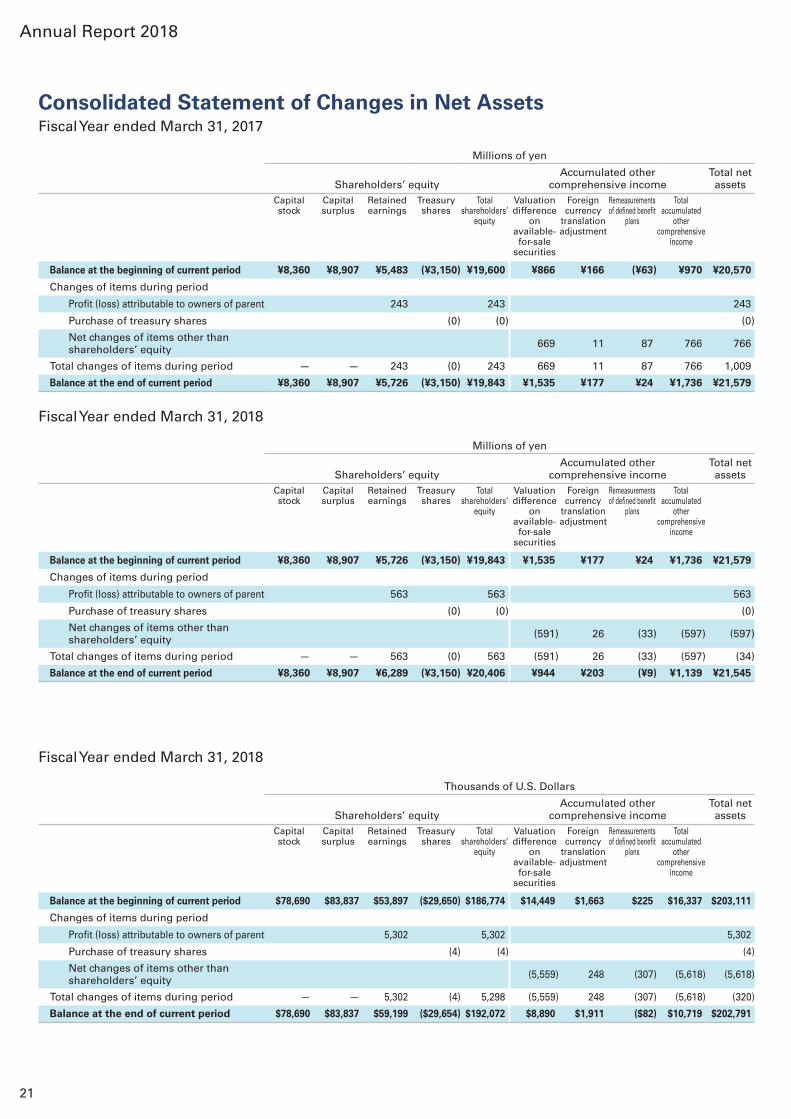
Consolidated Statement of Changes in Net AssetsFiscal Year ended March 31, 2017
Fiscal Year ended March 31, 2018
Fiscal Year ended March 31, 2018
Millions of yen
Shareholders’ equityAccumulated other
comprehensive incomeTotal net assets
Capital stock
Capital surplus
Retained earnings
Treasury shares
Total shareholders’
equity
Valuation difference
on available-for-sale
securities
Foreign currency
translation adjustment
Remeasurements of defined benefit
plans
Total accumulated
other comprehensive
income
Balance at the beginning of current period ¥8,360 ¥8,907 ¥5,483 (¥3,150) ¥19,600 ¥866 ¥166 (¥63) ¥970 ¥20,570
Changes of items during period
Profit (loss) attributable to owners of parent 243 243 243
Purchase of treasury shares (0) (0) (0)
Net changes of items other than shareholders’ equity 669 11 87 766 766
Total changes of items during period — — 243 (0) 243 669 11 87 766 1,009
Balance at the end of current period ¥8,360 ¥8,907 ¥5,726 (¥3,150) ¥19,843 ¥1,535 ¥177 ¥24 ¥1,736 ¥21,579
Millions of yen
Shareholders’ equityAccumulated other
comprehensive incomeTotal net assets
Capital stock
Capital surplus
Retained earnings
Treasury shares
Total shareholders’
equity
Valuation difference
on available-for-sale
securities
Foreign currency
translation adjustment
Remeasurements of defined benefit
plans
Total accumulated
other comprehensive
income
Balance at the beginning of current period ¥8,360 ¥8,907 ¥5,726 (¥3,150) ¥19,843 ¥1,535 ¥177 ¥24 ¥1,736 ¥21,579
Changes of items during period
Profit (loss) attributable to owners of parent 563 563 563
Purchase of treasury shares (0) (0) (0)
Net changes of items other than shareholders’ equity (591) 26 (33) (597) (597)
Total changes of items during period — — 563 (0) 563 (591) 26 (33) (597) (34)
Balance at the end of current period ¥8,360 ¥8,907 ¥6,289 (¥3,150) ¥20,406 ¥944 ¥203 (¥9) ¥1,139 ¥21,545
Thousands of U.S. Dollars
Shareholders’ equityAccumulated other
comprehensive incomeTotal net assets
Capital stock
Capital surplus
Retained earnings
Treasury shares
Total shareholders’
equity
Valuation difference
on available-for-sale
securities
Foreign currency
translation adjustment
Remeasurements of defined benefit
plans
Total accumulated
other comprehensive
income
Balance at the beginning of current period $78,690 $83,837 $53,897 ($29,650) $186,774 $14,449 $1,663 $225 $16,337 $203,111
Changes of items during period
Profit (loss) attributable to owners of parent 5,302 5,302 5,302
Purchase of treasury shares (4) (4) (4)
Net changes of items other than shareholders’ equity (5,559) 248 (307) (5,618) (5,618)
Total changes of items during period — — 5,302 (4) 5,298 (5,559) 248 (307) (5,618) (320)
Balance at the end of current period $78,690 $83,837 $59,199 ($29,654) $192,072 $8,890 $1,911 ($82) $10,719 $202,791
Annual Report 2018
21
010_0288501373006.indd 21 2018/09/05 10:16:47
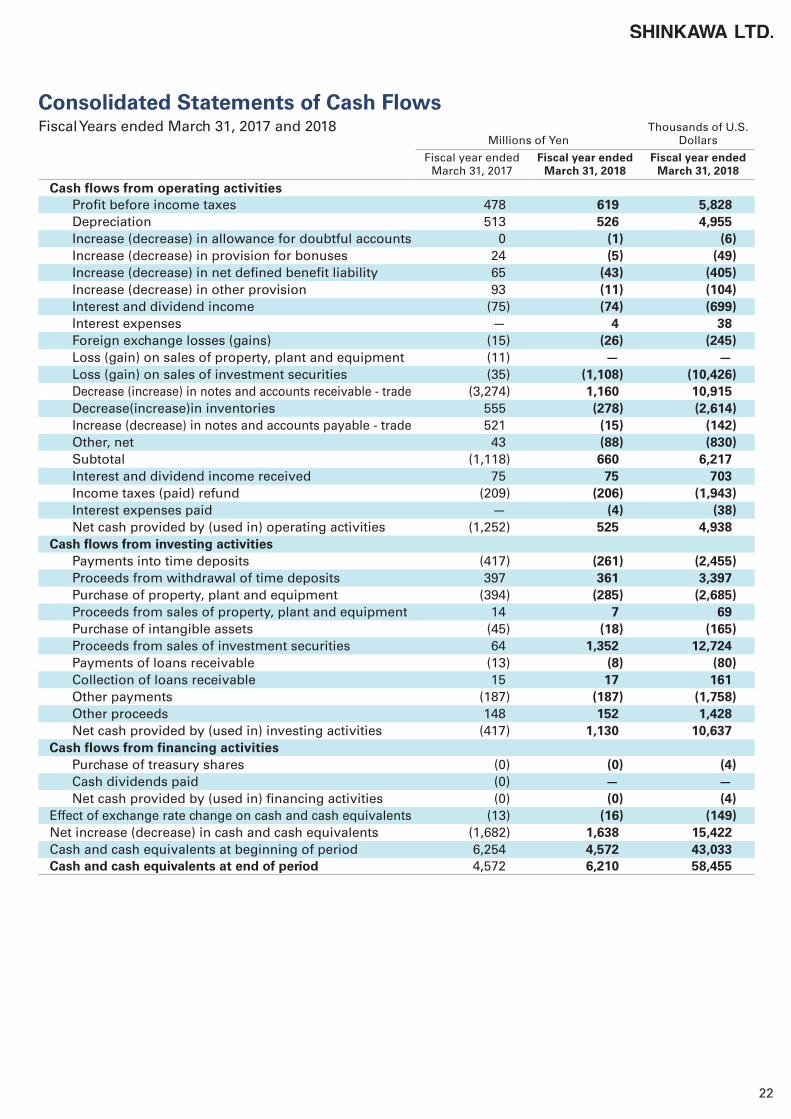
Consolidated Statements of Cash Flows
Millions of YenThousands of U.S.
Dollars
Fiscal year ended March 31, 2017
Fiscal year ended March 31, 2018
Fiscal year ended March 31, 2018
Cash flows from operating activitiesProfit before income taxes 478 619 5,828 Depreciation 513 526 4,955 Increase (decrease) in allowance for doubtful accounts 0 (1) (6)Increase (decrease) in provision for bonuses 24 (5) (49)Increase (decrease) in net defined benefit liability 65 (43) (405)Increase (decrease) in other provision 93 (11) (104)Interest and dividend income (75) (74) (699)Interest expenses — 4 38 Foreign exchange losses (gains) (15) (26) (245)Loss (gain) on sales of property, plant and equipment (11) — —Loss (gain) on sales of investment securities (35) (1,108) (10,426)Decrease (increase) in notes and accounts receivable - trade (3,274) 1,160 10,915 Decrease(increase)in inventories 555 (278) (2,614)Increase (decrease) in notes and accounts payable - trade 521 (15) (142)Other, net 43 (88) (830)Subtotal (1,118) 660 6,217 Interest and dividend income received 75 75 703 Income taxes (paid) refund (209) (206) (1,943)Interest expenses paid — (4) (38)Net cash provided by (used in) operating activities (1,252) 525 4,938
Cash flows from investing activitiesPayments into time deposits (417) (261) (2,455)Proceeds from withdrawal of time deposits 397 361 3,397 Purchase of property, plant and equipment (394) (285) (2,685)Proceeds from sales of property, plant and equipment 14 7 69 Purchase of intangible assets (45) (18) (165)Proceeds from sales of investment securities 64 1,352 12,724 Payments of loans receivable (13) (8) (80)Collection of loans receivable 15 17 161 Other payments (187) (187) (1,758)Other proceeds 148 152 1,428 Net cash provided by (used in) investing activities (417) 1,130 10,637
Cash flows from financing activitiesPurchase of treasury shares (0) (0) (4)Cash dividends paid (0) — —Net cash provided by (used in) financing activities (0) (0) (4)
Effect of exchange rate change on cash and cash equivalents (13) (16) (149)Net increase (decrease) in cash and cash equivalents (1,682) 1,638 15,422 Cash and cash equivalents at beginning of period 6,254 4,572 43,033 Cash and cash equivalents at end of period 4,572 6,210 58,455
Fiscal Years ended March 31, 2017 and 2018
22
010_0288501373006.indd 22 2018/09/05 10:16:47

Product Introduction
YSB55wHigh-Speed & High-Accuracy Flip Chip Bonder
FPB-1s NeoForcePackage Bonder for Multiple Processes
FPB-1w NeoForce / FPB-1ws NeoForcePackage Bonder for Multiple Processes
(UTC-5000NeoCu)
(FPB-1w NeoForce)
UTC-5000NeoCuHigh Speed Cu Wire Bonder Capable of Handling Wide Range of Product-Types from Fine Pitch Devices to Power Devices
UTC-5000High Speed Wire Bonder Capable of Handling Wide Range of Product-Types from Fine Pitch Devices to Power Devices
UTC-5100High Speed Wire Bonder for LED and Discrete Devices with Enhanced Productivity and Wide Frame Handling Capability
Wire Bonder
Flip Chip Bonder
STC-800Discrete Application Die Bonder
SPA-1000High-Accuracy Twin-Head Die Bonder
Die Bonder
SBB-5200Wide Area Handling High-speed Wafer Bump Bonder
Bump Bonder
Annual Report 2018
23
010_0288501373006.indd 23 2018/09/05 10:16:52
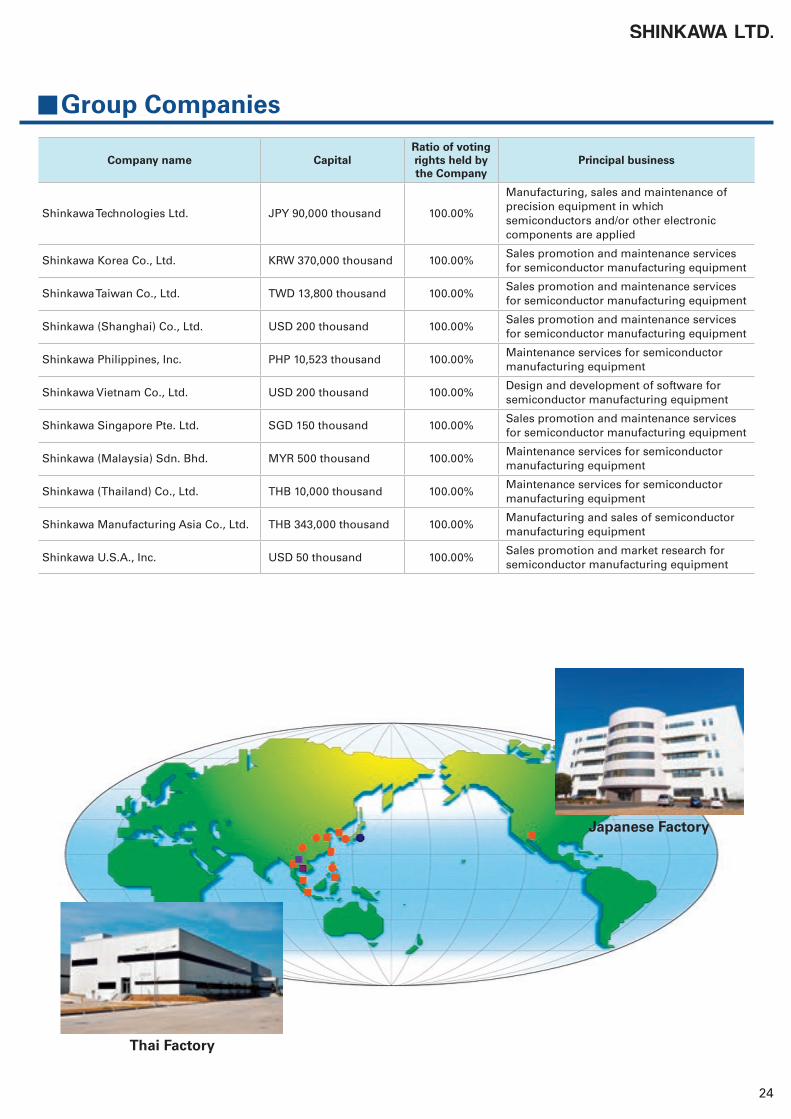
Group Companies
Company name CapitalRatio of voting rights held by the Company
Principal business
Shinkawa Technologies Ltd. JPY 90,000 thousand 100.00%
Manufacturing, sales and maintenance of precision equipment in which semiconductors and/or other electronic components are applied
Shinkawa Korea Co., Ltd. KRW 370,000 thousand 100.00%Sales promotion and maintenance services for semiconductor manufacturing equipment
Shinkawa Taiwan Co., Ltd. TWD 13,800 thousand 100.00%Sales promotion and maintenance services for semiconductor manufacturing equipment
Shinkawa (Shanghai) Co., Ltd. USD 200 thousand 100.00%Sales promotion and maintenance services for semiconductor manufacturing equipment
Shinkawa Philippines, Inc. PHP 10,523 thousand 100.00%Maintenance services for semiconductor manufacturing equipment
Shinkawa Vietnam Co., Ltd. USD 200 thousand 100.00%Design and development of software for semiconductor manufacturing equipment
Shinkawa Singapore Pte. Ltd. SGD 150 thousand 100.00%Sales promotion and maintenance services for semiconductor manufacturing equipment
Shinkawa (Malaysia) Sdn. Bhd. MYR 500 thousand 100.00%Maintenance services for semiconductor manufacturing equipment
Shinkawa (Thailand) Co., Ltd. THB 10,000 thousand 100.00%Maintenance services for semiconductor manufacturing equipment
Shinkawa Manufacturing Asia Co., Ltd. THB 343,000 thousand 100.00%Manufacturing and sales of semiconductor manufacturing equipment
Shinkawa U.S.A., Inc. USD 50 thousand 100.00%Sales promotion and market research for semiconductor manufacturing equipment
Thai Factory
Japanese Factory
24
010_0288501373006.indd 24 2018/09/05 10:16:53
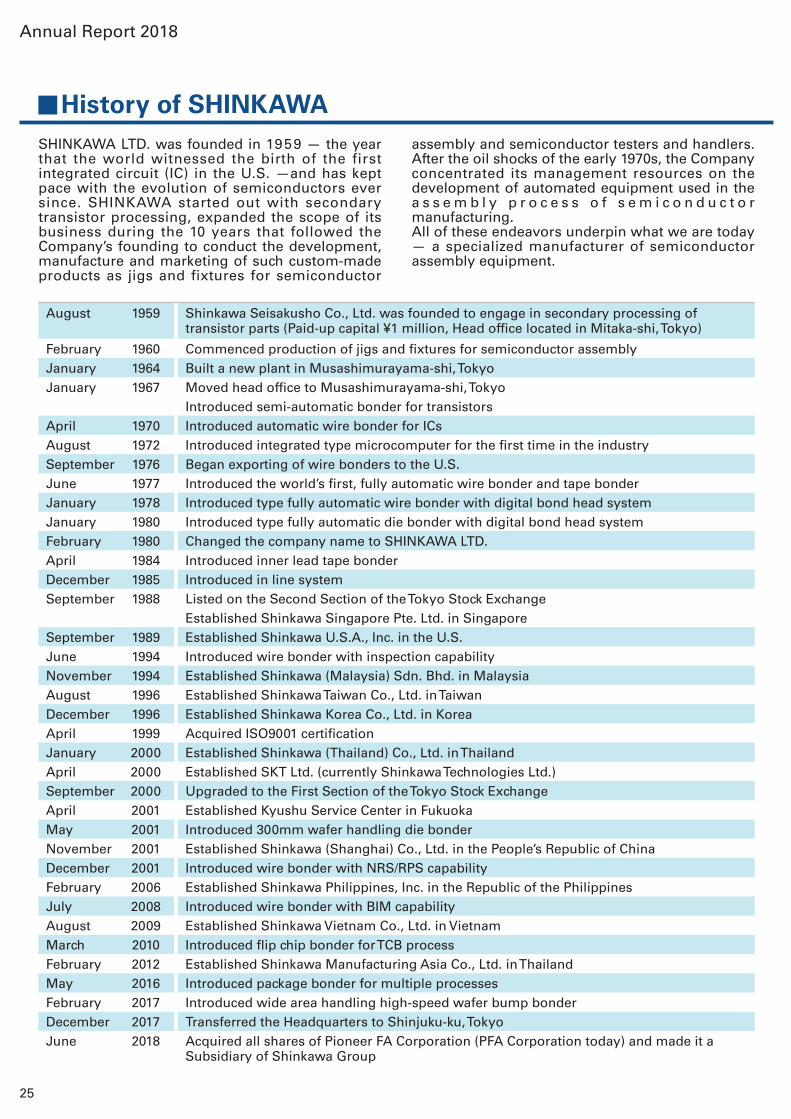
History of SHINKAWASHINKAWA LTD. was founded in 1959 — the year that the world witnessed the birth of the first integrated circuit (IC) in the U.S. —and has kept pace with the evolution of semiconductors ever since. SHINKAWA started out with secondary transistor processing, expanded the scope of its business during the 10 years that followed the Company’s founding to conduct the development, manufacture and marketing of such custom-made products as jigs and fixtures for semiconductor
assembly and semiconductor testers and handlers. After the oil shocks of the early 1970s, the Company concentrated its management resources on the development of automated equipment used in the a s s e m b l y p r o c e s s o f s e m i c o n d u c t o r manufacturing.All of these endeavors underpin what we are today — a specialized manufacturer of semiconductor assembly equipment.
August 1959 Shinkawa Seisakusho Co., Ltd. was founded to engage in secondary processing of transistor parts (Paid-up capital ¥1 million, Head office located in Mitaka-shi, Tokyo)
February 1960 Commenced production of jigs and fixtures for semiconductor assemblyJanuary 1964 Built a new plant in Musashimurayama-shi, TokyoJanuary 1967 Moved head office to Musashimurayama-shi, Tokyo
Introduced semi-automatic bonder for transistorsApril 1970 Introduced automatic wire bonder for ICsAugust 1972 Introduced integrated type microcomputer for the first time in the industrySeptember 1976 Began exporting of wire bonders to the U.S.June 1977 Introduced the world’s first, fully automatic wire bonder and tape bonderJanuary 1978 Introduced type fully automatic wire bonder with digital bond head systemJanuary 1980 Introduced type fully automatic die bonder with digital bond head systemFebruary 1980 Changed the company name to SHINKAWA LTD.April 1984 Introduced inner lead tape bonderDecember 1985 Introduced in line systemSeptember 1988 Listed on the Second Section of the Tokyo Stock Exchange
Established Shinkawa Singapore Pte. Ltd. in SingaporeSeptember 1989 Established Shinkawa U.S.A., Inc. in the U.S.June 1994 Introduced wire bonder with inspection capabilityNovember 1994 Established Shinkawa (Malaysia) Sdn. Bhd. in MalaysiaAugust 1996 Established Shinkawa Taiwan Co., Ltd. in TaiwanDecember 1996 Established Shinkawa Korea Co., Ltd. in KoreaApril 1999 Acquired ISO9001 certificationJanuary 2000 Established Shinkawa (Thailand) Co., Ltd. in ThailandApril 2000 Established SKT Ltd. (currently Shinkawa Technologies Ltd.)September 2000 Upgraded to the First Section of the Tokyo Stock ExchangeApril 2001 Established Kyushu Service Center in FukuokaMay 2001 Introduced 300mm wafer handling die bonderNovember 2001 Established Shinkawa (Shanghai) Co., Ltd. in the People’s Republic of ChinaDecember 2001 Introduced wire bonder with NRS/RPS capabilityFebruary 2006 Established Shinkawa Philippines, Inc. in the Republic of the PhilippinesJuly 2008 Introduced wire bonder with BIM capabilityAugust 2009 Established Shinkawa Vietnam Co., Ltd. in VietnamMarch 2010 Introduced flip chip bonder for TCB processFebruary 2012 Established Shinkawa Manufacturing Asia Co., Ltd. in ThailandMay 2016 Introduced package bonder for multiple processesFebruary 2017 Introduced wide area handling high-speed wafer bump bonderDecember 2017 Transferred the Headquarters to Shinjuku-ku, TokyoJune 2018 Acquired all shares of Pioneer FA Corporation (PFA Corporation today) and made it a
Subsidiary of Shinkawa Group
Annual Report 2018
25
010_0288501373006.indd 25 2018/09/05 10:16:53
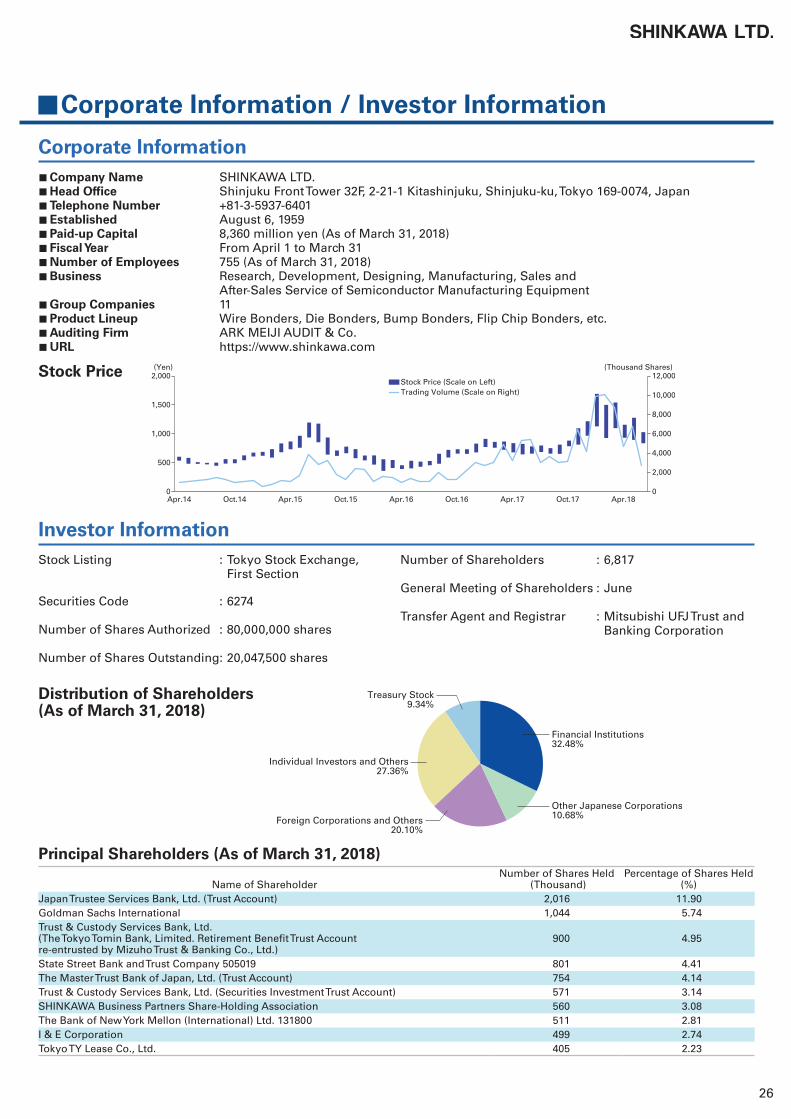
■Company Name SHINKAWA LTD.■Head Office Shinjuku Front Tower 32F, 2-21-1 Kitashinjuku, Shinjuku-ku, Tokyo 169-0074, Japan■Telephone Number +81-3-5937-6401■Established August 6, 1959■Paid-up Capital 8,360 million yen (As of March 31, 2018)■ Fiscal Year From April 1 to March 31■Number of Employees 755 (As of March 31, 2018)■Business Research, Development, Designing, Manufacturing, Sales and
After-Sales Service of Semiconductor Manufacturing Equipment■Group Companies 11■Product Lineup Wire Bonders, Die Bonders, Bump Bonders, Flip Chip Bonders, etc.■Auditing Firm ARK MEIJI AUDIT & Co.■URL https://www.shinkawa.com
Stock Listing : Tokyo Stock Exchange, First Section
Securities Code : 6274
Number of Shares Authorized : 80,000,000 shares
Number of Shares Outstanding: 20,047,500 shares
Number of Shareholders : 6,817
General Meeting of Shareholders : June
Transfer Agent and Registrar : Mitsubishi UFJ Trust and Banking Corporation
Corporate Information / Investor Information
Corporate Information
Investor Information
Stock Price
Distribution of Shareholders(As of March 31, 2018)
Principal Shareholders (As of March 31, 2018)
Stock Price (Scale on Left)Trading Volume (Scale on Right)
(Yen) (Thousand Shares)
0
500
1,000
2,000
1,500
0
2,000
4,000
8,000
6,000
12,000
10,000
Apr.17Oct.16 Apr.18Oct.17Apr.16Oct.15Apr.15Oct.14Apr.14
Financial Institutions32.48%
Other Japanese Corporations10.68%Foreign Corporations and Others
20.10%
Individual Investors and Others27.36%
Treasury Stock9.34%
Name of ShareholderNumber of Shares Held
(Thousand)Percentage of Shares Held
(%)Japan Trustee Services Bank, Ltd. (Trust Account) 2,016 11.90 Goldman Sachs International 1,044 5.74 Trust & Custody Services Bank, Ltd.(The Tokyo Tomin Bank, Limited. Retirement Benefit Trust Accountre-entrusted by Mizuho Trust & Banking Co., Ltd.)
900 4.95
State Street Bank and Trust Company 505019 801 4.41 The Master Trust Bank of Japan, Ltd. (Trust Account) 754 4.14 Trust & Custody Services Bank, Ltd. (Securities Investment Trust Account) 571 3.14 SHINKAWA Business Partners Share-Holding Association 560 3.08 The Bank of New York Mellon (International) Ltd. 131800 511 2.81 I & E Corporation 499 2.74 Tokyo TY Lease Co., Ltd. 405 2.23
26
010_0288501373006.indd 26 2018/09/05 10:16:53
Annual Report 2018
For the Year Ended March 31, 2018
010_0288501373006.indd 1 2018/09/05 10:16:41