Demant & de Graaf Dutch Deradicalization Policy in the Case of Moluccan & Islamic Radicals_2010
ANNUALREPORT
2017

Since its launch, many users and professionals have experienced the difference of Ponto 3 SuperPower, recognising that this product is a game changer. All users of bone anchored hearing systems benefit from a sound processor with the highest pos-sible maximum output. As the most powerful abutment-level sound processor in the market, Ponto 3 SuperPower provides premium sound quality and a unique option for the majority of users of bone anchored hearing systems.
“The Ponto has increased my capabilities, my gifts and passions”Camilla Gilbert was born with a hearing loss. She is a BAHS user and has witnessed the benefits of Oticon Medical’s Ponto first-hand. Listen to her story.
About the front coverBone anchored hearing systems (BAHS) like Ponto are designed to use your body’s natural ability to transfer sound through bone conduction. The implanted part is discreetly placed through the skin on the scull bone and lets you snap on the sound processor. The powerful sound processor is worn behind the ear and converts sound into vibrations, which are then sent through the skull bone directly to your inner ear.
Read more: demant.com
WILLIAM DEMANT ANNUAL REPORT 2017 3CONTENTS
CONTENTS
INSIGHTS AND HIGHLIGHTSKey figures and financial ratios 4CEO letter 8At a glance 10Financial review 14Outlook 20
SHAREHOLDER INFORMATION AND CORPORATE GOVERNANCEShareholder information 34Risk management activities 37Corporate social responsibility 40Corporate governance 41Executive Board and Board of Directors 43
OUR BUSINESSHearing Devices 22Hearing Implants 26Diagnostic Instruments 28Personal Communication 30Strategic Group initiatives 32
FINANCIAL REPORTManagement statement 47Independent auditor’s report 48Consolidated financial statements 51Notes to consolidated financial statements 59Parent financial statements 114Notes to Parent financial statements 119Subsidiaries, associates and joint ventures 128

4 WILLIAM DEMANT ANNUAL REPORT 2017KEY FIGURES AND FINANCIAL RATIOS – DKK
2015
10,665 7,895 7,895
763 2,203
325 1,878 1,902
-69 1,809 1,439
3,703 14,390
6,500
375 1,592 1,602 1,129
10,803
74.0%74.0%20.7%17.6%17.8%23.7%45.2%
5.30 5.89 4.18
024.1
25.0 131.4
35,126270.13
2014
9,346 6,813
- 680
2,055 294
1,761 -
-70 1,691 1,327
2,405 11,219
5,584
354 1,495
- 1,044
9,799
72.9%-
22.0%18.8%
-24.7%49.8%
4.80 5.38 3.75
0 20.1 20.0 93.6
25,545 278.13
2013
8,959 6,518
- 634
2,028 292
1,736 -
-72 1,664 1,286
2,284 10,318
5,056
391 1,282
- 819
9,063
72.8%-
22.6%19.4%
-28.0%49.0%
4.50 4.53 2.89
0 17.9 23.0
105.4 29,754283.11
2016
12,002 9,030 9,102
839 2,346
404 1,942 2,130
-101 1,841 1,464
4,036 15,548
6,966
299 1,679 1,7561,223
12,339
75.2%75.8%19.5%16.2%17.7%21.5%44.8%
5.53 6.37 4.64
0 26.4 22.2
122.8 31,829 263.75
2017
13,189 10,026 10,064
919 2,742
404 2,338 2,504
-111 2,227 1,759
4,030 16,222
7,433
292 1,872 2,023 1,387
13,280
76.0%76.3%20.8%17.7%19.0%24.0%45.8%
6.84 7.30 5.41
0 28.9 25.4
173.5 43,864 256.56
INCOME STATEMENT, DKK MILLIONRevenueGross profitGross profit – adjustedR&D costs EBITDAAmortisation and depreciation etc.Operating profit (EBIT)Operating profit (EBIT) – adjustedNet financial itemsProfit before taxProfit for the year
BALANCE SHEET, DKK MILLIONNet interest-bearing debtAssetsEquity
OTHER KEY FIGURES, DKK MILLIONInvestment in property, plant and equipment, netCash flow from operating activities (CFFO)Cash flow from operating activities (CFFO) – adjustedFree cash flowAverage number of employees
FINANCIAL RATIOSGross profit marginGross profit margin – adjustedEBITDA marginProfit margin (EBIT margin)Profit margin (EBIT margin) – adjustedReturn on equityEquity ratioEarnings per share (EPS), DKK*Cash flow per share (CFPS), DKK*Free cash flow per share, DKK*Dividend per share, DKK*Equity value per share, DKK*Price earnings (P/E)Share price, DKK*Market cap. adjusted for treasury shares, DKK million Average number of shares outstanding, million*
KEY FIGURES AND FINANCIAL RATIOS – DKK
Financial ratios are calculated in accordance with “Recommendations and Financial Ratios 2015” from the Danish Society of Financial Analysts. The free cash flow is calculated as the sum of cash flow from operating activities (CFFO) and investing activities (CFFI) before acquisitions and disposals of enterprises, participating interests and activities. On computation of the return on equity, average equity is calculated, duly considering the buy-back of shares. Half-yearly key figures have not been audited.
* Per share of nominally DKK 0.20.

WILLIAM DEMANT ANNUAL REPORT 2017 5KEY FIGURES AND FINANCIAL RATIOS – DKK
2016H2
6,192 4,681 4,733
435 1,322
220 1,102 1,238
-58 1,044
830
4,036 15,548
6,966
153
951
988 719
12,483
75.6%76.4%21.4%17.8%20.0%24.1%44.8%
3.16 3.63 2.75
0 26.4 22.2
122.8
31,829 261.68
2016H1
5,810 4,349 4,369
404 1,024
184 840 892 -43
797 634
3,914 14,946
6,704
146
728
768 504
12,194
74.9%75.2%17.6%14.5%15.4%19.0%44.9%
2.40 2.74 1.90
0 25.2 27.4
130.0
34,309 265.82
2017H1
6,505 4,939 4,956
458 1,256
197 1,059 1,142
-55 1,004
798
4,081 16,082
7,248
124
886
969 660
13,047
75.9%76.2%19.3%16.3%17.6%22.3%45.1%
3.10 3.43 2.56
0 28.1 27.3
168.5
43,222 257.94
2017H2
6,684 5,087 5,108
461 1,486
207 1,279 1,362
-56 1,223
961
4,030 16,222
7,433
168
986
1,054 727
13,514
76.1%76.4%22.2%19.1%20.4%25.7%45.8%
3.75 3.86 2.85
0 28.9 25.4
173.5
43,864 255.18
INCOME STATEMENT, DKK MILLIONRevenueGross profitGross profit – adjustedR&D costs EBITDAAmortisation and depreciation etc.Operating profit (EBIT)Operating profit (EBIT) – adjustedNet financial itemsProfit before taxProfit for the year
BALANCE SHEET, DKK MILLIONNet interest-bearing debtAssetsEquity
OTHER KEY FIGURES, DKK MILLIONInvestment in property, plant and equipment, netCash flow from operating activities (CFFO)Cash flow from operating activities (CFFO) – adjustedFree cash flowAverage number of employees
FINANCIAL RATIOSGross profit marginGross profit margin – adjustedEBITDA marginProfit margin (EBIT margin)Profit margin (EBIT margin) – adjustedReturn on equityEquity ratioEarnings per share (EPS), DKK*Cash flow per share (CFPS), DKK*Free cash flow per share, DKK*Dividend per share, DKK*Equity value per share, DKK*Price earnings (P/E)Share price, DKK*Market cap. adjusted for treasury shares, DKK million Average number of shares outstanding, million*
KEY FIGURES AND FINANCIAL RATIOS – DKK
2015H2
5,622 4,152 4,152
394 1,167
169 998
1,011 -36
962 770
3,703 14,390
6,500
186
837
842 586
11,247
73.9%73.9%20.8%17.8%18.0%24.5%45.2%
2.86 3.12 2.18
0 24.1 25.0
131.4
35,126 268.52
2015H1
5,043 3,743 3,743
369 1,036
156 880 891 -33
847 669
2,381 12,099
6,088
189
755
760 543
10,360
74.2%74.2%20.5%17.4%17.7%22.6%50.3%
2.46 2.78 2.00
0 22.4 20.0
102.2
27,551 271.74
* Per share of nominally DKK 0.20.

WILLIAM DEMANT ANNUAL REPORT 20176 KEY FIGURES AND FINANCIAL RATIOS – EUR**
2015
1,434256193873215
4,718
2014
1,256-
178750
-3,431
2013
1,204-
173679
-3,997
2016
1,613286197936236
4,275
2017
1,773337236998272
5,892
INCOME STATEMENT, EUR MILLIONRevenueOperating profit (EBIT) – adjustedProfit for the yearEquityCash flow from operating activities (CFFO) – adjustedMarket cap. adjusted for treasury shares
KEY FIGURES AND FINANCIAL RATIOS – EUR**
** On translation of key figures and financial ratios from Danish kroner to euro, Danmarks Nationalbank’s rate of exchange as of 29 December 2017 of 744.49 has been used for balance sheet items, and the average rate of exchange of 743.86 has been used for the income statement and cash flow items.
2016H2
832 166 112 936
133
4,275
2016H1
781 120
85 900
103 4,608
2017H1
874 154 107 974
130 5,806
2017H2
899 183 129 998
142 5,892
KEY FIGURES, EUR MILLIONRevenueOperating profit (EBIT) – adjustedProfit for the yearEquityCash flow from operating activities (CFFO) – adjustedMarket cap. adjusted for treasury shares
2015H2
756 136 104 873
113 4,718
2015H1
678 120
90 818
102 3,701

WILLIAM DEMANT ANNUAL REPORT 2017 7

8 KAPITEL WILLIAM DEMANT ANNUAL REPORT 2017
CEO LETTER
Another record year for William DemantSøren NielsenPresident & CEO
“Hearing care is healthcare, and as CEO of William Demant Holding, I feel that it is my duty to keep stressing the im-portance of this statement and to spread this message to the global healthcare community. In December 2017, The Lancet Commission on Dementia reported that cognitive decline, depression and dementia are strongly associated with hearing loss, giving evidence to the fact that inter-vention in hearing loss can reduce the burden of these diseases – for society, but most importantly for people.
In William Demant, we have known for years that properly treated hearing loss increases the quality of life in every aspect – health, wealth and wellbeing – and has signi-ficant societal benefits. In combination, patient under-standing and modern hearing technology positively change the lives of people living with hearing loss. I am convinced
Read more: demant.com
WILLIAM DEMANT ANNUAL REPORT 2017 9CEO LETTER
CEO LETTER
that the treatment and services provided by hearing care professionals are paramount to those suffering from hear-ing impairment. In fact, the belief that our services and products make a life-changing difference for people living with hearing loss permeates the whole Group and moti-vates us in our daily work. We believe in the value we cre-ate, which is why we decided many years ago to become part of the entire hearing healthcare market – across all product areas from hearing devices and hearing implants to diagnostic equipment. That way, we can help reduce the burdens associated with hearing loss and contribute to the elements that constitute the joy of a healthy life.
The past year has indeed confirmed that we deliver on this strategy and vision, with 2017 being another record year for William Demant. We delivered strong organic growth of 9% and very strong earnings of DKK 2.5 billion – both testaments to the fact that we offer products and services that more and more customers and end-users want. All our business activities – Hearing Devices, Hearing Implants and Diagnostic Instruments – are showing solid progress, enabled and fuelled by our hearing healthcare strategy and dedication to innovation. The outstanding performance of Oticon Opn and the advances in audiology, connectivity and rechargeability it represents have been key drivers of the very positive development the Group has seen. The open sound paradigm resonates well with customers and end-users alike, and our hearing aid wholesale business is a main driver of organic growth and thus market share gains. I am also delighted with our efforts in our retail business, where we have achieved strong growth while also refining our IT systems, marketing and sales excel-lence.
Another significant part of the William Demant Group is our business activity Diagnostic Instruments. Thanks to a global distribution set-up and innovative products, we deliver high growth and hold a leading position in the mar-ket. Also in Hearing Implants, we continue to expand our activities. Through hard and very skilled work, we have over a relatively short period of time built a competitive hearing implants business with a strong BAHS product portfolio. We are on the verge of launching Neuro 2, the world’s smallest CI processor, which has already received massive interest at industry conventions in 2017. By using technology developed for our hearing aids in our hearing implants, we exploit the synergies in hearing healthcare. We also continue to exploit the synergy between our joint venture, brand Sennheiser Communications, and the Group’s R&D function.
The exploitation of synergies takes place across the whole Group and is strongly supported by our shared services organisation. We see clear synergies in and between R&D, infrastructure, global distribution, operations and our dif-ferent business units that enable us to strengthen our com-petitive position. Keeping our competitive strength is also about being able to stick to our plans and deliver on our strategic initiatives – even when this calls for difficult de-cisions. In 2017, we moved our R&D activities from Bern to our major locations in Poland and Denmark, and we have executed on the plans to ramp down our production site in Thisted, Denmark, which will close at the end of 2018. These initiatives have affected valued employees, and I am very grateful for their cooperation all the way. If we look into 2018, it is key that we continue our expan-sion in R&D and focus our efforts and capabilities on bring-ing innovative products to market. We will also deepen our understanding of the market, broaden our sales channels – and knowledge of them – and get even closer to our cus-tomers. As I mentioned earlier and in relation to the current debate about over-the-counter products, I can only stress the importance and value of the hearing care professional in the treatment of hearing loss. It is not a quick fix.
Digital transformation is currently a hot topic in many in-dustries and will be for many years to come. For William Demant, it is important to have digital trends on the agen-da, and we embrace the topic by looking into new oppor-tunities. We see these trends more as a way of expanding the current market than disrupting it – all with a view to rewarding the users of our products with solutions that are compatible with modern life in the digital age. By way of example, at the Consumer Electronics Show (CES) we received an innovation award for a hearing fitness app that encourages hearing aid users to live a better and healthier life and advises them on how to achieve this.
Finally, I would like to underline that 2017 was a great year for William Demant and a very special year for me. I took over the role as CEO of William Demant in April, and I am very grateful for the positive way in which our customers, investors and business partners have met me in this new role. Thank you very much for your trust in William Demant and thanks to each and every user of our hearing health-care solutions. I would also like to give a very big thank you to all the employees of the Group for their support and for confirming my belief that everything we do revolves around getting users to find joy in life by using our hearing healthcare products and services. By always striving to do our very best, we remain innovative and in front.
10 WILLIAM DEMANT ANNUAL REPORT 2017AT A GLANCE
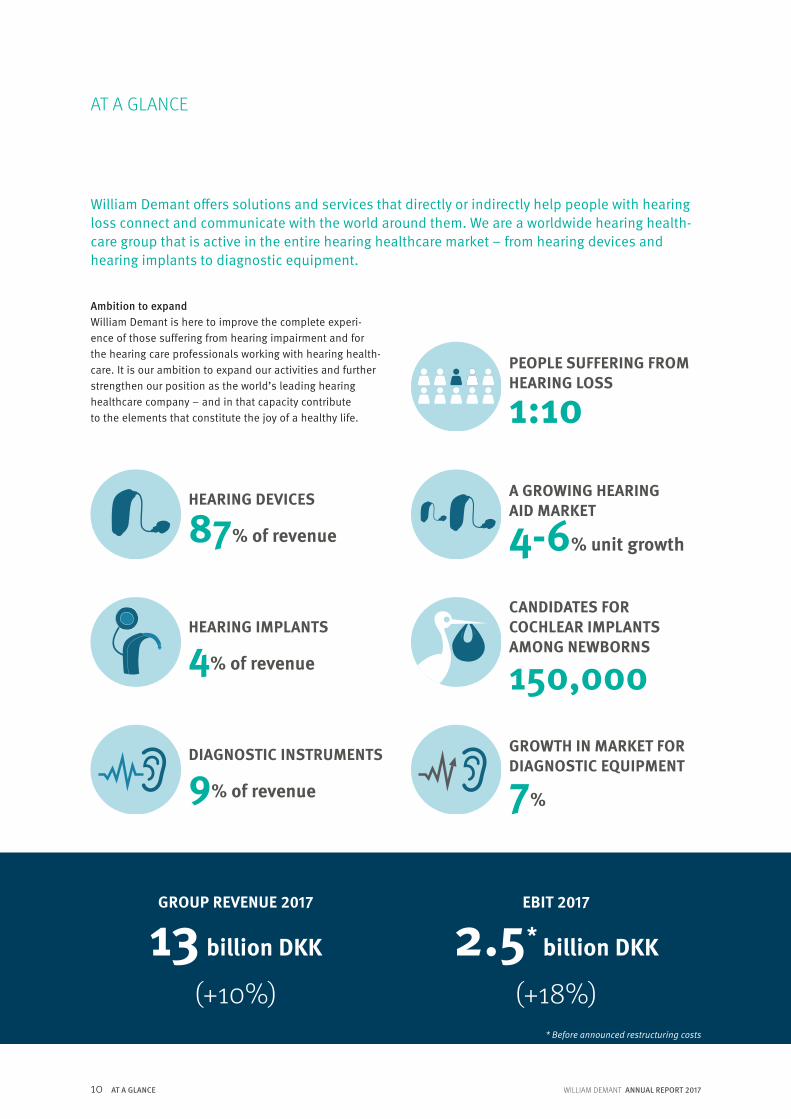
William Demant offers solutions and services that directly or indirectly help people with hearing loss connect and communicate with the world around them. We are a worldwide hearing health-care group that is active in the entire hearing healthcare market – from hearing devices and hearing implants to diagnostic equipment.
Ambition to expandWilliam Demant is here to improve the complete experi-ence of those suffering from hearing impairment and for the hearing care professionals working with hearing health-care. It is our ambition to expand our activities and further strengthen our position as the world’s leading hearing healthcare company – and in that capacity contribute to the elements that constitute the joy of a healthy life.
GROUP REVENUE 2017
13 billion DKK
(+10%)
EBIT 2017
2.5* billion DKK
(+18%)
A GROWING HEARING AID MARKET
4-6% unit growth
HEARING IMPLANTS
4% of revenue
PEOPLE SUFFERING FROMHEARING LOSS
1:10
HEARING DEVICES
87% of revenue
DIAGNOSTIC INSTRUMENTS
9% of revenue
AT A GLANCE
GROWTH IN MARKET FOR DIAGNOSTIC EQUIPMENT
7%
CANDIDATES FOR COCHLEAR IMPLANTS AMONG NEWBORNS
150,000
* Before announced restructuring costs
WILLIAM DEMANT ANNUAL REPORT 2017 11AT A GLANCE
FREE CASH FLOW 2017
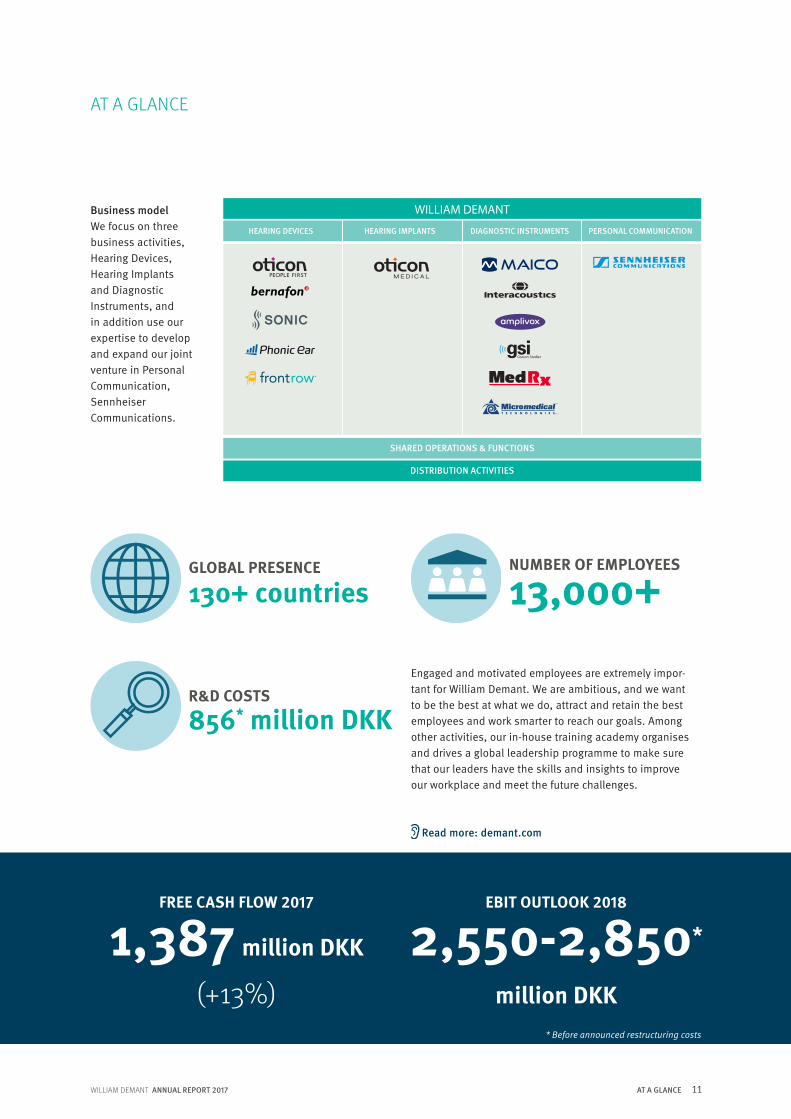
1,387 million DKK
(+13%)
EBIT OUTLOOK 2018
2,550-2,850*
million DKK
GLOBAL PRESENCE
130+ countriesNUMBER OF EMPLOYEES
13,000+
Business modelWe focus on three business activities, Hearing Devices, Hearing Implants and Diagnostic Instruments, and in addition use our expertise to develop and expand our joint venture in Personal Communication, Sennheiser Communications.
AT A GLANCE
HEARING DEVICES HEARING IMPLANTS DIAGNOSTIC INSTRUMENTS
SHARED OPERATIONS & FUNCTIONS
DISTRIBUTION ACTIVITIES
PERSONAL COMMUNICATION
WILLIAM DEMANT
R&D COSTS
856* million DKK
Engaged and motivated employees are extremely impor-tant for William Demant. We are ambitious, and we want to be the best at what we do, attract and retain the best employees and work smarter to reach our goals. Among other activities, our in-house training academy organises and drives a global leadership programme to make sure that our leaders have the skills and insights to improve our workplace and meet the future challenges.
* Before announced restructuring costs
Read more: demant.com

12 WILLIAM DEMANT ANNUAL REPORT 2017
AT A GLANCE
Hearing Devices
INFRASTRUCTURE
IN
NOVATION
GLOBAL DISTRIBUTION
Hear
ing Implants
Diagnostic Instruments
Our strategic ambition is to further expand our position as the leading global hearing healthcare company with the broadest and deepest product offering. We invest in inno-vation and R&D, and a key focus area for us is to exploit synergies across our business activities and enable our customers and end-users to benefit from our multi-brand approach backed by a comprehensive global distribution set-up and efficient infrastructure.
William Demant has a strong record of successfully devel-oping businesses from being relatively small to becoming market leaders. In the past decades, our Hearing Devices
Our international R&D organisation is a major catalyst for innovation projects. In 2017, we
significantly expanded our software development centre in Warsaw, Demant Technology
Centre. Along with our sites in Denmark, France, Sweden and Poland, our research centre
Eriksholm plays a key role in our endeavours to always be at the forefront of develop-
ment, enabling us to deliver the most innovative solutions to customers and end-users.
business activity has succeeded in gaining material mar-ket shares through our strong wholesale business and own retail activities. We have furthermore built market-leading entities in the fields of diagnostics and bone anchored hearing systems (BAHS), and through a combination of organic and acquisitive growth, we have successfully inte-grated them into the William Demant Group. It is our clear ambition to also develop our cochlear implants (CI) busi-ness to continue to gain market share in the coming years, which will further strengthen our leading hearing health-care position.
AT A GLANCE
Our vision is to make a life-changing difference
to people living with hearing loss.

WILLIAM DEMANT ANNUAL REPORT 2017 13AT A GLANCE
AT A GLANCEREAD MORE
www
.
Help more people hear betterDelivering accurate test results, the new automated hearing test, AMTAS, eases the life of the hearing care professional.
New scientific evidence highlights benefits of Oticon Opn
A step on the way towards data-driven healthcareOticon is the master behind the world’s first hearing aid app dedicated to hearing fitness.
“They are cured. That is very rewarding. It helps people.” Joachim Hougaard, Technical Product Manager, Interacoustics, talks about the effect of the balance chair on people who have been in therapy numerous times without any effect. Learn more about the cure for benign paroxysmal positionel vertigo – or dizziness.
Oticon Medical is ready with Neuro 2Marking a true change for Oticon Medical, the Neuro 2 sound processor is a leap forward in terms of design, usabilityand performance.
“My hearing aid has restored my normal hearing”In her work as theatre manager at the Betty Nansen Theatre in Copenhagen, Vibeke Windeløv is very dependent on her hearing aids. Watch the video to learn more about Vibeke’s life with Opn hearing aids.
An exciting new study shows that OpenSounds Navigator, the cutting-edge feature in Oticon Opn, improves speech understanding from 20% to 75% in restaurant-like envi-ronments (Le Goff and Beck 2017, Oticon whitepaper).
Read more: demant.com Read more: demant.com
Read more: demant.com Read more: demant.com
Read more: demant.com Read more: demant.com

14 KAPITEL WILLIAM DEMANT ANNUAL REPORT 2017
FINANCIAL REVIEW

WILLIAM DEMANT ANNUAL REPORT 2017 15FINANCIAL REVIEW
FINANCIAL REVIEW
Financial highlights
• Consolidated revenue for 2017 totalled DKK 13,189 million, matching a strong growth rate of 10% of which organic and acquisitive growth accounted for 9 and 2 percentage points, respectively, and exchange rates accounted for -1 percentage point.
• Due to innovation and strong commercial execution, all three business activities gained market share in 2017, resulting in organic growth rates of 8% in Hearing Devices, 28% in Hearing Implants and 11% in Diagnostic Instruments. Our hearing aid wholesale business deliv-ered strong organic growth of 11% due to a combination of positive trends in geography, channel and product mixes, continuously strong performance by Oticon Opn throughout the year and new products launched by Bernafon and Sonic in the second half-year. Our retail business delivered an organic growth rate of 4%.
• Operating profit (EBIT) increased by 18% to DKK 2,504 million before restructuring costs of DKK 166 million, which was within our guidance of DKK 2,300-2,600 mil-lion and despite a negative exchange rate effect of DKK 103 million compared to 2016. The corresponding EBIT margin increased by 1.3 percentage points from 17.7% to 19.0%, and the underlying EBIT was up by 25%, corre-sponding to a margin increase of 2.3 percentage points. The significant improvement in EBIT was mainly driven by strong revenue growth, mix changes and cost savings from strategic ini-tiatives. The reported EBIT for 2017 was DKK 2,338 million, and earnings per share increased by 24% to DKK 6.84.
HEARING DEVICES – WHOLESALE
11% organic growth
HEARING IMPLANTS
28% organic growth
HEARING DEVICES – RETAIL
4% organic growth
DIAGNOSTIC INSTRUMENTS
11% organic growth
The Group generated an EBIT of DKK 2,504 million before restructuring costs and growth of 25% in underlying EBIT, when adjusting for the negative exchange rate effect of DKK 103 million compared to 2016 and for one-offs in 2016.
• Cash flow from operating activities (CFFO) increased by 15% to DKK 2,023 million before restructuring costs (reported CFFO of DKK 1,872 million). The free cash flow before acquisitions amounted to DKK 1,387 million, up by 13% on 2016.
• In 2018, the William Demant Group expects to continue to generate substantial organic sales growth. Based on exchange rates at the end of January 2018 and if we in-clude the impact of exchange rate hedging, we expect a negative exchange rate effect on revenue of around 4% in 2018. We are guiding for an operating profit (EBIT) of DKK 2,550-2,850 million before restructuring costs of DKK 150 million, and we expect to buy back shares worth DKK 1.5-2.0 billion.

16 WILLIAM DEMANT ANNUAL REPORT 2017FINANCIAL REVIEW
FINANCIAL REVIEW
As previously announced, the Group has initiated a restructuring programme, and the commentary below on our financial results until Operating profit is based on figures adjusted for restructuring costs, unless otherwise indicated.
Revenue and exchange rate effectIn the reporting period, Group revenue amounted to DKK 13,189 million, corresponding to a growth rate of 10%, including a negative exchange rate effect of less than 1 percentage point. Organic growth contributed by 9 per-centage points and acquisitions by 2 percentage points.
12,002-2,9009,102
75.8%
-784-5,618
-65181
2,13017.7%
13,189-3,163
10,02676.0%
-919-6,095
-72753
2,33817.7%
0-38-38
-63-38-27
0-166
13,189-3,125
10,06476.3%
-856-6,057
-70053
2,50419.0%
10%8%
11%
9%8%8%
-35%18%
Adjusted income statement (DKK million)
RevenueProduction costsGross profitGross profit margin
R&D costsDistribution costsAdministrative expensesShare of profit after tax, associates and joint venturesOperating profit (EBIT)Profit margin (EBIT margin)
Adjusted 2016
Reported 2017
Restructuring costs
Adjusted 2017
Growth
Revenue by geographic region
Europe North America Pacific Asia Other countries
41%
41%7%
7% 4%
EuropeGroup revenue in Europe saw solid growth of 6% to DKK 5,437 million, or 8% in local currencies. Growth was driven by solid performances by both our wholesale business – despite the loss of sales to a large account, which was acquired by a competitor – and by our retail business. Hearing Implants delivered strong performance with double-digit organic growth, while Diagnostic Instru- ments delivered more modest growth in Europe.
North AmericaIn 2017, the Group generated revenue in North America of DKK 5,358 million, corresponding to 14% growth both in local currencies and as reported figures. Our wholesale business saw strong organic growth, the main contributors being the independent segment and continuously high unit sales to Veterans Affairs (VA), reaching 15% unit market share at year-end, up from 11% at the beginning of the year. The organic growth rate in our US retail business was relatively speaking in line with the market growth rate, however with higher growth rates in the second half of 2017 than in the first half. Both Diagnostic Instruments and Hearing Implants delivered solid double-digit growth rates in 2017.
Other regionsBoth Asia and Other countries delivered double-digit growth rates, with China and Export generating particu- larly strong growth. Growth in the Pacific region was more modest due to some challenges in the Australian hearing aid retail market in 2017.
Revenue by geographic region % changeDKK million 2017 2016 DKK LCYEurope 5,437 5,123 6% 8%North America 5,358 4,719 14% 14%Pacific 946 911 4% 3%Asia 960 861 11% 15%Other countries 488 388 26% 22%Total 13,189 12,002 10% 11%
WILLIAM DEMANT ANNUAL REPORT 2017 17FINANCIAL REVIEW
FINANCIAL REVIEW
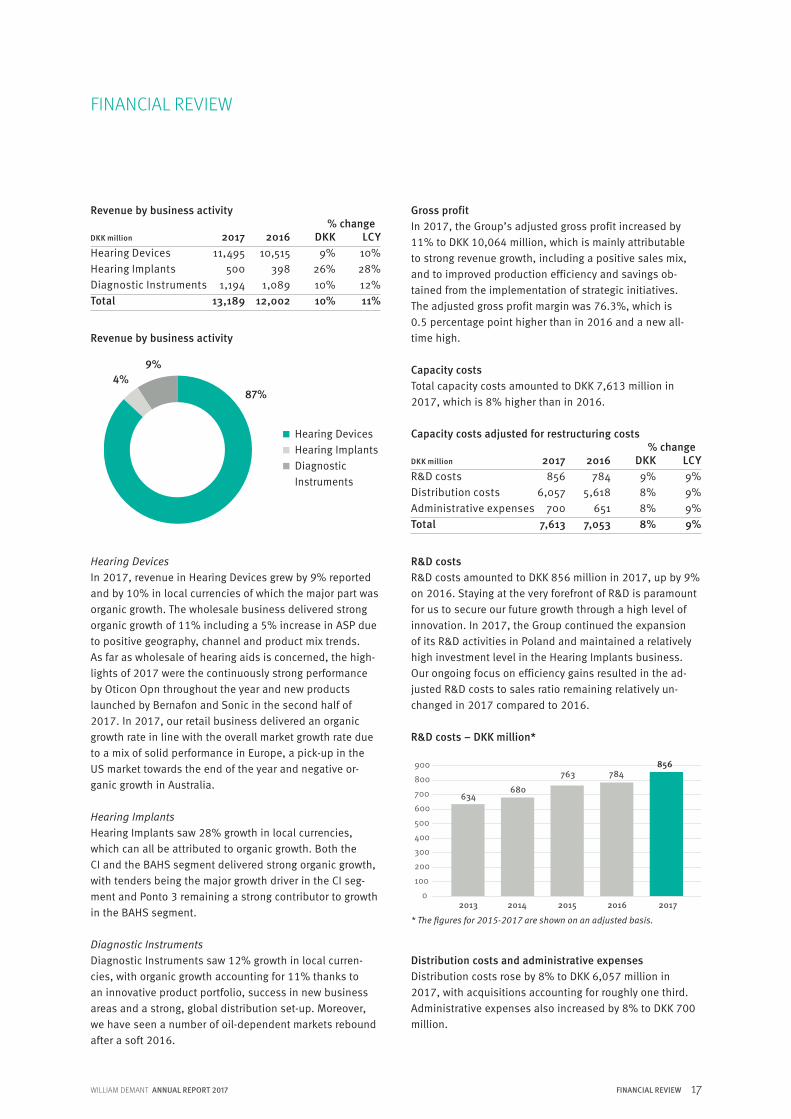
Hearing DevicesIn 2017, revenue in Hearing Devices grew by 9% reported and by 10% in local currencies of which the major part was organic growth. The wholesale business delivered strong organic growth of 11% including a 5% increase in ASP due to positive geography, channel and product mix trends. As far as wholesale of hearing aids is concerned, the high-lights of 2017 were the continuously strong performance by Oticon Opn throughout the year and new products launched by Bernafon and Sonic in the second half of 2017. In 2017, our retail business delivered an organic growth rate in line with the overall market growth rate due to a mix of solid performance in Europe, a pick-up in the US market towards the end of the year and negative or- ganic growth in Australia.
Hearing ImplantsHearing Implants saw 28% growth in local currencies, which can all be attributed to organic growth. Both the CI and the BAHS segment delivered strong organic growth, with tenders being the major growth driver in the CI seg-ment and Ponto 3 remaining a strong contributor to growth in the BAHS segment.
Diagnostic InstrumentsDiagnostic Instruments saw 12% growth in local curren-cies, with organic growth accounting for 11% thanks to an innovative product portfolio, success in new business areas and a strong, global distribution set-up. Moreover, we have seen a number of oil-dependent markets rebound after a soft 2016.
Revenue by business activity
Hearing Devices Hearing Implants Diagnostic
Instruments
87%4%
9%
Revenue by business activity % changeDKK million 2017 2016 DKK LCYHearing Devices 11,495 10,515 9% 10%Hearing Implants 500 398 26% 28% Diagnostic Instruments 1,194 1,089 10% 12%Total 13,189 12,002 10% 11%
Gross profitIn 2017, the Group’s adjusted gross profit increased by 11% to DKK 10,064 million, which is mainly attributable to strong revenue growth, including a positive sales mix, and to improved production efficiency and savings ob-tained from the implementation of strategic initiatives. The adjusted gross profit margin was 76.3%, which is 0.5 percentage point higher than in 2016 and a new all-time high.
Capacity costsTotal capacity costs amounted to DKK 7,613 million in 2017, which is 8% higher than in 2016.
R&D costsR&D costs amounted to DKK 856 million in 2017, up by 9% on 2016. Staying at the very forefront of R&D is paramount for us to secure our future growth through a high level of innovation. In 2017, the Group continued the expansion of its R&D activities in Poland and maintained a relatively high investment level in the Hearing Implants business. Our ongoing focus on efficiency gains resulted in the ad-justed R&D costs to sales ratio remaining relatively un-changed in 2017 compared to 2016.
Capacity costs adjusted for restructuring costs % changeDKK million 2017 2016 DKK LCYR&D costs 856 784 9% 9%Distribution costs 6,057 5,618 8% 9%Administrative expenses 700 651 8% 9%Total 7,613 7,053 8% 9%
0
100
200
300
400
500
600
700
800
900
2013 2014 2015 2016 2017
784856
763
680634
R&D costs – DKK million*
* The figures for 2015-2017 are shown on an adjusted basis.
Distribution costs and administrative expensesDistribution costs rose by 8% to DKK 6,057 million in 2017, with acquisitions accounting for roughly one third. Administrative expenses also increased by 8% to DKK 700 million.
18 WILLIAM DEMANT ANNUAL REPORT 2017
FINANCIAL REVIEW
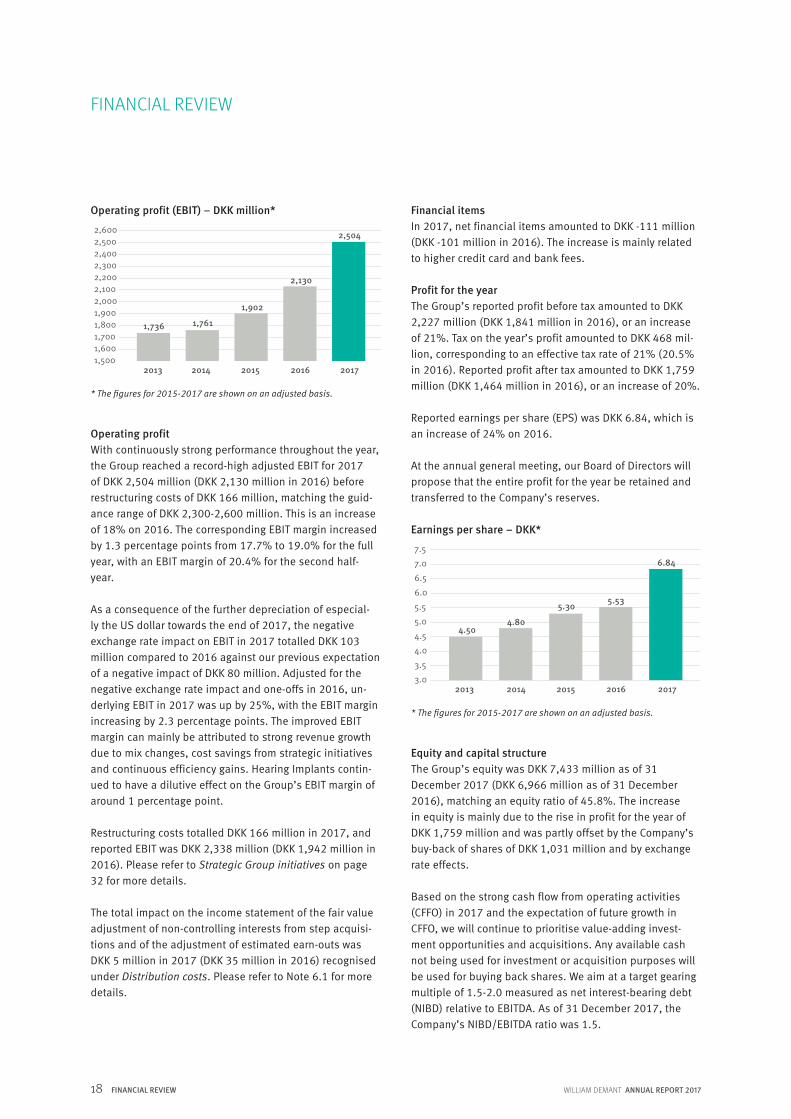
Operating profitWith continuously strong performance throughout the year, the Group reached a record-high adjusted EBIT for 2017 of DKK 2,504 million (DKK 2,130 million in 2016) before restructuring costs of DKK 166 million, matching the guid-ance range of DKK 2,300-2,600 million. This is an increase of 18% on 2016. The corresponding EBIT margin increased by 1.3 percentage points from 17.7% to 19.0% for the full year, with an EBIT margin of 20.4% for the second half-year.
As a consequence of the further depreciation of especial- ly the US dollar towards the end of 2017, the negativeexchange rate impact on EBIT in 2017 totalled DKK 103 million compared to 2016 against our previous expectation of a negative impact of DKK 80 million. Adjusted for the negative exchange rate impact and one-offs in 2016, un-derlying EBIT in 2017 was up by 25%, with the EBIT margin increasing by 2.3 percentage points. The improved EBIT margin can mainly be attributed to strong revenue growth due to mix changes, cost savings from strategic initiatives and continuous efficiency gains. Hearing Implants contin-ued to have a dilutive effect on the Group’s EBIT margin of around 1 percentage point.
Restructuring costs totalled DKK 166 million in 2017, and reported EBIT was DKK 2,338 million (DKK 1,942 million in 2016). Please refer to Strategic Group initiatives on page 32 for more details.
The total impact on the income statement of the fair value adjustment of non-controlling interests from step acquisi-tions and of the adjustment of estimated earn-outs was DKK 5 million in 2017 (DKK 35 million in 2016) recognised under Distribution costs. Please refer to Note 6.1 for more details.
1,5001,6001,7001,8001,9002,0002,1002,2002,3002,4002,5002,600
2013 2014 2015 2016 2017
2,130
2,504
1,902
1,7611,736
Operating profit (EBIT) – DKK million*
* The figures for 2015-2017 are shown on an adjusted basis.
FINANCIAL REVIEW
Financial itemsIn 2017, net financial items amounted to DKK -111 million (DKK -101 million in 2016). The increase is mainly related to higher credit card and bank fees.
Profit for the yearThe Group’s reported profit before tax amounted to DKK 2,227 million (DKK 1,841 million in 2016), or an increase of 21%. Tax on the year’s profit amounted to DKK 468 mil-lion, corresponding to an effective tax rate of 21% (20.5% in 2016). Reported profit after tax amounted to DKK 1,759 million (DKK 1,464 million in 2016), or an increase of 20%.
Reported earnings per share (EPS) was DKK 6.84, which is an increase of 24% on 2016.
At the annual general meeting, our Board of Directors will propose that the entire profit for the year be retained and transferred to the Company’s reserves.
Equity and capital structure The Group’s equity was DKK 7,433 million as of 31 December 2017 (DKK 6,966 million as of 31 December 2016), matching an equity ratio of 45.8%. The increase in equity is mainly due to the rise in profit for the year of DKK 1,759 million and was partly offset by the Company’s buy-back of shares of DKK 1,031 million and by exchange rate effects.
Based on the strong cash flow from operating activities (CFFO) in 2017 and the expectation of future growth in CFFO, we will continue to prioritise value-adding invest-ment opportunities and acquisitions. Any available cash not being used for investment or acquisition purposes will be used for buying back shares. We aim at a target gearing multiple of 1.5-2.0 measured as net interest-bearing debt (NIBD) relative to EBITDA. As of 31 December 2017, the Company’s NIBD/EBITDA ratio was 1.5.
Earnings per share – DKK*
3.0
3.5
4.0
4.5
5.0
5.5
6.0
6.5
7.0
7.5
20172016201520142013
5.53
6.84
5.30
4.804.50
* The figures for 2015-2017 are shown on an adjusted basis.

WILLIAM DEMANT ANNUAL REPORT 2017 19FINANCIAL REVIEW
FINANCIAL REVIEW
2017
6,966
-350
981,759
-1,0407,433
2016
6,500
43
261,464
-1,0676,966
Group equity
(DKK million)
Equity at 1.1.Foreign currency translationadjustments, subsidiariesValue adjustments, hedginginstrumentsProfit for the yearOther adjustments including buy-back of sharesEquity at 31.12.
Should attractive investment or acquisition opportuni- ties arise, we may temporarily slow down the buy-back of shares and/or reconsider the targeted gearing level with a view to ensuring a high level of financial flexibility and value creation in the Group.
Cash flowAdjusted CFFO totalled DKK 2,023 million in 2017, which is an increase of 15% on the year before. Costs in relation to the defined strategic initiatives had a negative impact on reported CFFO for 2017 of DKK 151 million, with the first half-year accounting for DKK 83 million. Income tax paid in 2017 aggregated DKK 488 million of which DKK 222 million was paid in Denmark.
The reported free cash flow amounted to DKK 1,387 mil-lion, corresponding to an increase of 13%. Cash flow from investing activities (CFFI) totalled DKK -485 million in 2017
2017
2,504
2,023
-151
1,872-485
1,387
-656-766
-35
2016
2,130
1,756
-77
1,679-456
1,223
-336-743144
Cash flow by main items
(DKK million)
Adjusted operating profit (EBIT)Adjusted cash flow from operating activitiesCash flow impact from strategic initiativesReported cash flow from operating activities Cash flow from investing activitiesFree cash flowAcquisition and divestment of enterprises, participatinginterests and activitiesCash flow from financing activitiesCash flow for the year
Cash flow from operating activities (CFFO) – DKK million*
1,000
1,200
1,400
1,600
1,800
2,000
2,200
2013 2014 2015 2016 2017
1,495
1,282
1,602
1,756
2,023
* The figures for 2015-2017 are shown on an adjusted basis.
Cash flow from financing activities (CFFF), totalling DKK -766 million in 2017 (DKK -743 million in 2016), mainly relates to share buy-back. In 2017, we repaid debt in the amount of DKK 1,156 million (DKK 350 million in 2016) and took out new debt in the amount of DKK 1,132 million (DKK 774 million in 2016).
Balance sheet As of 31 December 2017, the Group’s assets totalled DKK 16,222 million, which is an increase of 4% on the balance sheet total compared with year-end 2016. This increase is mainly due to acquisitions and an increase in the Group’s receivables.
We provide loans to our customers on an ongoing basis and as of 31 December 2017, such loans amounted to DKK 497 million (DKK 582 million in 2016).
As of 31 December 2017, our net interest-bearing debt amounted to DKK 4,030 million, which is in line with the amount at year-end 2016. The Group’s net working capi- tal amounted to DKK 2,125 million in 2017 (DKK 2,201 in 2016), consisting of current assets of DKK 4,470 and current liabilities of DKK 2,345 million.
At year-end 2017, the fair value of the Group’s forward ex-change contracts was DKK 63 million, consisting of unreal-ised gains of DKK 66 million and losses of DKK 3 million.
(DKK -456 million in 2016) excluding acquisitions and di-vestments. Reported cash flow for the year totalled DKK -35 million, corresponding to a drop of DKK 179 million com-pared to 2016. This trend is mainly attributable to a higher acquisition level.
The amount relating to the acquisition and divestment of enterprises, participating interests and activities was DKK 656 million in 2017 (DKK 336 million in 2016).

20 WILLIAM DEMANT ANNUAL REPORT 2017OUTLOOK 2018
OUTLOOK 2018
The hearing healthcare marketIn general, we consider the global hearing healthcare mar-ket to be very stable. However, official market statistics on the hearing healthcare market are not fully comprehensive, so our market growth assumptions listed below should be seen in this light. The market growth assumptions, which are in line with our long-term expectations, cover the wholesale part of the hearing healthcare market and serve as our currently best estimate of market trends in 2018:
• We estimate that the hearing aid wholesale market will see a unit growth rate of 4-6% and a low single-digit per-centage decline in the average selling price. In terms of value, we estimate that the hearing aid wholesale market will grow by 2-4%.
• The hearing implant market is estimated to see a value growth rate of 10-15%.
• The diagnostic equipment market is estimated to see a value growth rate of 3-5%.
• The total hearing healthcare market is estimated to see a value growth rate of 5%.
As a leading global hearing healthcare company, the William Demant Group is active in all key product seg-ments and sales channels and across all geographic regions. Due to this relatively unique position in the marketplace, the Group has access to a big and fast growing hearing healthcare market.
Outlook 2018The William Demant Group expects to generate substantial organic sales growth in 2018. Based on exchange rates as of 21 February 2018 and if we include the impact of exchange rate hedging, we expect a negative exchange rate effect on revenue of around 4% in 2018.
We are guiding for an operating profit (EBIT) of DKK 2,550-2,850 million before restructuring costs of DKK 150 million in relation to the previously announced strategic initia-tives.
We aim at a gearing multiple of 1.5-2.0 measured as net interest-bearing debt (NIBD) relative to EBITDA, and we expect to buy back shares worth DKK 1.5-2.0 billion. In order to maintain a high level of flexibility, this level of share buy-back is however subject to change, if additional attractive acquisition opportunities present themselves.

KAPITELWILLIAM DEMANT ANNUAL REPORT 2017 21
OUR BUSINESS
In 2017, the research projectIHEAR was initiated toensure that no child with hearing impairment is left behind in school.
Read more: demant.com

22 WILLIAM DEMANT ANNUAL REPORT 2017HEARING DEVICES
HEARING DEVICES
ing aid market rose gradually during 2017 and amounted to approx. 4% for the full year. According to data from the Hearing Industries Association (HIA), the US growth rate was close to the global average growth rate, mainly due to the private market growing by around 4%, whereas the growth rate in Veterans Affairs (VA) was more modest at around 1%. In Europe, the estimated growth rate in 2017 was around 4% with strong growth rates in France and Italy, but only a modest growth rate in Germany. Outside the US and Europe, the growth rate recorded in Japan was more or less flat, and in Australia the growth rate was neg-ative. China continued to record double-digit growth rates.
We maintain our estimate of a medium- to long-term unit growth rate of 4-6%, with key structural drivers remaining intact. The most important of these drivers is the demo-graphic trend towards increasing elderly populations in
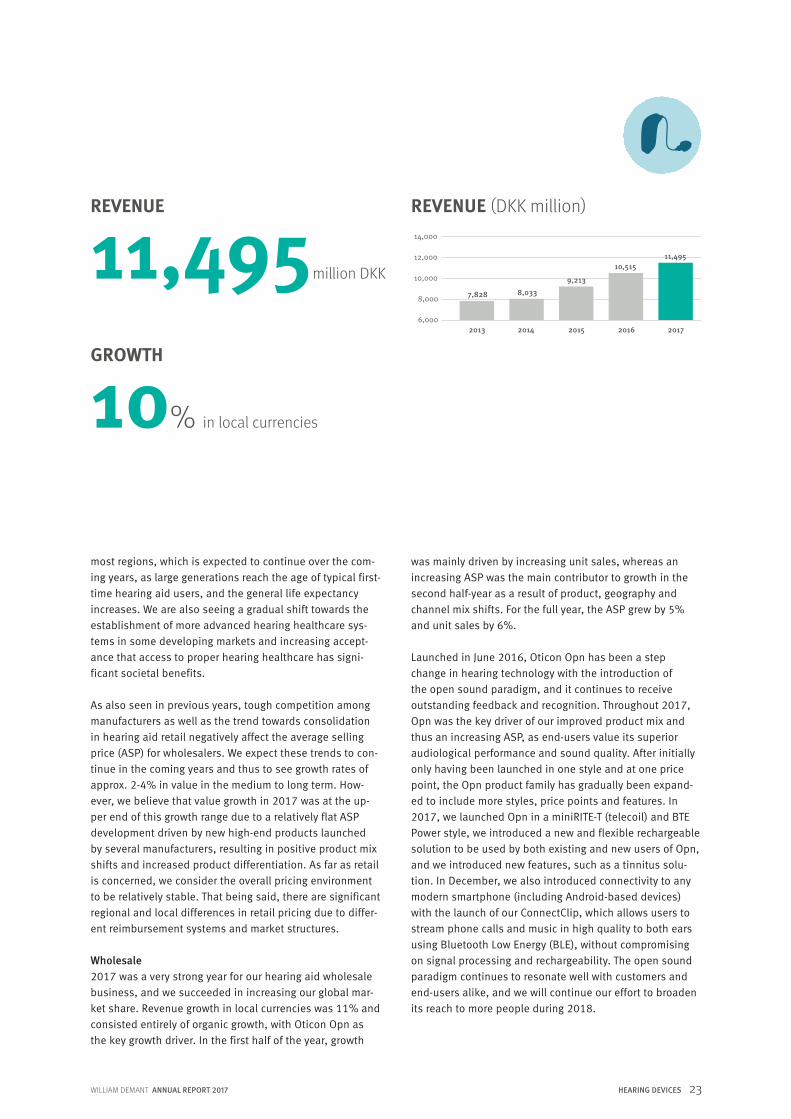
Encompassing both our hearing aid wholesale and our retail business, the Hearing Devices business activity per-formed strongly in 2017, generating a growth rate of 10% in local currencies of which organic growth accounted for 8 percentage points. The strong growth was primarily driven by the continued and highly successful roll-out of Oticon Opn, which helped our wholesale business gain global market share, but also new products from the Bernafon and Sonic brands helped fuel growth in the second half of the year. In 2017, our retail business delivered an organic growth rate of 4% in line with the estimated overall market growth rate due to a mix of solid performance in Europe, a pick-up in the US market towards the end of the year and negative organic growth in Australia.
Market conditions and business trendsWe estimate that the volume growth rate in the global hear-
We have succeeded in gaining market share in Hearing Devices, with Oticon Opn driving strong organic growth in the wholesale business.
Produktbillede
WILLIAM DEMANT ANNUAL REPORT 2017 23HEARING DEVICES
most regions, which is expected to continue over the com-ing years, as large generations reach the age of typical first-time hearing aid users, and the general life expectancy increases. We are also seeing a gradual shift towards the establishment of more advanced hearing healthcare sys-tems in some developing markets and increasing accept-ance that access to proper hearing healthcare has signi-ficant societal benefits.
As also seen in previous years, tough competition among manufacturers as well as the trend towards consolidation in hearing aid retail negatively affect the average selling price (ASP) for wholesalers. We expect these trends to con-tinue in the coming years and thus to see growth rates of approx. 2-4% in value in the medium to long term. How-ever, we believe that value growth in 2017 was at the up-per end of this growth range due to a relatively flat ASP development driven by new high-end products launched by several manufacturers, resulting in positive product mix shifts and increased product differentiation. As far as retail is concerned, we consider the overall pricing environment to be relatively stable. That being said, there are significant regional and local differences in retail pricing due to differ-ent reimbursement systems and market structures.
Wholesale2017 was a very strong year for our hearing aid wholesale business, and we succeeded in increasing our global mar-ket share. Revenue growth in local currencies was 11% and consisted entirely of organic growth, with Oticon Opn as the key growth driver. In the first half of the year, growth
was mainly driven by increasing unit sales, whereas an increasing ASP was the main contributor to growth in the second half-year as a result of product, geography and channel mix shifts. For the full year, the ASP grew by 5% and unit sales by 6%.
Launched in June 2016, Oticon Opn has been a step change in hearing technology with the introduction of the open sound paradigm, and it continues to receive outstanding feedback and recognition. Throughout 2017, Opn was the key driver of our improved product mix and thus an increasing ASP, as end-users value its superior audiological performance and sound quality. After initially only having been launched in one style and at one price point, the Opn product family has gradually been expand-ed to include more styles, price points and features. In 2017, we launched Opn in a miniRITE-T (telecoil) and BTE Power style, we introduced a new and flexible rechargeable solution to be used by both existing and new users of Opn, and we introduced new features, such as a tinnitus solu-tion. In December, we also introduced connectivity to any modern smartphone (including Android-based devices) with the launch of our ConnectClip, which allows users to stream phone calls and music in high quality to both ears using Bluetooth Low Energy (BLE), without compromising on signal processing and rechargeability. The open sound paradigm continues to resonate well with customers and end-users alike, and we will continue our effort to broaden its reach to more people during 2018.
REVENUE
11,495million DKK
GROWTH
10% in local currencies
REVENUE (DKK million)
10,515
8,0337,828
6,000
8,000
10,000
12,000
14,000
2013 2014 2015 2016 2017
9,213
11,495

HEARING DEVICES

WILLIAM DEMANT ANNUAL REPORT 2017 25HEARING DEVICES
HIGHLIGHTS 2017
• Organic revenue growth of 11% in the wholesale of hearing aids with Oticon Opn as the key growth driver
• Opn continues to receive outstanding feedback and recognition
• Opn now available in a miniRITE-T (telecoil) style, a BTE Power style with rechargeability, a tinnitus solution and connectivity by means of ConnectClip
• Bernafon and Sonic launched new product families with 2.4 GHz connectivity, Zerena and Enchant, respectively
PIPELINE 2018
• Further leverage on the open sound paradigm and the ultra-low-power, dual-radio technology platform
• Focus on consolidating our many retail entities into more coherent operational set-ups
Both Bernafon and Sonic saw growing unit sales in 2017, but their ASPs were negatively affected by substantial tender orders at relatively low prices and also by the fact that their product portfolios were nearing the end of their life cycles. However, in the second half-year Bernafon and Sonic both launched new product families with 2.4 GHz connectivity, Zerena and Enchant, respectively, which have helped improve the product mix for both brands. With these strong new products in combination with the successful Oticon Opn, we have entered the year with a very strong product portfolio across all our brands, allow-ing us to address the widest possible range of customers and channels. In 2018, we will further expand this strong technology platform.
In terms of geography, our growth was broadly based and we saw solid organic growth rates in all regions. North America was the most significant contributor to growth with strong sales to the independent segment, through our own retail network and to VA in the US. As far as the latter is concerned, we continued to increase our market share during 2017, even after the initial introduction effect following the launch of Opn in this channel in November 2016, and we finished the year holding a unit market share of 15%.
In Europe, we also succeeded in growing our business at a solid rate despite the loss of sales to a large account, which was acquired by a competitor in 2016. Naturally, this had an adverse effect on our unit growth, although the effect on revenue was less significant. In return, we were able to grow our sales to independent customers, to the NHS in the UK and through our own retail network, while experiencing generally strong momentum in coun-tries like Germany, France and Denmark. Our Asia and Pacific re-gions also saw strong organic growth with China, Japan and Australia as the main growth drivers, despite the overall demanding market conditions in Japan and Australia.
RetailOur retail business saw growth of 10% in local currencies of which 4 percentage points were organic growth and 6 percentage points acquisitive growth. Our organic growth rate was thus in line with the estimated market growth rate, but reflected some variations across the regions where we are active due to differences both in general market conditions and in the maturity of our retail opera-tions. Our retail business is continuously working on opti-mising its sales excellence model, marketing campaigns, IT systems and processes to sustain its profitable growth and solid contribution to the Group. In 2017, the composi-tion of growth in our retail business was relatively stable,
and the retail business in fact increased the number of units from our wholesale business. Furthermore, we saw a slightly increased ASP driven in large part by Oticon Opn.
Our European retail business performed well in 2017 with the UK, Poland and France as the main positive drivers. We continuously strive to benefit from economies of scale in the markets where we operate by focusing on sales and marketing excellence, while continuing to expand our net-work in selected markets. In France, we saw strong market growth in 2017, and we continue to grow the Audika busi-ness and to gradually ramp up the share of own products sold through Audika shops.
In North America, we saw strong performance in Canada due to a combination of strong organic growth and acqui-sitive growth from bolt-on acquisitions. Growth in our US retail business was mainly driven by acquisitions, where- as the organic growth rate was slightly below the market growth rate, even though it improved in the second half of the year compared to the first half-year. We continue to focus on consolidating our many entities into one coherent operational set-up, and in 2017, we saw this effort result-ing in improved performance, and we ended the year on a strong note.
As mentioned above, the Australian market for hearing aids saw negative growth in 2017, which naturally impact-ed our sizeable retail business there. However, we expect the market to return to its “normal” growth level in 2018.

26 WILLIAM DEMANT ANNUAL REPORT 2017HEARING IMPLANTS
HEARING IMPLANTS
seen in the past decade. Our “SuperPower for all” mes-sage has been very well received by clinics, as Ponto 3 SuperPower offers the highest output ever by an abutment-level sound processor and can be used for conductive hearing losses down to 65 dB. This means that people with severe hearing loss can get a very powerful solution, without having to make sacrifices in terms of cosmetics.
Cochlear implantsWe estimate that in terms of unit sales, the CI market growth rate was 10-12% – the same estimated range as in recent years. Going forward, the CI industry is expected to generate a double-digit unit growth rate, reflecting the fact that CIs are among the most successful hearing reha-bilitation devices. Low penetration, an increasing pool of elderly people needing a CI, new indications, such as single-sided deafness (SSD) and severe tinnitus, product
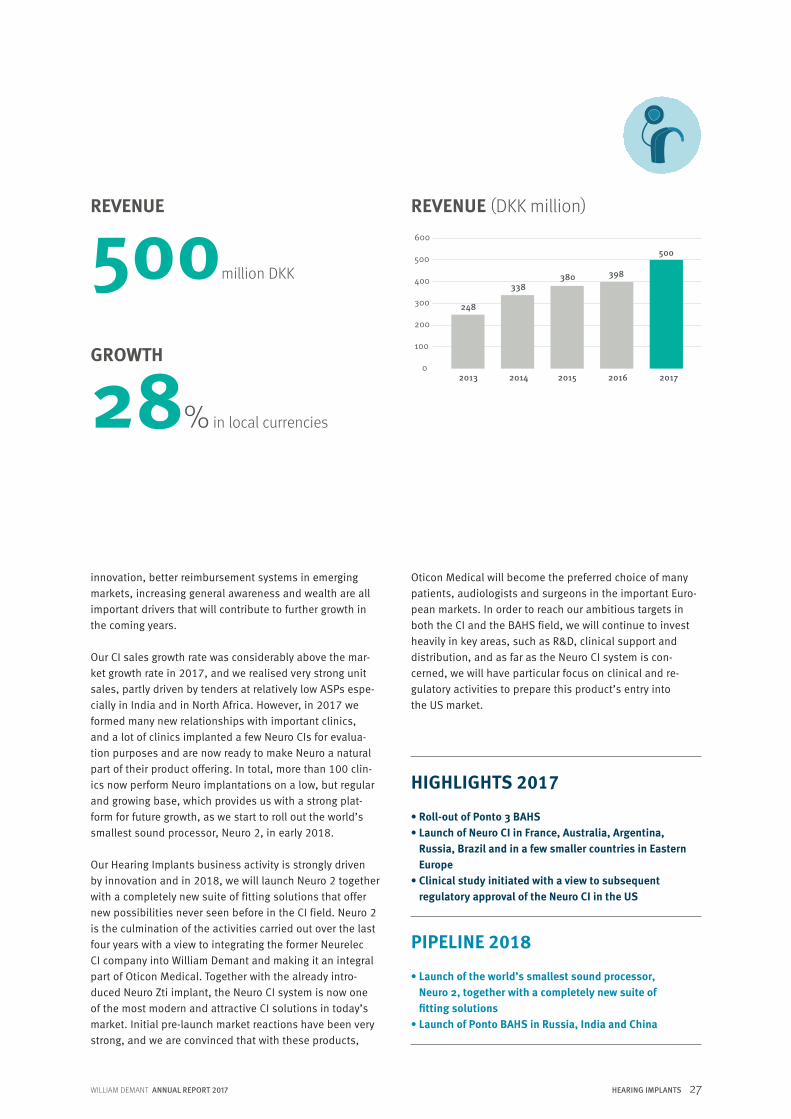
In 2017, our Hearing Implants business activity under the Oticon Medical brand realised as much as 28% growth in local currencies, which was entirely organic growth, and the second half-year even saw accelerated growth. Gene-rated by both the cochlear implant (CI) and the bone an-chored hearing system (BAHS) area, the strong growth rates exceeded the estimated market growth rates.
Bone anchored hearing systemsWe estimate that the BAHS market grew by 10-15% in 2017, driven by innovation, in particular due to Ponto 3 SuperPower – an industry only – growth in the Group’s BAHS sales exceeded the estimated market growth rate.
With Ponto 3, we have created a new standard for products for different hearing losses and because of this, Ponto 3 is one of the most important product innovations we have
We have delivered strong growth in Hearing Implants with strong performance in both CI and BAHS, driven by Neuro and Ponto 3.
WILLIAM DEMANT ANNUAL REPORT 2017 27HEARING IMPLANTS
innovation, better reimbursement systems in emerging markets, increasing general awareness and wealth are all important drivers that will contribute to further growth in the coming years.
Our CI sales growth rate was considerably above the mar-ket growth rate in 2017, and we realised very strong unit sales, partly driven by tenders at relatively low ASPs espe-cially in India and in North Africa. However, in 2017 we formed many new relationships with important clinics, and a lot of clinics implanted a few Neuro CIs for evalua-tion purposes and are now ready to make Neuro a natural part of their product offering. In total, more than 100 clin-ics now perform Neuro implantations on a low, but regular and growing base, which provides us with a strong plat-form for future growth, as we start to roll out the world’s smallest sound processor, Neuro 2, in early 2018.
Our Hearing Implants business activity is strongly driven by innovation and in 2018, we will launch Neuro 2 together with a completely new suite of fitting solutions that offer new possibilities never seen before in the CI field. Neuro 2 is the culmination of the activities carried out over the last four years with a view to integrating the former Neurelec CI company into William Demant and making it an integral part of Oticon Medical. Together with the already intro-duced Neuro Zti implant, the Neuro CI system is now one of the most modern and attractive CI solutions in today’s market. Initial pre-launch market reactions have been very strong, and we are convinced that with these products,
REVENUE
500million DKK
GROWTH
28% in local currencies
Oticon Medical will become the preferred choice of many patients, audiologists and surgeons in the important Euro-pean markets. In order to reach our ambitious targets in both the CI and the BAHS field, we will continue to invest heavily in key areas, such as R&D, clinical support and distribution, and as far as the Neuro CI system is con-cerned, we will have particular focus on clinical and re-gulatory activities to prepare this product’s entry into the US market.
HIGHLIGHTS 2017 • Roll-out of Ponto 3 BAHS• Launch of Neuro CI in France, Australia, Argentina,
Russia, Brazil and in a few smaller countries in Eastern Europe
• Clinical study initiated with a view to subsequent regulatory approval of the Neuro CI in the US
PIPELINE 2018
• Launch of the world’s smallest sound processor, Neuro 2, together with a completely new suite of fitting solutions
• Launch of Ponto BAHS in Russia, India and China
0
100
200
300
400
500
600
2013 2014 2015 2016 2017
398
500
380338
248
REVENUE (DKK million)
28 WILLIAM DEMANT ANNUAL REPORT 2017DIAGNOSTIC INSTRUMENTS
DIAGNOSTIC INSTRUMENTS
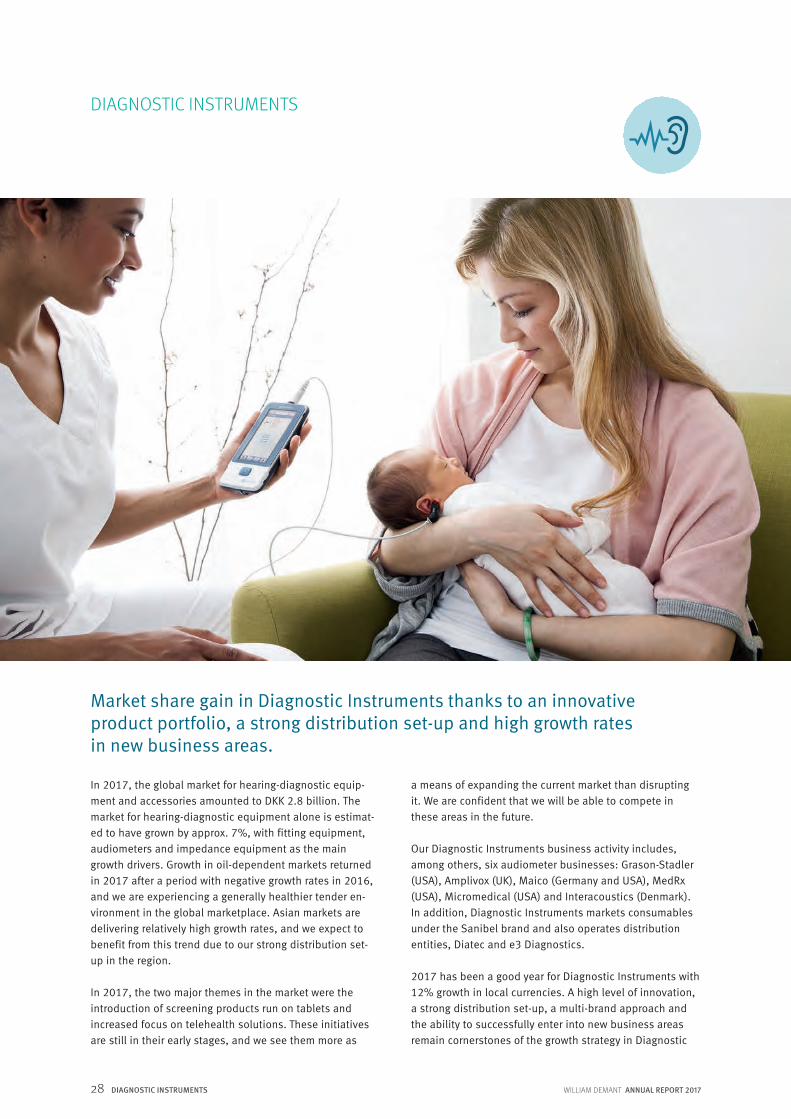
a means of expanding the current market than disrupting it. We are confident that we will be able to compete in these areas in the future.
Our Diagnostic Instruments business activity includes, among others, six audiometer businesses: Grason-Stadler (USA), Amplivox (UK), Maico (Germany and USA), MedRx (USA), Micromedical (USA) and Interacoustics (Denmark). In addition, Diagnostic Instruments markets consumables under the Sanibel brand and also operates distribution entities, Diatec and e3 Diagnostics.
2017 has been a good year for Diagnostic Instruments with 12% growth in local currencies. A high level of innovation, a strong distribution set-up, a multi-brand approach and the ability to successfully enter into new business areas remain cornerstones of the growth strategy in Diagnostic
In 2017, the global market for hearing-diagnostic equip-ment and accessories amounted to DKK 2.8 billion. The market for hearing-diagnostic equipment alone is estimat-ed to have grown by approx. 7%, with fitting equipment, audiometers and impedance equipment as the main growth drivers. Growth in oil-dependent markets returned in 2017 after a period with negative growth rates in 2016, and we are experiencing a generally healthier tender en-vironment in the global marketplace. Asian markets are delivering relatively high growth rates, and we expect to benefit from this trend due to our strong distribution set- up in the region.
In 2017, the two major themes in the market were the introduction of screening products run on tablets and increased focus on telehealth solutions. These initiatives are still in their early stages, and we see them more as
Market share gain in Diagnostic Instruments thanks to an innovative product portfolio, a strong distribution set-up and high growth rates in new business areas.

WILLIAM DEMANT ANNUAL REPORT 2017 29DIAGNOSTIC INSTRUMENTS
Instruments. We believe that we are well underway to de-liver on these key parameters exemplified by the launch of Amtas, our next-generation tablet-based hearing screen-ing and diagnosing equipment/system, by strong growth momentum in the newborn hearing screening business and by our ability to benefit from strong distribution set-ups in the US and in Asia.
Driven by market share gains in impedance, OAE and ABR equipment, we succeeded in gaining market share across the global market for diagnostic equipment in 2017. Having now entered 2018 with positive sales momentum, we expect to see further positive development by conti-nuing to deliver on efficiency gains and innovation.
REVENUE
1,194 million DKK
GROWTH
12% in local currencies
HIGHLIGHTS 2017 • Launch of Amtas: Next-generation, tablet-based hearing
screening and diagnosing equipment• Strong growth momentum in newborn hearing screening • Market share gains across the global market for diag-
nostic equipment
PIPELINE 2018
• Continued expansion and development of our newborn hearing screening business
• Worldwide expansion of service and calibration business• Introduction of more products using Amtas technology
REVENUE (DKK million)
800
850
900
950
1,000
1,050
1,100
1,150
1,200
1,250
2013 2014 2015 2016 2017
1,089
1,194
1,072
975
883

30 WILLIAM DEMANT ANNUAL REPORT 2017PERSONAL COMMUNICATION
PERSONAL COMMUNICATION
keting environment, with big international companies entering this field, which means that we need to be more selective when it comes to our marketing efforts.
In the Mobile segment, we are seeing a rapid shift from corded to wireless devices, and our PXC 550 and MB 660 headsets have both gained momentum and been success-ful in 2017. We are seeing an emerging trend in the Mobile segment towards more intelligent audio solutions, which we are following closely.
Sennheiser Communications is recognised under Share of profit after tax, associates and joint ventures in the con-solidated financial statements. However, the full income statement for Sennheiser Communications is shown on the next page.
Sennheiser Communications, our 50/50 joint venture with Sennheiser electronic GmbH & Co. KG, develops and manu-factures headsets and solutions for the professional Call Center and Office (CC&O) market, including Unified Com-munication (UC), as well as consumer headsets for the Gaming and Mobile segments.
In 2017, the global CC&O market delivered solid market growth. The positive UC trend remains the major growth driver, with new, large global accounts entering the market, but we are also seeing increasing interest from medium-sized companies.
The global Gaming headset market generated growth of 7-8% in 2017. Overall interest in the Gaming segment is growing, and we are seeing material changes in the mar-
Solid underlying performance in Sennheiser Communications driven by double-digit growth in CC&O.

WILLIAM DEMANT ANNUAL REPORT 2017 31PERSONAL COMMUNICATION
PERSONAL COMMUNICATION
REVENUE
743million DKK
GROWTH
-1% in local currencies
HIGHLIGHTS 2017 • Strong underlying growth driven by CC&O
PIPELINE 2018
• Continuous investments to benefit from positive UC trend
498
300
400
500
600
700
800
2013 2014 2015 2016 2017
576
668
749 743
REVENUE (DKK million)
2017
743311
41.9%-199112
15.1%-2587
43
2016
749320
42.7%-188132
17.6%-29
103
51
(DKK million)
RevenueGross profitGross marginCapacity costsOperating profit (EBIT)EBIT marginTax on profit for the yearProfit for the yearWilliam Demant Holding share of profit, 50%
Looking at the value chain for headsets, Sennheiser Com-munications acts as a manufacturer, while benefitting from the distribution set-up in Sennheiser KG. Thus, Sennheiser Communications reports wholesale revenue into Senn-heiser KG’s inventory, which should be taken into account when comparing Sennheiser Communications’ revenue with our competitors’ revenue.
Revenue for 2017 was DKK 743 million, corresponding to a decrease of 1% on last year, which is attributable to a decrease in the general stock level at Sennheiser KG (sales into Sennheiser KG’s inventory). At year-end 2017, the un-derlying business (sales from Sennheiser KG’s inventory to
customers) was 14% above the level at year-end 2016, which is mainly due to double-digit growth in CC&O.
Sennheiser Communications continues to invest in the business with a view to capturing future growth opportuni-ties and delivering on an ambitious growth plan. Because of this strategy, capacity costs were up by 6% in 2017 and are expected to increase further in 2018. The gross profit margin was adversely affected by price competition in the CC&O segment and changes to the product mix, as we have seen an increase in the sale of wireless products in 2017.
Income statement
32 WILLIAM DEMANT ANNUAL REPORT 2017STRATEGIC GROUP INITIATIVES
STRATEGIC GROUP INITIATIVES
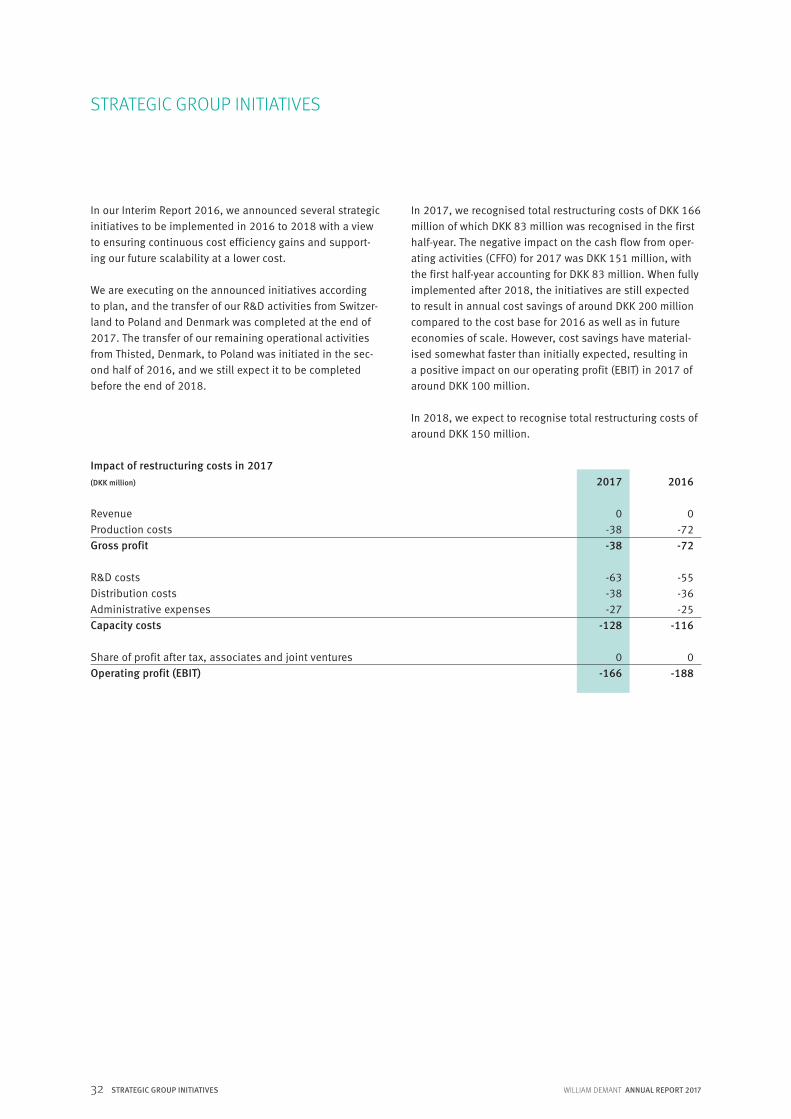
In our Interim Report 2016, we announced several strategic initiatives to be implemented in 2016 to 2018 with a view to ensuring continuous cost efficiency gains and support-ing our future scalability at a lower cost.
We are executing on the announced initiatives according to plan, and the transfer of our R&D activities from Switzer-land to Poland and Denmark was completed at the end of 2017. The transfer of our remaining operational activities from Thisted, Denmark, to Poland was initiated in the sec-ond half of 2016, and we still expect it to be completed before the end of 2018.
In 2017, we recognised total restructuring costs of DKK 166 million of which DKK 83 million was recognised in the first half-year. The negative impact on the cash flow from oper-ating activities (CFFO) for 2017 was DKK 151 million, with the first half-year accounting for DKK 83 million. When fully implemented after 2018, the initiatives are still expected to result in annual cost savings of around DKK 200 million compared to the cost base for 2016 as well as in future economies of scale. However, cost savings have material-ised somewhat faster than initially expected, resulting in a positive impact on our operating profit (EBIT) in 2017 of around DKK 100 million.
In 2018, we expect to recognise total restructuring costs of around DKK 150 million.
2016
0-72-72
-55-36-25
-116 0
-188
2017
0-38-38
-63-38-27
-128 0
-166
Impact of restructuring costs in 2017 (DKK million)
RevenueProduction costsGross profit R&D costsDistribution costsAdministrative expensesCapacity costs Share of profit after tax, associates and joint venturesOperating profit (EBIT)

SHAREHOLDER INFORMATIONAND CORPORATE GOVERNANCE
34 WILLIAM DEMANT ANNUAL REPORT 2017SHAREHOLDER INFORMATION
SHAREHOLDER INFORMATION
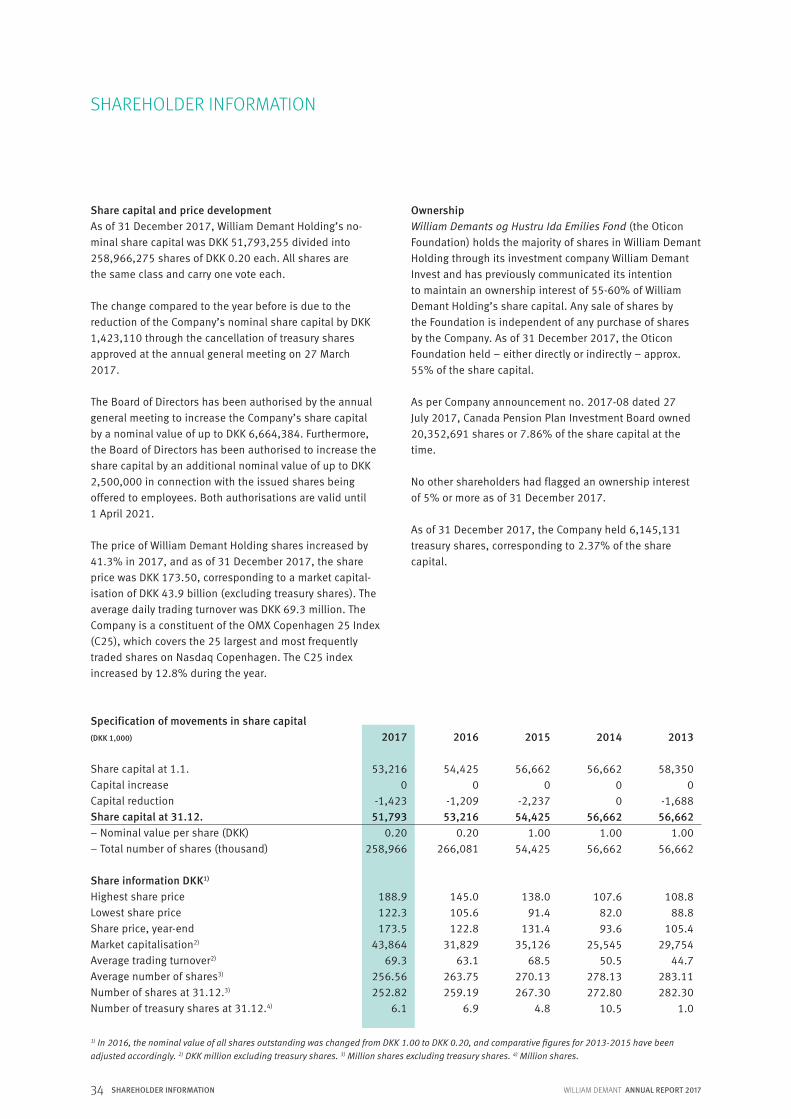
Share capital and price developmentAs of 31 December 2017, William Demant Holding’s no-minal share capital was DKK 51,793,255 divided into 258,966,275 shares of DKK 0.20 each. All shares are the same class and carry one vote each.
The change compared to the year before is due to the reduction of the Company’s nominal share capital by DKK 1,423,110 through the cancellation of treasury shares approved at the annual general meeting on 27 March 2017.
The Board of Directors has been authorised by the annual general meeting to increase the Company’s share capital by a nominal value of up to DKK 6,664,384. Furthermore, the Board of Directors has been authorised to increase the share capital by an additional nominal value of up to DKK 2,500,000 in connection with the issued shares being offered to employees. Both authorisations are valid until 1 April 2021.
The price of William Demant Holding shares increased by 41.3% in 2017, and as of 31 December 2017, the share price was DKK 173.50, corresponding to a market capital-isation of DKK 43.9 billion (excluding treasury shares). The average daily trading turnover was DKK 69.3 million. The Company is a constituent of the OMX Copenhagen 25 Index (C25), which covers the 25 largest and most frequently traded shares on Nasdaq Copenhagen. The C25 index increased by 12.8% during the year.
Ownership William Demants og Hustru Ida Emilies Fond (the Oticon Foundation) holds the majority of shares in William Demant Holding through its investment company William Demant Invest and has previously communicated its intention to maintain an ownership interest of 55-60% of William Demant Holding’s share capital. Any sale of shares by the Foundation is independent of any purchase of shares by the Company. As of 31 December 2017, the Oticon Foundation held – either directly or indirectly – approx. 55% of the share capital.
As per Company announcement no. 2017-08 dated 27 July 2017, Canada Pension Plan Investment Board owned 20,352,691 shares or 7.86% of the share capital at the time.
No other shareholders had flagged an ownership interest of 5% or more as of 31 December 2017.
As of 31 December 2017, the Company held 6,145,131 treasury shares, corresponding to 2.37% of the share capital.
2014
56,66200
56,6621.00
56,662
107.682.093.6
25,54550.5
278.13272.80
10.5
2017
53,2160
-1,42351,793
0.20258,966
188.9122.3173.5
43,86469.3
256.56252.82
6.1
2016
54,4250
-1,20953,216
0.20266,081
145.0105.6122.8
31,82963.1
263.75259.19
6.9
2015
56,6620
-2,23754,425
1.0054,425
138.091.4
131.435,126
68.5270.13267.30
4.8
2013
58,3500
-1,68856,662
1.0056,662
108.888.8
105.429,754
44.7283.11282.30
1.0
1) In 2016, the nominal value of all shares outstanding was changed from DKK 1.00 to DKK 0.20, and comparative figures for 2013-2015 have been adjusted accordingly. 2) DKK million excluding treasury shares. 3) Million shares excluding treasury shares. 4) Million shares.
Specification of movements in share capital(DKK 1,000)
Share capital at 1.1.Capital increaseCapital reductionShare capital at 31.12.– Nominal value per share (DKK)– Total number of shares (thousand)
Share information DKK1)
Highest share priceLowest share priceShare price, year-endMarket capitalisation2)
Average trading turnover2)
Average number of shares3)
Number of shares at 31.12.3) Number of treasury shares at 31.12.4)

WILLIAM DEMANT ANNUAL REPORT 2017 35SHAREHOLDER INFORMATION
SHAREHOLDER INFORMATION
The Oticon FoundationWilliam Demant Holding’s majority shareholder, the Oticon Foundation, was founded in 1957 by William Demant, son of the Company’s founder Hans Demant. Its primary goal is to safeguard and expand the William Demant Group’s business and pro-vide support for various commercial and charitable causes with particular focus on the field of audiology. At the end of 2011, the majority of the Oticon Foundation’s shares in William Demant Holding were transferred to its wholly owned subsidiary, William Demant Invest. Charitable tasks are thus handled by the Foundation itself and the Foundation’s business activities by William Demant Invest. Voting rights and decisions to buy and sell William Demant Holding shares are still exercised and made, respectively, by the Oticon Foundation.
In accordance with the Oticon Foundation’s investment strategy, the Foundation’s investments – apart from an ownership interest in William Demant Holding – also include other assets, as the Foundation can make active investments in compa-nies whose business model and structure resemble those of the William Demant Group, but fall outside the Group’s strategic sphere of interest. The Foundation has made a management agreement on a commercial arm’s length basis with William Demant Holding to the effect that the latter will handle the administration of the investments made through William Demant Invest.
Dividend and share buy-backThe Company will use its substantial cash flow from oper-ating activities for investments and acquisitions, and any excess liquidity will, as a rule, be used for the continuous buy-back of shares.
0
200
400
600
800
1,000
1,200
1,400
1,600
0.00
20.00
40.00
60.00
80.00
100.00
120.00
140.00
160.00
180.00
200.00
Dec - 16
Jan - 17
Feb - 1
7
Mar - 17
Apr - 17
May - 17
Jun - 17
Jul - 17
Aug - 17
Sep - 17
Oct - 17
Nov - 17
Dec - 17
Development in share price and turnover
Turnover William Demant Holding C25 (rebased)
Share price (DKK) Turnover (DKK million)
Until the next annual general meeting in March 2018, the Board of Directors has been authorised to let the Company buy back shares at a nominal value of up to 10% of the share capital. The purchase price may, however, not devi-ate by more than 10% from the price quoted on Nasdaq Copenhagen.

36 WILLIAM DEMANT ANNUAL REPORT 2017SHAREHOLDER INFORMATION
SHAREHOLDER INFORMATION
Investor RelationsWilliam Demant Holding strives to ensure a steady and consistent flow of information to IR stakeholders in order to promote the basis for a fair pricing of the Company’s shares – pricing that will at any time reflect the Company’s strategies, financial capabilities and outlook for the future. The flow of information will contribute to a reduction of the company-specific risk associated with investing in William Demant Holding shares, thereby leading to a reduction of the Company’s cost of capital.
We aim to reach this goal by continuously providing rele-vant, correct, adequate and timely information in our Com-pany announcements. In addition to the statutory publica-tion of an annual report and interim report, we publish quarterly interim management statements, containing up-dates on the Group and its financial position and results in relation to the full-year outlook, including updates on important events and transactions in the period under review. Our interim management statements do not in-clude actual figures.
We also maintain an active and open dialogue with ana-lysts as well as current and potential investors, which helps us stay updated on the views, interests and opinions of various stakeholders in respect of the Company. At our annual general meeting and through presentations, in-dividual meetings, participation in investor conferences, webcasts, capital markets days etc., we aim to maintain an ongoing dialogue with a broad spectrum of IR stake-holders, and in 2017, we held approx. 450 investor meetings and presentations. We also use our website, www.demant.com, as a means of communication with our stakeholders. At the end of 2017, 28 equity analysts were covering William Demant Holding. We refer to our website for a full list of analyst coverage.
Investors and analysts are welcome to contact Søren B. Andersson (Vice President, IR) or Mathias Holten Møller (IR Officer) by phone +45 3917 7300 or by e-mail to [email protected].
Søren B. Andersson Mathias Holten Møller
William Demant Holding has a three-week quiet period prior to publication of annual reports, interim reports and interim management statements where communication with IR stakeholders is restricted.
Annual general meeting 2018The annual general meeting will be held on Thursday, 22 March 2018, at 4 p.m. at the Company’s head office, Kongebakken 9, 2765 Smørum, Denmark.
Company announcements in 2017
23 February Annual Report 2016
23 February Management changes in William Demant
28 February Notice to annual general meeting
27 March Decisions of annual general meeting
8 May Completion of capital reduction
9 May Interim Management Statement
31 May Total number of voting rights and capital
27 July Major shareholder announcement concerning Canada Pension Plan Investment Board
14 August Interim Report 2017
9 November Interim Management Statement
10 November Financial calendar 2018
Financial calendar 2018
8 February Deadline for submission of items for the agenda of the annual general meeting
22 February Annual Report 2017
22 March Annual general meeting
8 May Interim Management Statement
15 August Interim Report 2018
6 November Interim Management Statement

WILLIAM DEMANT ANNUAL REPORT 2017 37RISK MANAGEMENT ACTIVITIES
RISK MANAGEMENT ACTIVITIES
Risk management activities in the William Demant Group first and foremost focus on the business-related and finan-cial risks to which the Group is fairly likely to be exposed. In connection with the preparation of the Group’s strategic, budgetary and annual plans, the Board of Directors con-siders the risks identified in these activities.
In general, we act in a stable market with a limited num- ber of players, and under normal circumstances, the risks to which the Group may be exposed do not change in the short term. In 2017, there has been no major change in the Group’s immediate risk exposure compared to recent years, and the development in the demand for Group prod-ucts has been stable.
Business risksThe major risks to which the Group may be exposed are of a business nature – be they risks within the Group’s con-trol or external risks due to, for instance, the behaviour of the competition.
The hearing healthcare market in which we act is a highly product-driven market where our significant R&D initiatives help underpin our market position. It is thus vital in the long term to maintain our innovative edge and to attract the most qualified and competent staff. Our continuous development of new products brings with it inherent prod-uct risks, including the risk of delay of launches of new products. However, due to our constant focus on all links in the value chain, such delays rarely occur. We closely monitor our supply situation and seek to ensure that we always have an inventory level that can counter any inter-ruptions in production. Product recalls also constitute a business risk in relation to bone anchored hearing systems and cochlear implants, specifically in relation to claims-related costs, such as the cost of replacing products, me-dical expenses, compensation for actual damage as well as legal fees.
In 2016, the Group announced several strategic initiatives, including the relocation of some production and R&D sites, to be implemented in the years 2016 to 2018. Such initia-tives carry inherent operational and executional risks, but are so far progressing according to plan. Please refer to Financial review on page 14 for more details on the pro-gress of the strategic Group initiatives.
An important part of our ongoing product innovation is to take out, protect and maintain patents for our own ground-breaking development and technology. These are indeed complicated processes in the hearing healthcare industry, and we therefore maintain and develop our competencies in this area on an ongoing basis. It is our policy to conti-
nuously monitor that third-party products do not infringe our patents and that our products do not infringe third-par-ty patents. The Group is involved in a few legal disputes, but Management is of the opinion that these do not or will not significantly affect the Group’s financial position. As a rule, we seek to make adequate provisions for legal proceedings.
As a major player in the hearing healthcare market, the Group is also exposed to certain regulatory risks in terms of changes to product requirements, reimbursement schemes and public tenders in the markets where we oper-ate. In August 2017, US lawmakers passed new legislation, requiring the Food and Drug Administration (FDA) to intro-duce a new over-the-counter (OTC) category of hearing aids within three years. We expect any impact of this legislation on the hearing aid industry to be limited, but until the final design of the category has been defined by the FDA, the impact of this legislation is considered part of the Group’s regulatory risks. Overall, we feel well positioned to respond to any regulatory changes, and our broad presence in the hearing healthcare market should help minimise any im-pact on the Group as a whole.
Being a large, global organisation, we are naturally de- pendant on a number of IT systems and general IT infra-structure to operate efficiently across our value chain. This entails the risk of system errors, human errors, data breaches or other interruptions that may impact the Group financially. We continuously seek to minimise these risks, and our IT strategy includes both prevention and contin-gency plans.
Financial risksFinancial risk management concentrates on identifying risks in respect of exchange rates, interest rates, credit and liquidity with a view to protecting the Group against potential losses and ensuring that Management’s forecasts for the current year are only to a limited extent affected by changes or events in the surrounding world – be they changes in exchange rates or in interest rates. It is the Group’s policy to exclusively hedge financial risks arising from our commercial activities and not to undertake any financial transactions of a speculative nature.
Exchange rate risksWith 98% of the Group’s sales being invoiced in foreign currencies, reported revenue is significantly affected by movements in the Group’s trading currencies. The Group seeks to hedge against any exchange rate risks, first and foremost through forward exchange contracts. In relation to exchange rate fluctuations, hedging ensures predictabil-ity in terms of profit and gives Management the opportunity
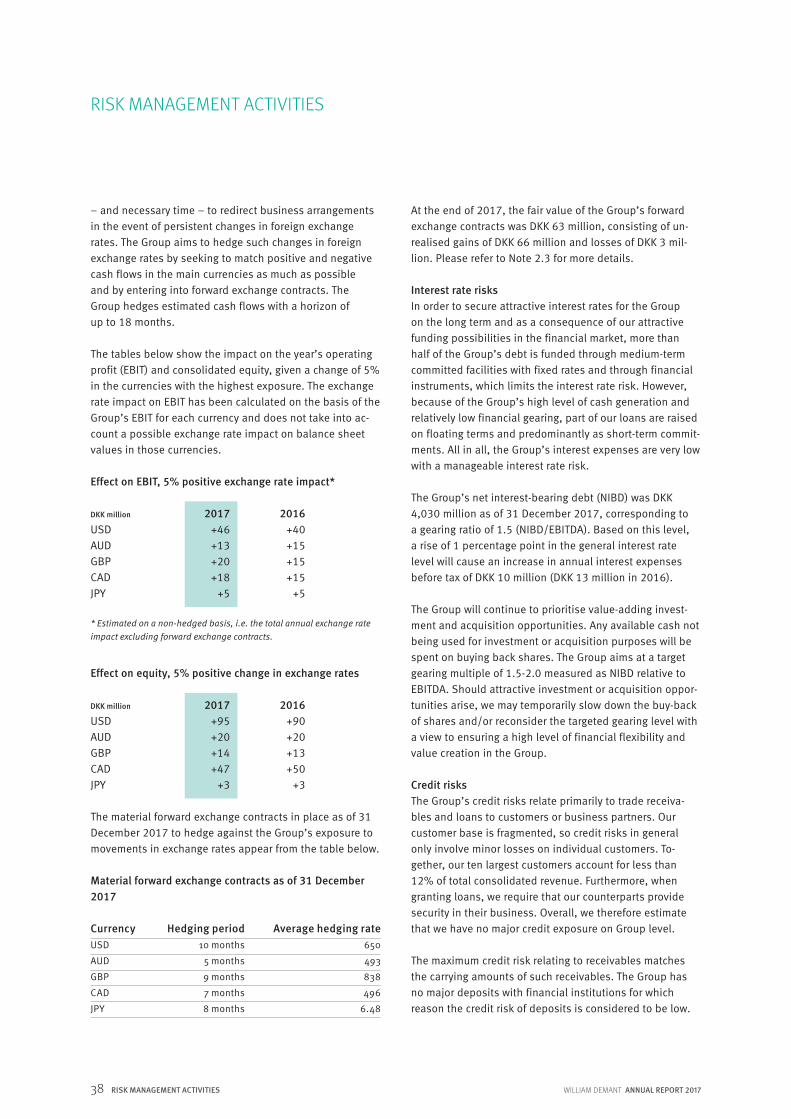
38 WILLIAM DEMANT ANNUAL REPORT 2017RISK MANAGEMENT ACTIVITIES
– and necessary time – to redirect business arrangements in the event of persistent changes in foreign exchange rates. The Group aims to hedge such changes in foreign exchange rates by seeking to match positive and negative cash flows in the main currencies as much as possible and by entering into forward exchange contracts. The Group hedges estimated cash flows with a horizon of up to 18 months.
The tables below show the impact on the year’s operating profit (EBIT) and consolidated equity, given a change of 5% in the currencies with the highest exposure. The exchange rate impact on EBIT has been calculated on the basis of the Group’s EBIT for each currency and does not take into ac-count a possible exchange rate impact on balance sheet values in those currencies.
Effect on EBIT, 5% positive exchange rate impact*
DKK million 2017 2016USD +46 +40AUD +13 +15GBP +20 +15CAD +18 +15JPY +5 +5
* Estimated on a non-hedged basis, i.e. the total annual exchange rate impact excluding forward exchange contracts.
Effect on equity, 5% positive change in exchange rates
DKK million 2017 2016USD +95 +90AUD +20 +20GBP +14 +13CAD +47 +50JPY +3 +3
The material forward exchange contracts in place as of 31 December 2017 to hedge against the Group’s exposure to movements in exchange rates appear from the table below.
At the end of 2017, the fair value of the Group’s forward exchange contracts was DKK 63 million, consisting of un-realised gains of DKK 66 million and losses of DKK 3 mil-lion. Please refer to Note 2.3 for more details.
Interest rate risksIn order to secure attractive interest rates for the Group on the long term and as a consequence of our attractive funding possibilities in the financial market, more than half of the Group’s debt is funded through medium-term committed facilities with fixed rates and through financial instruments, which limits the interest rate risk. However, because of the Group’s high level of cash generation and relatively low financial gearing, part of our loans are raised on floating terms and predominantly as short-term commit-ments. All in all, the Group’s interest expenses are very low with a manageable interest rate risk.
The Group’s net interest-bearing debt (NIBD) was DKK 4,030 million as of 31 December 2017, corresponding to a gearing ratio of 1.5 (NIBD/EBITDA). Based on this level, a rise of 1 percentage point in the general interest rate level will cause an increase in annual interest expenses before tax of DKK 10 million (DKK 13 million in 2016).
The Group will continue to prioritise value-adding invest-ment and acquisition opportunities. Any available cash not being used for investment or acquisition purposes will be spent on buying back shares. The Group aims at a target gearing multiple of 1.5-2.0 measured as NIBD relative to EBITDA. Should attractive investment or acquisition oppor-tunities arise, we may temporarily slow down the buy-back of shares and/or reconsider the targeted gearing level with a view to ensuring a high level of financial flexibility and value creation in the Group.
Credit risksThe Group’s credit risks relate primarily to trade receiva-bles and loans to customers or business partners. Our customer base is fragmented, so credit risks in general only involve minor losses on individual customers. To- gether, our ten largest customers account for less than 12% of total consolidated revenue. Furthermore, when granting loans, we require that our counterparts provide security in their business. Overall, we therefore estimate that we have no major credit exposure on Group level.
The maximum credit risk relating to receivables matches the carrying amounts of such receivables. The Group has no major deposits with financial institutions for which reason the credit risk of deposits is considered to be low.
RISK MANAGEMENT ACTIVITIES
Material forward exchange contracts as of 31 December 2017
Currency Hedging period Average hedging rateUSD 10 months 650
AUD 5 months 493
GBP 9 months 838
CAD 7 months 496
JPY 8 months 6.48

WILLIAM DEMANT ANNUAL REPORT 2017 39RISK MANAGEMENT ACTIVITIES
RISK MANAGEMENT ACTIVITIES
Liquidity risksThe Group aims to have sufficient cash resources to be able to take appropriate steps in case of unforeseen fluc-tuations in cash outflows. We have access to considerable undrawn credit facilities, and the liquidity risk is therefore considered to be low. We are of the opinion that the Group has strong cash flows and a satisfactory credit rating to secure the current inflow of working capital and funds for potential acquisitions. Neither in previous years nor in the financial year 2017, has the Group defaulted on loan agreements.
Financial reporting process and internal controlOnce a year, we carry through a very detailed planning and budgetary process, and any deviations from the plans and budgets resulting from this process are carefully moni-tored month by month. In terms of sales and costs, month-over-month development is very similar from one year to the other, and due to the repetitive nature of our business, deviations will normally become visible fairly quickly. To ensure high quality in the Group’s financial reporting sys-tems, the Board of Directors and Executive Board have adopted policies, procedures and guidelines for financial reporting and internal control to which the subsidiaries and reporting units must adhere, including:
• Continuous follow-up on results achieved compared to the approved budgets
• Policies for IT, insurance, cash management, procure-ment etc.
• Reporting instructions as well as reporting and finance manuals
The responsibility for maintaining sufficient and efficient internal control and risk management in connection with financial reporting lies with the Executive Board. The Board of Directors has assessed the Group’s existing control envi-ronment and concluded that it is adequate and that there is no need for setting up an internal audit function.
Safeguarding corporate assetsManagement continuously seeks to minimise any finan- cial consequences of damage to corporate assets, includ-ing any operating losses resulting from such damage. We have invested in security and surveillance systems to prevent damage and to minimise such damage, should it arise. Major risks, which cannot be adequately minimised, are identified by the Company’s Management, which will ensure that appropriate insurance policies are, on a contin-uous basis, taken out under the Group’s global insurance programme administered by recognised and credit-rated
insurance brokers and that such insurances are taken out with insurance companies with high credit ratings. The Group’s insurance programme has deductible clauses in line with normal market terms. The Board of Directors reviews the Company’s insurance policies once a year, including the coverage of identified risks, and is briefed regularly on developments in identified risks. The purpose of this reporting is to keep the Board members fully updat-ed and to facilitate corrective action to minimise any such risks.

40 CORPORATE SOCIAL RESPONSIBILITY WILLIAM DEMANT ANNUAL REPORT 2017
CORPORATE SOCIAL RESPONSIBILITY
98 million DKK
Donations to research, education,culture and care
3.5 tonnes
CO2 emission per employee
“REPORTING ON RESPONSIBILITYEvery year, we prepare a corporate social responsibility (CSR) report, which describes the commitment of William Demant’s Management to ensure that the Group acts in accordance with corporate governance rules and business ethics and that it meets its social and environmental responsibilities.
The report also serves as the William Demant Group’s Communication on Progress (COP) report to the UN Global Compact and as our statement on the UK Modern Slavery Act. In addition, the report serves as the statutory report to be presented under section 99a and 99b of the Danish Financial Statements Act. The full report is available on our website, www.demant.com/media/#media-documents.
DONATIONS BY THE OTICON FOUNDATIONIn 2017, the Oticon Foundation donated DKK 98 million to projects in such areas as research, education, culture and care. A total of DKK 60 million was donated to projects aim-ing at alleviating hearing loss all over the world and to edu-cation and research projects within hearing healthcare. A few examples of our global philanthropic activities are our financial support to the Global Foundation for Children with Hearing Loss and the establishment of national new-born hearing screening in Mongolia.
Supporting institutions and research projects in the field of audiology is an important part of the Oticon Foundation’s activities. In 2017, the Oticon Foundation donated DKK 20 million to audiological research at leading universities in for instance the Netherlands, the US, France, the UK, Switzerland, Germany and in the Nordic countries. In ad-dition, DKK 10 million was donated to Danish universities.
DIVERSITY AND GENDER EQUALITYIn terms of corporate governance, diversity at management level addresses age, international experience and gender. We have defined a diversity policy and taken specific initia-
tives to increase the share of female managers in the Group. Since we started recording these numbers in 2009, the male/female manager ratio in our Danish companies has improved from 89/11 in 2009 to 77/23 in 2017. In middle and first-line management, the ratio has increased from 84/16 in 2009 to 76/24 in 2017.
We will continue to take concrete initiatives to support the diversity policy, ranging from communication to recruit-ment and onboarding. Furthermore, in the next couple of years, we will take concrete steps to also record these numbers in William Demant companies of a considerable size in other countries and to update our local policies in this area. The diversity policy and a description of the developments made are available in our CSR report and on our website, www.demant.com/about/responsibility.
In terms of gender equality, the Board set a new target in February 2016: Before the end of 2020, the Board of Directors aims to have at least two female members. To- day, the Board has one female member.
CONCRETE EMISSION IMPROVEMENTSWe are committed to limiting our environmental footprint, and we encourage environmentally friendly initiatives across the Group. In order to track our total corporate CO2 emissions, we collect each year CO2 emission data, which are subsequently published in our CSR report.
In 2017, our Group’s CO2 emissions reached 37,671 tonnes, corresponding to 3.5 CO2 tonnes per employee. This is an increase compared to last year, as we have broadened our tracking and included the energy consump-tion of a representative cross section of the Group’s retail entities. The energy consumption of our hearing care shops is higher than consumption at our corporate sites and loca-tions, which we find natural. If we exclude these retail enti-ties, we have seen a decrease from 2.32 CO2 tonnes per employee in 2016 to 1.92 CO2 tonnes in 2017.
Deeply rooted in the hearing healthcare industry, we aspire to improve people’s quality of life and to run our business in a sustainable way. We are committed to being a responsible and reliable participant in the global community.
Søren Nielsen, President & CEO of William Demant Holding

WILLIAM DEMANT ANNUAL REPORT 2017 41CORPORATE GOVERNANCE
Recommendations on corporate governance Recommendations issued by the Danish Committee on Corporate Governance and adopted by Nasdaq Copenhagen are best-practice guidelines for the management of compa-nies admitted to trading on a regulated market in Denmark. The recommendations should be viewed together with the statutory requirements, including not least the Danish Companies Act and the Danish Financial Statements Act, but also European Union company law.
The work on corporate governance is an ongoing process for our Board of Directors and Executive Board, which deter-mines the extent to which the Company should comply with the recommendations and regularly assess whether the rec-ommendations give rise to amendments to our rules of pro-cedure or managerial processes. When reporting on corpo-rate governance, we follow the “comply or explain” princi-ple. The few cases where we have chosen to deviate from a recommendation are well-founded, and we explain what we do instead. To further increase transparency, we provide supplementary and relevant information, even when we follow the recommendations. A complete schematic presentation of the recommendations and how we comply, Statutory report on corporate govern-ance, cf. section 107 b of the Danish Financial Statements Act, is available on our website, www.demant.com/about/responsibility/#governance.
Board of Directors Tasks and responsibilities of the Board of Directors The Board of Directors is responsible for the overall stra-tegic management and for the financial and managerial supervision of the Company, the ultimate goal being to ensure that the Company creates value. On an ongoing basis, the Board of Directors evaluates the work of the Executive Board as for instance reflected in the annual plan and budget prepared for the Board of Directors. The Board’s duties and responsibilities are set out in its rules of procedure, and the Executive Board’s duties and respon-sibilities are provided in a set of instructions. The rules of procedure and instructions are reviewed annually by the Board of Directors and updated as deemed necessary.
Composition and organisation of the Board of DirectorsThe Board has eight members: five members elected by the shareholders at the annual general meeting and three members elected by staff in Denmark. Following the annual general meeting in 2017, Niels B. Christiansen was appoint-ed new Chairman of the Board. Shareholders elect Board members for a term of one year, and staff elect Board mem-bers for a term of four years. Staff-elected members are elected in accordance with the provisions of the Danish Companies Act.
Although the Board members elected by the general meet-ing are up for election every year, the individual Board members are traditionally re-elected and sit on the Board for an extended number of years. This ensures consistency and maximum insight into the conditions prevailing in the Company and the industry. Such consistency and in-sight are considered extremely important in order for the Board members to bring value to the Company. Presently, three of the Board members elected by shareholders at the an-nual general meeting are independent.
The Board is composed to ensure the right combination of competencies and experience, with extensive interna-tional managerial experience and board experience from major listed companies carrying particular weight. This also applies when new Board candidates are selected. On our website, www.demant.com/about/management/, we describe the competencies and qualifications that the Board of Directors deems necessary to have at its overall disposal in order for the Board to be able to perform its tasks for the Company. Board committeesThe Company’s Board of Directors has set up an audit com-mittee. The Board of Directors appoints the chairman of the audit committee, who must be independent and who must not be Chairman of the Board of Directors.
The Company’s Board of Directors has also set up a nomi-nation committee. The members are the Chairman and the Deputy Chairman of the Company’s Board of Directors, the Chairman and the Deputy Chairman of the Company’s major shareholder, the Oticon Foundation, and the President & CEO of the Company. The Chairman of the Board also chairs the nomination committee.
The Company’s Board of Directors has also set up a remu-neration committee. The members are the Chairman and the Deputy Chairman of the Company’s Board of Directors. The Chairman of the Board also chairs the remuneration committee.
The terms of reference and the composition of the audit, nomination and remuneration committees can be found on our website.
Evaluation of the performance of the Board of DirectorsOnce a year, the Chairman of the Board performs an evalu-ation of the Board’s work. Every other year, such evaluation is performed through personal, individual interviews with the Board members by the Chairman of the Board, and every other year, the evaluation is carried out by means of a questionnaire to be filled in by the individual Board
CORPORATE GOVERNANCE

42 WILLIAM DEMANT ANNUAL REPORT 2017
CORPORATE GOVERNANCE
CORPORATE GOVERNANCE
members. In both instances, the results of the evaluation are presented and discussed at the subsequent Board meeting, and any improvement proposals are considered.
Board of Directors’ and Executive Board’s remuneration At the annual general meeting in 2016, new guidelines for incentive pay were adopted, allowing agreements on in- centive pay for the Executive Board. In addition to their fixed remuneration, members of the Executive Board are allowed to join a cash-settled, share-based remuneration programme, the purposes of which are to provide further incentive for members of the Executive Board to continue their services to the Company and to align the interests of the Executive Board with the interests of the shareholders of the Company. The share-based programme has vesting conditions under which the members of the Executive Board must remain employed for three years to receive the remu-neration.
Board members’ fees consist of a basic fee of DKK 350,000. The Chairman receives three times the basic fee, and the Deputy Chairman receives twice the basic fee.
The members of the audit committee receive a basic fee of DKK 50,000, and the chairman of the committee receives three times the basic fee. Nomination and remuneration committee members do not receive additional remuneration for their work on the committee.
Meetings in 2017In 2017, the Board of Directors convened on five occasions. The audit committee held three meetings in connection with ordinary Board meetings. In 2017, the nomination commit-tee held one meeting, and the remuneration committee held one meeting.

WILLIAM DEMANT ANNUAL REPORT 2017 43
EXECUTIVE BOARD
EXECUTIVE BOARD
Søren Nielsen joined the Company in 1995 and has since then worked within multiple areas of the Group. In his first years, he worked with the Group’s then newly acquired hearing aid manufacturer, Bernafon, in Switzerland where he was instrumental in integrating Bernafon into the William Demant Group. He then moved on to also work within shared services as Quality Director and as business unit team leader in Oticon.
Since 2008, Søren Nielsen has been overall responsible for all the Group’s hearing aid activities, consisting of three hearing aid brands, and been Presi- dent of Oticon, and he has had a decisive say in the Group’s important strategic decisions and acquisitions. In 2015, he was appointed COO & Deputy CEO of William Demant Holding, and he has been a member of the Executive Board since September 2015. After more than 20 years with the Group, he took over as President & CEO of William Demant Holding in April 2017.
• Oticon A/S, President• Sennheiser Communications A/S, board member• HIMSA A/S, chairman• HIMSA II A/S, board member
Søren Nielsen holds a Master of Science degree in Industrial Management and Product Development from the Technical University of Denmark (DTU). He used Oticon as a case in his thesis work, and right after his graduation, he was em-ployed with the Company, which he has got to know from all angles imaginable. Søren Nielsen has a wide network in the global hearing healthcare community. One of the most important things that drives him is experiencing how proper hearing healthcare can positively change the lives of people with hearing loss and add immense value to society.
René Schneider joined the Company in September 2015 as Chief Financial Officer (CFO) and member of the Executive Board. René Schneider has broad business and financial experience from various management positions with major com-panies, including Auriga Industries (Cheminova), NeuroSearch, NNIT and Novo Nordisk. His areas of responsibility in William Demant Holding include HR, Finance, Oper-ations, IT, Executive Support, Investor Relations and Legal Affairs.
René Schneider holds a Master of Science degree in Economics from Aarhus University. He has extensive international experience in such areas as stream- lining and re-establishing companies, M&As and driving value creation.
Søren NielsenPresident & CEO(born 1970)13,512 shares
René SchneiderCFO(born 1973)6,361 shares
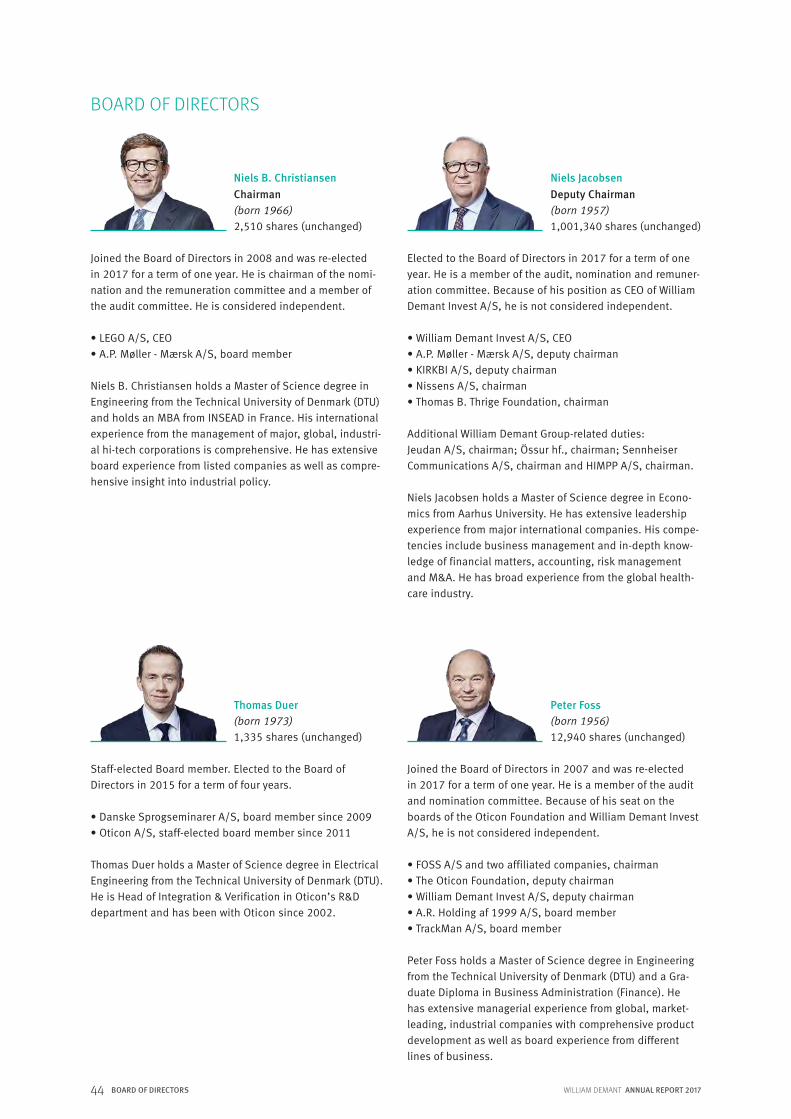
44 WILLIAM DEMANT ANNUAL REPORT 2017BOARD OF DIRECTORS
Joined the Board of Directors in 2008 and was re-elected in 2017 for a term of one year. He is chairman of the nomi-nation and the remuneration committee and a member of the audit committee. He is considered independent.
• LEGO A/S, CEO• A.P. Møller - Mærsk A/S, board member
Niels B. Christiansen holds a Master of Science degree in Engineering from the Technical University of Denmark (DTU) and holds an MBA from INSEAD in France. His international experience from the management of major, global, industri-al hi-tech corporations is comprehensive. He has extensive board experience from listed companies as well as compre-hensive insight into industrial policy.
Staff-elected Board member. Elected to the Board of Directors in 2015 for a term of four years.
• Danske Sprogseminarer A/S, board member since 2009• Oticon A/S, staff-elected board member since 2011
Thomas Duer holds a Master of Science degree in Electrical Engineering from the Technical University of Denmark (DTU). He is Head of Integration & Verification in Oticon’s R&D department and has been with Oticon since 2002.
Niels B. ChristiansenChairman(born 1966)2,510 shares (unchanged)
Thomas Duer (born 1973)1,335 shares (unchanged)
Joined the Board of Directors in 2007 and was re-elected in 2017 for a term of one year. He is a member of the audit and nomination committee. Because of his seat on the boards of the Oticon Foundation and William Demant Invest A/S, he is not considered independent.
• FOSS A/S and two affiliated companies, chairman• The Oticon Foundation, deputy chairman• William Demant Invest A/S, deputy chairman• A.R. Holding af 1999 A/S, board member • TrackMan A/S, board member
Peter Foss holds a Master of Science degree in Engineering from the Technical University of Denmark (DTU) and a Gra-duate Diploma in Business Administration (Finance). He has extensive managerial experience from global, market-leading, industrial companies with comprehensive product development as well as board experience from different lines of business.
Peter Foss(born 1956)12,940 shares (unchanged)
BOARD OF DIRECTORS
Elected to the Board of Directors in 2017 for a term of one year. He is a member of the audit, nomination and remuner-ation committee. Because of his position as CEO of William Demant Invest A/S, he is not considered independent. • William Demant Invest A/S, CEO• A.P. Møller - Mærsk A/S, deputy chairman• KIRKBI A/S, deputy chairman• Nissens A/S, chairman• Thomas B. Thrige Foundation, chairman
Additional William Demant Group-related duties: Jeudan A/S, chairman; Össur hf., chairman; Sennheiser Communications A/S, chairman and HIMPP A/S, chairman.
Niels Jacobsen holds a Master of Science degree in Econo-mics from Aarhus University. He has extensive leadership experience from major international companies. His compe-tencies include business management and in-depth know-ledge of financial matters, accounting, risk management and M&A. He has broad experience from the global health-care industry.
Niels JacobsenDeputy Chairman (born 1957)1,001,340 shares (unchanged)

WILLIAM DEMANT ANNUAL REPORT 2017 45BOARD OF DIRECTORS
Joined the Board of Directors in 2014 and was re-elected in 2017 for a term of one year. She is a member of the audit committee and is considered independent.
• Dell Technologies, SVP & EMEA General Counsel• Dell GmbH, Germany, chairman of the supervisory board
Benedikte Leroy holds a Master of Law degree from the University of Copenhagen. She has significant international management experience from large, global technology com-panies within both consumer and business-to-business segments. She has lived and worked in the UK and Belgium for many years.
Staff-elected Board member. Joined the Board of Directors in 2017 after having been elected substitute Board member in 2015 for a term of four years. Also staff-elected Board member from 2011-2015.
Jørgen Møller Nielsen holds a Master of Science degree in Electrical Engineering from the Technical University of Denmark (DTU) and a Diploma in Business Administration (Organisation and Strategy). He is Project Manager at the Group’s facility in Ballerup, Denmark, and he has been with the Company since 2001.
Staff-elected Board member. Joined the Board of Directors in 2003 and was re-elected in 2015 for a term of four years.
• Interacoustics A/S, staff-elected board member since 2003
Ole Lundsgaard trained as an electronics mechanic at the University of Odense, Institute of Biology. He is Senior Product Manager in Diagnostic Instruments where he is responsible for the hearing aid fitting systems area. He has been with Interacoustics A/S since 1993.
Benedikte Leroy(born 1970)3,000 shares (unchanged)
Ole Lundsgaard(born 1969)5,605 shares (+325)
Jørgen Møller Nielsen(born 1962)366 shares (+266)
BOARD OF DIRECTORS
Joined the Board of Directors in 2016 and was re-elected in 2017 for a term of one year. He is chairman of the audit committee and is considered independent.
• Coloplast A/S, President & CEO• H. Lundbeck A/S, chairman• Committee on healthcare issues under the Confederation
of Danish Industry, chairman
Lars Rasmussen holds a Bachelor of Science degree in Engineering from Aalborg University and an Executive MBA from SIMI. He has considerable executive manage-ment experience from global MedTech functions. His qua-lifications include management and board experience from listed companies, and he is well versed in such areas as innovation, globalisation, business-to-business and busi-ness-to-consumer sales models. He has extensive experi-ence of globalisation and efficiency improvements.
Lars Rasmussen(born 1959)7,500 shares (unchanged)

FINANCIAL REPORT
WILLIAM DEMANT ANNUAL REPORT 2017 47MANAGEMENT STATEMENT
We have today discussed and approved the Annual Report 2017 of William Demant Holding A/S for the financial year 1 January – 31 December 2017.
The consolidated financial statements are prepared and presented in accordance with International Financial Reporting Standards as adopted by the EU, and the Parent financial statements are prepared and presented in accordance with the Danish Financial Statements Act. Further, the Annual Report 2017 has been prepared in accordance with Danish disclosure requirements for listed companies.
In our opinion, the consolidated financial statements and the Parent financial statements give a true and fair view of the Group’s and the Parent’s assets, liabilities and financial position as of 31 December 2017 as well as of the consolidated financial performance and cash flows and the Parent’s financial performance for the financial year 1 January – 31 December 2017.
We also believe that the Management commentary contains a fair review of the development in the Group’s and the Parent’s business and financial position, the results for the year and the Group’s and the Parent’s financial position as a whole as well as a description of the principal risks and uncertainties that they face.
We recommend the Annual Report 2017 for adoption at the annual general meeting.
Smørum, 22 February 2018 Executive Board:
Søren Nielsen, President & CEO René Schneider, CFO
Board of Directors:
Niels B. Christiansen, Chairman Niels Jacobsen, Deputy Chairman
Thomas Duer Peter Foss Benedikte Leroy
Ole Lundsgaard Jørgen Møller Nielsen Lars Rasmussen
MANAGEMENT STATEMENT

48 WILLIAM DEMANT ANNUAL REPORT 2017INDEPENDENT AUDITOR’S REPORT
To the shareholders of William Demant Holding A/S
OpinionWe have audited the consolidated financial statements and the parent financial statements of William Demant Holding A/S for the financial year 1 January to 31 Decem-ber 2017, which comprise the income statement, balance sheet, statement of changes in equity and notes, including a summary of significant accounting policies, for the Group as well as the Parent, and the statement of comprehensive income and the cash flow statement of the Group. The consolidated financial statements are prepared in accord-ance with International Financial Reporting Standards as adopted by the EU and additional requirements of the Danish Financial Statements Act, and the parent financial statements are prepared in accordance with the Danish Financial Statements Act.
In our opinion, the consolidated financial statements give a true and fair view of the Group’s financial position as of 31 December 2017, and of the results of its operations and cash flows for the financial year 1 January 2017 to 31 De-cember 2017 in accordance with International Financial Reporting Standards as adopted by the EU and additional requirements under the Danish Financial Statements Act.
Further, in our opinion, the parent financial statements give a true and fair view of the Parent’s financial position as of 31 December 2017, and of the results of its opera-tions for the financial year 1 January 2017 to 31 December 2017 in accordance with the Danish Financial Statements Act.
Our opinion is consistent with our audit book comments issued to the Audit Committee and the Board of Directors.
Basis for opinionWe conducted our audit in accordance with International Standards on Auditing (ISAs) and the additional require-ments applicable in Denmark. Our responsibilities under those standards and requirements are further described in the Auditor’s responsibilities for the audit of the con-solidated financial statements and the parent financial statements section of this auditor’s report. We are inde-pendent of the Group in accordance with the International Ethics Standards Board of Accountants’ Code of Ethics for Professional Accountants (IESBA Code) and the additional requirements applicable in Denmark, and we have fulfilled our other ethical responsibilities in accordance with these requirements. We believe that the audit evidence we have obtained is sufficient and appropriate to provide a basis for our opinion.
To the best of our knowledge and belief, we have not provided any prohibited non-audit services as referred to in Article 5(1) of Regulation (EU) No 537/2014.
After William Demant Holding A/S was listed on Nasdaq OMX Copenhagen, we were appointed auditors for the first time on 29 April 1996 for the financial year 1996. We have been reappointed annually by decision of the general meet- ing for a total contiguous engagement period of 21 years up to and including the financial year 2017.
Key audit mattersKey audit matters are those matters that, in our profession-al judgement, were of most significance in our audit of the consolidated financial statements and the parent financial statements for the financial year 1 January to 31 December 2017. These matters were addressed in the context of our audit of the consolidated financial statements and the parent financial statements as a whole, and in forming our opinion thereon, and we do not provide a separate opinion on these matters.
Accounting for business combinationsRefer to note 6.1 in the consolidated financial statements.
The Group completed individually immaterial business combinations for a total purchase price of DKK 475 million, resulting in the recognition of goodwill of DKK 437 million and intangible assets of DKK 27 million.
The allocation of the purchase price in business combina-tions to other intangible assets acquired relies on assump-tions and judgements made by Management. Management has performed fair value calculations which include judge-ments and estimates, including the future cash flow antici-pated from the acquired customer base and the discount rate applied. We have tested internal controls that address the account-ing for business combinations and tested the reasonable-ness of the key assumptions, including market potential, revenue and cash flow growth and discount rates. We assessed and challenged Management’s assumptions used in its fair value models for identifying and measuring customer bases and for other intangible assets, including:
• The future cash flow projections by discussing with Management and key employees.
• Consulted with subject matter experts regarding the valuation methodologies applied.
INDEPENDENT AUDITOR’S REPORT

WILLIAM DEMANT ANNUAL REPORT 2017 49INDEPENDENT AUDITOR’S REPORT
INDEPENDENT AUDITOR’S REPORT
• Obtained supporting documentation of Management’s estimates and key assumptions and corroborated certain information – including the applied discount rates – with third party sources.
• Tested the mathematical accuracy of the calculations in the models.
• Considered the impact of reasonably possible changes in key assumptions and performed sensitivity calculations to quantify the impact of potential downside changes to Management’s models.
Statement on the management commentaryManagement is responsible for the management com-mentary.
Our opinion on the consolidated financial statements and the parent financial statements does not cover the man-agement commentary, and we do not express any form of assurance conclusion thereon.
In connection with our audit of the consolidated financial statements and the parent financial statements, our re-sponsibility is to read the management commentary and, in doing so, consider whether the management commen-tary is materially inconsistent with the consolidated finan-cial statements and the parent financial statements or our knowledge obtained in the audit or otherwise appears to be materially misstated.
Moreover, it is our responsibility to consider whether the management commentary provides the information required under the Danish Financial Statements Act.
Based on the work we have performed, we conclude that the management commentary is in accordance with the consolidated financial statements and the parent financial statements and has been prepared in accordance with the requirements of the Danish Financial Statements Act. We did not identify any material misstatement of the manage-ment commentary.
Management’s responsibilities for the consolidated financial statements and the Parent financial statementsManagement is responsible for the preparation of con-solidated financial statements that give a true and fair view in accordance with International Financial Reporting Standards as adopted by the EU and additional require-ments of the Danish Financial Statements Act as well as the preparation of parent financial statements that give a true and fair view in accordance with the Danish Financial Statements Act, and for such internal control as Manage-
ment determines is necessary to enable the preparation of consolidated financial statements and parent finan-cial statements that are free from material misstatement, whether due to fraud or error.
In preparing the consolidated financial statements and the parent financial statements, Management is respon-sible for assessing the Group’s and the Parent’s ability to continue as a going concern, for disclosing, as applicable, matters related to going concern, and for using the going con-cern basis of accounting in preparing the consolidated financial statements and the parent financial statements unless Management either intends to liquidate the Group or the Entity or to cease operations, or has no realistic alternative but to do so.
Auditor’s responsibilities for the audit of the consolidated financial statements and the parent financial statementsOur objectives are to obtain reasonable assurance about whether the consolidated financial statements and the parent financial statements as a whole are free from ma-terial misstatement, whether due to fraud or error, and to issue an auditor’s report that includes our opinion. Reasonable assurance is a high level of assurance, but is not a guarantee that an audit conducted in accordance with ISAs and the additional requirements applicable in Denmark will always detect a material misstatement when it exists. Misstatements can arise from fraud or error and are considered material if, individually or in the aggregate, they could reasonably be expected to influence the eco-nomic decisions of users taken on the basis of these con-solidated financial statements and these parent financial statements.
As part of an audit conducted in accordance with ISAs and the additional requirements applicable in Denmark, we ex-ercise professional judgement and maintain professional scepticism throughout the audit. We also:
• Identify and assess the risks of material misstatement of the consolidated financial statements and the parent financial statements, whether due to fraud or error, de-sign and perform audit procedures responsive to those risks, and obtain audit evidence that is sufficient and appropriate to provide a basis for our opinion. The risk of not detecting a material misstatement resulting from fraud is higher than for one resulting from error, as fraud may involve collusion, forgery, intentional omissions, misrepresentations, or the override of internal control.

50 WILLIAM DEMANT ANNUAL REPORT 2017INDEPENDENT AUDITOR’S REPORT
INDEPENDENT AUDITOR’S REPORT
• Obtain an understanding of internal control relevant to the audit in order to design audit procedures that are appropriate in the circumstances, but not for the pur-pose of expressing an opinion on the effectiveness of the Group’s and the Parent’s internal control.
• Evaluate the appropriateness of accounting policies used and the reasonableness of accounting estimates and related disclosures made by Management.
• Conclude on the appropriateness of Management’s use of the going concern basis of accounting in preparing the consolidated financial statements and the parent finan-cial statements, and, based on the audit evidence ob-tained, whether a material uncertainty exists related to events or conditions that may cast significant doubt on the Group’s and the Parent’s ability to continue as a going concern. If we conclude that a material uncertainty exists, we are required to draw attention in our auditor’s report to the related disclosures in the consolidated fi-nancial statements and the parent financial statements or, if such disclosures are inadequate, to modify our opinion. Our conclusions are based on the audit evi-dence obtained up to the date of our auditor’s report. However, future events or conditions may cause the Group and the Entity to cease to continue as a going concern.
• Evaluate the overall presentation, structure and content of the consolidated financial statements and the parent financial statements, including the disclosures in the notes, and whether the consolidated financial state-ments and the parent financial statements represent the underlying transactions and events in a manner that gives a true and fair view.
• Obtain sufficient appropriate audit evidence regarding the financial information of the entities or business ac-tivities within the Group to express an opinion on the consolidated financial statements. We are responsible for the direction, supervision and performance of the group audit. We remain solely responsible for our audit opinion.
We communicate with those charged with governance regarding, among other matters, the planned scope and timing of the audit and significant audit findings, includ-ing any significant deficiencies in internal control that we identify during our audit.
We also provide those charged with governance with a statement that we have complied with relevant ethical requirements regarding independence, and to communi-cate with them all relationships and other matters that may reasonably be thought to bear on our independence, and where applicable, related safeguards.
From the matters communicated with those charged with governance, we determine those matters that were of most significance in the audit of the consolidated financial state-ments and the parent financial statements of the current period and are therefore the key audit matters. We de-scribe these matters in our auditor’s report unless law or regulation precludes public disclosure about the matter or when, in extremely rare circumstances, we determine that a matter should not be communicated in our report because the adverse consequences of doing so would reasonably be expected to outweigh the public interest benefits of such communication.
Copenhagen, 22 February 2018
DeloitteStatsautoriseret RevisionspartnerselskabBusiness Registration No 33 96 35 56
Anders Vad Dons Kåre Valtersdorf State-Authorised State-Authorised Public Accountant Public Accountant MNE no 25299 MNE no 34490

CONSOLIDATED FINANCIAL STATEMENTS

52 WILLIAM DEMANT ANNUAL REPORT 2017CONSOLIDATED INCOME STATEMENT
2017
13,189-3,163
10,026
-919-6,095
-72753
2,338
49-160
2,227
-4681,759
1,7545
1,759
6.846.84
(DKK million)
RevenueProduction costs Gross profit
R&D costsDistribution costsAdministrative expensesShare of profit after tax, associates and joint venturesOperating profit (EBIT)
Financial incomeFinancial expensesProfit before tax
Tax on profit for the yearProfit for the year
Profit for the year attributable to:William Demant Holding A/S’ shareholdersMinority interests
Earnings per share (EPS), DKKDiluted earnings per share (DEPS), DKK
Note
1.1
1.2 / 1.3 / 1.5 / 1.8
1.2 / 1.3 / 1.8 / 8.3
1.2 / 1.3 / 1.8
1.2 / 1.3 / 1.8 / 8.2
3.3 / 6.3
4.2
4.2
5.1
1.4
1.4
2016
12,002-2,9729,030
-839-5,654
-67681
1,942
42-143
1,841
-3771,464
1,4595
1,464
5.535.53
CONSOLIDATED INCOME STATEMENT

WILLIAM DEMANT ANNUAL REPORT 2017 53
2017
1,759
-350
147-49-11
-263
8-26
-257
1,502
1,4975
1,502
10-3211-2
-13
CONSOLIDATED STATEMENT OF COMPREHENSIVE INCOME
CONSOLIDATED STATEMENT OF COMPREHENSIVE INCOME
2016
1,464
43
-2046-9
60
-71
-6
54
1,518
1,5135
1,518
-34
-101
-8
(DKK million)
Profit for the year
Other comprehensive income:
Items that have been or may subsequently be reclassified to the income statement:Foreign currency translation adjustment, subsidiariesValue adjustment of hedging instruments: Value adjustment for the year Value adjustment transferred to revenueTax on items that have been or may subsequently be reclassified to the income statementItems that have been or may subsequently be reclassified to the income statement
Items that will not subsequently be reclassified to the income statement:Actuarial gains/losses on defined benefit plansTax on items that will not subsequently be reclassified to the income statementItems that will not subsequently be reclassified to the income statement
Other comprehensive income
Comprehensive income
Comprehensive income attributable to:William Demant Holding A/S’ shareholdersMinority interests
Breakdown of tax on other comprehensive income:Foreign currency translation adjustment, subsidiariesValue adjustment of hedging instruments for the yearValue adjustment of hedging instruments transferred to revenueActuarial gains/losses on defined benefit plansTax on other comprehensive income

54 WILLIAM DEMANT ANNUAL REPORT 2017CONSOLIDATED BALANCE SHEET 31 DECEMBER – ASSETS
2017
6,33940
407106
6,892
871210289265
831,718
933500
11456372
2,272
10,882
1,3512,573
81107257
66208697
5,340
16,222
(DKK million)
AssetsGoodwillPatents and licencesOther intangible assetsPrepayments and assets under developmentIntangible assets
Land and buildingsPlant and machineryOther plant, fixtures and operating equipmentLeasehold improvementsPrepayments and assets under constructionProperty, plant and equipment
Investments in associates and joint venturesReceivables from associates and joint venturesOther investmentsOther receivablesDeferred tax assetsOther non-current assets
Non-current assets
InventoriesTrade receivablesReceivables from associates and joint venturesIncome taxOther receivablesUnrealised gains on financial contractsPrepaid expenses CashCurrent assets
Assets
CONSOLIDATED BALANCE SHEET 31 DECEMBER
2016
6,27651
289152
6,768
878220290263
911,742
583383
8539396
1,909
10,419
1,3002,440
71146259
11192710
5,129
15,548
Note
3.1
3.2
3.3
3.3 / 4.3 / 4.4
3.3 / 4.3 / 4.5
1.6 / 3.3 / 4.3 / 4.4
5.2
1.5
1.6 / 4.3
4.3
1.6 / 4.3 / 4.4
2.3 / 4.3 / 4.5
4.3 / 4.4

WILLIAM DEMANT ANNUAL REPORT 2017 55CONSOLIDATED BALANCE SHEET 31 DECEMBER – EQUITY AND LIABILITIES
CONSOLIDATED BALANCE SHEET 31 DECEMBER
2017
527,3757,427
67,433
2,307159215197208
3,086
3,258516
07225
1,5443
2855,703
8,789
16,222
2016
536,9086,961
56,966
1,960152295171170
2,748
3,547513
2148
321,244
46302
5,834
8,582
15,548
(DKK million)
Equity and liabilitiesShare capitalOther reservesEquity attributable to William Demant Holding A/S’ shareholdersEquity attributable to minority interestsEquity
Interest-bearing debtDeferred tax liabilitiesProvisionsOther liabilitiesDeferred incomeNon-current liabilities
Interest-bearing debtTrade payablesPayables to associates and joint venturesIncome taxProvisionsOther liabilitiesUnrealised losses on financial contractsDeferred incomeCurrent liabilities
Liabilities
Equity and liabilities
Note
4.3 / 4.4
5.2
7.1
4.3 / 7.2
4.3 / 4.4
4.3
7.1
4.3 / 7.2
2.3 / 4.3 / 4.4 / 4.5
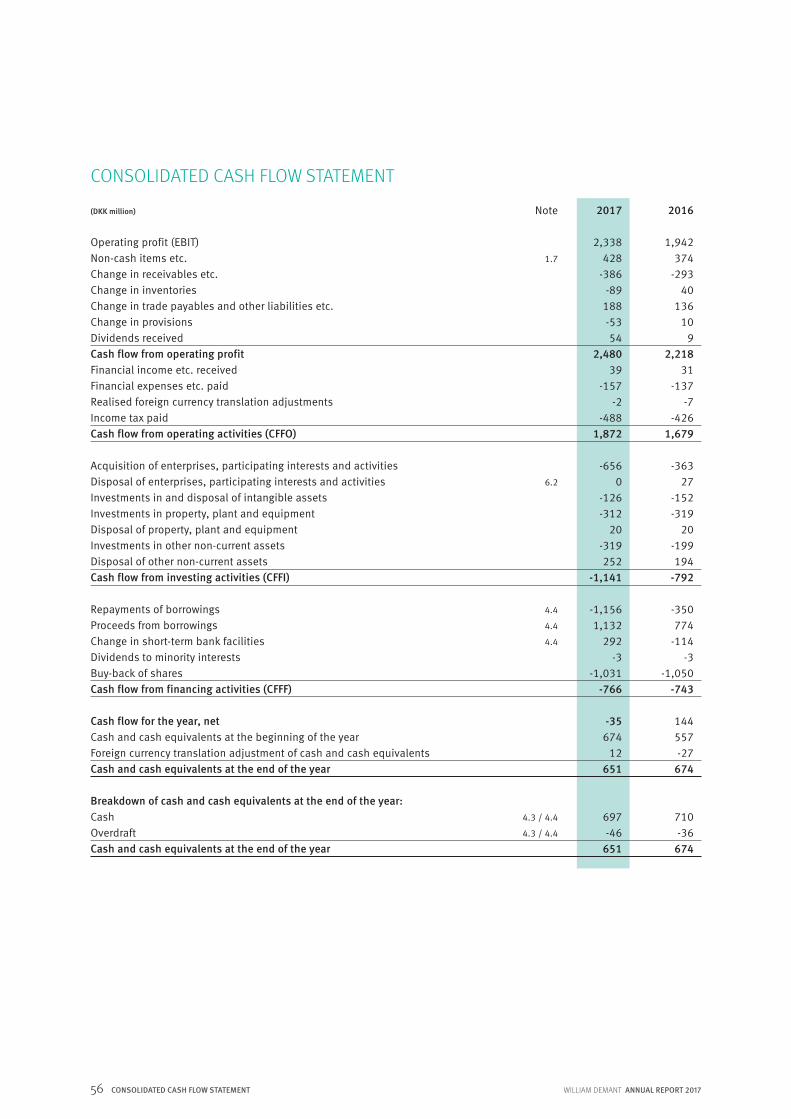
56 WILLIAM DEMANT ANNUAL REPORT 2017CONSOLIDATED CASH FLOW STATEMENT
2017
2,338428
-386-89
188-5354
2,48039
-157-2
-4881,872
-6560
-126-312
20-319252
-1,141
-1,1561,132
292-3
-1,031-766
-35674
12651
697-46
651
CONSOLIDATED CASH FLOW STATEMENT
2016
1,942374
-29340
13610
92,218
31-137
-7-426
1,679
-36327
-152-319
20-199194
-792
-350774
-114-3
-1,050-743
144557-27
674
710-36
674
Note
1.7
6.2
4.4
4.4
4.4
4.3 / 4.4
4.3 / 4.4
(DKK million)
Operating profit (EBIT)Non-cash items etc.Change in receivables etc.Change in inventoriesChange in trade payables and other liabilities etc.Change in provisionsDividends receivedCash flow from operating profitFinancial income etc. receivedFinancial expenses etc. paidRealised foreign currency translation adjustmentsIncome tax paidCash flow from operating activities (CFFO)
Acquisition of enterprises, participating interests and activitiesDisposal of enterprises, participating interests and activitiesInvestments in and disposal of intangible assetsInvestments in property, plant and equipmentDisposal of property, plant and equipment Investments in other non-current assets Disposal of other non-current assetsCash flow from investing activities (CFFI)
Repayments of borrowingsProceeds from borrowingsChange in short-term bank facilitiesDividends to minority interestsBuy-back of sharesCash flow from financing activities (CFFF)
Cash flow for the year, netCash and cash equivalents at the beginning of the yearForeign currency translation adjustment of cash and cash equivalentsCash and cash equivalents at the end of the year
Breakdown of cash and cash equivalents at the end of the year:CashOverdraftCash and cash equivalents at the end of the year
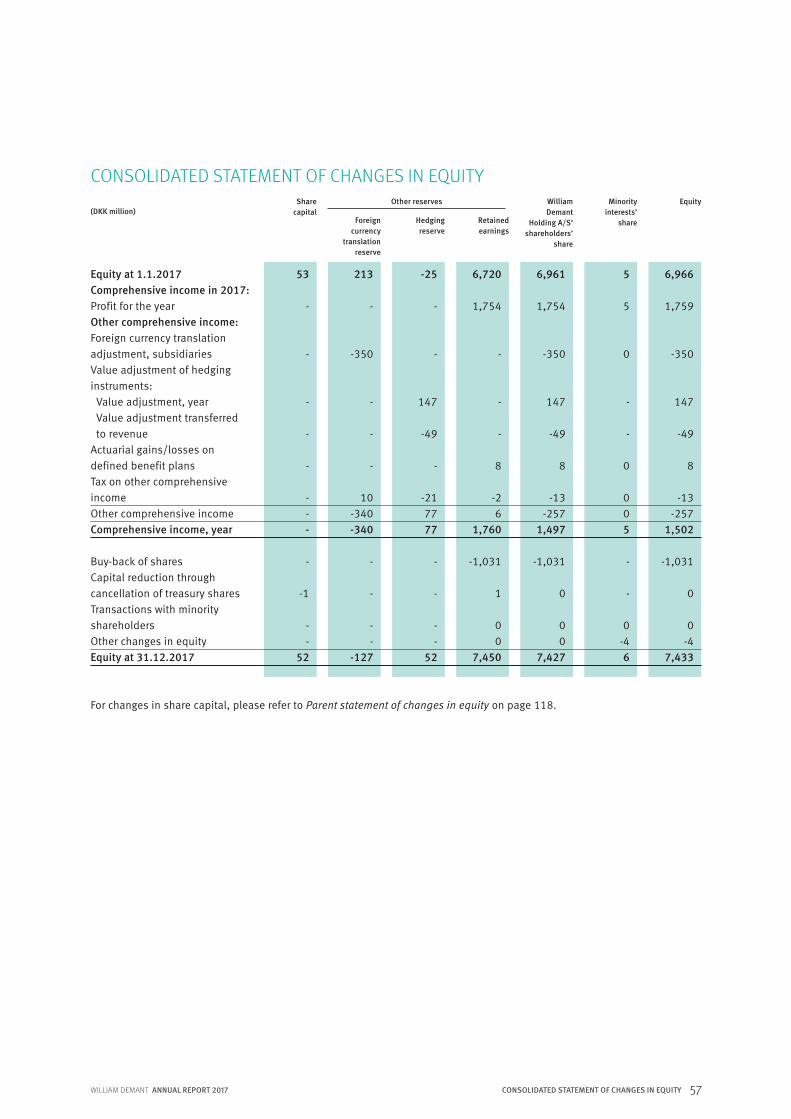
WILLIAM DEMANT ANNUAL REPORT 2017 57CONSOLIDATED STATEMENT OF CHANGES IN EQUITY
CONSOLIDATED STATEMENT OF CHANGES IN EQUITY
For changes in share capital, please refer to Parent statement of changes in equity on page 118.
6,966
1,759
-350
147
-49
8
-13 -257
1,502
-1,031 0
0 -4
7,433
6,720
1,754
-
- - 8
-2 6
1,760
-1,031
1
00
7,450
6,961
1,754
-350
147
-49
8
-13 -257
1,497
-1,031
0
00
7,427
5
5
0
-
-
0
0 0
5
-
-
0-4 6
-25
-
-
147
-49
-
-21 77 77
-
-
- -
52
213
-
-350
- - -
10 -340 -340
-
-
- -
-127
53
-
-
-
-
- -
- -
-
-1
- -
52
(DKK million)
Equity at 1.1.2017Comprehensive income in 2017:Profit for the yearOther comprehensive income:Foreign currency translationadjustment, subsidiariesValue adjustment of hedging instruments: Value adjustment, year Value adjustment transferred
to revenueActuarial gains/losses on defined benefit plansTax on other comprehensiveincomeOther comprehensive income Comprehensive income, year
Buy-back of sharesCapital reduction through cancellation of treasury sharesTransactions with minorityshareholdersOther changes in equityEquity at 31.12.2017
Other reservesShare capital
William Demant
Holding A/S’ shareholders’
share
Foreign currency
translation reserve
Hedgingreserve
Retained earnings
Minority interests’
share
Equity

58 WILLIAM DEMANT ANNUAL REPORT 2017CONSOLIDATED STATEMENT OF CHANGES IN EQUITY – CONTINUED
CONSOLIDATED STATEMENT OF CHANGES IN EQUITY – CONTINUED
Other reservesShare capital
William Demant
Holding A/S’ shareholders’
share
Foreign currency
translation reserve
Hedgingreserve
Retained earnings
Minority interests’
share
Equity
54
-
-
-
-
-
- - -
-
-1 -
- 53
173
-
43
-
-
-
-3 40 40
-
-
- -
213
-45
-
-
-20
46
-
-6 20 20
-
-
- -
-25
6,317
1,459
-
-
-
-7
1 -6
1,453
-1,050
1
-10
6,720
6,499
1,459
43
-20
46
-7
-8 54
1,513
-1,050
0
-10
6,961
1
5
0
-
-
0
0 0
5
-
-
2-3 5
6,500
1,464
43
-20
46
-7
-8 54
1,518
-1,050
0
1 -3
6,966
(DKK million)
Equity at 1.1.2016Comprehensive income in 2016:Profit for the yearOther comprehensive income:Foreign currency translationadjustment, subsidiariesValue adjustment of hedging instruments: Value adjustment, year Value adjustment transferred
to revenueActuarial gains/losses on defined benefit plansTax on other comprehensive incomeOther comprehensive income Comprehensive income, year
Buy-back of sharesCapital reduction through cancellation of treasury sharesTransactions with minorityshareholdersOther changes in equityEquity at 31.12.2016

WILLIAM DEMANT ANNUAL REPORT 2017 59NOTES TO CONSOLIDATED FINANCIAL STATEMENTS
Section 1 – page 60
OPERATING ACTIVITIES AND CASH FLOW1.1 Revenue by geographic region and business activity1.2 Employees1.3 Amortisation, depreciation and impairment losses1.4 Earnings per share1.5 Inventories1.6 Receivables1.7 Specification of non-cash items etc. 1.8 Restructuring costs
Section 2 – page 68
EXCHANGE RATES AND HEDGING2.1 Exchange rate risk policy2.2 Sensitivity analysis in respect of exchange rates2.3 Hedging and forward exchange contracts2.4 Exchange rates
Section 3 – page 73
ASSET BASE3.1 Intangible assets3.2 Property, plant and equipment3.3 Other non-current assets3.4 Non-current assets by geographic region3.5 Impairment testing
Section 4 – page 81
CAPITAL STRUCTURE AND FINANCIAL MANAGEMENT4.1 Financial risk management and capital structure4.2 Net financial items4.3 Categories of financial instruments4.4 Net interest-bearing debt, liquidity and interest
rate risks4.5 Fair value hierarchy
NOTES TO CONSOLIDATED FINANCIAL STATEMENTS
Section 5 – page 89
TAX5.1 Tax on profit5.2 Deferred tax
Section 6 – page 93
ACQUISITIONS, ASSOCIATES AND JOINT VENTURES6.1 Acquisition of enterprises and activities6.2 Divestment of enterprises and activities6.3 Associates and joint ventures
Section 7 – page 99
PROVISIONS, OTHER LIABILITIES ETC.7.1 Provisions7.2 Other liabilities7.3 Operating lease commitments7.4 Contingent liabilities
Section 8 – page 107
OTHER DISCLOSURE REQUIREMENTS8.1 Related parties8.2 Fees to Parent’s auditors appointed at the
annual general meeting8.3 Government grants8.4 Events after the balance sheet date8.5 Approval and publication8.6 Shareholders
Section 9 – page 110
BASIS FOR PREPARATION9.1 Group accounting policies9.2 Accounting estimates and assumptions
When relevant, if a note contains a figure that directly refers to the consolidated income statement, statement of comprehensive income, balance sheet or cash flow statement, this will be indicated by the following references:
IS – Consolidated income statement OCI – Consolidated other comprehensive incomeBS – Consolidated balance sheetCF – Consolidated cash flow statement

60 KAPITEL WILLIAM DEMANT ANNUAL REPORT 2017
SECTION 1 OPERATING ACTIVITIES AND CASH FLOW
13,189 million DKK
Revenue
1,387 million DKK
Free cash flow

WILLIAM DEMANT ANNUAL REPORT 2017 61SECTION 1 OPERATING ACTIVITIES AND CASH FLOW
1.1 REVENUE BY GEOGRAPHIC REGION AND BUSINESS ACTIVITY
Consolidated revenue mainly derives from the sale of goods and is broken down by the customers’ geographical location. The ten largest single customers together account for less than 12% of total consolidated revenue.
Value adjustments transferred from equity relating to derivatives made for hedging revenue OCI
2017
11,4951,194
50013,189
2016
10,5151,089
39812,002
2017
49
2016
-46
§ ACCOUNTING POLICIES Revenue is recognised in the income statement upon delivery and transfer of risk to buyer. Revenue from services, including service packages and extended warranties, is recognised on a straight-line basis in line with the delivery of such services.
Revenue is measured at the fair value of the agreed consideration excluding charges. Any discounts and profits on goods expected to be returned are set off against revenue. Revenue from agency-like business is measured at the value of the agency commission.
ACCOUNTING ESTIMATES AND ASSUMPTIONS Operating segmentsBased on IFRS 8 Operating Segments and the internal reporting model used by Management for the assessment of results and the use of resources, we have identified one operating segment: The development, manufacture and sale of products and equipment designed to facilitate people’s hearing and communication. This reflects Management’s approach to the organisation and management of activities.
Discounts, returns etc.Discounts, loyalty programmes and other revenue reductions are estimated and accrued when the related revenue is recorded. To make such estimates requires use of judgement, as all conditions are not known at the time of sale, e.g. the number of units sold to a given customer or the expected utilisation of loyalty programmes. Liabilities in respect of sales discounts, rebates and loyalty programmes are adjusted, as we gain better information on the likelihood that they will be realised and the value at which they are expected to be realised.
Depending on local legislation and the conditions to which a sale is subject, some customers have the option to return purchased goods for a refund. Based on historical return rates, an estimate is made of the expected returns and a liability is recognised. This liability is updated, as returns are recognised or when we collect more accurate data on return rates.
2016
1864,9374,719
911861388
12,002
2017
2285,2095,358
946960488
13,189
(DKK million)
Revenue by geographic region:DenmarkOther EuropeNorth AmericaOceaniaAsiaOther countriesTotal IS
Revenue by business activity: Hearing DevicesDiagnostic InstrumentsHearing ImplantsTotal IS

62 WILLIAM DEMANT ANNUAL REPORT 2017SECTION 1 OPERATING ACTIVITIES AND CASH FLOW
2017
4,937 3
70 2
476 5,488
796 571
3,491 630
5,488
13,280
2016
4,580 1
64 3
419 5,067
785 502
3,191 589
5,067
12,339
1.2 EMPLOYEES
As of 1 April 2017, Niels Jacobsen stepped down from his position as President & CEO of William Demant Holding. At the same time, the Board of Directors appointed Søren Nielsen new President & CEO of William Demant Holding.
A seniority bonus in the amount of DKK 42 million, matching one year’s salary for every four years of employment from 2005 to 2016, was paid out in April 2017 to the former President & CEO of William Demant Holding, Niels Jacobsen.
President & CEO, Søren Nielsen, is entitled to 24 months’ notice in the event of dismissal. CFO, René Schneider, is currently entitled to 14 months’ notice in the event of dismissal, which increases with seniority.
In 2017, the basic remuneration for a member of the Parent’s Board of Directors was DKK 350,000 (DKK 350,000 in 2016). The Chairman of the Board of Directors receives three times the basic remuneration and the Deputy Chairman twice the basic remuneration. The members of the audit committee each receive a basic remuneration of DKK 50,000 (DKK 50,000 in 2016), and the chairman of the audit committee receives three times the basic remuneration.
2017
Wages and salaries*
Share-based remunera-
tion**
TotalSeniority bonus
Wages and salaries*
Share-based remunera-
tion**
TotalSeniority bonus
2016
10.35.0
3.618.9
4.3
- -
0.00.0
-
0.90.5
- 1.4
-
11.25.5
3.620.3
4.3
7.94.7
14.126.7
3.9
- -
5.25.2
-
0.4 0.2
- 0.6
-
8.34.9
19.332.5
3.9
Note
7.1
(DKK million)
Staff costs:Wages and salariesShare-based remunerationDefined contribution plansDefined benefit plansSocial security costs, etc.Total
Staff costs by function:Production costsR&D costsDistribution costsAdministrative expensesTotal
Average number of full-time employees
Remuneration to Executive Board and Board of Directors (included in staff costs)
(DKK million)
Søren Nielsen, President & CEORené Schneider, CFONiels Jacobsen, former President & CEOExecutive Board
Fee to Board of Directors
*No member of the Executive Board has remuneration in the form of pension or other benefits of more than DKK 0.5 million (DKK 0.5 million in 2016). These expenses are therefore included in wages and salaries.**In 2017, DKK 0 million (DKK 0 million in 2016) of the share-based remuneration was settled.

WILLIAM DEMANT ANNUAL REPORT 2017 63
0.61.40.6
02.6
2.63.7
0.61.50.7
-0.32.5
2.25.1
SECTION 1 OPERATING ACTIVITIES AND CASH FLOW
1.2 EMPLOYEES – CONTINUED
In 2016, part of the Executive Board and other senior members of Management enrolled in a number of cash-settled, share-based remuneration programmes. These share-based programmes have vesting conditions under which Management must stay employed for three years to receive the remuneration.
Members of Management enrolled in the share-based remuneration programme are entitled to “shadow shares” of a value equal to a certain number of months’ salary. The fair value is determined based on this at the time of granting. There has been no changes to the programme in 2017 or to the members enrolled in the programme.
At 31 December 2017, the Group had liabilities of DKK 5 million related to the share-based remuneration programmes (DKK 1 million in 2016). The liability is recognised on a straight-line basis, as the service is rendered. The liability is remeasured at each reporting date and at the settlement date based on the fair value of the “shadow shares”. Fair value adjustments are recognised as financial income or financial expenses. If relevant, the liability is adjusted to reflect the expected risk of non-vesting as a result of resignations. Any changes to the liability are recognised in the income statement. The Group bought back shares to cover the financial risk of share price fluctuations related to the programmes.
At 31 December 2017, the remaining average contractual life of cash-settled remuneration programmes was 24 months (31 months in 2016).
* Unrecognised commitment is the part of granted ”shadow shares” not expensed at 31 December.
ACCOUNTING ESTIMATES AND ASSUMPTIONS Management must evaluate the likelihood of vesting conditions for the cash-settled, share-based programmes being ful-filled. Vesting is entirely dependent on the persons enrolled in the share-based programmes remaining employed until the end of the vesting period. The estimate made based on this likelihood is used to calculate the fair value of the share-based programmes. Furthermore, the shares must be valued. For this purpose, Management uses the share price quoted at Nasdaq Copenhagen.
-0.60.0
-0.6
2.21.7
-0.60.0
-0.6
3.93.1
Share-based remuneration
(DKK million)
Liability at 1.1.Expensed in staff costs during the yearFair value adjustmentsSettled during the yearLiability at 31.12.
Granted during the yearUnrecognised commitment at 31.12.*
ExecutiveBoard
Other senior members of
Management
20162017
ExecutiveBoard
Other senior members of
Management

64 WILLIAM DEMANT ANNUAL REPORT 2017
2017
1,754
261.91-5.35
256.56
6.84 6.84
2016
1,459
268.59 -4.84
263.75
5.535.53
1.3 AMORTISATION, DEPRECIATION AND IMPAIRMENT LOSSES
1.4 EARNINGS PER SHARE
William Demant Holding A/S’ shareholders’ share of profit for the year, DKK million IS
Average number of shares, millionAverage number of treasury shares, millionAverage number of shares outstanding, million
Earnings per share (EPS), DKK IS Diluted earnings per share (DEPS), DKK IS
2016
59296
23378
9541
20141
378
33
0303
2017
84289
0373
7253
20642
373
88
5128
(DKK million)
Amortisation of intangible assetsDepreciation of property, plant and equipmentImpairment of property, plant and equipment Total
Amortisation, depreciation and impairment losses by function:Production costsR&D costsDistribution costsAdministrative expensesTotal
Net gains from sale of assetsTotal
Net gains from sale of assets by function:Production costsDistribution costsAdministrative expensesTotal
For accounting policies on amortisation and depreciation, please refer to Note 3.1 and Note 3.2.
SECTION 1 OPERATING ACTIVITIES AND CASH FLOW
Note
3.1
3.2
3.2

WILLIAM DEMANT ANNUAL REPORT 2017 65
2017
618 61
672 1,351
117
0
33 2,335
(DKK million)
Raw materials and purchased componentsWork in progressFinished goods and goods for resaleInventories BS
Write-downs, provisions for obsolescence etc. included in the above
Carrying amount of inventories recognised at fair value after deduction of costs to sell
Included in the income statement under production costs:Write-downs of inventories for the year, netCost of goods sold during the year
Write-downs for the year are shown net, as breakdown into reversed write-downs and new write-downs is not possible. Inventories are generally expected to be sold within one year.
2016
57749
6741,300
130
0
432,080
1.5 INVENTORIES
§ ACCOUNTING POLICIESRaw materials, components and goods for resale are measured at cost according to the FIFO principle (according to which the most recently purchased items are considered to be in stock) or at their net realisable value, whichever is lower.
Group-manufactured products and work in progress are measured at the value of direct cost, direct payroll costs, consum-ables and a proportionate share of indirect production costs (IPO), which are allocated on the basis of the normal capacity of the production facility. IPO include the proportionate share of capacity costs directly relating to Group-manufactured products and work in progress.
The net realisable value of inventories is calculated as the estimated selling price less costs of completion and costs to sell.
ACCOUNTING ESTIMATES AND ASSUMPTIONSIndirect production cost allocations to inventoryIndirect production cost allocations are based on relevant assumptions related to capacity utilisation at the production facility, production time and other product-related factors. The assumptions are reviewed regularly to ensure that inven-tories are measured at their actual production cost. Changes in assumptions may affect gross profit margins as well as the valuation of work in progress, finished goods and goods for resale. Obsolescence provisionThe obsolescence provision for inventories is based on the expected sales forecast for the individual types of hearing devices, diagnostic equipment and hearing implants. Sales forecasts are based on Management’s expectations of mar- ket conditions and trends, and the obsolescence provision is subject to changes in these assumptions.
SECTION 1 OPERATING ACTIVITIES AND CASH FLOW

66 WILLIAM DEMANT ANNUAL REPORT 2017
2017
2,573 456 257
3,286
2,362 486 144 143 151
3,286
-291 19 52
-56 4
-272
(DKK million)
Trade receivables BS Other non-current receivables BS Other current receivables BS Total
Non-impaired receivables by age:Balance not due0-3 months3-6 months6-12 monthsOver 12 monthsTotal
Breakdown of allowance for impairment:Allowance for impairment at 1.1.Foreign currency translation adjustmentsApplied during the yearAdditions during the yearReversals during the yearAllowance for impairment at 31.12.
§ ACCOUNTING POLICIESReceivables include trade receivables and other receivables. Receivables are included in the loans and receivables cate- gory and are financial assets with fixed or determinable payments, which are not listed on an active market and are not derivatives.
On initial recognition, receivables are measured at fair value with the addition of transaction costs. Receivables with a definite maturity date are measured at amortised cost. Receivables without a definite maturity date are measured at cost. Current receivables arisen as a result of the Group’s ordinary activities are measured at nominal value. Based on assess-ments of the risk of losses on individual receivables and groups of similar receivables, provisions for impairment are made for bad debts using an allowance account.
1.6 RECEIVABLES
Of the total amount of trade receivables, DKK 270 million (DKK 225 million in 2016) is expected to be collected after 12 months. For information on security and collateral, please refer to Credit risks in Note 4.1.
2016
2,440 539 259
3,238
2,325 480 184 105 144
3,238
-257 -6
40 -78 10
-291
SECTION 1 OPERATING ACTIVITIES AND CASH FLOW
ACCOUNTING ESTIMATES AND ASSUMPTIONSAllowance for impairment is calculated for both trade receivables and other receivables. For trade receivables, the allow- ance is calculated for anticipated credit losses based on an assessment of the debtor’s ability to pay. This assessment is made by local management and is made for uniform groups of debtors based on a maturity analysis. When indicated by special circumstances, impairments are made for individual debtors. Other receivables, including customer loans, are assessed on an individual basis. Allowance is made for those receivables that are estimated to not be fully recoverable.

WILLIAM DEMANT ANNUAL REPORT 2017 67SECTION 1 OPERATING ACTIVITIES AND CASH FLOW
1.7 SPECIFICATION OF NON-CASH ITEMS ETC.
2017
404-53
-885
428
2016
404-81
-354
374
(DKK million)
Amortisation and depreciation etc.Share of profit after tax, associates and joint ventures IS
Gain on sale of intangible assets and property, plant and equipmentOther non-cash itemsNon-cash items etc. CF
1.8 RESTRUCTURING COSTS
2017
38633827
166
-16620-6
-15-167
16-151
2016
72553625
188
-18858
645
-792
-77
(DKK million)
Restructuring costs by function:Production costsR&D costsDistribution costsAdministrative expensesTotal
Effect of restructuring costs on cash flow:Operating profit (EBIT)Non-cash items etc.Change in trade payables and other liabilities etc.Change in provisionsCash flow from operating profitIncome tax recoveredCash flow from operating activities (CFFO)
The Group has defined several strategic initiatives to be implemented in the years 2016 to 2018 with the aim to ensure con-tinuous cost efficiency gains and to support our future scalability at a lower cost. In 2016 and 2017, the costs of these initia-tives impacted the income statement and the cash flow statement as indicated below.
Note
1.3

68 KAPITEL WILLIAM DEMANT ANNUAL REPORT 2017
SECTION 2 EXCHANGE RATES AND HEDGING
98%Sales invoiced in foreign currencies
1,297 million DKK
Contractual value of forward exchange contracts

WILLIAM DEMANT ANNUAL REPORT 2017 69SECTION 2 FOREIGN CURRENCIES AND HEDGING
2.1 EXCHANGE RATE RISK POLICY
The Group seeks to hedge against any exchange rate risks, first and foremost through forward exchange contracts. In relation to exchange rate fluctuations, hedging ensures predictability in terms of profit and gives Management the opportunity – and necessary time – to redirect business arrangements in the event of persistent changes in foreign exchange rates. The Group aims to hedge such changes in foreign exchange rates by seeking to match positive and negative cash flows in the main cur-rencies as much as possible and by entering into forward exchange contracts. The Group hedges estimated cash flows with a horizon of up to 18 months.
2.2 SENSITIVITY ANALYSIS IN RESPECT OF EXCHANGE RATES
(DKK million)
USDAUDGBPCADJPY
Effect on equity, 5% positive exchange rate impactEffect on EBIT, 5% positive exchange rate impact*
(DKK million)
USDAUDGBPCADJPY
* Estimated on a non-hedged basis, i.e. the total annual exchange rate impact excluding forward exchange contracts.
2017
+46+13+20+18
+5
2016
+40+15+15+15
+5
2017
+95+20+14+47
+3
2016
+90+20+13+50
+3
The below tables show the impact on the year’s operating profit (EBIT) and consolidated equity, given a change of 5% in the currencies with the highest exposures. The exchange rate impact on EBIT has been calculated on the basis of the Group’s EBIT for each currency and does not take into account a possible exchange rate impact on balance sheet values in those currencies.

70 WILLIAM DEMANT ANNUAL REPORT 2017SECTION 2 FOREIGN CURRENCIES AND HEDGING
§ ACCOUNTING POLICIESOn initial recognition, derivatives are measured at fair value at the settlement date. After initial recognition, derivatives are measured at fair value at the balance sheet date. Any positive or negative fair values of derivatives are recognised as sepa-rate items in the balance sheet. Forward exchange contracts and interest swaps are measured based on current market data and by use of commonly recognised valuation methods. Please refer to Note 4.5.
2.3 HEDGING AND FORWARD EXCHANGE CONTRACTS
Open forward exchange contracts at the balance sheet date may be specified as shown below, with contracts for the sale of currencies being shown at their negative contractual values. The expiry dates reflect the periods in which the hedged cash flows are expected to be realised.
Realised forward exchange contracts are recognised in the income statement together with the items, typically revenue in foreign currency, that such contracts are designed to hedge. In 2017, the Group’s forward exchange contracts realised a gain of DKK 49 million (loss of DKK 46 million in 2016), which increased reported revenue for the year. In addition, the Group raised loans in foreign currencies to balance out net receivables. At year-end 2017, the Group had entered into for-ward exchange contracts at a contractual value of DKK 1,297 million (DKK 1,694 million in 2016) and a fair value of DKK 63 million (DKK -34 million in 2016).
2016
2017
USDAUDGBPCADJPYOther
Forward exchange contracts
Contractual value
Positive fair value
at year-end
Negative fair value
at year-end
Expiry Fair value
0021003
2017/2018201720172017
2017/20182017
-754-111-277-246
-91182
-1,297
41202
144
63
41223
144
66
201820182018201820182018
4001301
45
-1,164-153-121-210-179133
-1,694
-4020
-370
-34
021071
11
USDAUDGBPCADJPYOther
Hedgingperiod*
Averagehedging
rate
650493838496
6.48-
10 months5 months9 months7 months8 months
-
(DKK million)
673510867513
6.29-
14 months6 months4 months8 months
18 months-
* Hedging periods represent the estimated periods for which the exchange rate exposure of a relative share of our revenue in a currency will be covered by forward exchange contracts.
Contractual value
Positive fair value
at year-end
Negative fair value
at year-end
Expiry Fair valueHedgingperiod*
Averagehedging
rate
(DKK million)
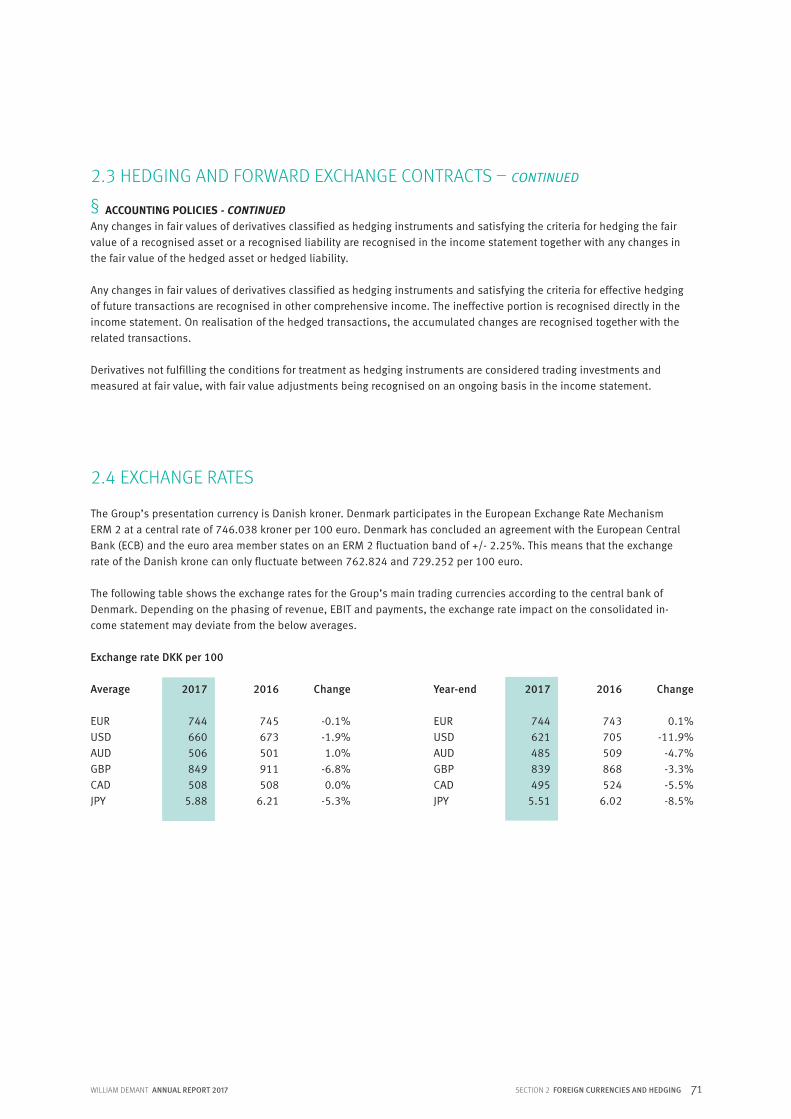
WILLIAM DEMANT ANNUAL REPORT 2017 71
2.4 EXCHANGE RATES
The Group’s presentation currency is Danish kroner. Denmark participates in the European Exchange Rate Mechanism ERM 2 at a central rate of 746.038 kroner per 100 euro. Denmark has concluded an agreement with the European Central Bank (ECB) and the euro area member states on an ERM 2 fluctuation band of +/- 2.25%. This means that the exchange rate of the Danish krone can only fluctuate between 762.824 and 729.252 per 100 euro.
The following table shows the exchange rates for the Group’s main trading currencies according to the central bank of Denmark. Depending on the phasing of revenue, EBIT and payments, the exchange rate impact on the consolidated in-come statement may deviate from the below averages.
Average
EURUSDAUDGBPCADJPY
Exchange rate DKK per 100
2017
744660506849508
5.88
2016
745 673 501911508
6.21
Change
-0.1%-1.9%1.0%
-6.8%0.0%
-5.3%
Year-end
EURUSDAUDGBPCADJPY
2017
744 621485839495
5.51
2016
743 705
509868524
6.02
Change
0.1%-11.9%
-4.7%-3.3%-5.5%-8.5%
§ ACCOUNTING POLICIES - CONTINUEDAny changes in fair values of derivatives classified as hedging instruments and satisfying the criteria for hedging the fair value of a recognised asset or a recognised liability are recognised in the income statement together with any changes in the fair value of the hedged asset or hedged liability.
Any changes in fair values of derivatives classified as hedging instruments and satisfying the criteria for effective hedging of future transactions are recognised in other comprehensive income. The ineffective portion is recognised directly in the income statement. On realisation of the hedged transactions, the accumulated changes are recognised together with the related transactions.
Derivatives not fulfilling the conditions for treatment as hedging instruments are considered trading investments and measured at fair value, with fair value adjustments being recognised on an ongoing basis in the income statement.
2.3 HEDGING AND FORWARD EXCHANGE CONTRACTS – CONTINUED
SECTION 2 FOREIGN CURRENCIES AND HEDGING

72 WILLIAM DEMANT ANNUAL REPORT 2017
§ ACCOUNTING POLICIESOn initial recognition, transactions in foreign currencies are translated at the exchange rates prevailing at the date of the transaction. The functional currencies of the enterprises are determined by the economic environment in which they ope-rate, normally the local currency.
Receivables, payables and other monetary items in foreign currencies are translated into Danish kroner at the exchange rates prevailing at the balance sheet date. Realised and unrealised foreign currency translation adjustments are recognised in the income statement under gross profit or net financial items, depending on the purpose of the underlying transaction.
Property, plant and equipment, intangible assets, inventories and other non-monetary assets purchased in foreign curren-cies and measured on the basis of historical cost are translated at the exchange rates prevailing at the transaction date. Non-monetary items, which are revalued at their fair values, are translated using the exchange rates at the revaluation date. On recognition in the consolidated financial statements of enterprises presenting their financial statements in a functional currency other than Danish kroner, the income statement is translated using average exchange rates for the months of the year in question, unless they deviate materially from actual exchange rates at the transaction dates. In case of the latter, actual exchange rates are applied.
Balance sheet items are translated at the exchange rates prevailing at the balance sheet date. Goodwill is considered as belonging to the acquired enterprise in question and is translated at the exchange rate prevailing at the balance sheet date.
All foreign currency translation adjustments are recognised in the income statement, with the exception of the following, which are recognised in other comprehensive income:
The translation of net assets of foreign subsidiaries using exchange rates prevailing at the balance sheet date The translation of income statements of foreign subsidiaries using monthly average exchange rates for the respective
months of the year, whereas their balance sheet items are translated using exchange rates prevailing at the balance sheet date
The translation of non-current, intra-Group receivables that are considered to be an addition to or deduction from net investments in foreign subsidiaries
The translation of investments in associates and joint ventures
SECTION 2 FOREIGN CURRENCIES AND HEDGING
2.4 EXCHANGE RATES – CONTINUED

KAPITELWILLIAM DEMANT ANNUAL REPORT 2017 73
SECTION 3 ASSETS BASE
1,718 million DKK
Property, plant and equipment
2,272 million DKK
Other non-current assets

74 WILLIAM DEMANT ANNUAL REPORT 2017SECTION 3 ASSETS BASE
152 -1
116 0 0 0
-161 106
------
106
141 0 2 0 0
-3 1
141
-90 0
-14 0 3
-101
40
429 -14
8 27
0 -5
160 605
-140 7
-70 0 5
-198
407
6,276 -374
0 437
0 0 0
6,339
- - - - - -
6,339
20 0
11341
00
-22 152
- - - --
-
152
3.1 INTANGIBLE ASSETS Patents and
licencesOther
intangible assets
Total intangible
assets
100 0
350006
141
-78 0
-12 00
-90
51
367 6 9
52-14
-716
429
-92 -4
-4712
-140
289
5,660 68
0 560 -12
00
6,276
- - - ---
6,276
Goodwill
6,998 -389 126 464
- -8 -
7,191
-230 7
-84 0 8
-299
6,892
6,147 74
157 653 -26
-70
6,998
-170 -4
-59 12
-230
6,768
Prepayments and assets
under development
(DKK million)
Cost at 1.1.2017Foreign currency translation adjustmentsAdditions during the year Additions relating to acquisitionsDisposals relating to divestmentsDisposals during the yearTransferred to/from other itemsCost at 31.12.2017
Amortisation at 1.1.2017Foreign currency translation adjustmentsAmortisation for the yearDisposals relating to divestmentsDisposals during the yearAmortisation at 31.12.2017
Carrying amount at 31.12.2017 BS
Cost at 1.1.2016Foreign currency translation adjustmentsAdditions during the yearAdditions relating to acquisitionsDisposals relating to divestments Disposals during the yearTransferred to/from other itemsCost at 31.12.2016
Amortisation at 1.1.2016Foreign currency translation adjustmentsAmortisation for the yearDisposals relating to divestmentsDisposals during the yearAmortisation at 31.12.2016
Carrying amount at 31.12.2016 BS
WILLIAM DEMANT ANNUAL REPORT 2017 75SECTION 3 ASSETS BASE
§ ACCOUNTING POLICIESOn initial recognition, goodwill is recognised and measured as the difference between the acquisition cost – including the value of minority interests in the acquired enterprise and the fair value of any existing investment in the acquired enterprise – and the fair value of the acquired assets, liabilities and contingent liabilities. Please refer to Accounting policies in Note 6.1.
On recognition, goodwill is allocated to corporate activities that generate independent payments (cash-generating units). The definition of a cash-generating unit is in line with the Group’s managerial structure as well as the internal financial management reporting.
Goodwill is not amortised, but is tested for impairment at least once a year. If the recoverable amount of a cash-generating unit is lower than the carrying amounts of property, plant and equipment and intangible assets, including goodwill, attribut-able to the particular cash-generating unit, the particular assets will be written down.
Patents and licences acquired from third parties are measured at cost less accumulated amortisation and impairment losses.
Patents and licences are amortised over their estimated useful lives, however maximum 20 years.
Other intangible assets, including intangible assets acquired in connection with a business combination, are measured at cost less accumulated amortisation and impairment losses. Other intangible assets are amortised on a straight-line basis over their estimated useful lives of 3-5 years, except certain assets that are amortised over a period of up to ten years.
ACCOUNTING ESTIMATES AND ASSUMPTIONSImpairment testing is carried out annually on preparation of the annual report or on indication of impairment in which discounted values of future cash flows are compared with carrying amounts. Group enterprises cooperate closely on R&D, purchasing, production, marketing and sale, as the use of resources in the individual markets is coordinated and monitored by Management in Denmark. Group enterprises are thus highly integrated. Consequently, Management considers the over-all business as one cash-generating unit. Any business activity, which largely acts with autonomy in relation to the Group and whose profitability can be measured independently of the other activities, constitutes a separate cash-generating unit. In relation to the existing integration in the Group and the recognised goodwill, neither as of 31 December 2017 nor as of 31 December 2016, had any separate cash-generating units been identified to which goodwill could be allocated. The an-nual impairment test was thus based on the Group as a whole.
It is Management’s opinion that the product development undertaken by the Group today cannot meaningfully be allocated to either the development of new products or the further development of existing products. Moreover, as the products are subject to approval by various authorities, it is difficult to determine the final completion of new products.
3.1 INTANGIBLE ASSETS – CONTINUED

76 WILLIAM DEMANT ANNUAL REPORT 2017
4,054 -61
283 21
0 -193
0 4,104
-2,312 34
-289 0 0
181
-2,386
1,718
0
3.2 PROPERTY, PLANT AND EQUIPMENTLand and buildings
Plant and machinery
Other plant, fixtures and
operating equipment
Leasehold improvements
Prepayments and assets
underconstruction
Total property, plant and equipment
Cost at 1.1.2016Foreign currency translation adjustmentsAdditions during the yearAdditions relating to acquisitionsDisposals relating to divestmentsDisposals during the yearTransferred to/from other itemsCost at 31.12.2016
Depreciation and impairment losses at 1.1.2016Foreign currency translation adjustmentsDepreciation for the yearImpairment losses for the yearDisposals relating to divestmentsDisposals during the yearDepreciation and impairment losses at 31.12.2016
Carrying amount at 31.12.2016 BS
Of which finance leased assets
1,157 -20 36
0 0
-41 7
1,139
-279 5
-33 0 0
39
-268
871
0
950 -6
15 0 0
-74 30
915
-730 8
-54 0 0
71
-705
210
0
1,255 -40 90 15
0 -68 46
1,298
-965 31
-137 0 0
62
-1,009
289
0
601 5
56 6 0
-10 11
669
-338 -10 -65
0 0 9
-404
265
0
91 0
86 0 0 0
-94 83
- - - - - -
-
83
0
3,864 -1
296 23 -7
-121 0
4,054
-2,096 -6
-296 -23
5 104
-2,312
1,742
29
1,131 -2 5
-1 0 0
24 1,157
-231 0
-25 -23
0 0
-279
878
29
859 3
20 0 0
-16 84
950
-676 -3
-66 0 0
15
-730
220
0
1,179 4
84 13 -2
-74 51
1,255
-894 -5
-132 0
1 65
-965
290
0
541 -4
75 11
-5 -27 10
601
-295 2
-73 0 4
24
-338
263
0
154 -2
112 0 0
-4 -169
91
- - - - - -
-
91
0
(DKK million)
Cost at 1.1.2017Foreign currency translation adjustmentsAdditions during the yearAdditions relating to acquisitionsDisposals relating to divestmentsDisposals during the yearTransferred to/from other itemsCost at 31.12.2017
Depreciation and impairment losses at 1.1.2017Foreign currency translation adjustmentsDepreciation for the yearImpairment losses for the yearDisposals relating to divestmentsDisposals during the yearDepreciation and impairment losses at 31.12.2017
Carrying amount at 31.12.2017 BS
Of which finance leased assets
SECTION 3 ASSETS BASE
WILLIAM DEMANT ANNUAL REPORT 2017 77
As of 31 December 2017, the Group had no finance leased assets. As of 31 December 2016, our finance leased assets were mainly properties acquirable at favourable prices on expiry of the term of such leases.
In 2017, the Group recognised impairment losses of DKK 0 million (DKK 23 million in 2016).
§ ACCOUNTING POLICIESProperty, plant and equipment are recognised at cost less accumulated depreciation and impairment losses. Cost is defined as the acquisition price and costs directly relating to the acquisition until such time as the particular asset is ready for use. For assets produced by the Group, cost includes all costs directly attributable to the production of such assets, including materials, components, sub-supplies and payroll. In respect of finance leased assets, cost is calculated as the fair value or the present value of future lease payments, whichever is lower.
Interest expenses on loans for financing of the construction of property, plant and equipment are recognised in the cost of the assets if such expenses pertain to the manufacturing period. Other borrowing costs are recognised in the income statement.
If the acquisition or the use of an asset requires the Group to defray costs for the demolition or restoration of such asset, the calculated costs hereof are recognised as a provision and as part of the cost of the particular asset, respectively.
The cost of a total asset is divided into various elements, which will be depreciated separately if their useful lives are not the same.
The depreciation basis is cost less the estimated residual value of an asset after the end of its useful life. The residual value is the estimated amount, which could after deduction of costs to sell be obtained through the sale of the asset today, such asset already having the age and being in the state of repair expected after the end of its useful life. The residual value is determined at the time of acquisition and is reviewed annually. If the residual value exceeds the carry- ing amount, depreciation will be discontinued.
Property, plant and equipment are depreciated on a straight-line basis over their estimated useful lives. Land is not depreciated.
Buildings 33-50 yearsTechnical installations 10 yearsPlant and machinery 3-5 yearsOther plant, fixtures and operating equipment 3-5 yearsIT hardware and software 3 yearsLeasehold improvements over the lease period
Depreciation methods, useful lives and residual values are reviewed annually. Property, plant and equipment are written down to their recoverable amounts, if these are lower than their carrying amounts.
3.2 PROPERTY, PLANT AND EQUIPMENT – CONTINUED
SECTION 3 ASSETS BASE

78 WILLIAM DEMANT ANNUAL REPORT 2017
664-53
2361
-302546
-12513
- - 0
22-90
456
3.3 OTHER NON-CURRENT ASSETSOther
receivables
Cost at 1.1.2016Foreign currency translation adjustmentsAdditions during the yearAdditions relating to acquisitionsDisposals, repayments etc. during the yearCost at 31.12.2016
Value adjustments at 1.1.2016Foreign currency translation adjustmentsShare of profit after tax IS
Dividends receivedDisposals during the yearOther adjustmentsValue adjustments at 31.12.2016
Carrying amount at 31.12.2016 BS
Please refer to Subsidiaries, associates and joint ventures on page 128 for a list of associates and joint ventures. The ownership interest equals the share of voting rights. Please refer to Note 6.3 for further details.
Investmentsin associates
and joint ventures
Receivables from
associates and joint ventures
Otherinvestments
383-33
1570
-7500
00 - - 00 -
500
16040
-119
-80 - - 00
-8
11
609-29
37500
955
-265
53-54
00
-22
933
68524
1690
-214664
-118-3 - - 2
-6-125
539
3577
550
-36383
00 - - 000
383
20000
-416
-80 - - 00
-8
8
5935
300
-19609
-68-1
55-91
-4-26
583
(DKK million)
Cost at 1.1.2017Foreign currency translation adjustmentsAdditions during the yearAdditions relating to acquisitionsDisposals, repayments etc. during the yearCost at 31.12.2017
Value adjustments at 1.1.2017Foreign currency translation adjustmentsShare of profit after tax IS
Dividends receivedDisposals during the yearOther adjustmentsValue adjustments at 31.12.2017
Carrying amount at 31.12.2017 BS
SECTION 3 ASSETS BASE

WILLIAM DEMANT ANNUAL REPORT 2017 79
Non-current assets are broken down by their geographical domicile. Please refer to Note 1.1 for further information on segments.
2017
1,3074,2114,653
534127
5010,882
2016
1,4363,9354,360
506137
4510,419
3.4 NON-CURRENT ASSETS BY GEOGRAPHIC REGION
(DKK million)
Non-current assets by geographic region:DenmarkOther EuropeNorth AmericaOceaniaAsiaOther countriesTotal BS
SECTION 3 ASSETS BASE

80 WILLIAM DEMANT ANNUAL REPORT 2017
3.5 IMPAIRMENT TESTING
Impairment testing is carried out for the Group’s one cash-generating unit. Based on the impairment test, a material ex-cess value was identified compared to the carrying amount for which reason no impairment of goodwill was made as of 31 December 2017 and 31 December 2016. Future cash flows are based on the budget for 2018, on strategy plans and on projections hereof. Projections extending beyond 2018 are based on general parameters, such as expected market growth, selling prices and profitability assumptions. The terminal value for the period after 2018 is determined on the assumption of 2% growth (2% in 2016). The pre-tax discount rate is 7.5% (7.5% in 2016). Sensitivity calculations show that even a significant increase in the discount rate or a significant reduction of the growth assumptions will not change the outcome of the impairment test. Apart from goodwill, all intangible assets have limited useful lives.
The market capitalisation of the Company on Nasdaq Copenhagen by far exceeds the equity value of the Company, which further supports the conclusion that there was no need for impairment in 2017 and 2016.
§ ACCOUNTING POLICIESThe carrying amounts of property, plant and equipment and intangible assets with definite useful lives as well as invest-ments in associates and joint ventures are reviewed at the balance sheet date to determine whether there are indications of impairment. If so, the recoverable amount of the particular asset is calculated to determine the need for impairment, if any. The recoverable amounts of goodwill and other intangible assets with indefinite useful lives will be estimated, whether or not there are indications of impairment.
The recoverable amount is estimated for the smallest cash-generating unit of which the asset is part. The recoverable amount is determined as the higher of the fair value of the asset or cash-generating unit less costs to sell and the value in use of such asset or unit. On determination of the value in use, estimated future cash flows will be discounted to their present values using a discount rate that reflects partly current market valuations of the time value of money, and partly the special risks attached to the particular asset or cash-generating unit for which no adjustment has been made in the estimated future cash flows. If the recoverable amount of a particular asset or cash-generating unit is lower than its car-rying amount, such asset or unit is written down to its recoverable amount.
Impairment losses are recognised in the income statement. On any subsequent reversal of impairment losses due to changes in the assumptions on which the calculation of the recoverable amount is based, the carrying amount of an asset or cash-generating unit is increased to the adjusted estimate of the recoverable amount, however not exceeding the carrying amount of the asset or cash-generating unit, had the particular asset or cash-generating unit not been written down. Impairment of goodwill is not reversed.
SECTION 3 ASSETS BASE

KAPITELWILLIAM DEMANT ANNUAL REPORT 2017 81
SECTION 4 CAPITAL STRUCTURE AND FINANCIAL MANAGEMENT
4,030 million DKK
Net interest-bearing debt
1.5 NIBD/EBITDA
Gearing multiple
-111 million DKK
Net financial items

82 WILLIAM DEMANT ANNUAL REPORT 2017SECTION 4 CAPITAL STRUCTURE AND FINANCIAL MANAGEMENT
4.1 FINANCIAL RISK MANAGEMENT AND CAPITAL STRUCTURE
Policies relating to financial risk management and capital structureFinancial risk management concentrates on identifying risks in respect of exchange rates, interest rates, credit and liquiditywith a view to protecting the Group against potential losses and ensuring that Management’s forecasts for the current yearare only to a limited extent affected by changes or events in the surrounding world – be they changes in exchange rates orin interest rates. It is Group policy to exclusively hedge commercial risks and not to undertake any financial transactionsof a speculative nature.
Interest rate risksIn previous years, we only hedged interest rate risks on Group loans to a limited extent, as the Group only had limiteddebt compared to its volume of activities. Because of the Group’s high level of cash generation and relatively low finan-cial gearing, the majority of our loans are raised on floating terms and predominantly as short-term commitments, result-ing in a low level of interest expenses. In order to secure attractive interest rates for the Group on the long term and as a consequence of our attractive funding possibilities in the financial market, more than half of the Group’s debt is funded through medium-term committed facilities with fixed rates and through financial instruments, which limits the interest rate risk. However, because of the Group’s high level of cash generation and relatively low financial gearing, part of our loans are raised on floating terms and predominantly as short-term commitments. All in all, the Group’s interest expenses are very low with a manageable interest rate risk. The Group’s net interest-bearing debt (NIBD) amounted to DKK 4,030 million as of 31 December 2017, corresponding to a gearing ratio of 1.5 (NIBD/EBITDA).
Credit risksThe Group’s credit risks relate primarily to trade receivables and loans to customers or business partners. Our customer base is fragmented, so credit risks in general only involve minor losses on individual customers. Together, our ten largest custom-ers account for less than 12% of total consolidated revenue. Furthermore, when granting loans, we require that our counter-parts provide security in their business. Overall, we therefore estimate that no major credit exposure exists on Group level.
The maximum credit risk relating to receivables matches the carrying amounts of such receivables. The Group has no majordeposits with financial institutions for which reason the credit risk of such deposits is considered to be low.
Liquidity risksThe Group aims to have sufficient cash resources to be able to take appropriate steps in case of unforeseen fluctuations incash outflows. We have access to considerable undrawn credit facilities, and the liquidity risk is therefore considered to be low. We are of the opinion that the Group has strong cash flows and a satisfactory credit rating to secure the current inflow of working capital and funds for potential acquisitions. Neither in previous years nor in the financial year 2017 has the Group defaulted on loan agreements.
Exchange rate risksPlease refer to the Group’s Exchange rate risk policy in Note 2.1.

WILLIAM DEMANT ANNUAL REPORT 2017 83SECTION 4 CAPITAL STRUCTURE AND FINANCIAL MANAGEMENT
2017
4 39
6 49
49
-69 -69
-3 -88
-160
-111
4.2 NET FINANCIAL ITEMS
§ ACCOUNTING POLICIESNet financial items mainly consist of interest income and interest expenses, credit card fees and bank fees and also in-clude interest on finance leases, unwinding of discounts on financial assets and liabilities, fair value adjustments of “shadow shares” under share-based remuneration programmes as well as certain realised and unrealised foreign ex-change gains and losses. Interest income and interest expenses are accrued based on the principal amount and the effective interest rate.
The effective interest rate is the discount rate used for discounting expected future payments attaching to the financial asset or financial liability in order for the present value to match the carrying amount of such asset or liability.
(DKK million)
Interest on cash and bank depositsInterest on receivables, customer loans etc.Other financial incomeFinancial income from financial assets not measured at fair value in the income statement
Financial income IS
Interest on bank debt, mortgages etc.Financial expenses on financial liabilities not measured at fair value in the income statement
Foreign exchange losses, netTransaction costsFinancial expenses IS
Net financial items
2016
4 36
2 42
42
-59 -59
-6 -78
-143
-101
In addition to the foreign exchange items above, the consolidated income statement is also affected by foreign exchange hedging instruments as described in Note 2.3 as well as by foreign exchange effects of balance sheet items affecting pro-duction costs with a loss of DKK 93 million in 2017 (a gain of DKK 33 million in 2016).
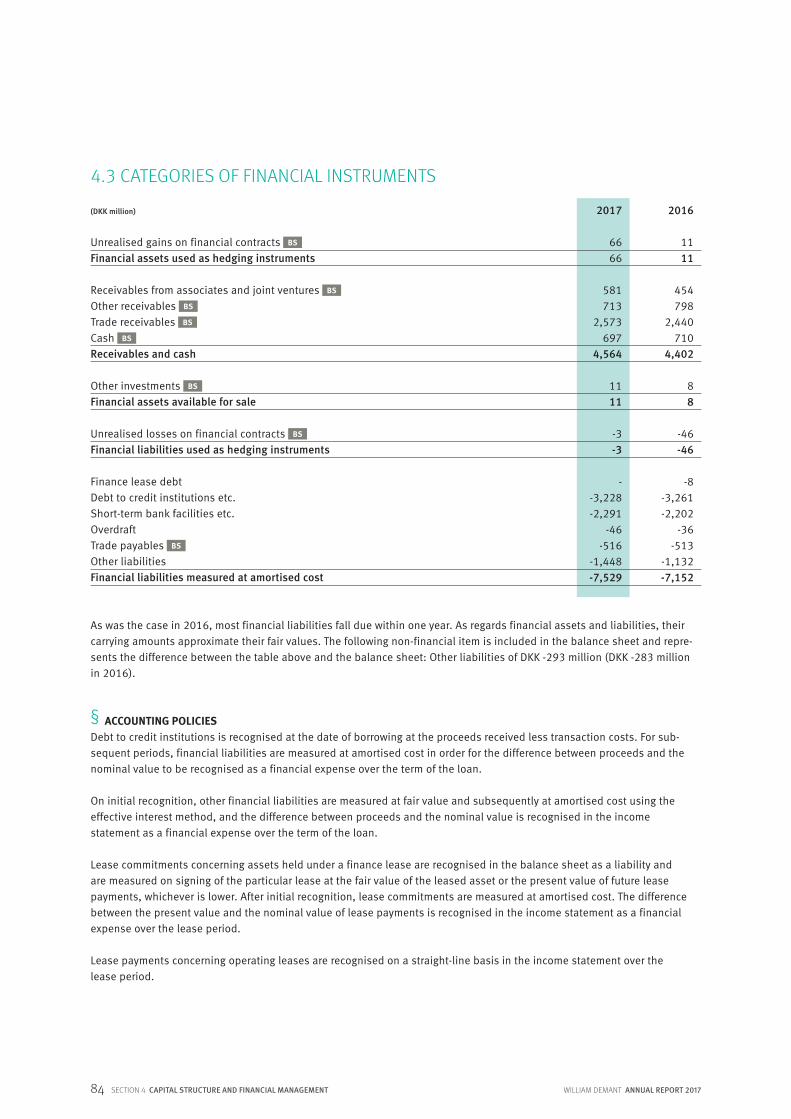
84 WILLIAM DEMANT ANNUAL REPORT 2017
2017
66 66
581 713
2,573 697
4,564
11 11
-3 -3
- -3,228 -2,291
-46 -516
-1,448 -7,529
(DKK million)
Unrealised gains on financial contracts BS
Financial assets used as hedging instruments
Receivables from associates and joint ventures BS
Other receivables BS
Trade receivables BS
Cash BS
Receivables and cash
Other investments BS
Financial assets available for sale
Unrealised losses on financial contracts BS
Financial liabilities used as hedging instruments
Finance lease debtDebt to credit institutions etc.Short-term bank facilities etc.Overdraft Trade payables BS
Other liabilitiesFinancial liabilities measured at amortised cost
As was the case in 2016, most financial liabilities fall due within one year. As regards financial assets and liabilities, their carrying amounts approximate their fair values. The following non-financial item is included in the balance sheet and repre-sents the difference between the table above and the balance sheet: Other liabilities of DKK -293 million (DKK -283 million in 2016).
2016
11 11
454 798
2,440 710
4,402
8 8
-46 -46
-8 -3,261 -2,202
-36 -513
-1,132 -7,152
4.3 CATEGORIES OF FINANCIAL INSTRUMENTS
§ ACCOUNTING POLICIESDebt to credit institutions is recognised at the date of borrowing at the proceeds received less transaction costs. For sub-sequent periods, financial liabilities are measured at amortised cost in order for the difference between proceeds and the nominal value to be recognised as a financial expense over the term of the loan.
On initial recognition, other financial liabilities are measured at fair value and subsequently at amortised cost using the effective interest method, and the difference between proceeds and the nominal value is recognised in the income statement as a financial expense over the term of the loan.
Lease commitments concerning assets held under a finance lease are recognised in the balance sheet as a liability and are measured on signing of the particular lease at the fair value of the leased asset or the present value of future lease payments, whichever is lower. After initial recognition, lease commitments are measured at amortised cost. The difference between the present value and the nominal value of lease payments is recognised in the income statement as a financial expense over the lease period.
Lease payments concerning operating leases are recognised on a straight-line basis in the income statement over the lease period.
SECTION 4 CAPITAL STRUCTURE AND FINANCIAL MANAGEMENT
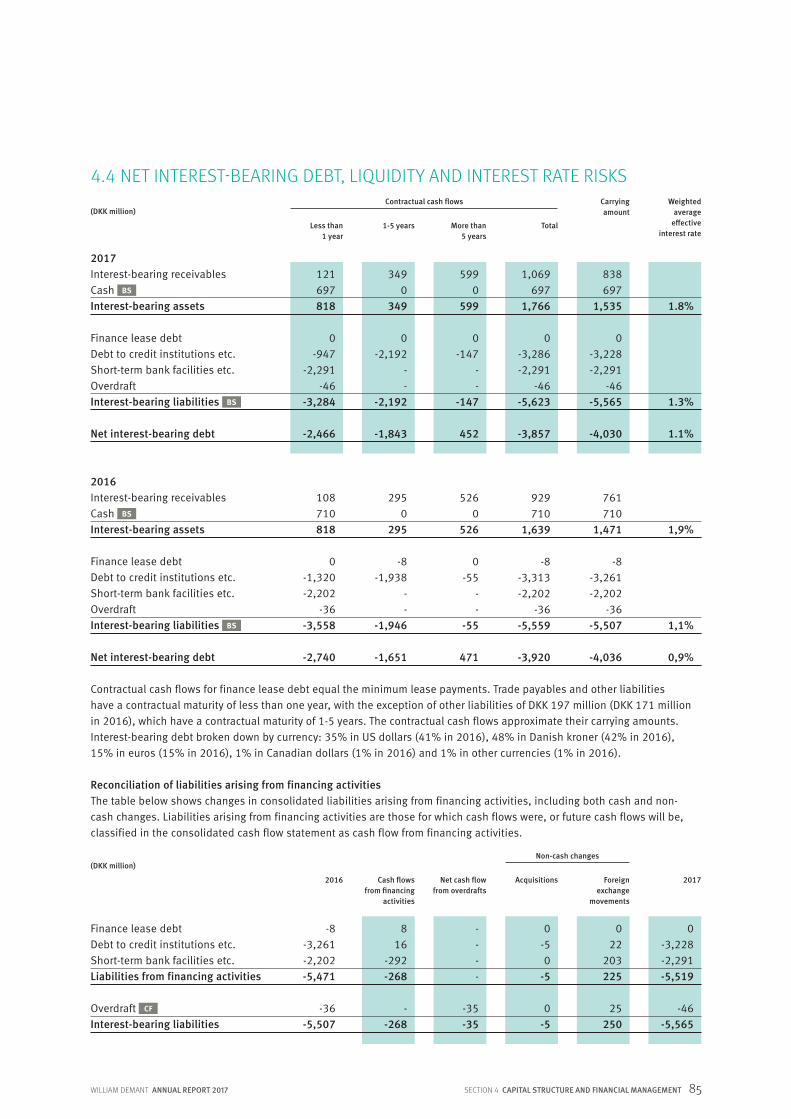
WILLIAM DEMANT ANNUAL REPORT 2017 85
121697818
0-947
-2,291-46
-3,284
-2,466
3490
349
0-2,192
--
-2,192
-1,843
5990
599
0-147
--
-147
452
838697
1,535
0-3,228-2,291
-46-5,565
-4,030
1.8%
1.3%
1.1%
Less than 1 year
1-5 years More than 5 years
Total
Weightedaverage
effectiveinterest rate
Contractual cash flows for finance lease debt equal the minimum lease payments. Trade payables and other liabilities have a contractual maturity of less than one year, with the exception of other liabilities of DKK 197 million (DKK 171 million in 2016), which have a contractual maturity of 1-5 years. The contractual cash flows approximate their carrying amounts. Interest-bearing debt broken down by currency: 35% in US dollars (41% in 2016), 48% in Danish kroner (42% in 2016), 15% in euros (15% in 2016), 1% in Canadian dollars (1% in 2016) and 1% in other currencies (1% in 2016).
Reconciliation of liabilities arising from financing activitiesThe table below shows changes in consolidated liabilities arising from financing activities, including both cash and non- cash changes. Liabilities arising from financing activities are those for which cash flows were, or future cash flows will be, classified in the consolidated cash flow statement as cash flow from financing activities.
Contractual cash flows Carrying amount
1,069697
1,766
0-3,286-2,291
-46-5,623
-3,857
4.4 NET INTEREST-BEARING DEBT, LIQUIDITY AND INTEREST RATE RISKS
108710818
0-1,320-2,202
-36-3,558
-2,740
2950
295
-8-1,938
--
-1,946
-1,651
5260
526
0-55
--
-55
471
761710
1,471
-8-3,261-2,202
-36-5,507
-4,036
1,9%
1,1%
0,9%
929710
1,639
-8-3,313-2,202
-36-5,559
-3,920
(DKK million)
2017Interest-bearing receivablesCash BS
Interest-bearing assets
Finance lease debtDebt to credit institutions etc.Short-term bank facilities etc.Overdraft Interest-bearing liabilities BS
Net interest-bearing debt
2016Interest-bearing receivablesCash BS
Interest-bearing assets
Finance lease debtDebt to credit institutions etc.Short-term bank facilities etc.Overdraft Interest-bearing liabilities BS
Net interest-bearing debt
-8-3,261-2,202-5,471
-36-5,507
816
-292-268
--268
----
-35-35
022
203225
25250
0-3,228-2,291-5,519
-46-5,565
2016 Cash flows from financing
activities
Net cash flow from overdrafts
Acquisitions 2017
Non-cash changes
Foreign exchange
movements
0-50
-5
0-5
(DKK million)
Finance lease debtDebt to credit institutions etc.Short-term bank facilities etc.Liabilities from financing activities
Overdraft CF
Interest-bearing liabilities
SECTION 4 CAPITAL STRUCTURE AND FINANCIAL MANAGEMENT
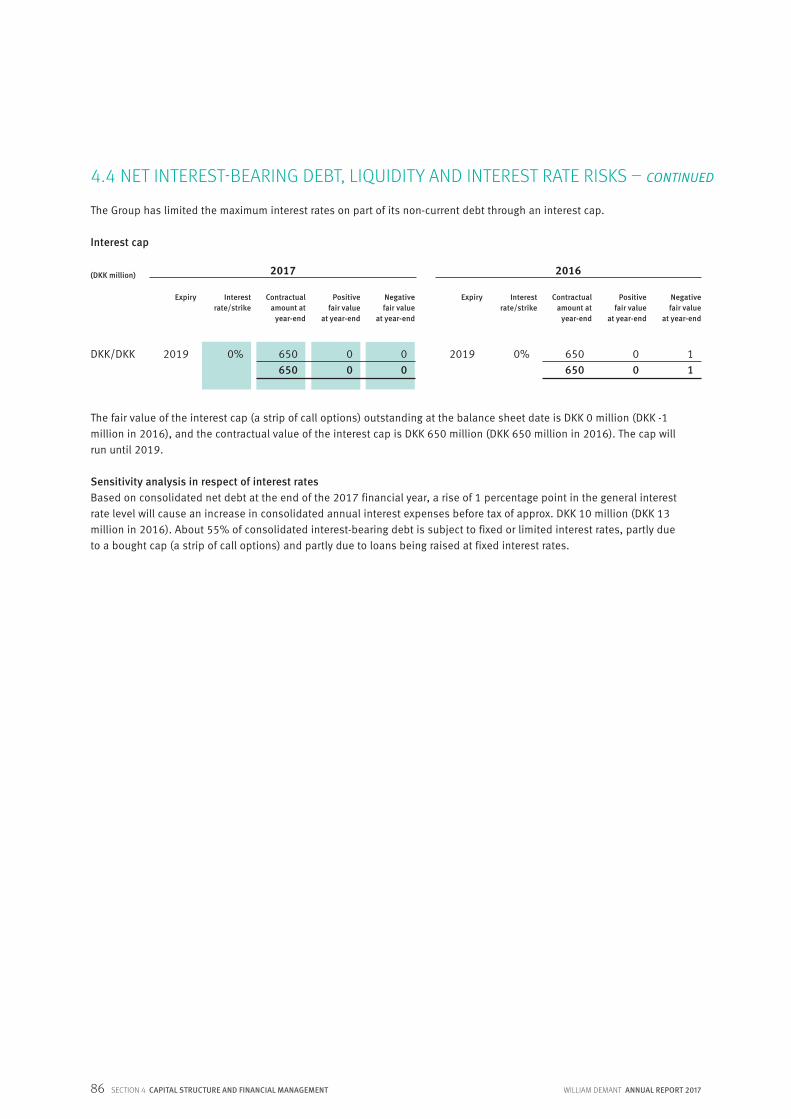
86 WILLIAM DEMANT ANNUAL REPORT 2017
650650
DKK/DKK 2019
The Group has limited the maximum interest rates on part of its non-current debt through an interest cap.
Interest cap
(DKK million)
Interest rate/strike
Interest rate/strike
Positive fair value
at year-end
Positive fair value
at year-end
Negative fair value
at year-end
Negative fair value
at year-end
ExpiryExpiry Contractual amount at
year-end
Contractual amount at
year-end
00
0% 00
4.4 NET INTEREST-BEARING DEBT, LIQUIDITY AND INTEREST RATE RISKS – CONTINUED
650650
2019 11
0% 00
The fair value of the interest cap (a strip of call options) outstanding at the balance sheet date is DKK 0 million (DKK -1 million in 2016), and the contractual value of the interest cap is DKK 650 million (DKK 650 million in 2016). The cap will run until 2019.
Sensitivity analysis in respect of interest ratesBased on consolidated net debt at the end of the 2017 financial year, a rise of 1 percentage point in the general interest rate level will cause an increase in consolidated annual interest expenses before tax of approx. DKK 10 million (DKK 13 million in 2016). About 55% of consolidated interest-bearing debt is subject to fixed or limited interest rates, partly due to a bought cap (a strip of call options) and partly due to loans being raised at fixed interest rates.
SECTION 4 CAPITAL STRUCTURE AND FINANCIAL MANAGEMENT
2017 2016
WILLIAM DEMANT ANNUAL REPORT 2017 87
4.5 FAIR VALUE HIERARCHY
Methods and assumptions for calculation of fair valuesOther investmentsOther investments are assessed on the basis of their equity value.
DerivativesForward exchange contracts are assessed using discounted cash flow valuation techniques. Future cash flows are based on forward exchange rates from observable forward exchange rates at the end of the reporting period and on contractual forward exchange rates discounted at a rate that reflects the credit risk related to various counterparties.
Interest swaps are assessed using discounted cash flow valuation techniques. Future cash flows are based on observable forward yield curves at the end of the reporting period and on contractual interest rates discounted at a rate that reflects the credit risk related to various counterparties.
The value of a cap is assessed using discounted cash flow valuation techniques. A cap consists of a series of interest rate options (IRGs) with the same strike rate. The individual interest rate options each cover an interest period. On pricing inte-rest rate options, the key elements are the strike rate, the forward rate, maturity and volatility. The value of an interest rate option is made up of the intrinsic value and the time value of such option. The value of a cap is the combined value of the individual IRGs.
Contingent considerationsContingent considerations are measured at fair value based on the contractual terms of the contingent considerations and on non-observable inputs (level 3), such as the financial performance and purchasing patterns of the acquired enterprises for a period of typically 1-5 years after the date of acquisition.
Fair value hierarchy for assets and liabilities measured at fair value in the balance sheetFinancial instruments measured at fair value are broken down according to the fair value hierarchy: – Listed prices in an active market for the same type of instrument (level 1) – Listed prices in an active market for similar assets or liabilities or other valuation methods, with all significant inputs
being based on observable market data (level 2)– Valuation methods, with any significant inputs not being based on observable market data (level 3)
SECTION 4 CAPITAL STRUCTURE AND FINANCIAL MANAGEMENT

88 WILLIAM DEMANT ANNUAL REPORT 2017
(DKK million)
Financial assets used as hedging instruments
Other investments (assets available for sale)
Financial liabilities used as hedging instruments
Contingent considerations
Level 2 Level 3Level 1 Total Level 2 Level 3Level 1 Total
There have been no transfers between level 1 and 2 in the 2017 and 2016 financial years.
Financial instruments measured at fair value in the balance sheet based on valuation methods, with any significant inputs not being based on observable market data (level 3):
11
0
-46
0
0
8
0
-183
11
8
-46
-183
0
0
0
0
0
11
0
-365
66
11
-3
-365
0
0
0
0
66
0
-3
0
2017
8040
-100
11
2016
12000
-4008
4.5 FAIR VALUE HIERARCHY – CONTINUED
§ ACCOUNTING POLICIESOn initial recognition, other investments are classified as assets available for sale, recognised at fair value and subsequently measured at fair value. Unrealised value adjustments are recognised in other comprehensive income. On realisation, value adjustments are transferred to net financial items in the income statement. The determination of fair values is based on equity values.
Contingent considerations arising from the acquisition of enterprises and activities are recognised at fair value at the time of acquisition. The obligations are re-evaluated on a recurring basis at fair value.
2017
-18342
-122-180
7350
-365
2016
-109-6
-1180
4370
-183
Contingent considerations
Financial assets available for saleLevel 3 assets and liabilities
(DKK million)
Carrying amount at 1.1.Foreign currency translation adjustmentAcquisitionsInvestments in associatesDisposals, repayments, settlements etc.Other adjustmentsTransferred to/from level 3Carrying amount at 31.12.
Of adjustments to contingent considerations, DKK 0 million (DKK 0 million in 2016) is recognised as income in distribution costs relating to contingent considerations still held at year-end.
SECTION 4 CAPITAL STRUCTURE AND FINANCIAL MANAGEMENT
2017 2016

KAPITELWILLIAM DEMANT ANNUAL REPORT 2017 89
SECTION 5 TAX
222 million DKK
Corporate tax paid in Denmark
21.0%Effective tax rate

90 WILLIAM DEMANT ANNUAL REPORT 2017SECTION 5 TAX
2017
-455-2
-653816
-468
22.0%1.9%
-0.7%-0.8%-0.1%-1.3%
21.0%
5.1 TAX ON PROFIT
§ ACCOUNTING POLICIESTax on the year’s profit includes current tax and any changes in deferred tax. Current tax includes taxes payable determined on the basis of the estimated taxable income for the year and any prior-year tax adjustments. Tax on changes in equity and other comprehensive income is recognised directly in equity and in other comprehensive income, respectively. Foreign cur- rency translation adjustments of deferred tax are recognised as part of the year’s adjustments of deferred tax.
Current tax liabilities or tax receivables are recognised in the balance sheet and determined as tax calculated on the year’s taxable income adjusted for any tax on account. The tax rates prevailing at the balance sheet date are used for calculation of the year’s taxable income.
(DKK million)
Tax on profit for the year:Current tax on profit for the yearAdjustment of current tax, prior yearsChange in deferred taxAdjustment of deferred tax, prior yearsImpact of changes in corporate tax ratesTax on profit for the year IS
Reconciliation of tax rates:Danish corporate tax rateDifferences between tax rates of non-Danish enterprises and Danish corporate tax rateImpact of changes in corporate tax ratesUse of tax assets not previously recognisedPermanent differencesOther items, including prior-year adjustmentsEffective tax rate
2016
-38117
2-14
-1-377
22.0%1.6%0.0%
-0.9%-0.2%-2.0%
20.5%
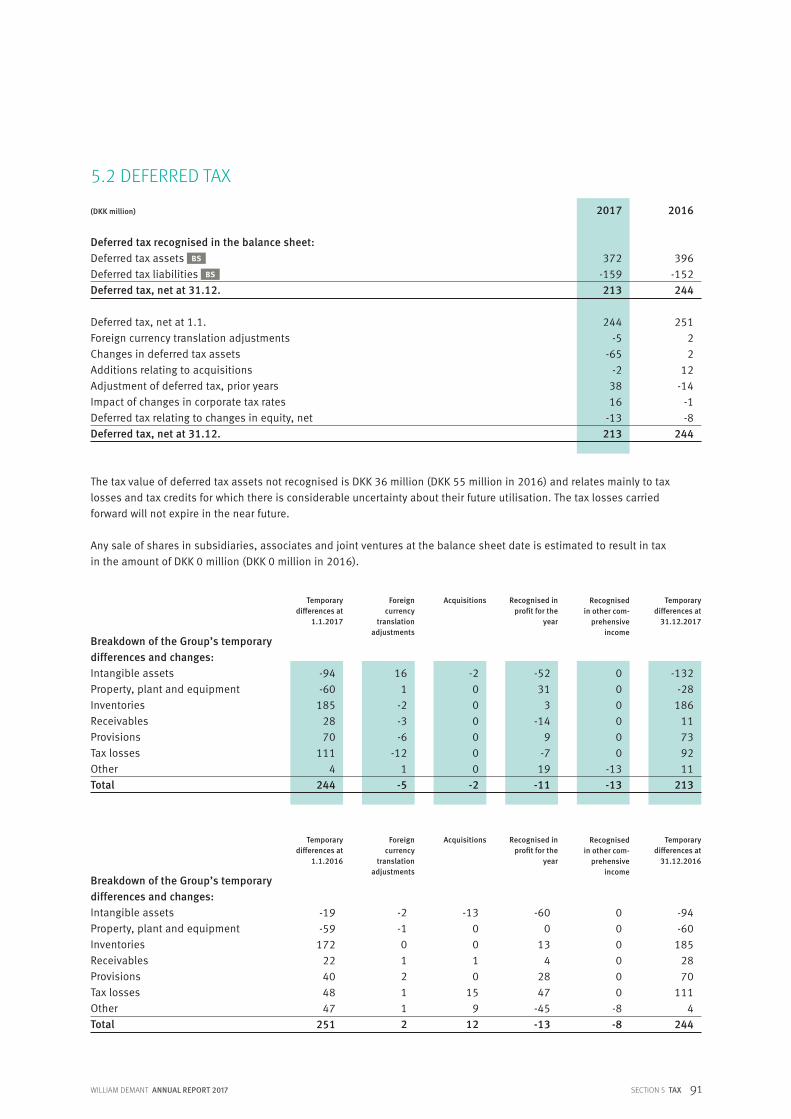
WILLIAM DEMANT ANNUAL REPORT 2017 91SECTION 5 TAX
The tax value of deferred tax assets not recognised is DKK 36 million (DKK 55 million in 2016) and relates mainly to tax losses and tax credits for which there is considerable uncertainty about their future utilisation. The tax losses carried forward will not expire in the near future.
Any sale of shares in subsidiaries, associates and joint ventures at the balance sheet date is estimated to result in tax in the amount of DKK 0 million (DKK 0 million in 2016).
2017
372-159213
244-5
-65-2
3816
-13213
2016
396-152244
25122
12-14
-1-8
244
Breakdown of the Group’s temporary differences and changes:
Recognised in other com-
prehensive income
Foreign currency
translation adjustments
Acquisitions Recognised in profit for the
year
Temporary differences at
31.12.2017
Temporary differences at
1.1.2017
161
-2-3-6
-121
-5
-2000000
-2
-5231
3-14
9-7
19-11
000000
-13-13
-132-28
18611739211
213
-94-60
1852870
1114
244
5.2 DEFERRED TAX
(DKK million)
Deferred tax recognised in the balance sheet:Deferred tax assets BS
Deferred tax liabilities BS
Deferred tax, net at 31.12.
Deferred tax, net at 1.1.Foreign currency translation adjustments Changes in deferred tax assetsAdditions relating to acquisitionsAdjustment of deferred tax, prior yearsImpact of changes in corporate tax ratesDeferred tax relating to changes in equity, netDeferred tax, net at 31.12.
Intangible assetsProperty, plant and equipmentInventoriesReceivablesProvisionsTax lossesOtherTotal
Breakdown of the Group’s temporary differences and changes:
Recognised in other com-
prehensive income
Foreign currency
translation adjustments
Acquisitions Recognised in profit for the
year
Temporary differences at
31.12.2016
Temporary differences at
1.1.2016
-2-1012112
-130010
159
12
-600
134
2847
-45-13
000000
-8-8
-94-60
1852870
1114
244
-19-59
17222404847
251
Intangible assetsProperty, plant and equipmentInventoriesReceivablesProvisionsTax lossesOtherTotal

92 WILLIAM DEMANT ANNUAL REPORT 2017SECTION 5 TAX
§ ACCOUNTING POLICIESDeferred tax is recognised using the balance sheet liability method on any temporary differences between the tax base of assets and liabilities and their carrying amounts, except for deferred tax on temporary differences arisen either on initial recognition of goodwill or on initial recognition of a transaction that is not a business combination, with the temporary difference ascertained on initial recognition affecting neither net profits nor taxable income.
Deferred tax is determined on the basis of the tax rules and rates prevailing at the balance sheet date in a particular country. The effect of any changes in tax rates on deferred tax is included in tax on the year’s profit, unless such deferred tax is attributable to items previously recognised directly in equity or in other comprehensive income. In the latter case, such changes will also be recognised directly in equity or in other comprehensive income. The tax base of a loss, if any, which may be set off against future taxable income, is carried forward and set off against deferred tax in the same legal tax entity and jurisdiction.
ACCOUNTING ESTIMATES AND ASSUMPTIONS Deferred tax assets, including the tax value of any tax losses allowed for carryforward, are recognised in the balance sheet at the estimated realisable value of such assets, either by a set-off against a deferred tax liability or by a net asset to be set off against future positive taxable income. At the balance sheet date, an assessment is made as to whether it is probable that sufficient taxable income will be available in the future against which the deferred tax asset can be utilised. Deferred tax on temporary differences between the carrying amounts and the tax values of investments in subsidiaries, associates and joint ventures is recognised, unless the Parent is able to control the time of realisation of such deferred tax, and it is probable that such deferred tax will not be realised as current tax in the foreseeable future. Deferred tax is recognised in respect of eliminations of intra-Group profits and losses.
5.2 DEFERRED TAX – CONTINUED

KAPITELWILLIAM DEMANT ANNUAL REPORT 2017 93
SECTION 6 ACQUISITIONS, ASSOCIATES AND JOINT VENTURES
339 million DKK
Cash acquisition cost
53 million DKK
Share of profit after tax, associates and joint ventures

94 WILLIAM DEMANT ANNUAL REPORT 2017SECTION 6 ACQUISITIONS, ASSOCIATES AND JOINT VENTURES
2016Intangible assetsProperty, plant and equipmentOther non-current assetsInventoriesCurrent receivablesCash and bank debtNon-current liabilitiesCurrent liabilitiesAcquired net assetsGoodwillAcquisition costMinority interests’ share of acqusition cost Fair value of non-controlling interests onobtaining controlContingent considerations and deferred paymentsAcquired cash and bank debtCash acquisition cost
6.1 ACQUISITION OF ENTERPRISES AND ACTIVITIES
Fair value on acquisition
North Oceania Europe/ South Total America Asia America
00000000000
0
0000
1014
0262
-4-1713
302315
0
0-106
-2207
2100000
-21
2728
0
0-80
20
156128
12-3
-1724
108132
0
0-8
-12112
3000000037
100
-10000
932315
93919
-208-50-60
560500-11
-45-118
-19307
30802570
-1537
235272 -11
-5 -102
-7147
0000000
-1-1650
0005
601515
73412
-208-34-99
312213
0
-30-16-12
155
2721
14
1414-7
-3638
437475
0
0-122
-14339
(DKK million)
2017Intangible assetsProperty, plant and equipmentOther non-current assetsInventoriesCurrent receivablesCash and bank debtNon-current liabilitiesCurrent liabilitiesAcquired net assetsGoodwillAcquisition costMinority interests’ share of acqusition costFair value of non-controlling interests onobtaining controlContingent considerations and deferred paymentsAcquired cash and bank debtCash acquisition cost
WILLIAM DEMANT ANNUAL REPORT 2017 95SECTION 6 ACQUISITIONS, ASSOCIATES AND JOINT VENTURES
The Group’s acquisitions in 2017 primarily consist of a number of minor retail acquisitions in Europe and North America. In respect of these acquisitions, we paid acquisition cost exceeding the fair values of the acquired assets, liabilities and contin-gent liabilities. Such positive balances in value can be attributed to expected synergies between the activities of the acquired entities and our existing activities, to the future growth opportunities and to the value of staff competencies in the acquired entities. These synergies are not recognised separately from goodwill, as they are not separately identifiable.
At the time of acquisition, minority interests’ shares of acquisitions were measured at their proportionate shares of the total fair value of the acquired entities including goodwill. On obtaining a controlling interest through step acquisitions, previously held non-controlling interests are at the time of obtaining control included at fair value with fair value adjustments in the in-come statement.
In 2017, a few adjustments were made to the preliminary recognition of acquisitions made in 2016. These adjustments were made in respect of payments made, contingent considerations provided and net assets and goodwill acquired and totalled DKK 11 million (DKK -13 million in 2016). In relation to acquisitions with final recognition in 2010-2016, adjustments were made in 2017 in respect of estimated contingent considerations. Such adjustments are recognised in the income statement.
The total impact on the income statement of fair value adjustments of non-controlling interests in step acquisitions amounted to DKK 0 million (DKK 28 million in 2016), and adjustments of estimated contingent considerations amounted to DKK 5 million (DKK 7 million in 2016) and are recognised under Distribution costs. In 2016, DKK 26 million was recognised under Share of profit after tax, associates and joint ventures.
Of the total acquisition cost in 2017, including adjustments to preliminary recognised acquisitions of DKK -2 million (DKK 0 million in 2016), the fair values of estimated contingent considerations in the form of discounted earn-outs or deferred pay-ments accounted for DKK 122 million (DKK 118 million in 2016). The maximum contingent consideration in respect of acqui-sitons made in 2017 was DKK 168 million.
The acquired assets include contractual receivables amounting to DKK 9 million (DKK 21 million in 2016) of which DKK 0 million (DKK 4 million in 2016) was thought to be uncollectible at the date of the acquisition. Of the total goodwill in the amount of DKK 437 million (DKK 560 million in 2016), DKK 304 million (DKK 244 million in 2016) can be amortised for tax purposes. In 2017, no contingent liability related to purchase agreement obligations was recognised (DKK 0 million in 2016).
Transaction cost in connection with acquisitions made in 2017 amounted to DKK 0 million (DKK 1 million in 2016), which has been recognised under Distribution costs.
Revenue and profit generated by the acquired enterprises since our acquisition in 2017 amount to DKK 147 million (DKK 206 million in 2016) and DKK 6 million (DKK 5 million in 2016), respectively. Had such revenue and profit been consolidated on 1 January 2017, we estimate that consolidated pro forma revenue and profit would have been DKK 13,294 million (DKK 12,113 million in 2016) and DKK 1,763 million (DKK 1,468 million in 2016), respectively. In our opinion, these pro forma figures re-flect the level of consolidated earnings after our acquisition of the enterprises without taking synergies from our core business into account.
The above statement of the fair values of acquired enterprises is not considered final until 12 months after acquisition.
From the balance sheet date and until the date of financial reporting in 2018, we have acquired additional distribution enter-prises. We are in the process of assessing their fair values. The acquisition cost is expected to relate primarily to goodwill.
6.1 ACQUISITION OF ENTERPRISES AND ACTIVITIES – CONTINUED

96 WILLIAM DEMANT ANNUAL REPORT 2017
§ ACCOUNTING POLICIESNewly acquired or newly established enterprises are recognised in the consolidated financial statements from the time of acquisition or formation. The time of acquisition is the date when control of the enterprise is transferred to the Group. For Group accounting policies on control, please refer to Consolidated financial statements in Note 9.1. In respect of newly acquired enterprises, comparative figures and key figures will not be restated. On acquiring new enterprises of which the Group obtains control, the purchase method is applied according to which their identified assets, liabilities and contingent liabilities are measured at their fair values on the acquisition date. Any non-current assets acquired for the purpose of resale are, however, measured at their fair values less expected costs to sell. Restructuring costs are solely recognised in the pre-acquisition balance sheet if they are a liability for the acquired enterprise. Any tax effect of revaluations will be taken into account.
The acquisition cost of an enterprise consists of the fair value of the consideration paid for the enterprise. If the final con- sideration is conditional upon one or more future events, the consideration will be recognised at the fair value on acquisi-tion. Any subsequent adjustment of contingent consideration is recognised directly in the income statement, unless the adjustment is the result of new information about conditions prevailing on the acquisition date, and this information be-comes available up to 12 months after the acquisition date. Transaction costs are recognised directly in the income state-ment when incurred. If costs exceed the fair values of the assets, liabilities and contingent liabilities identified on acquisi-tion, any remaining positive differences (goodwill) are recognised in the balance sheet under intangible assets and tested for impairment at least annually. If the carrying amount of an asset exceeds its recoverable amount, it will be written down to such lower recoverable amount.
If, on the acquisition date, there are any uncertainties with respect to identifying or measuring acquired assets, liabilities or contingent liabilities or uncertainty with respect to determining their cost, initial recognition will be made on the basis of provisionally calculated values. Such provisionally calculated values may be adjusted, or additional assets or liabilities may be recognised up to 12 months after the acquisition date, if new information becomes available about conditions prevailing on the acquisition date, which would have affected the calculation of values on that day, had such information been known.
ACCOUNTING ESTIMATES AND ASSUMPTIONSIdentification of assets and liabilitiesOn recognition of assets and liabilities from business combinations, Management judgements may be required for the following areas:– Intangibles assets resulting from technology, customer relationships, client lists or brand names– Contingent consideration arrangements
Contingent considerationBusiness combinations may include provisions that additional payments of contingent considerations be paid to the previous owners, when certain events occur or certain results are obtained. Management assesses on a regular basis the assumptions made in respect of the particular acquisitions, taking sales run rates of the acquired entity into account.
6.1 ACQUISITION OF ENTERPRISES AND ACTIVITIES – CONTINUED
SECTION 6 ACQUISITIONS, ASSOCIATES AND JOINT VENTURES

WILLIAM DEMANT ANNUAL REPORT 2017 97
6.2 DIVESTMENT OF ENTERPRISES AND ACTIVITIES
2017
0000
0
The divestment of entreprises and activities in 2016 included the divestment of a number of retail shops. There were no divestments in 2017.
(DKK million)
GoodwillOther intangible assetsProperty, plant and equipmentCarrying amount of net assets divested
Proceeds from divestments CF
SECTION 6 ACQUISITIONS, ASSOCIATES AND JOINT VENTURES
2016
12 13
2 27
27
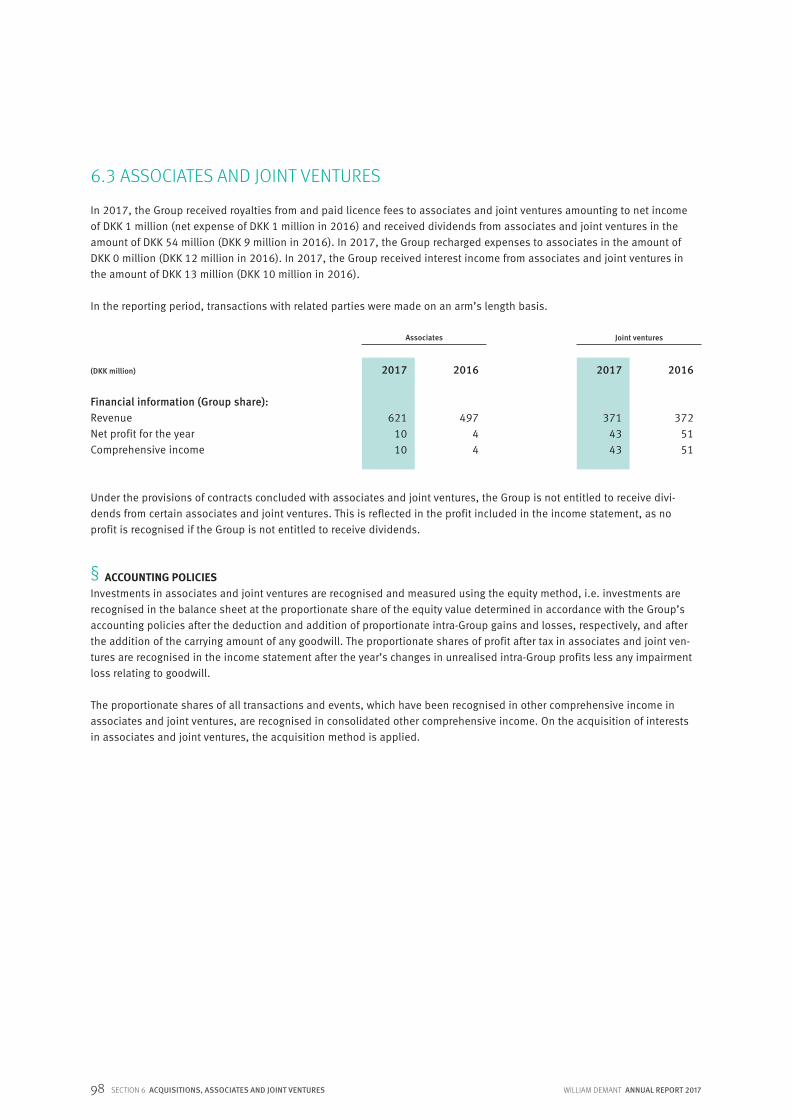
98 WILLIAM DEMANT ANNUAL REPORT 2017
6.3 ASSOCIATES AND JOINT VENTURES
In 2017, the Group received royalties from and paid licence fees to associates and joint ventures amounting to net income of DKK 1 million (net expense of DKK 1 million in 2016) and received dividends from associates and joint ventures in the amount of DKK 54 million (DKK 9 million in 2016). In 2017, the Group recharged expenses to associates in the amount of DKK 0 million (DKK 12 million in 2016). In 2017, the Group received interest income from associates and joint ventures in the amount of DKK 13 million (DKK 10 million in 2016).
In the reporting period, transactions with related parties were made on an arm’s length basis.
(DKK million)
Financial information (Group share):RevenueNet profit for the yearComprehensive income
2017
6211010
2016
497 4 4
§ ACCOUNTING POLICIESInvestments in associates and joint ventures are recognised and measured using the equity method, i.e. investments are recognised in the balance sheet at the proportionate share of the equity value determined in accordance with the Group’s accounting policies after the deduction and addition of proportionate intra-Group gains and losses, respectively, and after the addition of the carrying amount of any goodwill. The proportionate shares of profit after tax in associates and joint ven-tures are recognised in the income statement after the year’s changes in unrealised intra-Group profits less any impairment loss relating to goodwill.
The proportionate shares of all transactions and events, which have been recognised in other comprehensive income in associates and joint ventures, are recognised in consolidated other comprehensive income. On the acquisition of interests in associates and joint ventures, the acquisition method is applied.
2017
3714343
2016
3725151
Associates Joint ventures
Under the provisions of contracts concluded with associates and joint ventures, the Group is not entitled to receive divi-dends from certain associates and joint ventures. This is reflected in the profit included in the income statement, as no profit is recognised if the Group is not entitled to receive dividends.
SECTION 6 ACQUISITIONS, ASSOCIATES AND JOINT VENTURES
KAPITELWILLIAM DEMANT ANNUAL REPORT 2017 99
SECTION 7 PROVISIONS, OTHER LIABILITIES ETC.
240 million DKK
Provisions
1,741 million DKK
Other liabilities

100 WILLIAM DEMANT ANNUAL REPORT 2017SECTION 7 PROVISIONS, OTHER LIABILITIES ETC.
2017
295721
107133240
21525
240
2016
455430
129198327
29532
327
7.1 PROVISIONS
(DKK million)
Restructuring cost provisionsStaff-related provisionsMiscellaneous provisionsOther provisionsDefined benefit plan liabilities, netProvisions at 31.12.
Breakdown of provisions:Non-current provisions BS
Current provisions BS
Provisions at 31.12.
Staff-related Miscellaneous TotalRestructuring costs
45-205
-190
29
141529
54-51700
57
570
57
30-106
-5-9
21
111021
129-81
18-24
-9107
8225
107
Other provisions
(DKK million)
Other provisions at 1.1.2017Foreign currency translation adjustmentsAdditions relating to acquisitionsProvisions during the yearApplied during the yearReversals during the yearOther provisions at 31.12.2017
Breakdown of provisions:Non-current provisionsCurrent provisionsProvisions at 31.12.2017
000
46-10
45
291645
4810500
54
540
54
781
146
-60-9
30
141630
1262
1457
-61-9
129
9732
129
Other provisions at 1.1.2016Foreign currency translation adjustmentsAdditions relating to acquisitionsProvisions during the yearApplied during the yearReversals during the yearOther provisions at 31.12.2016
Breakdown of provisions:Non-current provisions Current provisions Provisions at 31.12.2016
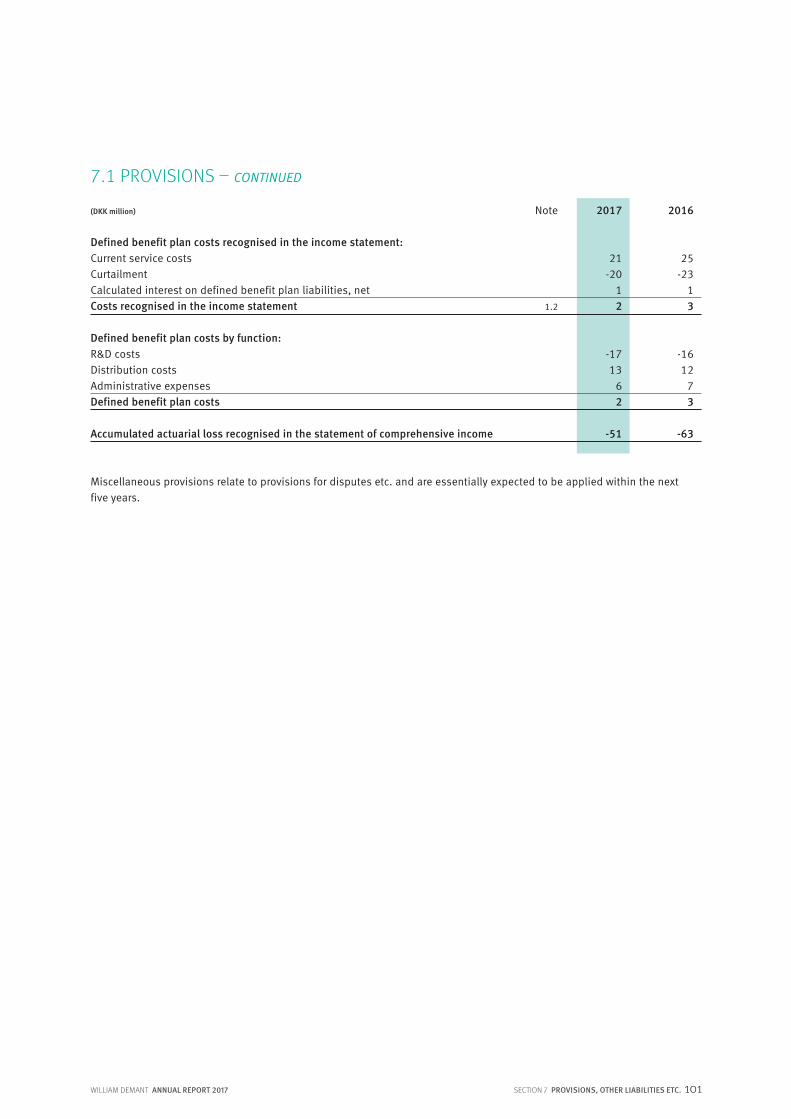
WILLIAM DEMANT ANNUAL REPORT 2017 101SECTION 7 PROVISIONS, OTHER LIABILITIES ETC.
Miscellaneous provisions relate to provisions for disputes etc. and are essentially expected to be applied within the next five years.
7.1 PROVISIONS – CONTINUED
2017
21-20
12
-1713
62
-51
2016
25-23
13
-1612
73
-63
(DKK million)
Defined benefit plan costs recognised in the income statement:Current service costsCurtailmentCalculated interest on defined benefit plan liabilities, netCosts recognised in the income statement
Defined benefit plan costs by function:R&D costsDistribution costsAdministrative expensesDefined benefit plan costs
Accumulated actuarial loss recognised in the statement of comprehensive income
Note
1.2

102 WILLIAM DEMANT ANNUAL REPORT 2017
Generally, the Group does not offer defined benefit plans, but it has such plans in Switzerland, France and Germany, where they are required by law.
The Group expects to pay approx. DKK 13 million in 2018 (DKK 16 million in 2017) into defined benefit plans.
Defined benefit obligations in the amount of DKK 64 million will mature within 1-5 years (DKK 149 million in 2016) and obligations in the amount of DKK 297 million after five years (DKK 346 million in 2016).
If the discount rate is 0.5% higher (lower), the defined benefit obligation will decrease by 6% (increase by 7%). If the expected salary growth rate is 0.5% higher (lower), the defined benefit obligation will increase by 1% (decrease by 2%).
SECTION 7 PROVISIONS, OTHER LIABILITIES ETC.
2017
495-30
00
21-20
2-6-10
-1099
361
297-24
0011
62-109228
133
211
0.5%1.0%1.5%
2016
3491
37106
25-23
3522
-2311
495
1861
3764
22
28-23
297
198
422
0.5%1.0%1.5%
(DKK million)
Present value of defined benefit obligations:Defined benefit obligations at 1.1.Foreign currency translation adjustmentsReclassificationsAdditions relating to acquisitionsCurrent service costsCurtailmentCalculated interest on defined benefit obligationsActuarial losses/gains, demographic assumptionsActuarial losses/gains, financial assumptionsActuarial losses/gains, experience assumptionsBenefits paidContributions from plan participantsDefined benefit obligations at 31.12.
Fair value of defined benefit assets:Defined benefit assets at 1.1.Foreign currency translation adjustmentsReclassificationsAdditions relating to acquisitionsExpected return on defined benefit assetsActuarial gains/lossesContributionsBenefits paidDefined benefit assets at 31.12.
Defined benefit obligations recognised in the balance sheet, net
Return on defined benefit assets:Actual return on defined benefit assetsExpected return on defined benefit assetsActuarial gains/losses on defined benefit assets
Assumptions:Discount rateExpected return on defined benefit assetsFuture salary increase rate
7.1 PROVISIONS – CONTINUED
WILLIAM DEMANT ANNUAL REPORT 2017 103SECTION 7 PROVISIONS, OTHER LIABILITIES ETC.
§ ACCOUNTING POLICIESProvisions are recognised if, as a result of an earlier event, the Group has a legal or constructive obligation, and if the settlement of such an obligation is expected to draw on corporate financial resources, but there is uncertainty about the timing or amount of the obligation. Provisions are measured on a discounted basis based on Management’s best estimate of the amount at which a particular liability may be settled. The discount effect of any changes in the present value of pro-visions is recognised as a financial expense.
The Group has defined benefit plans and similar agreements with some of its employees. As regards defined contribution plans, the Group pays regular, fixed contributions to independent pension companies. Contributions are recognised in the income statement for the period in which employees have performed work entitling them to such pension contributions. Contributions due are recognised in the balance sheet as a liability.
As regards defined benefit plans, the Group is obliged to pay a certain contribution when an employee covered by such a plan retires, for instance a fixed amount or a percentage of the employee’s final salary. An actuarial calculation is made periodically of the accrued present value of future benefits to which employees through their past employment with the Group are entitled and which are payable under the defined benefit plan. This defined benefit obligation is calculated annually using the projected unit credit method on the basis of assumptions in respect of the future development in for instance wage levels, interest rates and inflation rates. The defined benefit obligation less the fair value of any assets relating to the defined benefit plan is recognised in the income statement under provisions.
Defined benefit costs are categorised as follows:
Service costs including current service costs, past service costs as well as gains and losses on curtailments and settlements
Net interest expense or income Remeasurements
Remeasurements, comprising actuarial gains and losses, any effects of changes to the asset ceiling and return on defined benefit assets excluding interest, are reflected immediately in the balance sheet with a charge or credit recognised in other comprehensive income in the period in which it occurs. Remeasurements recognised in other comprehensive income are reflected immediately in retained earnings and will not be reclassified to the income statement. Service costs and net in- terest expense or income are included in the income statement as staff costs.
Other non-current employee benefits are recognised using actuarial calculation. Actuarial gains or losses on such benefits are recognised directly in the income statement.
ACCOUNTING ESTIMATES AND ASSUMPTIONS Management assesses, on an ongoing basis, provisions for restructuring costs and the likely outcome of pending and pro-bable lawsuits etc. (other provisions). When assessing the likely outcome of lawsuits, Management bases its assessment on internal and external legal advice and established precedent. Provisions for restructuring costs are based on the esti- mated costs of implementing restructuring initiatives and thus on a number of assumptions about future costs and events. For all provisions, the outcome and final expense depend on future events, which are by nature uncertain.
7.1 PROVISIONS – CONTINUED
104 WILLIAM DEMANT ANNUAL REPORT 2017
7.2 OTHER LIABILITIES
Product-related liabilities include service packages, warranties, returned products etc. Staff-related liabilities include holi-day pay and payroll costs due. The carrying amount of other liabilities approximates the fair value of such liabilities.
2017
293463265365355
1,741
1,544197
2016
283 435 249 183 265
1,415
1,244171
§ ACCOUNTING POLICIESOther non-financial liabilities are recognised if, as a result of an earlier event, the Group has a legal or constructive obliga-tion, and if the settlement of such an obligation is expected to draw on corporate financial resources. Other non-financial liabilities are measured on a discounted basis, and the discount effect of any changes in the present value of the liabilities is recognised as a financial expense.
On the sale of products with a right of return, a liability is recognised in respect of the profit on products expected to be re-turned and of any costs incurred with the return of such products. Warranty commitments include the obligation to remedy faulty or defective products during the warranty period.
(DKK million)
Product-related liabilitiesStaff-related liabilitiesOther debt, public authoritiesContingent considerations Other costs payableOther liabilities
Due within 1 year BS
Due within 1-5 years BS
SECTION 7 PROVISIONS, OTHER LIABILITIES ETC.
ACCOUNTING ESTIMATES AND ASSUMPTIONS Liabilities in respect of service packages and warranties have been calculated on the basis of information on products sold, related service and warranty periods and past experience of costs incurred by our Group to fulfil our service and warranty liabilities. Liabilities in respect of returns have been calculated based on information on products sold, related rights con-cerning returns and past experience of products being returned in the various markets. Consolidated product-related liabi-lities are the sum of a large number of small items, the sum changing constantly due to a large number of transactions.
WILLIAM DEMANT ANNUAL REPORT 2017 105SECTION 7 PROVISIONS, OTHER LIABILITIES ETC.
7.4 CONTINGENT LIABILITIES
The William Demant Group is involved in a few disputes, lawsuits etc. Management is of the opinion that such disputes do not or will not significantly affect the Group’s financial position. The Group seeks to make adequate provisions for legal proceedings.
As part of our business activities, the Group has entered into normal agreements with customers and suppliers etc. as well as agreements for the purchase of shareholdings.
For the purposes of section 357 of the Republic of Ireland Companies Act 2014, William Demant Holding A/S has undertaken to indemnify the creditors of its subsidiaries incorporated in the Republic of Ireland in respect of all losses and liabilities for the financial year ending on 31 December 2017 or any amended financial period incorporating the said financial year. The Company does not expect any material loss to arise from this guarantee.
Operating leases are recognised in the income statement at an amount of DKK 495 million (DKK 470 million in 2016). The Group’s operating leases mainly relate to rent of which some have renewal options.
2017
928 84
1,012
342 517 153
1,012
2016
849 74
923
310 450 163 923
7.3 OPERATING LEASE COMMITMENTS
(DKK million)
RentOther operating leasesTotal
Operating leases, less than 1 yearOperating leases, 1-5 yearsOperating leases, over 5 yearsTotal

106 WILLIAM DEMANT ANNUAL REPORT 2017
SECTION 8 OTHER DISCLOSURE REQUIREMENTS
WILLIAM DEMANT ANNUAL REPORT 2017 107SECTION 8 OTHER DISCLOSURE REQUIREMENTS
8.2 FEES TO PARENT’S AUDITORS APPOINTED AT THE ANNUAL GENERAL MEETING
8.1 RELATED PARTIES
William Demants og Hustru Ida Emilies Fond (the Oticon Foundation), Kongebakken 9, 2765 Smørum, Denmark, is the only related party with a controlling interest. Controlling interest is achieved through a combination of the Oticon Foundation’s own shareholding and the shareholding of William Demant Invest A/S for which the Oticon Foundation exercises the voting rights. Associated enterprises of William Demant Invest A/S are related parties to the William Demant Group.
Related parties with significant influence are the Company’s Executive Board, Board of Directors and their related parties. Furthermore, related parties are companies in which the above persons have significant interests. Subsidiaries, associates and joint ventures as well as the William Demant Group’s ownership interests in these companies appear from the Subsidiaries, associates and joint ventures list on page 128, and financial information on associates and joint ventures can be found in Note 6.3. In 2017, the Oticon Foundation and William Demant Invest A/S paid administration fees to the Group of DKK 1 million (DKK 2 million in 2016) and DKK 2 million (DKK 5 million in 2016), respectively. The Group paid administration fees to William Demant Invest A/S of DKK 3 million (DKK 0 million in 2016). In 2017, the Group paid service fees to Össur hf. of DKK 28 million (DKK 19 million in 2016) and received service fees of DKK 10 million from Össur hf. (DKK 7 million in 2016). In 2017, the Oticon Foundation donated DKK 4 million (DKK 0 million in 2016) to Interacoustics Research Unit at the Technical University of Denmark. Furthermore, the Oticon Foundation acquired diagnostic equipment worth DKK 2 million (DKK 2 million in 2016) from the Group.
In 2016 and 2017, the Group settled Danish tax on account and residual tax with William Demant Invest A/S, which is the administration company for the joint taxation.
There have been no transactions with the Executive Board and the Board of Directors apart from normal remuneration. Please refer to Note 1.2.
A few Group enterprises are not audited by the Parent’s appointed auditors (Deloitte) or the auditors’ foreign affiliates.
The fee for non-audit services delivered by Deloitte Statsautoriseret Revisionspartnerselskab to the Group amounts to DKK 2 million and consists of VAT and tax assistance, tax advisory services related to transfer pricing, issuance of various assurance reports and accounting advisory.
2017
11 4 1
16
2016
10 5 1
16
(DKK million)
Statutory auditTax and VAT advisory servicesOther servicesTotal

108 WILLIAM DEMANT ANNUAL REPORT 2017
8.3 GOVERNMENT GRANTS
In 2017, the William Demant Group received government grants in the amount of DKK 16 million (DKK 14 million in 2016). Grants are offset against R&D costs.
§ ACCOUNTING POLICIESGovernment grants are recognised when there is reasonable certainty that the conditions for such grants are satisfied and that they will be awarded. Grants received as compensation for costs incurred are recognised proportionately in the income statement over the periods in which the related costs are recognised in the income statement and are offset against costs incurred. Government grants relating to the acquisition of non-current assets are deducted from the cost of such asset.
8.4 EVENTS AFTER THE BALANCE SHEET DATE
There have been no events that materially affect the assessment of this Annual Report 2017 after the balance sheet date and up to today.
The names of the shareholders listed below are recorded in the register of shareholders as owners of minimum 5% of the votes or minimum 5% of the share capital:
William Demant Invest A/S and this company’s parent, William Demants og Hustru Ida Emilies Fond (the Oticon Foundation), Kongebakken 9, 2765 Smørum, Denmark. The ownership interest is approx. 55% of the share capital (57% of the shares outstanding). William Demant Invest A/S prepares consolidated financial statements in which the William Demant Group is included.
Canada Pension Plan Investment Board, One Queen St. E., S 2500, Toronto, Canada. The ownership interest is 7.86% of the share capital.
At the Board meeting on 22 February 2018, our Board of Directors approved this Annual Report 2017 for publication. The report will be presented to the shareholders of William Demant Holding A/S for adoption at the annual general meeting on 22 March 2018.
8.5 APPROVAL AND PUBLICATION
8.6 SHAREHOLDERS
SECTION 8 OTHER DISCLOSURE REQUIREMENTS

WILLIAM DEMANT ANNUAL REPORT 2017 109SECTION 8 OTHER DISCLOSURE REQUIREMENTS
SECTION 9 BASIS FOR PREPARATION

110 WILLIAM DEMANT ANNUAL REPORT 2017
9.1 GROUP ACCOUNTING POLICIES
The Group’s general accounting policies are described below. In addition to this, specific accounting policies are described in each of the individual notes to the consolidated financial statements as outlined here:
GeneralThe consolidated financial statements are presented in compliance with International Financial Reporting Standards (IFRS) as adopted by the EU and Danish disclosure requirements for annual reports published by reporting class D (listed) compa-nies, cf. the Danish executive order on IFRS issued in compliance with the Danish Financial Statements Act. The registered office of William Demant Holding A/S is in Denmark.
The consolidated financial statements are presented in Danish kroner (DKK), which is the functional currency for the Parent. The consolidated financial statements are presented on the basis of historical cost, except for obligations for contingent con-sideration in connection with business combinations, share-based remuneration, derivatives and financial assets classified as assets available for sale, which are measured at fair value.
The financial statements for the Parent as well as the Parent’s accounting policies are presented separately from the consoli-dated financial statements and are shown on the last pages of this Annual Report 2017.
Based on an inquiry from the Danish Business Authority, the Group has decided to amend its accounting policy under which short-term bank facilities are included in cash and cash equivalents in the cash flow statement. Please see page 113 for the new accounting policy. The change of the comparative figures had a positive impact on cash flow from financing activities of DKK 114 million and resulted in an increase in cash and cash equivalents of DKK 2.2 billion.
Besides the change described above, the accounting policies remain unchanged for the consolidated financial statement compared to 2016, with the exception of the implementation of new and amended standards as described below as well as insignificant reclassifications of the comparative figures for 2016.
Effect of new accounting standardsThe Group has adopted all new, amended and revised accounting standards and interpretations as published by the IASB and adopted by the EU effective for the accounting period beginning on 1 January 2017. None of these new, updated and amended standards and interpretations resulted in any changes to the accounting policies for the Group or had any signi-ficant impact on the consolidated financial statements for 2017.
Effect of new accounting standards not yet in forceRevised and new standards and interpretations issued, but not yet effective or approved by the EU at the time of publication of this Annual Report 2017, have not been incorporated into this report.
Issued in May 2014, IFRS 15 Revenue from Contracts with Customers establishes a single comprehensive model for entities to be used in accounting for revenue arising from contracts with customers. IFRS 15 will supersede the current revenue rec-ognition guidance including IAS 18 Revenue and related interpretations when it becomes effective. Management has ana-lysed the impact of IFRS 15 and assessed that the new standard will have some impact on the timing of revenue recognition, on net or gross recognition of principal and agent relationships and on the disclosure of revenue. The transition will impact the balance sheet by approx. DKK 390 million net of tax and will predominantly pertain to deferral of income. The impact on the income statement will be limited. IFRS 15 will take effect on 1 January 2018.
1.1 Revenue by geographic region and business activity
1.5 Inventories1.6 Receivables2.3 Hedging and forward exchange
contracts2.4 Exchange rates
3.1 Intangible assets3.2 Property, plant and equipment3.5 Impairment testing4.2 Net financial items4.3 Categories of financial instruments4.5 Fair value hierarchy5.1 Tax on profit
5.2 Deferred tax6.1 Acquisition of enterprises
and activities6.3 Associates and joint ventures7.1 Provisions7.2 Other liabilities8.3 Government grants
SECTION 9 BASIS FOR PREPARATION
WILLIAM DEMANT ANNUAL REPORT 2017 111SECTION 9 BASIS FOR PREPARATION
IFRS 9 Financial Instruments was issued in 2009 and has been revised several times since then. Management has assessed that the standard will only have limited impact on the consolidated financial statements. The main impact for the Group will be on the measurement of credit losses related to receivables, where the impact of the transition on the balance sheet is approx. DKK 20 million net of tax in respect of increased bad debt provisions. Although IFRS 9 provides the option to hedge net positions (i.e. EBIT) instead of hedging revenue, Management has decided to continue the current hedging policy, and consequently the changes in IFRS 9 will not have any impact on the Group’s hedging. IFRS 9 will take effect on 1 January 2018.
Issued in January 2016, IFRS 16 Leases requires lessees to recognise nearly all leases on the balance sheet. Management has assessed the expected impact of the standard and concluded that it will have a material impact on the recognition of tangible assets and financial debt on the balance sheet. The standard will also impact the classification of expenses in the income statement, the classification of cash flows in the cash flow statement as well as the related key figures. Based on figures as of 2017, the transition is expected to impact the net interest-bearing debt by approx. DKK 825 million and EBITDA by approx. DKK 335 million. IFRS 16 will take effect on 1 January 2019.
Definition of materialityIFRS contain extensive disclosure requirements. The Group discloses the information required according to IFRS, unless such information is deemed immaterial.
Consolidated financial statementsThe consolidated financial statements comprise William Demant Holding A/S (the Parent) and the enterprises in which the Parent can or actually does exercise control by either directly or indirectly holding more than 50% of the voting rights, or in which the Parent in some other manner exercises control. Enterprises in which the Group holds 20-50% of the voting rights and/or in some other manner can or actually does exercise significant influence are considered to be associates or joint ventures and are incorporated proportionately into the consoli-dated financial statements using the equity method.
Consolidation principlesThe consolidated financial statements are prepared on the basis of the financial statements for the Parent and its subsid-iaries by aggregating uniform items. Enterprises that, by agreement, are managed jointly with one or more other enterprises are recognised using the equity method. The financial statements included in the consolidated financial statements are pre-pared in accordance with the Group’s accounting policies. Intra-Group income, expenses, shareholdings, balances and divi-dends as well as unrealised intra-Group profits on inventories are eliminated.
The accounting items of subsidiaries are recognised 100% in the consolidated financial statements. On initial recognition, minority interests are measured either at their fair value or at their proportionate share of the fair value of the identifiable assets, liabilities and contingent liabilities of the acquired subsidiary. The particular method is chosen for each individual transaction. Minority interests are subsequently adjusted according to their proportionate share of changes in equity of the particular subsidiary. Comprehensive income is allocated to minority interests whether or not, as a result hereof, the value of such interests is negative.
Buying or selling minority interests in a subsidiary, which does not result in obtaining or discontinuing control of such sub-sidiary, is treated as an equity transaction in the consolidated financial statements, and any difference between the consid-eration and the carrying amount is allocated to the Parent’s share of the equity.
Income statementIncome and costs are recognised on an accruals basis. The income statement is broken down by function, and all costs, in-cluding depreciation, amortisation and impairment losses, are therefore charged to production, distribution, administration and R&D.
9.1 GROUP ACCOUNTING POLICIES – CONTINUED
112 WILLIAM DEMANT ANNUAL REPORT 2017
9.1 GROUP ACCOUNTING POLICIES – CONTINUED
Production costsProduction costs are costs incurred to generate revenue. Distribution companies recognise costs to sell under production costs. Production companies recognise cost of raw materials, consumables, production staff as well as maintenance of and depreciation, amortisation and impairment losses on property, plant and equipment and intangible assets used in the pro-duction process under production costs.
R&D costsResearch costs are always recognised in the income statement in step with the incurrence of such costs. Development costs include all costs not satisfying capitalisation criteria, but incurred in connection with development, prototype construction, development of new business concepts and amortisation of capitalised development costs.
Distribution costsDistribution costs include costs relating to training, sales, marketing, promotion materials, distribution, bad debts as well as depreciation, amortisation and impairment losses on assets used for distribution purposes.
Administrative expensesAdministrative expenses include administrative staff costs, office expenses as well as depreciation, amortisation and impair-ment losses on assets used for administrative purposes.
Prepaid expensesPrepaid expenses recognised under assets include costs relating to the subsequent financial years. Prepaid expenses are measured at cost.
Deferred incomeDeferred income includes income received relating to the subsequent financial year. Deferred income is measured at cost.
EquityForeign currency translation reserve includes foreign currency translation adjustments on the translation of financial state-ments of foreign subsidiaries, associates and joint ventures from their respective functional currencies into Danish kroner. Foreign currency translation adjustments are recognised in the income statement on realisation of the net investment. Hedging reserves include fair value adjustments of derivatives and loans satisfying the criteria for hedging of future trans-actions. The amounts are recognised in the income statement or the balance sheet in step with recognition of the hedged transactions.
Treasury shares and dividendOn the buy-back of shares or sale of treasury shares, the purchase price or selling price, respectively, is recognised directly in equity under other reserves (retained earnings). A capital reduction through the cancellation of treasury shares will reduce the share capital by an amount corresponding to the nominal value of such shares. Proposed dividends are recognised as a liability at the time of adoption at the annual general meeting.
Cash flow statementThe cash flow statement is prepared according to the indirect method and reflects the consolidated net cash flow broken down into operating, investing and financing activities. Cash flow from operating activities includes inflows from the year’s operations adjusted for non-cash operating items, changes in working capital, financial income received and expenses paid, realised foreign currency translation gains and losses and income tax paid. Cash flow from investing activities includes pay-ments in respect of the acquisition or divestment of enterprises and financial assets as well as the purchase, development, improvement or sale of intangible assets and property, plant and equipment. Finance leases are considered transactions with no cash flow effect. Cash flow relating to finance leases is recognised as payment of interest and repayment of debt. Cash flow from financing activities includes payments to and from shareholders and the raising and repayment of non- current and current debt not included in working capital.
SECTION 9 BASIS FOR PREPARATION

WILLIAM DEMANT ANNUAL REPORT 2017 113SECTION 9 BASIS FOR PREPARATION
9.2 ACCOUNTING ESTIMATES AND ASSUMPTIONS
On the preparation of the consolidated financial statements, Management makes a number of accounting estimates and judgements. These relate to the recognition, measurement and classification of assets and liabilities. Many items can only be estimated rather than accurately measured. Such estimates are based on the most recent information available on prepa-ration of the financial statements. Estimates and assumptions are therefore reassessed on an ongoing basis. Actual figures may, however, deviate from these estimates. Any changes in accounting estimates will be recognised in the reporting period in which such changes are made.
Specific accounting estimates and assumptions are described in each of the individual notes to the consolidated financial statements as outlined here:
1.1 Revenue by geographic region and business activity
1.2 Employees1.5 Inventories
1.6 Receivables3.1 Intangible assets5.2 Deferred tax
6.1 Acqusition of enterprises and activities
7.1 Provisions7.2 Other liabilities
9.1 GROUP ACCOUNTING POLICIES – CONTINUED
Cash flow in currencies other than the functional currency is recognised at average exchange rates for the months of the year, unless they deviate significantly from actual exchange rates on the transaction dates.
Cash and cash equivalents are cash less overdrafts, which consist of uncommitted bank facilities that often fluctuate from positive to overdrawn. Any short-term bank facilities that are consistently overdrawn are considered cash flow from financing activities.

114 KAPITEL WILLIAM DEMANT ANNUAL REPORT 2017
PARENT FINANCIAL STATEMENTS

WILLIAM DEMANT ANNUAL REPORT 2017 115PARENT INCOME STATEMENT
PARENT INCOME STATEMENT
2016
-7735
-42
1,1154919
-391,102
131,115
2017
-6934
-35
1,3554143
-291,375
31,378
(DKK million)
Administrative expensesOther operating income and expensesOperating profit/loss (EBIT)
Share of profit after tax, subsidiariesShare of profit after tax, associates and joint venturesFinancial incomeFinancial expensesProfit before tax
Tax on profit for the yearProfit for the year
Note
10.1 / 10.2
10.8
10.8
10.3
10.3
10.4
10.5
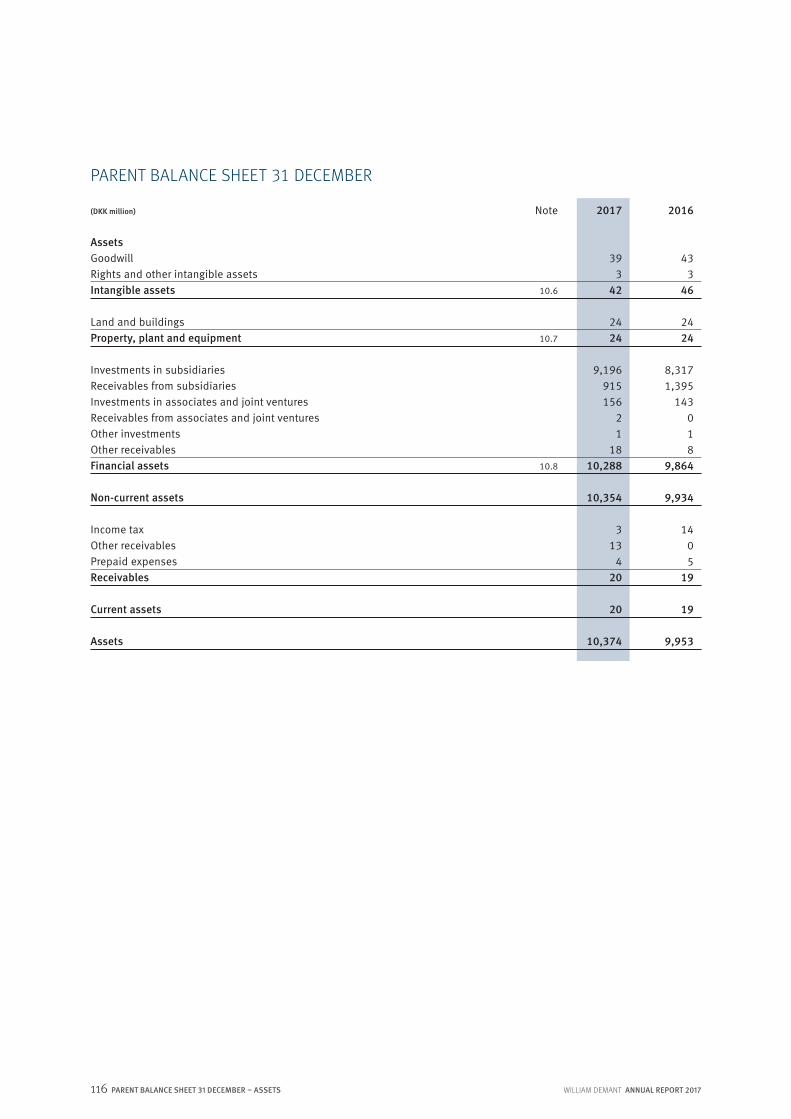
116 WILLIAM DEMANT ANNUAL REPORT 2017PARENT BALANCE SHEET 31 DECEMBER – ASSETS
PARENT BALANCE SHEET 31 DECEMBER
2017
393
42
2424
9,196915156
21
1810,288
10,354
313
420
20
10,374
2016
433
46
2424
8,3171,395
143018
9,864
9,934
1405
19
19
9,953
(DKK million)
Assets GoodwillRights and other intangible assetsIntangible assets
Land and buildingsProperty, plant and equipment
Investments in subsidiariesReceivables from subsidiariesInvestments in associates and joint venturesReceivables from associates and joint venturesOther investmentsOther receivablesFinancial assets
Non-current assets
Income taxOther receivablesPrepaid expensesReceivables
Current assets
Assets
Note
10.6
10.7
10.8
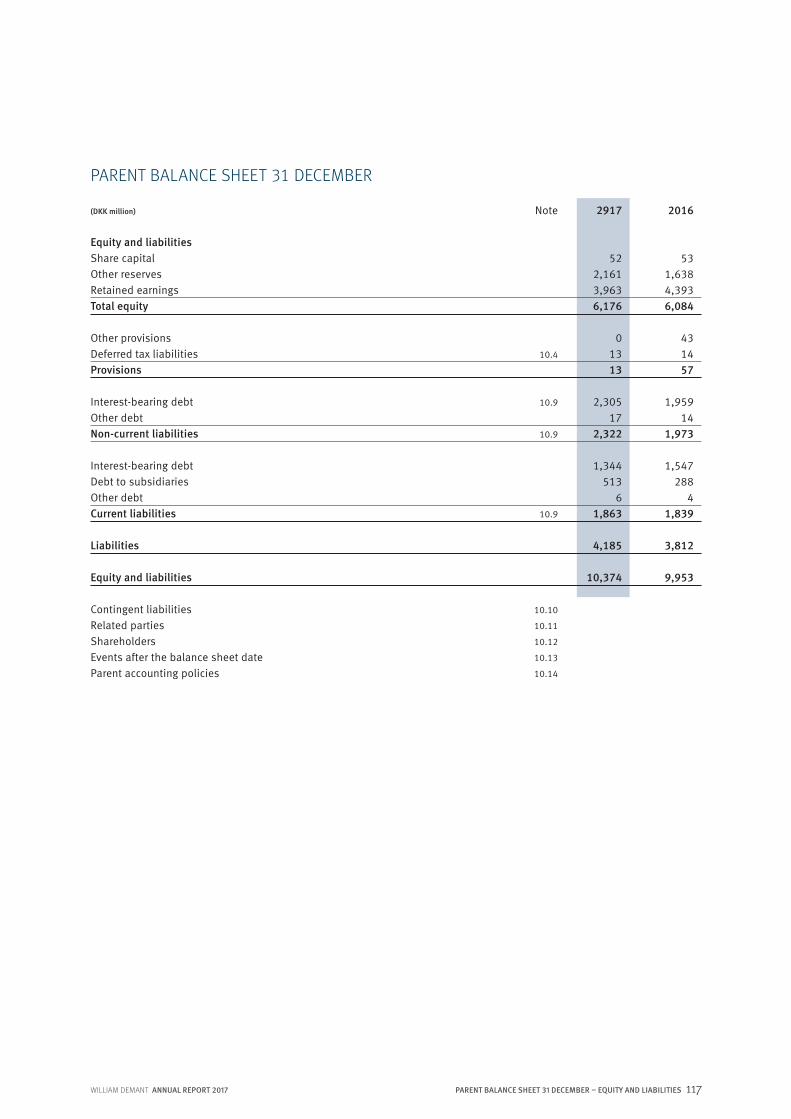
WILLIAM DEMANT ANNUAL REPORT 2017 117PARENT BALANCE SHEET 31 DECEMBER – EQUITY AND LIABILITIES
PARENT BALANCE SHEET 31 DECEMBER
2917
522,1613,9636,176
01313
2,30517
2,322
1,344513
61,863
4,185
10,374
2016
531,6384,3936,084
431457
1,95914
1,973
1,547288
41,839
3,812
9,953
(DKK million)
Equity and liabilitiesShare capitalOther reservesRetained earningsTotal equity
Other provisions Deferred tax liabilitiesProvisions
Interest-bearing debtOther debtNon-current liabilities
Interest-bearing debtDebt to subsidiariesOther debtCurrent liabilities
Liabilities
Equity and liabilities
Contingent liabilitiesRelated partiesShareholdersEvents after the balance sheet dateParent accounting policies
Note
10.4
10.9
10.9
10.9
10.10
10.11
10.12
10.13
10.14
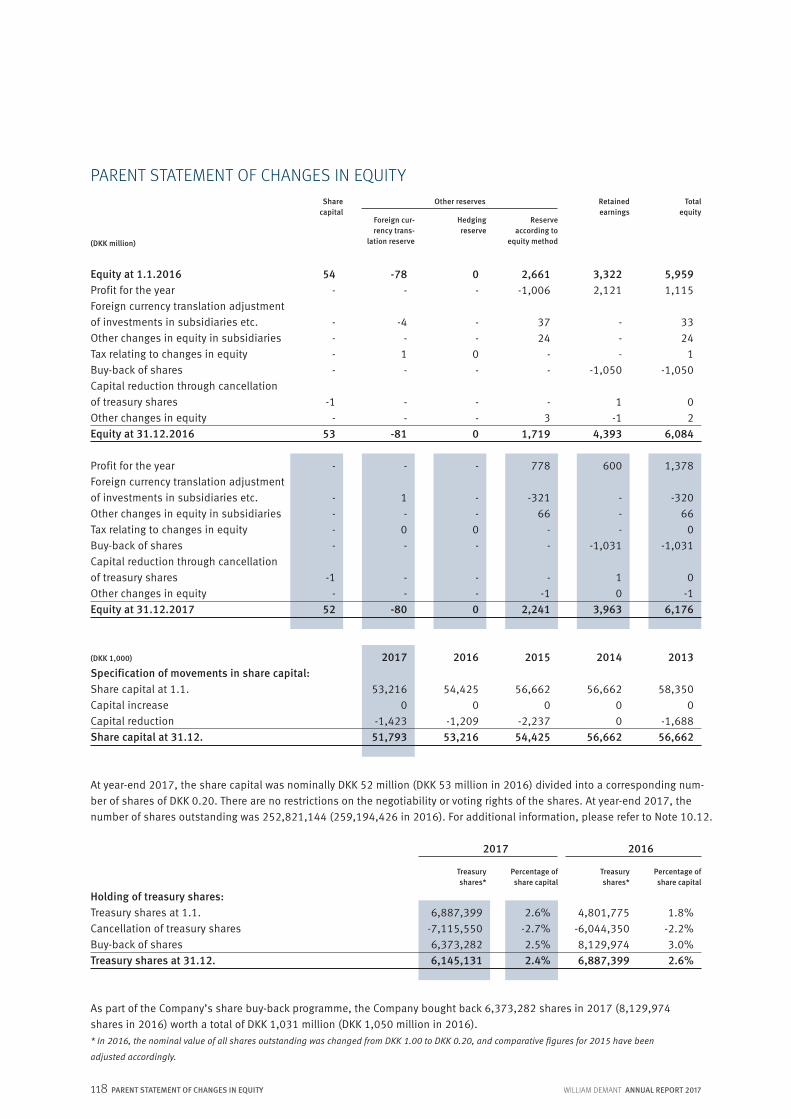
118 WILLIAM DEMANT ANNUAL REPORT 2017PARENT STATEMENT OF CHANGES IN EQUITY
2017 2016
Other reserves
At year-end 2017, the share capital was nominally DKK 52 million (DKK 53 million in 2016) divided into a corresponding num-ber of shares of DKK 0.20. There are no restrictions on the negotiability or voting rights of the shares. At year-end 2017, the number of shares outstanding was 252,821,144 (259,194,426 in 2016). For additional information, please refer to Note 10.12.
Foreign cur- rency trans-
lation reserve
Share capital
Hedgingreserve
Retainedearnings
Totalequity
Treasury shares*
Percentage of share capital
Treasuryshares*
Percentage of share capital
As part of the Company’s share buy-back programme, the Company bought back 6,373,282 shares in 2017 (8,129,974 shares in 2016) worth a total of DKK 1,031 million (DKK 1,050 million in 2016). * In 2016, the nominal value of all shares outstanding was changed from DKK 1.00 to DKK 0.20, and comparative figures for 2015 have been
adjusted accordingly.
Reserveaccording to
equity method
-
- - - -
-1 -
52
- 1 -
0 -
- -
-80
-
- - 0 -
- -
0
778
-321 66
- -
- -1
2,241
600
- - -
-1,031 1 0
3,963
1,378
-320 66
0 -1,031
0 -1
6,176
54 -
--
--
-1-
53
3,3222,121
-
- -
-1,050 1
-14,393
5,9591,115
3324 1
-1,050 0
2 6,084
-78-
-4 -
1-
--
-81
0-
- -
0-
--
0
2,661-1,006
3724
-- -
31,719
2017
53,2160
-1,42351,793
2014
56,66200
56,662
2013
58,3500
-1,68856,662
2016
54,4250
-1,20953,216
2015
56,6620
-2,23754,425
4,801,775-6,044,3508,129,9746,887,399
1.8%-2.2%3.0%2.6%
6,887,399-7,115,5506,373,2826,145,131
2.6%-2.7%2.5%2.4%
PARENT STATEMENT OF CHANGES IN EQUITY
(DKK million)
Equity at 1.1.2016Profit for the yearForeign currency translation adjustmentof investments in subsidiaries etc.Other changes in equity in subsidiariesTax relating to changes in equityBuy-back of sharesCapital reduction through cancellation of treasury sharesOther changes in equityEquity at 31.12.2016
Profit for the yearForeign currency translation adjustment of investments in subsidiaries etc.Other changes in equity in subsidiariesTax relating to changes in equityBuy-back of sharesCapital reduction through cancellation of treasury sharesOther changes in equityEquity at 31.12.2017
(DKK 1,000)
Specification of movements in share capital: Share capital at 1.1. Capital increaseCapital reductionShare capital at 31.12.
Holding of treasury shares:Treasury shares at 1.1.Cancellation of treasury sharesBuy-back of sharesTreasury shares at 31.12.

KAPITELWILLIAM DEMANT ANNUAL REPORT 2017 119
SECTION 10 NOTES TO PARENT FINANCIAL STATEMENTS
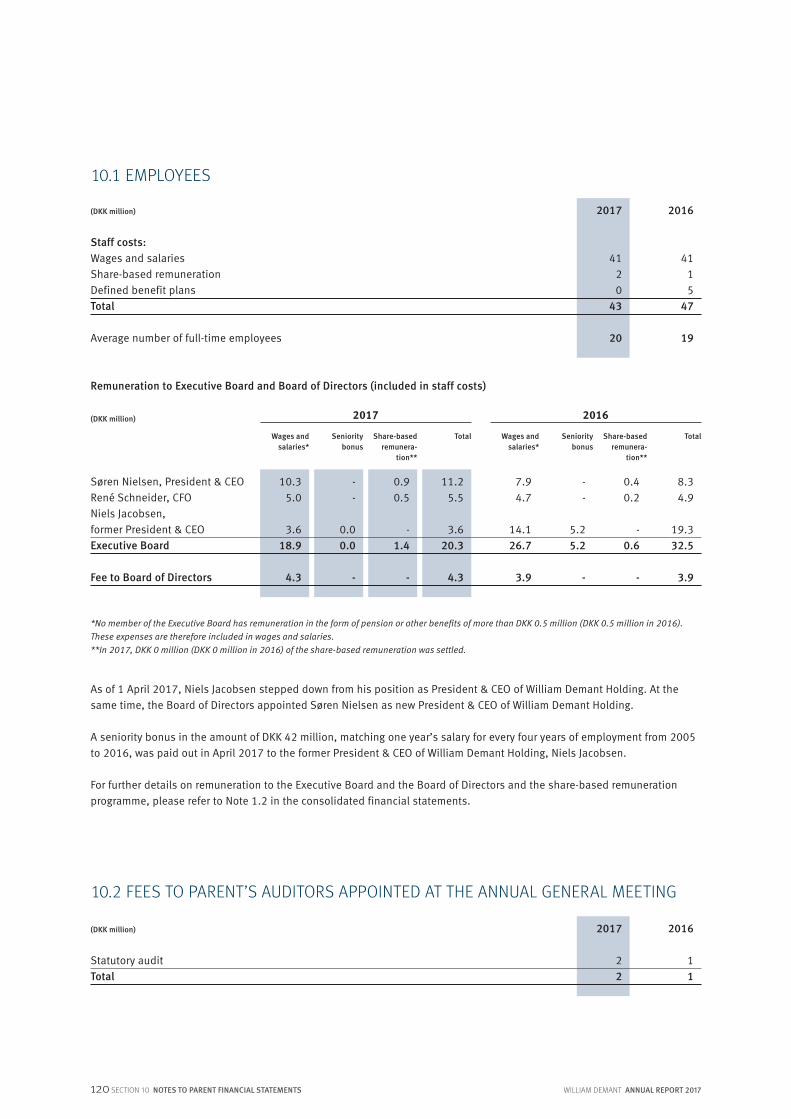
120 WILLIAM DEMANT ANNUAL REPORT 2017
10.35.0
3.618.9
4.3
- -
0.00.0
-
0.90.5
- 1.4
-
11.25.5
3.620.3
4.3
10.1 EMPLOYEES
As of 1 April 2017, Niels Jacobsen stepped down from his position as President & CEO of William Demant Holding. At the same time, the Board of Directors appointed Søren Nielsen as new President & CEO of William Demant Holding.
A seniority bonus in the amount of DKK 42 million, matching one year’s salary for every four years of employment from 2005 to 2016, was paid out in April 2017 to the former President & CEO of William Demant Holding, Niels Jacobsen.
For further details on remuneration to the Executive Board and the Board of Directors and the share-based remuneration programme, please refer to Note 1.2 in the consolidated financial statements.
2017
4120
43
20
2016
4115
47
19
10.2 FEES TO PARENT’S AUDITORS APPOINTED AT THE ANNUAL GENERAL MEETING
2017
22
2016
11
(DKK million)
Statutory auditTotal
(DKK million)
Staff costs:Wages and salariesShare-based remunerationDefined benefit plansTotal
Average number of full-time employees
Remuneration to Executive Board and Board of Directors (included in staff costs)
(DKK million)
Søren Nielsen, President & CEORené Schneider, CFONiels Jacobsen, former President & CEOExecutive Board
Fee to Board of Directors
*No member of the Executive Board has remuneration in the form of pension or other benefits of more than DKK 0.5 million (DKK 0.5 million in 2016). These expenses are therefore included in wages and salaries.**In 2017, DKK 0 million (DKK 0 million in 2016) of the share-based remuneration was settled.
SECTION 10 NOTES TO PARENT FINANCIAL STATEMENTS
2017
Wages and salaries*
Share-based remunera-
tion**
TotalSeniority bonus
Wages and salaries*
Share-based remunera-
tion**
TotalSeniority bonus
2016
7.94.7
14.126.7
3.9
- -
5.25.2
-
0.4 0.2
- 0.6
-
8.34.9
19.332.5
3.9

WILLIAM DEMANT ANNUAL REPORT 2017 121SECTION 10 NOTES TO PARENT FINANCIAL STATEMENTS
10.3 NET FINANCIAL ITEMS
10.4 TAX ON PROFIT AND DEFERRED TAX
2017
15 1
27 43
-1 -28
0 0
-29
14
2016
18 1 0
19
-5 -26
-1 -7
-39
-20
2017
3-1103
0-13-13
-1410
-13
2016
130
-11
13
0-14-14
-14-11
-14
(DKK million)
Interest from subsidiariesInterest incomeForeign exchange gains, netFinancial income IS
Interest to subsidiariesInterest expensesTransaction costsForeign exchange losses, netFinancial expenses IS
Net financial items
(DKK million)
Tax on profit for the year:Current tax on profit for the yearAdjustment of current tax, prior yearsChange in deferred taxAdjustment of deferred tax, prior yearsTax on profit for the year IS Deferred tax recognised in the balance sheet:Deferred tax assetsDeferred tax liabilities BS Deferred tax, net at 31.12.
Deferred tax, net at 1.1.Changes in deferred tax liabilitiesAdjustment of deferred tax, prior yearsDeferred tax, net at 31.12.
10.5 PROPOSED DISTRIBUTION OF NET PROFIT
2017
778600
1,378
2016
-1,0062,1211,115
(DKK million)
Transferred to reserves for net revaluation according to the equity methodRetained earningsTotal
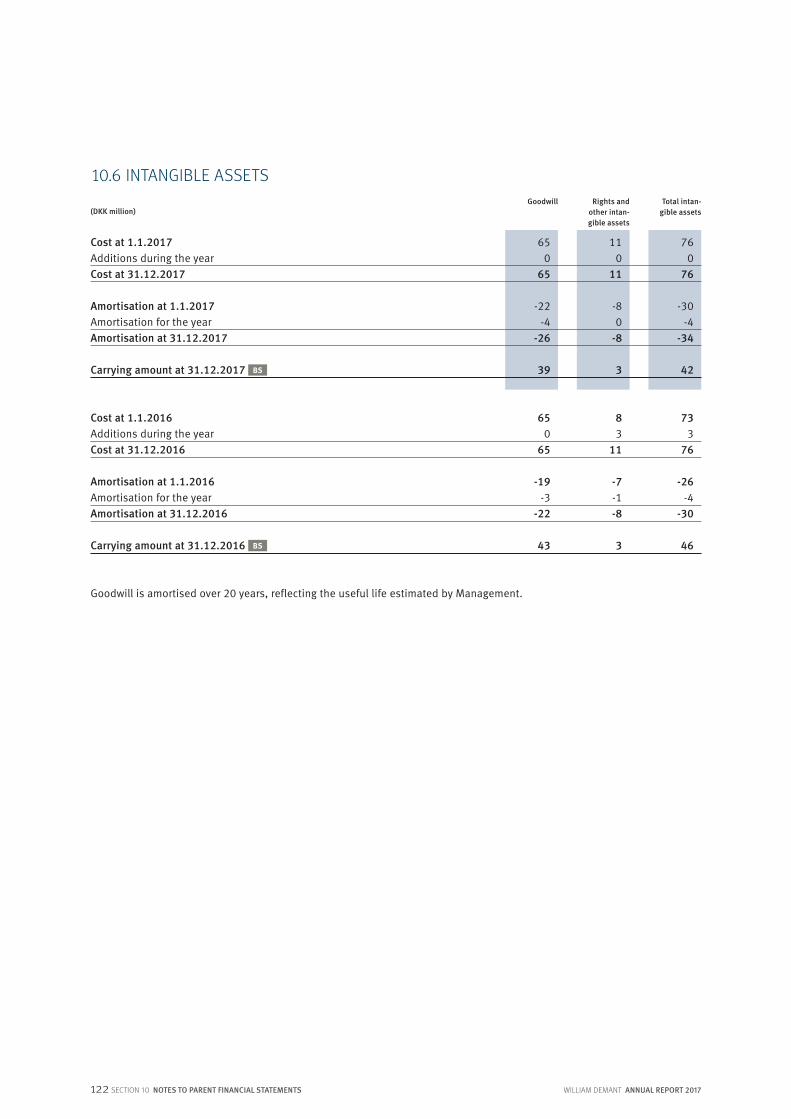
122 WILLIAM DEMANT ANNUAL REPORT 2017
10.6 INTANGIBLE ASSETS Goodwill Rights and
other intan-gible assets
Total intan-gible assets
Goodwill is amortised over 20 years, reflecting the useful life estimated by Management.
65 0
65
-22 -4
-26
39
11 0
11
-8 0
-8
3
76 0
76
-30 -4
-34
42
(DKK million)
Cost at 1.1.2017Additions during the yearCost at 31.12.2017
Amortisation at 1.1.2017Amortisation for the yearAmortisation at 31.12.2017
Carrying amount at 31.12.2017 BS
Cost at 1.1.2016Additions during the yearCost at 31.12.2016
Amortisation at 1.1.2016Amortisation for the yearAmortisation at 31.12.2016
Carrying amount at 31.12.2016 BS
65 0
65
-19 -3
-22
43
8 3
11
-7 -1 -8
3
73 3
76
-26 -4
-30
46
SECTION 10 NOTES TO PARENT FINANCIAL STATEMENTS
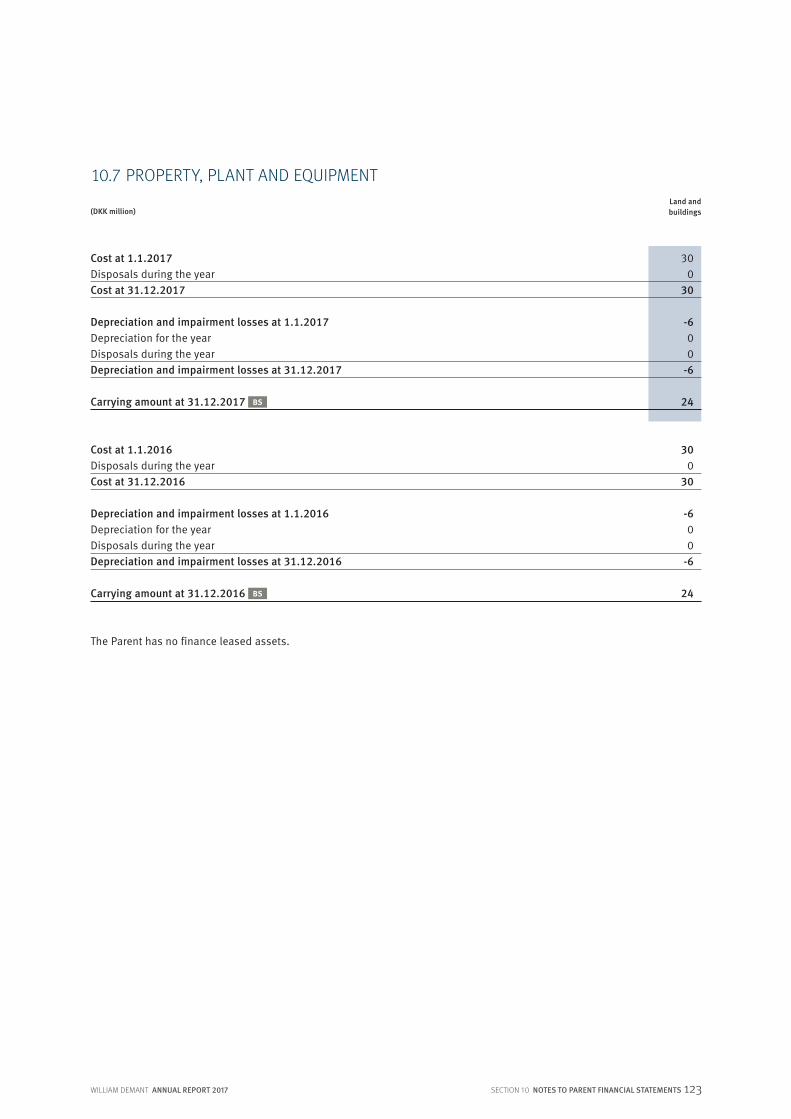
WILLIAM DEMANT ANNUAL REPORT 2017 123
10.7 PROPERTY, PLANT AND EQUIPMENT Land and buildings
30 0
30
-6 00
-6
24
300
30
-600
-6
24
(DKK million)
Cost at 1.1.2017Disposals during the yearCost at 31.12.2017
Depreciation and impairment losses at 1.1.2017Depreciation for the yearDisposals during the yearDepreciation and impairment losses at 31.12.2017
Carrying amount at 31.12.2017 BS
Cost at 1.1.2016Disposals during the yearCost at 31.12.2016
Depreciation and impairment losses at 1.1.2016Depreciation for the yearDisposals during the yearDepreciation and impairment losses at 31.12.2016
Carrying amount at 31.12.2016 BS
The Parent has no finance leased assets.
SECTION 10 NOTES TO PARENT FINANCIAL STATEMENTS

124 WILLIAM DEMANT ANNUAL REPORT 2017
10.8 FINANCIAL ASSETSInvestments
in subsidiariesReceivables
from asso-ciates and
joint ventures
Otherinvestments
Otherreceivables
The carrying amounts of investments in subsidiaries, associates and joint ventures include capitalised goodwill in the net amount of DKK 5,405 million (DKK 5,402 million in 2016). Amortisation of consolidated capitalised goodwill for the year is DKK 440 million (DKK 321 million in 2016). Receivables from subsidiaries of DKK 915 million (DKK 1,395 million in 2016) are considered additions to the total investments in the particular enterprises and are therefore considered non-current. Other receivables worth DKK 4 million (DKK 8 million in 2016) will fall due after five years. Please refer to Subsidiaries, associates and joint ventures on page 128.
Receivables from
subsidiaries
Investmentsin associates
and joint ventures
6,625-41
354
06,938
1,692-283
1,355-573
067
2,258
9,196
6,25332
340
06,625
2,7114
1,115-2,162
024
1,692
8,317
1,395-1
206
-685915
0 -
- - --
0
915
1,426-6
290
-3151,395
0 -
- - - -
0
1,395
002
02
0 - - - -
- 0
2
120
17
-290
0 - - - - - 0
0
000
00
10 - - -
01
1
000
00
10 - - -
01
1
1580
13
0171
-153
41-45
01
-15
156
1490
13
-4158
-571
49-800
-15
143
Cost at 1.1.2016Foreign currency translation adjustments Additions during the yearDisposals, repayments etc. during the yearCost at 31.12.2016
Value adjustments at 1.1.2016Foreign currency translation adjustments Share of profit after tax IS
Dividends receivedDisposals during the yearOther adjustmentsValue adjustments at 31.12.2016
Carrying amount at 31.12.2016 BS
8-1
29
-531
0 0 - - 00 0
31
2300
-158
0 0 - -
0 0
0
8
(DKK million)
Cost at 1.1.2017Foreign currency translation adjustmentsAdditions during the yearDisposals, repayments etc. during the yearCost at 31.12.2017
Value adjustments at 1.1.2017Foreign currency translation adjustments Share of profit after tax IS
Dividends receivedDisposals during the yearOther adjustmentsValue adjustments at 31.12.2017
Carrying amount at 31.12.2017 BS
SECTION 10 NOTES TO PARENT FINANCIAL STATEMENTS

WILLIAM DEMANT ANNUAL REPORT 2017 125
10.9 OTHER DEBT
Staff-related liabilities include holiday pay and payroll costs due. The carrying amount of other debt matches the fair value of the debt.
Of the non-current interest-bearing debt in the amount of DKK 2,305 million (DKK 1,959 million in 2016), DKK 147 million (DKK 55 million in 2016) will fall due after five years.
10.10 CONTINGENT LIABILITIES
William Demant Holding A/S has provided security in respect of credit facilities established by Danish subsidiaries. These credit facilities totalled DKK 1,630 million in 2017 (DKK 1,635 million in 2016) of which DKK 404 million was drawn (DKK 283 million in 2016). Moreover, we have established a mutual guarantee with Oticon A/S in the amount of DKK 650 million (DKK 650 million in 2016), which is being drawn upon on a current basis.
William Demant Holding A/S has provided security in respect of rent as well as guarantees concerning the continuous oper-ation and payment of liabilities in 2017 for some of our subsidiaries.
The Parent is jointly taxed with William Demant Invest A/S, which is the administration company. Under the Danish Corpora-tion Tax Act, the Parent is liable for any obligation to withhold tax at source in respect of interest, royalties and dividends in relation to the jointly taxed enterprises.
For the purposes of section 357 of the Republic of Ireland Companies Act 2014, William Demant Holding A/S has undertaken to indemnify the creditors of its subsidiaries incorporated in the Republic of Ireland in respect of all losses and liabilities for the financial year ending on 31 December 2017 or any amended financial period incorporating the said financial year. The Company does not expect any material loss to arise from this guarantee.
2017
21
1460
23
617
2016
1 2
13 1 1
18
414
(DKK million)
Staff-related liabilitiesOther debt, public authoritiesLiabilities relating to acquisitions Other costs payableUnrealised losses on financial contractsOther debt
Due within 1 year BS
Due within 1-5 years BS
SECTION 10 NOTES TO PARENT FINANCIAL STATEMENTS
126 WILLIAM DEMANT ANNUAL REPORT 2017
10.11 RELATED PARTIES
William Demants og Hustru Ida Emilies Fond (the Oticon Foundation), Kongebakken 9, 2765 Smørum, Denmark, is the only related party with a controlling interest. Controlling interest is achieved through a combination of the Oticon Foundation’s own shareholding and the shareholding of William Demant Invest A/S for which the Oticon Foundation exercises the voting rights. Associated enterprises of William Demant Invest A/S are related parties to William Demant Holding A/S.
Related parties with significant influence are the Company’s Executive Board, Board of Directors and their related parties. Furthermore, related parties are companies in which the above persons have significant interests.
10.13 EVENTS AFTER THE BALANCE SHEET DATE
Please refer to Note 8.4 in the consolidated financial statements.
10.12 SHAREHOLDERS
The names of the shareholders listed below are recorded in the register of shareholders as owners of minimum 5% of the votes or minimum 5% of the share capital:
William Demant Invest A/S and this company’s parent, William Demants og Hustru Ida Emilies Fond (the Oticon Foundation), Kongebakken 9, 2765 Smørum, Denmark. The ownership interest is approx. 58% of the share capital (59% of the shares outstanding). William Demant Invest A/S prepares consolidated financial statements in which the William Demant Group is included.
Canada Pension Plan Investment Board, One Queen St. E., S 2500, Toronto, Canada. The ownership interest is 7.86% of the share capital.
10.14 PARENT ACCOUNTING POLICIES
The financial statements of the Parent, William Demant Holding A/S, are presented in accordance with the provisions of the Danish Financial Statements Act for class D entities.
The Parent financial statements are presented in Danish kroner (DKK), which is also the functional currency for the Parent.The accounting policies are the same as last year.
In respect of recognition and measurement, the Parent’s accounting policies are generally consistent with the Group’s ac-counting policies. The instances in which the Parent’s accounting policies deviate from those of the Group are described below.
Income statementTaxThe Parent is jointly taxed with its Danish subsidiaries and its parent, William Demant Invest A/S. Current income tax is allocated to the jointly taxed Danish companies in proportion to their taxable income.
SECTION 10 NOTES TO PARENT FINANCIAL STATEMENTS

WILLIAM DEMANT ANNUAL REPORT 2017 127
10.14 PARENT ACCOUNTING POLICIES – CONTINUED
Balance sheetGoodwillGoodwill is amortised on a straight-line basis over 20 years, which is the useful life determined on the basis of Manage-ment’s experience in respect of the individual business activities. Goodwill is written down to its recoverable amount, if lower than its carrying amount.
RightsRights acquired are amortised on a straight-line basis over their estimated useful lives and measured at cost less accu-mulated amortisation and impairment losses. The amortisation period is five years. Rights acquired are written down to their recoverable value, if lower than their carrying value.
Investments in subsidiaries and associatesInvestments in subsidiaries and associates are recognised and measured using the equity method, i.e. interests are measured at the proportionate share of the equity values of such subsidiaries and associates with the addition or de-duction of the carrying amount of goodwill and with the addition or deduction of unrealised intra-Group profits or un-realised intra-Group losses, respectively.
The Parent’s proportionate shares of profits or losses in subsidiaries and associates are recognised in the income state-ment after elimination of unrealised intra-Group profits or losses less amortisation and impairment, if any, of goodwill.
Subsidiaries and associates with negative equity values are measured at DKK 0, and any receivables from such companies are written down with the Parent’s share of the negative equity value to the extent that such receivable is considered irre-coverable. If the negative equity value exceeds the value of receivables, if any, such residual amount will be recognised under provisions to the extent that the Parent has a legal or constructive obligation to cover liabilities incurred by the par-ticular subsidiary or associate.
On distribution of profit or loss, net revaluation and net impairment losses on investments in subsidiaries and associates are transferred to reserves for net revaluation according to the equity method.
Other investmentsOn initial recognition, other investments are measured at cost. Subsequently, they are measured at fair value on the balance sheet date, and any changes in fair values are recognised in the income statement under net financial items.
ProvisionsProvisions include liabilities, which are uncertain in respect of the amount or the timing of their settlement. Provisions may include different types of liabilities, such as deferred tax liabilities, onerous contracts, pension obligations as well as provi-sions for disputes etc.
Statement of changes in equityIn compliance with the format requirements of the Danish Financial Statements Act, any items included under comprehen-sive income in the consolidated financial statements are recognised directly in equity in the Parent financial statements.
Cash flow statementIn compliance with section 84(4) of the Danish Financial Statements Act, a cash flow statement is not drawn up for the Parent, such statement being included in the consolidated cash flow statement.
SECTION 10 NOTES TO PARENT FINANCIAL STATEMENTS

128 SUBSIDIARIES, ASSOCIATES AND JOINT VENTURES
SUBSIDIARIES, ASSOCIATES AND JOINT VENTURESCompany Interest
William Demant Holding A/S Parent
Oticon A/S, Denmark* 100%
Oticon AS, Norway* 100%
Oticon AB, Sweden* 100%
Oticon GmbH, Germany 100%
Oticon S.A., Switzerland* 100%
Oticon Italia S.r.l., Italy* 100%
Oticon España S.A., Spain 100%
Oticon Polska Sp. z o.o., Poland* 100%
Oticon Limited, United Kingdom* 100%
Oticon Inc., USA 100%
Oticon Australia Pty. Ltd., Australia* 100%
Oticon Singapore Pte Ltd., Singapore* 100%
Oticon Shanghai Hearing Technology Co. Ltd., China* 100%
Oticon International Trading Shanghai Co. Ltd., China* 100%
Oticon South Africa (Pty) Ltd., South Africa* 100%
Oticon Korea Co. Ltd., Korea* 100%
Oticon Malaysia Sdn, Malaysia* 100%
Oticon Medical A/S, Denmark* 100%
Oticon Medical AB, Sweden 100%
Oticon Medical LLC, USA 100%
Audmet OY, Finland* 100%
Audmet Australia Pty. Ltd., Australia* 100%
Audmet B.V., the Netherlands* 100%
Audmet Canada LTD., Canada 100%
Audmet K.K., Japan* 100%
Audmet New Zealand Limited, New Zealand* 100%
Audmet S.r.l., Italy* 100%
Bernafon AG, Switzerland* 100%
Bernafon Hörgeräte GmbH, Germany 100%
Bernafon S.r.l., Italy* 100%
Bernafon LLC, USA 100%
Bernafon AB, Sweden* 100%
Bernafon Ibérica S.L.U., Spain* 100%
DGS Diagnostics Sp. z o.o., Poland 100%
DGS Poland Sp. z o.o., Poland 100%
Demant Technology Centre Sp. z o. o., Poland* 100%
ACS Sluchmed Sp. z o.o., Poland 100%
Acustica Sp. z o.o., Poland* 100%
Acoustic Metrology Limited, United Kingdom 100%
Akoustica Medica M EPE, Greece* 100%
Amplivox Ltd., United Kingdom 100%
Audika AB, Sweden* 100%
Audika AG, Switzerland* 100%
Audika Groupe S.A.S., France* 100%
Company Interest
Audio Seleccion S.L., Spain* 100%
BC Implants AB, Sweden* 100%
Centro Auditivo Telex Ltda., Brazil 100%
Danacom Høreapparater A/S, Denmark* 100%
Din Hørelse ApS, Denmark* 100%
Diagnostic Group LLC, USA 100%
Diatec AG, Switzerland* 100%
Diatec Diagnostics GmbH, Germany* 100%
Diatec Spain, S.L.U., Spain* 100%
e3 diagnostics Inc., USA 100%
Guymark UK Limited, United Kingdom 100%
Hear Better Centers LLC, USA 100%
HearingLife Canada Ltd., Canada* 100%
Hearing Healthcare Management LLC, USA 100%
Hearing Holding Belgium NV, Belgium* 100%
Hearing Screening Associates LLC, USA 100%
Hidden Hearing (Portugal), Unipessoal Lda., Portugal* 100%
Hidden Hearing Limited, United Kingdom 100%
Hidden Hearing Limited, Ireland* 100%
IDEA Isitme Sistemleri Sanayi ve Ticaret A.S., Turkey* 100%
Interacoustics A/S, Denmark* 100%
Interacoustics Pty. Ltd., Australia* 100%
Kuulopiiri Oy, Finland* 100%
LeDiSo Italia S.r.l., Italy* 100%
Maico Diagnostic GmbH, Germany* 100%
Maico S.r.l., Italy* 100%
MedRx Inc., USA 100%
Micromedical Technologies Inc., USA 100%
Neurelec GmbH, Germany 100%
Neurelec Maroc Sarlau, Morocco 100%
Neurelec S.A.S., France* 100%
New Zealand Audiology Limited, New Zealand* 100%
Phonic Ear A/S, Denmark* 100%
Prodition S.A.S., France* 100%
Sensory Devices Inc., USA 100%
SES Isitme Cihazlari Sanayi ve Ticaret A.S., Turkey* 100%
Sonic Innovations Inc., USA 100%
Sonic Innovations Pty Ltd., Australia 100%
Udicare S.r.l., Italy* 100%
Van Boxtel Hoorwinkels B.V., the Netherlands 100%
Your Hearing Network, Inc., USA 100%
FrontRow Calypso LLC, USA 75%
Sennheiser Communications A/S, Denmark* 50%
Dencker A/S, Denmark* 40%
HIMSA A/S, Denmark 25%
The list above includes the Group’s active companies. * Directly owned by the Parent.

WILLIAM DEMANT ANNUAL REPORT 2017

130 KAPITEL WILLIAM DEMANT ANNUAL REPORT 2017
William Demant Holding A/SKongebakken 9
2765 SmørumDenmark
Phone +45 3917 7300Fax +45 3927 8900
[email protected] no 71186911
Editing, design and production: William Demant Holding A/S