Annual Report 2017 - melroseplc.net · GKN plc on 1 February 2018, seeking to create a UK...
170
Melrose Buy Improve Sell Annual Report 2017 Melrose Industries PLC
Transcript of Annual Report 2017 - melroseplc.net · GKN plc on 1 February 2018, seeking to create a UK...

Melrose
BuyImproveSell
Ann
ual
Rep
ort
2017
Melrose Industries PLC
Melro
se Industries P
LCA
nnual Report 2017

A h
isto
ry o
f sha
reho
lder
va
lue
crea
tion
Cautionary statement
The Strategic Report and certain other sections of this Annual Report contain forward-looking statements. These statements are made by the Directors in good faith based on the information available to them up to the time of their approval of this report and such statements should be treated with caution due to the inherent uncertainties, including both economic and business risk factors, underlying any such forward-looking information. Accordingly, readers are cautioned not to place undue reliance on any such forward-looking statements. Subject to compliance with applicable laws and regulations, Melrose does not undertake any obligation to update any forward-looking statement to reflect events or circumstances after the date of this Annual Report.
The Strategic Report has been prepared solely to provide additional information to shareholders to assess the Company’s strategies and the potential for those strategies to succeed.
Some financial and other numerical data in this Annual Report and financial statements has been rounded and, as a result, the numerical figures shown as totals may vary slightly from the exact arithmetic aggregation of the figures that precede them.
Strategic Report P02Chairman’s statement 02
Chief Executive’s review 04
Market overview 06
Our strategy and business model 08
Strategy in action 10
Key performance indicators 18
Performance Review 20
Divisional review 22 Air Management 22 Security & Smart Technology 26 Ergonomics 28 Energy 30
Finance Director’s review 32
Longer-term viability statement 41
Risk management 42
Risks and uncertainties 44
Corporate Social Responsibility 50
Governance P58Governance overview 60
Board of Directors 62
Directors’ report 64
Corporate governance report 68
Audit Committee report 72
Nomination Committee report 78
Directors’ remuneration report 80
Statement of Directors’ responsibilities 91
Financials P92Independent auditor’s report to the 94 members of Melrose Industries PLC
Consolidated Income Statement 101
Consolidated Statement of Comprehensive Income 102
Consolidated Statement of Cash Flows 103
Consolidated Balance Sheet 104
Consolidated Statement of Changes in Equity 105
Notes to the financial statements 106
Company Balance Sheet for Melrose Industries PLC 145
Company Statement of Changes in Equity 145
Notes to the Company Balance Sheet 146
Glossary 152
Shareholder information P156Notice of Annual General Meeting 156
Company and shareholder information 162
Melrose Industries PLC
Acquiring good quality manufacturing businesses, making operational improvements, realising shareholder value at the appropriate time and then returning this value to shareholders continues to be the fundamentals of the “buy, improve, sell” business strategy that Melrose has followed since being founded in 2003.
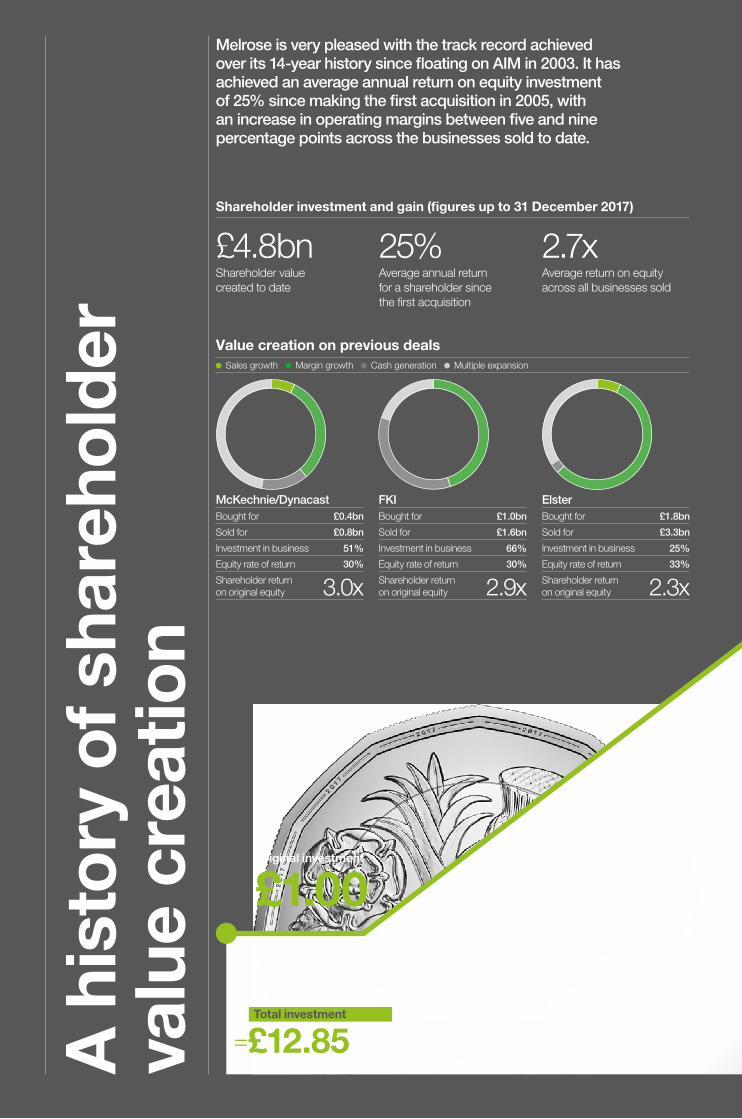
Value creation on previous deals
McKechnie/DynacastBought for £0.4bn
Sold for £0.8bn
Investment in business 51%
Equity rate of return 30%
Shareholder returnon original equity
3.0x
£1.0bn
£1.6bn
66%
30%
2.9x
£1.8bn
£3.3bn
25%
33%
2.3x
FKIBought for
Sold for
Investment in business
Equity rate of return
Shareholder returnon original equity
ElsterBought for
Sold for
Investment in business
Equity rate of return
Shareholder returnon original equity
Sales growth Margin growth Cash generation Multiple expansion
A h
isto
ry o
f sha
reho
lder
va
lue
crea
tion
Shareholder investment and gain (figures up to 31 December 2017)
25%Average annual return for a shareholder since the first acquisition
2.7xAverage return on equity across all businesses sold
£4.8bnShareholder value created to date
Melrose is very pleased with the track record achieved over its 14-year history since floating on AIM in 2003. It has achieved an average annual return on equity investment of 25% since making the first acquisition in 2005, with an increase in operating margins between five and nine percentage points across the businesses sold to date.
Original investment
£1.00+ £11.85 Additional investment in
subsequent capital raisings
Total investment
=£12.85

Melrose has substantially improved the funding levels for all the pensions schemes under its ownership.
McKechnie
FKI UK
FKI
Bridon
Brush
58%
87%
109%103%99%95%
Melrose FTSE 350
3,019%
231%
c.13xhigher TSR
24%
22%
16%15%15%(2)
18%
13%11%10%9%
Company Entry Current Exit Improvement
McKechnie +6pp>30%24%•18%
Elster +9pp>70%22%•13%
Dynacast +5pp>40%16%•11%
FKI +5pp>50%15%•10%
Nortek +6pp>60%•15%9%
Elster Nortek
+9ppts
+6ppts+6ppts
+2ppts
+1ppts
+4ppts
+1ppts
+1ppts
Responsible stewardship
Gross return
£17.30on original £1 investment
£13.24 Capital returns
+ £2.05 Ordinary dividends
+ £13.86 Market value of shares held
Total returns
=£29.15
Total shareholder returns (TSR)(1)
Underlying operating margin improvement
How Elster and Nortek operating margin improved
(1) Since Melrose IPO (October 2003).
(2) Nortek operating margin up to 31 December 2017.
Total pension scheme contributions
£307m
Investment in R&D equal to 4% of sales
over £230mR&D investment in Elster and Nortek businesses in last five years.
Returns on capex and restructuring and other commercial actions.
Central cost savings. Exit of low margin sales channels.

This year has been another demonstration of the effectiveness of the tried and tested Melrose methods. We are delighted with the performance Nortek management are achieving freed from the culture of ‘head office knows best’.
Substantial value is being created for all stakeholders with significant investment in new technology, new products and operations. Brush is adjusting to its changed market place and will emerge a stronger business as a result.
Christopher MillerChairman
Mel
rose
Ind
ustr
ies
PLC
A
nnua
l Rep
ort 2
017
01

Chairman’s statement
A history of value creation
In addition, we launched a formal offer for GKN plc on 1 February 2018, seeking to create a UK industrial powerhouse with a value in excess of £10 billion. The Board believes that GKN plc is a company in need of fundamental change to reverse its long-term underperformance. We believe GKN plc will respond to Melrose’s methods and deliver lasting results for all stakeholders.
DividendThe Board proposes to pay a final dividend of 2.8 pence per share (2016: 1.9 pence), making a total of 4.2 pence for the year (2016: 2.2 pence(3)), an increase of 91% in line with its progressive annual dividend policy. This will be paid on 21 May 2018 to those shareholders on the register at 6 April 2018 subject to approval at the Annual General Meeting (AGM) on 10 May 2018.
Board mattersAs planned, John Grant retired at the conclusion of the 2017 AGM, having made a significant contribution to Melrose’s success over the course of his ten years of service as a non-executive Director. On John’s retirement, the Chairman of the Remuneration Committee, Justin Dowley, took up the role of Senior Independent Director, with Liz Hewitt assuming the responsibilities of chairing the Audit Committee, while handing over her chairmanship of the Nomination Committee to David Lis. On 5 July 2017, Archie G. Kane was appointed to the Board as an independent non-executive Director and will be putting himself forward for election at this year’s AGM in May.
I commend them all on their appointments, further details of which are included in the Governance Report.
The search for a suitable candidate to fill the fifth independent non-executive Director position was put on hold by the Board pending the outcome of the Company’s bid for GKN plc. Your Board believes that it is
Christopher MillerChairman
I am pleased to report on our 15th set of annual results since flotation in 2003.
2017
Calendar year 20172017 has been another successful year, with Nortek undergoing the fastest transformation of any acquisition we have made to date and improving its sales performance in the second half of the year. As a result, the Melrose Group revenue for the year was £2,092.2 million (2016: £889.3 million) and, despite declaring a statutory loss before tax of £27.6 million (2016: statutory loss of £69.3 million), the underlying(1) profit before tax was £257.7 million (2016: £96.4 million).
These results reflect the record performance of the Nortek businesses, which have increased their underlying(1) operating profits by 52%(2) from last year and 67%(2) from the last full year prior to our acquisition. This performance was achieved through increasing underlying(1) operating margins to 15.2%, which is a 5.5 percentage point improvement since the start of the year. This was our original three to five-year aim at the time of acquisition and has been achieved in less than 18 months. There is more to come as investments continue at approximately double the rate of depreciation and the benefit of many of the 2017 improvements is still to be fully reflected. Melrose continues to invest in R&D and in the past five years has now expensed R&D costs equivalent to 4% of revenue within the Elster and Nortek businesses.
Unfortunately, although its Switchgear and Transformers businesses have continued to perform satisfactorily, Brush’s Turbogenerator business has not been immune to the significant structural change in its key global gas turbine market, leading to the consultation process announced earlier this month to materially re-shape this business. The Board is committed to positioning the business well for the future.
Further details of these results are contained in the Chief Executive’s and Finance Director’s reviews and I would like to thank all employees for their efforts in helping to produce this strong performance.
02M
elro
se In
dus
trie
s P
LC
Ann
ual R
epor
t 201
7
“ We rely on shareholder support for our ability to secure acquisitions where we can materially improve businesses and create value for our investors. The progress made at Nortek should give further confidence that our approach can continue to identify new opportunities even in challenging times.”
Christopher Miller, Chairman
appropriate for independent directors to be a majority of the Board and will resume this search as soon as possible.
Premium ListAs promised on completion of the acquisition of Nortek, we sought readmission to the Premium Segment of the Official List of the London Stock Exchange at the earliest opportunity and this was approved by the UK Listing Authority on 26 April 2017.
Strategy The scale and rate of success achieved by the Nortek businesses in such a short space of time demonstrates the continuing effectiveness of the Melrose model, which simplifies corporate structures and injects pace and accountability into businesses, while investing heavily for their long-term success. Whilst FKI has been a very successful acquisition, Brush is experiencing extremely difficult market conditions and your Board will continue to support the business through these times.
The Board believes that GKN plc is similarly well placed to benefit from Melrose’s management and we have invited GKN plc shareholders to accept our offer to join us in creating a UK industrial powerhouse.
OutlookAt present the majority of our businesses are based in the US, where markets are currently sound. We note some adverse headwinds from exchange rate movements, however, further improvement in our businesses building on their second half sales performance, as well as exciting acquisition opportunities, gives us confidence for 2018 and future years.
Christopher MillerChairman20 February 2018
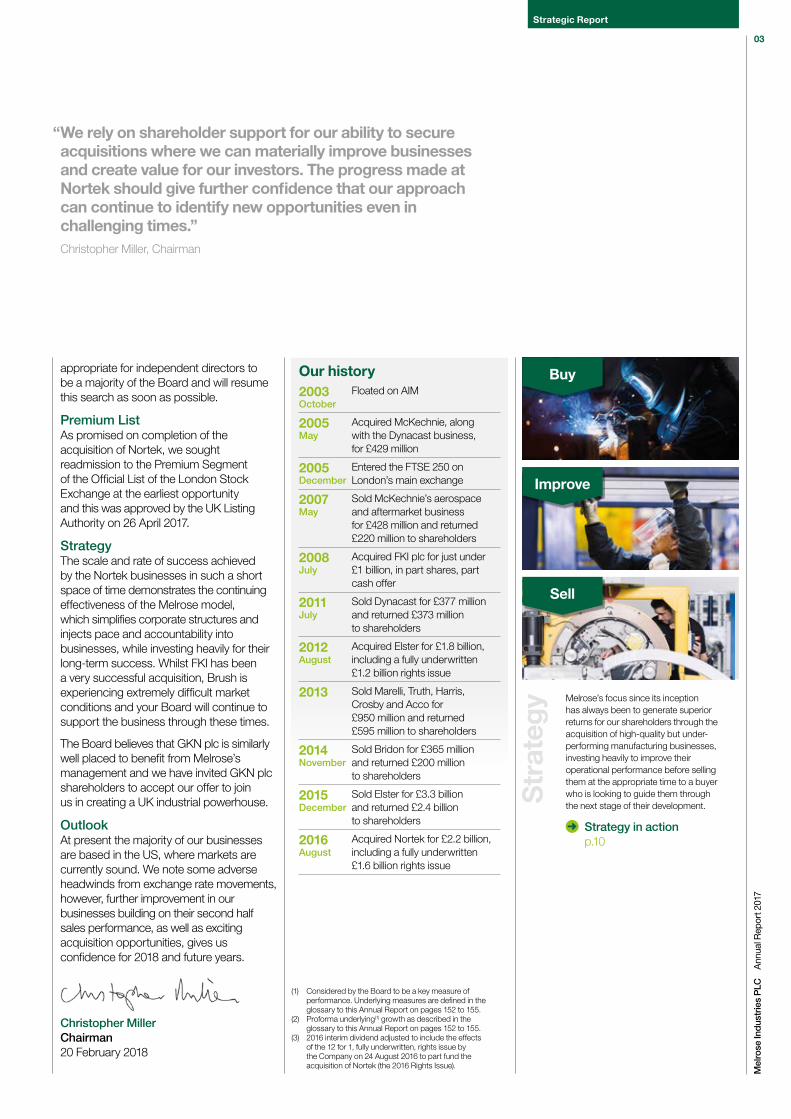
Our history2003 October
Floated on AIM
2005May
Acquired McKechnie, along with the Dynacast business, for £429 million
2005December
Entered the FTSE 250 on London’s main exchange
2007May
Sold McKechnie’s aerospace and aftermarket business for £428 million and returned £220 million to shareholders
2008July
Acquired FKI plc for just under £1 billion, in part shares, part cash offer
2011July
Sold Dynacast for £377 million and returned £373 million to shareholders
2012August
Acquired Elster for £1.8 billion, including a fully underwritten £1.2 billion rights issue
2013 Sold Marelli, Truth, Harris, Crosby and Acco for £950 million and returned £595 million to shareholders
2014November
Sold Bridon for £365 million and returned £200 million to shareholders
2015December
Sold Elster for £3.3 billion and returned £2.4 billion to shareholders
2016August
Acquired Nortek for £2.2 billion, including a fully underwritten £1.6 billion rights issue
Melrose’s focus since its inception has always been to generate superior returns for our shareholders through the acquisition of high-quality but under-performing manufacturing businesses, investing heavily to improve their operational performance before selling them at the appropriate time to a buyer who is looking to guide them through the next stage of their development.
Strategy in action p.10
Str
ateg
y
Buy
Improve
Sell
(1) Considered by the Board to be a key measure of performance. Underlying measures are defined in the glossary to this Annual Report on pages 152 to 155.
(2) Proforma underlying(1) growth as described in the glossary to this Annual Report on pages 152 to 155.
(3) 2016 interim dividend adjusted to include the effects of the 12 for 1, fully underwritten, rights issue by the Company on 24 August 2016 to part fund the acquisition of Nortek (the 2016 Rights Issue).
Strategic Report
Mel
rose
Ind
ustr
ies
PLC
A
nnua
l Rep
ort 2
017
03

52%
Improved underlying(1) operating profit of Nortek Group by 52%(2) in their first full year under Melrose ownership
Chief Executive’s review
Our strong track record
The Nortek businesses have built on a promising start under Melrose ownership to have an outstanding 2017, with improved momentum in sales coming through in the second half when sales were up 4%(2) on the second half of 2016. Freed from the restrictions of the formerly centralised group structure, operational management have improved underlying(1) operating profit by 52%(2) in their first full year and increased underlying(1) operating margins to 15.2%, being the original three to five-year aim at the time of the acquisition and an improvement of more than five percentage points. This improvement has been funded by Melrose investments equal to approximately 2x depreciation, the full benefits of which are still unfolding. The businesses have also been extremely successful in converting this strong performance into cash, with a cash conversion rate under Melrose ownership of over 100%.
At HVAC, the strengthened and refocused management team is currently upgrading the key US production facilities and has made significant investment in the R&D centre in Saskatoon, Canada. A detailed
Simon PeckhamChief Executive
The Melrose Group currently consists of four divisions, three of which were acquired with Nortek in 2016: the Air Management division, which includes the Heating, Ventilation & Air Conditioning (HVAC) and Air Quality & Home Solutions (AQH) businesses; the Security & Smart Technology (SST) division, comprising the Nortek Security & Control (NSC), Core Brands and GTO businesses; and the Ergonomics division, which comprises the Ergotron business. Energy is the fourth division and includes the Brush businesses from our FKI acquisition in 2008.
2017
(1) Considered by the Board to be a key measure of performance. Underlying performance measures are defined in the glossary to this Annual Report on pages 152 to 155.
(2) Proforma underlying growth as described in the glossary to this Annual Report on pages 152 to 155.
04M
elro
se In
dus
trie
s P
LC
Ann
ual R
epor
t 201
7

product profitability review has led not only to the exiting of approximately 12% of low margin divisional sales, but has also better informed their approach to tendering.
Free from the distraction of the loss- making European business of Best S.p.A., which was sold in July 2017, AQH is part way through optimising a previously fragmented production footprint, including a site consolidation in Canada and increased production at the Hartford, US headquarters, made possible by an ongoing £16 million upgrade investment. An in-depth product portfolio review and accelerated R&D investment has supported the continued refreshing of the product range, with a number of new product launches due in 2018.
The consolidation of NSC, Core Brands and GTO businesses under one Security & Smart Technology management team has refocused the business on profitable channels, improving the product mix to take advantage of customer changes in the market. This has been supported by significant investment in tooling for new products.
Already a high margin business on acquisition, Melrose has supported Ergotron’s expansion projects such as the growth in e-commerce and in the European and Asia Pacific markets, while restructuring its US production facility along with further development of Ergotron’s market leading ‘WorkFit’ and medical cart products.
As previously announced, due to significant structural changes to the global gas turbine market caused by worldwide environmental policy, Brush commenced consultations with employees in relation to implementing a restructuring plan for its Turbogenerator business as described in greater detail on page 31.
5.5percentage point improvement in underlying(1) operating margins at Nortek in the first full year of ownership
The Board continues to be fully committed to supporting Brush and its management team in emerging from these adverse market conditions so as to be positioned to have the best possible long-term future.
OutlookThe benefit from ongoing investment yet to fully materialise and the encouraging second half sales momentum in Nortek, balanced by the effect of exchange rates, position the Group well for 2018 and beyond, without taking future acquisition opportunities into account.
Simon PeckhamChief Executive20 February 2018
“ 2017 has been another highly successful year for Melrose, as Nortek has continued its strong performance, with improvements made across all three divisions during the year.”
Simon Peckham, Chief Executive
Strategic Report
Mel
rose
Ind
ustr
ies
PLC
A
nnua
l Rep
ort 2
017
05

Market overview
This section details the market trends and external factors affecting the growth of each of Melrose’s divisions and explores how they are responding to those trends and factors.
AQHMarket trends• The housing and remodelling market
forecasted another year of growth. Home improvement, e-commerce and digital growth is expected at 15% overall, with Amazon expecting approximately 30% growth.
• Outlook for the home improvement industry remains positive, supported by job gains and income growth, strong consumer balance sheets and favourable revolving credit usage.
• Rising home prices should continue to encourage homeowners to engage in more discretionary projects in addition to ongoing maintenance and repair spending.
• Ventilation and air quality in home construction trends continue to be an important topic to builders looking to add differentiation to their customers.
• Indoor air quality products growing rapidly in Asia.
• Increasing US codes and regulations for proper airflow and ventilation in newly built homes.
• Home building market growth and speed determined by developable land and labour market. Labour is tight in specific regions and various trades.
• Omni channel research, shopping, and purchasing forces disciplined channel strategy and market awareness.
Business response• Refocus on the North American markets.• AQH is expanding its professional
channel sales model to sell and influence decision makers and builders earlier in the purchase process.
• The appliance channel is launching a new line of hoods that will show AQH’s interchangeable features and product depth.
• There is additional focus and opportunity in private label sales.
• AQH is revitalising their brands’ websites; strategic growth investments in e-commerce channel with plans to grow double digit again in 2018 after a strong 2017.
• Omni channel shifts and strength in current professional customers requires channel and product differentiation as product launches will accelerate in second half of the 2018.
• Product development plan for 2018 will result in multiple new product launches in chimney hoods, supply fans, indoor air quality wall mounts, expanded air quality sensing, LED feature expansion and decorative designs.
Air Management
Nortek Global HVACMarket trends• The prevalence of mega trends as shown
in the diagram below, which is impacting HVAC’s customers and therefore informing its growth platforms and technological investments.
• Convergence of smart devices, artificial intelligence, virtual reality and ubiquitous data means that there will be 50 billion connected devices by 2020, high performance computing and new entrants into the space.
• Energy efficiency targets are increasing globally with a commitment on 43% reductions worldwide resulting in an increase in demand for energy efficient products.
• Two thirds of the world’s population by 2050 in cities, 90 trillion in urban investment, backlog of deferred maintenance and increase in renovations and retrofits.
• Increased demand for healthcare and understanding the importance of air quality.
Business response• Focus on providing new innovative products
and solutions that help address many of the trends related to sustainability, energy efficiency, life cycle technology costs and quality environments where people work and live.
• Diversification of portfolio of businesses in the coming years.
• HVAC’s product suite can help alleviate concerns related to energy, water, sustainability and reliability in a data centre.
• Best in class products in ensuring clean room certification and healthcare solutions.
Digitisation Convergence of smart devices, artificial intelligence, virtual reality and ubiquitous data.
Implications:• 50 billion connected devices by 2020.• Data centre infrastructure. • High performance computing. • New entrants into space.
Energy 42% energy use in buildings, 53% increase in demand by 2035, optimisation.
Implications:• Power and water usage effectiveness
performance data centre.• Energy efficient products. • Control and optimisation. • Innovation and speed.
Legislative ®ulatory
Targets are increasing globally, commitment on 43% reductions worldwide, increased carbon emissions and infections in healthcare.
Implications:• Standards driving product performance
and design, energy related products and seasonal energy efficiency.
• Requirements by governments.• Healthcare design and infection control technologies.
Demographics Surging middle class and an ageing world, transition from baby boomers to millennials, changing racial demographics.
Implications:• Increased demand for productivity, comfort,
and efficiency (work, home, play).• Shifting demands in customers and channel,
especially in cities.• Talent and workforce shortage.• Impact on Healthcare and Cleansuite.
Urbanisation 2/3 of population by 2050 in cities, 90 trillion in urban investment, backlog of deferred maintenance and increase in renovations & retrofits.
Implications:• Opportunity to drive retrofit business
and services.• New innovative products.• New competitors and business models. • Channel expansion.
Market mega trends
06M
elro
se In
dus
trie
s P
LC
Ann
ual R
epor
t 201
7

Ergonomics Energy Security & Smart Technology
Market trends• Dynamic market, with rapidly advancing
technologies, new services entrants, growth in new business models and growing global demand.
• Growth in internet of things (IoT) products and technologies have required traditional security services to broaden their appeal from strictly professional options to new DIY options.
• Technology continues to shift towards video and audio technology solutions (including voice control) as well as strong preferences for analytics to be more proactive.
• Cloud-based software platforms are growing in importance as mobile-based user applications dominate user requirements for control, security and monitoring.
• Growing demand for cyber security reflected in encrypted devices.
• Growth of telecommunication, cable companies and consumer technology companies entering the business and offering lower cost options for traditional video and audio content management.
• Software becoming a primary technological requirement.
Business response• The business is transforming its
engineering base from predominantly hardware to integrated solutions with both hardware and software.
• Focused attention on developing more intellectual property to strengthen its position in the market.
• Restructuring of product management and engineering organisations to add more software capabilities and leverage IoT technologies across the business providing its customers with more services. Increased capabilities in security, safety, control, automation and audio & video management.
• The business has begun partnering with companies that have analytics that can be used to improve its software platform as well as launched encrypted sensors that address the concern for better security.
• Restructure of international product management and sales efforts through the combination of the businesses to provide greater focus and speed for international sales opportunities.
Market trends• Relevant market segments are
underpinned by strong technology and wellness trends.
• Electronic medical records are well established in the US and many other countries.
• Digital learning in education and corporate wellness initiatives drive the need for sit-stand workstations, student desks, and laptop charging carts.
• Preparatory design is a rapidly growing market as large healthcare and electronic device manufacturers seek to consolidate into global design and manufacturing partners.
Business response• Migration from strength in the healthcare
cart market to product development in adjacent spaces such as mobile device solutions and medication delivery.
• Development of superior ergonomic solutions for the sit-stand workstation market and also driving e-commerce sales and expanding into the furniture channel.
• Facilities in both China and the US provide the flexibility to build charging carts cost-efficiently.
• Build on key strength in medical cart sector with an aggressive sales initiative delivering a strong order pipeline.
• Development of a digital marketing campaign and launch of e-commerce website to drive brand awareness.
• Leverage strengths and features from previous offering to enhance broader spectrum of product.
Market trends• Renewables are forecast to account for
almost two thirds of the overall growth in the installed generation capacity to 2040.
• Demand for gas fired electricity generation impacted by strong growth in the renewable energy sector, which has significantly impacted the gas turbine market with orders running more than 60% below the peak level of 2011.
• Correlation between economic growth and energy consumption weakening due to greater environmental awareness, energy conservation and efficiency improvements.
• Low prices/high supply of oil in recent years have led to the cancellation and/or deferral of many investment projects and activity in the available oil and gas sector.
• Excess production capacity leading to integrated customers in-sourcing generator manufacturing.
• For Switchgear and Transformers, electrification in developing markets, increased investment in rail and tram infrastructure and regulatory strategies favouring asset upgrade over replacement, present growth opportunities.
Business response• Intention to concentrate European
turbogenerator manufacturing activity in Plzen (Czech Republic) and the closure of generator manufacturing activity in both Loughborough (UK) and Ridderkerk (Netherlands).
• Organisational changes implemented to support geographic expansion in both the Switchgear and Transformers businesses and the Aftermarket organisation were realigned to take advantage of potential asset extension or upgrade opportunities in all businesses.
• Brush continues to invest in product development across all of its businesses enabling it to launch several innovative new products in Generators, Switchgear & HGI during 2018.
• Product enhancements are ongoing to broaden Brush’s product offering to support rail switchgear asset upgrade.
Strategic Report
Mel
rose
Ind
ustr
ies
PLC
A
nnua
l Rep
ort 2
017
07

39%
100%Equity raisedto acquirebusinesses
Our strategy and business model
Our aim Melrose aims to acquire high-quality manufacturing businesses with strong fundamentals and the potential for significant development and improvement under Melrose management.
Our objective Through investing in businesses, changing management focus and operational improvements, Melrose seeks to increase and realise the value in such businesses at the appropriate time and to return the proceeds to shareholders.
Our
bus
ines
s m
odel
Our
str
ateg
y
Buy
• Good manufacturing businesses whose performance can be improved.
• Use low (public market) leverage.
• Melrose management are substantial equity investors.
• Free management from bureaucratic central structures.
• Change management focus, incentivise well.
• Set strategy and targets and sign off investments.
• Drive operational improvements.
• Invest in the business.
• Focus on profitability and operating cash generation – not growth for the sake of growth.
Businesses under improvementInputs
Industry expertise
Highly experienced management team
Strong track record
Operational efficiency
Effective governance
Investment into the businesses
Further investment in the businesses to improve operations(1)
Value creation model
Reinvestment Sales growthGood demand drivers potentially suggest more than average top line growth.
Margin growthGood manufacturing businesses whose previous potential was constrained by leverage.
Improve
08M
elro
se In
dus
trie
s P
LC
Ann
ual R
epor
t 201
7

Selling for a higher multiple than paid 32%
Cash generation 16%
Sales growth 4%
Margin growth 48%
(1) In respect of the McKechnie, Dynacast,FKI and Elster acquisitions.
OutputsValue creation
Value creation model
Cash generationCash flows have been significantly improved.
Multiple expansionMultiple expansion is never assumed, but has been achieved on all previous deals (on average +30%) as the businesses have been improved.
How has Melrose created value?(1) Shareholder investment and gain (figures up to 31 December 2017):
Average annual return since first acquisition
25%Average return on equity across all businesses sold
2.7xShareholder value created to date
£4.8bn
Sell
• Commercially choose the right time to sell, often between 3-5 years but flexible.
• Return value to shareholders from significant disposals.
The Melrose philosophyThe improvements made by Melrose vary depending on the needs of the business but the common theme for all businesses is the implementation of the Melrose philosophy:
1 2 3 4 5Giving ownership to the divisions.
Appropriately incentivising the management teams.
Freeing businesses from central bureaucracy.
Quick decision making.
Ready access to funds for capital expenditure, R&D and expansion projects.
Air Management HVAC p.10 AQH p.12
Security & Smart Technology p.14
Ergonomics p.16
Energy p.17
ReinvestmentInvestment in research and development in last five years
£230m equal to 4% of sales
Capital expenditure in last five years
£250m
Strategic Report
Mel
rose
Ind
ustr
ies
PLC
A
nnua
l Rep
ort 2
017
09

Strategy in action
Improve
Air Management
Each of the HVAC and AQH businesses had been impacted by the capital constraints of Nortek, Inc. prior to acquisition by Melrose. This had restricted investment and resulted in a loss of focus without coherent business strategies.
£21mcapital investment into the production facilities
HVAC
In addition to the underinvestment, Melrose inherited a business split between two management teams, overseeing operations that were further fragmented, as a result of a lack of integration following previous acquisitions. Despite some strong brands, the business lacked direction and vision for the future.Melrose immediately consolidated the Nortek Air Solutions (NAS), Residential and Light Commercial businesses under one management team in St Louis, Missouri, closing duplicate sites and administrative functions. Further work was required to overcome the localised fragmentation. A targeted £21m capital investment into the production facilities, warehousing systems and quality management processes reinforced a fundamental culture change which was made possible by clarity of strategy and improved financial visibility.
A significant R&D investment was made in the technology centre in Saskatoon, Canada, which unlocked a breakthrough in the data centre climate management sector and put the business at the heart of major customer development plans.
10M
elro
se In
dus
trie
s P
LC
Ann
ual R
epor
t 201
7

Strategic Report
Mel
rose
Ind
ustr
ies
PLC
A
nnua
l Rep
ort 2
017
11

Strategy in action
Improve12
Mel
rose
Ind
ustr
ies
PLC
A
nnua
l Rep
ort 2
017

AQHAQH had market leading brands but was steadily losing market share as the underinvestment had made it slow and unresponsive, resulting in poor customer service and a tired product range.
The Melrose strategy review with management highlighted that the business needed to refocus on its core strengths, rationalise its production footprint and invest heavily in three main areas: production to drive efficiency; productivity and quality; and new product development to regain initiative with customers and improve customer service.
The first step was to change the culture through fresh leadership and a new CEO with relevant large retail customer experience. Having freed the business from the distraction of the Nortek head office, Melrose also sold AQH’s loss-making European business Best S.p.A. to ensure focus remained on its core North American markets.
AQH then set about optimising its production footprint. This included a £5.6m site consolidation in Canada and a £16m capital investment at their Hartford headquarters focusing on improvements in productivity, efficiency and quality measures and increasing automation, which included the consolidation of US warehousing and distribution into the Hartford headquarters.
This is addressing the issue of inconsistent customer service and having a positive effect on AQH’s ‘On Time and Complete’ delivery rates. Investment in new product development has increased the rate of refreshment of the product offering and the launch of the Alliance range is the largest in ten years, and the start of the new pipeline.
£16mcapital investment in the manufacturing and warehousing facilities at their Hartford headquarters
Strategic Report
Mel
rose
Ind
ustr
ies
PLC
A
nnua
l Rep
ort 2
017
13

Strategy in action
Improve
Security & Smart Technology
Previous indecision at Nortek corporate level had meant the NSC, Core Brands and GTO businesses were separated prior to our acquisition and lacked scale. Although the business had good technology, it was saddled with duplicative costs and in the case of GTO, distracted by material legal action, meaning the division was disjointed and underperforming.
With a high degree of cross over in markets, platforms and customers, each of the businesses had significant contributions to make to the others, together with significant associated back office consolidation savings.
Melrose consolidated all three businesses under one management team, which is currently moving to a new headquarters in Carlsbad, California. This move involves a capital investment to upgrade the divisional R&D capabilities, as well as investing significantly in new product development. Non core and underperforming parts of the business were closed and the warehousing was consolidated as control was handed back to the divisions, resulting in $4m of cost savings, which improved flow and customer service. Significant operational improvements were implemented in the Asian production facility including LEAN and Kaizan projects, enabling the reversal of previous production outsourcing decisions.
Finally, the product development pipeline received heavy investment to differentiate itself alongside significant customer change as well as leverage premium features across the different product platforms.
14M
elro
se In
dus
trie
s P
LC
Ann
ual R
epor
t 201
7

£4.5minvested in software and hardware product development for new panel and accessory launches
Strategic Report
Mel
rose
Ind
ustr
ies
PLC
A
nnua
l Rep
ort 2
017
15

Strategy in action
Improve
£4mTooling investment commitment to enhance their product portfolio
Ergonomics
Although already a high margin business on acquisition, and well regarded in the previous Nortek structure, Ergotron had nonetheless suffered from the same capital constraints as the other Nortek businesses. Therefore, the Ergotron improvement plan, which was different from the other Nortek businesses, focused on supporting the expansion and leverage of their premier product range, including a £4 million tooling investment commitment to enhance their portfolio. Despite some initial teething problems relating to the decentralisation, the business is already seeing the benefits of our investment in e-commerce and their digital platform, as well as the growth of the European and Asia Pacific markets.
16M
elro
se In
dus
trie
s P
LC
Ann
ual R
epor
t 201
7

Energy
Brush is a high-quality turbogenerator, switchgear, transformer and aftermarket business. It has been a part of the Melrose Group for almost ten years and has received significant investment in R&D, site expansion, new product development and operational improvements during that time to ensure it was well placed to serve its markets.
Unfortunately, the most important of those markets – the global gas turbine market – has suffered a severe structural change due to the rise in renewables. Demand for gas turbines has fallen over 60% from the peak levels in 2011 and this has been reflected in a similar fall in turbogenerator volumes.
As a result, and as announced on 1 February 2018, Brush has commenced employee consultations in relation to the restructuring at the turbogenerator production sites in the UK and Netherlands. Once this restructuring is complete Brush will have a well invested 2-pole and 4-pole turbogenerator production facility in Plzen , Czech Republic, well equipped to cope with any increased OEM demand and complemented by aftermarket facilities in the US, UK and Europe. Brush is also investing in the next generation of its product ranges across the business, with the uprated turbogenerator trailer set being qualified this year and the Quantum switchgear range providing a major upgrade on its Eclipse project.
Strategy in action
Reshape
Strategic Report
Mel
rose
Ind
ustr
ies
PLC
A
nnua
l Rep
ort 2
017
17

Key performance indicators
In order to support the Group’s strategy and to monitor performance, the Board uses a number of financial and non-financial key performance indicators (KPIs). Details of a selection of the KPIs are shown here. Additional business level KPIs are also used, which are relevant to their particular circumstances.
Non
-fina
ncia
l KP
IsFi
nanc
ial K
PIs Underlying(1) diluted
earnings per share
9.8p 3.2p(2)
9.8p
4.4p (proforma(3) 6.4p)
2015
2017
2016
Method of calculationGroup underlying(1) profit after tax, attributable to owners of the parent of businesses in existence during the year ended 31 December 2017, divided by the related diluted number of shares in issue.
Strategic objectiveTo create consistent and long-term value for shareholders.
Underlying(1) operating profit
£278.4m £24.8m
£278.4m
£104.1m (proforma(3) £188.0m)
2015
2016
2017
Method of calculationUnderlying(1) operating profit for the businesses in existence during the year ended 31 December 2017.
Strategic objectiveTo improve profitability of Group operations.
Net debt to underlying(1) EBITDA(4)
1.9x2015
1.9x
1.9x2016
n/a(5)
2017
Method of calculationNet debt at average exchange rates divided by underlying(1) EBITDA(4) for existing businesses at each year end.
Strategic objectiveTo ensure the Group has suitable amounts of debt and remains within its banking covenants.
Health and safety
Method of calculationA variety of different health and safety KPIs are used by the businesses owned by the Group from time to time, which are specific to the exact nature of the business and its associated risks.
Strategic objectiveThe Company has an objective to stop all preventable accidents.
Performance The Group’s current businesses measure three key health and safety KPIs:
Major accident frequency rate:
Records the number of lost time accidents that have resulted in more than three days off work (defined as ‘major’ accidents), per 200,000 hours worked:
0.7
1.5
0.8
2015
2016
2017
Accident frequency rate:
Records the number of all lost time accidents, both major and minor, per 200,000 hours worked:
1.9
1.3
2.2
2015
2016
2017
Accident severity rate:
Records the average number of days an employee takes off work following an accident at work:
18.5
16.1
22.5
2015
2016
2017
The Nortek businesses currently account for almost 90% of the Melrose Group and were acquired in August 2016. Therefore, the KPIs for 2015 and most of 2016 relate to a period when the businesses were not owned by Melrose, but the figures have been included for comparison purposes.
18M
elro
se In
dus
trie
s P
LC
Ann
ual R
epor
t 201
7

Underlying(1) profit conversion to cash percentage
95% 65%
95%
123%
2015
2016
2017
Method of calculationPercentage of underlying(1)
EBITDA(4) conversion to cash for businesses in existence during the year ended 31 December 2017, pre capital expenditure.
Strategic objectiveTo ensure businesses are suitably cash generative in order to have adequate cash reserves for the effective running of the Group and for significant capital investment where required.
Underlying(1) operating profit margin
13.3% 9.5%
13.3%
11.7% (proforma(3) 9.1%)
2015
2016
2017
Method of calculationUnderlying(1) operating profit as a percentage of revenue, for the businesses in existence during the year ended 31 December 2017.
Strategic objectiveTo improve profitability of Group operations.
Interest cover
19.6x 15.3x
19.6x
20.7x
2015
2016
2017
Method of calculationUnderlying(1) EBITDA(4) as a multiple of interest payable on bank loans and overdrafts for the Group during each year.
Strategic objectiveTo ensure the Group has sufficient profitability to meet the interest cost of debt and remain within its banking covenants.
Final dividend per share
2.8p 0.5p(2)
2.8p
1.9p
2015
2016
2017
Method of calculationAmount declared as payable by way of dividends in terms of pence per share.
Strategic objectiveTo operate a progressive dividend policy whenever the financial position of the Company, in the opinion of the Board, justifies the payment.
For discussions on the dividend policy going forward, please refer to the Chairman’s statement on page 2.
The figures demonstrate a decrease in 2017, principally due to investment in health and safety initiatives at the Nortek businesses. On joining the Melrose Group in 2016 a full review was conducted and improvements implemented, and health and safety remains a key focus for the businesses.
Further information in relation to the various health and safety initiatives undertaken by the Group’s businesses during 2017 can be found within the Corporate Social Responsibility Report on pages 50 to 57.
Environment and energy usage
Method of calculationDue to the decentralised nature of the Group and differing operations of businesses which the Company may acquire, there are no standardised environmental KPIs used throughout the Group. A range of environmental measures are utilised, including energy consumption, CO2 emissions, water consumption, water contamination, waste disposal, solid and liquid waste generation, recycling and volatile organic compound emissions.
Strategic objectiveMelrose fully understands the importance of the Group’s environmental responsibilities and is committed to ensuring that operations have a minimum possible adverse effect on the environment.
Performance Information in relation to the various environmental initiatives undertaken by the Group’s business divisions during 2017 can be found within the Corporate Social Responsibility Report on pages 54 to 55. The Group is required to disclose greenhouse gas emissions data for the year ended 31 December 2017. Such data can be found within the Corporate Social Responsibility Report on page 55.
Other non-financial KPIs
Due to the diverse nature of the Group, each business acquired by the Group uses a range of its own specific non-financial KPIs, which are used to drive business performance and assist in managing risk. This helps to ensure that the KPIs used are relevant to each business and take into account specific operational and reporting requirements. Such KPIs cover operational, quality, commercial and human resource measures. Further information regarding some of the Group’s recent initiatives can be found within the Corporate Social Responsibility Report on pages 50 to 57.
Risk management p.42
Risks and uncertainties p.44
(1) Considered by the Board to be a key measure of performance. A reconciliation of statutory profit/(loss) to underlying profit is given in the Finance Director’s review on page 32.(2) 2015 has been adjusted by a bonus factor of 18.8% related to the Rights Issue completed in August 2016.(3) Assuming a full year’s ownership of Nortek in 2016, as explained in the Finance Director’s review.(4) Underlying(1) operating profit before depreciation, and amortisation of computer software and development costs.(5) All external debt had been repaid at 31 December 2015.
Strategic Report
Mel
rose
Ind
ustr
ies
PLC
A
nnua
l Rep
ort 2
017
19

Performance ReviewDivisional review 22 Air Management 22 Security & Smart Technology 26 Ergonomics 28 Energy 30
Finance Director’s review 32
Longer-term viability statement 41
Risk management 42
Risks and uncertainties 44
Corporate Social Responsibility 50
Melrose is not a passive investor in the businesses it acquires. The leadership team has a hands-on relationship with each acquired business and work closely with them to develop long-term strategic plans, as well as having regular input on restructuring decisions, capital expenditure and working capital management.
20M
elro
se In
dus
trie
s P
LC
Ann
ual R
epor
t 201
7

Per
form
ance
R
evie
w
Strategic Report
21
Mel
rose
Ind
ustr
ies
PLC
A
nnua
l Rep
ort 2
017

Divisional review
Air
Man
agem
ent
22M
elro
se In
dus
trie
s P
LC
Ann
ual R
epor
t 201
7

Proportion of total revenue
56%
HVACwww.nortekair.com
The Air Management division is the largest in the Melrose Group. It comprises the HVAC business based in St. Louis, Missouri and AQH, headquartered in Hartford, Wisconsin.
Consolidation of the NAS, Residential and Light Commercial businesses under one HVAC management team has removed unnecessary complexity in its business structure, product portfolios and cost base.
This has freed the business up to make investments of more than £12 million across its NAS manufacturing base which enabled HVAC to increase the capacity of its clean room, premium air handler and healthcare operating room production capabilities, as well as upgrade to next generation plant and equipment and expand its two Canadian plants. HVAC also invested £9 million in new machinery and updated technologies for its Residential and Light Commercial facilities to drive utilisation and quality improvements.
These investments have been bolstered by the implementation of Value Analysis/Value Engineering (VAVE), LEAN, ISO and other quality processes in the facilities to drive process and manufacturing, quality, productivity and accountability. A warehouse management system (Design for Manufacturing Assembly and Quality) and operational finance and costing tools have provided better visibility on its sales pipeline, logistics and costings.
In addition, inventory efficiency drives and supply chain initiatives to improve working capital have been very successful. There have also been significant improvements in safety and quality, with recordable injury rate and warranty costs falling by 47% and 20% respectively in 2017, with continued improvement expected.
2017 also heralded a refocus by the businesses on customers to materially improve service levels, including in one instance a 44% improvement in on-time delivery rates and the launch of a new account management programme. This will enable the business and customers alike to benefit from access to combined manufacturing capabilities, new product pipelines, expanded engineering support and distinctive innovation roadmaps, thereby addressing the market need for smart, energy efficient and sustainable solutions for buildings, homes and cities, and creating opportunities for customers to cross-sell multiple products.
This refocus on customers also involved a comprehensive technology roadmap and product profitability review, resulting in the exit of 12% of low margin divisional sales and enabling HVAC to make material and targeted investments in product development and innovation. This included funding the expansion of the CLEANSUITE® product family, expansion and new breakthrough technologies in data centre cooling and high-performance computing, expanding and updating the Residential product portfolio and leveraging sales synergies between its Light Commercial and NAS product lines.
The key to this transformation has been a change in culture throughout the business to reinforce employee engagement, involvement and ownership, and provide the foundation for the next stage of improvements in 2018 and beyond.
OutlookHaving invested heavily to improve performance and overcome operational issues and complexity while unifying the culture, HVAC has progressed from transforming the businesses to driving profitable growth. In 2018, the business will seek to capitalise on its distinctive capabilities and strong market positions to continue to grow and improve.
Strategic Report
23
Mel
rose
Ind
ustr
ies
PLC
A
nnua
l Rep
ort 2
017

Divisional reviewContinued
£16mcapital investment in the manufacturing and warehousing facilities at their Hartford headquarters
Air Quality & Home Solutionswww.broan-nutone.com
AQH is a leading manufacturer of ventilation products for the professional remodelling and replacement market, residential new construction market and DIY market.
It supplies to distributors and dealers of electrical and lighting products, kitchen and bathroom dealers, retail home centres and private label customers from its four manufacturing locations around the world. AQH enjoys a leading market share and installed base in US residential ventilation fans and range hoods.
AQH had a very productive 2017 as it reversed a recent history of underinvestment to address a number of operational challenges. Supported by significant Melrose investment, the business undertook a number of operational improvement projects, including a £16 million upgrade to the production facility at its headquarters in Hartford, Wisconsin, a consolidation of its Canadian footprint and US warehousing, and substantial automation, efficiency and quality improvement programmes.
New technology, product launches and promotions by competitors had previously taken advantage and chipped away at AQH’s strong market presence. The appointment of a new CEO with substantial large retail customer experience is reversing this trend through production upgrades, improved channel strategy, a refresh of the new product development schedule and a refocus of the management team on core product categories.
AQH has developed a robust product development pipeline to strengthen its leadership position in North America. It also completed the launch of the Alliance range hood platform in 2017, which was the largest new product initiative in over ten years and demonstrates their interchangeable features and product depth.
With the loss-making European business of Best S.p.A. being sold in July, the business refocused its attention on its North American markets. The business is also expanding its professional channel sales model to sell and influence decision makers and builders earlier in the purchase process. The retail business continues to be competitive and will receive investment in further innovation, programming and promotions during 2018.
OutlookAQH is in the midst of a fundamental improvement to its operational capabilities, restructuring its product offering, materially improving its service levels and revitalising its brand presence. These ongoing improvements, the strength of professional customer relationships and the acceleration of new product launches in the second half of 2018, means the business is well positioned for further improvement this year.
24M
elro
se In
dus
trie
s P
LC
Ann
ual R
epor
t 201
7

Strategic Report
25
Mel
rose
Ind
ustr
ies
PLC
A
nnua
l Rep
ort 2
017

Sec
urit
y &
Sm
art
Tech
nolo
gy
Divisional reviewContinued
26M
elro
se In
dus
trie
s P
LC
Ann
ual R
epor
t 201
7

Proportion of total revenue
21%
®
The SST division comprises the Nortek Security and Control, Core Brands and GTO Access Systems (GTO) businesses. The decision was taken to consolidate these businesses under one management team, which is due to move into its brand new integrated office in Carlsbad, California in April 2018.
SST is one of the world’s leading developers and manufacturers of security, home automation and access control technologies for the residential and commercial markets, together with audio visual equipment for the residential audio video and professional video markets. It has expertise in the design and manufacture of wireless connectivity devices and strong brand presence in professional security, integrator and custom installer channels as well as relationships with top resellers.
The division operates in a rapidly evolving market in which consumers are increasingly demanding greater focus on software and connectivity from manufacturers and their service provider partners, as they embrace the possibilities of the IoT. In response, under Melrose ownership, the division has improved and accelerated its product development processes to increase speed to market and service options for partners, as well as improving its operating efficiency to eliminate complexity and lower overall costs.
SST is utilising its increased R&D investment and consolidating its engineering and product development capabilities to enable increased leverage of software and hardware product platforms, thereby increasing speed to market and overall flexibility. This is ensuring it gains the maximum benefit for its increased R&D investment.
The division has launched a number of new, good margin, high technology additions to its product range, including the 2GIG® Vario Hybrid Security System which adds wireless connectivity to a hardwired security and home control solution, as well as the 2GIG® Rely DIY panel which allows service providers to enter the renters market. It has invested in the next generation smart garage door and gate operators equipped with full inter-connectivity, as well as additions to its premium ELAN home control system, which streamlines management of lighting, security, audio, video and other aspects of the connected home to a single device.
In addition to improved product development, SST continued a controlled expansion of its international sales structure through entry into strategic arrangements with key partners in Europe, the Middle East and Latin America.
In addition to the integration of the three businesses, which allowed the division to leverage its management, systems and engineering capabilities, SST continues a strong focus on efficiency programmes, such as factory investment and improvements, the restructure of distribution and logistics arrangements, and efforts to reduce product costs through improvements in its supply chain management.
OutlookThe controlled broadening of its product offering into the smart ecosystem and sensor markets has allowed SST to explore the possibilities in the growing IoT market, which is linked to its traditional security business. We expect this trend to continue in 2018 and, following the consolidation, the division has a clear strategy that means it is well positioned to take advantage of these changing market developments.
Security & Smart Technologywww.nortekcontrol.com www.corebrands.com www.gtoaccess.com
Strategic Report
27
Mel
rose
Ind
ustr
ies
PLC
A
nnua
l Rep
ort 2
017

Erg
onom
ics
Divisional reviewContinued
28M
elro
se In
dus
trie
s P
LC
Ann
ual R
epor
t 201
7

Proportion of total revenue
13%
The Ergonomics division comprises Ergotron, a leading manufacturer and distributor of innovative ergonomic technology workstations including wall mounts, carts, arms and stands, headquartered in Minneapolis, US. The business is organised into three segments: Commercial, Original Design and Manufacture (ODM), and Consumer.
Ergotron’s Commercial business is a top global manufacturer of products such as electronic medical records carts and workstations for hospitals, sit-stand desks and technology charging carts for education, and ergonomic arms and sit-stand desks for corporate offices. The ODM business manufactures ergonomic and charging products for top technology industry brands and is an emerging leader in healthcare equipment carts for ultrasound and other specialty healthcare applications. The Consumer business sells ergonomic equipment through retail channels under the brands OmniMount and Ergotronhome.
Ergotron retains a strong market position in most of its key markets due to expertise in the design and manufacture of ergonomic technology workstations and computer mounts, utilising its Constant Force counterbalance technology. A strong supply chain enables Ergotron to leverage component suppliers from the global computer industry, producing high-quality, affordable products.
The 2017 results were impacted by a disrupted transition to a new warehousing partner in the US. This issue has been resolved and the 2018 outlook is strong. Competitive pressures in the sit-stand desk market impacted growth in Ergotron’s premier WorkFit brand, while healthcare and OmniMount remained robust, and its ODM new business revenue continued to grow. Continual refreshment of the product portfolio remains the key to maintaining the business’s market-leading position. Melrose has supported its expansion projects with approximately $1 million of additional revenue expenditure as it looks to build momentum in e-commerce with a new online portal, as well as to pursue markets in Europe and Asia Pacific.
The drop in profits in 2017 is mostly as a result of a one-off credit relating to a legal settlement received prior to our ownership in 2016.
OutlookWith the 2017 operational issues resolved, Ergotron expects its core businesses to perform well in 2018. Several key business growth initiatives are in place that will contribute revenue in 2018, including a recently launched e-commerce site, an expanded European sales team, and expansion into the office furniture dealer channel. New product development is accelerating focus on an expanded product portfolio in healthcare, sit-stand desks, and OfficePro, a brand focused on the office dealer channel, and the business is positive in its outlook for 2018.
Ergonomicswww.ergotron.com
Strategic Report
29
Mel
rose
Ind
ustr
ies
PLC
A
nnua
l Rep
ort 2
017

Ene
rgy
Divisional reviewContinued
30M
elro
se In
dus
trie
s P
LC
Ann
ual R
epor
t 201
7

Proportion of total revenue
10%
The Energy division comprises: Brush Turbogenerators (Generators), which manufactures electricity generating equipment for gas turbines; Brush Transformers (Transformers), which designs and manufactures systems and power transformers; Hawker Siddeley Switchgear (Switchgear), a medium voltage AC switchgear and low voltage DC switchgear manufacturer; Harrington Generators International Limited (HGI), a specialist UK-based small generator manufacturer; and Brush Aftermarket (Aftermarket), which provides comprehensive support for customers throughout the manufactured product’s life.
Brush’s Generator business supplies the global gas turbine market, which had enjoyed a long period of growth. This was predicted to continue and, as a result, the business received significant investment under Melrose ownership, including the acquisition of the US aftermarket business Generator & Motor Services for £8 million in 2010 and its subsequent expansion to install a £6 million balancing pit, construction of the new £30 million turbogenerator factory in Changshu, China, the over £11 million upgrade of plant and equipment at the Loughborough facility and a further £7 million in its Plzen , Czech Republic site.
Unfortunately, the fossil power generation market experienced large scale disruption in a very short timescale. The growth of renewables has caused a substantial structural change that significantly impacted the gas turbine market, with orders falling more than 60% from the peak levels in 2011. This caused a 43% reduction in Generator’s unit sales in 2017 alone.
Alongside certain mitigating actions taken during 2017, Brush conducted a full review of the Generator business. This culminated in the announcement on 1 February 2018 of Brush’s intention to restructure its Generator production footprint, impacting the sites in Ridderkerk, Netherlands and Loughborough, UK. Brush has already closed its Changshu, China site just prior to year end. This restructure is aimed at reshaping Generators in light of the reduced generator volumes and ensuring it is well positioned for the future. The cash cost of these restructuring items is estimated to be £40 million and is expected to be materially complete by the end of 2018. These actions are expected to mitigate the current £12 million annual losses of the Turbogenerators business and align it to the new market conditions.
The Transformers and Switchgear businesses have performed satisfactorily. Brush has continued to invest in product development across all of its businesses putting it in a position to launch several innovative products in Generators and Switchgear during 2018, such as the new generation turbogenerator trailer set and the Quantum switchgear.
OutlookGlobal economic prospects remain uncertain in Brush’s main markets and we expect the underlying trading environment in 2018 to remain very challenging for Generators. There is some optimism for Aftermarket performance in 2018 and Switchgear and Transformers should benefit from the launch of new products and geographic market expansion. However, this is not expected to result in material upside for the business in the short-term.
Despite the challenges, Brush is taking the difficult but necessary action to structurally reduce its cost base and position the business to the new market realities. Brush remains a strong business and these actions will simplify the structure and increase flexibility and responsiveness to the market, positioning the business for 2019 and beyond.
Energywww.brush.eu
Strategic Report
31
Mel
rose
Ind
ustr
ies
PLC
A
nnua
l Rep
ort 2
017

Mel
rose
Ind
ustr
ies
PLC
A
nnua
l Rep
ort 2
017
Finance Director’s review
The statutory IFRS results, which are shown unadjusted on the face of the Income Statement, are presented below. The underlying results, which are used as an Alternative Performance Measure (APM) as described by the European Securities and Markets Authority (ESMA), are shown below the unadjusted statutory results and are described in more detail in the glossary to this Annual Report on pages 152 to 155. Lastly, to improve year-on-year comparability, a proforma measure is calculated, which presents the prior year, on a constant currency basis, as if Nortek had been owned for the full year. All three of these measures are discussed in this review and their definitions are explained in the glossary to this Annual Report.
Melrose Group segmental splitThe Melrose Group at 31 December 2017 consisted of four divisions, the Energy division, along with three divisions within Nortek, namely: the Air Management division, which contains both the Air Quality & Home Solutions (AQH) business and the Heating, Ventilation & Air Conditioning (HVAC) business; the Security & Smart Technology (SST) division; and the Ergonomics division.
Statutory resultsThe Income Statement shows the unadjusted statutory results of the Group.
The statutory results for the year ended 31 December 2017 include revenue of £2,092.2 million (2016: £889.3 million), an operating loss of £6.9 million (2016: £61.6 million), a statutory loss before tax of £27.6 million (2016: £69.3 million) and diluted earnings per share (EPS), being a loss of 1.2p (2016: loss of 2.6p).
A table summarising the statutory results by division is shown in the segmental note of the financial statements.
The year ended 31 December 2017 was a year of significant transformation for Melrose, being the first full year of Nortek ownership and with Brush Turbogenerators experiencing structural changes in its end markets. Consequently these statutory results include significant amounts of items which are non-trading in nature, significant in size, volatile or are non-recurring. These are defined as non-underlying items. It is Melrose accounting policy to exclude these items from underlying results and the specific amounts that fall within these categories in the year are detailed as follows.
Geoffrey MartinGroup Finance Director
The results for the year ended 31 December 2017 include the first full year of ownership of Nortek. As a consequence, the results for the year are not directly comparable to 2016 as the prior year performance includes only four months of Nortek trading following its acquisition on 31 August 2016.
32

Non-underlying itemsIn reporting financial information, the Group presents underlying results, which are not defined or specified under the requirements of IFRS. The Board considers the underlying results to be a key APM to monitor how the businesses are performing because this provides a more meaningful comparison of how the businesses are managed and measured on a day-to-day basis and achieves consistency and comparability between reporting periods.
Non-underlying items are defined as those which are significant in size or volatility or by nature are non-trading or non-recurring, and any item released to the Income Statement that was previously a fair value item booked on acquisition.
The following items have been classified as non-underlying in these financial statements:
An impairment charge totalling £144.7 million in respect of the carrying value of the assets held within the Brush business. This charge included £31.1 million in respect of the net assets of Brush China, which was closed in November 2017, and, following a review of the non-current assets, included £18.2 million in respect of fixed assets and £95.4 million in respect of goodwill. The impairment charge has been excluded from underlying results due to its one-off nature and size.
The amortisation of intangible assets acquired in business combinations are excluded from underlying results due to their non-trading nature and to enable comparison with companies that grow organically and do not have such a charge. Where intangible assets are trading in nature, such as computer software and development costs, the amortisation of these intangible assets are shown within underlying results.
Restructuring costs and other associated costs arising from significant strategy changes totalled £35.0 million (2016: £51.4 million), and included £1.1 million (2016: £nil) of losses incurred following the announcement of the closure of certain businesses. Within the Nortek businesses the cost of restructuring actions taken in the year was £29.1 million (2016: £45.3 million, of which £31.8 million related to the closure of the Nortek head office). These actions included the closure of loss-making operations within the HVAC business, the removal of excess manufacturing capacity in the AQH business and the consolidation of NSC, GTO and Core Brands into a single SST division based in Carlsbad. Restructuring costs also included £5.9 million (2016: £6.1 million) within the Brush businesses relating to the closure of the China factory in November 2017 and realigning the cost base of Brush with the reduced revenue. Restructuring costs are excluded from underlying results due to their size and non-trading nature.
Acquisition and disposal costs incurred in the year ended 31 December 2017 totalled £5.8 million (2016: £38.7 million) and included the costs involved in returning the ordinary shares of the Company to the Premium List of the London Stock Exchange following on from the acquisition of Nortek, along with £1.8 million of committed costs associated with the potential acquisition of GKN plc. In the year ended 31 December 2016 acquisition and disposal costs related primarily to the acquisition of Nortek. These items are excluded from underlying results due to their non-trading nature.
The charge for the Company’s equity-settled long-term incentive plan renewed in 2012 (the Incentive Plan (2012)), including its associated employer’s tax charge, is excluded from underlying results due to its size and volatility. The shares that would be issued in respect of the equity-settled Melrose Plan are included in the calculation of the underlying diluted EPS, which the Board considers to be a key measure of performance.
Certain items, primarily booked as fair value items on the acquisition of Nortek, have been settled for a more favourable amount than first anticipated. The release of any excess fair value item is shown within non-underlying profit to avoid positively distorting underlying results.
The net tax credit arising from the new US tax legislation enacted in December 2017, including an estimated repatriation charge and changes to closing deferred tax items due to a reduction in the Federal tax rate from 35% to 21%, has been included as non-underlying because of its size and one-off nature.
Underlying resultsUnderlying results are the statutory results excluding non-underlying items. The underlying measures are used to partly determine the variable element of remuneration of senior management throughout the Group and are also in alignment with performance measures used by certain external stakeholders. The underlying measures are also one measure used to value individual businesses as part of the “Buy, Improve, Sell” Melrose strategy model.
Strategic Report
33
Mel
rose
Ind
ustr
ies
PLC
A
nnua
l Rep
ort 2
017

Mel
rose
Ind
ustr
ies
PLC
A
nnua
l Rep
ort 2
017
The table also presents a constant currency proforma growth after adjusting revenue for exited sales channels. This measurement of year-on-year growth is described in more detail in the glossary to this Annual Report on pages 152 to 155.
2017 Actual
£m
2016Full year
£m
Proforma(1)
growth%
Revenue
Nortek(2),(3) 1,873.2 1,830.2 +2%
Brush 219.0 246.4 -14%
Continuing Group 2,092.2 2,076.6 Flat
Underlying operating profit
Nortek(3) 284.3 177.8 +52%
Brush 17.5 32.0 -47%
Continuing Group(4) 278.4 188.0 +40%
Underlying operating margin
Nortek 15.2% 9.7% +5.5ppts
Brush 8.0% 13.0% -5.0ppts
Continuing Group 13.3% 9.1% +4.2ppts
Underlying diluted EPS(5) 9.8p 6.4p +45%(6)
(1) At constant currency, using 2016 average exchange rates in both 2016 and 2017.(2) Adjusting revenue growth for exited sales channels.(3) Nortek 2016 full year revenue of $2,480.7 million and underlying operating profit of
$241.0 million as reported in the audited financial statements used for the Step Up to the Premium List of the London Stock Exchange.
(4) Includes the Melrose central costs and an additional divisional LTIP charge of £7.6 million in 2016 as if Nortek was owned for the full year.
(5) Underlying diluted EPS for 2016 calculated after using the same net finance costs, effective tax rate and number of shares as for 2017.
(6) Growth of 54% using actual average exchange rates for both years.
Profit estimateOn 1 February 2018 a trading update was published which, under Rule 28 of the City Code on Takeovers and Mergers, was deemed to include the following profit estimate:
“Nortek trading has been transformed more comprehensively and faster than envisaged at the time of the acquisition; underlying operating profits at constant currency are up approximately 50% compared to last year of $241.0 million and approximately 65% up on the full year prior to acquisition of $220.1 million.”
A reconciliation of the proforma Nortek underlying operating profit, at constant currency, is presented in the glossary to this Annual Report on pages 152 to 155. This shows that Nortek proforma underlying operating profit was up 52% on 2016 and up 67% on 2015.
The underlying results in the year ended 31 December 2017 included an underlying operating profit of £278.4 million (2016: £104.1 million) and an underlying profit before tax of £257.7 million (2016: £96.4 million). The following table reconciles the statutory operating result to underlying operating profit:
2017£m
2016£m
Operating loss (6.9) (61.6)
Impairment of Brush assets 144.7 –
Amortisation of intangible assets 81.4 36.3
Restructuring costs 35.0 51.4
Acquisition and disposal related costs 5.8 38.7
Removal of one-off uplift in the value of inventory – 18.2
Equity-settled compensation scheme charges 24.2 22.8
Release of fair value items (5.8) (1.7)
Adjustments to statutory operating loss 285.3 165.7
Underlying operating profit 278.4 104.1
The underlying performance of each of the trading divisions is shown in the segmental note of the financial statements and the reasons for the performance are discussed in the Chief Executive’s review. The underlying operating profit in Brush of £17.5 million included £2.1 million of losses incurred within the Brush China factory prior to its closure.
Central costs were £23.4 million (2016: £14.2 million), which included £15.8 million (2016: £14.2 million) of Melrose corporate costs and £7.6 million (2016: £nil) of costs relating to the Nortek divisional cash-based long-term incentive plan, which was introduced during the year.
Proforma Group trading resultsThe results for 2017 are not directly comparable to 2016 because the prior year performance includes only four months of Nortek trading following its acquisition on 31 August 2016.
The table opposite presents a comparative which includes a proforma measure as if Nortek had been owned for the full year, converted to IFRS and presented under Melrose accounting policies. The Nortek full year results for 2016 were audited for the process of returning Melrose to the Premium List of the London Stock Exchange. The proforma measure also makes an allowance for the divisional cash-based long-term incentive plan, finance costs of the acquisition and uses a consistent tax rate and number of shares in both years.
Finance Director’s reviewContinued
34

Finance costs and incomeThe net finance cost in 2017 was £20.7 million (2016: £7.7 million) and the net interest on external bank loans, overdrafts and cash balances was £16.0 million (2016: £5.9 million). The year-on-year increase reflecting that the Group was in a net cash position for eight months prior to acquiring Nortek on 31 August 2016, after which it was in a net debt position.
Melrose uses interest rate swaps to fix the majority of the interest rate exposure on its drawn debt. More detail on these swaps is given in the finance cost risk management section of this review.
In addition, a £2.3 million (2016: £0.7 million) amortisation charge relating to the arrangement costs of raising the bank facility was incurred in 2017.
Also included in net finance costs is a net interest cost on net pension liabilities of £1.1 million (2016: £0.9 million) and a charge for the unwinding of discounts on long-term provisions of £1.3 million (2016: £0.2 million).
TaxThe statutory tax rate for the year ended 31 December 2017 was 13.4% (2016: 43.7%). This is lower than the underlying effective tax rate due to the deferred tax credit noted below, which is partially offset by certain non-underlying charges not being deductible for tax purposes.
The underlying effective tax rate for the full 12 months was 25.9% (2016: 27.0%). As expected, this rate represents a mixture of profits arising in the UK at lower tax rates and in the rest of the world at higher rates, particularly the US with a federal rate of 35%, plus state taxes.
As announced in January 2018, the tax event with most significance for the Group this year was the passing of the Tax Cuts and Jobs Act in the US on 22 December 2017. This changed the US Federal tax rate at which deferred tax assets and liabilities will reverse in the future from 35% to 21%, leading to a reassessment of deferred tax balances and a net non-underlying credit of £26.4 million.
The corporate tax paid during the year was £15.9 million (2016: £5.9 million). The Melrose Group continues to benefit from the utilisation of tax losses and other deferred tax assets.
The net deferred tax liability has reduced by £60.5 million to £19.8 million. This is because the deferred tax liability in respect of intangible assets was reduced as a result of the US law change and also because the Group has recognised additional deferred tax assets in respect of deductions arising from the Incentive Plan (2012) and the Company’s long-term incentive plan renewed in 2017 (the Incentive Plan (2017)).
Long-term incentive plansThe Melrose Incentive Plan (2012) matured, as expected, on 31 May 2017 and was replaced by the new Incentive Plan (2017), approved by shareholders, which mirrors the previous plan, except that the five-year duration of the replacement plan is split between a three-year performance period and a further two-year holding period. Directors will be subject to malus and clawback provisions during the performance period and to clawback provisions for the duration of the subsequent holding period.
During the year the Remuneration Committee determined that 23,494 options held in respect of the Incentive Plan (2012) should be withheld by the Company in exchange for an equivalently valued £115.5 million cash payment being sufficient to allow holders to meet their income tax and employee national insurance liabilities in respect of the Incentive Plan (2012).
The remaining 26,506 options were exercised on 30 May 2017 in exchange for 26,506 Incentive Shares (2012), which were issued on 31 May 2017 and converted into 54,453,914 Melrose ordinary shares, increasing the total number of shares in issue by 2.9% at that date to 1,941,200,503.
At the start of the Incentive Plan (2017) the first tranche of options were granted. For accounting purposes the IFRS 2 charge has been calculated as if all options over the Incentive Plan (2017) have been granted on day one because of a common expectation, established at that date, between employees and the Company that the remaining options will be allocated annually in two more equal tranches over the three-year performance period.
The charge to non-underlying profit in respect of the Incentive Plan (2017) will be £13.3 million per annum (previous Incentive Plan (2012) £4.0 million), excluding the associated employer’s tax charge. The increased charge reflects the relative size of the business at the time of inception of the Incentive Plan (2017) compared to that at inception of the Incentive Plan (2012).
Earnings per shareIn accordance with IAS 33, the statutory basic and diluted EPS numbers are disclosed on the face of the Income Statement. In the year ended 31 December 2017 the diluted EPS was a loss of 1.2p (2016: a loss of 2.6p). There were no discontinued operations in 2017 or 2016.
The underlying diluted EPS for the year ended 31 December 2017 was 9.8p (2016: proforma of 6.4p), representing a 45% increase over the proforma calculation, described in the glossary to this Annual Report on pages 152 to 155, which is largely as a result of the 52% increase in Nortek underlying operating profits in the year.
Strategic Report
35
Mel
rose
Ind
ustr
ies
PLC
A
nnua
l Rep
ort 2
017

Mel
rose
Ind
ustr
ies
PLC
A
nnua
l Rep
ort 2
017
Fair value exerciseIn accordance with IFRS 3 “Business Combinations”, an extensive review of the opening Nortek assets, liabilities and accounting policies commenced following the acquisition in August 2016.
This review was completed in the first half of 2017. In accordance with IFRS 3, the 31 December 2016 Balance Sheet has been restated in these financial statements to reflect goodwill decreasing by £57.7 million, deferred tax liabilities by £63.8 million and inventory by £1.2 million. Provisions increased by £3.4 million, other payables by £1.8 million and deferred tax assets by £0.3 million.
DisposalOn 10 August 2017 the disposal of the loss-making Best S.p.A. operations to Electrolux A.G. was completed. The Best operations were previously shown within the AQH business, within the Air Management division. Cash consideration, net of costs, was £9.2 million which was equal to the net assets that were disposed.
Assets and liabilitiesThe summary Melrose Group assets and liabilities are shown below:
2017£m
2016(1)
£m
Fixed assets (tangible, intangible and goodwill) 2,456.5 2,881.2
Net working capital 241.0 225.2
Retirement benefit obligations (17.6) (33.4)
Provisions (209.8) (283.0)
Deferred tax and current tax (26.2) (90.5)
Net other 13.1 4.8
Total 2,457.0 2,704.3
(1) Restated to reflect the completion of the acquisition accounting for Nortek.
These assets and liabilities are funded by:
2017£m
2016£m
Net debt (571.8) (541.5)
Equity (1,885.2) (2,162.8)
Total (2,457.0) (2,704.3)
The reduction in net assets included the statutory loss for the year and primarily related to the adverse foreign exchange movements on the retranslation of foreign operations of £133.3 million in the year, along with the dividend payment to shareholders of £63.0 million.
Cash generation and managementFor the year ended 31 December 2017 the profit conversion to cash pre capital expenditure was 95% (2016: 123%). An analysis of the cash generation performance for the year is shown in the table below:
Cash flow from operating and investing activities (after all costs including tax)
2017£m
2016£m
Underlying operating profit 278.4 104.1
Depreciation(1) 34.7 18.1
Working capital movement (16.1) 28.2
Underlying operating cash flow (pre capex) 297.0 150.4
Underlying EBITDA conversion to cash (pre capex) % 95% 123%
Net capital expenditure (48.8) (17.1)
Net interest and net tax paid (30.7) (8.6)
Defined benefit pension contributions (4.2) (10.5)
Incentive scheme tax related payments (including employer’s tax) (147.9) –
Restructuring (48.6) (24.2)
Net other (31.8) (12.6)
Cash flow from operating and investing activities (after all costs including tax) (15.0) 77.4
Movement in net debt(2) £m £m
Opening (net debt)/cash (541.5) 2,451.4
Acquired net debt with Nortek – (1,056.5)
Net repayment, on acquisition, of the Nortek debt – 429.8
Cash flow from trading (after all costs including tax) (15.0) 77.4
Amount paid to shareholders (63.0) (2,394.3)
Foreign exchange and other non-cash movements 47.7 (49.3)
Closing net debt (571.8) (541.5)
(1) Including amortisation of computer software and development costs.(2) Defined as the net of cash and cash equivalents, external bank borrowings and
finance leases.
The total cash outflow from operating and investing activities included payments relating to restructuring provisions of £48.6 million (2016: £24.2 million), net capital expenditure in the Nortek businesses of £46.3 million, representing 1.8x depreciation, and £147.9 million of incentive scheme payments which included associated employer’s tax.
Payments to defined benefit pension schemes in the year ended 31 December 2017 were £4.2 million compared to £10.5 million in 2016. The previous year included £8.8 million early contributions to the Brush UK Pension Plan following the disposal of the Elster businesses to Honeywell International Inc. in December 2015.
Finance Director’s reviewContinued
36

Goodwill, intangible assets and impairment reviewThe total value of goodwill as at 31 December 2017 was £1,432.2 million (31 December 2016: £1,648.3 million) and intangible assets acquired with business combinations was £796.7 million (31 December 2016: £950.1 million). These items are split by division as follows:
31 December 2017Nortek
£mBrush
£mTotal
£m
Goodwill 1,310.2 122.0 1,432.2
Intangible assets acquired with business combinations 734.2 62.5 796.7
Total goodwill and intangible assets 2,044.4 184.5 2,228.9
The goodwill and intangible assets have been tested for impairment as at 31 December 2017. In accordance with IAS 36 “Impairment of assets” the recoverable amount is assessed as being the higher of the fair value less costs to sell and the value in use.
The Board is comfortable that no impairment is required in respect of the goodwill and intangible assets of Nortek and that there are no reasonable possible changes in assumptions that would result in any impairment.
The Group reported on 21 November 2017 that a full review of the cash generating units of the Energy divisions was underway following the continued worsening of the market, recent negative trading statements made by participants in the market sector and the deferral of Generator orders within Brush. As has been well-publicised, structural changes caused by worldwide environmental policy have triggered a fall in volumes in the gas turbine market of over 60% from its peak in 2011. This in turn has resulted in Brush’s turbogenerator sales falling. These circumstances resulted in a reduction in the forecasts of the Brush business and the communication, in the November trading statement, that the current order intake by Brush would result in a low single-digit margin during 2018.
At 31 December 2017 an agreed restructuring plan for the Brush business had not been publicly announced or communicated to those affected by the restructure and therefore, in accordance with IAS 37 “Provisions”, these were not considered to be committed at that date. The restructuring plans were subsequently announced on 1 February 2018.
Under IAS 36, the value in use basis for calculating the recoverable amount prohibits the inclusion of future uncommitted restructuring plans, whilst the fair value less costs to sell basis of valuation allows the inclusion of these plans if it is deemed that a market participant would also restructure. The recent trading announcements by key players in the market in which Brush operates is considered to be a good indication that a market participant would restructure the business. With the restructuring being a material part of the Brush valuation, this affects the result of the impairment review considerably.
The recoverable amount of the Brush assets using the fair value less costs to sell basis was £300 million, which gave a higher valuation than the value in use basis which was £177.5 million, which excluded the benefits of the restructuring. Consequently Brush is valued at £300 million at 31 December 2017 and an impairment charge of £144.7 million has been recognised in the year, which included the write down of the Brush China assets of £31.1 million, following the announcement of its closure in November 2017, an impairment of certain fixed assets of £18.2 million and a £95.4 million impairment to goodwill.
ProvisionsTotal provisions at 31 December 2017 were £209.8 million (31 December 2016: £283.0 million). Despite the £106.7 million (2016: £85.6 million) net charge to operating profit in the year, provisions decreased primarily because of the net utilisation of the restructuring provision at Nortek, along with the £31.7 million payment made in the year in respect of the employer related tax on the Incentive Plan (2012), which matured in the year.
The following table summarises the movement in provisions in the year:
Total£m
At 31 December 2016(1) 283.0
Net charge to underlying operating profit 62.4
Charge to non-underlying operating profit 48.7
Release of fair value items to non-underlying operating profit (4.4)
Spend against provisions (163.9)
Other (including foreign exchange) (16.0)
At 31 December 2017 209.8
(1) Restated to reflect the completion of the acquisition accounting for Nortek.
In 2017 there was a net charge to underlying operating profit of £62.4 million which included the £7.6 million charge for Nortek divisional cash based long-term incentive plans but mainly related to warranty, product liability and workers’ compensation type charges, which are matched by similar cash payments in the year.
The charge to non-underlying operating profit of £48.7 million included £13.4 million of Melrose equity-settled incentive plan related costs in respect of employer related tax. The remaining charge to non-underlying operating profit primarily related to restructuring items.
Included within other movements in provisions are foreign exchange movements, the unwind of discounting on sizeable provisions and the provisions included in the Best S.p.A. businesses which were disposed of on 10 August 2017(1).
(1) The sale of Best S.p.A. was signed on 6 July 2017 and completed on 10 August 2017.
Strategic Report
37
Mel
rose
Ind
ustr
ies
PLC
A
nnua
l Rep
ort 2
017

Mel
rose
Ind
ustr
ies
PLC
A
nnua
l Rep
ort 2
017
The facility has two financial covenants. There is a net debt to underlying EBITDA (underlying operating profit before depreciation and amortisation) covenant and an interest cover covenant, both of which are tested half yearly, each June and December.
The first of these covenants is set at 3.5x leverage for each of the half yearly measurement dates for the remainder of the term of the facility. For the year ended 31 December 2017 it was approximately 1.9x (31 December 2016: 1.9x), showing significant headroom compared to the covenant test.
The interest cover covenant is set at 4.0x throughout the life of the facility and was 19.6x at 31 December 2017 (31 December 2016: 20.7x), affording comfortable headroom compared to the covenant test.
At 31 December 2017 the term loan was fully drawn down and the revolving credit facility was drawn down by US $455 million, split US $274 million and £134 million. The core currency of Nortek is the US dollar, and debt is drawn down to protect the Melrose Group as efficiently as possible from currency fluctuations on net assets and profit.
In addition, there are a number of uncommitted overdraft, guarantee and borrowing facilities made available to the Melrose Group. These uncommitted facilities have been lightly used.
Cash, deposits and marketable securities amounted to £16.3 million at 31 December 2017 (31 December 2016: £42.1 million) and are offset against gross debt of £588.1 million (31 December 2016: £583.6 million) to arrive at the net debt position of £571.8 million (31 December 2016: £541.5 million). The combination of this cash and the size of the new facility allows the Directors to consider that the Melrose Group has sufficient access to liquidity for its current needs.
The Board takes careful consideration of counterparty risk with banks when deciding where to place Melrose’s cash on deposit.
Finance cost risk managementThe bank margin on the Melrose bank facility depends on the Melrose Group leverage, and ranges from 0.85% to 2.00%; as at 31 December 2017 the margin was 1.35% (31 December 2016: 1.35%).
The Melrose Group holds interest rate swap arrangements to fix the cost of LIBOR. The profile of the interest rate swaps has been designed to hedge, on average, 70% of the interest exposure on the projected gross debt as it reduces over the five-year term. Under the terms of these swap arrangements, the Melrose Group will pay a weighted average fixed cost of 1.0% up to 31 December 2019, and 0.9% until the remaining swaps terminate on 6 July 2021.
The interest on the swaps is payable annually in arrears on 1 July. The bank margin is payable monthly.
PensionsAt 31 December 2017 the accounting net deficit of the Melrose Group’s defined benefit pension plans was £17.6 million (2016: £33.4 million). Total plan assets at 31 December 2017 were £524.7 million (2016: £522.6 million) and total plan liabilities were £542.3 million (2016: £556.0 million). The plan assets and liabilities at 31 December 2017 were split as follows:
UK Plans
£m
US Plans
£m
OtherPlans
£mTotal
£m
Plan liabilities (288.5) (252.6) (1.2) (542.3)
Plan assets 283.0 241.1 0.6 524.7
Net deficit (5.5) (11.5) (0.6) (17.6)
The net deficit on the UK Plans included a surplus of £8.3 million (31 December 2016: £17.1 million) for the Brush UK Plan.
The values of the Melrose Group plans were updated at 31 December 2017 by independent actuaries to reflect the latest key assumptions. A summary of the assumptions used are shown below:
2017UK%
2017US%
2016UK%
2016US%
Discount rate 2.5 3.4 2.7 3.9
Inflation (RPI) 3.2 n/a 3.3 n/a
It is noted that a 0.1 percentage point decrease in the discount rate would increase the pension liabilities of the Melrose Group by £8.0 million, or 1%, and a 0.1 percentage point increase to inflation would increase the liabilities by £3.0 million, or 1%. Furthermore, an increase by one year in the expected life of a 65 year old member would increase the pension liabilities on these plans by £18.3 million, or 3%.
Annual contributions to the Melrose Group defined benefit pension plans are expected to be approximately £3.2 million in 2018.
Financial risk managementThe financial risks the Melrose Group faces have been considered and policies have been implemented to appropriately deal with each risk. The most significant financial risks are considered to be liquidity risk, finance cost risk, exchange rate risk, contract and warranty risk and commodity cost risk. These are discussed in turn below.
Liquidity risk managementThe Melrose Group’s net debt position at 31 December 2017 was £571.8 million (31 December 2016: £541.5 million).
Melrose has a five-year multi-currency US $1.25 billion committed bank facility which commenced on 6 July 2016 to assist with the acquisition of Nortek and consists of a US $350 million term loan facility and a US $900 million revolving credit facility. Loans drawn under this facility are guaranteed by Melrose Industries PLC and certain of its subsidiaries, and there is no security over any of the Melrose assets in respect of this facility.
Finance Director’s reviewContinued
38

The long-term exchange rate risk, which ignores any hedging instruments, is as follows:
Sensitivity of profit to translation and full transaction exchange rate risk
Increase/(decrease) in underlying operating profit
£m
For every 10% strengthening of the US Dollar against Sterling 31.9
For every 10% strengthening of the Chinese Renminbi against Sterling (23.8)
No specific exchange instruments are used to protect against the translation risk because it is a non-cash risk to the Melrose Group. However, when the Melrose Group has net debt, the hedge of having a matching debt facility funding these foreign currency trading units protects against some of the balance sheet and banking covenant translation risk.
Lastly, and potentially most significantly for Melrose, exchange risk arises when a business that is predominantly based in a foreign currency is sold. The proceeds for those businesses may be received in a foreign currency and therefore an exchange risk might arise if foreign currency proceeds are converted back to Sterling, for instance to pay a dividend or make a capital return to shareholders. Protection against this risk is considered on a case-by-case basis.
Contract and warranty riskThe financial risks connected with contracts and warranties, which include the consideration of commercial, legal and warranty terms and their duration, are considered carefully by Melrose before being entered into.
Commodity cost risk managementThe cumulative expenditure on commodities is important to the Melrose Group and the risk of base commodity costs increasing is mitigated by, wherever possible, passing on the cost increases to customers or by having suitable purchase agreements with its suppliers which sometimes fix the price over some months into the future. These risks are minimised through sourcing policies, including the use of multiple sources, where possible, and procurement contracts where prices are agreed for up to one year to limit exposure to price volatility. On occasions, Melrose does enter into financial instruments on commodities when this is considered to be the most efficient way of protecting against movements.
Exchange rate risk managementThe Melrose Group trades in various countries around the world and is exposed to many different foreign currencies. The Melrose Group therefore carries an exchange rate risk that can be categorised into three types, transaction, translation and disposal related risk, as described in the paragraphs below. The Board policy is designed to protect against the majority of the cash risks but not the non-cash risks.
The most common exchange rate risk is the transaction risk the Group takes when it invoices a sale in a different currency to the one in which its cost of sale is incurred. This is addressed by taking out forward cover against approximately 60% to 80% of the anticipated cash flows over the following 12 months, placed on a rolling quarterly basis and for 100% of each material contract. This does not eliminate the cash risk but does bring some certainty to it.
The Melrose Group’s annual revenue is heavily denominated in US Dollars, with 82% of revenue being denominated in this currency, and therefore the largest foreign exchange rate exposure is the translation risk from changes in the US Dollar exchange rate relative to Sterling. In addition, the Melrose Group has foreign currency exposure, the largest being a transactional exchange rate exposure due to certain Nortek US businesses transacting in the Chinese Renminbi. The following exchange rates were used in respect of these two currencies during the year:
US DollarTwelve month
average rate
Four month average (Nortek
businesses)Closing
rate
2017 1.29 N/A 1.35
2016 1.36 1.26 1.23
CNY
2017 8.71 N/A 8.80
2016 8.99 8.56 8.57
The translation rate risk, being the effect on the results in the year due to the translation movement of exchange rates from one year to the next is shown below. The table below illustrates what the movement in proforma revenue and underlying operating profit has been in 2017 as a result of changes in foreign exchange rates.
The translation difference in 2017 £m
Revenue has increased by 100.0
Underlying operating profit has increased by 15.1
For reference, in respect of the continuing Melrose Group, an indication of the short-term exchange rate risk, which shows both translation exchange risk and unhedged transaction exchange rate risk, is as follows:
Sensitivity of profit to translation and unhedged transaction exchange risk
Increase/(decrease) in underlying operating profit
£m
For every 10% strengthening of the US Dollar against Sterling 27.3
For every 10% strengthening of the Chinese Renminbi against Sterling (4.7)
Strategic Report
39
Mel
rose
Ind
ustr
ies
PLC
A
nnua
l Rep
ort 2
017

Mel
rose
Ind
ustr
ies
PLC
A
nnua
l Rep
ort 2
017
This restructuring involves the intended closure of the turbogenerator production facility at Ridderkerk, Netherlands and the transfer of its 4-pole turbogenerator production to the facility in Plzen , Czech Republic, while the factory in Changshu, China has already been closed. In the UK, Brush has entered into consultation with its workforce about the future of 2-pole turbogenerator production at the Loughborough, UK facility, which accounts for approximately half the workforce at the site. The 520-strong workforce employed at Brush’s other UK sites in the transformers, switchgear and mobile generator businesses remain unaffected.
The cash cost of these restructuring items is estimated to be £40 million and is expected to be materially complete by the end of 2018.
Geoffrey MartinGroup Finance Director20 February 2018
Going concernThe Melrose Group’s business activities, together with the factors likely to affect its future development, performance and position are set out in the Chief Executive’s review. In addition, the consolidated financial statements include details of the Melrose Group’s borrowing facilities and hedging activities along with the processes for managing its exposures to credit risk, capital risk, liquidity risk, interest risk, foreign currency risk and commodity cost risk.
The Melrose Group has adequate financial resources and has a consistent cash generation record, and, as a consequence, the Directors believe that the Melrose Group is well placed to manage its business risks successfully despite the current uncertain economic outlook.
After making enquiries, the Directors have a reasonable expectation that the Melrose Group has adequate resources to continue in operational existence for the foreseeable future. For this reason, they continue to adopt the going concern basis in preparing the financial statements.
Post balance sheet eventsOn 17 January 2018 the Melrose Group announced the terms of a firm offer to acquire the entire issued share capital of GKN plc and on 1 February 2018 issued a public offer document containing the full terms and conditions of the offer.
In conjunction with this offer, the Company entered into a senior term and revolving credit facilities agreement with Lloyds Bank plc and Royal Bank of Canada as original lenders which is subject to the acquisition taking place. The new facilities agreement provides for term facilities and revolving credit facilities in an aggregate principal amount up to £2.6 billion, US $2.0 billion and €0.5 billion. The maturity of the facilities ranges from three years and six months to five years, after the date of the agreement of the new facility.
On 1 February 2018 Melrose announced that Brush had commenced consultations with employees in relation to restructuring its Turbogenerator business to reflect the reduced levels of activity. These reduced levels have been caused by worldwide environmental policy which has triggered a fall in volumes in the gas turbine market of over 60% from its peak in 2011. This in turn has resulted in Brush’s turbogenerator sales falling.
Finance Director’s reviewContinued
40

In preparing this statement, the following qualifications and assumptions are made:
(i) the viability model is based on the Group as at the date of this Annual Report, the model includes no consideration of a combined working capital forecast for the proposed GKN plc acquisition, for the reasons set out above. It also does not consider any further acquisitions or future disposals of continuing businesses. We note future acquisitions would be based on the same proven business model applied previously, with related bank debt and equity raised to support the acquisition with sufficient headroom to cover business risks; and
(ii) financing arrangements and bank covenant testing are in line with the current facility which is committed for the period under review.
Longer-term viability statement
(1) For further details on the economic risk, foreign exchange risk and liquidity risk, and the mitigating actions being taken by management, please refer to the Risks and Uncertainties section of the Strategic Report on pages 44 to 49.
In accordance with provision C.2.2 of the UK Corporate Governance Code, the Directors have assessed the prospects of the Company over a longer period than the 12 months required by the “Going Concern” provision. A period of three years is believed to be appropriate for this assessment since this is consistent with the Group’s financing cycle, whereby on average the Group has refinanced debt in line with this timescale, usually as a result of acquisition or disposal activity.
The Directors confirm that they have a reasonable expectation that the Group will continue in operation and meet its liabilities, as they fall due, up to December 2020.
The Directors’ assessment has been made by reference to the Group’s financial position as at 31 December 2017, its prospects, the Group’s strategy, the Board’s risk appetite and the Group’s principal risks and their management, all of which are described in the Strategic Report.
The Directors’ assessment of the Group’s viability is supported by comprehensive and detailed analysis and modelling. The model underpinning this statement is stress-tested, proven and is frequently used by management when determining working capital requirements for transactions and corporate restructuring. The main assumptions included in the model relate to forecast revenue, operating margin and cash generation. The model includes three years of forecast data from the Group’s business assets and incorporates agreed sensitivities for economic risk (impacting revenue and margins to replicate a sales downturn in line with those experienced in previous downturns), foreign exchange risk (impacting net debt and assuming adverse movements in foreign exchange rates) and liquidity risk (impacting net debt and assuming a deterioration in working capital)(1), each of which have been considered both individually and in combination by the Board, together with expected achievable mitigating actions from the working capital model to create severe, but plausible, scenarios. These scenarios sensitise the main assumptions noted above.
On 1 February 2018 the Company issued an official offer document to acquire the entire share capital of GKN plc. In anticipation of the potential acquisition, the Company has entered into a senior term and revolving credit facilities agreement with Lloyds Bank plc and Royal Bank of Canada as original lenders which is subject to the acquisition taking place. The new facilities agreement provides for term facilities and revolving credit facilities in an aggregate principal amount up to £2.6 billion, US $2.0 billion and €0.5 billion. The maturity of the new facilities would range from three years and six months to five years, after the date of the agreement of the new facility.
At this point in time the Company does not have access to non-public information on GKN plc that would allow procedures to be undertaken for Melrose to be able to conclude on a combined working capital model.
Strategic Report
41
Mel
rose
Ind
ustr
ies
PLC
A
nnua
l Rep
ort 2
017

The Board further confirms that the systems, processes and controls in place accord with the guidance contained in the Financial Reporting Council’s “Guidance on Risk Management, Internal Control and Related Financial Business Reporting”.
The Audit Committee monitors the effectiveness of the risk management and internal control processes implemented across the Group, through regular updates and discussions with management and a review of the key findings presented by the external and internal auditors. The Board is responsible for considering the Audit Committee’s recommendations and ensuring implementation by management of those recommendations it deems appropriate for the business. A description of the Audit Committee’s activities during the year on risk management can be found on page 75.
During 2017, in accordance with provision C.2.3 of the UK Corporate Governance Code, the Audit Committee undertook a robust review of the effectiveness of the Group’s risk management and internal control systems, covering all material controls including financial, operational and compliance controls. The Audit Committee reported its findings to the Board. From this review of the risk management and internal control systems, the Board did not identify, nor was it advised of, any failings or weaknesses which it would determine to be significant. The Board concluded that the Group’s risk management and internal control systems and processes were operating effectively and therefore a confirmation in respect of necessary actions to be undertaken has not been considered appropriate.
The Board’s view of our principal risks and uncertainties is detailed in the table on pages 44 to 49.
Risk management strategy and framework The objectives of the Directors and senior management are to safeguard and increase the value of the businesses and assets of the Group. Achievement of these objectives requires the development of policies and appropriate internal control frameworks to ensure the Group’s resources are managed properly and any key risks are identified and mitigated, where possible.
The Board recognises that it is ultimately responsible for determining the nature and extent of the principal risks it is willing to take to achieve its strategic objectives. It also recognises the need to define a risk appetite for the Group, to maintain sound risk management and internal control systems and to monitor its risk exposures and mitigations to ensure that the nature and extent of risks taken by the Group are consistent and aligned with its strategic objectives.
The Board confirms that there is an ongoing process for identifying, evaluating and managing the principal risks faced by the Company and that these systems, which are subject to regular monitoring and review, have been in place for the year under review and up to the date of approval of the Annual Report and financial statements.
Risk management
The Board recognises that operating in a dynamic and rapidly evolving commercial environment requires a pragmatic, flexible and responsive risk management framework that changes with the business and provides management with a comprehensive view of the Group’s risk profile at any given time.
Risk management responsibilitiesThe Board, having overall responsibility for risk management, has approved a formalised, but pragmatic, Group risk management framework.
BoardOverall responsibility for risk management
Audit CommitteeMonitors the effectiveness of the Group’s internal control processes
Melrose senior management and business unit senior managers
Operational managers and financial controllers
• Agrees the Group’s risk strategy and defines its risk appetite
• Reviews reports and recommendations from the Audit Committee on risk governance
• Maintains oversight of key risks and mitigation plans
• Oversees the risk management processes and controls
• Supports the Board in monitoring risk exposure against risk appetite
• Set the risk management processes and controls
• Consider emerging risks
• Oversee and challenge risk mitigation plans
• Risk identification, assessment and monitoring at the business unit level
• Implementing risk mitigation plans and controls
• Embedding risk awareness and culture throughout the business
Top d
own
At the G
roup level, risk oversight and assessm
ent
Bo
ttom
up
Risk exposure identification
and assessment at the
business unit level
42M
elro
se In
dus
trie
s P
LC
Ann
ual R
epor
t 201
7

The Group operates on a decentralised basis and the Board has established an organisational structure with clear reporting procedures, lines of responsibility and delegated authority, as depicted in the diagram on the previous page. Consistent with this, the Group operates a top-down/bottom-up approach to risk management, comprising Board and senior management oversight coupled with bottom-up risk management embedded in the day-to-day activities of its individual businesses.
Risk appetiteThe Board has undertaken a comprehensive exercise to consider its risk appetite across a number of key business risk areas. The results of this review indicate the relative appetite of the Board across the risk factors at a specific point in time. Any material changes in risk factors will impact the Board’s assessment of its risk appetite.
The Board has a higher risk appetite towards its strategic and operational risks and a balanced appetite towards macro-economic and political risk. The Board seeks to minimise all health and safety risks and has a low risk appetite in relation to legal, compliance and regulatory risk. Similarly, a conservative appetite is indicated by the Board with respect to pension and finance-related risks.
The results of the risk appetite review will support the Board’s decision making processes during 2018. It is the intention to undertake a review of the Board’s risk appetite at least annually.
Risk management actionsDuring 2017, the Board continued to deliver on the key management priorities identified in the 2016 review across the Group, utilising and updating where necessary the enhanced risk management framework implemented in 2015. Specific actions undertaken during the year include:
• reviewing and reaffirming the Board’s risk appetite;
• monitoring the implementation and risk management governance framework across all business divisions. This framework defines the Melrose principles for risk management and sets the standards for the identification, evaluation, prioritisation, recording, review and reporting of risks and their management or mitigation throughout the organisation;
• fully embedding the Melrose risk register methods and risk profile mapping application throughout the Nortek business divisions. These provide the Board with greater levels of detail and visibility on the risk management systems and processes in place, and illustrate each principal risk facing the Group from both a gross risk (pre-mitigation) and net risk (post-mitigation) position. The risk mapping application provides Directors with a clear risk profile for the Group and enables the Board to determine the degree to which its profile is aligned with its risk appetite; and
• reviewing and improving the Group’s processes around the assessment of principal risks and the monitoring and reporting of the Group’s risk management performance.
Assessment of principal risksDuring the year the Board undertook a robust, in-depth and comprehensive assessment of the principal risks facing the Group and specifically those that might threaten the delivery of its strategic business model, its future performance, solvency or liquidity.
A summary of the principal risks and uncertainties that could impact on the Group’s performance is shown on pages 44 to 49. Further information detailing the internal control and risk management policies and procedures operated within the Group is shown on pages 70 to 71 of the Corporate Governance Report.
Risk management priorities for 2018Continual improvements have been made during 2017 in respect of the Group’s risk management processes. However, the Board recognises that Melrose cannot be complacent. In 2018, management will continue to focus on refining the risk management framework and embedding a culture of effective risk management across the Group to ensure that risks and opportunities are identified and managed, to support the delivery of long-term value creation. Further resources will be devoted to strengthening the mechanisms for providing independent assurance on the effectiveness of the Group’s risk management governance, processes and controls.
Risk management framework
IdentificationFinancial and non-financial risks recorded in controlled risk registers
EvaluationRisk exposure reviewed and risks prioritised
MitigationRisk owners identified and action plans implemented
AnalysisRisks analysed for impact and probability to determine gross exposure
Review and monitoringRobust mitigation strategy subject to regular and rigorous review
Risks and uncertainties p.44
Governance overview p.60
Strategic Report
43
Mel
rose
Ind
ustr
ies
PLC
A
nnua
l Rep
ort 2
017

Risks and uncertainties
The table below lists the principal risks and uncertainties that may affect the Group and highlights the mitigating actions that are being taken. The content of the table, however, is not intended to be an exhaustive list of all the risks and uncertainties that may arise and nor is the order of the list intended to be any indication of priority.
A risk management and internal controls framework is in place within the Group to ensure that such risks and uncertainties can be identified and, where possible, managed suitably. Each Group business maintains a risk register which is reviewed regularly by both the management of the business and the Melrose Board.
Key risk Description and impact Mitigation Responsibility Risk trend
Trend commentary
Strategic priorities
Strategic risk
Acquisition of new businesses and improvement strategies
The success of the Group’s acquisition strategy depends on identifying available and suitable targets, obtaining any consents or authorisations required to carry out an acquisition and procuring the necessary financing, be this from equity, debt or a combination of the two. In making acquisitions, there is a risk of unforeseen liabilities being later discovered which were not uncovered or known at the time of the due diligence process. Further, as per the Group’s strategy to buy and improve good but under-performing manufacturing businesses, once an acquisition is completed, there are risks that the Group will not succeed in driving strategic operational improvements to achieve the expected post-acquisition trading results or value which were originally anticipated, that the acquired products and technologies may not be successful or that the business may require significantly greater resources and investment than anticipated. If anticipated benefits are not realised or trading by acquired businesses falls below expectations, it may be necessary to impair the carrying value of these assets. The Group’s return on shareholder investment may fall if acquisition hurdle rates are not met. The Group’s financial performance may suffer from goodwill or other acquisition-related impairment charges, or from the identification of additional liabilities not known at the time of the acquisition.
• Structured and appropriate due diligence undertaken.• Focus on acquisition targets that have strong headline
fundamentals, high-quality products, leading market share but which are underperforming their potential and ability to generate sustainable cash flows and profit growth.
• Hands-on role taken by Directors and other senior employees of the Group.
• Development of strategic plans, restructuring opportunities, capital expenditure and working capital management.
Executive management (1)
As the bid for GKN plc indicates, the Group is currently actively looking to secure its next acquisition and is confident that opportunities will be available.
Improve
Buy
Sell
Timing of disposals
In line with our strategy and depending where the Group is within the “buy, improve, sell” cycle, the expected timing of any disposal of businesses is considered as a principal risk which could have a material impact on the Group strategy. Further, due to the Group’s global operations, there may be a significant impact on timing of disposal due to political and macroeconomic factors. Depending on the timings of disposals and nature of businesses’ operations there may be long-term liabilities which could be retained by the Group following a disposal. Insufficient allowance for such retained liabilities may affect the Group’s financial position.
• Directors are experienced in judging and regularly reviewing the appropriate time in a business cycle for a disposal to realise maximum value for shareholders.
• Each disposal is assessed on its merits, with a key focus on a clean disposal.
Executive management (1)
The responsiveness of the Nortek business to the Melrose methods have meant that disposal may be considered earlier than expected. However, management will remain disciplined and there is no obligation to sell before it is appropriate to do so.
Improve
Buy
Sell
Operational risk
Economic and political
The Group operates, through manufacturing and/or sales facilities, in numerous countries and is affected by global economic conditions. Businesses are also affected by government spending priorities and the willingness of governments to commit substantial resources. Current global economic and financial market conditions, including any fluctuation in commodity prices (in particular, the prices of oil and gas), the potential for a significant and prolonged global recession and any uncertainty in the political environment may materially and adversely affect the Group’s operational performance, financial condition and could have significant impact on timing of acquisitions and disposals.
Following the EU referendum on 23 June 2016, there continues to be some uncertainty in the UK regarding the nature of Brexit and what this will mean for business and the economy. However, the majority of the Group’s revenue is generated in North America, where any effects are expected to be minimal, and the Group remains agile and well positioned to deal with any short-term uncertainty in the UK.
A recession may also materially affect customers, suppliers and other parties with which the Group does business. Adverse economic and financial market conditions may cause customers to terminate existing orders, to reduce their purchases from the Group, or to be unable to meet their obligations to pay outstanding debts to the Group. These market conditions may also cause our suppliers to be unable to meet their commitments to the Group or to change the credit terms they extend to the Group’s businesses.
• Regular monitoring of order books and other leading indicators, to ensure the Group and each of its businesses can respond quickly to any adverse trading conditions. This includes the identification of cost reduction and efficiency measures.
• Finance for acquisitions is readily available to the Group from banking syndicates. This has proven to be available to the Group even during periods of economic downturn, for example during the global financial crisis in 2008.
Executive management (1)
There continues to be a degree of geopolitical uncertainty in 2018. However, the Board notes that economic uncertainty can depress business valuations and this may increase the number of potential acquisition opportunities for Melrose.
Improve
Buy
Sell
(1) Comprises executive Directors and Melrose senior management.
44M
elro
se In
dus
trie
s P
LC
Ann
ual R
epor
t 201
7

2
7
6
9
8
3
5
4
1
ProbabilityRemote Unlikely Possible Likely Very likely
Very
low
Low
Mod
erat
eH
igh
Very
hig
h
Imp
act
on
finan
cial
co
nditi
on
Key risk Description and impact Mitigation Responsibility Risk trend
Trend commentary
Strategic priorities
Strategic risk
Acquisition of new businesses and improvement strategies
The success of the Group’s acquisition strategy depends on identifying available and suitable targets, obtaining any consents or authorisations required to carry out an acquisition and procuring the necessary financing, be this from equity, debt or a combination of the two. In making acquisitions, there is a risk of unforeseen liabilities being later discovered which were not uncovered or known at the time of the due diligence process. Further, as per the Group’s strategy to buy and improve good but under-performing manufacturing businesses, once an acquisition is completed, there are risks that the Group will not succeed in driving strategic operational improvements to achieve the expected post-acquisition trading results or value which were originally anticipated, that the acquired products and technologies may not be successful or that the business may require significantly greater resources and investment than anticipated. If anticipated benefits are not realised or trading by acquired businesses falls below expectations, it may be necessary to impair the carrying value of these assets. The Group’s return on shareholder investment may fall if acquisition hurdle rates are not met. The Group’s financial performance may suffer from goodwill or other acquisition-related impairment charges, or from the identification of additional liabilities not known at the time of the acquisition.
• Structured and appropriate due diligence undertaken.• Focus on acquisition targets that have strong headline
fundamentals, high-quality products, leading market share but which are underperforming their potential and ability to generate sustainable cash flows and profit growth.
• Hands-on role taken by Directors and other senior employees of the Group.
• Development of strategic plans, restructuring opportunities, capital expenditure and working capital management.
Executive management (1)
As the bid for GKN plc indicates, the Group is currently actively looking to secure its next acquisition and is confident that opportunities will be available.
Improve
Buy
Sell
Timing of disposals
In line with our strategy and depending where the Group is within the “buy, improve, sell” cycle, the expected timing of any disposal of businesses is considered as a principal risk which could have a material impact on the Group strategy. Further, due to the Group’s global operations, there may be a significant impact on timing of disposal due to political and macroeconomic factors. Depending on the timings of disposals and nature of businesses’ operations there may be long-term liabilities which could be retained by the Group following a disposal. Insufficient allowance for such retained liabilities may affect the Group’s financial position.
• Directors are experienced in judging and regularly reviewing the appropriate time in a business cycle for a disposal to realise maximum value for shareholders.
• Each disposal is assessed on its merits, with a key focus on a clean disposal.
Executive management (1)
The responsiveness of the Nortek business to the Melrose methods have meant that disposal may be considered earlier than expected. However, management will remain disciplined and there is no obligation to sell before it is appropriate to do so.
Improve
Buy
Sell
Operational risk
Economic and political
The Group operates, through manufacturing and/or sales facilities, in numerous countries and is affected by global economic conditions. Businesses are also affected by government spending priorities and the willingness of governments to commit substantial resources. Current global economic and financial market conditions, including any fluctuation in commodity prices (in particular, the prices of oil and gas), the potential for a significant and prolonged global recession and any uncertainty in the political environment may materially and adversely affect the Group’s operational performance, financial condition and could have significant impact on timing of acquisitions and disposals.
Following the EU referendum on 23 June 2016, there continues to be some uncertainty in the UK regarding the nature of Brexit and what this will mean for business and the economy. However, the majority of the Group’s revenue is generated in North America, where any effects are expected to be minimal, and the Group remains agile and well positioned to deal with any short-term uncertainty in the UK.
A recession may also materially affect customers, suppliers and other parties with which the Group does business. Adverse economic and financial market conditions may cause customers to terminate existing orders, to reduce their purchases from the Group, or to be unable to meet their obligations to pay outstanding debts to the Group. These market conditions may also cause our suppliers to be unable to meet their commitments to the Group or to change the credit terms they extend to the Group’s businesses.
• Regular monitoring of order books and other leading indicators, to ensure the Group and each of its businesses can respond quickly to any adverse trading conditions. This includes the identification of cost reduction and efficiency measures.
• Finance for acquisitions is readily available to the Group from banking syndicates. This has proven to be available to the Group even during periods of economic downturn, for example during the global financial crisis in 2008.
Executive management (1)
There continues to be a degree of geopolitical uncertainty in 2018. However, the Board notes that economic uncertainty can depress business valuations and this may increase the number of potential acquisition opportunities for Melrose.
Improve
Buy
Sell
(1) Comprises executive Directors and Melrose senior management.
Strategic risk profileOur updated view of the current strategic risk profile is shown below. The residual risk scores have been calculated on a post-mitigation basis.
No Risk rating Risk titleRisk trend since last Annual Report
1 Moderate Acquisition of new businesses and improvement strategies
Decrease
2 Moderate Timing of disposals No change
3 Moderate Economic and political No change
4 Moderate Loss of key management No change
5 Moderate Legal, regulatory and environmental No change
6 Moderate Information security and cyber threat Increase
7 Low Foreign exchange rate No change
8 Low Pensions No change
9 Low Liquidity No change
Strategic Report
45
Mel
rose
Ind
ustr
ies
PLC
A
nnua
l Rep
ort 2
017

Risks and uncertaintiesContinued
Key risk Description and impact Mitigation Responsibility Risk trend
Trend commentary
Strategic priorities
Operational risk continued
Loss of key management
The success of the Group is built upon strong management teams. As a result, the loss of key personnel could have a significant impact on performance, at least for a time. The loss of key personnel or the failure to plan adequately for succession or develop new talent may impact the reputation of the Group or lead to a disruption in the leadership of the business. Competition for personnel is intense and the Group may not be successful in attracting or retaining qualified personnel, particularly engineering professionals.
• Succession planning within the Group and its businesses is coordinated via the Nomination Committee in conjunction with the Board and includes all Directors and senior employees.
• The Company recognises that, as with most businesses, particularly those operating within a technical field, it is dependent on Directors and employees with particular managerial, engineering or technical skills. Appropriate remuneration packages and long-term incentive arrangements are offered in an effort to attract and retain such individuals.
Executive management (1)
Succession planning remains a core focus for the Nomination Committee and the Board. Succession planning of executive Directors and senior management, together with visibility of potential successors within the Group, has been selected as an area for targeted management focus during 2018.
Improve
Buy
Sell
Compliance and ethical risk
Legal, regulatory and environmental
There is a risk that the Group may not always be in complete compliance with laws, regulations or permits, for example concerning environmental requirements. The Group could be held responsible for liabilities and consequences arising from past or future environmental damage, including potentially significant remedial costs. There can also be no assurance that any provisions for expected environmental liabilities and remediation costs will adequately cover these liabilities or costs.
The Group operates in highly regulated sectors. In addition, new legislation, regulations or certification requirements may require additional expense, restrict commercial flexibility and business strategies or introduce additional liabilities for the Group or Directors. For example, the Group’s operations are subject to anti-bribery and anti-corruption, anti-money laundering, competition, anti-trust and trade compliance laws and regulations. Failure to comply with certain regulations may result in significant financial penalties, debarment from government contracts and/or reputational damage and impact our business strategy.
• Regular monitoring of legal and regulatory matters at both a Group and business level. Consultation with external advisers where necessary.
• A robust control framework is in place underpinned by comprehensive corporate governance and compliance procedures at both a Group and business level.
• Due diligence processes during the acquisition stage seek to identify legal, regulatory and environmental risks. At the business level, controls are in place to prevent such risks from crystallising.
• Any environmental risks that crystallise are subject to mitigation by specialist consultants engaged for this purpose. External consultants assist the Group in complying with new and emerging environmental regulations.
• Insurance cover mitigates certain levels of risk.
Executive management (1)
The Group undertakes annual reviews to ensure it has a robust legal and compliance framework and considers the risk to be consistent with prior years.
Improve
Buy
Sell
Information security and cyber threat
Information security and cyber threats are an increasing priority across all industries and remain a key UK government agenda item.
Like many businesses, Melrose recognises that the Group may have a potential exposure in this area. Potential exposure to such risks remains a constant threat to the Group due to the size and complexity of the Group’s operations and the nature of the product portfolio.
• Management continues to work with information security consultants to better understand the extent to which the Group is exposed to cyber security risk and to ensure appropriate mitigations are in place.
• Management has developed an information security strategy to mitigate the Group’s exposure to cyber risk which follows the UK government’s recommended steps on cyber security, covering all the relevant security areas, including: network security; malware protection; active monitoring of information systems and networks; home and mobile working; and incident management.
• This strategy has been successfully implemented across the whole Group with significant progress made during the year and is also subject to regular monitoring, together with the Group’s Business Continuity and Disaster Recovery policies and procedures, supplementing those already in place.
Executive management (1)
Information security and cyber threats are an increasing priority across all industries. Cyber security breaches of the Group’s IT systems could result in the misappropriation of confidential information belonging to it or its customers, suppliers or employees. In response to the increased sophistication of information security and cyber threats, the Group has worked, and continues to work, with external consultants to monitor and refine it’s Group-wide strategy to aid the prevention, identification and mitigation of any threats.
Improve
Buy
Sell
(1) Comprises executive Directors and Melrose senior management.
46M
elro
se In
dus
trie
s P
LC
Ann
ual R
epor
t 201
7

Key risk Description and impact Mitigation Responsibility Risk trend
Trend commentary
Strategic priorities
Operational risk continued
Loss of key management
The success of the Group is built upon strong management teams. As a result, the loss of key personnel could have a significant impact on performance, at least for a time. The loss of key personnel or the failure to plan adequately for succession or develop new talent may impact the reputation of the Group or lead to a disruption in the leadership of the business. Competition for personnel is intense and the Group may not be successful in attracting or retaining qualified personnel, particularly engineering professionals.
• Succession planning within the Group and its businesses is coordinated via the Nomination Committee in conjunction with the Board and includes all Directors and senior employees.
• The Company recognises that, as with most businesses, particularly those operating within a technical field, it is dependent on Directors and employees with particular managerial, engineering or technical skills. Appropriate remuneration packages and long-term incentive arrangements are offered in an effort to attract and retain such individuals.
Executive management (1)
Succession planning remains a core focus for the Nomination Committee and the Board. Succession planning of executive Directors and senior management, together with visibility of potential successors within the Group, has been selected as an area for targeted management focus during 2018.
Improve
Buy
Sell
Compliance and ethical risk
Legal, regulatory and environmental
There is a risk that the Group may not always be in complete compliance with laws, regulations or permits, for example concerning environmental requirements. The Group could be held responsible for liabilities and consequences arising from past or future environmental damage, including potentially significant remedial costs. There can also be no assurance that any provisions for expected environmental liabilities and remediation costs will adequately cover these liabilities or costs.
The Group operates in highly regulated sectors. In addition, new legislation, regulations or certification requirements may require additional expense, restrict commercial flexibility and business strategies or introduce additional liabilities for the Group or Directors. For example, the Group’s operations are subject to anti-bribery and anti-corruption, anti-money laundering, competition, anti-trust and trade compliance laws and regulations. Failure to comply with certain regulations may result in significant financial penalties, debarment from government contracts and/or reputational damage and impact our business strategy.
• Regular monitoring of legal and regulatory matters at both a Group and business level. Consultation with external advisers where necessary.
• A robust control framework is in place underpinned by comprehensive corporate governance and compliance procedures at both a Group and business level.
• Due diligence processes during the acquisition stage seek to identify legal, regulatory and environmental risks. At the business level, controls are in place to prevent such risks from crystallising.
• Any environmental risks that crystallise are subject to mitigation by specialist consultants engaged for this purpose. External consultants assist the Group in complying with new and emerging environmental regulations.
• Insurance cover mitigates certain levels of risk.
Executive management (1)
The Group undertakes annual reviews to ensure it has a robust legal and compliance framework and considers the risk to be consistent with prior years.
Improve
Buy
Sell
Information security and cyber threat
Information security and cyber threats are an increasing priority across all industries and remain a key UK government agenda item.
Like many businesses, Melrose recognises that the Group may have a potential exposure in this area. Potential exposure to such risks remains a constant threat to the Group due to the size and complexity of the Group’s operations and the nature of the product portfolio.
• Management continues to work with information security consultants to better understand the extent to which the Group is exposed to cyber security risk and to ensure appropriate mitigations are in place.
• Management has developed an information security strategy to mitigate the Group’s exposure to cyber risk which follows the UK government’s recommended steps on cyber security, covering all the relevant security areas, including: network security; malware protection; active monitoring of information systems and networks; home and mobile working; and incident management.
• This strategy has been successfully implemented across the whole Group with significant progress made during the year and is also subject to regular monitoring, together with the Group’s Business Continuity and Disaster Recovery policies and procedures, supplementing those already in place.
Executive management (1)
Information security and cyber threats are an increasing priority across all industries. Cyber security breaches of the Group’s IT systems could result in the misappropriation of confidential information belonging to it or its customers, suppliers or employees. In response to the increased sophistication of information security and cyber threats, the Group has worked, and continues to work, with external consultants to monitor and refine it’s Group-wide strategy to aid the prevention, identification and mitigation of any threats.
Improve
Buy
Sell
(1) Comprises executive Directors and Melrose senior management.
Strategic Report
47
Mel
rose
Ind
ustr
ies
PLC
A
nnua
l Rep
ort 2
017
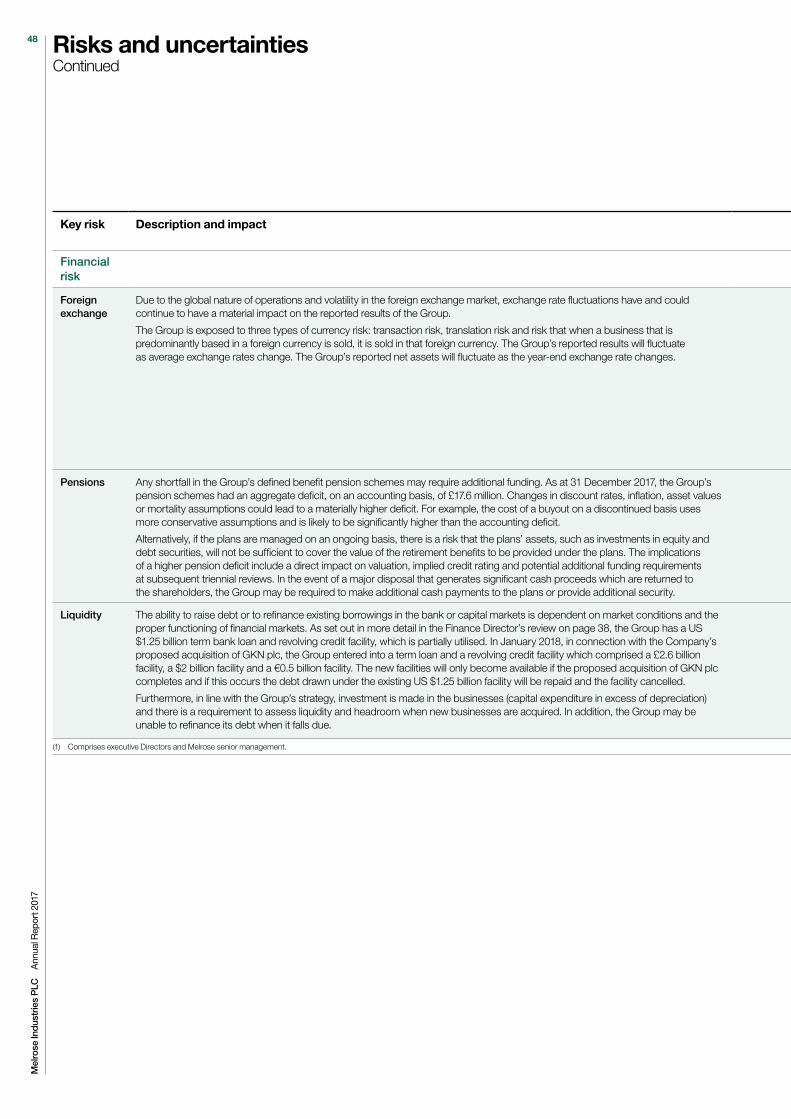
Key risk Description and impact Mitigation Responsibility Risk trend
Trend commentary
Strategic priorities
Financial risk
Foreign exchange
Due to the global nature of operations and volatility in the foreign exchange market, exchange rate fluctuations have and could continue to have a material impact on the reported results of the Group.
The Group is exposed to three types of currency risk: transaction risk, translation risk and risk that when a business that is predominantly based in a foreign currency is sold, it is sold in that foreign currency. The Group’s reported results will fluctuate as average exchange rates change. The Group’s reported net assets will fluctuate as the year-end exchange rate changes.
• The Group policy is to protect against the majority of foreign exchange risk which affects cash, by hedging such risks with financial instruments.
• Protection against specific transaction risks is taken by the Board on a case-by-case basis.
Executive management (1)
Group results are reported in Sterling but a large proportion of its revenues are denominated in currencies other than Sterling. Following the Nortek acquisition, movements between the US Dollar and Sterling and Renminbi and the US Dollar could have a material adverse effect on Group results, whilst exposure remains in Brush against the Czech Koruna and the Euro.
Improve
Buy
Sell
Pensions Any shortfall in the Group’s defined benefit pension schemes may require additional funding. As at 31 December 2017, the Group’s pension schemes had an aggregate deficit, on an accounting basis, of £17.6 million. Changes in discount rates, inflation, asset values or mortality assumptions could lead to a materially higher deficit. For example, the cost of a buyout on a discontinued basis uses more conservative assumptions and is likely to be significantly higher than the accounting deficit.
Alternatively, if the plans are managed on an ongoing basis, there is a risk that the plans’ assets, such as investments in equity and debt securities, will not be sufficient to cover the value of the retirement benefits to be provided under the plans. The implications of a higher pension deficit include a direct impact on valuation, implied credit rating and potential additional funding requirements at subsequent triennial reviews. In the event of a major disposal that generates significant cash proceeds which are returned to the shareholders, the Group may be required to make additional cash payments to the plans or provide additional security.
• The Group’s key funded pension plans, including the Nortek plans, are closed to new entrants and future service accrual. Long-term funding arrangements are agreed with the Trustees and reviewed following completion of actuarial valuations.
• Active engagement with Trustees on pension plan asset allocations and strategies.
Executive management (1)
No structured changes occurred during 2017.
The Group is satisfied that pension liability risks are well mitigated. The net deficit is relatively small for a group of this size.
Improve
Buy
Sell
Liquidity The ability to raise debt or to refinance existing borrowings in the bank or capital markets is dependent on market conditions and the proper functioning of financial markets. As set out in more detail in the Finance Director’s review on page 38, the Group has a US $1.25 billion term bank loan and revolving credit facility, which is partially utilised. In January 2018, in connection with the Company’s proposed acquisition of GKN plc, the Group entered into a term loan and a revolving credit facility which comprised a £2.6 billion facility, a $2 billion facility and a €0.5 billion facility. The new facilities will only become available if the proposed acquisition of GKN plc completes and if this occurs the debt drawn under the existing US $1.25 billion facility will be repaid and the facility cancelled.
Furthermore, in line with the Group’s strategy, investment is made in the businesses (capital expenditure in excess of depreciation) and there is a requirement to assess liquidity and headroom when new businesses are acquired. In addition, the Group may be unable to refinance its debt when it falls due.
• To ensure it has comprehensive and timely visibility of the liquidity position, the Group conducts monthly reviews of its cash forecast, which are in turn revised quarterly.
• The Group operates cash management mechanisms, including cash pooling across the Group and maintenance of revolving credit facilities to mitigate the risk of any liquidity issues.
• The Group operates a conservative level of headroom across its financing covenants which is designed to avoid the need for any unplanned refinancing.
Executive management (1)
The Group is satisfied that it has adequate resources available to meet its liabilities. Improve
Buy
Sell
(1) Comprises executive Directors and Melrose senior management.
Risks and uncertaintiesContinued
48M
elro
se In
dus
trie
s P
LC
Ann
ual R
epor
t 201
7
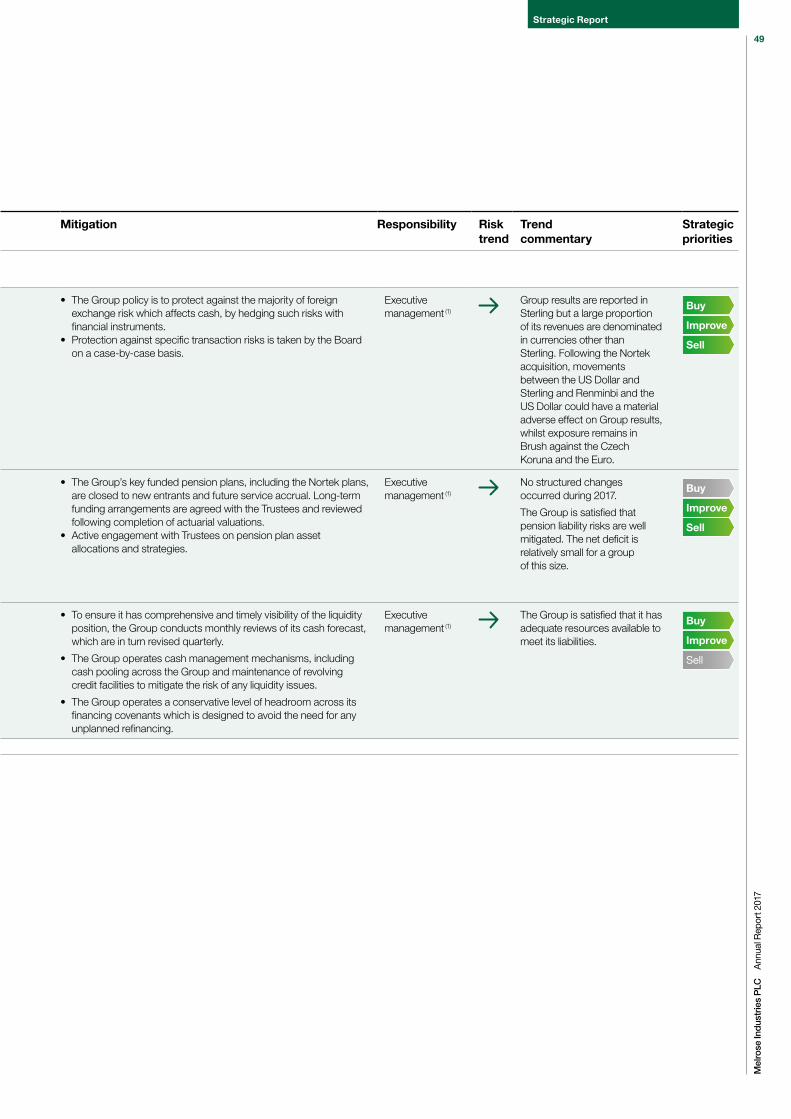
Key risk Description and impact Mitigation Responsibility Risk trend
Trend commentary
Strategic priorities
Financial risk
Foreign exchange
Due to the global nature of operations and volatility in the foreign exchange market, exchange rate fluctuations have and could continue to have a material impact on the reported results of the Group.
The Group is exposed to three types of currency risk: transaction risk, translation risk and risk that when a business that is predominantly based in a foreign currency is sold, it is sold in that foreign currency. The Group’s reported results will fluctuate as average exchange rates change. The Group’s reported net assets will fluctuate as the year-end exchange rate changes.
• The Group policy is to protect against the majority of foreign exchange risk which affects cash, by hedging such risks with financial instruments.
• Protection against specific transaction risks is taken by the Board on a case-by-case basis.
Executive management (1)
Group results are reported in Sterling but a large proportion of its revenues are denominated in currencies other than Sterling. Following the Nortek acquisition, movements between the US Dollar and Sterling and Renminbi and the US Dollar could have a material adverse effect on Group results, whilst exposure remains in Brush against the Czech Koruna and the Euro.
Improve
Buy
Sell
Pensions Any shortfall in the Group’s defined benefit pension schemes may require additional funding. As at 31 December 2017, the Group’s pension schemes had an aggregate deficit, on an accounting basis, of £17.6 million. Changes in discount rates, inflation, asset values or mortality assumptions could lead to a materially higher deficit. For example, the cost of a buyout on a discontinued basis uses more conservative assumptions and is likely to be significantly higher than the accounting deficit.
Alternatively, if the plans are managed on an ongoing basis, there is a risk that the plans’ assets, such as investments in equity and debt securities, will not be sufficient to cover the value of the retirement benefits to be provided under the plans. The implications of a higher pension deficit include a direct impact on valuation, implied credit rating and potential additional funding requirements at subsequent triennial reviews. In the event of a major disposal that generates significant cash proceeds which are returned to the shareholders, the Group may be required to make additional cash payments to the plans or provide additional security.
• The Group’s key funded pension plans, including the Nortek plans, are closed to new entrants and future service accrual. Long-term funding arrangements are agreed with the Trustees and reviewed following completion of actuarial valuations.
• Active engagement with Trustees on pension plan asset allocations and strategies.
Executive management (1)
No structured changes occurred during 2017.
The Group is satisfied that pension liability risks are well mitigated. The net deficit is relatively small for a group of this size.
Improve
Buy
Sell
Liquidity The ability to raise debt or to refinance existing borrowings in the bank or capital markets is dependent on market conditions and the proper functioning of financial markets. As set out in more detail in the Finance Director’s review on page 38, the Group has a US $1.25 billion term bank loan and revolving credit facility, which is partially utilised. In January 2018, in connection with the Company’s proposed acquisition of GKN plc, the Group entered into a term loan and a revolving credit facility which comprised a £2.6 billion facility, a $2 billion facility and a €0.5 billion facility. The new facilities will only become available if the proposed acquisition of GKN plc completes and if this occurs the debt drawn under the existing US $1.25 billion facility will be repaid and the facility cancelled.
Furthermore, in line with the Group’s strategy, investment is made in the businesses (capital expenditure in excess of depreciation) and there is a requirement to assess liquidity and headroom when new businesses are acquired. In addition, the Group may be unable to refinance its debt when it falls due.
• To ensure it has comprehensive and timely visibility of the liquidity position, the Group conducts monthly reviews of its cash forecast, which are in turn revised quarterly.
• The Group operates cash management mechanisms, including cash pooling across the Group and maintenance of revolving credit facilities to mitigate the risk of any liquidity issues.
• The Group operates a conservative level of headroom across its financing covenants which is designed to avoid the need for any unplanned refinancing.
Executive management (1)
The Group is satisfied that it has adequate resources available to meet its liabilities. Improve
Buy
Sell
(1) Comprises executive Directors and Melrose senior management.
Strategic Report
49
Mel
rose
Ind
ustr
ies
PLC
A
nnua
l Rep
ort 2
017

Cor
pora
te S
ocia
l R
espo
nsib
ility
50M
elro
se In
dus
trie
s P
LC
Ann
ual R
epor
t 201
7

Melrose supports and monitors the corporate social responsibility policies, practices and initiatives across its businesses.
Reflecting the decentralised nature of the Group, responsibility for the adoption of policies, practices and initiatives sits at a divisional unit level. This ensures that rigorous and targeted policies and procedures are implemented that meet local regulatory requirements and guidance, whilst also taking into account the size and nature of the business.
The information set out in this Corporate Social Responsibility Report focuses on the initiatives taken during 2017 by each of the four divisions that now make up the Melrose Group. The policies, practices and initiatives set out in this report are indicative of the approach taken with any new business Melrose acquires.
01Employment matters p.52
02Charitable achievements p.53
03Gender diversity p.54
05Health and safety p.56
04The environment p.54
06Supply chain assurance p.57
07Human rights and ethical standards p.57
Strategic Report
51
Mel
rose
Ind
ustr
ies
PLC
A
nnua
l Rep
ort 2
017

Corporate Social ResponsibilityContinued
01the Business Disability Forum, a not-for-profit member organisation that works with the business community to understand the changes required in the workplace in order that disabled persons are treated fairly, so that they can contribute to business success, to society and to economic growth.
Employee involvement, consultation and developmentThe Group places great importance on good labour relations, employee engagement and employee development. The responsibility for the implementation and management of employment practices rests with local management, in a manner appropriate to each business.
A culture of clear communication and employee consultation and engagement is inherent across the Group. Employee briefing sessions with employee representatives are held on a regular basis to communicate strategy, key changes, financial results, achievements and other important issues to employees, and to receive feedback from them on these issues. Regular appraisals, employee surveys, notice boards, team meetings, suggestion boxes and newsletters are also used to communicate and engage with employees, and to solicit their feedback on issues of concern to them.
Extensive training is available to all staff and is actively encouraged to ensure that high standards of skills are maintained across the Group. Inter-departmental training programmes are also put in place across the Group to ensure that skills are shared between operations. The importance of training extends beyond on-the-job training and also focuses on enhancing personal development. In addition, apprenticeship programmes help to assist with training a new generation of employees and to ensure knowledge is retained within the businesses. Employees across the Group are encouraged to think innovatively and to have regard for both financial and economic factors affecting the Group.
The Group regards employee training and advancement as an essential element of industrial relations.
Employee initiativesDuring 2017, a range of employee related initiatives were implemented across the Group:
• The SST division continued its emphasis on improving its products and services through the employee invention process. Three of 2016’s employee submissions have resulted in the grant of patents, and 2017 saw another 36
Employment matters
The Group recognises its responsibilities for the fair treatment of all its current and potential employees, in accordance with legislation applicable to the territories within which it operates, together with relevant guidance on good practice where appropriate.
Employment policies As part of the Group’s decentralised approach, each of Melrose’s businesses is responsible for setting and measuring its own employment and employee related KPIs and, as such, these can vary throughout the Group. However, such measurements will generally include absenteeism, punctuality, headcount and employee relations issues. Any concerns or adverse trends are responded to in a timely manner.
Equal opportunities for appropriate training, career development and promotion are available to all employees within the Group regardless of any disability, gender, religion, race, nationality, sexual orientation or age.
Applications for employment by disabled persons are always fully and fairly considered by the Group and are considered on merit, with regard only to the job-specific requirements and the relevant applicant’s aptitude and ability to carry out the role. Furthermore, as a Group-wide policy and so far as particular disabilities permit, Melrose and each of its businesses will, where practicable, make every effort to provide continued employment in the same role for employees who are disabled during their period of employment or, where necessary, provide such employees with a suitable alternative role, together with appropriate training.
It is the Group’s policy that in recruitment, training, career development and promotion, the treatment of disabled persons should, as far as possible, be identical to that of other employees. Melrose is proud to be a member of
submissions, with five resulting in patent applications (including one design patent issued from efforts by SST’s engineering team in Shenzhen). Several submissions have also resulted in new products and product improvements. The Patent Committee meets monthly to review employee submissions, the committee consisting of inside counsel, outside patent counsel, senior engineering leadership from all offices, and the inventors themselves. Incentives are in place for employees to submit, including financial incentives if submission results in applications filed and patents granted.
• Within our Ergonomics division, Ergotron has conducted over 20 training programmes globally with over 1,700 employees participating. Topics included leadership and management skills training, technical and quality training, product and marketing training, system and process training in addition to wellness and benefits training. Ergotron also has global programmes that provide employees opportunities to enhance their education through educational reimbursement.
• Brush continues to take the health and well-being of its employees seriously and its Occupational Health Service is available to employees four days a week. The service can make referrals to doctors, physiotherapists or counselling services, as required, ensuring that the business supports its employees throughout any periods of absence or illness. Health promotion is a key feature of the service, which is continually developing through awareness campaigns and has had a positive impact on both the employees and the business as a whole. During 2017, Brush GMS, based in Pittsburgh, promoted employee engagement by supporting employee leisure and community/charitable activities such as summer games, family parties and community outreach activities. It has also increased management training resources.
• 165 employees attended the first Air Management Leadership Bootcamp in Itasca, Illinois in April 2017. The Leadership Bootcamp reinforced the Air Management mission and values and key business objectives for 2017. Over the three days, leaders actively engaged in seminars to equip them with specific skills and business tools to support a performance driven culture. Outside business experts led employees through topics such as financial management, team dynamics, and plan execution tools.
52M
elro
se In
dus
trie
s P
LC
Ann
ual R
epor
t 201
7

02Charitable achievements
Hurricane reliefNSC held a drive to help the victims of Hurricane Maria in Puerto Rico and shipped 13 large boxes filled with items such as canned goods, toiletries and clothes to San Juan, Puerto Rico. NSC also used cash donations to buy supplies of food and collected containers of pet supplies for local animal shelters who were taking in dogs rescued from Puerto Rico.
Heart walksSince 2012, Ergotron has made a commitment to sponsor and participate in the American Heart Association’s (AHA) Heart Walks throughout the US. AHA is an organisation whose mission is to improve the lives of all Americans and help people understand the importance of healthy lifestyle choices, which aligns with the Ergotron mission of promoting a healthy environment for life and work. Teams from the business’s Twin Cities, Phoenix and Tualatin offices have raised over $130,000 and look forward to the fundraising activities and the Heart Walk every year.
March of DimesHVAC was once again named one of the top 40 giving companies in West Tennessee for its commitment to investing in its community. One of the excellent causes HVAC supported was March of Dimes, a US non-profit organisation that works to improve the health of mothers and babies by preventing birth defects, premature birth and infant mortality. Approximately 20 employees participated in the walk, which was held in Dyer County, Tennessee in October 2017 and raised $5,000.
Christmas for childrenOn 19 December 2017, HVAC supported a group of local, under-privileged children by donating presents that the children had wished for in their letters to Santa. HVAC employees, along with Santa, attended the surprise Christmas party at their school.
United WayBroan supported United Way of Washington County 2017 Campaign, a non-profit organisation who are dedicated to improving community conditions through support in education, health and financial stability. Broan raised a total of $105,000 through events such as “Dunk Tank”, “Chilli Cook Off” and “School Supplies for Boys and Girls Club.”
Employees of the Group have supported a number of worthwhile charities during 2017.
Here are a few examples of the great contributions that have been made.
Strategic Report
53
Mel
rose
Ind
ustr
ies
PLC
A
nnua
l Rep
ort 2
017

Men 1,479
Women 195
Brush
1,674
Men 1,115
Women 1,323
SST
2,438
Men 3,023
Women 664
HVAC
3,687
Men 1,278
Women 893
AQH
2,171
Men 727
Women 620
Ergotron
1,347
Men 7,645
Women 3,706
Total Group employees
11,351
Corporate Social ResponsibilityContinued
03Gender diversity
The charts opposite show the total number of males and females working within the Group as at 31 December 2017.
Melrose is a meritocracy and individual performance is the key determinant in any appointment, irrespective of ethnicity, gender or other characteristic, trait or orientation. The Board recognises the importance of diversity throughout the workforce and the Board is committed to equality of opportunity for all employees.
The Group currently takes into account a variety of factors before determining suitability for vacancies, including relevant skills to perform the role, experience and knowledge. The most important priority, however, has been and will continue to be ensuring that the best candidate is selected.
Melrose notes the recommendations of Lord Davies’ review, “Women on Boards” and continues to encourage gender diversity throughout the Group. Although not appropriate to set specific gender diversity targets at Board level and throughout the Group’s workforce due to Melrose’s strategic business model and frequent turnover of businesses, Melrose is actively engaged in finding ways to increase the Group’s diversity.
04The environment
The Melrose Board fully understands the importance of the Group’s environmental responsibilities and is committed to ensuring that operations have the minimum possible adverse effect on the environment.
Although there are no standardised environmental KPIs currently used within the Group, the Group ensures businesses understand the importance of monitoring the impact of their operations on the environment. A range of KPIs are used as environmental measures, including energy consumption, CO2 emissions, water consumption, water contamination, waste disposal, solid and liquid waste generation, recycling and volatile organic compound emissions. These KPIs are then used to plan for ongoing improvements.
During the year, the Company continued to comply with the ongoing annual reporting requirements of the UK’s Carbon Reduction Commitment Energy Efficiency Scheme.
54M
elro
se In
dus
trie
s P
LC
Ann
ual R
epor
t 201
7

Environmental initiativesDuring 2017, a range of environmental initiatives were implemented within the Group’s divisions. Some of these are listed below:
• SST continues to make its environmental awareness and compliance one of its highest priorities. The various sites continue to evaluate their operations and strive to make improvements to reduce their environmental global footprint. The manufacturing site located in China completed seven energy and emissions reduction projects, as well as adding exhaust filtration and tin slag recovery systems. Continued improvements in cardboard, pallets, paper and universal waste systems have been implemented throughout the continental US. SST’s Chinese site’s efforts resulted in a 4% reduction in electrical consumption and a 2% drop in paper consumption. Continued improvements are planned for 2018 including the review and reduction of the hazardous material quantities/hazard level as directed by ISO 14001 standard, improving and increasing waste recycling systems, and reducing their carbon footprint.
• Ergotron maintained the environmental certification ISO 14001:2004 in its locations in Eagan, Minnesota, EMEA, and Asia Pacific and added ISO 14001:2015 in Asia Pacific. The division focused throughout the year on reducing its impact on the environment, resulting in 95% of waste materials at its EMEA, Eagan and Minnesota locations being recycled. The Asia Pacific sites have decreased the loss of main raw material (scrap rate 0.2% maximum) and decreased the electricity wasted by 3% compared with 2016.
• The Air Management division rolled out an environmental inspection process at facility level which will be audited in early 2018. In 2017, the Air Management division worked closely with insurers to successfully address employee related inspection items with 22 items being addressed.
• Brush continued its focus on making further energy savings, including in gas and electricity consumption. Through more effective energy management and greater employee engagement, electricity consumption for lighting at its Czech operations was reduced by 5%, whilst heating consumption was the lowest in the location’s history again. Lighting initiatives across the Loughborough site continue with ad hoc upgrades which continue to generate savings for the business. The Loughborough site is also working towards environmental management standard ISO 14001:2015 transition. The site is also in the process of replacing existing lighting with LED luminaires which will deliver an annual reduction of 83.5 tonnes of CO
2 and 35.04kw reduction of light load.
Greenhouse gas emissionsThe Group is required to measure and report its direct and indirect greenhouse gas (GHG) emissions pursuant to the Companies Act 2006 (Strategic Report and Directors’ Reports) Regulations 2013. The emissions associated with the purchase of the Nortek Group in 2016 have been included in the report for the first time and account for the significant year-on-year increase in emissions. However, the intensity measure decreased by over 60% year on year. The year-on-year like-for-like emissions, removing the Nortek group emissions, decreased by approximately 20% due to a significant reduction in gas and electricity usage.
Global GHG emissions data for period 1 January 2017 – 31 December 2017 (tonnes CO2e
(1) unless stated)
Emissions sources: 2017 2016(2) Change
Combustion of fuel & operation of facilities 23,680 7,122 +232%
UK electricity 3,236 3,717 -13%
Overseas electricity 33,273 9,008 +269%
Total purchased electricity 36,509 10,689 +242%
Other purchased energy 2,027 2,035 -0.4%
Company’s chosen intensity measurement:Emissions reported above normalised to tonnes per£1,000 turnover
0.030 0.081 -63%
(1) CO2e – carbon dioxide equivalent, this figure includes greenhouse gases in addition to carbon dioxide.(2) The 2016 emissions data does not include the Nortek businesses as they were acquired part way through that year.
The GHG reporting period is aligned to the Company’s financial reporting year.
The data has been prepared in accordance with the principles and requirements of the Greenhouse Gas Protocol, Corporate Accounting and Reporting Standard (Revised Edition) 2004 for Scope 1 and Scope 2 emissions and the Department for Environment, Food & Rural Affairs (DEFRA) guidance on how to measure and report on greenhouse gas emissions, as first published in 2013 and subsequently updated.
We have reported on all emission sources required under the Companies Act 2006 (Strategic Report and Directors’ Reports) Regulations 2013.
All material emissions from within the organisational and operational scope and boundaries of the Group are reported. The emissions from owned vehicle transport (i.e. Group owned cars and vans, lorries and fork lift trucks) and the emissions associated with refrigeration have been excluded from the report on a de minimis basis.
Given that the Melrose business model is to acquire and divest businesses over a three to five-year time frame, there may be significant year-on-year changes in the reported emissions data which may not reflect the underlying GHG performance of the Group’s businesses.
Strategic Report
55
Mel
rose
Ind
ustr
ies
PLC
A
nnua
l Rep
ort 2
017

Corporate Social ResponsibilityContinued
For more information on the Group’s health and safety KPIs, see the key performance indicators section on pages 18 to 19 of the Strategic Report.
A number of sites within the Group hold the ISO 18001 certification, the internationally recognised assessment standard for occupational health and safety management systems, including Brush’s manufacturing locations in the UK and the Czech Republic and Ergotron’s Asia Pacific sites. GBIS Huizhou China is also ISO 14001 registered.
The Air Management division’s Tualatin facility earned its fifth year SHARP Award (Safety & Health Achievement Recognition Programme). SHARP is an intensive, five-year safety programme and the site was presented with its certificate in January 2018. The site will be pursuing the Voluntary Protection Programme – the next step up in safety excellence after SHARP – which is a federally recognised OSHA safety programme that continues to build effective, world class safety culture and performance.
Brush GMS is ISO 9001:2008 (quality management system) accredited and will be transitioning to ISO 9001:2015 during 2018. SST’s Carlsbad and Shenzhen sites are both ISO 9001 (Quality Management) and 13485 (Quality Management for medical devices) certified.
During 2017, a range of health and safety initiatives were implemented across the Group including Safety Councils, 190 certifications and wellness programmes, designed to promote a strong health and safety catalogue at local levels, some of which are listed below:
• HVAC rolled out their Safety Council early in 2017. The team worked on facility communication across all locations, harmonising policies, and developing or sharing best practices. As a result of these actions, they had great success in reducing the recordable injury rate by 16% over the year. During 2018 HVAC, along with all of Air Management, will engage
with DEKRA to further develop a safety driven culture. All locations will be evaluated to determine the level of understanding and status of leadership involvement. These evaluations will lead to future tasks and plans to grow awareness and develop a safety driven culture.
• Brush’s behavioural safety programme is designed to improve the strong health and safety culture within the business. The programme focuses on developing a proactive approach among Brush employees so that they increase responsibility and accountability for their own and their working group’s actions while ensuring they intervene at the earliest opportunity to stop hazardous acts or correct any unsafe conditions. It is intended to refresh the behavioural safety programme during 2018. At Brush Electrical Machines in Loughborough there has been increased focus on accident prevention by issuing Safety Alerts, implementing management “walk-abouts” to hazard “hot-spots” and improved, more efficient reporting and closing of incidents. The result was a significant decrease in the number of lost days in 2017.
Following these initiatives, among others, the Group has recognised the benefits of a workforce engaged in matters of health and safety, management teams committed to the continuous improvement of health and safety standards throughout the Group’s businesses and a recognition that a strong health and safety focus can have a positive impact on growth and brand value.
05Health and safety
The Board is committed to minimising the health and safety risks that each Group employee is exposed to by promoting the effective use and management of business-specific policies and procedures.
The Group has a policy to ensure that the Directors are made aware of any serious health and safety incidents, wherever they occur in the world, without delay, to ensure that suitable investigations and corrective action can be organised. Current events and issues relating to health and safety matters are also discussed within the Group at quarterly Board meetings of the Company.
Each division is responsible for setting its own detailed arrangements concerning health and safety policies and procedures, in accordance with local health and safety legislation. As a general rule, they strive to achieve best practice in terms of what is suitable and practical for the size and nature of their operations. Defined and business-specific health and safety key performance indicators are also used. Reports detailing each division’s performance in relation to three health and safety KPIs (major accident frequency rate, accident frequency rate and accident severity rate) are presented to the Melrose Board and reviewed at each quarterly Board meeting.
There were no material issues or concerns identified by the Board during 2017. While no corrective measures were deemed necessary, the Board continues to encourage management to remain vigilant where employee and third party safety is concerned.
56M
elro
se In
dus
trie
s P
LC
Ann
ual R
epor
t 201
7

06Supply chain assurance
Each of the businesses is responsible for the management of its supplier base, including the application of the appropriate policy, which best suits the geographical and operational diversity of the Group.
The security, assurance and ethical compliance of business supply chains are very important to Melrose and its businesses. Responsibility for the implementation and management of all supplier-related policies rests with local management. Such policies are used in a manner appropriate to the size and complexity of the business and also take into account the nature and geographical representation of key suppliers. A supplier approval process exists within all business divisions, which is linked to specific and tailored supplier assessments and due diligence requirements utilising third party resources and the implementation of appropriate terms and conditions for the protection of the Group.
07Human rights and ethical standards
Sound business ethics and integrity are core to the Group’s values and a high importance is placed on dealings with all employees, customers, suppliers and other stakeholders.
The decentralised nature of the Group means there is no over-arching policy currently in place with regard to human rights, however Melrose is committed to good practice in respect of human rights. Employees across the Group are required, at all times, to exhibit the highest levels of integrity and to maintain the highest ethical standards in business affairs. The full text of the Melrose Code of Ethics, which all employees of the Group are required to familiarise themselves with, can be found on the Company’s website at: www.melroseplc.net/about-us/code-of-ethics
In addition to the Melrose Code of Ethics, each Group business is expected to have its own code of ethics dealing with matters such as human rights. All business-specific employee policies are prepared locally within each business in order to ensure compliance with local laws and standards as a minimum. Responsibility for the communication and implementation of such policies rests with the relevant senior managers within the Group’s businesses.
Finally, the Company produced its first Modern Slavery Statement in June 2017 in accordance with the Modern Slavery Act 2015 which is available at: www.melroseplc.net/media/1412/msa-policy.pdf . The Group has taken steps to implement effective and proportionate procedures to ensure that there are no forms of modern slavery in the Group’s business or supply chains. This has included the roll out of a new policy regarding the prevention of modern slavery and human trafficking to all businesses and online training for employees.
The Strategic Report, as set out on pages 2 to 57, has been approved by the Board
On behalf of the Board
Simon PeckhamChief Executive20 February 2018
Strategic Report
57
Mel
rose
Ind
ustr
ies
PLC
A
nnua
l Rep
ort 2
017

GovernanceGovernance overview 60
Board of Directors 62
Directors’ report 64
Corporate governance report 68
Audit Committee report 72
Nomination Committee report 78
Directors’ remuneration report 80
Statement of Directors’ responsibilities 91
The Board remains committed to maintaining the high standards of corporate governance required to ensure that Melrose can continue to deliver its strategy to the benefit of shareholders.
58M
elro
se In
dus
trie
s P
LC
Ann
ual R
epor
t 201
7

Gov
erna
nce
Governance
59
Mel
rose
Ind
ustr
ies
PLC
A
nnua
l Rep
ort 2
017

Governance overview
extensive financial and accounting experience, including her role as Chairman of the Audit Committee for Novo Nordisk A/S, Savills plc. and the House of Lords Commission.
Mr David Lis took up the role of Chairman of the Nomination Committee on conclusion of the 2017 AGM, having served on the Committee since joining the Melrose Board in 2016. Mr Lis brings a wealth of experience to the role, including as non-executive Director of Electra Private Equity PLC and BCA Marketplace plc.
On the recommendation of the Nomination Committee, the Board decided to increase the number of independent Directors following Mr Grant’s retirement so that they comprised the majority of the members of the Board. Therefore, external recruitment consultants Stonehaven International were retained to identify suitable candidates for the Board’s consideration. Stonehaven International provided an initial list of potential candidates which the Nomination Committee reviewed and produced a shortlist of candidates, from which several candidates were invited to interview with members of the Committee. Mr Archie G. Kane was identified as the Board’s preferred candidate and accepted the offer of appointment subject to certain necessary approvals. Those approvals were granted and Mr Kane was appointed to the Board on 5 July 2017.
Following Mr Kane’s appointment, the Committee continued its search for a fifth independent non-executive Director. However, at the time the Company’s approach to GKN plc was made public, the appropriate candidate had not been identified and the search for the fifth independent non-executive Director was put on hold until the acquisition process has concluded.
RemunerationThe Directors’ Remuneration Report, comprising the Annual Report on Remuneration, is available on pages 80 to 90.
The Company’s former long-term incentive plan, the Incentive Plan (2012), crystallised on 31 May 2017 and, following shareholder approval at a general meeting on 11 May 2017 (the General Meeting), was replaced by a new scheme, the Incentive Plan (2017), on equivalent economic terms. The Incentive Plan (2012) had been central to the Company’s exceptional performance since its establishment in creating £3.6 billion of shareholder value over its performance period. Approval was also sought and granted at the General Meeting for a new Directors’ Remuneration Policy to be adopted in order to incorporate, and allow for awards to be made under, the Incentive Plan (2017). The Incentive Plan (2017) is on equivalent economic principles as the Incentive Plan (2012) with additional, shareholder focused features, as set out in the circular to shareholders (available at www.melroseplc.net/investors/shareholder-information/shareholder-meetings). The only change to the new Directors’ Remuneration Policy as compared to the policy approved by shareholders at the 2016 AGM is to reflect the inclusion of the Incentive Plan (2017) in place of the Incentive Plan (2012). All other elements remained the same as approved at the 2016 AGM.
Melrose’s remuneration philosophy remains unchanged; executive remuneration should be simple, transparent, support the delivery of the Melrose value creation strategy and only pay for performance.
Christopher MillerExecutive Chairman
“ The Board remains committed to maintaining the high standards of corporate governance required to ensure that the Company can continue to deliver on its strategic goals and to achieve long-term success for the benefit of its shareholders.”
Introduction from the Chairman As part of this approach, the Board supports, applies and complies with the Main Principles, the Supporting Principles and the respective related provisions of corporate governance contained in the UK Corporate Governance Code (the Code) issued by the Financial Reporting Council (the FRC) and available to view on the FRC’s website at: www.frc.org.uk
In support of this commitment, the Board carried out a number of key governance activities during 2017 designed to ensure that Melrose remains compliant with the provisions of the Code and to enable continuous improvement in line with best practice corporate governance guidelines.
Succession planningSuccession planning was an area of focus for Melrose in 2017. The Nomination Committee and the Board have considered the leadership needs of the Group, present and future, together with the skills and experiences needed from its Directors going forward. We recognise that succession planning is an ongoing process and is critical to maintaining an effective and high-quality board.
Mr John Grant retired from the Board at the conclusion of the 2017 AGM in May. At the time of his retirement, Mr Grant was the Senior Independent Director and Chairman of the Audit Committee. His departure therefore led to a change in the composition of a number of the independent non-executive positions of the Board and Committees.
Mr Justin Dowley, who has served as a non-executive Director since 2011, took up the role of Senior Independent Director of the Board at the conclusion of the 2017 AGM, while continuing to perform his role as the Chairman of the Remuneration Committee. Ms Liz Hewitt stood down as Chairman of the Nomination Committee on conclusion of the 2017 AGM to take up the role of Chairman of the Audit Committee vacated by Mr Grant. Ms Hewitt had served as a member of the Audit Committee since joining the Board as a non-executive Director in 2013 and brings to the role
60M
elro
se In
dus
trie
s P
LC
Ann
ual R
epor
t 201
7

Executive Chairman 1
Executive Directors 3
Non-executive Directors 4
Board composition
Independent 4
Non-independent 4
Board independence
Male 7
Female 1
Board diversity
Board structure
Main responsibilities of the Board: • Effectively manage and control the Company via a
formal schedule of matters reserved for its decision
• Determine and review Company strategy and policy
• Consider acquisitions, disposals and requests for major capital expenditure
• Review trading performance
• Ensure that adequate funding and personnel are in place
• Maintain sound internal control systems
• Report to shareholders and give consideration to all other significant financial matters
• Agree Board succession plans and consider the evaluation of the Board’s performance over the preceding year
• Review the Group’s risk management and internal control systems
• Determine the nature and extent of the risks the Group is willing to take
• Agree the Group’s governance framework and approve Group governance policies
Audit Committee report p.72
Nomination Committee report p.78
Directors’ remuneration report p.80
Risk management and complianceMelrose has implemented a uniform Enterprise Risk Management programme across all its business units. Brush continues to manage and monitor its programme and the Nortek businesses have fully embedded our processes and procedures.
The Group’s compliance policies have been fully implemented across all Nortek business units and continue to be monitored to ensure their effectiveness for the enlarged Group. Taken together, these initiatives have ensured the Nortek businesses’ effectiveness at identifying and managing risks and have promoted and embedded a more risk-aware culture. Further details on the Group’s management of risk can be found on pages 42 to 43 of this Annual Report.
Melrose’s reputation for acting responsibly plays a critical role in its success as a business and its ability to generate shareholder value. We maintain high standards of ethical conduct and take a zero tolerance approach to bribery, corruption, modern slavery and human trafficking and any other unethical or illegal practices. Supporting our updated compliance policies are a comprehensive online training platform and an industry-leading whistleblowing reporting facility. The integrity of the compliance framework is further reinforced by the use of independent assurance and compliance audits.
Engagement with shareholdersDuring 2017, the Company continued its programme of engagement with major investors and the governance bodies in respect of our Remuneration Policy and incentive arrangements. In particular, the Chairman of the Remuneration Committee and other members of the Board met with major shareholders prior to the implementation of the Incentive Plan (2017), which was well supported by shareholders. The Board is pleased with the support and constructive feedback throughout these discussions and it is our intention to continue this programme for the foreseeable future. Further engagement with key shareholders and governance bodies has been a central part of our bid for GKN plc and has continued in our lead up to the 2018 AGM.
Christopher Miller Executive Chairman 20 February 2018
Governance
61
Mel
rose
Ind
ustr
ies
PLC
A
nnua
l Rep
ort 2
017

Executives
Christopher MillerExecutive Chairman
Year appointedAppointed as Executive Chairman on 29 May 2003.
Skills and experienceChristopher’s long-standing involvement in manufacturing industries and private investment brings a wealth of experience to the Board.
A Chartered Accountant, Christopher qualified with Coopers & Lybrand, following which he was an Associate Director of Hanson plc. In September 1988, Christopher joined the board of Wassall PLC as its Chief Executive. Between October 2000 and May 2003, Christopher was involved in private investment activities.
Board meetings attended 4
Business reviews attended 3
Other significant appointments
• Trustee of the Prostate Cancer Research Centre
Committee membership
• Nomination
Independent
Not applicable
Board of Directors
David RoperExecutive Vice-Chairman
Year appointedAppointed as Executive Vice-Chairman on 9 May 2012, having previously served as Chief Executive from May 2003.
Skills and experienceFrom a wide range of roles in corporate finance, private investment and management in manufacturing industries, David brings significant investment, financial and operational expertise.
A Chartered Accountant, David qualified with Peat Marwick Mitchell, following which he worked in the corporate finance divisions of S.G. Warburg, BZW and Dillon Read. In September 1988, David was appointed to the board of Wassall PLC, before becoming its deputy Chief Executive in 1993. Between 2000 and 2003, David was involved in private investment activities and served as a non-executive Director on the boards of two companies in France.
Board meetings attended 4
Business reviews attended 3
Independent
Not applicable
Simon PeckhamChief Executive
Year appointedAppointed as Chief Executive on 9 May 2012, having previously served as Chief Operating Officer from May 2003.
Skills and experienceSimon provides widespread expertise in corporate finance, mergers and acquisitions, strategy and operations. Simon qualified as a solicitor in 1986, before moving to Wassall PLC in 1990, where he became an executive Director in 1999. Between October 2000 and May 2003, Simon worked for the equity finance division of The Royal Bank of Scotland where he was involved in several high profile transactions.
Board meetings attended 4
Business reviews attended 3
Other significant appointments
• Non-executive Director of Greensphere Capital PLC
Independent
Not applicable
Geoffrey MartinGroup Finance Director
Year appointedAppointed as Group Finance Director on 7 July 2005.
Skills and experienceGeoffrey provides considerable public company experience and expertise in corporate finance, raising equity finance and financial strategy. A chartered accountant, Geoffrey qualified with Coopers & Lybrand, where he worked within the corporate finance and audit departments. In 1996, Geoffrey joined Royal Doulton PLC, serving as Group Finance Director from October 2000 until June 2005. During this time, Geoffrey was involved in a number of projects, including raising public equity, debt refinancing and the restructuring and outsourcing of the manufacturing and supply chain.
Board meetings attended 4
Business reviews attended 3
Independent
Not applicable
62M
elro
se In
dus
trie
s P
LC
Ann
ual R
epor
t 201
7

Non-executive
Justin DowleySenior Independent Non-executive Director
Year appointedAppointed as a non-executive Director on 1 September 2011 and took up the role of Senior Independent Director on the retirement of John Grant at the conclusion of the 2017 AGM.
Skills and experienceAppointed as Senior Independent Director on 11 May 2017. Justin has extensive experience with over 35 years spent within the banking, investment and asset management sector. A Chartered Accountant, Justin qualified with Price Waterhouse and was latterly Vice Chairman of EMEA Investment Banking, a division of Nomura International plc. He was also a founder partner of Tricorn Partners, Head of Investment Banking at Merrill Lynch Europe and a Director of Morgan Grenfell.
Board meetings attended 4
Business reviews attended 3
Other significant appointments
• Non-executive Director of Scottish Mortgage Investment Trust PLC
• Director of a number of private companies
• Steward of the Jockey Club• Deputy Chairman of The Panel
on Takeovers and Mergers (with effect from 1 May 2018)
Committee membership
• Audit • Nomination • Remuneration (Chairman)
Independent
Yes
Liz HewittIndependent Non-executive Director
Year appointedAppointed as a non-executive Director on 8 October 2013.
Skills and experienceLiz has extensive business, financial and investment experience gained from a number of senior roles in international companies. A Chartered Accountant, Liz qualified with Arthur Andersen & Co., following which she held a variety of positions within Gartmore Investment Management, CVC and 3i Group plc. Between 2004 and 2011, Liz was the Group Director of Corporate Affairs for Smith & Nephew plc, following a secondment to the Department for Business, Innovation and Skills and the HM Treasury, where Liz worked to establish The Enterprise Capital Fund.
Board meetings attended 4
Business reviews attended 3
Other significant appointments
• Non-executive Director of Novo Nordisk A/S, Savills plc, Silverwood Property Ltd, St George’s Fields Ltd and St George’s Fields (No2) Ltd
• Independent Member of the House of Lords Commission
Committee membership
• Audit (Chairman)(1) • Nomination• Remuneration
Independent
Yes
David LisIndependent Non-executive Director
Year appointedAppointed as a non-executive Director on 12 May 2016.
Skills and experienceDavid has held several senior roles in investment and fund management and brings extensive financial experience to the Board. David commenced his career at NatWest, and held positions at J Rothschild Investment Management and Morgan Grenfell after which David founded Windsor Investment Management. David joined Norwich Union Investment Management in 1997 (later merging to form Aviva Investors), before becoming Head of Equities in 2012 and latterly Chief Investment Officer, Equities and Multi Assets, until his retirement in March 2016.
Board meetings attended 4
Business reviews attended 3
Other significant appointments
• Non-executive Director of Electra Private Equity PLC and BCA Marketplace plc
Committee membership
• Audit • Nomination (Chairman)(1)
• Remuneration
Independent
Yes
Archie G. KaneIndependent Non-executive Director
Year appointedAppointed as a non-executive Director on 5 July 2017.
Skills and experienceArchie qualified as a Chartered Accountant with Mann Judd Gordon and Company. After a move into the financial services sector as Group Financial Controller of the TSB subsidiary United Dominions Trust, Archie became Group Strategy Director. Archie later served in senior roles for Lloyds Bank and was CEO of the former mutual Scottish Widows in 2003. In 2009 he moved to become Group Executive Director for all the group’s insurance businesses and for Scotland, until his retirement in May 2011. Archie continues to serve as a non-executive Governor of the Board of Bank of Ireland.
Board meetings attended 2
Business reviews attended 1
Other significant appointments
• Non-executive Governor of the Board of Bank of Ireland
Committee membership
• Audit • Nomination • Remuneration
Independent
Yes
(1) From conclusion of the 2017 AGM.
Governance
63
Mel
rose
Ind
ustr
ies
PLC
A
nnua
l Rep
ort 2
017

Mel
rose
Ind
ustr
ies
PLC
A
nnua
l Rep
ort 2
017
Directors’ report
Post Balance Sheet eventsIn January 2018, in connection with the Company’s proposed acquisition of GKN plc, the Group entered into a facilities agreement for acquisition financing facilities. Further details of the financing facilities are set out on page 67.
On 1 February 2018, the Company announced its formal offer to acquire GKN plc on terms of 1.49 Melrose shares and 81 pence per GKN share.
On 1 February 2018, the Company announced that it had entered into consultations with employees regarding the intended closure of the turbogenerator production facility at Ridderkerk, Netherlands and the transfer of its 4-pole turbogenerator production to the facility in Plzen , Czech Republic. In the UK, Brush has entered into consultation with its workforce about the future of 2-pole turbogenerator production at the Loughborough, UK facility, which accounts for approximately half the workforce at the site.
The cash cost of these restructuring items is estimated to be £40 million and is expected to be materially complete by the end of 2018.
Capital structureAs set out in detail on pages 43 to 46 of the prospectus published by the Company on 6 July 2016 in connection with the Rights Issue (the Prospectus), upon completion of the acquisition of Nortek on 31 August 2016 the listing of the Company’s ordinary shares on the premium segment of the Official List was cancelled, and on that date the Company announced that its ordinary shares had been re-admitted to the standard segment of the Official List (Readmission).
The Company stated in the Prospectus that, following Readmission, the Directors intended to seek a Premium Listing for Melrose as soon as reasonably practicable, subject to meeting the eligibility criteria contained in Chapter 6 of the Listing Rules. On 26 April 2017, the Company’s ordinary shares were admitted to the premium segment of the Official List.
On 31 May 2017 the Incentive Plan (2012) crystallised as planned. As further detailed in the Directors’ Remuneration Report, 23,494 options over the incentive shares under the Incentive Plan (2012) (the Incentive Shares (2012)) were cash cancelled immediately prior to crystallisation, following which the remaining 26,506 options in issue over the Incentive Shares (2012) were exercised on 30 May 2017 in exchange for 26,506 Incentive Shares (2012), which were issued on 31 May 2017 and converted into 54,453,914 new ordinary shares in the Company (2012 Incentive Plan Crystallisation). As a result, the issued share capital of the Company increased to 1,941,200,503 ordinary shares of 48/7 pence each. Further details regarding the crystallisation of the Incentive Plan (2012) are available in the circular posted to shareholders on 7 April 2017 available at https://www.melroseplc.net/media/1728/21347274-_-1-_circular.pdf and in the Directors’ Remuneration Report.
On 29 June 2017 certain participants in the Incentive Plan (2017), including the executive Directors, exercised options to subscribe for the incentive shares under the Incentive Plan (2017) (the Incentive Shares (2017)) and on the same date the Company issued 12,831 Incentive Shares (2017) for a subscription price of £1.00 per option exercised (2017 Option Exercise). The Incentive Shares (2017) do not carry voting rights. Following the issuance, the Company’s issued share capital now consists of 1,941,200,503 ordinary shares of 48/7 pence each, with each ordinary share carrying the right to one vote, and 12,831 Incentive Shares (2017) which do not carry the right to vote. Further details regarding the Incentive Plan (2017) are available in the circular posted to shareholders on 7 April 2017 at https://www.melroseplc.net/media/1728/21347274-_-1-_circular.pdf
The Directors of Melrose Industries PLC present their Annual Report and audited financial statements of the Group for the year ended 31 December 2017.
Incorporated informationThe Corporate Governance Report set out on pages 68 to 71, the Finance Director’s review on pages 32 to 40 and the Corporate Social Responsibility section of the Strategic Report on pages 50 to 57 are each incorporated by reference into this Directors’ Report.
Disclosures elsewhere in the Annual Report are cross-referenced where appropriate. Taken together, they fulfil the combined requirements of the Companies Act 2006 (the Act) and of the Disclosure and Transparency Rules (the DTRs) and the Listing Rules of the Financial Conduct Authority.
AGMThe Annual General Meeting of the Company will be held at Saddlers’ Hall, 40 Gutter Lane, London EC2V 6BR at 11 a.m. on 10 May 2018. The notice convening the meeting is shown on pages 156 to 161 and includes full details of the resolutions to be proposed, together with explanatory notes in relation to such resolutions (the AGM Notice).
DirectorsThe Directors of the Company as at the date of this Annual Report, together with their biographical details, can be found on pages 62 to 63.
Changes to the Board during the year are set out in the Corporate Governance Report on pages 68 to 71. Details of Directors’ service contracts are set out in the Directors’ Remuneration Report on pages 80 to 90.
The statement of Directors’ responsibilities in relation to the consolidated financial statements is set out on page 91, which is incorporated into this Directors’ Report by reference.
Appointment and removal of Directors and their powersThe Company’s articles of association (Articles) give the Directors the power to appoint and replace other Directors. Under the terms of reference of the Nomination Committee, any appointment must be recommended by the Nomination Committee for approval by the Board.
Pursuant to the Articles and in line with the Code, all of the Directors of the Company are required to stand for re-election on an annual basis. With the exception of Mr Archie G. Kane who will be standing for election for the first time following his appointment on 5 July 2017, all current Directors of the Company will be standing for re-election by the shareholders at the forthcoming AGM.
The Directors are responsible for managing the business of the Company and exercise their powers in accordance with the Articles, directions given by special resolution and any relevant statutes and regulations.
Insurance and indemnitiesIn accordance with the Articles and the indemnity provisions of the Act, the Directors have the benefit of an indemnity from the Company in respect of any liabilities incurred as a result of their office. This indemnity is provided both within the Articles and through a separate deed of indemnity between the Company and each of the Directors.
The Company has taken out an insurance policy in respect of those liabilities for which the Directors may not be indemnified. Neither the indemnities nor the insurance provides cover in the event that a Director is proved to have acted dishonestly or fraudulently.
64

The table below shows details of the Company’s issued share capital as at 31 December 2016; immediately following the 2012 Incentive Plan Crystallisation on 31 May 2017; immediately following the 2017 Option Exercise; and as at 31 December 2017.
Share class 31 December 2016
31 May 2017(2012 Incentive Plan
Crystallisation)
29 June 2017(2017 Option
Exercise) 31 December 2017
Ordinary shares of 48/7 pence each 1,886,746,589(1) 1,941,200,503(2) 1,941,200,503 1,941,200,503
Incentive Shares (2017) Nil Nil 12,831(3) 12,831
(1) These ordinary shares were issued pursuant to the general authorities granted by the Company’s shareholders in accordance with section 551 and section 570 of the Act at a general meeting of the Company held on 25 July 2016. The terms of this issue were fixed on 8 August 2016 following a meeting of a transaction committee of the Board.
(2) Includes 54,453,914 ordinary shares issued on 31 May 2017 in connection with the 2012 Incentive Plan Crystallisation pursuant to the authority contained in Article 6(L) of the Company’s articles of association, with a sum of £3,733,982.68 standing to the credit of the Company’s merger reserve being capitalised in order to pay up such shares in full.
(3) The Incentive Plan (2017) was approved by the Company’s shareholders at a general meeting of the Company held on 11 May 2017, and these Incentive Shares were issued pursuant to the authority granted at such meeting to issue Incentive Shares up to an aggregate nominal amount of £50,000.
The Company’s incentive shares may only be transferred with the prior written consent of the Board (such consent expressly provided in respect of transfers to personal trusts, companies wholly-owned by the relevant holder and certain of their close relatives).
The Company is not aware of any agreements between shareholders that restrict the transfer of ordinary shares in the Company.
Articles of associationThe Articles may only be amended by a special resolution at a general meeting of the shareholders of the Company. There are no amendments proposed to be made to the Articles at the forthcoming AGM.
Substantial shareholdingsAs at 31 December 2017, the following voting interests in the ordinary share capital of the Company, disclosable under DTR 5, had been notified to the Directors:
Shareholder Shareholding
% of ordinary share capital as at 31 December 2017
Fidelity Mgt & Research 170,830,412 8.80
BlackRock Inc 152,914,793 7.88
Old Mutual 141,394,166 7.28
Ameriprise Financial 120,163,145 6.19
Aviva plc 108,680,727 5.60
Affiliated Managers Group 99,800,027 5.14
Between 1 January 2018 and 20 February 2018, the following voting interests in the ordinary share capital of the Company, disclosable under DTR 5, were notified to the Directors.
Shareholder Shareholding(1)
% of ordinary share capital as at date
of disclosure(1)
Deutsche Bank AG 64,669,685 3.33%
(1) Since the disclosure date, the shareholders’ interests in the Company may have changed.
Details of the Incentive Plan (2012) and the Incentive Plan (2017) are set out on page 85 of the Directors’ Remuneration Report and note 21 to the financial statements, which are incorporated by reference into this report.
The Directors note that, in connection with the Company’s proposed acquisition of GKN plc, the Directors are seeking authority to allot shares in the Company up to an aggregate nominal amount of £178,210,189 (to apply in addition to existing authorities). Further details are set out in the circular relating to the proposed acquisition sent to the Company’s shareholders on 2 February 2018, which provides notice of a general meeting to be held on 8 March 2018.
Shareholders’ voting rightsSubject to any special rights or restrictions as to voting attached to any class of shares by or in accordance with the Articles, at a general meeting of the Company, each member who holds ordinary shares in the Company and who is present (in person or by proxy) at such meeting is entitled to:
• on a show of hands, one vote; and
• on a poll, one vote for every ordinary share held by them.
With the exception of the Incentive Shares (2017), which do not carry voting rights, there are currently no special rights or restrictions as to voting attached to any class of shares.
The Company is not aware of any agreements between shareholders that restrict voting rights attached to the ordinary shares in the Company.
Where any call or other amount due and payable in respect of an ordinary share remains unpaid, the holder of such shares shall not be entitled to vote or attend any general meeting of the Company in respect of those shares. As at 20 February 2018, all ordinary shares issued by the Company are fully paid.
Details of the deadlines for exercising voting rights in respect of the resolutions to be considered at the 2018 AGM are set out in the AGM Notice on pages 156 to 161.
Restrictions on transfer of securitiesThe Articles do not contain any restrictions on the transfer of ordinary shares in the Company, aside from the usual restrictions applicable where shares are not fully paid up, if entitled to do so under the Uncertificated Securities Regulations 2001, where the transfer instrument does not comply with the requirements of the Articles or, in exceptional circumstances, where approved by the UK Listing Authority provided such refusal would not disturb the market in such shares. Restrictions may also be imposed by laws and regulations (such as insider trading and market abuse provisions). Directors and certain senior employees of the Group may also be subject to internal approvals before dealing in ordinary shares of the Company and minimum shareholding requirements.
Governance
65
Mel
rose
Ind
ustr
ies
PLC
A
nnua
l Rep
ort 2
017
Mel
rose
Ind
ustr
ies
PLC
A
nnua
l Rep
ort 2
017
Directors’ reportContinued
Financial instrumentsThe disclosures required in relation to the use of financial instruments by the Company, including the financial risk management objectives and policies (including in relation to hedging) of the Company and the exposure of the Company to price risk, credit risk, liquidity risk, cash flow risk, exchange rate risk, contract and warranty risk and commodity cost risk, can be found in the Finance Director’s review on pages 32 to 40, the risks and uncertainties section of the Strategic Report on pages 44 to 49 and in note 23 to the financial statements, which are incorporated by reference into this Directors’ Report.
Research and development activitiesThe industries in which the Melrose Group invests are highly competitive and the businesses within the Group are encouraged to research and develop new and innovative product lines and processes in order to meet customer demands in a continuously evolving environment.
An example of the types of new products being launched within the Nortek businesses include Ergotron’s next generation of height adjustable sit-stand desks, NSC’s fast response security panel and the extension of HVAC’s clean suite products for operating room use, as noted in the Divisional reviews on pages 22 to 31, which is incorporated by reference into this Directors’ Report.
Business review and risksA review of the Group’s performance, the key risks and uncertainties facing the Group and details on the likely development of the Group can be found in the Chairman’s statement on page 2 and the Strategic Report on pages 2 to 57 of this Annual Report (including the longer-term viability statement on page 41 and the risks and uncertainties section on pages 44 to 49) which are incorporated into this Directors’ Report by reference.
EmployeesDetails in relation to employment policies, employee involvement, consultation and development, together with details of some of the human resource improvement initiatives implemented during 2017 are shown on page 52 of the Corporate Social Responsibility section of the Strategic Report, which is incorporated by reference into this Directors’ Report.
EnvironmentalDetails of the Group’s environmental initiatives, greenhouse gas emissions and the methodology used to calculate such emissions are set out on pages 54 to 55 of the Corporate Social Responsibility section of the Strategic Report, which is incorporated by reference into this Directors’ Report.
Political donationsThe Group’s policy is not to make any political donations and there were no political donations made during the year ended 31 December 2017 (2016: nil).
BranchesThe Melrose Group and its businesses operate across various jurisdictions. The Group has no registered branches.
Shareholder dividendThe Directors are pleased to recommend the payment of a final dividend of 2.8 pence per share (2016: 1.9 pence) to be paid on 21 May 2018 to ordinary shareholders on the register of members of the Company at the close of trading on 6 April 2018. This dividend recommendation will be put to shareholders at the forthcoming AGM of the Company, to be held on 10 May 2018. Subject to shareholder approval being obtained at the AGM for the final dividend, this will mean a full year 2017 dividend of 4.2 pence per share (2016: 2.2 pence).
For discussions on the Board’s intentions with regard to the dividend policy, please see the Chairman’s statement on page 2, which is incorporated into this report by reference.
The Company offers a Dividend Reinvestment Plan (DRIP), which gives shareholders the opportunity to use their dividend payments to purchase further ordinary shares in the Company. Further details about the DRIP and its terms and conditions can be found within the Investors section of the Company’s website at www.melroseplc.net
Historic dividendsThe Company administers the unclaimed dividends of the former FKI plc (now Brush Holdings Limited). Pursuant to law and the Articles, the Company is obliged to pay such unclaimed dividends 12 years from the date of the last dividend claim of the particular shareholder (Unclaimed Dividends). Six months after this time period has expired, the Company’s policy is to donate the amount of the Unclaimed Dividend to a charity of the Company’s choice. As at 31 December 2017, the amount of such Unclaimed Dividends was £139,481.83. If the Unclaimed Dividends are not claimed by 30 September 2018, the Company will donate the funds to charity.
Ability to purchase own sharesPursuant to sections 693 and 701 of the Act and a special resolution passed at a general meeting of the Company on 11 May 2017, the Company is authorised to make market purchases of up to 188,674,658 of its ordinary shares, representing approximately 10% of the issued ordinary share capital of the Company. The Company has not made any purchases of its own shares pursuant to this authority. This authority will expire at the end of this year’s AGM, at which the Company is seeking approval to make market purchases of its ordinary shares up to 194,120,050, being approximately 10% of the current issued ordinary share capital (as enlarged as a result of the 2012 Incentive Plan Crystallisation), together with an additional 259,889,859 ordinary shares in the event that the Company’s proposed acquisition of GKN plc completes (being an amount which, when aggregated with 194,120,050 ordinary shares, equates to approximately 10% of the Company’s issued ordinary share capital as it is expected to be enlarged as a result of the proposed acquisition), thereby renewing the authority. The full text of the resolution, together with minimum and maximum price requirements, is set out in the AGM Notice on pages 156 to 161.
66

AuditorSo far as each Director is aware, there is no relevant audit information (being information that is needed by the Company’s auditor to prepare its report) of which the Company’s auditor is unaware. Each Director has taken all the steps that he/she ought to have taken as a Director to make him/herself aware of any relevant audit information and to establish that the Company’s auditor is aware of that information.
This confirmation is given and should be interpreted in accordance with the provisions of section 418 of the Act.
On behalf of the Board, the Audit Committee has reviewed the effectiveness, performance, independence and objectivity of the existing external auditor, Deloitte LLP, for the year ended 31 December 2017 and concluded that the external auditor was in all respects effective. Deloitte LLP has expressed its willingness to continue in office as auditor of the Group. Accordingly, resolutions will be proposed at this year’s AGM for the reappointment of Deloitte LLP as auditor of the Group and to authorise the Audit Committee to determine its remuneration.
ApprovalApproved by the Board and signed on its behalf by:
Jonathon CrawfordCompany Secretary20 February 2018
Disclosures required under Listing Rule 9.8.4ROther than the following, no further information is required to be disclosed by the Company in respect of Listing Rule 9.8.4R:
• details of the allotment of ordinary shares issued as a result of the Incentive Plan (2012) Crystallisation, which are set out on page 64 of this Directors’ Report and note 24 to the financial statements (incorporated by reference into this report); and
• details of the allotment of Incentive Shares (2017) as a result of the 2017 Option Exercise, which are set out on page 64 of this Directors’ Report and note 24 to the financial statements (incorporated by reference into this report).
Significant agreements and change of controlWith the exception of the Group’s banking facilities, the Incentive Plan (2017) (including the options granted under this plan), and the divisional management long-term incentive plans, there are no other agreements that would have a significant effect upon a change of control of Melrose Industries PLC as at 20 February 2018.
In July 2016, as part of the process to acquire Nortek, the Group entered into a $1,250,000,000 senior term and revolving facilities agreement (the Existing Facilities Agreement).
In the event of a change of control of the Company following a takeover bid, the Company and lenders under the facility agreement are obliged to enter into negotiations to determine whether, and if so how, to continue with the facility. There is no obligation for the lenders to continue to make the facility available for more than 30 days beyond any change of control. Failure to reach agreement with parties on revised terms could require an acquirer to put in place replacement facilities.
In January 2018, in connection with the Company’s proposed acquisition of GKN plc, the Group entered into a term loan and a revolving credit facility which comprised a £2.6 billion facility, a $2.0 billion facility and a €0.5 billion facility (the New Facilities Agreement). The facilities will only become available if the proposed acquisition of GKN plc completes and if this occurs the debt drawn under the Existing Facilities Agreement will be repaid and then the facility cancelled.
Equivalent provisions apply under the New Facilities Agreement in respect of a change of control as described above in relation to the Existing Facilities Agreement.
In the event of a takeover of the Company, options granted under the Incentive Plan (2017) would be exercised and any Incentive Shares (2017) resulting from such exercise, or that had previously been issued, would convert into ordinary shares in the Company or an entitlement to a dividend paid in cash. The rate of conversion is based upon the offer price of the Company’s ordinary shares as calculated on the date of the change of control of the Company. If the offer price, or any element of the offer price, is not in cash, the Remuneration Committee will determine the value of the non-cash element, having been advised by a reputable investment bank that such valuation is fair and reasonable.
During 2017, long-term management incentive plans have been put in place for the Nortek divisions which would be triggered upon a takeover of the Company. The plans provide for the payment of bonuses to certain key managers of the Nortek divisions based upon the increase in value of the business.
Governance
67
Mel
rose
Ind
ustr
ies
PLC
A
nnua
l Rep
ort 2
017

Corporate governance report
A pack of briefing papers and an agenda are provided to each Director in advance of each Board, Committee or business review meeting. The Directors are able to seek further clarification and information on any matter from any other Director, the Company Secretary or any other employee of the Group whenever necessary.
Decisions are taken by the Board in conjunction with the recommendations of its Committees and advice from external consultants, advisers and senior management.
The Board has a fully encrypted electronic board portal system, enabling Board, Committee and review papers to be delivered securely and efficiently to Directors. This facilitates a faster and more secure distribution of information, accessed using electronic tablets and reduced resource usage.
The Company Secretary is responsible for advising and supporting the Chairman and the Board on corporate governance matters as well as ensuring a smooth flow of information to enable effective decision making. All Directors have access to the advice and services of the Company Secretary and, through him, have access to independent professional advice in respect of their duties, at the Company’s expense. The Company Secretary acts as secretary to the Board, the Audit Committee, the Nomination Committee and the Remuneration Committee.
In accordance with its Articles and in compliance with the Act, the Company has granted a qualifying third party indemnity to each Director. This indemnity is provided both within the Company’s Articles and through a separate deed of indemnity between the Company and each of the Directors. The Company also maintains Directors’ and Officers’ liability insurance.
Chairman, Vice-Chairman and Chief ExecutiveThe roles of Chairman and Vice-Chairman are, and will remain, separate to that of the Chief Executive of the Company, in accordance with best practice and Board policy.
The Chairman, with the assistance of the Vice-Chairman, is responsible for leadership of the Board. The Chairman sets the Board agenda and ensures that adequate time is given to the discussion of issues, particularly those of a strategic nature. Responsibility for ensuring effective communications are made to shareholders rests with the Chairman, Vice-Chairman and the two other executive Directors.
The Board notes, and confirms its satisfaction with, the choice of an Executive Chairman. Christopher Miller, the current Executive Chairman of the Group, is one of the founding members of Melrose, having been a Director since its incorporation in 2003. Christopher’s long-standing involvement brings a wealth of experience to the Board and his oversight of corporate governance and compliance matters complements the work of the Group’s non-executive Directors. Christopher continues to play an active role in identifying and evaluating new opportunities for the Group.
The Chief Executive is responsible for strategic direction and decisions involving the day-to-day management of the Company.
Non-executive DirectorsThe Company’s non-executive Directors are encouraged to, and do, scrutinise the performance of the executive Directors in all areas, including on strategy, risks and financial information, through their roles on the Company’s Committees, at the Board’s scheduled meetings and review sessions and on an ad hoc basis.
In line with the UK Corporate Governance Code and the Listing Rules issued by the Financial Conduct Authority, this section of the Annual Report details the ways in which the Company has applied and complied with the principles and provisions of the Code during the year ended 31 December 2017.
In April 2016, the Financial Reporting Council (FRC) amended the Code, a copy of which is available at www.frc.org.uk/Our-Work/ Publications/Corporate-Governance/UK-Corporate-Governance-Code-April-2016.pdf
The Audit Committee Report, Nomination Committee Report, Directors’ Remuneration Report, Statement of Directors’ Responsibilities and the risk management and risks and uncertainties sections of the Strategic Report also form part of this Corporate Governance Report.
Statement of complianceThroughout the year ended 31 December 2017, the Company has applied and complied with the main principles, the supporting principles and the respective related provisions of the Code, with the exception of the following:
D.1.1 Schedule A of the Code recommends that grants under executive share options and other long-term investment plans should normally be phased, rather than awarded in one block. Grants under the Incentive Plan (2012), details of which are set out on pages 85 to 86 of the Directors’ Remuneration Report in the Annual Report for the year ended 31 December 2015, were awarded in one block, rather than phased. The Incentive Plan (2012) was recommended as being in the best interests of shareholders as a whole by the Board and was approved by shareholders at a general meeting held on 11 April 2012. The Incentive Plan (2012) crystallised in May 2017 and was finalised.
All other aspects of the executive Directors’ remuneration fully comply with Schedule A of the Code. It is noted that grants under the Incentive Plan (2017) will be phased rather than awarded in one block.
Main Principle A: Leadership The BoardDetails of the structure of the Board and its key responsibilities are shown on pages 62 to 63.
There were four formally scheduled Board meetings held during the year and the attendance of each Director at these meetings is shown on page 70. In addition, a number of unscheduled Board meetings were held during the year in connection with corporate transactions, for example in relation to the crystallisation of the Incentive Plan (2012) and the creation and approval of the Incentive Plan (2017).
In addition, business review meetings are held between scheduled Board meetings. There were three business review meetings held during the year. The attendance of each Director at these review meetings is set out on page 70. These meetings are critical to providing the Directors with a comprehensive understanding of the current performance of, and the key issues affecting, the Group’s businesses, without the formality or rigidity of a Board meeting. Chief executives and other senior management from the Melrose businesses are periodically invited to attend and present to these meetings, providing the Directors with an opportunity to discuss each business directly and to develop relationships with their leadership teams.
68M
elro
se In
dus
trie
s P
LC
Ann
ual R
epor
t 201
7

invaluable experience in financial and other corporate matters. On Mr Grant’s retirement the position of Senior Independent Director was taken up by Mr Dowley.
The non-executive Directors are not entitled to any cash bonus or shares under the Incentive Plan (2012) or the Incentive Plan (2017).
Board induction, training and supportAn induction programme tailored to the needs of individual Directors is provided for new Directors joining the Board. The primary aim of the induction programme is to introduce new Directors to, and educate new Directors about, the Group’s businesses, its operations and its governance arrangements. Individual induction requirements are monitored by the Chairman and the Company Secretary to ensure that new Directors gain sufficient knowledge to enable them to contribute to the Board’s deliberations as quickly as possible.
Board evaluationEvaluation approach and processIn accordance with its obligations under the Code to conduct an external Board evaluation at least once every three years, the Board engaged Lintstock Limited to undertake an independent evaluation of the Board, the Audit Committee, the Nomination Committee, the Remuneration Committee and the Chairman’s performance to identify areas where performance and procedures might be further improved. Lintstock is a specialist corporate governance consultancy and, other than the Board, Committee and Chairman evaluations, has no commercial dealings or other connection with the Melrose Group.
A range of topics were discussed including: Board mix, profile and diversity, succession planning, risk and internal controls, strategy, Board processes, future investor strategy and the Group’s preparedness at managing the cyber risks facing the business.
The discussion also included a review of the actions agreed following the 2016 Board evaluation, and the steps taken in 2017 to address these needs:
Actions agreed from 2016 evaluation
What we have delivered in 2017
To continue to focus on succession planning for the executive Directors and senior management and the Board’s visibility of potential successors within the Group, and to further scrutinise the composition, expertise and diversity of the Board.
Executive succession planning, talent management and senior executive career planning were considered by the Board throughout the year, and the composition, expertise and diversity of the Board is subject to continuous review.
It is intended that these issues remain a core focus for the Board and that they be reviewed on at least an annual basis.
To continue to focus on risk management and internal control and, in particular, further embedding a culture of effective risk management across the Group.
The Board and the Audit Committee monitored throughout the year the key elements of the Melrose risk management framework and its application to the Group, including the updated risk strategy, best practice risk register with risk mapping and profiling application, education and training programmes and audit and assurance processes. The review of the implementation of these elements across the Nortek business divisions was an area of particular focus.
Main Principle B: Effectiveness Board compositionAs at 20 February 2018, the Board comprised an Executive Chairman, three other executive Directors and four non-executive Directors. The Board believes that the Directors possess diverse business experience in areas complementary to the activities of the Company. Biographies of the Directors are shown on pages 62 and 63 and on the Company’s corporate website at www.melroseplc.net
These biographies identify any other significant appointments held by the Directors.
The Board and the Nomination Committee undertake an annual review of the time commitment required from both the executive and non-executive Directors. The consensus view between the Directors is that the current time commitment is appropriate.
The Board notes that Mr John Grant retired as a non-executive Director at the conclusion of the 2017 AGM and was replaced as Senior Independent Director by Mr Justin Dowley. On the recommendation of the Nomination Committee, the Board had decided to increase the number of independent Directors following Mr Grant’s retirement so that they comprised the majority of the members of the Board. Therefore, external recruitment consultants Stonehaven International were retained to identify suitable candidates for the Board’s consideration. Stonehaven International provided an initial list of potential candidates which the Nomination Committee reviewed and produced a shortlist of candidates, from which several candidates were invited to interview with members of the Committee. Mr Archie G. Kane was identified as the Board’s preferred candidate and accepted the offer of appointment subject to certain necessary approvals. Those approvals were granted and Mr Kane was appointed to the Board on 5 July 2017.
Following Mr Kane’s appointment, the Committee continued its search for a fifth non-executive Director. However, at the time the Company’s approach to GKN plc was made public, the appropriate candidate had not been identified and it was decided to suspend the search for the fifth non-executive Director until the acquisition process has concluded. Aside from their assistance with the recruitment process, Stonehaven International have no other connection with the Company.
Despite this appointment remaining outstanding, the Board is satisfied that there will be sufficient challenge by non-executive Directors of executive management in meetings of the Board and that no individual or small group of individuals dominates its decision making.
Non-executive Director independenceIn accordance with the provisions of the Code, consideration has been given to the independence of all non-executive Directors. The Board considers all of the non-executive Directors to be independent.
Under the Code, the Board is required to state its reasons if it determines that a Director is independent notwithstanding the existence of any circumstances which may appear relevant to its determination.
Mr Grant retired from the Board and his role as the Board’s Senior Independent Director at the conclusion of the 2017 AGM, having served three three-year terms as a non-executive Director. Mr Grant’s role as a non-executive Director, and in particular the length of his time in office, was closely monitored by the Board. Even though Mr Grant served as a non-executive Director for more than nine years since the date of his first election, the Board determined that he continued to maintain his independence. In addition, the Board continued to benefit from Mr Grant’s
Governance
69
Mel
rose
Ind
ustr
ies
PLC
A
nnua
l Rep
ort 2
017

Corporate governance reportContinued
The table also shows attendance at business review meetings held between scheduled Board meetings.
Attendance of Directors
Board Audit Nomination RemunerationBusiness
review
Number of meetings(1) 4 3 2 2 3
Christopher Miller 4 – 2 – 3
David Roper 4 – – – 3
Simon Peckham 4 – – – 3
Geoffrey Martin 4 3(2) – – 3
John Grant(3) 1 1 – 1 2
Justin Dowley 4 3 2 2 3
Liz Hewitt 4 3 2 2 3
David Lis 4 3 2 2 3
Archie G. Kane(4) 2 2 1 1 1
(1) In addition, ad hoc meetings are held from time to time which are attended by a quorum of Directors and are convened to deal with specific items of business.
(2) Geoffrey Martin attends by invitation.(3) John Grant retired with effect from the conclusion of the 2017 AGM on 11 May 2017, having
attended all meetings held to that date.(4) Archie G. Kane was appointed as a non-executive Director with effect from 5 July 2017 and
has attended all meetings since that date, plus the June Board and Nomination Committee meetings as an observer prior to his appointment being finalised.
Main Principle C: AccountabilityObjectives and policyThe objectives of the Directors and senior management are to safeguard and increase the value of the business and assets of the Group for the benefit of its shareholders. Achievement of their objectives requires the development of policies and appropriate internal control frameworks to ensure the Group’s resources are managed properly and any key risks are identified and mitigated where possible.
The Board is ultimately responsible for the development of the Group’s overall risk management policies and system of internal control frameworks and for reviewing their respective effectiveness, while the role of senior management is to implement these policies and frameworks across the Group’s business operations. The Directors recognise that the systems and processes established by the Board are designed to manage, rather than eliminate, the risk of failing to achieve business objectives and cannot provide absolute assurance against material financial misstatement or loss.
The Board is committed to satisfying the internal control guidance for Directors set out in the FRC’s Guidance on Risk Management, Internal Control and Related Financial and Business Reporting. In accordance with this guidance, the Board assumes ultimate responsibility for risk management and internal controls, including determining the nature and extent of the principal risks it is willing to take to achieve its strategic objectives (its “risk appetite”) and ensuring an appropriate culture has been embedded throughout the organisation. The establishment of a revised risk management and internal control system has been complemented by ongoing monitoring and review, to ensure the Company is able to adapt to an evolving risk environment.
A separate Audit Committee Report is set out on pages 72 to 77 and provides details of the role and activities of the Audit Committee and its relationship with the internal and external auditors.
Managing and controlling riskSince 2016, the Group’s approach to risk management has been reviewed and enhanced. The systems, processes and controls in place accord with the Code and the FRC’s updated guidance. Details on the Group’s risk management strategy are set out on pages 42 to 43.
Outputs of the evaluationOverall, the Board was satisfied with its performance, and agreed that the Chairman and the Senior Independent Director continued to be very effective.
In order to continue and further enhance the Board’s effectiveness, the following areas were designated as the subject of management focus during 2018:
• Executive and non-executive Director succession and senior management succession (both in Melrose and its Group);
• risk management and internal control and to delineate accountabilities between the Board and the Audit Committee; and
• although considerable steps were taken to improve cyber security across all business units in 2017 it was recognised that cyber security is an ongoing risk and will, therefore, be focused on again in 2018.
In accordance with the provisions of the Code, it is anticipated that externally facilitated Board evaluations will be carried out at least once every three years. The scope for each evaluation is designed to build upon the previous evaluation to ensure that the recommendations agreed are implemented and that year-on-year progress is measured and reported upon.
Annual re-election of DirectorsPursuant to the Company’s Articles and in accordance with the provisions of the Code, all of the Directors (with the exception of Mr Kane who was appointed with effect from 5 July 2017) stood for re-election at the 2017 AGM. With the exception of Mr Kane who is standing for election for the first time, all current Directors of the Company will be standing for re-election by shareholders at this year’s AGM.
Following performance evaluations of each of the Directors and having carefully considered the commitments required and the contributions made by each Director, the Chairman is of the opinion that each Director’s performance continues to be effective and demonstrates commitment to the role. Similarly, following performance evaluations of the Chairman, and having carefully considered the commitments required and the contributions made by the Chairman, the non-executive Directors, led by the Senior Independent Director, are of the opinion that the Chairman’s performance continues to be effective and that he continues to demonstrate commitment to the role.
Attendance of Directors at meetingsThe following table shows the attendance of each of the Directors at the scheduled meetings of the Board and its Committees held during the year. The quorum necessary for the transaction of business by the Board and each of its Committees is two. Briefing papers and meeting agendas are provided to each Director in advance of each meeting. Decisions are taken by the Board in conjunction with the recommendations of its Committees and advice from external advisers and senior management as appropriate. The representations of any Director who is unable to attend a meeting of the Board or a standing Committee are duly considered by those Directors in attendance.
70M
elro
se In
dus
trie
s P
LC
Ann
ual R
epor
t 201
7

The Company produced its first Modern Slavery Statement in June 2017 which is available at http://www.melroseplc.net/media/1412/msa-policy.pdf . To support the Company’s belief in the importance of this matter it also produced a Group-wide policy on the prevention of modern slavery and human trafficking which was rolled out to Nortek and Brush employees along with an online compliance training module. The Company also rolled out an online whistleblowing training module for all employees to promote awareness of the importance of whistleblowing and the Company’s externally hosted whistleblowing portal. The whistleblowing portal received reports which were identified as employee related matters. Each report was fully investigated by the Company and all reports were presented to the Audit Committee for their review.
Main Principle D: RemunerationDetails regarding Directors’ remuneration, both generally and in relation to the requirements of the Code, are set out in the Directors’ Remuneration Report, which is presented in the following three sections:
• the annual statement from the Chairman of the Remuneration Committee, which can be found on pages 80 to 82;
• the Annual Report on Remuneration, which can be found on pages 83 to 90; and
• the Directors’ Remuneration Policy, which can be found in the circular dated 7 April 2017 on pages 19 to 27 available at https://www.melroseplc.net/media/1728/21347274-_-1-_circular.pdf and remains unchanged.
Main Principle E: Relations with shareholdersThrough regular meetings and presentations between the executive Directors, analysts and institutional shareholders, including those following the announcements of the Company’s annual and interim results, the Company seeks to build on a mutual understanding of objectives with its shareholders. During 2017, the Company continued its programme of engagement with major investors and the governance bodies in respect of its Remuneration Policy and incentive arrangements. In particular, the Chairman of the Remuneration Committee and other members of the Board met with major shareholders prior to the implementation of the Incentive Plan (2017), which was well supported by shareholders. The Board is pleased with the support and constructive feedback throughout these discussions and it is the Company’s intention to continue this programme for the foreseeable future. Further engagement with key shareholders and governance bodies has been a central part of the Company’s bid for GKN plc and has continued in the lead up to the 2018 AGM.
The non-executive Directors are also available to meet institutional shareholders should there be unresolved matters shareholders wish to bring to their attention. The views of key analysts and shareholders are generally reported to the Board directly by individual Directors or via the Company’s brokers. This helps to ensure that all members of the Board develop an understanding of the views and any concerns of shareholders.
The Board welcomes the attendance of shareholders at the AGM, the notice for which can be found on pages 156 to 161. The AGM provides all shareholders with the opportunity to attend and vote on the matters put to shareholders, either in person or by proxy. The results of the voting on each of the resolutions proposed will be announced shortly after the AGM has concluded, via the Melrose corporate website at www.melroseplc.net
Details of the deadlines for exercising voting rights in respect of the resolutions to be considered at the 2018 AGM are set out in the AGM Notice on pages 156 to 161.
Further information regarding the Group’s financial risk objectives and policies can be found in the Finance Director’s review on pages 32 to 40. A summary of the principal risks and uncertainties that could impact upon the Group’s performance is set out on pages 44 to 49.
Internal financial controls and reportingThe Group has a comprehensive system for assessing the effectiveness of the Group’s internal controls, including strategic business planning and regular monitoring and reporting of financial performance. A detailed annual budget is prepared by senior management and thereafter is reviewed and formally adopted by the Board.
The budget and other targets are regularly updated via a rolling forecast process and regular business review meetings are held with the involvement of senior management to assess performance. The results of these reviews are in turn reported to, and discussed by, the Board at each meeting. As discussed in the Audit Committee Report on pages 76 to 77, the Group engages BM Howarth as internal auditor. A total of 25 internal audit visits, 21 of which were Nortek sites, were completed during 2017.
The Directors are pleased to report that there were no material deficiencies at Brush and that the majority of the recommendations presented in the internal audit reports have now been, or are in the process of being, implemented. There were some deficiencies found in HVAC’s internal financial controls at two sites. This prompted immediate action by the Finance Director and the Melrose accounting function, including strengthening of the local accounting functions, implementation of more comprehensive and robust controls and a specific action plan to address the shortcomings identified. The internal auditor has scheduled follow up visits at each site to review progress in the first half of 2018. The Committee has already seen significant progress and is confident that the Nortek Global HVAC sites have already, and will continue to, improve their internal financial controls under Melrose ownership.
The Audit Committee also monitors the effectiveness of the internal control process implemented across the Group through a review of the key findings presented by the external and internal auditors. Management is responsible for ensuring that the Audit Committee’s recommendations in respect of internal controls and risk management are implemented.
Compliance and ethicsThe Company takes very seriously its responsibilities under the laws and regulations in the countries and jurisdictions in which the Group operates and has in place appropriate measures to ensure compliance. A compliance framework is in place comprising a suite of policies governing anti-bribery and anti-corruption, anti-money laundering, competition, trade compliance, data privacy, whistleblowing, document retention and joint ventures. These policies are in place within each business and apply to all Directors, employees (whether permanent, fixed-term, or temporary), pension trustees, consultants and other business advisers, contractors, trainees, volunteers, business agents, distributors, joint venture partners or any other person working for or performing a service on behalf of the Company, its subsidiaries and/or associated companies in which the Company or any of its subsidiaries has a majority interest.
In addition, in conjunction with their internal audit function, BM Howarth conduct compliance audits across the Group and its businesses to identify any areas for improvement.
During 2017, the Company completed its roll-out of its online compliance training platform to Nortek, covering topics such as antitrust, trade compliance and export controls, data privacy, anti-bribery and anti-corruption and anti-money laundering.
Governance
71
Mel
rose
Ind
ustr
ies
PLC
A
nnua
l Rep
ort 2
017

Audit Committee report
• reviewing the Company’s procedures for detecting fraud;
• assessing annually the external auditor’s independence and objectivity, taking into account relevant UK law, regulation, the Ethical Standards and other professional requirements and the relationship with the auditor as a whole, including the provision of any non-audit services;
• developing, implementing and monitoring the Group’s policy on external audit and for overseeing the objectivity and effectiveness of the external auditor;
• reviewing and challenging the provision of non-audit services by the external auditor; and
• reviewing and considering the Annual Report and financial statements to ensure that it is fair, balanced and understandable and advising the Board on whether it can state that this is the case.
CompositionOn the retirement of Mr John Grant as Chairman of the Audit Committee at the conclusion of the 2017 AGM, existing Audit Committee member Ms Liz Hewitt took up the role of Chairman. Ms Hewitt brings a wealth of expertise to the role as Audit Chairman of Novo Nordisk A/S, Savills plc and the House of Lords Commission. The Audit Committee briefly had three members on Mr Grant’s retirement, until Mr Archie G. Kane’s appointment on 5 July 2017. Each member of the Committee is deemed to be independent by the Company and brings recent and relevant financial experience from senior executive and non-executive positions as described in their biographies on page 63.
The Company Secretary acts as secretary to the Committee.
The Committee invites the Group Finance Director, the Head of Financial Reporting and senior representatives of the external and internal auditors to attend meetings where appropriate to the business being considered. The Committee has the right to invite any other Directors and/or employees to attend meetings where this is considered appropriate. In addition, the Committee meets at least once per year with both the external and internal auditors without management present.
Summary of meetings in the yearThe Committee is expected to meet not less than three times a year. In 2017, the Committee met in March, August and November. The scheduling of these meetings is designed to be aligned with the financial reporting timetable, thereby enabling the Committee to review the Annual Report and financial statements, the interim financial report and the audit plan ahead of the year-end audit and to maintain a view of the internal controls and processes throughout the year.
The attendance of its members at these meetings is shown in the table at the start of this section.
Significant activities related to the financial statementsIn discharging its duties under its terms of reference, the Committee undertook the following recurring activities that receive annual scrutiny:
• reviewed the Annual Report and financial statements and interim financial report, including the going concern assumption and the assessment forming the basis of the longer-term viability statement. As part of this review, the Committee received reports from the external auditor on their audit of the Annual Report and financial statements and their review of the interim financial report;
• considered the Annual Report and financial statements in the context of being fair, balanced and understandable and reviewed the content of a paper prepared by management
The responsibilities of the Audit Committee (the Committee) include overseeing financial reporting, risk management and internal controls, in addition to making recommendations to the Board regarding the appointment of the Company’s internal and external auditors.
Member No. of meetings
Liz Hewitt (Chairman) 3/3
John Grant(1) 1/1
David Lis 3/3
Justin Dowley 3/3
Archie G. Kane(2) 2/2
(1) Retired from the Audit Committee with effect from the conclusion of the AGM on 11 May 2017.(2) Appointed to the Audit Committee with effect from 5 July 2017.
Role and responsibilities The Committee’s role and responsibilities are set out in its terms of reference. These were updated in August 2017 in line with best practice and are available on the Company’s website and from the Company Secretary at the Company’s registered office. In discharging its duties, the Committee embraces its role of protecting the interests of shareholders with respect to the integrity of financial information published by the Company and the effectiveness of the audit. The responsibilities of the Committee include:
• reviewing and monitoring the integrity of the financial statements of the Group, including the Annual Report and interim report, and reviewing and reporting to the Board on significant financial reporting issues and judgements which they contain;
• keeping under review the effectiveness of the Group’s financial reporting, risk management and internal control systems and compliance controls;
• monitoring and evaluating the effectiveness of the internal audit function;
• reviewing and challenging the going concern assumption and the assessment forming the basis of the longer-term viability statement;
• focusing and challenging the consistency of accounting policies, methods used to account for significant or unusual transactions and compliance with accounting standards;
• reviewing the Group’s arrangements for its employees to raise concerns in confidence in accordance with the Company’s whistleblowing policy;
Liz HewittAudit Committee Chairman
72M
elro
se In
dus
trie
s P
LC
Ann
ual R
epor
t 201
7

in relation to the 2017 Annual Report and financial statements. The Committee advised the Board that, in its view, the 2017 Annual Report and financial statements when taken as a whole is fair, balanced and understandable and provides the information necessary for shareholders to assess the Group’s performance, business model and strategy;
• considered the processes in place to generate forecasts of cash flows and accounting valuation information, including the reasonableness and consistent use of assumptions;
• reviewed the effectiveness of the Group’s risk management and internal controls and disclosures made in the Annual Report and financial statements on this matter;
• reviewed the effectiveness of the Group’s internal and external auditors; and
• reviewed and agreed the scope of work to be undertaken in respect of the 2017 annual accounts by the external auditor and the scope of work to be undertaken in 2018 by the internal auditor.
In addition to these matters, the Committee considered the following significant issues in relation to the financial statements during the year:
The Audit Committee’s activities during 2017
Significant issue considered by the Audit Committee How the issue was addressed by the Audit Committee
Impairment of goodwill, intangible assets and other fixed assets of the Energy CGUThe judgements in relation to goodwill impairment testing include the assumptions applied in calculating the recoverable amount of the cash-generating units being tested for impairment.
In the 2016 Annual Report the headroom in respect of the carrying amount of the Energy CGUs was £95.4 million (23%), which was a tightening of headroom from that shown in the previous year. As a result of this reduced headroom, enhanced sensitivity disclosures were provided in the 2016 Annual Report in respect of this group of CGUs.
At the date of the 2017 interim results announcement, it was evident that trading conditions had worsened and were in fact the toughest conditions experienced since Melrose acquired Brush in 2008.
Subsequently, it was announced, in a trading statement in November 2017, that since the interim announcement the market conditions had worsened such that a full review of Brush was underway to improve its performance.
The closure of Brush China was announced in November 2017, resulting in an impairment loss on assets of £31.1 million, and at 31 December a review of property, plant and equipment was performed that identified a write down of £18.2 million. The key estimates used to derive the discounted cash flow valuations of the property, plant and equipment were revenue changes, operating margins and market conditions that impact long-term growth rates and discount rates.
Furthermore, an assessment of the future cash flows of the Brush businesses under a value in use basis, which does not allow for the benefits of any restructuring programme that has not been committed to, and under a fair value less costs to sell basis, which does allow future restructuring to be considered if it is viewed that a market participant would restructure, was made.
In accordance with IAS 36, the higher valuation, being the fair value less cost to sell basis, was used to value the Brush business at £300 million, resulting in an impairment to goodwill of £95.4 million.
In considering the valuation that has been used for Brush using a fair value less cost to sell basis, the key estimates that were used were the timing and impact of restructuring, the possibility of a further reduction of future sales, operating margins and market conditions that impact long-term growth rates and discount rates.
(Refer to notes 3 and 11)
The Committee challenged the outcome of the impairment review in respect of Brush performed by management and in doing so considered the following:
• the Committee reviewed a paper, which included the key outputs of the impairment model, prepared by management;
• the appropriateness of the inclusion of restructuring in the fair value less costs to sell approach, on the basis that a market participant would restructure the Brush business. In particular, with regard to the structural changes in the markets in which Brush operates and following the recent announcements from key participants in these markets;
• the trading assumptions that have been applied in the model, in particular the assumptions that were key to the model, being revenue growth and operating margin;
• the timing and the impact of the restructuring for the fair value in use less costs to sell approach;
• the market assumptions for the long-term growth rates applied and the discount rate used, taking into account third party valuations of the company;
• risk adjustments that have been applied to the model, in particular the fair value less costs to sell model which includes the impact of future restructuring; and
• the appropriateness of the full disclosures in the financial statements in respect of the impairment review performed and the impact, along with sensitivities that could cause a future impairment.
Governance
73
Mel
rose
Ind
ustr
ies
PLC
A
nnua
l Rep
ort 2
017

Audit Committee reportContinued
The Audit Committee’s activities during 2017
Significant issue considered by the Audit Committee How the issue was addressed by the Audit Committee
Classification of non-underlying items and use of Alternative Performance Measures (APMs)The reporting, classification and consistency of non-underlying items continue to be an area of focus for the Committee. In particular, given the guidance on Alternative Performance Measures (APMs) given by the European Securities and Markets Authority (ESMA).
The Committee considers this to be a key consideration when considering whether the financial statements give a fair, balanced and understandable view of events.
(Refer to note 6 and the glossary to this Annual Report)
The Committee has considered the nature, classification and consistency of non-underlying items, whilst addressing the guidance given by ESMA. These items were detailed in the external auditor’s paper to the Committee and are clearly defined and discussed in the Finance Director’s review, along with the glossary to this Annual Report.
The Committee has considered the Company’s accounting policy and reporting practice as to non-underlying items and determines it to be clear, transparent and appropriate, thereby assisting shareholders in measuring the underlying performance of the Company. The Committee therefore concluded that these non-underlying items were appropriately captured and disclosed.
The Committee also considered the disclosure of the Company’s APMs with respect to applicable guidelines and noted that these are set out in detail in the glossary to this Annual Report and found them to be clear and transparent.
Non-audit feesUnder EU and Competition Commission rules, effective from 17 June 2016, new restrictions on non-audit services now apply.
The Committee has considered the application of the new rules to the Group, noting in particular the cap on permitted non-audit services of 70% of average audit fees over a three-year period, to be first applied in December 2020. Audit fees in 2017, 2018 and 2019 will be relevant and the average of these three years will be compared to the non-audit fees in 2020.
The Company’s non-audit fee represents 62% of the audit fees for 2017.
The Committee completed its annual review of the Group’s Non-Audit Services Policy, whereby the Committee reviewed the services provided by the audit firm, considered the impact of the services and threats and safeguards to ensure that the auditor remained independent and the services provided were in line with the Group’s non-audit services policy. The non-audit fees were also reviewed and services provided approved.
Risk management and internal controlMonitored the risk management and the internal control systems and conducted a review of their effectiveness.
The Committee received updates during the year from senior management on the Company’s risk management framework and internal control systems.
The Committee received a presentation from senior management on the risk management framework and on the financial, operational and compliance controls in place.
In addition, the Committee were presented with the findings of the internal audit visits on a bi-annual basis to assist them with determining the effectiveness of internal controls within the Group.
The Committee considered the risk management and internal control systems and concluded that they were effective and reported this to the Board.
Provisions for legal and environmental claims, other provisions and contingent liabilitiesThe level of provisioning for legal and environmental claims and other provisions requires judgement.
Although provisions are reviewed on a regular basis and adjusted for management’s best current estimates, the judgemental nature of these items means that future amounts settled may be different from those provided. (Refer to note 19)
The Committee considered management’s proposed provisioning in respect of these legal and environmental claims and other provisions including the key judgements made and relevant legal advice.
The external auditor also reported on all material provisions to the Committee.
Having considered the matter and sought guidance from the external auditor, the Committee concluded that management’s proposed provisioning and the associated disclosures in the Annual Report were appropriate and consistent with previous years.
Going concern and viabilityAssessment of the going concern assumptions and the basis of the viability statement.
The Committee reviewed and supported management’s recommendation to prepare the financial statements on a going concern basis.
The Committee also considered papers prepared by management detailing the qualifications, assumptions, scenario modelling, sensitivity analysis and judgements which underpinned the longer-term viability statement to be included in the 2017 Annual Report. The Committee concurred with the assumptions and judgements made by management and concluded that the longer-term viability statement was appropriate.
74M
elro
se In
dus
trie
s P
LC
Ann
ual R
epor
t 201
7

The Audit Committee’s activities during 2017
Significant issue considered by the Audit Committee How the issue was addressed by the Audit Committee
Internal auditMonitoring and evaluating the effectiveness of the internal audit function.
The Committee reviewed and approved the new Internal Audit Charter and committed to annually reviewing the Internal Audit Charter.
The Committee reviewed and assessed the effectiveness of the internal audit process, by use of a questionnaire completed by each member and key representatives of the Company and deemed it to be thorough and effective.
The Committee reviewed the reappointment of BM Howarth as internal auditor and, following an assessment of the services delivered to the Company by BM Howarth in 2017, approved their reappointment.
External auditMonitoring and evaluating the effectiveness of the external audit function.
The Committee reviewed the independence of the external auditor, whilst considering fees in respect of the audit and non-audit services, and deemed the external auditor to be independent.
The Committee reviewed the remuneration paid to the external auditor in 2017 in light of the services provided to the Company during 2017 and deemed it fair and reasonable.
The Committee reviewed and assessed the effectiveness of the external audit process. In doing so the Committee consulted the views of its members, the Finance Director, the Chief Executive, the divisional finance directors and the internal auditor.
Following the assessment, the Committee reviewed and approved the reappointment of Deloitte LLP as external auditor.
Committee evaluationMonitoring and evaluating the effectiveness of the Committee.
The Committee participated in an externally facilitated independent evaluation of itself carried out by Lintstock Limited to identify areas where performance and procedures might be further improved.
External audit Assessment of effectiveness and reappointment The Committee reviews and makes recommendations with regard to the reappointment of the external auditor. In making these recommendations, the Committee considers auditor effectiveness and independence, partner rotation and any other factors which may impact the external auditor’s reappointment.
The Committee has reviewed the external auditor’s performance and effectiveness. For 2017, a series of questions covering the key areas of the audit process that the Committee is expected to have an opinion over were put to the Committee, including:
• the calibre, continuity, experience, resources and technical and industry knowledge of the engagement partner and of the wider external audit team;
• the planning and execution of the audit process;
• the quality and timeliness of communications from the external auditor;
• the quality of support provided to the Committee by the external audit partner;
• the degree to which the external auditor and the audit process have contributed to improvements in financial reporting to Melrose’s shareholders; and
• the external auditor’s independence and objectivity.
The Committee, along with the Finance Director and the divisional finance directors, were requested to complete a questionnaire containing these questions. The Chairman also sought feedback from the Chief Executive and the internal auditor. The Company Secretary subsequently produced a report summarising the responses. Based on this report, the Committee concluded that the quality of the external audit team remains very high, the external audit process is operating effectively and Deloitte LLP continues to prove effective in its role as external auditor.
Risk management and internal control During 2017, the Committee monitored the effectiveness of the Group’s risk management and internal control systems through regular updates from management and a review of the key findings presented by the external and internal auditors.
In accordance with provision C.2.3 of the Code, the Board instructed the Committee to undertake a review of the effectiveness of the Group’s risk management and internal control systems, covering all material controls including financial, operational and compliance controls.
This review took the form of management presentations followed by a Committee discussion. The Company Secretary briefed the Committee on the key elements of the Melrose risk management framework including an updated risk strategy, a best practice risk register with risk mapping and profiling application, an education and training programme and an audit and assurance process, as well as a confirmation to the Committee that this has been implemented across the Nortek business units.
Management then reported on the Group’s internal control systems supported by the internal audit review. Samples of both Group and business unit controls, including financial, operational and compliance controls, were presented and examined. The Group’s risk management and internal control systems were reviewed and the Committee concluded that these systems were effective. The Committee reported its conclusions to the Board at the next scheduled Board meeting.
Governance
75
Mel
rose
Ind
ustr
ies
PLC
A
nnua
l Rep
ort 2
017

Audit Committee reportContinued
As detailed below, the Committee regularly monitors the objectivity and independence of the external auditor. Deloitte LLP was appointed in 2003 when the Company commenced trading and the external audit has not been formally tendered since then. The Committee is satisfied that the effectiveness and independence of the external auditor is not impaired in any way. There are no legal or contractual obligations that restrict the Group’s capacity to recommend a particular firm for appointment as auditor and therefore a resolution proposing the reappointment of Deloitte LLP as external auditor will be put to the shareholders at the 2018 AGM.
Audit tenderingThe Committee has considered the audit tendering provisions outlined in the Code. The Committee has also reviewed the guidance provided by the European Commission and the Competition and Markets Authority (CMA). It is the Committee’s understanding that, under the CMA and the EU rules, rotation of the external audit firm is required by 2024. It is the Committee’s intention to put the external audit out to tender in accordance with the CMA and the EU timeframes.
The current audit engagement partner was appointed in 2015 and is not due to rotate until after the year ending 31 December 2019. The Committee remains satisfied with the quality, integrity and the effectiveness of the work undertaken by Deloitte LLP on behalf of the Melrose shareholders. Accordingly, it is not proposed to put the audit out to tender at the present time but the matter will be kept under review.
Non-audit servicesUnder EU and Competition Commission rules, effective from 17 June 2016, restrictions on non-audit services now apply, which cap the level of permissible non-audit services awarded to the external auditor at 70% of the average audit fee for the previous three years. The cap applies prospectively and so will first apply in respect of the Company’s 2020 financial year, audit fees in 2017, 2018 and 2019 being relevant.
A policy on the engagement of the external auditor for the supply of non-audit services is in place to ensure that the provision of non-audit services does not impair the external auditor’s independence or objectivity. In accordance with best practice FRC guidelines, the Company policy in relation to non-audit services is kept under regular review (it was revised in 2016). The policy outlines which non-audit services are pre-approved (being those which are routine in nature, with a fee that is not significant in the context of the audit or audit-related services), which services require the prior approval of the Committee and which services the auditor is excluded from providing. The general principle is that the audit firm should not be requested to carry out non-audit services on any activity of the Company where the audit firm may, in the future, be required to give an audit opinion.
During 2017, the main non-audit services provided by Deloitte LLP were in relation to the reporting accountant’s role for the step up to the premium segment of the Official List following the acquisition of Nortek Inc., an aborted acquisition, tax compliance in non-EU subsidiaries and the audit of non-statutory accounts. The Company did not use Deloitte for any taxation advice in 2017 and does not intend to during 2018. The Company’s non-audit fee represents 62% of the audit fees for 2017.
The Committee closely monitors the amount of non-audit work undertaken by the external auditor and considers using other firms for transaction-related work. However, there are occasions when it is appropriate, because of background knowledge, to use our auditor for non-audit work, for example on certain advisory and compliance projects.
Despite being well within the CMA guidance, the Committee has taken into account feedback from institutional shareholder services and has been actively migrating non-audit work to other firms and has recently worked with Ernst & Young and KPMG in respect of corporate finance affairs and obtained tax advice from PricewaterhouseCoopers.
An analysis of the fees earned by the external auditor for audit and non-audit services can be found in note 7 to the consolidated financial statements.
As in previous years, the Audit Committee specifically considered the potential threats that each of these limited non-audit engagements may present to the objectivity and independence of the external auditor. In each case, the Committee was satisfied with the safeguards in place to ensure that the external auditor remained independent from the Company and its objectivity was not, and is not, compromised.
Auditor objectivity and independenceThe Committee carries out regular reviews to ensure that auditor objectivity and independence are maintained at all times.
No fees were paid to Deloitte LLP on a contingent basis. Based on these strict procedures, the Committee remains confident that auditor objectivity and independence have been maintained but accepts that non-audit work should be controlled to ensure that it does not compromise the auditor’s position.
At each year end, Deloitte LLP submits a letter setting out how it believes its independence and objectivity have been maintained. As noted above, Deloitte LLP is also required to rotate the audit partner responsible for the Group audit every five years and significant subsidiary audits every five years.
Internal auditDue to the size and complexity of the Group, it is appropriate for an internal audit programme to be used within the business. BM Howarth Ltd, an external firm, provides internal audit services to the Group in accordance with an annually agreed Internal Audit Charter and internal audit plan. A rotation programme is in place, such that every business unit site will have an internal audit at least once every three years, with the largest sites being reviewed at least once every two years. Upon acquisition, each site of any new business is promptly visited as part of the acquisition accounting exercise, which better informs the external audit rotation process. The rotation programme allows divisional management’s actions and responses to be followed up on a timely basis. The internal audit programme of planned visits is discussed and agreed with the Committee during the year.
76M
elro
se In
dus
trie
s P
LC
Ann
ual R
epor
t 201
7

The internal auditor’s remit includes assessment of the effectiveness of internal control systems, compliance with the Group’s Policies and Procedures Manual and a review of the businesses’ balance sheets. A report of key findings and recommendations is presented to the Group Finance Director and the Head of Financial Reporting, followed by a meeting to discuss these key findings and to agree on resulting actions. Site visits were conducted by BM Howarth across a total of 25 sites, 21 of which were Nortek sites.
The Directors are pleased to report that there were no material deficiencies at Brush and that the majority of the recommendations presented in the internal audit reports have now been, or are in the process of being, implemented. There were some deficiencies found in Nortek Global HVAC’s internal financial controls at two sites. This prompted immediate action by the Finance Director and the Melrose accounting function, and resulted in the strengthening of the local accounting functions, implementation of more comprehensive and robust controls and a specific action plan to address the shortcomings identified. The internal auditor has scheduled follow-up visits at each site to review progress in the first half of 2018. The Committee has already seen significant progress and is confident that the Nortek Global HVAC sites have already, and will continue to, improve their internal financial controls under Melrose ownership.
A review of the internal audit process and scope of work covered by the internal auditor is the responsibility of the Committee, to ensure their objectives, level of authority and resources are appropriate for the nature of the businesses under review. A report of significant findings is presented by the internal auditor to the Committee at each meeting and implementation of recommendations by the Board is followed up at the subsequent Committee meeting. The Committee also reviews BM Howarth’s performance against the agreed internal audit programme.
Liz HewittChairman, Audit Committee 20 February 2018
Governance
77
Mel
rose
Ind
ustr
ies
PLC
A
nnua
l Rep
ort 2
017
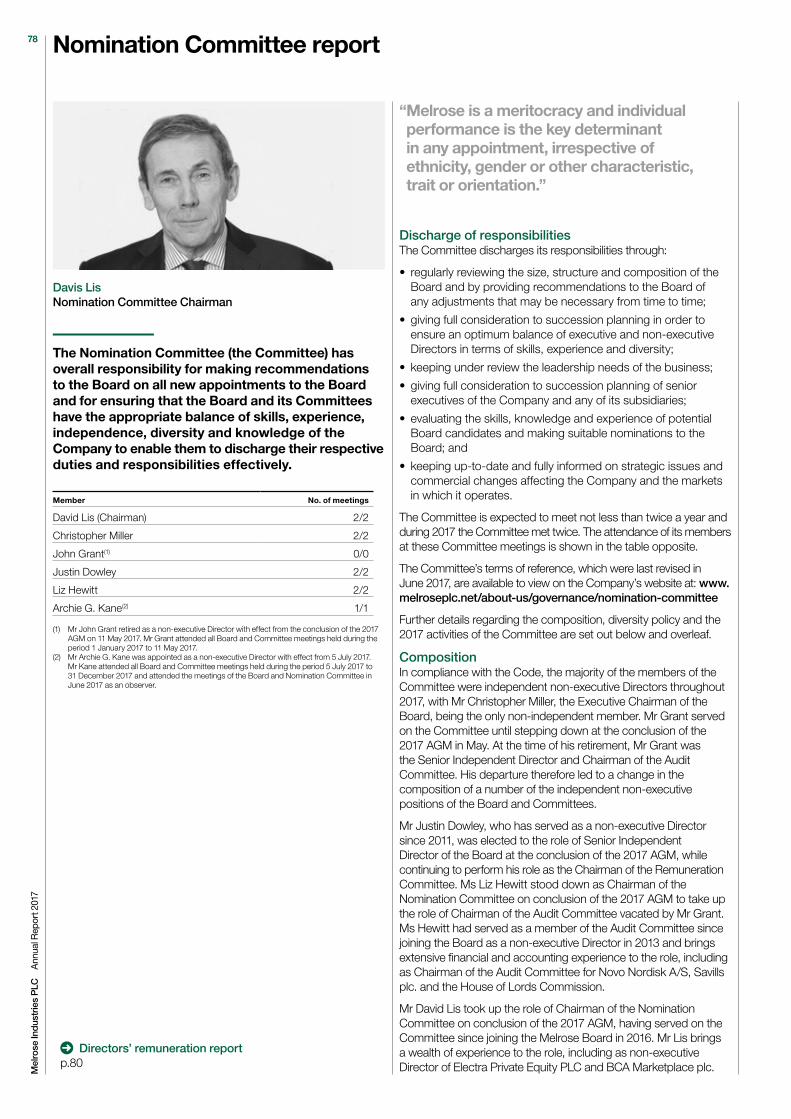
Nomination Committee report
“ Melrose is a meritocracy and individual performance is the key determinant in any appointment, irrespective of ethnicity, gender or other characteristic, trait or orientation.”
Discharge of responsibilitiesThe Committee discharges its responsibilities through:
• regularly reviewing the size, structure and composition of the Board and by providing recommendations to the Board of any adjustments that may be necessary from time to time;
• giving full consideration to succession planning in order to ensure an optimum balance of executive and non-executive Directors in terms of skills, experience and diversity;
• keeping under review the leadership needs of the business;
• giving full consideration to succession planning of senior executives of the Company and any of its subsidiaries;
• evaluating the skills, knowledge and experience of potential Board candidates and making suitable nominations to the Board; and
• keeping up-to-date and fully informed on strategic issues and commercial changes affecting the Company and the markets in which it operates.
The Committee is expected to meet not less than twice a year and during 2017 the Committee met twice. The attendance of its members at these Committee meetings is shown in the table opposite.
The Committee’s terms of reference, which were last revised in June 2017, are available to view on the Company’s website at: www.melroseplc.net/about-us/governance/nomination-committee
Further details regarding the composition, diversity policy and the 2017 activities of the Committee are set out below and overleaf.
CompositionIn compliance with the Code, the majority of the members of the Committee were independent non-executive Directors throughout 2017, with Mr Christopher Miller, the Executive Chairman of the Board, being the only non-independent member. Mr Grant served on the Committee until stepping down at the conclusion of the 2017 AGM in May. At the time of his retirement, Mr Grant was the Senior Independent Director and Chairman of the Audit Committee. His departure therefore led to a change in the composition of a number of the independent non-executive positions of the Board and Committees.
Mr Justin Dowley, who has served as a non-executive Director since 2011, was elected to the role of Senior Independent Director of the Board at the conclusion of the 2017 AGM, while continuing to perform his role as the Chairman of the Remuneration Committee. Ms Liz Hewitt stood down as Chairman of the Nomination Committee on conclusion of the 2017 AGM to take up the role of Chairman of the Audit Committee vacated by Mr Grant. Ms Hewitt had served as a member of the Audit Committee since joining the Board as a non-executive Director in 2013 and brings extensive financial and accounting experience to the role, including as Chairman of the Audit Committee for Novo Nordisk A/S, Savills plc. and the House of Lords Commission.
Mr David Lis took up the role of Chairman of the Nomination Committee on conclusion of the 2017 AGM, having served on the Committee since joining the Melrose Board in 2016. Mr Lis brings a wealth of experience to the role, including as non-executive Director of Electra Private Equity PLC and BCA Marketplace plc.
Davis LisNomination Committee Chairman
The Nomination Committee (the Committee) has overall responsibility for making recommendations to the Board on all new appointments to the Board and for ensuring that the Board and its Committees have the appropriate balance of skills, experience, independence, diversity and knowledge of the Company to enable them to discharge their respective duties and responsibilities effectively.
Member No. of meetings
David Lis (Chairman) 2/2
Christopher Miller 2/2
John Grant(1) 0/0
Justin Dowley 2/2
Liz Hewitt 2/2
Archie G. Kane(2) 1/1
(1) Mr John Grant retired as a non-executive Director with effect from the conclusion of the 2017 AGM on 11 May 2017. Mr Grant attended all Board and Committee meetings held during the period 1 January 2017 to 11 May 2017.
(2) Mr Archie G. Kane was appointed as a non-executive Director with effect from 5 July 2017. Mr Kane attended all Board and Committee meetings held during the period 5 July 2017 to 31 December 2017 and attended the meetings of the Board and Nomination Committee in June 2017 as an observer.
Directors’ remuneration report p.80
78M
elro
se In
dus
trie
s P
LC
Ann
ual R
epor
t 201
7

On the recommendation of the Nomination Committee, the Board decided to increase the number of independent Directors following Mr Grant’s retirement so that they comprised the majority of the members of the Board. Therefore, external recruitment consultants Stonehaven International were retained to identify suitable candidates for the Board’s consideration. Stonehaven International provided an initial list of potential candidates which the Nomination Committee reviewed and produced a shortlist of candidates, from which several candidates were invited to interview with members of the Committee. Mr Archie G. Kane was identified as the Board’s preferred candidate and accepted the offer of appointment subject to certain necessary approvals. Those approvals were granted and Mr Kane was appointed to the Board on 5 July 2017.
Mr Kane brings significant financial and accounting experience to the Board having begun his career as a Chartered Accountant at Mann Judd Gordon and Company. Mr Kane then moved into the financial services sector as Group Financial Controller of the TSB subsidiary United Dominions Trust. Mr Kane became Group Strategy Director responsible for strategic planning for all group businesses, mergers and acquisitions, disposals and long-term business research. Mr Kane continued to serve in senior roles for Lloyds Bank, including Retail Financial Services Director and Group Director for IT & Operations before being appointed Group Executive Director Insurance Investments and Chief Executive Officer for the former mutual Scottish Widows in 2003. In 2009 he moved to become Group Executive Director for all the group’s insurance businesses and for Scotland, until his retirement in May 2011. Mr Kane continues to work as a non-executive Governor of the Bank of Ireland. In accordance with the Articles, Mr Kane will stand for election at the 2018 AGM.
Following Mr Kane’s appointment, the Committee continued its search for a fifth non-executive Director. However, at the time the Company’s approach to GKN plc was made public, the appropriate candidate had not been identified and it was decided to suspend the search for the fifth non-executive Director until the acquisition process has concluded.
The Company Secretary acts as secretary to the Committee. On occasion, the Committee invites the Chief Executive, the Executive Vice-Chairman and the Group Finance Director to attend discussions where their input is required.
DiversityMelrose is a meritocracy and individual performance is the key determinant in any appointment, irrespective of ethnicity, gender or other characteristic, trait or orientation. The Board recognises the importance of diversity throughout the workforce, be it geographical, cultural or market-aligned and encompassing gender, race, sexual orientation and disability, and the Board is committed to equality of opportunity for all employees. For example, Melrose is proud to support the Business Disability Forum, a body committed to understanding the changes required in the workplace so that disabled people are treated fairly and they can contribute to business success, to society and to economic growth.
The Committee currently takes into account a variety of factors before recommending any new appointments to the Board, including relevant skills to perform the role, experience and knowledge. The most important priority of the Committee, however, has been, and will continue to be, to ensure that the best candidate is selected to join the Board and this approach will remain in place going forward.
The Committee will endeavour to pursue diversity, including gender and ethnic diversity, throughout the Melrose Group and notes the recommendations of Lord Davies’ review, “Women on Boards” and Sir John Parker’s review “Report into Ethnic Diversity of UK Boards” and continues to encourage diversity throughout the
Group. Although not appropriate to set specific diversity targets at Board level and throughout the Group’s workforce due to Melrose’s strategic business model and frequent turnover of businesses, Melrose is actively engaged in finding ways to increase the Group’s diversity.
What the Committee did in 2017The principal focus of the Committee during 2017 has been to consider the items set out below:
• the Committee considered the composition and balance of the Board and the timing of future Board changes and reviewed the succession plans in place in respect of executive Directors and non-executive Directors in conjunction with the provisions of the Code. In particular, action was taken to replace Mr Grant who, having served more than three, three-year terms as a non-executive Director, stood down from the Board following the conclusion of the 2017 AGM. The Committee determined that in securing a replacement for John Grant it would increase the number of non-executive Directors to five, so there will be a majority of independents serving on the Board. The Committee recommended the appointment of Mr Kane whose appointment was approved by the Board and Mr Kane was appointed as a non-executive Director with effect from 5 July 2017. The recruitment process for the fifth non-executive Director has been postponed until the conclusion of the GKN plc acquisition process;
• the existing time commitment of the Company’s non-executive Directors was reviewed and confirmed as appropriate;
• the Committee membership was reviewed and a recommendation made to the Board that, subject to the appointment of a new non-executive Director, no changes would be required to be made in 2018;
• consideration was given to the reappointment of each of the Directors (with the exception of Mr Kane who is standing for election for the first time since his appointment took effect on 5 July 2017) before making a recommendation to the Board regarding each Director’s re-election at the 2018 AGM;
• a review of the leadership requirements of Melrose, both executive and non-executive, was undertaken and this confirmed that the existing management team is appropriate for the Group. This review also demonstrated that appropriate and effective leadership is in place within the businesses and that processes are in place to ensure that performance is reviewed regularly against operational and financial criteria;
• the Committee examined the career planning and talent management programmes in operation across the Group and concluded that these were appropriate for the needs of the business;
• the Committee reviewed and re-affirmed the principles underlying the Company’s diversity policy;
• the Committee’s terms of reference were reviewed and updated in line with best practice; and
• the Committee participated in an externally facilitated independent evaluation of itself carried out by Lintstock Limited to identify areas where performance and procedures might be further improved.
David Lis Chairman, Nomination Committee 20 February 2018
Governance
79
Mel
rose
Ind
ustr
ies
PLC
A
nnua
l Rep
ort 2
017

Directors’ remuneration report
“ Melrose’s philosophy is that executive remuneration should be simple and transparent, support the delivery of the value creation strategy and pay only for performance.”
Dear Shareholder,On behalf of the Board, I am pleased to present our report on Directors’ remuneration at the end of yet another successful year. As set out elsewhere in this Annual Report, the disappointing downgrade of Brush and the restructure of its turbogenerator business, albeit a small part of the Group, is offset by the scale and pace of the transformation achieved with Nortek. Nortek recorded a 52% improvement in its underlying profit through the 5.5 percentage point improvement in its underlying profit margins to over 15%. This margin improvement had been the original three to five-year aim when the business was acquired, but this has been achieved in under 18 months.
Our Directors’ Remuneration Policy was approved by shareholders at the General Meeting on 11 May 2017, with over 80% of votes cast in favour of the resolution, a level of support which was also reflected in the approval of the Incentive Plan (2017). The Policy is set out on pages 19 to 27 of the Circular relating to the General Meeting held on 11 May 2017, which is available on the Company’s website at https://www.melroseplc.net/media/1728/21347274- _-1-_circular.pdf
This report includes the Annual Report on Remuneration, which provides details on the amounts earned in respect of the year ended 31 December 2017 and which will be subject to an advisory vote at the AGM to be held on 10 May 2018.
Performance in 20172017 was another very strong year for Melrose and marked another milestone in our “buy, improve, sell” strategy. It is with this performance in mind, and in line with Melrose’s remuneration philosophy of paying only for performance, that the Committee has taken its decisions in respect of executive Directors’ remuneration arrangements for 2017 and 2018.
Our remuneration structure for executive DirectorsMelrose’s philosophy is that executive remuneration should be simple and transparent, support the delivery of the value creation strategy and pay only for performance. This philosophy is reflected in our remuneration structure.
Justin DowleyRemuneration Committee Chairman
The Board has delegated to the Remuneration Committee (the Committee) responsibility for overseeing the remuneration of the Company’s Directors, Company Secretary and other senior employees.
Member No. of meetings(1)
Justin Dowley (Chairman) 2/2
John Grant(2) 1/1
Liz Hewitt 2/2
David Lis 2/2
Archie G. Kane(3) 1/1
(1) Reflects regular scheduled meetings. The Committee also met twice in connection with the establishment of the Incentive Plan (2017).
(2) Retired from the Committee with effect from the conclusion of the AGM on 11 May 2017.(3) Appointed to the Committee with effect from 5 July 2017.
Board of Directors p.62 to 63
80M
elro
se In
dus
trie
s P
LC
Ann
ual R
epor
t 201
7

The Committee feels strongly that rewards should be linked to generation and delivery of real returns to shareholders.
• Base salary: Base salaries are considered reasonably conservative in comparison to a market-competitive range for companies of similar size and complexity. Since flotation in 2003, all current executive Directors have received the same annual increases to base salary. In the last eight years these increases have averaged 3%.
• Pension: Pension contributions/salary supplements for executive Directors are payable at the level of 15% of base salary, which is considered modest for a business of the size and complexity of Melrose. No executive Director participates in, or has ever participated in, any Group defined benefit pension scheme.
• Annual bonus: The maximum bonus payable is set at 100% of base salary. All Directors who participate in the annual bonus scheme receive the same percentage bonus. In the last three years, the average percentage of base salary payable has been 91%. The maximum opportunity is deliberately positioned below the median maximum opportunity for FTSE 250 companies.
• Long-term incentives: The Incentive Plan (2012) crystallised on 31 May 2017 and was renewed on equivalent economic terms with further shareholder protections. This renewal was approved by shareholders by special resolution at the General Meeting held on 11 May 2017.
The values delivered to the executive Directors under the Incentive Plan (2012) are included in the single total figure of remuneration table on page 84, and are further described below that table. It should be noted that these values were earned over the five-year performance period and that no other long-term incentive vested to the executive Directors over that period.
The Committee strongly believes that this simple and transparent incentive framework is aligned with the Company’s strategy for creation of shareholder value. The Company’s long-term incentive arrangements have applied since Melrose was floated in 2003 and have been regularly renewed with shareholder approval since then. Consistent with Melrose’s remuneration principles, they are intended to align management’s incentive arrangements directly with the interests of shareholders by linking remuneration specifically to shareholder value.
Since its first acquisition in 2005, Melrose has demonstrated an excellent track record, including:
• generating a total net shareholder value increase of £4.8 billion as set out in the table on page 83;
• maintaining an average annual return on investment of 25% since the first acquisition in 2005; and
• producing a gross return of approximately £17.30 for shareholders who invested £1 at the time of its first acquisition in 2005.
The awards paid under the Incentive Plan (2012) were based on value created between March 2012 and 31 May 2017, during which time Melrose’s management created £3.6 billion in value for shareholders, equating to an average annual return of 22%. In the view of the Remuneration Committee, this validates the incentive arrangements as a highly effective and essential mechanism in establishing the necessary environment for management to produce the significant returns enjoyed by shareholders to date. We believe that this remuneration strategy has also directly driven historical outperformance when compared with our competitors and supported the Company’s success. In this regard, our remuneration arrangements are tailored to the culture and strategy of the Company and provide a strong platform for the ongoing long-term success of the Company.
We have included on page 86 details of the awards granted to the executive Directors in 2017 under the Incentive Plan (2017). That plan entitles its participants to 7.5% of the increase in the index-adjusted value over the course of the performance period from and including 31 May 2017, to (but excluding) 31 May 2020.
Through a combination of grants under the Remuneration Policy and their own self-funded purchases of shares, the executive Directors have built significant shareholdings in the Company. As at 31 December 2017, the Chairman and Chief Executive held 135 and 77 times their base salary, respectively, in Melrose shares. The table below shows the number of ordinary shares held by the executive Directors as at 31 December 2017 and the value of each executive Director’s shareholding at that date as a multiple of their 2017 base salary. Further details on Directors’ shareholdings are given on page 87.
Executive Director
Number of shares held as at
31 December 2017
Value of shares held at 31 December
2017 (1)
(£)
Value of shares held at 31 December
2017 as a multiple of 2017 base
salary
Christopher Miller 30,108,510(2) 63,890,258 135x
David Roper 15,730,130 33,379,336 70x
Simon Peckham 17,265,565 36,637,529 77x
Geoffrey Martin 7,395,256 15,692,733 41x
(1) For these purposes, the value of a share is 212.20 pence, being the closing mid-market price on 29 December 2017, being the last business day prior to 31 December 2017.
(2) As at 31 December 2017, the interest of Christopher Miller included 8,750,000 ordinary shares held by Harris & Sheldon Investments Limited, a company which is connected with Christopher Miller within the meaning of section 252 of the Act.
Our remuneration structure for non-executive DirectorsA simple remuneration structure is applied for the non-executive Directors. Non-executive Directors are paid fees to reflect market conditions and to attract individuals with appropriate knowledge and expertise. Fees for non-executive Directors are determined by the executive Directors, and non-executive Directors do not participate in the Company’s pension arrangements, the annual bonus or long-term incentive arrangements.
Governance
81
Mel
rose
Ind
ustr
ies
PLC
A
nnua
l Rep
ort 2
017

Directors’ remuneration reportContinued
The overall framework for the executive Directors’ annual bonus arrangements for 2018 will remain the same as in 2017, with a maximum bonus opportunity of 100% of salary, 80% of which is based on financial performance metrics and 20% of which is based on strategic performance metrics.
In accordance with terms of the Incentive Plan (2017), allocations are phased over the course of the performance period. Accordingly, the Remuneration Committee intends to make a further allocation of options over incentive shares in the Incentive Plan (2017) to executive Directors and senior management during 2018. For accounting purposes, the IFRS 2 charge has been calculated as if all three tranches have been granted on day one because of a common expectation, established at that date but subject to changes to take account of exceptional circumstances, between employees and the Company that the remaining options will be allocated annually in two more equal tranches over the three-year performance period.
Business unit long-term incentive plansLong-term incentive plans were put in place for the leadership of the Group’s businesses during 2017, with payouts based on the creation of shareholder value in their respective businesses.
Shareholder engagementWe remain committed to maintaining an open and transparent engagement with our investors. We believe that a key objective of the Directors’ Remuneration Report is to communicate clearly how much our executive Directors are earning and how this is clearly linked to performance. Members of the Committee are engaged in an ongoing dialogue with corporate governance advisory agencies and investors in order to better understand their views on Melrose’s approach to executive remuneration. Specifically during 2017, the Company conducted a formal engagement with over 30 key shareholders and corporate governance advisory agencies in respect of the AGM and the establishment of the Incentive Plan (2017).
Justin DowleyChairman, Remuneration Committee 20 February 2018
2017 key decisions and incentive pay-outsThe Remuneration Committee remains committed to a responsible approach to executive pay.
In line with increases in previous years, an increase of 3% was made to the executive Directors’ salaries with effect from 1 January 2017. This is consistent with the salary rises awarded to the wider head office population other than where other such employees’ salaries have been increased on a different basis to reflect individual circumstances such as promotions. Non-executive Directors’ basic fees increased by 3% with effect from 1 January 2017. However, the additional fees payable to the committee chairmen and the Senior Independent Director were left unchanged.
Annual bonuses for executive Directors are calculated using two elements, 80% being based on diluted earnings per share growth and 20% based on a strategic element. The maximum bonus opportunity is set at 100% of base salary, which is below the maximum median annual bonus opportunity for FTSE 250 companies, and reflects the participation of the Chief Executive and Group Finance Director in the Incentive Plan (2012) and Incentive Plan (2017). The Chairman and the Vice-Chairman do not participate in the annual bonus scheme. Information on the bonuses earned during the year and the relevant performance measures is set out on page 85.
The Incentive Plan (2012) crystallised on 31 May 2017 as referred to above, and further information is set out below the single total figure of remuneration table on page 84. Allocations of options to acquire incentive shares under the Incentive Plan (2017) were made on establishment on 31 May 2017, as set out below. On 29 June 2017, the executive Directors exercised all options held by them at that time, paying the exercise price to the Company and being issued with incentive shares under the Incentive Plan (2017). No value can be realised in respect of these shares until crystallisation of the Incentive Plan (2017), which is intended to occur on 31 May 2020.
Approach to Directors’ remuneration for 2018In 2018, we will apply the Remuneration Policy approved by shareholders at the General Meeting on 11 May 2017.
Executive Directors’ base salaries have been increased by 3%, with effect from 1 January 2018. This is consistent with the salary rises awarded to the wider head office population, other than where such employees’ salaries have been increased on a different basis to reflect individual circumstances, such as promotions. Non-executive Directors’ basic fees for 2018 have also been increased by 3%, with effect from 1 January 2018. However, the additional fees payable to the committee chairmen and the Senior Independent Director are viewed as appropriate and have been left unchanged.
82M
elro
se In
dus
trie
s P
LC
Ann
ual R
epor
t 201
7

Since its first acquisition in 2005, Melrose has demonstrated an excellent track record, including:
• generating a total net shareholder value increase of £4.8 billion as set out in the table opposite;
• maintaining an average annual return on investment of 25%; and
• producing a gross return of approximately £17.30 for shareholders who invested £1 at the time of its first acquisition in 2005.
The awards paid under the Incentive Plan (2012) are based on value created between March 2012 and 31 May 2017, during which time Melrose’s management created £3.6 billion in value for shareholders, equating to an average annual return of 22%. In the view of the Remuneration Committee, this validates the incentive arrangements as a highly effective and essential mechanism in establishing the necessary environment for management to produce the significant returns enjoyed by shareholders to date. We believe that this remuneration strategy
Annual Report on RemunerationMelrose’s remuneration philosophy is that executive remuneration should be simple and transparent, support the delivery of the value creation strategy and pay only for performance. This philosophy is reflected in our remuneration structure, whereby:
• both the salary and annual incentive remuneration (annual bonus) is positioned below the median maximum opportunity for FTSE 250 companies; and
• long-term incentive remuneration is intended to directly align executive Directors’ remuneration with that of shareholders by connecting remuneration specifically to the creation of shareholder value.
The Committee strongly believes that this simple and transparent incentive framework is aligned with the Company’s strategy for creation of shareholder value. The Company’s long-term incentive arrangements have applied since Melrose was floated in 2003 and have been regularly renewed with shareholder approval since then. Consistent with Melrose’s remuneration principles, they are intended to align management’s incentive arrangements directly with the interests of shareholders by linking remuneration specifically to shareholder value.
has also directly driven historical outperformance when compared with our competitors and supported the Company’s success. In this regard, our remuneration arrangements are tailored to the culture and strategy of the Company and provide a strong platform for the ongoing long-term success of the Company.
Total shareholder investment £ billion
Total money invested (3.6)
Total money returned to investors 4.3
Net shareholder investment returned 0.7
Market capitalisation 4.1
Net shareholder gain 4.8
The Annual Report on Remuneration sets out the amounts earned by Directors in 2017 as a result of the application of our remuneration philosophy, and how that philosophy will be applied in 2018.
Governance
83
Mel
rose
Ind
ustr
ies
PLC
A
nnua
l Rep
ort 2
017

Directors’ remuneration reportContinued
Single total figure of remunerationThe following information provided in this part of the Annual Report on Remuneration is subject to audit.
Year ended 31 December 2017
Total salary and fees
£’000
Taxable benefits
£’000
Annual bonus £’000
Long-termincentives(1)
£’000
Pension relatedbenefits(2)
£’000Total £’000
Christopher Miller 475 19 – 41,770 71 42,335
David Roper 475 18 – 41,770 71 42,334
Simon Peckham 475 20 428 41,770 71 42,764
Geoffrey Martin 380 27 342 41,770 57 42,576
John Grant(3)(4) 30 – – – 30
Justin Dowley(4) 81 – – – 81
Liz Hewitt 75 – – – 75
David Lis 69 – – – 69
Archie G. Kane(5) 33 – – – 33
Total 2,093 84 770 167,080 270 170,297
(1) The Incentive Plan (2012) crystallised in 2017. The values included in the above table are calculated in accordance with the applicable regulations, as further disclosed below.(2) All of the £270,923 attributable to pension contributions was paid as a supplement to base salary in lieu of pension arrangements.(3) John Grant retired as a non-executive Director of the Company with effect from 11 May 2017 and the fees referred to above reflect his fees for the period from 1 January 2017 to 11 May 2017.(4) Includes £5,000 per annum in recognition of the role of Senior Independent Director, pro-rated for time served.(5) Archie G. Kane was appointed as a non-executive Director of the Company with effect from 5 July 2017 and the fees referred to above reflect his fees for the period 5 July 2017 to 31 December 2017.
Year ended 31 December 2016
Total salary and fees
£’000
Taxable benefits
£’000
Annual bonus £’000
Long-termincentives(1)
£’000
Pension relatedbenefits(2)
£’000Total £’000
Christopher Miller 461 19 – – 69 549
David Roper 461 18 – – 69 548
Simon Peckham 461 19 438 – 69 987
Geoffrey Martin 369 27 351 – 56 803
John Grant(4) 79 – – – – 79
Justin Dowley 76 – – – – 76
Liz Hewitt 68 – – – – 68
David Lis(3) 42 – – – – 42
Perry Crosthwaite(4)(5) 26 – – – – 26
Total 2,043 83 789 – 263 3,178
(1) The Company’s long-term incentive arrangement for Directors was the Incentive Plan (2012). This five-year plan crystallised in 2017 and, accordingly, no value was vested to participants in respect of the year to 31 December 2016.
(2) Of the £263,025 attributable to pension contributions, £253,650 was paid as a supplement to base salary in lieu of pension arrangements. The balance of £9,375 was paid into the Directors’ individual nominated private pension plans.
(3) David Lis was appointed as a non-executive Director of the Company with effect from 12 May 2016 and the fees referred to above reflect his fees for the period 12 May 2016 to 31 December 2016.(4) Includes £5,000 per annum in recognition of the role of Senior Independent Director, pro-rated for time served.(5) Perry Crosthwaite retired as a non-executive Director of the Company with effect from 11 May 2016 and the fees referred to above reflect his fees for the period 1 January 2016 to 11 May 2016.
Base salarySalaries are fixed at a level which is considered reasonably conservative in comparison to a market competitive range for companies of similar size and complexity. Each executive Director received an increase in base salary of approximately 3% effective from 1 January 2017.
BenefitsThe range of benefits provided to Directors has not changed since the inception of Melrose and there is no intention to widen the range of benefits Directors may receive. All of the executive Directors received certain benefits during 2017, being a company car allowance, fuel allowance, private medical insurance, life insurance and group income protection. Geoffrey Martin also received paid train travel to and from London.
84M
elro
se In
dus
trie
s P
LC
Ann
ual R
epor
t 201
7

The Committee is satisfied that given their significant shareholdings the interests of executive Directors are aligned with those of shareholders, and therefore considers bonus deferral provisions would be unnecessary and inappropriate.
Long-term incentivesThe long-term incentives values in the 2017 single total figure of remuneration table reflect the value of the Incentive Plan (2012) which vested in May 2017. The performance period of that plan ran from May 2012 to May 2017 and delivered to participants (including the executive Directors) 7.5% of the index adjusted growth in shareholder value of the Company over that period, calculated in accordance with the Incentive Plan (2012) rules. It should be noted that these values were earned over that five-year period and that no other long-term incentive vested to the executive Directors over that period. As noted in the statement from the Chairman of the Committee, the creation of shareholder value over the same period was £3.6 billion.
As described in the circular relating to the General Meeting on 11 May 2017, the crystallisation of the Incentive Plan (2012) resulted in an income tax liability for the participants. The tax liability could have been satisfied by the sale of shares acquired on the crystallisation of the Incentive Plan (2012). However, as described in that circular, the Committee recognised that this would increase the dilutive effect of the Incentive Plan (2012) on existing shareholders, and instead determined that a proportion of the Incentive Plan (2012) options would be cancelled in return for a cash payment equal to the value of the shares that would otherwise have been issued for those options, so as to enable participants to meet their tax and National Insurance contributions liability, with the cash payment withheld to satisfy those liabilities.
In the 2017 single total figure of remuneration table, the long-term incentives value for each executive Director is calculated as follows:
Executive Director
Number of ordinary shares acquired pursuant to the
crystallisation of the Incentive Plan (2012)
Value of ordinary shares acquired pursuant to the
crystallisation of theIncentive Plan (2012)(1)
Amount of cash cancellation
payment to meet tax and NIC liabilities Option exercise price Aggregate value(2)
Christopher Miller 9,604,317 £22,978,328 £18,796,627 £4,675 £41,770,280
David Roper 9,604,317 £22,978,328 £18,796,627 £4,675 £41,770,280
Simon Peckham 9,255,069 £22,142,753 £19,632,032 £4,505 £41,770,280
Geoffrey Martin 9,255,069 £22,142,753 £19,632,032 £4,505 £41,770,280
(1) Based on a share price of £2.3925, being the closing value of those shares on 31 May 2017.(2) Net of £1 per option exercise price paid by the executive Directors in respect of the exercise of the options over incentive shares in the Incentive Plan (2017).
BonusThe maximum bonus opportunity is set below the maximum median annual bonus opportunity for FTSE 250 companies to reflect the participation of the executive Directors in the Company’s long-term incentive arrangements. For the year ended 31 December 2017, the maximum bonus opportunity was equal to 100% of base salary. Following the application of the formulaic basis used in previous years and as explained below, it was determined by the Committee that Simon Peckham and Geoffrey Martin (being the only executive Directors participating in the annual bonus plan) should be awarded a bonus of 90% of base salary.
Measure Performance measure Threshold Target Maximum Actual audited results Weighting
Bonusoutturn
(% of basesalary)
Growth in earningsper share
EPS growth subject to a 5x multiple (capped at 80% of base salary)
0% n/a 100% Proforma growth in EPS of 54% as set out in the Finance Director’s review and the glossary to the financial statements.
80% 80%
Strategic element
Strategic objectives set by the Committee:
The strategic objectives focused on the “Improve” segment of the “Buy, Improve, Sell” strategy.The scale and pace of the improvement achievement at Nortek to deliver underlying operating margins over 15% and improvement in underlying operating profit of 52% was balanced by the downgrade and restructure at Brush, albeit a small part of the Group and largely market driven.
Accordingly, the Committee awarded 10% of the possible 20% maximum available for the strategic element of the 2017 annual bonus.
20% 10%
Total 100% 90%
Governance
85
Mel
rose
Ind
ustr
ies
PLC
A
nnua
l Rep
ort 2
017

Directors’ remuneration reportContinued
Scheme interests awarded during the yearAwards were granted to the executive Directors and other participants under the Incentive Plan (2017), on establishment on 31 May 2017. On 29 June 2017, each of the executive Directors exercised all options they held at that time and, on payment of the exercise price to the Company, the executive Directors were issued with Incentive Shares (2017). Details of the award, exercise and issue to the executive Directors are as follows: Christopher Miller 2,583 Incentive Shares (2017), David Roper 2,583 Incentive Shares (2017), Simon Peckham 2,833 Incentive Shares (2017) and Geoffrey Martin 2,833 Incentive Shares (2017).
The Incentive Shares (2017) entitle the holders to 7.5% of the increase in the index-adjusted value from and including 31 May 2017 to (but excluding) 31 May 2020, subject to earlier crystallisation in accordance with the Incentive Plan (2017). For accounting purposes, the IFRS 2 charge has been calculated as if all three tranches have been granted on establishment because of a common expectation, established at that date but subject to changes to take account of exceptional circumstances, between employees and the Company that the remaining options will be allocated annually in two more equal tranches over the three-year performance period.
The regulations require that the Directors’ Remuneration Report sets out the face value of the awards at the date of grant. However, this is not practical in the case of the Incentive Plan (2017), where the value of any award is based on the growth in value of the Company over the applicable measurement period.
Payments to past DirectorsNo payments were made in the year to any former Director of the Company.
Payments for loss of officeNo payments for loss of office were made in the year to any Director.
Statement of Directors’ shareholding and share interestsAs disclosed at the time of the crystallisation of the 2009 Incentive Plan, the executive Directors considered it appropriate that they, together with their immediate families, would hold at least half of the shares acquired pursuant to that crystallisation (after satisfying tax obligations following the crystallisation of that plan and subject to capital adjustments) for the foreseeable future. Accordingly, the Remuneration Committee has adopted the minimum share retention guidelines outlined below in relation to the holding of ordinary shares by executive Directors who participated in the 2009 Incentive Plan and the Incentive Plan (2012) and who participate in the Incentive Plan (2017), reinforcing the executive Directors’ long-term stewardship of the Company and long-term investment in the Company’s shares.
No executive Director may dispose of any ordinary shares without the consent of the Remuneration Committee, which will not normally be withheld provided the executive Director will continue to hold at least the “minimum number” of ordinary shares referred to in the table below following any such disposal.
These guidelines were updated at the time of the renewal of the Incentive Plan (2017) for the ordinary shares issued to executive Directors on crystallisation of the Incentive Plan (2012) as set out in the table on page 85.
Executive Director
Minimum numberof ordinary
shares to be heldby the executive
Directors as at 31 December
2017(1)
Number of ordinary shares
held as at 31 December
2017
Value of ordinary shares held as at
31 December 2017 as a multiple
of salary for the year ended
31 December2017 (3)
Christopher Miller 4,802,159 30,108,510(2) 135x
David Roper 4,802,159 15,730,130 70x
Simon Peckham 4,627,535 17,265,565 77x
Geoffrey Martin 4,627,535 7,395,256 41x
(1) This threshold is subject to adjustments related to the reductions in capital as the Company returns proceeds to shareholders following the sale of businesses.(2) As at 31 December 2017, the interest of Christopher Miller included 8,750,000 ordinary shares held by Harris & Sheldon Investments Limited, a company which is connected with Christopher Miller
within the meaning of section 252 of the Act.(3) For these purposes, the value of a share is 212.20 pence, being the closing mid-market price on 29 December 2017, the last business day prior to 31 December 2017.
As at 31 December 2017, each executive Director held much more than the minimum number of ordinary shares and so satisfied the guidelines. Internal Company rules on shareholdings are extended to senior management in addition to the executive Directors, in order that appropriate remuneration principles are applied to senior management on a similar basis to executive Directors.
86M
elro
se In
dus
trie
s P
LC
Ann
ual R
epor
t 201
7

Directors’ shareholding and share interests as at 31 December 2017 (or, if earlier, the date of retirement from the Board)
Director Type
Ordinary shares held at 31 December 2017
(or, if earlier, the date of retirement from the Board)
Vested interests under share schemes
Unvested interests under share schemes
Subject to performance conditions
Not subject to performance conditions
Christopher Miller(4) Ordinary shares(1) 30,108,510 n/a n/a n/a
Incentive Shares (2017)(2) n/a n/a 2,583 n/a
David Roper(4) Ordinary shares 15,730,130 n/a n/a n/a
Incentive Shares (2017)(2) n/a n/a 2,583 n/a
Simon Peckham(4) Ordinary shares 17,265,565 n/a n/a n/a
Incentive Shares (2017)(2) n/a n/a 2,833 n/a
Geoffrey Martin(4) Ordinary shares 7,395,256 n/a n/a n/a
Incentive Shares (2017)(2) n/a n/a 2,833 n/a
Justin Dowley Ordinary shares 1,065,661 n/a n/a n/a
Liz Hewitt Ordinary shares 120,877 n/a n/a n/a
David Lis Ordinary shares 433,947 n/a n/a n/a
Archie G. Kane Ordinary shares – n/a n/a n/a
John Grant(3) Ordinary shares 632,637 n/a n/a n/a
(1) As at 31 December 2017, the interest of Christopher Miller included 8,750,000 ordinary shares held by Harris & Sheldon Investments Limited, a company which is connected with Christopher Miller within the meaning of section 252 of the Act.
(2) Each executive Director was granted options over Incentive Shares (2017) on 31 May 2017: Christopher Miller was granted 2,583 options, David Roper was granted 2,583 options, Simon Peckham was granted 2,833 options and Geoffrey Martin was granted 2,833 options. Each executive Director exercised his option on 29 June 2017 and 2,583 Incentive Shares (2017) each were issued to Christopher Miller and David Roper and 2,833 Incentive Shares (2017) each were issued to Simon Peckham and Geoffrey Martin. The value which may be derived from the Incentive Shares (2017) acquired on exercise will be determined following 31 May 2020, or any other earlier crystallisation date in accordance with the Incentive Plan (2017). For accounting purposes, the IFRS 2 charge has been calculated as if all three tranches have been granted on day one because of a common expectation, established at that date but subject to changes to take account of exceptional circumstances, between employees and the Company that the remaining options will be allocated annually in two more equal tranches over the three-year performance period.
(3) John Grant retired as a non-executive Director of the Company with effect from 11 May 2017.(4) During 2017, each executive Director exercised his option under the Incentive Plan (2012). Each executive Director held an option over 8,500 Incentive Shares (2012). Those options were cancelled in
respect of 3,825 Incentive Shares (2012) (in the case of Christopher Miller), 3,825 Incentive Shares (2012) (in the case of David Roper), 3,995 Incentive Shares (2012) (in the case of Simon Peckham) and 3,995 Incentive Shares (2012) (in the case of Geoffrey Martin), as referred to on page 64. The Incentive Shares (2012) acquired on exercise of the Incentive Plan (2012) options were converted into 9,604,317 ordinary shares (in the case of Christopher Miller), 9,604,317 ordinary shares (in the case of David Roper), 9,255,069 ordinary shares (in the case of Simon Peckham) and 9,255,069 ordinary shares (in the case of Geoffrey Martin), as referred to on page 64.
There have been no changes in the holdings of the Directors between 31 December 2017 and 20 February 2018.
Performance graphThe information provided in this part of the Annual Report on Remuneration is not subject to audit.
The total shareholder return graph below shows the value as at 31 December 2017 of £100 invested in the Company on 31 December 2009, compared with £100 invested in the FTSE 100 Index, the FTSE 250 Index or the FTSE All-Share Index. The Committee considers the FTSE 100 Index, the FTSE 250 Index and the FTSE All-Share Index to be appropriate indices for the year ended 31 December 2017 for the purposes of this comparison because of the comparable size of the companies which comprise the FTSE 100 Index and the FTSE 250 Index and the broad nature of companies which comprise the FTSE All-Share Index. The data shown below assumes that all cash returns to shareholders made by the Company during this period are reinvested in ordinary shares.
4,000
3,000
2,000
1,000
0
Dec 10 Dec 09
Source: Datastream
Dec 11 Dec 12 Dec 13 Dec 14 Dec 15 Dec 16 Dec 17
Melrose FTSE 100
Val
ue o
f inv
estm
ent (
£)
FTSE 250 FTSE All-Share
Governance
87
Mel
rose
Ind
ustr
ies
PLC
A
nnua
l Rep
ort 2
017

Directors’ remuneration reportContinued
Financial year Chief Executive
Total remuneration
£
Total remuneration excluding the
long-term incentive value
£
Annual bonus as a percentage
of maximum opportunity
Long-term incentives as a percentage of
maximum opportunity
Year ended 31 December 2017 Simon Peckham 42,764,000(2) 994,000 90% n/a(3)
Year ended 31 December 2016 Simon Peckham 987,725 987,725 95% –
Year ended 31 December 2015 Simon Peckham 928,541 928,541 88% –
Year ended 31 December 2014 Simon Peckham 773,167 773,167 58% –
Year ended 31 December 2013 Simon Peckham 927,276 927,276 100% –
Year ended 31 December 2012(1) Simon Peckham 20,280,584(4) 489,372 64% n/a(5)
David Roper 10,915,846(4) 259,040 64% n/a(5)
Year ended 31 December 2011 David Roper 811,152 811,152 84% –
Year ended 31 December 2010 David Roper 849,341 849,341 100% –
Year ended 31 December 2009 David Roper 712,372 712,372 70% –
(1) In the year ending 31 December 2012, David Roper was Chief Executive for the period from 1 January 2012 until 9 May 2012 and Simon Peckham was Chief Executive for the period from 9 May 2012 onwards. In the table above:
(i) the “Total remuneration” figure shows, in respect of David Roper, his total remuneration in respect of his service in the period 1 January 2012 to 9 May 2012 and in respect of Simon Peckham his total remuneration in respect of his service in the period from 9 May 2012 to 31 December 2012. Included in this figure for each of David Roper and Simon Peckham is the value of the long-term incentives vesting in the year pro-rated to reflect the portion of the year for which he was Chief Executive; and
(ii) the “Total remuneration excluding the long-term incentive value” shows in respect of each of David Roper and Simon Peckham total remuneration in respect of the period for which he was Chief Executive excluding any value received on the maturity in April 2012 of the 2009 Incentive Plan.
(2) The value derived in 2017 from the Incentive Shares (2012) represents the Chief Executive’s share, determined in accordance with the terms of those shares, of the shareholder value created over a period of approximately five years.
(3) On the crystallisation in May 2017 of the Incentive Plan (2012), participants as a whole were entitled to 7.5% of the increase in shareholder value from 22 March 2012 to 31 May 2017. Because the value derived on the crystallisation of the Incentive Shares (2012) depended upon the shareholder value created over the relevant period, it is not possible to express the value derived as a percentage of the maximum opportunity.
(4) The value derived in 2012 from the 2009 incentive shares represents the Chief Executive’s share, determined in accordance with the terms of those shares, of the shareholder value created over a period of approximately five years.
(5) On the crystallisation in April 2012 of the 2009 Incentive Plan awarded in 2009, participants as a whole were entitled to 10% of the increase in shareholder value from 18 July 2007 to 23 March 2012. Because the value derived on the crystallisation of the 2009 incentive shares depended upon the shareholder value created over the relevant period, it is not possible to express the value derived as a percentage of the maximum opportunity. The crystallisation of the 2009 incentive shares was satisfied by the conversion of those shares into ordinary shares.
Chief Executive remuneration for previous nine yearsIn accordance with the regulations governing the reporting of Directors’ remuneration, which came into effect in October 2013, the total figure of remuneration set out in the table below includes the value of long-term incentive vesting in respect of the financial year. This means that the full value of the crystallisation of the 2009 Incentive Plan on 11 April 2012 is shown for the year ended 31 December 2012 and that the full value of the Incentive Plan (2012) which crystallised in May 2017 is shown for 2017.
The value of each Incentive Plan was earned over a period of approximately five years. Therefore, in the view of the Committee, inclusion of these values in respect of the years ended 31 December 2012 and 31 December 2017 does not give a fair representation of the Chief Executive’s yearly remuneration over each of the previous five years. Therefore, an additional column has been added to the table below to show total remuneration excluding the value received on the maturity of those plans. No other long-term incentive plan vested in favour of any executive Director in any of the other years.
The amount of that value shown in respect of David Roper and Simon Peckham for the year ended 31 December 2012 reflects the proportion of that year for which each was the Chief Executive.
Element of remuneration
Chief Executive percentage
change
Senior head office employees
percentage change
Basic salary 3% 6%
Benefits 5% -13%
Annual bonus -2% -12%
Percentage change in Chief Executive’s remunerationThe table opposite sets out, in relation to salary, taxable benefits and annual bonus, the percentage increase in pay for the Company’s Chief Executive compared to the average increase for a group consisting of the Company’s senior head office employees, managing directors and finance directors of the Group’s businesses and direct senior reports of those managing directors. The percentages shown opposite relate to the financial year ended 2017 as a percentage comparison to the financial year ended 2016. This group of senior management was considered an appropriate comparator group because of their level of seniority and the structure of their remuneration package. The spread of the Company’s operations across various countries and industries means that remuneration policies vary to take account of geography and industry such that the Committee considers that selecting a wider group of employees would not provide a meaningful comparison.
88M
elro
se In
dus
trie
s P
LC
Ann
ual R
epor
t 201
7

Incentive Plan (2017) awards in 2018In accordance with terms of the Incentive Plan (2017), allocations are phased over the course of the performance period. Accordingly, the Committee intends to make a further allocation of options over Incentive Shares (2017) in the Incentive Plan (2017) to executive Directors and senior management during 2018. For accounting purposes, the IFRS 2 charge has been calculated as if all three tranches have been granted on day one because of a common expectation, established at that date but subject to changes to take account of exceptional circumstances, between employees and the Company that the remaining options will be allocated annually in two more equal tranches over the three-year performance period.
Non-executive Directors’ fees Non-executive Directors’ basic fees have been increased by 3% with effect from January 2018. The non-executive Director fee levels for 2017 and 2018 are set out in the table below.
Fee element
Previous fee with effect from
January 2017
Fee with effect from
January 2018
Basic non-executive Director fee £67,685 £69,715
Additional fee for holding the chairmanship of the Remuneration Committee
£10,000 £10,000
Additional fee for holding the chairmanship of the Audit Committee
£10,000 £10,000
Additional fee for holding the chairmanship of the Nomination Committee
£2,500 £2,500
Additional fee for holding the position of Senior Independent Director
£5,000 £5,000
Consideration by the Directors of matters relating to Directors’ remuneration The responsibilities of the Remuneration CommitteeThe Committee is responsible for, among other things:
• considering and making recommendations to the Board on the framework for the remuneration of the Company’s executive Directors, the Company Secretary and other senior employees;
• ensuring that the executive Directors and senior employees are provided with appropriate annual incentives to encourage enhanced performance and that they are rewarded for their individual contributions to the success of the Company, noting any major changes in employee benefit structures throughout the Group and ensuring that executive Director remuneration practice is consistent with any such changes;
• approving the structure of, and determining targets for, any performance-related pay schemes (including bonus schemes) and any material long-term incentive plans operated by the Company;
• reviewing the structure of all share incentive plans operated by the Company for approval by the Board; and
• reviewing, on an annual basis, remuneration trends across the Group and obtaining reliable and up-to-date information about the remuneration of Directors and senior employees in other companies of comparable scale and complexity.
Full details can be found in the terms of reference available in the Investor section of the Melrose website at www.melroseplc.net
Fees for non-executive Directors are determined by the executive Directors.
Relative importance of spend on payThe following table sets out the percentage change in dividends and the overall expenditure on pay (as a whole across the organisation).
Expenditure
Year ended 31 December
2016
Year ended 31 December
2017Percentage
change
Remuneration paid to all employees
£246.6million(1) £502.9million(1) 104%
Distributions to shareholders by way of dividend and share buy back
£2,394.3million(2) £63.0million -97%
(1) The figure for the year ended 31 December 2016 total staff costs as stated in note 7 on page 121 of the 2017 Annual Report and financial statements and the figure for the year ended 31 December 2017 is the year end 31 December 2017 total staff costs as stated in note 7 on page 121 of the 2017 Annual Report and financial statements. The 2016 total staff costs include four months of Nortek staff costs as compared to the 2017 total staff costs which reflect a full year of Nortek’s staff costs. In light of the Company’s business model of buy, improve, sell and return of capital to shareholders your Board does not consider that the table is meaningful in the context of the Group’s remuneration structure which provides a strong alignment with shareholder interests.
(2) The figure for year ended 2016 includes the £2,388.5 million return of capital to shareholders in February 2016.
Implementation of Directors’ Remuneration Policy for the financial year commencing on 1 January 2018The Committee strongly believes that its remuneration framework is aligned with the Company’s strategy for creation of shareholder value, and no structural changes to the Directors’ remuneration arrangements are proposed for 2018. A summary of our approach to executive Directors’ remuneration and non-executive Directors’ fees for 2018 is set out below.
Executive Directors’ salariesExecutive Directors’ salaries have increased by 3% with effect from January 2018. This is consistent with the salary rises awarded to the wider head office population, other than where other such employees’ salaries have been increased on a different basis to reflect individual circumstances such as promotions, as shown in the following table.
Executive Director2017 salary
£’000 2018 salary
£’000Percentage
increase
Christopher Miller 475 490 3%
David Roper 475 490 3%
Simon Peckham 475 490 3%
Geoffrey Martin 380 392 3%
Bonus arrangements for 2018The overall framework for Simon Peckham’s and Geoffrey Martin’s (the executive Directors who participate in the annual bonus arrangement) annual bonus arrangements for 2018 will remain the same as in 2017, with a maximum bonus opportunity of 100% of salary, based on financial performance metrics as regards 80% of the opportunity and strategic performance metrics as regards the balance. The Committee considers that the strategic performance measures are commercially sensitive but will disclose the nature of those measures on a retrospective basis, where appropriate, on a similar basis to the disclosure on page 85 in respect of the annual bonus for the year ending 31 December 2017.
Governance
89
Mel
rose
Ind
ustr
ies
PLC
A
nnua
l Rep
ort 2
017

Directors’ remuneration reportContinued
The members of the Remuneration CommitteeThe members of the Committee during the year were Justin Dowley (Committee Chairman), Liz Hewitt, David Lis and Archie G. Kane (appointed to the Committee with effect from 5 July 2017). John Grant was a member of the Committee from 1 January 2017 until his retirement from the Board following the conclusion of the 2017 AGM on 11 May 2017. The Company regards all members of the Committee as independent non-executive Directors; the composition of the Committee is therefore in accordance with the UK Corporate Governance Code. During the year, the Committee met four times, including two regularly scheduled meetings and two special meetings in relation to the establishment of the Incentive Plan (2017).
Advisers to the Remuneration CommitteeDuring the year, the Remuneration Committee received advice on the remuneration reporting regulations and preparation of the Directors’ Remuneration Report from Deloitte LLP. Deloitte LLP was appointed by the Company Secretary on behalf of the Remuneration Committee. Deloitte LLP’s fees for this advice were £4,000, which were charged on a time/cost basis. As the external auditor to the Company, Deloitte LLP also provides certain other services (as described on page 76 of this Annual Report and financial statements).
Deloitte LLP is a member of the Remuneration Consultants’ Group, and as such chooses to operate pursuant to a code of conduct that requires remuneration advice to be given objectively and independently. The Remuneration Committee is satisfied that the advice provided by Deloitte LLP in relation to remuneration matters is objective and independent.
Statement of voting at general meetingThe Company remains committed to ongoing shareholder dialogue and takes an active interest in voting outcomes. The following table sets out actual voting in respect of the resolutions at the Company’s Annual General Meeting on 11 May 2017 to approve (i) the Directors’ Remuneration Report and (ii) the Directors’ Remuneration Policy:
Votes cast for the resolution
Percentage of votes cast for the
resolutionVotes cast against
the resolution
Percentage of votes cast against
the resolution Total votes cast Votes withheld
Resolution to approve the Directors’ Remuneration Report for the year ended 31 December 2016
1,453,684,782 99.28 10,525,099 0.72 1,464,209,881 120,663
Resolution to approve the Directors’ Remuneration Policy
1,135,681,725 82.04 248,582,841 17.96 1,384,264,566 35,787,047
This report was approved by the Board and signed on its behalf by:
Justin DowleyChairman, Remuneration Committee 20 February 2018
90M
elro
se In
dus
trie
s P
LC
Ann
ual R
epor
t 201
7

Directors’ responsibility statementWe confirm that to the best of our knowledge:
• the financial statements, prepared in accordance with the relevant financial reporting framework, give a true and fair view of the assets, liabilities, financial position and profit or loss of the Company and the undertakings included in the consolidation taken as a whole;
• the Strategic Report includes a fair review of the development and performance of the business and the position of the Company and the undertakings included in the consolidation taken as a whole, together with a description of the principal risks and uncertainties that they face; and
• the Annual Report and financial statements, taken as a whole, are fair, balanced and understandable and provide the information necessary for shareholders to assess the Company’s performance, business model and strategy.
This responsibility statement was approved by the Board of Directors on 20 February 2018 and is signed on its behalf by:
Geoffrey Martin Simon PeckhamGroup Finance Director Chief Executive 20 February 2018 20 February 2018
The Directors are responsible for preparing the Annual Report and financial statements in accordance with applicable law and regulations.
Company law requires the Directors to prepare financial statements for each financial year. Under that law, the Directors are required to prepare the Group financial statements in accordance with International Financial Reporting Standards (IFRSs) as adopted by the European Union and Article 4 of the IAS Regulation and have elected to prepare the parent company financial statements in accordance with United Kingdom Generally Accepted Accounting Practice (United Kingdom Accounting Standards and applicable law), including FRS 102 “The Financial Reporting Standard applicable in the UK and Republic of Ireland”. Under company law, the Directors must not approve the financial statements unless they are satisfied that they give a true and fair view of the state of affairs of the Company and of the profit or loss of the Company for that period.
In preparing the parent company financial statements, the Directors are required to:
• select suitable accounting policies and then apply them consistently;
• make judgements and accounting estimates that are reasonable and prudent;
• state whether applicable UK Accounting Standards have been followed, subject to any material departures disclosed and explained in the financial statements; and
• prepare the financial statements on the going concern basis unless it is inappropriate to presume that the Company will continue in business.
In preparing the Group financial statements, International Accounting Standard 1 requires that Directors:
• properly select and apply accounting policies;
• present information, including accounting policies, in a manner that provides relevant, reliable, comparable and understandable information;
• provide additional disclosures when compliance with the specific requirements in IFRSs are insufficient to enable users to understand the impact of particular transactions, other events and conditions on the entity’s financial position and financial performance; and
• make an assessment of the Company’s ability to continue as a going concern.
The Directors are responsible for keeping adequate accounting records that are sufficient to show and explain the Company’s transactions and disclose with reasonable accuracy at any time the financial position of the Company and enable them to ensure that the financial statements comply with the Act. They are also responsible for safeguarding the assets of the Company and hence for taking reasonable steps for the prevention and detection of fraud and other irregularities.
The Directors are responsible for the maintenance and integrity of the corporate and financial information included on the Company’s website. Legislation in the United Kingdom governing the preparation and dissemination of financial statements may differ from legislation in other jurisdictions.
Statement of Directors’ responsibilitiesGovernance
91
Mel
rose
Ind
ustr
ies
PLC
A
nnua
l Rep
ort 2
017

FinancialsConsolidated statements
Independent auditor’s report to the members of Melrose Industries PLC 94
Consolidated Income Statement 101
Consolidated Statement of Comprehensive Income 102
Consolidated Statement of Cash Flows 103
Consolidated Balance Sheet 104
Consolidated Statement of Changes in Equity 105
Notes to the financial statements
Note1. Corporate information 1062. Summary of significant accounting policies 1073. Critical accounting judgements and
key sources of estimation uncertainty 1154. Revenue 1165. Segment information 1166. Reconciliation between profit and underlying profit 1187. Revenues and expenses 1208. Tax 1219. Dividends 12210. Earnings per share 12311. Goodwill and other intangible assets 12412. Property, plant and equipment 12913. Interests in joint ventures 12914. Inventories 12915. Trade and other receivables 13016. Cash and cash equivalents 13117. Trade and other payables 13118. Interest-bearing loans and borrowings 13219. Provisions 13320. Deferred tax 13321. Share-based payments 13422. Retirement benefit obligations 13523. Financial instruments and risk management 13924. Issued capital and reserves 14225. Cash flow statement 14326. Commitments and contingencies 14327. Related parties 14328. Post Balance Sheet events 14429. Contingent liabilities 144
Company statements
Company Balance Sheet for Melrose Industries PLC 145
Company Statement of Changes in Equity 145
Notes to the Company Balance Sheet
Note1. Significant accounting policies 1462. Loss for the year 1473. Investment in subsidiaries 1474. Debtors 1505. Creditors 1506. Provisions 1507. Issued share capital 1518. Related party transactions 151
Glossary 152
Shareholder InformationNotice of Annual General Meeting 156
Company and shareholder information 162
92M
elro
se In
dus
trie
s P
LC
Ann
ual R
epor
t 201
7

Fina
ncia
ls
Financials
93
Mel
rose
Ind
ustr
ies
PLC
A
nnua
l Rep
ort 2
017

Independent auditor’s report to the members of Melrose Industries PLC
Report on the audit of the financial statementsOpinionIn our opinion:
• the financial statements give a true and fair view of the state of the group’s and of the parent company’s affairs as at 31 December 2017 and of the group’s loss for the year then ended;
• the group financial statements have been properly prepared in accordance with International Financial Reporting Standards (IFRSs) as adopted by the European Union;
• the parent company financial statements have been properly prepared in accordance with United Kingdom Generally Accepted Accounting Practice including Financial Reporting Standard 102 “The Financial Reporting Standard applicable in the UK and Republic of Ireland”; and
• the financial statements have been prepared in accordance with the requirements of the Companies Act 2006 and, as regards the group financial statements, Article 4 of the IAS Regulation.
We have audited the financial statements of Melrose Industries plc (the ‘parent company’) and its subsidiaries (the ‘group’) which comprise:
• the Consolidated Income Statement;
• the Consolidated Statement of Comprehensive Income;
• the Consolidated Statement of Cash Flows;
• the Consolidated and Company Balance Sheets;
• the Consolidated and Company Statements of Changes in Equity; and
• the related notes 1 to 29 to the consolidated financial statements and the related notes 1 to 8 to the company financial statements.
The financial reporting framework that has been applied in the preparation of the group financial statements is applicable law and IFRSs as adopted by the European Union. The financial reporting framework that has been applied in the preparation of the parent company financial statements is applicable law and United Kingdom Accounting Standards, including FRS 102 “The Financial Reporting Standard applicable in the UK and Republic of Ireland” (United Kingdom Generally Accepted Accounting Practice).
Basis for opinionWe conducted our audit in accordance with International Standards on Auditing (UK) (ISAs (UK)) and applicable law. Our responsibilities under those standards are further described in the auditor’s responsibilities for the audit of the financial statements section of our report.
We are independent of the group and the parent company in accordance with the ethical requirements that are relevant to our audit of the financial statements in the UK, including the FRC’s Ethical Standard as applied to listed public interest entities, and we have fulfilled our other ethical responsibilities in accordance with these requirements. We confirm that the non-audit services prohibited by the FRC’s Ethical Standard were not provided to the group or the parent company.
We believe that the audit evidence we have obtained is sufficient and appropriate to provide a basis for our opinion.
Summary of our audit approach
Key audit matters The key audit matters that we identified in the current year were: • Carrying value of goodwill and other non-current assets in the Energy Segment; and • Classification of non-underlying items
Materiality The materiality that we used for the group financial statements was £12.5 million which was determined on the basis of the Group’s underlying profit before tax.
Scoping Full scope audit work was completed on 11 components and the head office function, and specified audit procedures over certain balances were performed on 4 components. In total our scope represented 77% of Group revenue, 83% of Group operating profit and 95% of Group net assets.
Significant changes in our approach Following the acquisition of the Nortek group in August 2016, this is the first full year of ownership. As such we have revised our audit scoping, materiality basis and consideration of the risks most specific to the current group.
In particular, our basis of materiality in the prior year considered revenue, underlying profit before tax and net assets of the enlarged Group, whereas in the current year our basis of materiality is focused on underlying profit before tax.
Our prior year audit report also discussed the risks relating to the acquisition of the Nortek business, focused on the valuation of intangible assets and the fair value of provisions. The acquisition completed in 2016 and is therefore not considered to be a key audit matter in 2017.
94M
elro
se In
dus
trie
s P
LC
Ann
ual R
epor
t 201
7

Conclusions relating to going concern, principal risks and viability statement
Going concern
We have reviewed the directors’ statement in note 2 to the financial statements about whether they considered it appropriate to adopt the going concern basis of accounting in preparing them and their identification of any material uncertainties to the group’s and company’s ability to continue to do so over a period of at least twelve months from the date of approval of the financial statements.
We are required to state whether we have anything material to add or draw attention to in relation to that statement required by Listing Rule 9.8.6R(3) and report if the statement is materially inconsistent with our knowledge obtained in the audit.
We confirm that we have nothing material to report, add or draw attention to in respect of these matters.
Principal risks and viability statement
Based solely on reading the directors’ statements and considering whether they were consistent with the knowledge we obtained in the course of the audit, including the knowledge obtained in the evaluation of the directors’ assessment of the group’s and the company’s ability to continue as a going concern, we are required to state whether we have anything material to add or draw attention to in relation to:
• the disclosures on pages 44 to 49 that describe the principal risks and explain how they are being managed or mitigated;
• the directors’ confirmation on page 42 to 43 that they have carried out a robust assessment of the principal risks facing the group, including those that would threaten its business model, future performance, solvency or liquidity; or
• the directors’ explanation on page 41 as to how they have assessed the prospects of the group, over what period they have done so and why they consider that period to be appropriate, and their statement as to whether they have a reasonable expectation that the group will be able to continue in operation and meet its liabilities as they fall due over the period of their assessment, including any related disclosures drawing attention to any necessary qualifications or assumptions.
We are also required to report whether the directors’ statement relating to the prospects of the group required by Listing Rule 9.8.6R(3) is materially inconsistent with our knowledge obtained in the audit.
We confirm that we have nothing material to report, add or draw attention to in respect of these matters.
Key audit mattersKey audit matters are those matters that, in our professional judgement, were of most significance in our audit of the financial statements of the current period and include the most significant assessed risks of material misstatement (whether or not due to fraud) that we identified. These matters included those which had the greatest effect on: the overall audit strategy, the allocation of resources in the audit; and directing the efforts of the engagement team.
These matters were addressed in the context of our audit of the financial statements as a whole, and in forming our opinion thereon, and we do not provide a separate opinion on these matters.
Our prior year audit report discussed the risks relating to the acquisition of the Nortek business, focused on the valuation of intangible assets and the fair value of provisions. The acquisition completed in 2016 and is therefore not considered to be a key audit matter in 2017.
Financials
95
Mel
rose
Ind
ustr
ies
PLC
A
nnua
l Rep
ort 2
017

Independent auditor’s report to the members of Melrose Industries PLCContinued
Key audit matter description How the scope of our audit responded to the key audit matter Key observations
Carrying value of goodwill and other non-current assetsThe carrying value of goodwill and other non-current assets in the Energy group of cash-generating units (the Energy group) as at 31 December 2017 is comprised of goodwill of £122 million, other intangible assets of £62.5 million and property, plant and equipment of £69.8 million.
Management perform an impairment review for all goodwill balances on an annual basis and for other assets whenever an indication of impairment is identified.
As a result of the continued market downturn and deferral of generator orders in the second half of the year, an impairment trigger was identified for the Energy group. Management determined the recoverable amount for the Energy Group was £300 million, which resulted in pre-tax impairment charges of £95.4 million related to Goodwill and £18.2 million relating to property, plant and equipment, in addition to a £31.1 million charge for the write down of assets in Brush China.
IAS 36 “Impairment of assets” requires that the recoverable amount of an asset is measured as the higher of its Value in Use (“VIU”) or its fair value less costs to sell (“FV”). Management has prepared a model to calculate the recoverable amount, in this instance FV being the higher valuation. The determination of the fair value of the Energy business is a judgemental process which requires estimates concerning the forecast future cash flows, associated growth and discount rates. Further, the valuation includes the impact of restructuring costs on the basis that a market participant would perform a similar restructure. The inclusion of restructuring costs, forecasting of future cash flows and associated growth and discount rates is a judgemental process.
The key judgements and estimates and impairment accounting policy are described in more detail in the audit committee report and in notes 2, 3 and 11 to the consolidated financial statements.
We assessed the design and implementation of relevant controls around management’s preparation of the impairment models.
We assessed management’s impairment paper, underlying analysis, supporting financial model and challenged the reasonableness of the assumptions which underpin management’s forecasts. Specifically, our work included, but was not limited to:
• Evaluating the model applied by management in calculating the fair value less cost to sell recoverable amount, specifically evaluated the appropriateness of the inclusion of the restructuring costs and benefits in the estimation of fair value;
• Evaluating forecast revenue and operating margins with reference to the recent and historical trading performance of the Energy group, as well as the current contractual arrangements and external market data;
• Assessing the forecast restructuring costs and impact on future cash flows;
• Benchmarking long-term growth rates to applicable macro-economic and market data;
• Engaging our internal valuation specialists to challenge the discount rate applied, by obtaining the underlying data used in the calculation and benchmarking it against market data and comparable organisations, and by evaluating the underlying process used to determine the risk adjusted cash flow projections;
• Validating the integrity of the impairment models through testing of the mathematical accuracy and verifying the application of the input assumptions.
We performed sensitivity analysis and have challenged management on the key assumptions such as forecasted revenues, operating margins, discount rate and long-term growth rate which would either individually or collectively impact the impairment charge whilst also considering the likelihood of such movements.
We reviewed the disclosures in note 11 in relation to the sensitivities reflecting the risks inherent in the valuation of goodwill and other non-current assets and also in note 3 in relation to the key sources of estimation uncertainty for the Energy business.
Based on our detailed audit procedures performed, we determined that the assumptions applied in the impairment model were within an acceptable range, that the overall position adopted was reasonable and the disclosures are appropriate.
96M
elro
se In
dus
trie
s P
LC
Ann
ual R
epor
t 201
7

Key audit matter description How the scope of our audit responded to the key audit matter Key observations
Classification of non-underlying itemsThe presentation and consistency of costs and income within non-underlying items is a key determinant in the assessment of the quality of the Group’s underlying earnings.
There is no definition of non-underlying items within IFRS and therefore the Group continues to classify one off costs or income in accordance with its accounting policy on non-underlying items as set out in note 2.
In the Group’s reported results significant adjustments have been made to the statutory operating loss of £6.9m to derive underlying operating profit of £278.4m. Explanations of each adjustment are set out in note 6 to the financial statements.
As such, a risk of material misstatement exists in respect of the classification of items recorded as non-underlying. We note that underlying profit before tax is the main measure used by management in monitoring the Group’s performance and in communication to shareholders.
There is a risk that items may be classified as non-underlying which are underlying or recurring items and that therefore the reported underlying earnings are distorted, whether due to manipulation or error. Consistency in the identification and presentation of these items is important for the comparability of year on year reporting.
We evaluated the appropriateness of the inclusion of items, both individually and in aggregate, within non-underlying results. We assessed the consistency of items included year on year and the application of management’s accounting policy, challenging the nature of these items and ensuring adherence to IFRS requirements, ESMA guidance and latest FRC guidance.
A sample of non-underlying items, including all material items, were agreed to source documentation and evaluated by the component and Group audit teams as to their nature in order to assess whether they are in line with the Group’s accounting policy, and also to assess consistency of non-underlying items between periods in the financial statements.
We also assessed whether the disclosures within the financial statements provide sufficient detail for the reader to understand the nature of these items and how non-underlying results are reconciled to statutory results.
We consider the disclosure of non-underlying items to be in line with the Group’s accounting policies and that the presentation of non-underlying items is consistent between the periods presented.
Our application of materialityWe define materiality as the magnitude of misstatement in the financial statements that makes it probable that the economic decisions of a reasonably knowledgeable person would be changed or influenced. We use materiality both in planning the scope of our audit work and in evaluating the results of our work.
Based on our professional judgement, we determined materiality for the financial statements as a whole as follows:
Group financial statements Parent company financial statements
Materiality £12.5 million (2016: £11 million) £6.25 million (2016: £5.5 million)Basis for determining materiality 5% of underlying profit before tax which is
reconciled to the loss before tax in Note 6 to the financial statements.
50% of Group materiality.
Rationale for the benchmark applied Underlying profit before tax is a key measure used by management in monitoring the Group’s performance and in communication to shareholders. This approach differs from the prior year where we considered a range of benchmarks, including revenue, underlying profit and net assets, due to the impact of the timing of the acquisition of Nortek Inc. and the resulting focus on the balance sheet. Our determined materiality for the current year is equivalent to 0.7% of net assets (2016: 0.5%).
Materiality for the parent company financial statements has been capped at 50% of Group materiality. This is with reference to the net asset position of the parent company when compared to the net asset position of the Group.
Financials
97
Mel
rose
Ind
ustr
ies
PLC
A
nnua
l Rep
ort 2
017

Independent auditor’s report to the members of Melrose Industries PLCContinued
Underlying profit before tax £257.7m
Group materiality £12.5m
Group materiality £12.5m
Upper range of component materiality £6.25m
Audit Committee reporting threshold £0.5m
We agreed with the Audit Committee that we would report to the Committee all audit differences in excess of £500,000 (2016: £250,000) for the group and £250,000 (2016: £125,000) for the parent company, as well as differences below that threshold that, in our view, warranted reporting on qualitative grounds. We also report to the Audit Committee on disclosure matters that we identified when assessing the overall presentation of the financial statements.
An overview of the scope of our auditOur Group audit was scoped by obtaining an understanding of the Group and its environment, including Group-wide controls, and assessing the risks of material misstatement at the Group level.
The Group is organised into an Energy division and three Nortek divisions.
Our Group audit scope focused primarily on audit work at 15 components (2016: 17), of which 4 relate to components which form part of the Energy division, 7 relate to Air Management, 2 relate to Security & Smart Technology and 2 relate to the Ergonomics division. The change in the number of components reflects the reorganisation of the Nortek business since acquisition by Melrose and our risk assessment in the current year.
The extent of our testing was based on our assessment of the risks of material misstatement and on the materiality of the Group’s business operations at these locations. In total our scope represented 77% of Group revenue, 83% of Group operating profit and 95% of Group net assets.
Full audit scope 73%
Specified audit procedures 4%
Review at group level 23%
Revenue
Full audit scope 76%
Specified audit procedures 7%
Review at group level 17%
Operating profit
Full audit scope 95%
Specified audit procedures 0%
Review at group level 5%
Net assets
In 2016 our combined full audit scope and specified audit procedures represented 82% of Group revenue, 86% of Group operating profit and 92% of Group net assets.
Energy divisionIn respect of the Energy division, all 4 components were subject to a full audit (2016: 4). These 4 components accounted for 80% of the Energy division’s revenue and 76% of the Energy division’s underlying operating profit and divisional costs (before central costs). The work performed at these 4 components together with the work performed centrally by the Group audit team accounted for 77% of the Energy division net assets.
Our work at the 4 components forming part of the Energy division was principally performed to levels of materiality applicable to each individual entity which were lower than group materiality and ranged between £0.4 million and £1.1 million.
In 2016, these 4 components accounted for 81% of the revenue and 79% of the underlying operating profit and divisional costs (before central costs) of the Energy division.
Nortek groupFor the Nortek group, 7 components were subject to a full audit (2016: 8 components) and 4 were subject to specified audit procedures (2016: 5 components) on certain balances that represent a risk of material misstatement to the Group financial statements.
These 11 components subject to full audit and specified audit procedures accounted for 76% of revenue and 78% of underlying operating profit and divisional costs (before central costs). The work performed at these components together with the work performed centrally by the Group audit team accounted for 78% of the net assets of the Nortek group at 31 December 2017.
Our work and audit procedures at the Nortek components were performed at levels of materiality which were lower than group materiality, determined by reference to the relative scale of the business concerned, and ranged between £6.25 million and £5 million (2016: between £2.8 million and £3.9 million).
98M
elro
se In
dus
trie
s P
LC
Ann
ual R
epor
t 201
7

Involvement in the work of component auditors and work performed at group levelThe senior statutory auditor or other senior members of the Group audit team visited 7 of the largest components for the audit (2016: 8). The senior statutory auditor also held close meetings which covered all businesses. Where we do not visit a component within our Group audit scope, we include the component audit team in our team briefing, discuss their risk assessment and review documentation of the findings from their work.
At the parent entity level, we also tested the consolidation process and carried out analytical procedures to confirm our conclusion that there were no significant risks of material misstatement of the aggregated financial information of the remaining components not subject to audit or audit of specified account balances. The parent company was audited directly by the group audit team.
Other informationThe directors are responsible for the other information. The other information comprises the information included in the annual report, other than the financial statements and our auditor’s report thereon.
Our opinion on the financial statements does not cover the other information and, except to the extent otherwise explicitly stated in our report, we do not express any form of assurance conclusion thereon.
In connection with our audit of the financial statements, our responsibility is to read the other information and, in doing so, consider whether the other information is materially inconsistent with the financial statements or our knowledge obtained in the audit or otherwise appears to be materially misstated.
If we identify such material inconsistencies or apparent material misstatements, we are required to determine whether there is a material misstatement in the financial statements or a material misstatement of the other information. If, based on the work we have performed, we conclude that there is a material misstatement of this other information, we are required to report that fact.
In this context, matters that we are specifically required to report to you as uncorrected material misstatements of the other information include where we conclude that:
• Fair, balanced and understandable – the statement given by the directors that they consider the annual report and financial statements taken as a whole is fair, balanced and understandable and provides the information necessary for shareholders to assess the group’s position and performance, business model and strategy, is materially inconsistent with our knowledge obtained in the audit; or
• Audit committee reporting – the section describing the work of the audit committee does not appropriately address matters communicated by us to the audit committee; or
• Directors’ statement of compliance with the UK Corporate Governance Code – the parts of the directors’ statement required under the Listing Rules relating to the company’s compliance with the UK Corporate Governance Code containing provisions specified for review by the auditor in accordance with Listing Rule 9.8.10R(2) do not properly disclose a departure from a relevant provision of the UK Corporate Governance Code.
We have nothing to report in respect of these matters.
Responsibilities of directorsAs explained more fully in the directors’ responsibilities statement, the directors are responsible for the preparation of the financial statements and for being satisfied that they give a true and fair view, and for such internal control as the directors determine is necessary to enable the preparation of financial statements that are free from material misstatement, whether due to fraud or error.
In preparing the financial statements, the directors are responsible for assessing the group’s and the parent company’s ability to continue as a going concern, disclosing as applicable, matters related to going concern and using the going concern basis of accounting unless the directors either intend to liquidate the group or the parent company or to cease operations, or have no realistic alternative but to do so.
Auditor’s responsibilities for the audit of the financial statementsOur objectives are to obtain reasonable assurance about whether the financial statements as a whole are free from material misstatement, whether due to fraud or error, and to issue an auditor’s report that includes our opinion. Reasonable assurance is a high level of assurance, but is not a guarantee that an audit conducted in accordance with ISAs (UK) will always detect a material misstatement when it exists. Misstatements can arise from fraud or error and are considered material if, individually or in the aggregate, they could reasonably be expected to influence the economic decisions of users taken on the basis of these financial statements.
A further description of our responsibilities for the audit of the financial statements is located on the Financial Reporting Council’s website at: www.frc.org.uk/auditorsresponsibilities. This description forms part of our auditor’s report.
Use of our reportThis report is made solely to the company’s members, as a body, in accordance with Chapter 3 of Part 16 of the Companies Act 2006. Our audit work has been undertaken so that we might state to the company’s members those matters we are required to state to them in an auditor’s report and for no other purpose. To the fullest extent permitted by law, we do not accept or assume responsibility to anyone other than the company and the company’s members as a body, for our audit work, for this report, or for the opinions we have formed.
Financials
99
Mel
rose
Ind
ustr
ies
PLC
A
nnua
l Rep
ort 2
017

Independent auditor’s report to the members of Melrose Industries PLCContinuedReport on other legal and regulatory requirementsOpinions on other matters prescribed by the Companies Act 2006In our opinion the part of the directors’ remuneration report to be audited has been properly prepared in accordance with the Companies Act 2006.
In our opinion, based on the work undertaken in the course of the audit:
• the information given in the strategic report and the directors’ report for the financial year for which the financial statements are prepared is consistent with the financial statements; and
• the strategic report and the directors’ report have been prepared in accordance with applicable legal requirements.
In the light of the knowledge and understanding of the group and of the parent company and their environment obtained in the course of the audit, we have not identified any material misstatements in the strategic report or the directors’ report.
Matters on which we are required to report by exceptionAdequacy of explanations received and accounting recordsUnder the Companies Act 2006 we are required to report to you if, in our opinion:
• we have not received all the information and explanations we require for our audit; or
• adequate accounting records have not been kept by the parent company, or returns adequate for our audit have not been received from branches not visited by us; or
• the parent company financial statements are not in agreement with the accounting records and returns.
We have nothing to report in respect of these matters.
Directors’ remunerationUnder the Companies Act 2006 we are also required to report if in our opinion certain disclosures of directors’ remuneration have not been made or the part of the directors’ remuneration report to be audited is not in agreement with the accounting records and returns.
We have nothing to report in respect of these matters.
Other mattersAuditor tenureFollowing the recommendation of the audit committee, we were appointed by the Board of Directors in 2003 to audit the financial statements for the year ending 31 December 2003 and subsequent financial periods. Our appointment was subsequently ratified at the annual general meeting of the Company. The period of total uninterrupted engagement including previous renewals and reappointments of the firm is 15 years, covering the years ending 31 December 2003 to 31 December 2017.
Consistency of the audit report with the additional report to the audit committeeOur audit opinion is consistent with the additional report to the audit committee we are required to provide in accordance with ISAs (UK).
Stephen Griggs FCA (Senior statutory auditor) For and on behalf of Deloitte LLP Statutory Auditor London, United Kingdom 20 February 2018
100M
elro
se In
dus
trie
s P
LC
Ann
ual R
epor
t 201
7

Consolidated Income Statement
Continuing operations Notes
Year ended 31 December
2017£m
Year ended31 December
2016£m
Revenue 4, 5 2,092.2 889.3Cost of sales (1,439.4) (626.0)Gross profit 652.8 263.3Net operating expenses 7 (659.7) (324.9)Operating loss (6.9) (61.6)Finance costs 7 (21.5) (9.5)Finance income 7 0.8 1.8Loss before tax (27.6) (69.3)Tax 8 3.7 30.3Loss after tax for the year attributable to owners of the parent (23.9) (39.0)
Earnings per share– Basic 10 (1.2)p (2.6)p– Diluted 10 (1.2)p (2.6)p
Underlying ResultsUnderlying operating profit 5, 6 278.4 104.1Underlying profit before tax 6 257.7 96.4Underlying profit after tax 6 190.9 70.4Underlying basic earnings per share 10 9.9p 4.7pUnderlying diluted earnings per share 10 9.8p 4.4p
Financials
101
Mel
rose
Ind
ustr
ies
PLC
A
nnua
l Rep
ort 2
017

Note
Year ended 31 December
2017£m
Year ended31 December
2016£m
Loss for the year (23.9) (39.0)
Items that will not be reclassified subsequently to the Income Statement:Net remeasurement gain on retirement benefit obligations 22 12.1 22.7Income tax charge relating to items that will not be reclassified (1.1) (3.3)
11.0 19.4Items that may be reclassified subsequently to the Income Statement:Currency translation on net investments (133.3) 104.3Transfer to Income Statement from equity of cumulative translation
differences on disposal of foreign operations (0.5) –Gains on cash flow hedges 8.9 5.3Transfer to Income Statement on cash flow hedges (4.1) 0.3Income tax (charge)/credit relating to items that may be reclassified (0.7) 5.4
(129.7) 115.3Other comprehensive (expense)/income after tax (118.7) 134.7Total comprehensive (expense)/income for the year attributable to owners of the parent (142.6) 95.7
Consolidated Statement of Comprehensive Income102M
elro
se In
dus
trie
s P
LC
Ann
ual R
epor
t 201
7

Consolidated Statement of Cash Flows
Continuing operations Notes
Year ended31 December
2017£m
Year ended31 December
2016£m
Net cash from operating activities 25 32.4 50.6Investing activitiesDisposal of businesses 10.8 –Disposal costs (0.2) (0.1)Net cash disposed (1.4) –Purchase of property, plant and equipment (47.7) (16.8)Proceeds from disposal of property, plant and equipment 2.1 0.3Purchase of computer software and capitalised development costs (3.2) (0.6)Dividends received from joint ventures 13 0.6 0.9Acquisition of subsidiaries (9.2) (1,130.0)Cash acquired on acquisition of subsidiaries 11 – 9.4Interest received 0.8 1.8Net cash used in investing activities (47.4) (1,135.1)Financing activitiesReturn of Capital – (2,388.5)Net proceeds from Rights Issue – 1,612.0Repayment of borrowings – (1,092.4)New bank loans raised 56.0 557.4Costs of raising debt finance – (10.9)Repayment of finance leases (1.0) –Dividends paid 9 (63.0) (5.8)Net cash used in financing activities (8.0) (1,328.2)Net decrease in cash and cash equivalents (23.0) (2,412.7)Cash and cash equivalents at the beginning of the year 25 42.1 2,451.4Effect of foreign exchange rate changes 25 (2.8) 3.4Cash and cash equivalents at the end of the year 16, 25 16.3 42.1
As at 31 December 2017, the Group had net debt of £571.8 million (31 December 2016: £541.5 million). A reconciliation of the movement in net debt is shown in note 25.
Financials
103
Mel
rose
Ind
ustr
ies
PLC
A
nnua
l Rep
ort 2
017

Notes
31 December 2017
£m
Restated (1)
31 December 2016
£m
Non-current assetsGoodwill and other intangible assets 11 2,237.6 2,609.3Property, plant and equipment 12 218.9 271.9Interests in joint ventures 13 0.4 –Deferred tax assets 20 49.3 49.6Derivative financial assets 23 4.1 5.2Trade and other receivables 15 1.9 5.2
2,512.2 2,941.2Current assetsInventories 14 275.4 296.1Trade and other receivables 15 332.0 365.8Derivative financial assets 23 9.9 3.8Cash and cash equivalents 16 16.3 42.1
633.6 707.8Total assets 5 3,145.8 3,649.0Current liabilitiesTrade and other payables 17 366.5 428.2Interest-bearing loans and borrowings 18 0.4 0.5Derivative financial liabilities 23 1.3 4.2Current tax liabilities 6.4 10.2Provisions 19 92.2 140.5
466.8 583.6Net current assets 166.8 124.2Non-current liabilitiesTrade and other payables 17 1.8 13.7Interest-bearing loans and borrowings 18 587.7 583.1Deferred tax liabilities 20 69.1 129.9Retirement benefit obligations 22 17.6 33.4Provisions 19 117.6 142.5
793.8 902.6Total liabilities 5 1,260.6 1,486.2Net assets 1,885.2 2,162.8EquityIssued share capital 24 133.1 129.4Share premium account 1,492.6 1,492.6Merger reserve 108.7 112.4Other reserves (2,329.9) (2,329.9)Hedging reserve 8.6 4.5Translation reserve (66.0) 67.8Retained earnings 2,538.1 2,686.0Total equity attributable to owners of the parent 1,885.2 2,162.8
(1) Restated to reflect the completion of the acquisition accounting for Nortek (note 11).
The financial statements were approved and authorised for issue by the Board of Directors on 20 February 2018 and were signed on its behalf by:
Geoffrey Martin Simon PeckhamGroup Finance Director Chief Executive20 February 2018 20 February 2018
Consolidated Balance Sheet104M
elro
se In
dus
trie
s P
LC
Ann
ual R
epor
t 201
7

Consolidated Statement of Changes in Equity
Issuedshare
capital£m
Sharepremium account
£m
Merger reserve
£m
Other reserves
£m
Hedgingreserve
£m
Translation reserve
£m
Retained earnings
£m
Total equity attributable to owners of the
parent£m
At 1 January 2016 10.0 – 2,500.9 (2,329.9) – (37.8) 2,702.2 2,845.4Loss for the year – – – – – – (39.0) (39.0)Other comprehensive income – – – – 4.5 105.6 24.6 134.7
Total comprehensive income/(expense) – – – – 4.5 105.6 (14.4) 95.7
Return of Capital – – (2,388.5) – – – – (2,388.5)Issue of new shares 119.4 1,492.6 – – – – – 1,612.0Dividends paid – – – – – – (5.8) (5.8)Credit to equity for equity-settled
share-based payments – – – – – – 4.0 4.0At 31 December 2016 129.4 1,492.6 112.4 (2,329.9) 4.5 67.8 2,686.0 2,162.8Loss for the year – – – – – – (23.9) (23.9)Other comprehensive income/(expense) – – – – 4.1 (133.8) 11.0 (118.7)
Total comprehensive income/(expense) – – – – 4.1 (133.8) (12.9) (142.6)
Dividends paid – – – – – – (63.0) (63.0)Credit to equity for equity-settled
share-based payments – – – – – – 10.1 10.1Deferred tax on share-based payment transactions – – – – – – 33.4 33.4Incentive scheme related (1) 3.7 – (3.7) – – – (115.5) (115.5)At 31 December 2017 133.1 1,492.6 108.7 (2,329.9) 8.6 (66.0) 2,538.1 1,885.2
(1) On 31 May 2017, the Melrose 2012 Incentive Plan crystallised. Of the 50,000 options in issue, 23,494 were withheld by the Company in exchange for a cash payment sufficient to allow holders to meet their income tax and employee national insurance liabilities in respect of the Incentive Plan. This resulted in 23,494 options being exercised for £115.5 million in cash and being paid to the tax authorities on behalf of the option holders. The remaining 26,506 options were converted into 54,453,914 ordinary shares of 48/7 pence each and resulted in a £3.7 million increase to Issued share capital and an equivalent reduction to the Merger reserve.
Financials
105
Mel
rose
Ind
ustr
ies
PLC
A
nnua
l Rep
ort 2
017

1. Corporate informationMelrose Industries PLC (the Company) is a company incorporated in the United Kingdom under the Companies Act 2006. The address of the registered office is given on the back cover. The nature of the Group’s operations and its principal activities are set out in note 5 and in the Divisional review section on pages 22 to 31.
The consolidated financial statements of the Group for the year ended 31 December 2017 were authorised in accordance with a resolution of the Directors of Melrose Industries PLC on 20 February 2018.
These financial statements are presented in pounds Sterling which is the currency of the primary economic environment in which the Company is based. Foreign operations are included in accordance with the policies set out in note 2.
On 31 August 2016 the Group acquired 100 per cent of the issued share capital and obtained control of Nortek Inc. (Nortek) for cash consideration of £1,093.1 million (note 11).
In the year to 31 December 2016, the results of Nortek are included in the consolidated financial statements of the Group for the four month period from the date of acquisition.
The Balance Sheet at 31 December 2016, shown in these consolidated financial statements, has been restated to reflect the completion of the acquisition accounting for Nortek (note 11).
On 10 August 2017 the disposal of the Best EMEA operations, previously reported within the Air Management segment, to Electrolux A.G. was completed. The assets and liabilities related to these operations were classified as held for sale as at 30 June 2017.
1.1 New Standards and Interpretations affecting amounts, presentation or disclosure reported in the current year In the current financial year, the Group has adopted a number of new or revised Standards and Interpretations, none of which significantly affected the amounts reported in these financial statements. Details of the Standards and Interpretations that were adopted are set out in section 1.2.
1.2 New Standards and Interpretations adopted with no significant effect on financial statementsThe following new and revised Standards and Interpretations have been adopted in the current year. Their adoption has not had any significant impact on the amounts reported in these financial statements, but may impact the accounting for future transactions and arrangements:
• Annual improvements to IFRSs: 2014-16 cycle
• Amendments to IAS 7: Disclosure initiative
• Amendments to IAS 12: Recognition of deferred tax assets for unrealised losses
1.3 New Standards and Interpretations in issue but not yet effectiveAt the date of authorisation of these financial statements, the following Standards and Interpretations are in issue but not yet effective (and in some cases have not been adopted by the EU):
• IFRS 9: Financial instruments
• IFRS 15: Revenue from contracts with customers (and related clarifications)
• IFRS 16: Leases
• Amendments to IFRS 2: Classification and measurement of share-based payment transactions
• Amendments to IFRS 9: Prepayment features with negative compensation
• Amendments to IFRS 10 and IAS 28: Sale or contribution of assets between an investor and its associate or joint venture
• Amendments to IAS 28: Long-term interests in associates and joint ventures
• IFRIC 22: Foreign currency transactions and advance consideration
• IFRIC 23: Uncertainty over income tax treatments
The Directors do not expect that the adoption of the Standards listed above will have a material impact on the financial statements of the Group in future periods, except that IFRS 16 will impact the recognition of leases. A detailed review of the impact of IFRS 9 and IFRS 15 has been completed and it is not anticipated that the application of either standard will have a material impact on the financial statements of the Group in future periods.
IFRS 9 is effective from 1 January 2018. It includes amendments to classification and measurement of financial instruments, which include providing a new model for expected future credit losses and impairment. The Group does not expect that the adoption of IFRS 9 will have a material impact on the financial statements but it will impact both the measurement and disclosure of financial instruments. IFRS 9 does not require restatement of prior periods and therefore any difference between the new carrying amount under IFRS 9 and the previous carrying amount on the date of initial application will be recognised as a change to equity.
IFRS 15 is effective from 1 January 2018. It provides a single, principles-based, five-step model to be applied to all sales contracts, based on the transfer of control of goods and services to customers. It replaces the separate model for goods and services of IAS 18 “Revenue”. The Directors do not consider the impact of IFRS 15 to be significant on the sale of goods where revenue is currently recognised on either dispatch or delivery dependent on the specific circumstances. The supply of goods and services under more complicated contractual arrangements will involve the application of judgement when recognising revenue, however, the year-on-year impact on profit is not considered to be significant and therefore the adoption of this standard is not expected to have a material impact on the financial statements of the Group in future periods. IFRS 15 will be adopted via the cumulative effect method, therefore comparative information will not be restated.
Notes to the financial statements106M
elro
se In
dus
trie
s P
LC
Ann
ual R
epor
t 201
7

1. Corporate information continuedIFRS 16 is effective from 1 January 2019. It will require all leases to be recognised on the Balance Sheet. Currently, IAS 17: “Leases” only requires those categorised as finance leases to be recognised on the Balance Sheet, with leases categorised as operating leases not recognised and expensed through the Income Statement instead. The impact of IFRS 16 will be to recognise a lease liability and a corresponding asset in the Balance Sheet for leases currently classified as operating leases. The Directors are continuing to evaluate the full impact of the adoption of this standard and it is not practicable to provide a reasonable estimate of the effect of IFRS 16 until a detailed review has been completed, which is planned to be undertaken in the next 12 months. IFRS 16 will be adopted via a modified retrospective approach and it is anticipated that right of use assets recognised on transition will be measured at an amount equal to the lease liability.
2. Summary of significant accounting policiesBasis of accountingThe consolidated financial statements have been prepared in accordance with International Financial Reporting Standards (IFRSs). The consolidated financial statements have also been prepared in accordance with IFRSs adopted for use in the European Union and therefore comply with Article 4 of the EU IAS Regulation.
The consolidated financial statements have been prepared on an historical cost basis, except for the revaluation of certain financial instruments which are recognised at fair value at the end of each reporting period. Historical cost is generally based on the fair value of the consideration given in exchange for assets. The principal accounting policies adopted are consistent with the prior year and are set out below.
Alternative Performance MeasuresThe Group presents Alternative Performance Measures (APMs) in addition to the unadjusted statutory results of the Group. These are presented in accordance with the Guidelines on APMs issued by the European Securities and Markets Authority (ESMA).
To provide more clarity and in response to increased guidance, the APMs used by the Group are set out in the glossary to these Financial Statements on pages 152 to 155 and the reconciling items between statutory and underlying results are listed below and described in more detail in note 6 to the financial statements.
Underlying profit/(loss) excludes items which are significant in size or volatility or by nature are non-trading or non-recurring, and excludes any item released to the Income Statement that was previously a fair value item booked on acquisition.
On this basis, the following items were included within adjusted items for the year ended 31 December 2017:
• Impairment charges that are considered to be significant in nature and/or value to the trading performance of the business.
• Amortisation of intangible assets that are acquired in a business combination.
• Significant restructuring costs and other associated costs arising from significant strategy changes that are not considered by the Group to be part of the normal operating costs of the business.
• Acquisition and disposal costs.
• The charge for the equity-settled Melrose Incentive Plan, including its associated employer’s tax charge.
• The release of fair value items booked on acquisitions.
• The net impact arising from the new US tax legislation with the US Federal tax rate moving from 35% to 21%.
The Board consider the underlying results to be a key measure to monitor how the businesses are performing because this provides a more meaningful comparison of how the business is managed and measured on a day-to-day basis and achieves consistency and comparability between reporting periods.
The underlying measures are used to partly determine the variable element of remuneration of senior management throughout the Group and are also in alignment with performance measures used by certain external stakeholders. The underlying measures are also one measure used to value individual businesses as part of the “Buy, Improve and Sell” Melrose strategy model.
Underlying profit is not a defined term under IFRS and may not be comparable with similarly titled profit measures reported by other companies. It is not intended to be a substitute for, or superior to, GAAP measures. All APMs relate to the current year results and comparative periods where provided.
Basis of consolidationThe Group financial statements include the results of the parent undertaking and all of its subsidiary undertakings. The results of businesses acquired during the period are included from the effective date of acquisition and, for those sold during the period, to the effective date of disposal. Where necessary, adjustments are made to the financial statements of subsidiaries to bring the accounting policies used into line with those used by the Group.
All intra-Group balances and transactions, including unrealised profits arising from intra-Group transactions, have been eliminated in full.
Non-controlling interests in subsidiaries are identified separately from the Group’s equity therein. The interest of non-controlling shareholders is initially measured at the non-controlling interests’ proportion of the share of the fair value of the acquiree’s identifiable net assets. Subsequent to acquisition, the carrying amount of non-controlling interests is the amount of those interests at initial recognition plus the non-controlling interests’ share of subsequent changes in equity. Total comprehensive income is attributed to non-controlling interests even if this results in the non-controlling interests having a deficit balance.
Financials
107
Mel
rose
Ind
ustr
ies
PLC
A
nnua
l Rep
ort 2
017

2. Summary of significant accounting policies continuedGoing concernThe Directors have, at the time of approving the financial statements, a reasonable expectation that the Company and the Group have adequate resources to continue in operational existence for the foreseeable future. Thus they continue to adopt the going concern basis of accounting in preparing the financial statements. Further detail is contained on page 40 of the Finance Director’s review.
Business combinations and goodwillThe acquisition of subsidiaries is accounted for using the acquisition method. The cost of acquisition is measured at the fair value of assets transferred, the liabilities incurred or assumed at the date of exchange of control and equity instruments issued by the Group in exchange for control of the acquiree. Control is achieved where the Company has the power to govern the financial and operating policies of an investee entity so as to obtain benefits from its activities. Costs directly attributable to business combinations are recognised as an expense in the Income Statement as incurred.
The acquired identifiable assets and liabilities are measured at their fair value at the date of acquisition except those where specific guidance is provided by IFRSs. Non-current assets and directly attributable liabilities that are classified as held for sale in accordance with IFRS 5: “Non-current assets held for sale and discontinued operations”, are recognised and measured at fair value less costs to sell. Also, deferred tax assets and liabilities are recognised and measured in accordance with IAS 12: “Income taxes”, liabilities and assets related to employee benefit arrangements are recognised and measured in accordance with IAS 19 (revised): “Employee benefits” and liabilities or equity instruments related to the replacement by the Group of an acquiree’s share-based payments awards are measured in accordance with IFRS 2: “Share-based payment”. Any excess of the cost of the acquisition over the fair values of the identifiable net assets acquired is recognised as goodwill.
If the initial accounting for a business combination is incomplete by the end of the reporting period in which the combination occurs, the Group reports provisional amounts where appropriate. Those provisional amounts are adjusted during the measurement period, or additional assets or liabilities recognised, to reflect new information obtained about facts and circumstances that existed as of the acquisition date that, if known, would have affected the amounts recognised at that date.
The measurement period is the period from the date of acquisition to the date the Group obtains complete information about facts and circumstances that existed as of the acquisition date and is subject to a maximum period of one year.
Goodwill on acquisition is initially measured at cost, being the excess of the sum of the consideration transferred, the amount of any non-controlling interest in the acquiree and the fair value of the acquirer’s previously held equity interest in the acquiree over the acquirer’s interest in the net fair value of the identifiable assets, liabilities and contingent liabilities. Following initial recognition, goodwill is measured at cost less any accumulated impairment losses. Goodwill is reviewed for impairment annually or more frequently if events or changes in circumstances indicate that the carrying value may be impaired.
If, after reassessment, the Group’s interest in the fair value of the acquiree’s identifiable net assets exceeds the sum of the consideration transferred, the amount of any non-controlling interest in the acquiree and the fair value of the acquirer’s previously held equity interest in the acquiree, the excess is recognised immediately in profit or loss as a bargain purchase gain.
As at the acquisition date, any goodwill acquired is allocated to the cash-generating units acquired. Impairment is determined by assessing the recoverable amount of the cash-generating unit to which goodwill relates. Where the recoverable amount of the cash-generating unit is less than the carrying amount, an impairment loss is recognised in the Income Statement and is not subsequently reversed. When there is a disposal of a cash-generating unit, goodwill relating to the operation disposed of is taken into account in determining the gain or loss on disposal of that operation. The amount of goodwill allocated to a partial disposal is measured on the basis of the relative values of the operation disposed of and the operation retained.
Joint venturesA joint venture is an entity which is not a subsidiary undertaking but the interest of the Group is that of a partner in a business over which the Group exercises joint control. The results, assets and liabilities of joint ventures are accounted for using the equity method of accounting.
RevenueRevenue is measured at the fair value of the consideration received or receivable and represents amounts receivable for goods and services provided in the normal course of business, net of discounts, customs duties and sales related taxes. Revenue is reduced for estimated customer returns, rebates and other similar allowances. The nature of agreements into which the Group enters means that:
• Certain of the Group’s arrangements with its customers are multiple element arrangements that can include any combination of products and services such as extended warranties, installation and start up testing as deliverables. With the exception of certain extended warranty arrangements, substantially all of the deliverables within the Group’s multiple-element arrangements are delivered within a one year period. Revenue for any undelivered elements are deferred until delivery occurs. The Group allocates revenue to multiple-element arrangements based on the relative fair value of each element’s estimated selling price.
• The service element of the contract is usually insignificant in relation to the total contract value and is often provided on a short-term or one-off basis. Where this is the case, revenue is recognised when the service is complete.
• Aftermarket activities generally relate to the provision of spare parts, repairs and the rebuild of equipment. Revenue on the provision of parts is recognised in accordance with the policy on the sale of goods and revenue for repairs and rebuild is recognised upon completion of the activity.
Notes to the financial statementsContinued
108M
elro
se In
dus
trie
s P
LC
Ann
ual R
epor
t 201
7

2. Summary of significant accounting policies continuedCash discounts, volume rebates and other customer incentive programmes are based upon certain percentages agreed upon with the Group’s various customers, which are typically earned by the customer over an annual period. The Group records periodic estimates for these amounts based upon the historical results to date, estimated future results through the end of the contract period, and the contractual provisions of the customer agreements. These are recorded at the later of the date at which the revenues are recognised or the incentive is offered and are generally recorded as a reduction in sales at the time of sale based upon the estimated future outcome.
The significant majority of the Group’s revenue is recognised on a sale of goods basis.
The specific methods used to recognise the different forms of revenue earned by the Group are as follows:
Sale of goodsRevenue is recognised when all of the following conditions are satisfied:
• the Group has transferred to the buyer the significant risks and rewards of ownership of the goods;
• the Group retains neither continuing managerial involvement to the degree usually associated with ownership nor effective control over the goods;
• the amount of revenue can be measured reliably;
• it is probable that the economic benefits associated with the transaction will flow to the Group; and
• the costs incurred or to be incurred in respect of the transaction can be measured reliably.
Transfers of risks and rewards vary depending on the nature of the products sold and the individual terms of the contract of sale. Sales made under internationally accepted trade terms are recognised as revenue when the Group has completed the primary duties required to transfer risks as stipulated in those terms. Sales made outside of such terms are generally recognised on delivery to the customer. No revenue is recognised where recovery of the consideration is not probable or there are significant uncertainties regarding associated costs or the possible return of goods.
Provision of servicesAs noted above, because revenue from the rendering of services is usually not significant in relation to the total contract value and is generally provided on a short-term or one-off basis, revenue is usually recognised when the service is complete.
Construction contracts Revenue from significant contracts, without discrete elements, is recognised in proportion to the stage of completion of the contract by reference to the specific contract terms and the costs incurred on the contract at the Balance Sheet date in comparison to the total forecast costs of the contract. This is normally measured by the proportion that contract costs incurred for work performed to date bear to the estimated total contract costs, except where this would not be representative of the stage of completion.
Variations in contract work, claims and incentive payments are included in revenue from construction contracts when the amount can be measured reliably and its receipt is considered probable. Variations are included when the customer has agreed to the variation or acknowledged liability for the variation in principle. Claims are included when negotiations with the customer have reached an advanced stage such that it is probable that the customer will accept the claim. Incentive payments are included when a contract is sufficiently advanced that it is probable that the performance standards triggering the incentive will be achieved.
Profit attributable to contract activity is recognised if the final outcome of such contracts can be reliably assessed. Where this is not the case contract revenue is recognised to the extent of contract costs incurred where it is probable they will be recovered. When it is probable that total contract costs will exceed total contract revenue, the expected loss is recognised as an expense immediately.
Interest incomeInterest income is recognised when it is probable that the economic benefits will flow to the Group and the amount of revenue can be measured reliably. Interest income is accrued on a time basis, by reference to the principal outstanding and the effective interest rate applicable.
Operating profitOperating profit is stated after the share of profit after tax of joint ventures and associates, and before finance costs.
EBITDAEBITDA is operating profit from continuing operations, before depreciation and impairment of property, plant and equipment and before amortisation and impairment of intangible assets acquired in business combinations, computer software and development costs.
Borrowing costsBorrowing costs directly attributable to the acquisition, construction or production of qualifying assets, which are assets that necessarily take a substantial period of time to get ready for their intended use or sale, are added to the cost of those assets, until such time as the assets are substantially ready for their intended use or sale.
Investment income earned on the temporary investment of specific borrowings pending their expenditure on qualifying assets is deducted from the borrowing costs eligible for capitalisation.
All other borrowing costs are recognised in the Income Statement in the period in which they are incurred.
Issue costs of loansThe finance cost recognised in the Income Statement in respect of the issue costs of borrowings is allocated to periods over the terms of the instrument using the effective interest rate method.
Financials
109
Mel
rose
Ind
ustr
ies
PLC
A
nnua
l Rep
ort 2
017

2. Summary of significant accounting policies continuedProperty, plant and equipmentProperty, plant and equipment are stated at cost less accumulated depreciation and any impairment in value.
The initial cost of an asset comprises its purchase price or construction cost, and any costs directly attributable to bring the asset into operation. The purchase price or construction cost is the aggregate amount paid and the fair value of any other consideration given to acquire the asset.
Depreciation is calculated on a straight-line basis over the estimated useful life of the asset as follows:
Freehold land nil Freehold buildings and long leasehold property over expected economic life not exceeding 50 yearsShort leasehold property over the term of the leasePlant and equipment 3-12 years
The estimated useful lives of property, plant and equipment are reviewed on an annual basis and, if necessary, changes in useful lives are accounted for prospectively.
The carrying values of property, plant and equipment are reviewed for impairment when events or changes in circumstances indicate that the carrying value may not be recoverable. If any such indication exists an impairment review is performed and, where the carrying values exceed the estimated recoverable amount, the assets are written down to their recoverable amount. The recoverable amount of property, plant and equipment is the greater of net selling price and value in use. In assessing value in use, the estimated future cash flows are discounted to their present value using a pre-tax discount rate that reflects current market assessments of the time value of money and the risks specific to the asset. For an asset that does not generate largely independent cash inflows, the recoverable amount is determined for the cash-generating unit to which the asset belongs.
An item of property, plant and equipment is derecognised upon disposal or when no future economic benefits are expected to arise from the continued use of the asset. Any gain or loss arising on derecognition of the asset (calculated as the difference between the net disposal proceeds or costs and the carrying amount of the item) is included in the Income Statement in the year that the item is derecognised.
Intangible assetsIntangible assets are stated at cost less accumulated amortisation and accumulated impairment losses.
On acquisition of businesses, separately identifiable intangible assets are initially recorded at their fair value at the acquisition date.
Access to the use of brands and intellectual property are valued using a “relief from royalty” method which determines the net present value of future additional cash flows arising from the use of the intangible asset.
Customer relationships are valued on the basis of the net present value of the future additional cash flows arising from customer relationships with appropriate allowance for attrition of customers.
Technology assets are valued using a replacement cost approach.
Amortisation of intangible assets is recorded in administration expenses in the Income Statement and is calculated on a straight-line basis over the estimated useful lives of the asset as follows:
Customer relationships 20 years or lessBrands and intellectual property 20 years or lessTechnology 5 years or lessOrder backlog 1 year or lessComputer software 5 years or lessDevelopment costs 5 years or less
Computer software is initially recorded at cost. Where these assets have been acquired through a business combination, this will be the fair value allocated in the acquisition accounting. Where these have been acquired other than through a business combination, the initial cost is the aggregate amount paid and the fair value of any other consideration given to acquire the asset.
Intangible assets (other than computer software and development costs) are tested for impairment annually or more frequently whenever events or changes in circumstances indicate that the carrying value may not be recoverable. Impairment losses are measured on a similar basis to property, plant and equipment. Useful lives are also examined on an annual basis and adjustments, where applicable, are made on a prospective basis.
Research and development costsResearch costs are expensed as incurred.
Costs relating to clearly defined and identifiable development projects are capitalised when there is a technical degree of exploitation, adequacy of resources and a potential market or development possibility in the undertaking that are recognisable; and where it is the intention to produce, market or execute the project. A correlation must also exist between the costs incurred and future benefits and those costs can be measured reliably. Capitalised costs are expensed on a straight-line basis over their useful lives of five years or less. Costs not meeting such criteria are expensed as incurred.
Notes to the financial statementsContinued
110M
elro
se In
dus
trie
s P
LC
Ann
ual R
epor
t 201
7

2. Summary of significant accounting policies continuedInventoriesInventories are valued at the lower of cost and net realisable value and measured using a first in, first out basis. Cost includes all direct expenditure and appropriate production overhead expenditure incurred in bringing goods to their current state under normal operating conditions. Net realisable value is based on estimated selling price less costs expected to be incurred to completion and disposal. Provisions are made for obsolescence or other expected losses where necessary.
Trade and other receivablesTrade receivables and other receivables are measured and carried at amortised cost using the effective interest method, less any impairment. The carrying amount of other receivables is reduced by the impairment loss directly and a charge is recorded in the Income Statement. For trade receivables, the carrying amount is reduced through the use of an allowance account. Subsequent recoveries of amounts previously written off are credited against the allowance account and changes in the carrying amount of the allowance account are recognised in the Income Statement.
Trade receivables that are assessed not to be impaired individually are also assessed for impairment on a collective basis. Objective evidence of impairment for a portfolio of receivables could include the Group’s past experience of collecting receipts, an increase in the number of delayed receipts in the portfolio past the average credit period, as well as observable changes in national or local economic conditions that correlate with default on receivables.
Cash and cash equivalentsCash and cash equivalents in the Balance Sheet comprise cash in hand, current balances with banks and similar institutions and short-term deposits which are readily convertible to cash which are subject to insignificant risks of changes in value.
For the purpose of the Consolidated Cash Flow Statement, cash and cash equivalents consist of cash and cash equivalents as defined above, net of outstanding bank overdrafts.
Interest-bearing loans and borrowingsAll loans and borrowings are initially recognised at fair value of the consideration received net of issue costs associated with the borrowings.
After initial recognition, interest-bearing loans and borrowings are subsequently measured at amortised cost using the effective interest method. Amortised cost is calculated by taking into account any issue costs, and any discount or premium on settlement.
Gains and losses are recognised in the Income Statement when the liabilities are derecognised or impaired, as well as through the amortisation process.
LeasesFinance leases, which transfer to the Group substantially all the risks and benefits incidental to ownership of the leased item, are capitalised at the inception of the lease at the fair value of the lease or, if lower, at the present value of the minimum lease payments. The corresponding liability to the lessor is included in the Balance Sheet as a finance lease obligation. Lease payments are apportioned between the finance charges and reduction of the lease liability so as to achieve a constant rate of interest on the remaining balance of the liability.
Finance charges are charged directly against income. Capitalised leased assets are depreciated over the shorter of the estimated useful life of the asset or the lease term.
Operating lease payments are recognised as an expense in the Income Statement on a straight-line basis over the lease term. Rental income from operating leases is recognised on a straight-line basis over the term of the relevant lease.
Net DebtNet debt includes interest-bearing loans, finance leases and cash and cash equivalents.
Other financial liabilities Other financial liabilities are initially measured at fair value, net of transaction costs. Other financial liabilities are subsequently measured at amortised cost using the effective interest method, with interest expense recognised on an effective yield basis. The effective interest method is a method of calculating the amortised cost of a financial liability and of allocating interest expense over the relevant periods. The effective interest rate is the rate that discounts estimated future cash payments throughout the expected life of the financial liability, or, where appropriate, a shorter period to the net carrying amount on initial recognition. The Group derecognises financial liabilities when the Group’s obligations are discharged, cancelled or they expire.
Derivative financial instruments and hedgingThe Group uses derivative financial instruments to manage its exposure to interest rate, foreign exchange rate and commodity risks, arising from operating and financing activities. The Group does not hold or issue derivative financial instruments for trading purposes. Details of derivative financial instruments are disclosed in note 23 of the financial statements.
Derivative financial instruments are recognised and stated at fair value. Their fair value is recalculated at each reporting date. The accounting treatment for the resulting gain or loss will depend on whether the derivative meets the criteria to qualify for hedge accounting.
Where derivatives do not meet the criteria to qualify for hedge accounting, any gains or losses on the revaluation to fair value at the period end are recognised immediately in the Income Statement. Where derivatives do meet the criteria to qualify for hedge accounting, recognition of any resulting gain or loss on revaluation depends on the nature of the hedge relationship and the item being hedged.
Derivative financial instruments with maturity dates of less than one year from the period end date are classified as current in the Balance Sheet.
Financials
111
Mel
rose
Ind
ustr
ies
PLC
A
nnua
l Rep
ort 2
017

2. Summary of significant accounting policies continuedHedge accountingIn order to qualify for hedge accounting, the Group is required to document from inception the relationship between the item being hedged and the hedging instrument and to show that the hedge will be highly effective on an ongoing basis. This effectiveness testing is performed at each period end to ensure that the hedge remains highly effective.
Hedge accounting is discontinued when the Group revokes the hedging relationship, the hedge instrument expires or is sold, terminated, exercised, or no longer qualifies for hedge accounting.
The Group designates certain hedging instruments as either fair value hedges, cash flow hedges or hedges of net investments in foreign operations.
Fair value hedgeDerivative financial instruments are classified as fair value hedges when they hedge the Group’s exposure to changes in the fair value of a recognised asset or liability. Changes in the fair value of derivatives that are designated and qualify as fair value hedges are recorded in the Income Statement immediately, together with any changes in the fair value of the hedged item that is attributable to the hedged risk.
Cash flow hedgeDerivative financial instruments are classified as cash flow hedges when they hedge the Group’s exposure to the variability in cash flows that are either attributable to a particular risk associated with a recognised asset or liability, or a highly probable forecasted cash flow.
The effective portion of any gain or loss from revaluing the derivative financial instrument is recognised in the Statement of Comprehensive Income and accumulated in equity. The gain or loss relating to the ineffective portion is recognised immediately in the Income Statement.
Amounts previously recognised in the Statement of Comprehensive Income and accumulated in equity are recycled to the Income Statement in the periods when the hedged item is recognised in the Income Statement or when the forecast transaction is no longer expected to occur. However, when the forecast transaction that is hedged results in the recognition of a non-financial asset or a non-financial liability, the gains and losses previously deferred in equity are transferred from equity and included in the initial measurement of the cost of the non-financial asset or non-financial liability.
Hedges of net investments in foreign operationsDerivative financial instruments are classified as net investment hedges when they hedge the Group’s net investment in foreign operations. The effective element of any foreign exchange gain or loss from revaluing the derivative at a reporting period end is recognised in the Statement of Comprehensive Income. Any ineffective element is recognised immediately in the Income Statement.
Gains and losses accumulated in equity are recognised immediately in the Income Statement when the foreign operation is disposed of or when the hedge is no longer expected to occur.
ProvisionsProvisions are recognised when the Group has a present obligation (legal or constructive) as a result of a past event, it is probable that an outflow of resources embodying economic benefits will be required to settle the obligation and a reliable estimate can be made of the amount of the obligation. If the effect of the time value of money is material, provisions are determined by discounting the expected future cash flows at a rate that reflects the current market assessment of the time value of money and, where appropriate, the risks specific to the liability. Where discounting is used, the increase in the provision due to the passage of time is recognised as a finance cost.
RestructuringA restructuring provision is recognised when the Group has developed a detailed formal plan for the restructuring and has raised a valid expectation in those affected that it will carry out the restructuring by either starting to implement the plan or by announcing its main features to those affected by it. The measurement of a restructuring provision includes only the direct expenditures arising from the restructuring, which are those amounts that are both necessarily entailed by the restructuring and not associated with the ongoing activities of the entity.
WarrantiesProvisions for the expected cost of warranty obligations under local sale of goods legislation are recognised at the date of sale of the relevant products and subsequently updated for changes in estimates as necessary. The Directors’ best estimate of the expenditure required to settle the Group’s obligation is used to determine the amount of the provision.
Onerous contractsPresent obligations arising under onerous contracts are recognised and measured as provisions. An onerous contract is considered to exist where the Group has a contract under which the unavoidable costs of meeting the obligations under the contract exceed the economic benefits expected to be received under it.
Environmental liabilitiesLiabilities for environmental costs are recognised when environmental assessments or clean-ups are probable and the associated costs can be reasonably estimated. Generally, the timing of these provisions coincides with the commitment to a formal plan of action. The amount recognised is the best estimate of the expenditure required. Where the liability will not be settled for a number of years, the amount recognised is the present value of the estimated future expenditure.
Employee related Liabilities for health and workers compensation expenses are provided for based on the total liabilities that are able to be estimated and are probable as of the balance sheet date. These liabilities include an estimate of claims incurred but not yet reported and are based on actuarial valuations using claim data.
Notes to the financial statementsContinued
112M
elro
se In
dus
trie
s P
LC
Ann
ual R
epor
t 201
7

2. Summary of significant accounting policies continuedProduct liability Provisions are recorded for product and general liability claims which are probable and for which the cost can be reliably estimated. These liabilities include an estimate of claims incurred but not yet reported and are based on actuarial valuations using claim data.
Contingent liabilities acquired in a business combinationContingent liabilities acquired in a business combination are initially measured at fair value at the acquisition date. At the end of subsequent reporting periods, such contingent liabilities are measured at the higher of the amount that would be recognised in accordance with IAS 37: “Provisions, contingent liabilities and contingent assets” and the amount initially recognised less cumulative amortisation recognised in accordance with IAS 18: “Revenue”.
Pensions and other retirement benefitsThe Group operates defined benefit pension plans and defined contribution plans, some of which require contributions to be made to administered funds separate from the Group.
For the defined benefit pension and retirement benefit plans, plan assets are measured at fair value and plan liabilities are measured on an actuarial basis and discounted at an interest rate equivalent to the current rate of return on a high quality corporate bond of equivalent currency and term to the plan liabilities. Any assets resulting from this calculation are limited to past service cost plus the present value of available refunds and reductions in future contributions to the plan. The present value of the defined benefit obligation, and the related current service cost and past service cost, are measured using the projected unit credit method.
The service cost of providing pension and other retirement benefits to employees for the period is charged to the Income Statement.
Net interest expense on net defined benefit obligations is determined by applying discount rates used to measure defined benefit obligations at the beginning of the year to net defined benefit obligations at the beginning of the year. Net interest expense is recognised within finance costs.
Remeasurement gains and losses comprise actuarial gains and losses, the effect of the asset ceiling (if applicable) and the return on plan assets (excluding interest). Remeasurement gains and losses, and taxation thereon, are recognised in full in the Statement of Comprehensive Income in the period in which they occur and are not subsequently recycled.
Actuarial gains and losses may result from differences between the actuarial assumptions underlying the plan obligations and actual experience during the period or changes in the actuarial assumptions used in the valuation of the plan obligations.
For defined contribution plans, contributions payable are charged to the Income Statement as an operating expense when employees have rendered services entitling them to the contributions.
Foreign currenciesThe individual financial statements of each Group company are presented in the currency of the primary economic environment in which it operates (its functional currency). For the purpose of the consolidated financial statements, the results and financial position of each Group company are expressed in pounds Sterling, which is the functional currency of the Company, and the presentation currency for the consolidated financial statements.
In preparing the financial statements of the individual companies, transactions in currencies other than the entity’s functional currency (foreign currencies) are recorded at the rates of exchange prevailing on the dates of the transactions. At each Balance Sheet date, monetary assets and liabilities that are denominated in foreign currencies are retranslated at the rates prevailing on the Balance Sheet date. Non-monetary items carried at fair value that are denominated in foreign currencies are translated at the rates prevailing at the date when the fair value was determined. Non-monetary items that are measured in terms of historical cost in a foreign currency are not retranslated.
Exchange differences arising on the settlement of monetary items, and on the retranslation of monetary items, are included in the Income Statement for the period. Exchange differences arising on the retranslation of non-monetary items carried at fair value are included in the Income Statement for the period except for differences arising on the retranslation of non-monetary items in respect of which gains and losses are recognised directly in equity. For such non-monetary items, any exchange component of that gain or loss is also recognised directly in equity.
For the purpose of presenting consolidated financial statements, the assets and liabilities of the Group’s foreign operations are translated at exchange rates prevailing on the Balance Sheet date. Income and expense items are translated at the average exchange rates for the period, unless exchange rates fluctuate significantly during that period, in which case the exchange rates at the date of transactions are used. Exchange differences arising, if any, are recognised in the Statement of Comprehensive Income and accumulated in equity (attributed to non-controlling interests as appropriate). Such translation differences are recognised as income or as expenses in the period in which the related operation is disposed of. Any exchange differences that have previously been attributed to non-controlling interests are derecognised but they are not reclassified to the Income Statement.
Goodwill and fair value adjustments arising on the acquisition of a foreign entity are treated as assets and liabilities of the foreign entity and translated at the rate prevailing at the Balance Sheet date.
Financials
113
Mel
rose
Ind
ustr
ies
PLC
A
nnua
l Rep
ort 2
017

2. Summary of significant accounting policies continuedTaxationThe tax expense is based on the taxable profits for the period and represents the sum of the tax paid or currently payable and deferred tax.
Taxable profit differs from net profit as reported in the Income Statement because it excludes items of income or expense that are taxable or deductible in other years and it further excludes items that are never taxable or deductible. The Group’s liability for current tax is calculated using tax rates and tax laws that have been enacted or substantively enacted by the Balance Sheet date.
Deferred tax is provided, using the liability method, on all temporary differences at the Balance Sheet date between the tax bases of assets and liabilities and their carrying amounts for financial reporting purposes.
Deferred tax liabilities are recognised for all taxable temporary differences except:
• where the deferred tax liability arises on the initial recognition of goodwill or an asset or liability in a transaction that is not a business combination and, at the time of the transaction, affects neither the accounting profit nor taxable profit or loss; and
• where the timing of the reversal of the temporary differences associated with investments in subsidiaries and interests in joint ventures can be controlled and it is probable that the temporary differences will not reverse in the foreseeable future.
Deferred tax assets are recognised for all deductible temporary differences, carry-forward of unused tax assets and unused tax losses, to the extent that it is probable that taxable profit will be available against which the deductible temporary differences, and carry-forward of unused tax assets and unused tax losses can be utilised except:
• where the deferred tax asset arises from the initial recognition of an asset or liability in a transaction that is not a business combination and, at the time of the transaction, affects neither the accounting profit nor taxable profit or loss; and
• in respect of deductible temporary differences associated with investments in subsidiaries and interests in joint ventures, deferred tax assets are only recognised to the extent that it is probable that the temporary differences will reverse in the foreseeable future and taxable profit will be available against which the temporary differences can be utilised.
The carrying amount of deferred tax assets is reviewed at each Balance Sheet date and reduced to the extent that it is no longer probable that sufficient taxable profit will be available to allow all or part of the deferred tax asset to be utilised.
Deferred tax assets and liabilities are measured at the tax rates that are expected to apply to the year when the asset is realised or the liability is settled, based on tax rates and tax laws that have been enacted or substantively enacted at the relevant Balance Sheet date.
Deferred tax assets and liabilities are offset when there is a legally enforceable right to set off current tax assets against current tax liabilities and when they relate to income taxes levied by the same taxation authority and the Group intends to settle its current tax assets and liabilities on a net basis.
Tax relating to items recognised directly in other comprehensive income is recognised in the Statement of Comprehensive Income and not in the Income Statement.
Revenues, expenses and assets are recognised net of the amount of sales tax except:
• where the sales tax incurred on a purchase of goods and services is not recoverable from the taxation authority, in which case the sales tax is recognised as part of the cost of acquisition of the asset or as part of the expense item as applicable; and
• where receivables and payables are stated with the amount of sales tax included.
The net amount of sales tax recoverable from, or payable to, the taxation authority is included as part of receivables or payables in the Balance Sheet.
Share-based paymentsThe Group has applied the requirements of IFRS 2: “Share-based payment”. The Group issues equity-settled share-based payments to certain employees. Equity-settled share-based payments are measured at fair value of the equity instrument excluding the effect of non-market based vesting conditions at the date of grant. The fair value determined at the grant date of the equity-settled share-based payments is expensed on a straight-line basis over the vesting period, based on the Group’s estimate of shares that will eventually vest and adjusted for the effect of non-market based vesting conditions.
Fair value is measured by use of the Black Scholes pricing model. The expected life used in the model has been adjusted, based on the Directors’ best estimate, for the effects of non-transferability, exercise restrictions, and behavioural considerations.
Non-current assets and businesses held for saleNon-current assets and businesses classified as held for sale are measured at the lower of carrying amount and fair value less costs to sell.
Non-current assets and businesses are classified as held for sale if their carrying amount will be recovered principally through a sale transaction rather than through continuing use. This condition is regarded as having been met only when the sale is highly probable and the asset or business is available for immediate sale in its present condition. Management must be committed to the sale which should be expected to qualify for recognition as a completed sale within one year from the date of classification.
Notes to the financial statementsContinued
114M
elro
se In
dus
trie
s P
LC
Ann
ual R
epor
t 201
7

3. Critical accounting judgements and key sources of estimation uncertaintyIn the application of the Group’s accounting policies, which are described in note 2, the Directors are required to make judgements, estimates and assumptions about the carrying amounts of assets and liabilities that are not readily apparent from other sources. The estimates and associated assumptions are based on historical experiences and other factors that are considered to be relevant. Actual results may differ from these estimates.
The estimates and underlying assumptions are reviewed on an ongoing basis. Revisions to accounting estimates are recognised in the period in which the estimate is revised if the revision affects only that period, or in the period of revision and future periods if the revision affects both current and future periods.
There are no critical judgements, apart from those involving estimations, to disclose within the scope of paragraph 122 of IAS 1: “Presentation of financial statements”.
Key sources of estimation uncertainty The key assumptions concerning the future, and other key sources of estimation uncertainty at the reporting period end that may have a significant risk of causing a material adjustment to the carrying amounts of assets and liabilities within the next financial year, are discussed below.
Assumptions used to determine the carrying amount of the Energy segmentIAS 36: “Impairment of assets” requires that the carrying amount of assets does not exceed their recoverable amount. Recoverable amount is defined as the higher of an asset’s or cash-generating unit’s (CGU) fair value less costs of disposal and its value in use.
The Group reported on 21 November 2017 that a full review of the Energy group of CGUs was underway following the continued worsening of the market, recent negative trading statements made by participants in the market sector and the deferral of Generator orders within Brush. As has been well-publicised, structural changes caused by worldwide environmental policy have triggered a fall in volumes in the gas turbine market of over 60% from its peak in 2011. This in turn has resulted in Brush’s turbogenerator sales falling. These circumstances resulted in a reduction in the forecasts of the Brush business and the communication, in the November trading statement, that the current order intake by Brush would result in a low single-digit margin during 2018.
Given the challenging current market conditions affecting the Energy segment, management conducted a review of the carrying value of property, plant and equipment and computer software as at 31 December 2017 using a value in use calculation. This required the entity to estimate the future cash flows expected to arise from the property, plant and equipment and use a suitable discount rate in order to calculate present value. Management draws upon experience as well as external resources in making these estimates. Based on this testing, an impairment loss of £18.2 million was identified in relation to specific items of property, plant and equipment and computer software. At 31 December 2017, the carrying amount of property, plant and equipment and computer software was £70.1 million (31 December 2016: £118.2 million). The key estimates used to derive these non-current asset discounted cash flow valuations were revenue changes, operating margins (impacting EBITDA) and market conditions that impact long-term growth rates and discount rates.
As a result of its closure in November 2017, a reassessment of the value of the assets in Brush China resulted in a write down of £31.1 million and therefore the valuation of these assets is no longer considered a key source of estimation uncertainty.
Goodwill and intangible assets are tested for impairment whenever events or circumstances indicate that their carrying amounts might be impaired and at least annually.
Under IAS 36, the value in use basis for calculating the recoverable amount prohibits the inclusion of future uncommitted restructuring plans, however, the fair value less costs to sell basis valuation should reflect all future events (including restructuring) that would affect the expected cash flows for a market participant. The recent trading announcements by key players in the market in which Brush operates is considered to be a good indication that a market participant would restructure the business and therefore the restructuring impact should be included in the calculation.
For the purposes of this impairment test, the Energy group of CGUs has been measured using the higher of a fair value less disposal costs basis and a value in use basis. The fair value less cost to sell basis gives a value of £300 million (net of expected costs of disposal), which is more than the recoverable amount calculated using the value in use basis of £177.5 million. The fair value less costs to sell basis has therefore been used in the impairment assessment of the Energy group of CGUs, in accordance with IAS 36.
Fair value is the price that would be expected to be received to sell an asset or paid to transfer a liability in an orderly transaction between market participants at the measurement date. In estimating the fair value, the Group uses market-observable data to the extent it is available. The Group engaged third party valuation specialists as necessary and worked closely with these specialists to establish appropriate valuation techniques and market based inputs to the model. Fair value less disposal costs has been estimated using discounted cash flow projections, approved by management. The key estimates used to derive this valuation are the timing and impact of restructuring, potential reduction of future sales, operating margins (impacting EBITDA) and market conditions that impact long-term growth rates and discount rates. These are considered to be the main risk areas and are discussed in more detail in note 11.
Based on the impairment testing completed at year end, an impairment loss of £95.4 million was identified in relation to the assets of the Brush CGU, and hence goodwill has been written down accordingly. At 31 December 2017, the carrying amount of goodwill and other intangible assets in this division (not including computer software and development costs) was £184.5 million (31 December 2016: £283.0 million). Further information on the carrying amount of these assets, including a sensitivity analysis on the key assumptions, is provided in note 11.
Financials
115
Mel
rose
Ind
ustr
ies
PLC
A
nnua
l Rep
ort 2
017

3. Critical accounting judgements and key sources of estimation uncertainty continuedAssumptions used to determine the carrying amount of the Group’s defined benefit obligationThe Group’s defined benefit obligation is discounted at a rate set by reference to market yields at the end of the reporting period on high quality corporate bonds. Significant judgement is required when setting the criteria for bonds to be included in the population from which the yield curve is derived. The most significant criteria considered for the selection of bonds include the issue size of the corporate bonds, quality of the bonds and the identification of outliers which are excluded. In addition judgement is made in determining mortality rate assumptions to be used when valuing the Group’s defined benefit obligations. At 31 December 2017, the Group’s retirement benefit obligation deficit was £17.6 million (31 December 2016: £33.4 million). Further details of the assumptions applied and a sensitivity analysis on the principal assumptions used to determine the Group’s defined benefit obligations is shown in note 22.
4. RevenueAn analysis of the Group’s revenue, as defined by IAS 18: “Revenue”, is as follows:
Continuing operations Notes
Year ended 31 December
2017 £m
Year ended 31 December
2016 £m
Revenue from the sale of goods 1,995.7 807.8Revenue recognised on long-term contracts 5.0 3.0Revenue from the provision of services 91.5 78.5Revenue 5 2,092.2 889.3Finance income 7 0.8 1.8Total revenue from continuing operations as defined by IAS 18 2,093.0 891.1
5. Segment informationSegment information is presented in accordance with IFRS 8: “Operating segments” which requires operating segments to be identified on the basis of internal reports about components of the Group that are regularly reported to the Group’s Board in order to allocate resources to the segments and assess their performance. The Group’s reportable operating segments under IFRS 8 are as follows:
Energy – includes the Brush business, a specialist supplier of energy industrial products to the global market.
Air Management – includes the Air Quality & Home Solutions business (AQH), a leading manufacturer of ventilation products for the professional remodelling and replacement markets, residential new construction market, and do-it-yourself market. The Air Management division also includes the Heating, Ventilation & Air Conditioning business (HVAC) which manufactures and sells split-system and packaged air conditioners, heat pumps, furnaces, air handlers and parts for the residential replacement and new construction markets, along with custom-designed and engineered HVAC products and systems for non-residential applications.
Security & Smart Technology (SST) – includes the Security & Control business (SCS) along with the Core Brands and GTO Access Systems businesses. These businesses are manufacturers and distributors of products designed to provide convenience and security primarily for residential applications and audio visual equipment for the residential audio video and professional video market.
Ergonomics – comprises the Ergotron business, a manufacturer and distributor of innovative products designed with ergonomic features including wall mounts, carts, arms, desk mounts, workstations and stands that attach to or support a variety of display devices such as notebook computers, computer monitors and flat panel displays.
In addition, there are central cost centres which are also separately reported to the Board. The central corporate cost centre which contains the Melrose Group head office costs along with charges related to the divisional management long-term incentive plans and the remaining Nortek central cost centre.
All operating segments are classified as continuing operations.
Transfer prices between business units are set on an arm’s length basis in a manner similar to transactions with third parties.
No single customer contributed 10% or more to the Group’s revenue in either 2017 or 2016.
The Group’s geographical segments are determined by the location of the Group’s non-current assets and, for revenue, the location of external customers. Inter-segment sales are not material and have not been disclosed.
Notes to the financial statementsContinued
116M
elro
se In
dus
trie
s P
LC
Ann
ual R
epor
t 201
7

5. Segment information continuedSegment revenues and results The following tables present the revenue, results and certain asset and liability information regarding the Group’s operating segments and central cost centres for the year ended 31 December 2017 and the comparative year.
Year ended 31 December 2017Energy
£m
Air Management
£m
Security & Smart
Technology£m
Ergonomics£m
Nortek central
£m
Nortektotal£m
Central(1)-corporate
£mTotal
£m
Revenue 219.0 1,159.6 440.7 272.9 – 1,873.2 – 2,092.2Underlying operating profit/(loss) 17.5 146.1 70.7 69.6 (2.1) 284.3 (23.4) 278.4Impairment of Brush assets (144.7) – – – – – – (144.7)Amortisation of intangible assets (8.8) (35.3) (20.2) (17.1) – (72.6) – (81.4)Restructuring costs (5.9) (19.0) (6.7) (2.1) (1.3) (29.1) – (35.0)Acquisition and disposal costs – – – – – – (5.8) (5.8)Melrose equity-settled
compensation scheme – – – – – – (24.2) (24.2)Release of fair value items 0.3 3.2 1.8 0.5 – 5.5 – 5.8Operating (loss)/profit (141.6) 95.0 45.6 50.9 (3.4) 188.1 (53.4) (6.9)Finance costs (21.5)Finance income 0.8Loss before tax (27.6)Tax 3.7Loss for the year (23.9)
(1) Includes £7.6 million (2016: £nil) of costs relating to divisional Long-term Incentive Plans.
Year ended 31 December 2016Energy
£m
Air Management
£m
Security & Smart
Technology£m
Ergonomics£m
Nortek central£m
Nortek (1)
total£m
Central-corporate
£mTotal
£m
Revenue 246.4 416.5 130.4 96.0 – 642.9 – 889.3Underlying operating profit/(loss) 32.0 46.8 17.1 24.4 (2.0) 86.3 (14.2) 104.1Amortisation of intangible assets (8.5) (15.1) (6.9) (5.8) – (27.8) – (36.3)Restructuring costs (6.1) (12.4) (1.1) – (31.8) (45.3) – (51.4)Acquisition and disposal costs – – – – – – (38.7) (38.7)Melrose equity-settled
compensation scheme – – – – – – (22.8) (22.8)Release of fair value items 1.7 – – – – – – 1.7Removal of one-off uplift
in value of inventory – (13.0) (3.4) (1.8) – (18.2) – (18.2)Operating profit/(loss) 19.1 6.3 5.7 16.8 (33.8) (5.0) (75.7) (61.6)Finance costs (9.5)Finance income 1.8Loss before tax (69.3)Tax 30.3Loss for the year (39.0)
(1) Includes four months trading of Nortek following its acquisition on 31 August 2016.
Total assets Total liabilities
31 December 2017
£m
Restated (1)
31 December 2016
£m
31 December 2017
£m
Restated (1)
31 December 2016
£m
Energy 376.4 549.2 69.5 97.8Air Management 1,399.2 1,569.2 367.2 497.4Security & Smart Technology 630.5 692.2 127.3 160.7Ergonomics 670.3 756.5 103.4 144.6Nortek central 0.5 5.3 (10.3) (2) (31.0) (2)
Nortek total 2,700.5 3,023.2 587.6 771.7Central – corporate 68.9 76.6 603.5 616.7Total 3,145.8 3,649.0 1,260.6 1,486.2
(1) Restated to reflect the completion of the acquisition accounting for Nortek (note 11).(2) IAS 12 requires the set off of deferred tax assets and liabilities in the same tax jurisdiction. The £10.3 million (31 December 2016: £31.0 million) negative balance within Nortek central liabilities
represents £36.7 million (31 December 2016: £85.5 million) of Nortek central deferred tax assets which have been treated as negative liabilities to represent the required offset, and £26.4 million (31 December 2016: £54.5 million) of other Nortek central liabilities.
Financials
117
Mel
rose
Ind
ustr
ies
PLC
A
nnua
l Rep
ort 2
017

5. Segment information continuedCapital expenditure (1) Depreciation (1)
Continuing operations
Year ended 31 December
2017£m
Year ended 31 December
2016£m
Year ended 31 December
2017£m
Year ended 31 December
2016£m
Energy 1.8 3.6 9.2 9.0Air Management 44.4 10.3 18.9 6.4Security & Smart Technology 3.1 1.8 3.1 1.0Ergonomics 2.4 1.1 2.8 1.0Nortek central – 0.1 0.7 0.5Nortek total 49.9 13.3 25.5 8.9Central – corporate – – – 0.2Total 51.7 16.9 34.7 18.1
(1) Including computer software and development costs.
Geographical informationThe Group operates in various geographical areas around the world. The Group’s country of domicile is the UK and the Group’s revenues and non-current assets in Europe and North America are also considered to be material.
The Group’s revenue from external customers and information about its segment assets (non-current assets excluding interests in joint ventures, deferred tax assets, derivative financial assets and non-current trade and other receivables) by geographical location are detailed below:
Revenue (1) from external customers Non-current assets
Continuing operations
Year ended 31 December
2017£m
Year ended 31 December
2016£m
31 December
2017£m
Restated (2)
31 December 2016
£m
UK 104.7 88.9 130.3 183.3Europe 124.2 82.3 108.8 181.4North America 1,767.8 638.8 2,207.3 2,480.1Other 95.5 79.3 10.1 36.4Total 2,092.2 889.3 2,456.5 2,881.2
(1) Revenue is presented by destination.(2) Restated to reflect the completion of the acquisition accounting for Nortek (note 11).
6. Reconciliation between profit and underlying profit As described in note 2, underlying profit/(loss) is an alternative performance measure used by the Board to monitor the underlying trading performance of the Group. The Board considers the underlying results to be a key measure to monitor how the businesses are performing because this provides a more meaningful comparison of how the business is managed and measured on a day-to-day basis and achieves consistency and comparability between reporting periods.
A reconciliation between the statutory loss and underlying profit is shown below:
Continuing operations Notes
Year ended31 December
2017£m
Year ended31 December
2016£m
Operating loss (6.9) (61.6)Impairment of Brush assets a 144.7 –Amortisation of intangible assets b 81.4 36.3Restructuring costs c 35.0 51.4Acquisition and disposal costs d 5.8 38.7Removal of one-off uplift in value of inventory e – 18.2Melrose equity-settled compensation scheme f 24.2 22.8Release of fair value items g (5.8) (1.7)Total adjustments to operating loss (1) 285.3 165.7Underlying operating profit 278.4 104.1
(1) Of the adjustments to operating loss, £285.3 million (2016: £147.5 million) is included within net operating expenses and £nil (2016: £18.2 million) within cost of sales.
Notes to the financial statementsContinued
118M
elro
se In
dus
trie
s P
LC
Ann
ual R
epor
t 201
7

6. Reconciliation between profit and underlying profit continueda. The results for the year ended 31 December 2017 included an impairment charge totalling £144.7 million in respect of the carrying
value of the assets held within the Brush business. This charge included £31.1 million in respect of the net assets of Brush China, which was closed in November 2017, and, following a review of the non-current assets, included £18.2 million in respect of fixed assets and £95.4 million in respect of goodwill. The impairment charge has been excluded from underlying results due to its one-off nature and size.
b. The amortisation of intangible assets acquired in business combinations are excluded from underlying results due to their non-trading nature and to enable comparison with companies that grow organically and do not have such a charge. Where intangible assets are trading in nature, such as computer software and development costs, the amortisation of these intangible assets are shown within underlying results.
c. Restructuring costs and other associated costs arising from significant strategy changes totalled £35.0 million (2016: £51.4 million) and included £1.1 million (2016: £nil) of losses incurred following the announcement of the closure of certain businesses. Within the Nortek businesses the cost of restructuring actions taken in the year was £29.1 million (2016: £45.3 million, of which £31.8 million related to the closure of the Nortek head office). These actions included the closure of loss making operations within the HVAC business, the removal of excess manufacturing capacity in the Air Quality & Home Solutions business and the consolidation of Nortek Security & Control, GTO and Core Brands into a single Security & Smart Technology division based in Carlsbad. Restructuring costs also included £5.9 million (2016: £6.1 million) within the Brush businesses relating to the closure of the China factory and realigning the cost base of Brush with the reduced revenue. Restructuring costs are excluded from underlying results due to their size and non-trading nature.
d. Acquisition and disposal costs incurred in the year ended 31 December 2017 totalled £5.8 million (2016: £38.7 million) and included the costs involved in returning the ordinary shares of the Company to the Premium List of the London Stock Exchange following on from the acquisition of Nortek, along with £1.8 million of committed costs associated with the potential acquisition of GKN plc. In the year ended 31 December 2016 acquisition and disposal costs related primarily to the acquisition of Nortek. These items are excluded from underlying results due to their non-trading nature.
e. The one-off loss of profit effect of being required to uplift the value of inventory acquired in an acquisition to that close to its selling price was excluded from the year ended 31 December 2016 underlying results due to its size and non-recurring nature.
f. The charge for the equity-settled Melrose Incentive Plan, including its associated employer’s tax charge, is excluded from underlying results due to its size and volatility. The shares that would be issued in respect of the equity-settled Melrose Plan are included in the calculation of the underlying diluted earnings per share, which the Board consider to be a key measure of performance.
g. During the year ended 31 December 2017 certain items, primarily booked as fair value items on the acquisition of Nortek, have been settled for a more favourable amount than first anticipated. The release of any excess fair value item is shown within non-underlying profit to avoid positively distorting underlying results.
Continuing operations
Year ended 31 December
2017 £m
Year ended31 December
2016£m
Loss before tax (27.6) (69.3)Adjustments to loss before tax per above 285.3 165.7Underlying profit before tax 257.7 96.4
Continuing operations Notes
Year ended 31 December
2017 £m
Year ended31 December
2016£m
Loss for the year (23.9) (39.0)Adjustments to loss before tax per above 285.3 165.7Net effect of new tax legislation in the US h (26.4) –Incremental deferred tax asset recognition on UK losses i – (10.4)Tax effect of adjustments to underlying profit before tax 8 (44.1) (45.9)Adjustments to loss for the year 214.8 109.4Underlying profit for the year 190.9 70.4
h. The net tax credit arising from the new US tax legislation enacted in December 2017, including an estimated repatriation charge and changes to closing deferred tax items due to a reduction in the Federal tax rate from 35% to 21%, has been included as non-underlying because of its size and one-off nature.
i. During the year ended 31 December 2016 deferred tax assets on UK tax losses, which are now considered accessible following acquisition and disposal activities, were recognised. This is excluded from underlying results due to its size, volatility and non-trading nature.
Financials
119
Mel
rose
Ind
ustr
ies
PLC
A
nnua
l Rep
ort 2
017

7. Revenues and expenses
Continuing operations
Year ended 31 December
2017 £m
Year ended 31 December
2016 £m
Net operating expenses comprise:Selling and distribution costs (167.7) (76.7)Administration expenses(1) (492.6) (249.1)Share of results of joint ventures (note 13) 0.6 0.9 Total net operating expenses (659.7) (324.9)
(1) Includes £285.3 million (2016: £147.5 million) of non-underlying costs.
Continuing operations
Year ended 31 December
2017 £m
Year ended 31 December
2016£m
Operating profit is stated after charging/(crediting):Cost of inventories 1,439.4 626.0 Amortisation of intangible assets acquired in business combinations (note 11) 81.4 36.3 Depreciation and impairment of property, plant and equipment (note 12)(1) 74.7 18.4 Impairment of goodwill (note 11)(1) 95.4 –Amortisation and impairment of computer software and development costs (note 11)(1) 4.3 7.5 Operating lease expense 20.0 10.7 Staff costs 502.9 246.6 Research and development costs(2) 18.7 3.9 Loss on disposal of property, plant and equipment 1.6 –Loss on disposal of computer software and development costs 0.3 0.2 Expense of writing down inventory to net realisable value(1) 11.8 9.3 Reversals of previous write-downs of inventory (2.7) (6.6)Impairment recognised on trade receivables 4.6 3.7 Impairment reversed on trade receivables (4.4) (1.1)
(1) Of the £144.7 million of Brush impairment charges, £95.4 million relates to goodwill, £0.5 million relates to computer software and development costs, £42.3 million relates to property, plant and equipment, £3.9 million relates to inventory and £2.6 million relates to other assets.
(2) In addition staff costs include £44.2 million (2016: £19.2 million) of research and development related costs.
The analysis of auditor’s remuneration is as follows:
Year ended 31 December
2017 £m
Year ended 31 December
2016 £m
Fees payable to the Company’s auditor for the audit of the Company’s annual accounts 2.3 1.8Fees payable to the auditor for the audit of the Nortek acquisition Balance Sheet – 0.5Total fees payable for the audit of the Company’s annual accounts 2.3 2.3Fees payable to the Company’s auditor and their associates for other audit services to the Group:The audit of the Company’s subsidiaries pursuant to legislation 0.4 0.5Total audit fees 2.7 2.8Audit-related assurance services:Review of the half year interim statement 0.2 0.1Non-statutory audit of certain of the Company’s businesses 0.9 0.1Other assurance services 0.1 0.4Total audit-related assurance services 1.2 0.6Total audit and audit-related assurance services 3.9 3.4Taxation compliance services – 0.1Other taxation advisory services – 0.9Corporate finance services 0.5 1.8Total audit and non-audit fees 4.4 6.2
Details of the Company’s policy on the use of auditors for non-audit services and how auditor’s independence and objectivity were safeguarded are set out in the Audit Committee report on page 76. No services were provided pursuant to contingent fee arrangements.
Notes to the financial statementsContinued
120M
elro
se In
dus
trie
s P
LC
Ann
ual R
epor
t 201
7

7. Revenues and expenses continued
Continuing operations
Year ended 31 December
2017 £m
Year ended 31 December
2016 £m
Staff costs during the year (including executive Directors)Wages and salaries 433.4 204.9Social security costs(1) 52.0 31.7Pension costs (note 22)– defined benefit plans 0.2 0.1– defined contribution plans 7.2 5.9Share based compensation expense(2)(note 21) 10.1 4.0Total staff costs 502.9 246.6
(1) Includes the employer’s tax charge on the change in value of the Melrose equity-settled incentive scheme (note 6). (2) Charged to non-underlying expense (note 6).
Continuing operations
Year ended 31 December
2017 Number
Year ended(1)
31 December 2016
Number
Average monthly number of persons employed (including executive Directors)Energy 1,798 2,107Air Management 6,205 6,743Security & Smart Technology 2,507 2,602Ergonomics 1,418 1,546Nortek central(2) 2 86Central – corporate 30 30Total average number of persons employed 11,960 13,114
(1) For Nortek businesses the average monthly number of persons employed in the year ended 31 December 2016 reflects the average for the four month period from the date of acquisition. (2) At 31 December 2017, no Nortek central employees remained within the Group (31 December 2016: 10).
Continuing operations
Year ended 31 December
2017 £m
Year ended 31 December
2016 £m
Finance costs and incomeInterest on bank loans and overdrafts (16.8) (7.7)Amortisation of costs of raising finance (2.3) (0.7)Net interest cost on pensions (1.1) (0.9)Unwind of discount on provisions (1.3) (0.2)Total finance costs (21.5) (9.5)Finance income 0.8 1.8Total net finance costs (20.7) (7.7)
8. Tax
Continuing operations
Year ended31 December
2017 £m
Year ended 31 December
2016 £m
Analysis of charge/(credit) in year:Current taxIn respect of current year 13.1 6.0In respect of prior year 0.2 (3.0)Deferred taxIn respect of current year 6.4 (22.5)Adjustments to deferred tax attributable to changes in tax rates (39.4) (0.4)Loss utilisation against US repatriation charge 16.0 –Recognition of previously unrecognised UK tax losses – (10.4)Total income tax credit (3.7) (30.3)
The total income tax credit of £3.7 million (2016: £30.3 million) is comprised of a current tax charge of £13.3 million (2016: £3.0 million) and a deferred tax credit of £17.0 million (2016: £33.3 million).
The deferred tax credit for the year has been materially affected by the reduction of corporate tax rates in the UK and the US. In the UK, the Finance Act 2016 enacted future reductions in the rate of UK Corporation Tax and excess losses arising in the current year have been recognised in the closing Balance Sheet at the rates at which the benefit is likely to reverse. This has resulted in an effective deferred tax charge of £3.0 million (2016: credit of £0.4 million) which is included in underlying tax.
Financials
121
Mel
rose
Ind
ustr
ies
PLC
A
nnua
l Rep
ort 2
017

8. Tax continuedIn addition, the new US tax measures enacted in December 2017 include a reduction of the Federal tax rate from 35% to 21% with effect from 1 January 2018, requiring a revaluation of the US deferred tax assets and liabilities at 31 December 2017. The reduction in the deferred tax liability held in respect of intangible assets results in a tax credit of £99.5 million (2016: £nil), whilst the reduction in the deferred tax assets held within the Group’s subsidiaries results in a tax charge of £57.1 million (2016: £nil). Together with a charge of £16.0 million (2016: £nil) in respect of the US repatriation charge, these amounts total £26.4 million (2016: £nil) which is classified as non-underlying tax.
In addition, the tax effect of non-underlying items incurred in the year was a credit of £44.1 million (2016: £45.9 million) which comprises £2.5 million (2016: £nil) in respect of impairment of Brush assets, £10.0 million (2016: £18.2 million) in respect of restructuring costs, £0.3 million (2016: £3.9 million) in respect of acquisition and disposal costs, £30.0 million (2016: £12.8 million) in respect of the amortisation of intangible assets, £nil (2016: £6.8 million) in respect of the required uplift in the value of inventory acquired with Nortek, £2.9 million (2016: £4.5 million) in respect of Melrose equity-settled compensation scheme, and a charge of £1.6 million (2016: £0.3 million) in respect of the release of fair value provisions and other items.
The tax credit for the year for continuing operations can be reconciled to the loss per the Income Statement as follows:
Year ended 31 December
2017£m
Year ended 31 December
2016£m
Loss on ordinary activities before tax: (27.6) (69.3)
Tax on loss on ordinary activities at weighted average rate 14.22% (2016: 40.82%) (3.9) (28.3)Tax effect of:Disallowable expenses within underlying items 5.4 1.6Disallowable items in respect of non-underlying items 21.7 7.3Temporary differences not recognised in deferred tax 11.0 2.7Tax credits, withholding taxes and other rate differences (0.9) (0.2)Prior year tax adjustments (10.6) (3.0)Tax credit classified as non-underlying (note 6) (26.4) (10.4)Total tax credit for the year (3.7) (30.3)
The reconciliation has been performed at a blended Group tax rate of 14.22% (2016: 40.82%) which represents the weighted average of the tax rates applying to profits and losses in the jurisdictions in which those results arose.
In addition to the amount charged to the Income Statement, a tax credit of £31.6 million (2016: £2.1 million) has been recognised in equity. This represents a tax charge of £1.1 million (2016: £3.3 million) in respect of retirement benefit obligations, a tax charge of £0.7 million (2016: £1.1 million) in respect of movements on cash flow hedges, a tax credit of £nil (2016: £1.3 million) in respect of tax charged on foreign exchange gains and a tax credit of £33.4 million (2016: £5.2 million) in respect of share based payments.
9. DividendsYear ended
31 December 2017
£m
Year ended 31 December
2016 £m
Final dividend for the year ended 31 December 2015 paid of 2.6p (0.5)p (1) – 3.8Interim dividend for the year ended 31 December 2016 paid of 1.4p (0.3)p (1) – 2.0Final dividend for the year ended 31 December 2016 paid of 1.9p 35.8 –Interim dividend for the year ended 31 December 2017 paid of 1.4p 27.2 –
63.0 5.8
(1) Adjusted to include the effects of the Rights Issue (note 10).
Proposed final dividend for the year ended 31 December 2017 of 2.8p per share (2016: 1.9p per share) totalling £54.4 million (2016: £35.8 million).
The final dividend of 2.8p was proposed by the Board on 20 February 2018 and, in accordance with IAS 10: “Events after the reporting period”, has not been included as a liability in these financial statements.
Notes to the financial statementsContinued
122M
elro
se In
dus
trie
s P
LC
Ann
ual R
epor
t 201
7

10. Earnings per share
Earnings attributable to owners of the parent
Year ended31 December
2017£m
Year ended 31 December
2016£m
Earnings for basis of earnings per share from continuing operations (23.9) (39.0)
Year ended31 December
2017 Number
Year ended (1)
31 December2016
Number
Weighted average number of ordinary shares for the purposes of basic earnings per share (million) 1,918.7 1,499.3Further shares for the purposes of diluted earnings per share (million) 22.5 89.8Weighted average number of ordinary shares for the purposes of diluted earnings per share (million) 1,941.2 1,589.1
(1) On 24 August 2016, a 12 for 1, fully underwritten, Rights Issue was completed by Melrose Industries PLC and subsequently 1,741.6 million new ordinary shares were issued raising £1,654.5 million to part fund the acquisition of the Nortek Group. In accordance with IAS 33, a bonus factor associated with the issue of the new share capital of 18.8491% has been applied to the number of ordinary shares in issue prior to 24 August 2016 for the purposes of earnings per share calculations.
On 28 January 2016 the number of ordinary shares in issue was consolidated in a ratio of 7 for 48, which reduced the number of ordinary shares in issue from 995.2 million to 145.1 million.
On 1 June 2017 the number of ordinary shares in issue increased by 54.5 million following the crystallisation of the 2012 Melrose Incentive Plan which increased the number of shares in issue from 1,886.7 million to 1,941.2 million.
Earnings per share
Year ended31 December
2017pence
Year ended 31 December
2016pence
Basic earnings per share (1.2) (2.6)Diluted earnings per share (1.2) (2.6)
Underlying earnings Note
Year ended31 December
2017£m
Year ended31 December
2016£m
Underlying earnings for the basis of underlying earnings per share from continuing operations 6 190.9 70.4
Underlying earnings per share
Continuing operations
Year ended31 December
2017pence
Year ended 31 December
2016pence
Underlying basic earnings per share 9.9p 4.7pUnderlying diluted earnings per share 9.8p 4.4p
Financials
123
Mel
rose
Ind
ustr
ies
PLC
A
nnua
l Rep
ort 2
017

11. Goodwill and other intangible assets
CostGoodwill
£m
Customer relationships
£m
Brands and intellectual
property £m
Other (1)
£m
Computer software and development
costs £m
Total £m
At 1 January 2016 198.1 28.4 106.4 – 4.5 337.4 Acquisition of businesses(2) 1,348.5 556.4 266.5 29.7 15.8 2,216.9 Additions – – – – 0.6 0.6 Disposals – – – – (0.2) (0.2)Exchange adjustments 101.7 37.8 25.1 1.9 1.5 168.0 At 31 December 2016 restated(2) 1,648.3 622.6 398.0 31.6 22.2 2,722.7 Transfer to held for sale(3) – – – – (0.1) (0.1)Additions – – – – 3.2 3.2 Disposals – – – – (1.2) (1.2)Exchange adjustments (120.7) (51.3) (22.7) (2.8) (0.9) (198.4)At 31 December 2017 1,527.6 571.3 375.3 28.8 23.2 2,526.2 Amortisation and impairment At 1 January 2016 – (21.3) (39.8) – (3.3) (64.4)Charge for the year – (18.7) (11.5) (6.1) (2.2) (38.5)Impairments(4) – – – – (5.3) (5.3)Exchange adjustments – (1.3) (3.2) (0.2) (0.5) (5.2)At 31 December 2016 – (41.3) (54.5) (6.3) (11.3) (113.4)Charge for the year – (49.1) (23.2) (9.1) (3.8) (85.2)Impairments(4) (95.4) – – – (0.5) (95.9)Disposals – – – – 0.9 0.9 Exchange adjustments – 3.2 0.5 1.1 0.2 5.0 At 31 December 2017 (95.4) (87.2) (77.2) (14.3) (14.5) (288.6)Net book valueAt 31 December 2017 1,432.2 484.1 298.1 14.5 8.7 2,237.6 At 31 December 2016 restated(2) 1,648.3 581.3 343.5 25.3 10.9 2,609.3 At 1 January 2016 198.1 7.1 66.6 – 1.2 273.0
(1) Other includes technology and order backlog intangible assets acquired with the Nortek businesses. (2) Restated to reflect the completion of the acquisition accounting for Nortek.(3) Transferred to assets held for sale at 30 June 2017 in accordance with IFRS 5, subsequently disposed on 10 August 2017.(4) The impairment in 2017 relates to impairments recognised in the Energy segment. The impairment charges in 2016 relate to the closure of the Nortek head office.
The goodwill generated as a result of major acquisitions represents the premium paid in excess of the fair value of all net assets, including intangible assets, identified at the point of acquisition. The carrying value of goodwill includes a premium, paid in order to secure shareholder agreement to the business combination, that is less than the value that the Directors believed could be added to the acquired businesses through the application of their specialist turnaround experience.
The goodwill arising on bolt-on acquisitions is attributable to the anticipated profitability and cash flows arising from the businesses acquired, synergies as a result of the complementary nature of the business with existing Melrose businesses, the assembled workforce, technical expertise, knowhow, market share and geographical advantages afforded to the Group.
The future improvements applied to the acquired businesses, achieved through a combination of revised strategic direction, operational improvements and investment, are expected to result in improved profitability of the acquired businesses during the period of ownership and are also expected to result in enhanced disposal proceeds when the acquired businesses are ultimately disposed. The combined value achieved from these improvements is expected to be in excess of the value of goodwill acquired.
Goodwill acquired in business combinations, net of impairment, has been allocated to the businesses, each of which comprises several cash-generating units, as follows:
31 December 2017
£m
Restated (1)
31 December 2016
£m
Energy 122.0 212.9Air Management 580.5 636.1Security & Smart Technology 320.2 350.6Ergonomics 409.5 448.7Nortek total 1,310.2 1,435.4Total operations 1,432.2 1,648.3
(1) Restated to reflect the completion of the acquisition accounting for Nortek.
The Group tests goodwill annually or more frequently if there are indications that goodwill might be impaired. In accordance with IAS 36: “Impairment of assets” the Group values goodwill at the recoverable amount, being the higher of the value in use basis and the fair value less costs to sell basis.
Notes to the financial statementsContinued
124M
elro
se In
dus
trie
s P
LC
Ann
ual R
epor
t 201
7

11. Goodwill and other intangible assets continuedValue in use calculations have been used to determine the recoverable amount of goodwill allocated to each group of cash-generating units (CGUs) within Nortek. The calculation uses the latest approved forecast extrapolated to perpetuity using growth rates shown below, which do not exceed the long-term growth rate for the relevant market. Based on impairment testing completed at the year end, no impairment was identified in respect of the Nortek businesses. No reasonable possible change in key assumptions would result in an impairment in any of the Nortek group of CGUs.
The Group reported on 21 November 2017 that a full review of the Energy group of CGUs was underway following the continued worsening of the market, recent negative trading statements made by participants in the market sector and the deferral of Generator orders within Brush. As has been well-publicised, structural changes caused by worldwide environmental policy have triggered a fall in volumes in the gas turbine market of over 60% from its peak in 2011. This in turn has resulted in Brush’s turbogenerator sales falling. These circumstances resulted in a reduction in the forecasts of the Brush business and the communication, in the November trading statement, that the current order intake by Brush would result in a low single-digit margin during 2018.
At 31 December 2017 an agreed restructuring plan had not been publicly announced or communicated to those affected by the restructure and therefore, in accordance with IAS 37: “Provisions, contingent liabilities and contingent assets”, these costs were not considered to be committed. The restructuring plan was subsequently announced on 1 February 2018.
Under IAS 36, the value in use basis for calculating the recoverable amount prohibits the inclusion of future uncommitted restructuring plans, however, the fair value less costs to sell basis valuation should reflect all future events (including restructuring) that would affect the expected cash flows for a market participant. The recent trading announcements by key players in the market in which Brush operates is considered to be a good indication that a market participant would restructure the business and therefore the restructuring impact should be included in the calculation.
The fair value less costs to sell calculation does not include any synergistic savings as these synergies would not be available to most market participants.
The inclusion of the impacts of the restructuring plan, risk adjusted downwards to reflect the inherent execution risk, results in the fair value less cost to sell basis giving a value of £300 million (net of expected costs of disposal), which is more than the recoverable amount calculated using the value in use basis of £177.5 million. The fair value less costs to sell basis has therefore been used in the impairment assessment of the Energy group of CGUs, in accordance with IAS 36.
Based on the impairment testing completed at year end, an impairment loss of £95.4 million was identified in relation to these assets, and hence goodwill has been written down accordingly. Combined with the £31.1 million write down of assets in Brush China following its closure in November 2017 and the £18.2 million impairment of fixed assets, tested separately on a value in use basis as required by IAS 36 a total impairment charge of £144.7 million is shown in non-underlying items (note 6).
The basis of these impairment tests and the key assumptions are set out in the table below:
31 December 2017
Group of CGUsBasis of
valuation
Carrying value of
goodwill£m
Pre-tax discount
rates(a)
Post-tax discount
ratesPeriod of forecast
Key assumptions applied in the
forecast cash flowprojections(b)
Long-termgrowth rates(c)
Energy(d)
Fair value less costs of
disposal 122.0 (1) 11.9% 10.0% 5 years
Revenue growth, restructuring impact,
operating margins 2.2%
Air Management Value in use 580.5 12.6% 9.8% 4 yearsRevenue growth,
operating margins 3.0%
Security & Smart Technology Value in use 320.2 12.6% 9.8% 4 yearsRevenue growth,
operating margins 3.0%
Ergonomics Value in use 409.5 12.6% 9.8% 4 yearsRevenue growth,
operating margins 3.0%
(1) Following a goodwill impairment charge in the year of £95.4 million.
31 December 2016
Group of CGUsBasis of
valuation
Restated (1)
carrying value of goodwill
£m
Pre-tax discount
rates (a)
Post-tax discount
ratesPeriod of forecast
Key assumptions applied in the
forecast cash flowprojections(b)
Long-termgrowth rates(c)
Energy Value in use 212.9 11.0% 9.2% 5 yearsRevenue growth,
operating margins 2.2%
Air Management Value in use 636.1 12.8% 9.7% 4 yearsRevenue growth,
operating margins 3.0%
Security & Smart Technology Value in use 350.6 12.7% 9.7% 4 yearsRevenue growth,
operating margins 3.0%
Ergonomics Value in use 448.7 12.6% 9.7% 4 yearsRevenue growth,
operating margins 3.0%
(1) Restated to reflect the completion of the acquisition accounting for Nortek.
Financials
125
Mel
rose
Ind
ustr
ies
PLC
A
nnua
l Rep
ort 2
017

11. Goodwill and other intangible assets continued(a) Pre-tax risk adjusted discount ratesCash flows are discounted using a pre-tax discount rate specific to each group of CGUs. Discount rates reflect the current market assessments of the time value of money and are based on the estimated cost of capital of each CGU. In determining the cost of equity, the Capital Asset Pricing Model (CAPM) has been used. Under CAPM, the cost of equity is determined by adding a risk premium to the risk free rate to reflect the additional risk associated with investing outside of lending to a country. The risk free rate for the Energy group of CGUs is based on the cost of UK Government bonds, whilst the risk free rate for the Air Management, Security & Smart Technology and Ergonomics groups of CGUs are based on the cost of US Government bonds. The premium is based on an industry adjustment (“Beta”) to the expected return of the equity market above the risk free return. The relative risk adjustment reflects the risk inherent in each group of CGUs relative to all other sectors and geographies on average.
The discount rate used for the Energy group of CGUs has been risk adjusted to reflect the execution risk inherent in future restructuring plans in the fair value less costs of disposal approach.
(b) Assumptions applied in financial forecastsThe Group prepares cash flow forecasts derived from financial budgets and medium-term forecasts. The key assumptions used in forecasting pre-tax cash flows relate to future budgeted revenue and operating margins likely to be achieved and the likely rates of long-term growth by market sector. Underlying factors in determining the values assigned to each key assumption are shown below:
Revenue growth and operating margins: Revenue growth assumptions in the forecast period are based on financial budgets and medium-term forecasts by management, taking into account industry growth rates and management’s historical experience in the context of wider industry and economic conditions. Projected sales are built up with reference to markets and product categories. They incorporate past performance, historical growth rates, projections of developments in key markets, secured orders and orders likely to be achieved in the short to medium-term given trends in the relevant market sector.
Operating margins have been forecast based on historical levels achieved considering the likely impact of changing economic environments and competitive landscapes on volumes and revenues and the impact of management actions on costs. Projected margins reflect the impact of all initiated projects to improve operational efficiency and leverage scale. The projections do not include the impact of future restructuring projects to which the Group is not yet committed. Forecasts for other operating costs are based on inflation forecasts and supply and demand factors.
Brush is a supplier of turbogenerators for the power generation, industrial, Oil & Gas and offshore sectors and a leading supplier of switchgear, transformers and other power infrastructure equipment. The key drivers for revenues and operating margins are: i) original equipment investments in the global power market, both new capacity (mainly emerging markets) and replacement capacity (mainly in mature markets) ii) growth in service requirements of the installed base; and iii) new product introduction. Independent forecasts of growth in these power generation markets have been used to derive revenue growth assumptions. Forecasts for other operating costs are based on inflation forecasts and supply and demand factors. As described above, the impacts of the planned restructuring have been included in deriving future operating margins within the Energy group of CGUs using a fair value less costs to sell basis. The timing of these assumed restructuring impacts have been risk adjusted to reflect the execution risk inherent in future restructuring plans of a market participant and are also a key driver for operating margins in the forecast period.
Nortek is a diversified global manufacturer of innovative air management, security, home automation and ergonomic and productivity solutions.
Air Management is a leading provider of residential indoor air quality improvement solutions, home comfort and convenience products and heating, ventilation and air conditioning equipment for both residential and commercial markets. The key drivers for revenue and operating margins are the levels of residential remodelling and replacement activity and the levels of residential and non-residential new construction in the markets in which Air Management operates. New residential and non-residential construction activity and, to a lesser extent, residential remodelling and replacement activity are affected by seasonality and cyclical factors such as interest rates, credit availability, inflation, consumer spending, employment levels and other macroeconomic factors.
Security & Smart Technology is a leading developer and manufacturer of security, home automation and access control technologies for residential and commercial markets’ service providers. The key driver for revenue and operating margins is global demand for security and home automation products. Consumer spending, employment levels, regulation, technological advancements and the evolution of the traditional security market towards home automation and other macroeconomic factors influence demand for these products.
The Ergonomics segment includes Ergotron, one of the world’s largest manufacturers of ergonomics equipment. Ergotron provides a wide variety of solutions to healthcare, education, corporate office and home applications. The key driver for revenue and operating margins is demand for technology and wellness products in the markets in which Ergotron operates. Seasonal factors, public authority spending, corporate and consumer spending, employment levels, the public awareness of wellness, regulation, technological advancements and other macroeconomic factors influence demand for these products.
Notes to the financial statementsContinued
126M
elro
se In
dus
trie
s P
LC
Ann
ual R
epor
t 201
7

11. Goodwill and other intangible assets continued(c) Long-term growth ratesLong-term growth rates are based on long-term forecasts for growth in the sectors and geography in which the CGU operates. Long-term growth rates are determined using a blend of publicly available data and a long-term growth rate forecast that takes into account the international presence and the markets in which each business operates.
(d) Energy group of CGUs The previous full impairment test performed at 30 June 2017 indicated that although headroom had decreased from 31 December 2016, the recoverable amount was still in excess of the carrying amount. It is evident that market conditions have deteriorated further since this date and Brush is facing some of the most challenging market conditions it has ever experienced.
The recoverable amount of the Energy group of CGUs has been determined based on fair value less costs of disposal, which was higher than value in use. The valuation technique used is an income approach, based on discounted future cash flow projections relevant to a market participant. This methodology includes a risk adjusted assessment of the results of the restructuring plan that was announced on 1 February 2018. It has been assumed that a market participant would also restructure the business based on the economic data in the market and the announcements made by key players in the market.
Key assumptions used in the calculation of recoverable amounts are discount rates, revenue growth, operating margins and long-term growth rates.
Discount ratesThe estimate of fair value less disposal costs was determined using a post-tax discount rate of 10.0%. This discount rate has been risk adjusted to reflect the execution risk inherent in future restructuring plans and hence is higher than would be the case under a non-restructured basis.
Revenue growth Structural changes caused by worldwide environmental policy have triggered a fall in volumes in the gas turbine market of over 60% from its peak in 2011. This in turn has resulted in Brush’s turbogenerator sales falling. The continuing impacts arising from this downturn in the market are a key assumption. In addition the revenue assumptions applied to Switchgear, Transformers and Aftermarket are a key assumption.
Revenue is forecast to increase by a compound annual growth rate of 0.2% over the five year projection period.
Restructuring impact and operating margins Over the five year period, operating margins and EBITDA are anticipated to increase as the impact of the restructuring savings materialise. The timing and quantitative impact of these restructuring benefits is a key assumption.
Long-term growth rates The Energy group of CGUs has five years of cash flows included in their discounted cash flow model. A long-term growth rate into perpetuity has been determined based upon the nominal GDP rates for the countries in which the business operates and the long-term compound annual growth rate estimated by management.
The fair value measurement of the Energy group of CGUs is categorised within Level 3 of the fair value hierarchy set out in IFRS 13: “Fair value measurement”.
Based on the impairment testing completed at year end, an impairment loss of £95.4 million was identified in relation to these assets, and hence goodwill has been written down accordingly. Combined with the £31.1 million write down of assets in Brush China following its closure in November 2017 and the £18.2 million impairment of fixed assets, tested separately on a value in use basis as required by IAS 36 a total impairment charge of £144.7 million is shown in non-underlying items (note 6).
Sensitivity analysisThe Energy group of CGUs has been measured at fair value less costs of disposal, a methodology required by IAS 36: “Impairment of assets”. Following the above impairment, the recoverable amount is equal to the carrying amount and therefore any adverse movement in a key assumption may lead to further impairment.
The discount rate has been risk adjusted to reflect the uncertainty of achieving the cash flows within the forecast. However, for illustration purposes a further 0.1 percentage point increase in the discount rate could result in an impairment of £4.5 million. A further £0.5 million reduction in annual and terminal value operating profit could result in an impairment of £4.9 million. A further 0.1 percentage point decrease in the long-term growth rate could result in an impairment of £3.5 million.
Financials
127
Mel
rose
Ind
ustr
ies
PLC
A
nnua
l Rep
ort 2
017

11. Goodwill and other intangible assets continuedAllocation of significant intangible assetsThe allocation of significant customer relationships, brands and intellectual property is as follows:
Customer relationships Brands and intellectual property
Remaining amortisation period Net book value Remaining amortisation period Net book value
31 December 2017
years
31 December 2016 years
31 December 2017
£m
31 December 2016
£m
31 December 2017
years
31 December 2016 years
31 December 2017
£m
31 December 2016
£m
AQH 13 14 180.2 213.0 14 15 56.1 65.9HVAC 10 11 97.4 117.7 14 15 72.0 84.6SCS 13 14 110.3 130.4 14 15 25.5 30.0Ergotron 9 10 94.7 115.7 17 18 83.5 97.4Brush 1 2 1.5 4.5 11 12 61.0 65.6
484.1 581.3 298.1 343.5
Acquisition of businessesOn 31 August 2016 the Group acquired 100 per cent of the issued share capital and obtained control of Nortek Inc. (“Nortek”) for cash consideration of £1,093.1 million.
Nortek is a leading diversified global manufacturer of innovative air management, security, home automation and ergonomic and productivity solutions (note 5).
The amounts recognised in respect of the identifiable assets and liabilities assumed on the acquisition of Nortek were set out in the 2016 Annual Report. During the year, the Group has completed its review of the assets and liabilities acquired. As a result the Group recorded its final adjustments to the opening balance sheet of Nortek at the half year. In accordance with IFRS 3: “Business combinations” the acquisition Balance Sheet at 31 August 2016 has been restated to reflect this. These adjustments also impacted the Balance Sheet at 31 December 2016 and increased provisions by £3.4 million, deferred tax assets by £0.3 million and other payables by £1.8 million whilst reducing inventory by £1.2 million and deferred tax liabilities by £63.8 million. The corresponding adjustment is to decrease goodwill by £57.7 million. The measurement period was closed at 30 June 2017.
Restated(1)
fair value £m
NortekProperty, plant and equipment 143.3 Intangible assets, computer software and development costs 868.4 Interests in joint ventures 3.0 Inventories 254.5 Trade and other receivables 301.5 Cash and cash equivalents 9.4 Trade and other payables (362.1)Provisions (213.0) Deferred tax (103.4)Retirement benefit obligations (42.2)Current tax (9.4)Interest-bearing loans and borrowings (1,065.9)Net liabilities (215.9)Total consideration 1,093.1 Goodwill 1,309.0 Amounts recycled to goodwill 39.5 Total goodwill 1,348.5 Total consideration satisfied by:Cash consideration 1,093.1
(1) Restated to reflect the completion of the acquisition accounting for Nortek.
Notes to the financial statementsContinued
128M
elro
se In
dus
trie
s P
LC
Ann
ual R
epor
t 201
7

12. Property, plant and equipmentLand and buildings
£m
Plant and equipment
£mTotal
£m
CostAt 1 January 2016 52.8 88.5 141.3Additions 1.6 14.7 16.3Disposals – (0.5) (0.5)Acquisition of businesses 74.3 69.0 143.3Exchange adjustments 10.2 14.7 24.9At 31 December 2016 138.9 186.4 325.3Additions 9.3 39.2 48.5Disposals (2.8) (11.1) (13.9)Transfer to held for sale(1) (12.4) (6.4) (18.8)Exchange adjustments (3.0) (6.1) (9.1)At 31 December 2017 130.0 202.0 332.0Accumulated depreciation and impairment At 1 January 2016 (4.3) (24.1) (28.4)Charge for the year (2.6) (13.3) (15.9)Disposals – 0.2 0.2Impairments(2) (2.2) (0.3) (2.5)Exchange adjustments (2.0) (4.8) (6.8)At 31 December 2016 (11.1) (42.3) (53.4)Charge for the year (5.5) (25.4) (30.9)Disposals 0.3 9.9 10.2 Transfer to held for sale(1) 0.8 2.1 2.9 Impairments(2) (15.6) (28.2) (43.8)Exchange adjustments 0.5 1.4 1.9 At 31 December 2017 (30.6) (82.5) (113.1)Net book valueAt 31 December 2017 99.4 119.5 218.9At 31 December 2016 127.8 144.1 271.9At 1 January 2016 48.5 64.4 112.9
(1) Transferred to assets held for sale at 30 June 2017 in accordance with IFRS 5, subsequently disposed on 10 August 2017.(2) The impairment in 2017 relates to impairments recognised in the Energy segment of £42.3 million and in Nortek central of £1.5 million. The impairment charges in 2016 relate to the closure of the
Nortek head office.
13. Interests in joint ventures31 December
2017 £m
31 December 2016
£m
Aggregated amounts relating to joint ventures:Share of assets 3.1 2.6Share of liabilities (2.7) (2.6)Interests in joint ventures 0.4 –Share of joint venture revenues 3.2 1.9Share of results of joint ventures 0.6 0.9Dividends received from joint ventures (0.6) (0.9)
A list of subsidiaries and significant holdings including the name, country of incorporation and proportion of ownership interest is given in note 3 to the Company’s separate financial statements.
14. Inventories
31 December 2017
£m
Restated(1) 31 December
2016 £m
Raw materials 79.1 74.9Work in progress 54.6 48.4Finished goods 141.7 172.8
275.4 296.1
(1) Restated to reflect the completion of the acquisition accounting for Nortek (note 11).
Financials
129
Mel
rose
Ind
ustr
ies
PLC
A
nnua
l Rep
ort 2
017

14. Inventories continuedIn 2017 the write-down of inventories to net realisable value amounted to £11.8 million (2016: £9.3 million). The reversal of write-downs amounted to £2.7 million (2016: £6.6 million). Write-downs and reversals in both years relate to ongoing assessments of inventory obsolescence, excess inventory holding and inventory resale values across all of the Group’s businesses.
The Directors consider that there is no material difference between the Balance Sheet value of inventories and their replacement cost.
15. Trade and other receivables
Current
31 December 2017
£m
31 December 2016
£m
Trade receivables 312.5 348.4Allowance for doubtful receivables (14.9) (18.3)Other receivables 21.4 15.2Prepayments 13.0 20.5
332.0 365.8
Trade receivables are non interest-bearing. Credit terms offered to customers vary upon the country of operation but are generally between 30 and 90 days.
Non-current
31 December 2017
£m
31 December 2016
£m
Other receivables 1.9 5.2
An allowance has been made for estimated irrecoverable amounts with reference to past default experience and management’s assessment of credit worthiness, an analysis of which is as follows:
Nortek £m
Energy £m
Total £m
At 1 January 2016 – 0.8 0.8 Acquisition of businesses 16.8 – 16.8 Income Statement charge 2.2 0.4 2.6 Utilised (2.6) (0.3) (2.9)Exchange differences 0.9 0.1 1.0At 31 December 2016 17.3 1.0 18.3 Income Statement charge 0.1 0.1 0.2 Utilised (1.2) (0.5) (1.7)Transfer to held for sale (1) (0.7) – (0.7)Exchange differences (1.2) – (1.2)At 31 December 2017 14.3 0.6 14.9
(1) Transferred to assets held for sale at 30 June 2017 in accordance with IFRS 5, subsequently disposed on 10 August 2017.
The concentration of credit risk is limited due to the large number of customers and because they are unrelated to each other. Credit control procedures are implemented to ensure that sales are only made to organisations that are willing and able to pay for them. Such procedures include the establishment and review of customer credit limits and terms. The Group does not hold any collateral or any other credit enhancements over any of its trade receivables nor does it have a legal right of offset against any amounts owed by the Group to the counterparty.
The ageing of impaired trade receivables past due is as follows:
31 December 2017
£m
31 December 2016
£m
0 – 30 days 11.0 8.631 – 60 days 0.1 6.260+ days 3.8 3.5
14.9 18.3
Included in the Group’s trade receivables balance are overdue trade receivables with a carrying amount of £54.5 million (31 December 2016: £62.5 million) against which an appropriate provision of £14.9 million (31 December 2016: £18.3 million) is held.
Notes to the financial statementsContinued
130M
elro
se In
dus
trie
s P
LC
Ann
ual R
epor
t 201
7
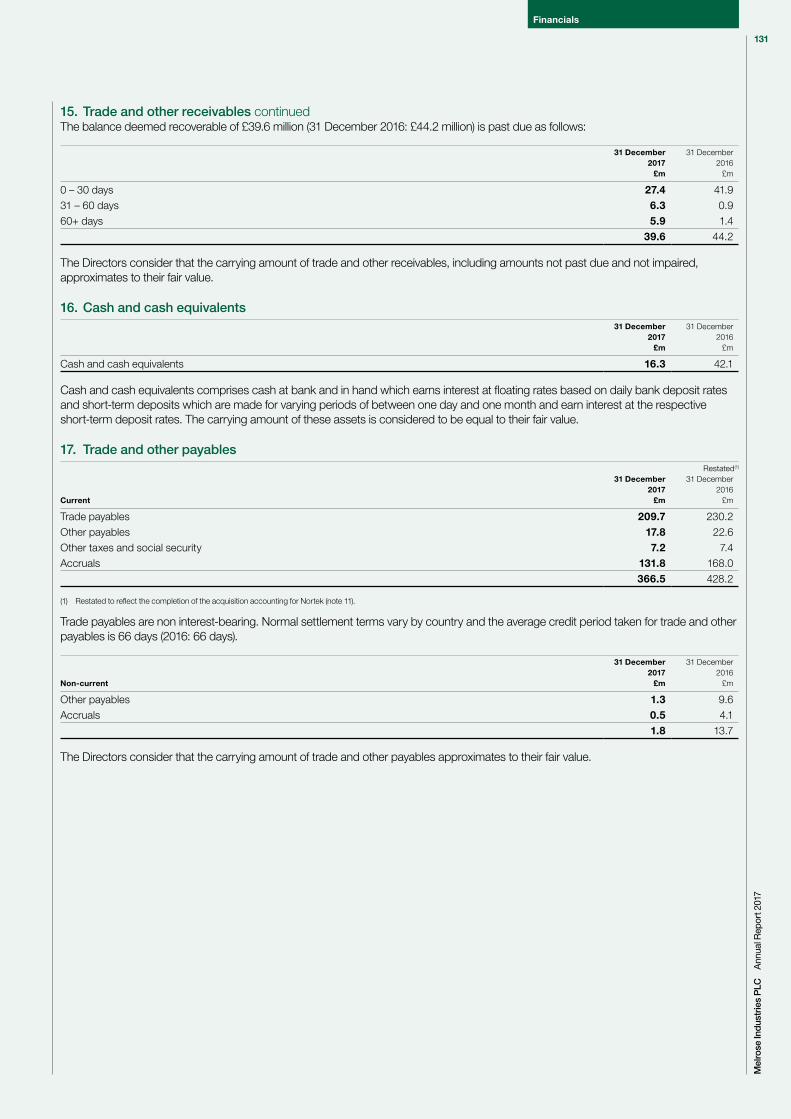
15. Trade and other receivables continuedThe balance deemed recoverable of £39.6 million (31 December 2016: £44.2 million) is past due as follows:
31 December 2017
£m
31 December 2016
£m
0 – 30 days 27.4 41.931 – 60 days 6.3 0.960+ days 5.9 1.4
39.6 44.2
The Directors consider that the carrying amount of trade and other receivables, including amounts not past due and not impaired, approximates to their fair value.
16. Cash and cash equivalents31 December
2017 £m
31 December 2016
£m
Cash and cash equivalents 16.3 42.1
Cash and cash equivalents comprises cash at bank and in hand which earns interest at floating rates based on daily bank deposit rates and short-term deposits which are made for varying periods of between one day and one month and earn interest at the respective short-term deposit rates. The carrying amount of these assets is considered to be equal to their fair value.
17. Trade and other payables
Current
31 December 2017
£m
Restated(1) 31 December
2016 £m
Trade payables 209.7 230.2Other payables 17.8 22.6Other taxes and social security 7.2 7.4Accruals 131.8 168.0
366.5 428.2
(1) Restated to reflect the completion of the acquisition accounting for Nortek (note 11).
Trade payables are non interest-bearing. Normal settlement terms vary by country and the average credit period taken for trade and other payables is 66 days (2016: 66 days).
Non-current
31 December 2017
£m
31 December 2016
£m
Other payables 1.3 9.6Accruals 0.5 4.1
1.8 13.7
The Directors consider that the carrying amount of trade and other payables approximates to their fair value.
Financials
131
Mel
rose
Ind
ustr
ies
PLC
A
nnua
l Rep
ort 2
017
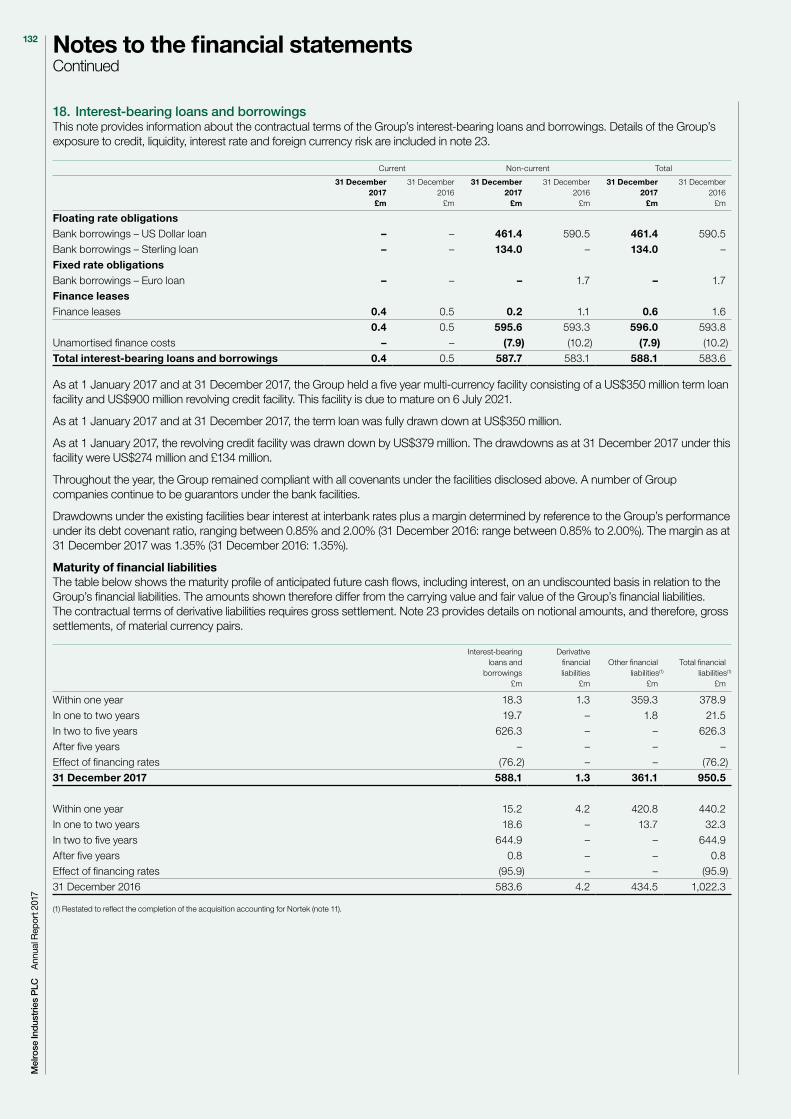
18. Interest-bearing loans and borrowingsThis note provides information about the contractual terms of the Group’s interest-bearing loans and borrowings. Details of the Group’s exposure to credit, liquidity, interest rate and foreign currency risk are included in note 23.
Current Non-current Total
31 December 2017
£m
31 December 2016
£m
31 December 2017
£m
31 December 2016
£m
31 December 2017
£m
31 December 2016
£m
Floating rate obligationsBank borrowings – US Dollar loan – – 461.4 590.5 461.4 590.5Bank borrowings – Sterling loan – – 134.0 – 134.0 –Fixed rate obligationsBank borrowings – Euro loan – – – 1.7 – 1.7 Finance leasesFinance leases 0.4 0.5 0.2 1.1 0.6 1.6
0.4 0.5 595.6 593.3 596.0 593.8Unamortised finance costs – – (7.9) (10.2) (7.9) (10.2)Total interest-bearing loans and borrowings 0.4 0.5 587.7 583.1 588.1 583.6
As at 1 January 2017 and at 31 December 2017, the Group held a five year multi-currency facility consisting of a US$350 million term loan facility and US$900 million revolving credit facility. This facility is due to mature on 6 July 2021.
As at 1 January 2017 and at 31 December 2017, the term loan was fully drawn down at US$350 million.
As at 1 January 2017, the revolving credit facility was drawn down by US$379 million. The drawdowns as at 31 December 2017 under this facility were US$274 million and £134 million.
Throughout the year, the Group remained compliant with all covenants under the facilities disclosed above. A number of Group companies continue to be guarantors under the bank facilities.
Drawdowns under the existing facilities bear interest at interbank rates plus a margin determined by reference to the Group’s performance under its debt covenant ratio, ranging between 0.85% and 2.00% (31 December 2016: range between 0.85% to 2.00%). The margin as at 31 December 2017 was 1.35% (31 December 2016: 1.35%).
Maturity of financial liabilitiesThe table below shows the maturity profile of anticipated future cash flows, including interest, on an undiscounted basis in relation to the Group’s financial liabilities. The amounts shown therefore differ from the carrying value and fair value of the Group’s financial liabilities. The contractual terms of derivative liabilities requires gross settlement. Note 23 provides details on notional amounts, and therefore, gross settlements, of material currency pairs.
Interest-bearing loans and
borrowings £m
Derivative financial liabilities
£m
Other financialliabilities(1)
£m
Total financialliabilities(1)
£m
Within one year 18.3 1.3 359.3 378.9 In one to two years 19.7 – 1.8 21.5 In two to five years 626.3 – – 626.3 After five years – – – –Effect of financing rates (76.2) – – (76.2)31 December 2017 588.1 1.3 361.1 950.5
Within one year 15.2 4.2 420.8 440.2 In one to two years 18.6 – 13.7 32.3 In two to five years 644.9 – – 644.9 After five years 0.8 – – 0.8 Effect of financing rates (95.9) – – (95.9)31 December 2016 583.6 4.2 434.5 1,022.3
(1) Restated to reflect the completion of the acquisition accounting for Nortek (note 11).
Notes to the financial statementsContinued
132M
elro
se In
dus
trie
s P
LC
Ann
ual R
epor
t 201
7

19. ProvisionsSurplus leasehold
property costs
£m
Environmental and legal
costs£m
Warrantyrelated
costs£m
Productliability
£m
Employee related
£mOther
£mTotal
£m
At 1 January 2017 (1) 20.8 66.8 86.9 42.5 8.9 57.1 283.0Utilised (4.2) (18.7) (22.8) (5.7) (34.6) (77.9) (163.9)Net charge to operating profit (2) (2.1) (2.0) 14.2 3.4 35.7 57.5 106.7Transfer from accruals – 1.3 1.6 – – 0.7 3.6Unwind of discount 0.1 0.1 – – – 1.1 1.3Transfer to held for sale (3) – (1.0) (1.0) – – (2.9) (4.9)Exchange differences (1.1) (3.6) (6.0) (3.2) (0.7) (1.4) (16.0)At 31 December 2017 13.5 42.9 72.9 37.0 9.3 34.2 209.8Current 4.6 15.9 33.2 10.5 5.6 22.4 92.2Non-current 8.9 27.0 39.7 26.5 3.7 11.8 117.6
13.5 42.9 72.9 37.0 9.3 34.2 209.8
(1) Restated to reflect the completion of the acquisition accounting for Nortek (note 11).(2) Includes restructuring charges and other non-underlying items of £44.3 million and £62.4 million relating to items charged through underlying operating profit. (3) Transferred to liabilities held for sale at 30 June 2017 in accordance with IFRS 5, subsequently disposed on 10 August 2017.
The provision for surplus leasehold property costs represents the estimated net payments payable over the term of these leases together with any dilapidation costs. This is expected to result in cash expenditure over the next one to seven years.
Environmental and legal costs provisions relate to the estimated remediation costs of pollution, soil and groundwater contamination at certain sites and estimated future costs and settlements in relation to legal claims. Due to their nature, it is not possible to predict precisely when these provisions will be utilised.
The provision for warranty related costs represents the best estimate of the expenditure required to settle the Group’s obligations, based on past experiences. Warranty terms are, on average, between one and five years.
The employee related provision relates to the estimated cost of the Group’s health insurance and workers’ compensation plans. The product liability provision relates to the estimated cost of future product and general liabilities claims. Due to their nature it is not possible to predict precisely when these provisions will be utilised.
Other provisions relate to costs that will be incurred in respect of restructuring programmes, usually resulting in cash spend within one year. In addition other provisions include long-term incentive plans for divisional senior management and the employer tax on equity-settled incentive schemes which are expected to result in cash expenditure over the next five years.
Where appropriate, provisions have been discounted using a discount rate of 3% (31 December 2016: 3%).
20. Deferred taxThe following are the major deferred tax assets and liabilities recognised by the Group and movements thereon during the current and prior reporting period.
Restated(1)
deferred tax assets Restated(1) deferred tax liabilities
Tax losses and other assets
£m
Accelerated capital allowances and
other liabilities £m
Deferred tax on intangible assets
£m
Total deferred tax liabilities
£m
Total net deferred tax
£m
At 1 January 2016 25.7 (6.5) (13.7) (20.2) 5.5 Acquisition of businesses 228.5 – (331.9) (331.9) (103.4)Credit/(charge) to income 22.8 (2.3) 12.8 10.5 33.3 Credit/(charge) to equity 4.8 (2.7) – (2.7) 2.1 Exchange differences 5.0 (0.2) (22.6) (22.8) (17.8)Set off of assets and liabilities(2) (237.2) – 237.2 237.2 –Net amount at 31 December 2016 49.6 (11.7) (118.2) (129.9) (80.3)(Charge)/credit to income (107.5) (4.9) 129.4 124.5 17.0 Credit to equity 30.1 1.5 – 1.5 31.6 Exchange differences (16.3) (0.1) 28.3 28.2 11.9 Movement in set off of assets and liabilities(2) 93.4 2.7 (96.1) (93.4) –Net amount at 31 December 2017 49.3 (12.5) (56.6) (69.1) (19.8)
(1) Restated to reflect the impact of Nortek acquisition accounting (note 11). (2) Set off of deferred tax assets and liabilities in accordance with IAS 12 within the Nortek US Federal tax group.
Financials
133
Mel
rose
Ind
ustr
ies
PLC
A
nnua
l Rep
ort 2
017

20. Deferred tax continuedAs at 31 December 2017, the Group had gross unused federal and corporate losses of £497.3 million (31 December 2016: £274.4 million) available for offset against future profits. At 31 December 2017, a £62.4 million deferred tax asset (31 December 2016: £34.9 million) in respect of £346.0 million (31 December 2016: £169.1 million) of these gross losses was recognised in the Balance Sheet. No asset was recognised in respect of the remaining losses due to the divisional and geographic split of anticipated future profit streams. The majority of these losses may be carried forward indefinitely subject to certain continuity of business requirements. In addition a deferred tax asset has been recognised on certain federal tax credits and state tax losses with a net tax value of £32.8 million (2016: £31.8 million).
A net deferred tax asset of £3.9 million (31 December 2016: £5.5 million) was recognised in respect of Group retirement benefit obligations and a deferred tax asset of £94.0 million (31 December 2016: £214.6 million) was recognised in relation to other temporary differences.
Deferred tax liabilities of £197.7 million (31 December 2016: £355.4 million) were recognised in respect of intangible assets and a net deferred tax liability of £15.2 million (31 December 2016: £11.7 million) was recognised in respect of accelerated capital allowances and other temporary differences.
In accordance with IAS 12, £143.8 million (31 December 2016: £237.2 million) of deferred tax assets and liabilities have been set off within these financial statements, £135.5 million (31 December 2016: £237.2 million) in respect of the Nortek US Federal Group and £8.3 million (31 December 2016: £nil) in respect of the UK entities of Melrose.
As at 31 December 2017, the aggregate amount of temporary differences associated with undistributed earnings of subsidiaries was £187.9 million (31 December 2016: £187.5 million) on which a deferred tax liability of £3.0 million has been recognised (31 December 2016: £33.8 million). There are no further liabilities associated with the distribution of these earnings as a result of the new US tax legislation.
21. Share-based paymentsMelrose Incentive PlanOn 31 May 2017 the Incentive Plan (2012) crystallised as expected. Prior to crystallisation the Remuneration Committee determined that 23,494 of the 50,000 options held in respect of the Incentive Plan (2012) should be withheld by the Company in exchange for an equivalently valued £115.5 million cash payment being sufficient to allow the holders of the options to meet their income tax and employee national insurance liabilities in respect of the Incentive Plan (2012).
In respect of the remaining 26,506 options that were not withheld, these were exercised on 30 May 2017 in exchange for 26,506 Incentive Shares (2012), which were issued on 31 May 2017 and converted to 54,453,914 Melrose ordinary shares at that date. As a result the total number of ordinary shares in the Company increased from 1,886,746,589 shares to 1,941,200,503 shares.
On 11 May 2017, at a Melrose General Meeting, shareholders voted in favour of a new share-based Incentive Plan (2017), on the same economic principles as the previous Incentive Plan (2012), except that:
(i) the total duration of the replacement plan is five years, split between a three-year performance period (after which it will crystallise and the next incentive plan will be established) and a further two-year holding period;
(ii) instead of a single lump sum allocated on commencement, allocations of interests in the new Incentive Plan (2017) will be phased in three annual tranches throughout the performance period; and
(iii) executive Directors will be subject to malus provisions during the performance period and to clawback provisions for the duration of the subsequent holding period.
At the start of the Incentive Plan (2017) the first tranche of 16,542 options were granted. For accounting purposes the IFRS 2 charge has been calculated as if all three tranches have been granted on day one because of a common expectation, established at that date, between employees and the Company that the remaining options will be allocated annually in two more equal tranches over the three year performance period.
The estimated value of the Incentive Shares (2017) at 31 December 2017 was £nil. Using a Black Scholes option pricing model, the projected value of this plan at 31 May 2020 will be £24.5 million.
The annual IFRS 2 charge to be recognised in respect of the Incentive Plan (2017) has been established at £13.3 million. The inputs into the Black Scholes valuation model that were used to fair value the plan at the point of establishment in May 2017 were as follows:
Valuation assumptions
Weighted average share price £2.41Weighted average exercise price £2.77Expected volatility 27%Expected life as at inception 3.05 yearsRisk free interest 0.2%
Expected volatility was determined by calculating the historical volatility of the Company’s share price.
The Group recognised an IFRS 2 charge of £10.1 million (2016: £4.0 million) in the year ended 31 December 2017. £8.4 million (2016: £nil) was in respect of the 2017 Melrose Incentive Plan and £1.7 million (2016: £4.0 million) was in respect of the 2012 Melrose Incentive Plan.
During the year, 12,831 of the Incentive Plan (2017) options were converted to Incentive Shares (2017) with a nominal value of £1 each. The number of Incentive Plan (2017) options in issue at 31 December 2017 is therefore 37,169 (31 December 2016: 50,000 Incentive Plan (2012) options).
Notes to the financial statementsContinued
134M
elro
se In
dus
trie
s P
LC
Ann
ual R
epor
t 201
7

22. Retirement benefit obligationsDefined contribution plansThe Group operates defined contribution plans for qualifying employees across several jurisdictions. The assets of the plans are held separately from those of the Group in funds under the control of trustees.
The total costs charged in relation to the continuing businesses during the year of £7.2 million (2016: £5.9 million) represents contributions payable to these plans by the Group at rates specified in the rules of the plans.
Defined benefit plansThe Group sponsors defined benefit plans for qualifying employees of certain subsidiaries. The funded defined benefit plans are administered by a separate fund that is legally separated from the Group. The trustees of the funds are required by law to act in the interest of the fund and of all relevant stakeholders in the plans. The trustees of the pension funds are responsible for the investment policy with regard to the assets of the fund.
The most significant defined benefit pension plans in the Group at 31 December 2017 were:
• The Brush Group (2013) (Brush UK) Pension Plan, which is defined benefit in type and is a funded plan. The plan is closed to new members and the accrual of future benefits for existing members.
• The Brush Aftermarket North America, Inc. (FKI US) Group Pension Plan, which is defined benefit in type and is a funded plan. The plan is closed to new members and the accrual of future benefits for existing members.
• The Nortek, Inc. (Nortek US) Retirement Plan, which is defined benefit in type and is a funded plan. The plan is closed to new members and the accrual of future benefits to existing members.
Other plans include a number of funded and unfunded defined benefit arrangements in the US and Europe.
The cost of the Group’s defined benefit plans are determined in accordance with IAS 19 (revised): “Employee benefits” using the advice of independent professionally qualified actuaries on the basis of formal actuarial valuations and using the projected unit credit method. In line with normal practice, these valuations are undertaken triennially in the UK and annually in the US.
The valuation of the Brush UK Pension Plan was based on a full actuarial valuation as of 31 December 2016, updated at 31 December 2017 by independent actuaries. The FKI US Pension Plan valuation was based on a full actuarial valuation as of 31 December 2016, updated at 31 December 2017 by independent actuaries. The Nortek US Pension Plan valuation was based on a full actuarial valuation as of 1 January 2017, updated at 31 December 2017 by independent actuaries.
The Group contributed £4.2 million (2016: £10.5 million) to the defined benefit pension plans in the year ended 31 December 2017.
In total, the Group expects to contribute approximately £3.2 million to its defined benefit plans in the year ending 31 December 2018.
Actuarial assumptionsThe major assumptions used by the actuaries in calculating the Group’s pension liabilities are as set out below:
31 December 2017 31 December 2016
UK Plans % p.a.
US Plans % p.a.
UK Plans % p.a.
US Plans % p.a.
Rate of increase in salaries n/a n/a n/a n/aRate of increase in pensions in payment 3.2 n/a 3.3 n/aDiscount rate 2.5 3.4 2.7 3.9RPI inflation assumption 3.2 n/a 3.3 n/aCPI inflation assumption 2.1 n/a 2.2 n/a
MortalityBrush UK Pension PlanMortality assumptions for the Brush UK Pension Plan, as at 31 December 2017 were based on the Self Administered Pension Scheme (SAPS) “S2” base tables with a scaling factor of 110%, which reflected the results of a mortality analysis carried out on the plan’s membership. Future improvements are in line with the Continuous Mortality Investigation (CMI) improvement model with a long-term rate of improvement of 1.25% p.a. for both males and females.
The assumptions were that a member currently aged 65 will live on average for a further 21.4 years (31 December 2016: 21.4 years) if they are male and for a further 23.3 years (31 December 2016: 23.6 years) if they are female. For a member who retires in 2037 at age 65, the assumptions were that they will live for a further 22.8 years (31 December 2016: 22.8 years) after retirement if they are male and for a further 24.8 years (31 December 2016: 25.1 years) after retirement if they are female.
The mortality assumptions were consistent with those adopted for the full valuation as at 31 December 2016.
Financials
135
Mel
rose
Ind
ustr
ies
PLC
A
nnua
l Rep
ort 2
017

22. Retirement benefit obligations continuedFKI US Pension PlanThe mortality assumptions adopted as at 31 December 2017 were set to reflect the Group’s best estimate view of life expectancies of members of the pension arrangement. Each assumption reflected the characteristics of the membership of the FKI US Pension Plan.
The assumptions were that a member currently aged 65 will live on average for a further 19.3 years (31 December 2016: 19.9 years) if they are male and for a further 21.3 years (31 December 2016: 21.9 years) if they are female. For a member who retires in 2037 at age 65, the assumptions were that they will live for a further 21.0 years (31 December 2016: 21.5 years) after retirement if they are male and for a further 22.9 years (31 December 2016: 23.5 years) after retirement if they are female.
The mortality assumptions were consistent with those adopted for the full valuation as at 31 December 2016.
Nortek US Pension Plan The mortality assumptions adopted as at 31 December 2017 were set to reflect the Group’s best estimate view of life expectancies of members of the pension arrangement. Each assumption reflected the characteristics of the membership of the Nortek US Pension Plan.
The assumptions were that a member currently aged 65 will live on average for a further 19.3 years (31 December 2016: 20.2 years) if they are male and for a further 21.3 years (31 December 2016: 22.3 years) if they are female. For a member who retires in 2037 at age 65, the assumptions were that they will live for a further 21.0 years (31 December 2016: 21.8 years) after retirement if they are male and for a further 22.9 years (31 December 2016: 23.9 years) after retirement if they are female.
The mortality assumptions were consistent with those adopted for the full valuation as at 1 January 2017.
Balance Sheet disclosuresThe amount recognised in the Balance Sheet arising from net liabilities in respect of defined benefit plans was as follows:
31 December 2017
£m
31 December 2016
£m
Present value of funded defined benefit obligations (537.6) (549.1)Fair value of plan assets 524.7 522.6 Funded status (12.9) (26.5)Present value of unfunded defined benefit obligations (4.7) (6.9)Net liabilities (17.6) (33.4)
The plan liabilities and assets at 31 December 2017 were as follows:
UK Plans £m
US Plans £m
Other Plans £m
Total £m
Plan liabilities (288.5) (252.6) (1.2) (542.3)Plan assets 283.0 241.1 0.6 524.7 Net liabilities (5.5) (11.5) (0.6) (17.6)
The major categories and fair values of plan assets at the end of the reporting period for each category were as follows:
31 December 2017
£m
31 December 2016
£m
Equities 230.8 152.4Government bonds 138.3 107.1Corporate bonds 114.0 155.0Property 9.8 6.7Other 31.8 101.4(1)
Total 524.7 522.6
(1) At 31 December 2016, £73.6 million of assets in relation to the Nortek US Plan were held in cash as they were in the process of being transferred to a new plan custodian.
The assets were well diversified and the majority of plan assets had quoted prices in active markets. All government bonds were issued by reputable governments and were generally AA rated or higher. Interest rate and inflation rate swaps were also employed to complement the role of fixed and index-linked bond holdings for liability risk management.
The trustees continually review whether the chosen investment strategy is appropriate with a view to providing the pension benefits and to ensure appropriate matching of risk and return profiles. The main strategic policies included maintaining an appropriate asset mix, managing interest rate sensitivity and maintaining an appropriate equity buffer. Investment results were regularly reviewed.
There was no self investment (other than in relevant tracker funds) either in the Group’s own financial instruments or property or other assets used by the Group.
Notes to the financial statementsContinued
136M
elro
se In
dus
trie
s P
LC
Ann
ual R
epor
t 201
7

22. Retirement benefit obligations continuedMovements in the present value of defined benefit obligations during the year:
Year ended 31 December
2017 £m
Year ended 31 December
2016 £m
At beginning of year 556.0 360.7 Acquisition of businesses – 136.3 Transfer to held for sale(1) (1.3) –Current service cost 0.2 0.1 Interest cost on obligations 17.2 15.4 Remeasurement gains – demographic (5.8) (6.1)Remeasurement losses – financial 23.7 42.1 Remeasurement losses/(gains) – experience 10.2 (2.8)Benefits paid out of plan assets (32.6) (26.6)Benefits paid out of Group assets for unfunded plans (1.0) (0.5)Currency translation differences (24.3) 37.4 At end of year 542.3 556.0
(1) Transferred to liabilities held for sale at 30 June 2017 in accordance with IFRS 5, subsequently disposed on 10 August 2017.
The defined benefit plan liabilities were 2% (31 December 2016: 2%) in respect of active plan participants, 47% (31 December 2016: 53%) in respect of deferred plan participants and 51% (31 December 2016: 45%) in respect of pensioners.
The weighted average duration of the defined benefit plan liabilities at 31 December 2017 was 14.8 years (31 December 2016: 14.4 years).
Movements in the fair value of plan assets during the year:
Year ended 31 December
2017 £m
Year ended 31 December
2016 £m
At beginning of year 522.6 343.5Acquisition of businesses – 94.1Interest income on plan assets 16.1 14.5Return on plan assets, excluding interest income 40.2 55.9Contributions 3.2 10.0Benefits paid out of plan assets (32.6) (26.6)Plan administrative costs (2.3) (1.9)Currency translation differences (22.5) 33.1At end of year 524.7 522.6
The actual return on plan assets was a gain of £56.3 million (2016: £70.4 million).
Income Statement disclosuresAmounts recognised in the Income Statement in respect of these defined benefit plans were as follows:
Continuing operations
Year ended 31 December
2017 £m
Year ended 31 December
2016 £m
Included within underlying operating profit:– current service cost 0.2 0.1– plan administrative costs 2.3 1.9Included within net finance costs:– interest cost on defined benefit obligations 17.2 15.4– interest income on plan assets (16.1) (14.5)
Financials
137
Mel
rose
Ind
ustr
ies
PLC
A
nnua
l Rep
ort 2
017

22. Retirement benefit obligations continuedStatement of Comprehensive Income disclosuresAmounts recognised in the Statement of Comprehensive Income in respect of these defined benefit plans were as follows:
Year ended 31 December
2017 £m
Year ended 31 December
2016 £m
Return on plan assets, excluding amounts included in net interest expense 40.2 55.9Actuarial gains arising from changes in demographic assumptions 5.8 6.1Actuarial losses arising from changes in financial assumptions (23.7) (42.1)Actuarial (losses)/gains arising from experience adjustments (10.2) 2.8Net remeasurement gain on retirement benefit obligations 12.1 22.7
Risks and sensitivities The defined benefit plans expose the Group to actuarial risks, such as longevity risk, currency risk, salary risk, interest rate risk and market (investment) risk. The Group is not exposed to any unusual, entity specific or plan specific risks.
A sensitivity analysis on the principal assumptions used to measure the plan liabilities at the year end was as follows:
Change in assumption
Decrease/(increase) to
plan liabilities £m
Increase/(decrease) to
profit before tax £m
Discount rate Increase by 0.10% 7.5 0.2Decrease by 0.10% (8.0) (0.2)
Inflation assumption (1) Increase by 0.10% (3.0) n/aDecrease by 0.10% 3.2 n/a
Assumed life expectancy at age 65 (rate of mortality) Increase by 1 year (18.3) n/aDecrease by 1 year 18.3 n/a
(1) The inflation sensitivity encompasses the impact on pension increases, where applicable.
The sensitivity analysis above was determined based on reasonable possible changes to the respective assumptions, while holding all other assumptions constant. There has been no change in the methods and assumptions used in preparing the sensitivity analysis from prior years.
The sensitivities were based on the relevant assumptions and membership profile as at 31 December 2017 and were applied to the obligations at the end of the reporting period. Whilst the analysis does not take account of the full distribution of cash flows expected, it does provide an approximation to the sensitivity of the assumptions shown. Extrapolation of these results beyond the sensitivity figures shown may not be appropriate and the sensitivity analysis presented may not be representative of the actual change in the defined benefit obligation as it is unlikely that the change in assumptions would occur in isolation of one another as some of the assumptions may be correlated.
Notes to the financial statementsContinued
138M
elro
se In
dus
trie
s P
LC
Ann
ual R
epor
t 201
7

23. Financial instruments and risk managementThe table below sets out the Group’s accounting classification of each category of financial assets and liabilities and their fair values at 31 December 2017 and 31 December 2016:
Nortek £m
Energy £m
Central £m
Total £m
31 December 2017Financial assets Classified as loans and receivables: Cash and cash equivalents – – 16.3 16.3 Net trade receivables 240.9 56.7 – 297.6 Other receivables 15.9 7.4 – 23.3 Classified as fair value:Derivative financial assets 1.3 1.2 11.5 14.0 Financial liabilitiesClassified as amortised cost:Interest-bearing loans and borrowings (0.6) – (587.5) (588.1)Other financial liabilities (304.2) (45.9) (11.0) (361.1)Classified as fair value:Derivative financial liabilities (1.0) (0.3) – (1.3)31 December 2016Financial assetsClassified as loans and receivables: Cash and cash equivalents – – 42.1 42.1Net trade receivables 259.7 70.2 0.2 330.1Other receivables 15.5 4.9 – 20.4 Classified as fair value:Derivative financial assets 1.0 0.9 7.1 9.0Financial liabilitiesClassified as amortised cost: Interest-bearing loans and borrowings (3.3) – (580.3) (583.6)Other financial liabilities(1) (359.4) (55.4) (19.7) (434.5)Classified as fair value:Derivative financial liabilities (1.5) (1.7) (1.0) (4.2)
(1) Restated to reflect the completion of the acquisition accounting for Nortek (note 11).
Credit riskThe Group considers its maximum exposure to credit risk was as follows:
Nortek £m
Energy £m
Central £m
Total £m
31 December 2017Financial assetsCash and cash equivalents – – 16.3 16.3Net trade receivables 240.9 56.7 – 297.6Other receivables 15.9 7.4 – 23.3Derivative financial assets 1.3 1.2 11.5 14.031 December 2016Financial assetsCash and cash equivalents – – 42.1 42.1Net trade receivables 259.7 70.2 0.2 330.1Other receivables 15.5 4.9 – 20.4Derivative financial assets 1.0 0.9 7.1 9.0
The Group’s principal financial assets were cash and cash equivalents, trade receivables, other receivables and derivative financial assets which represented the Group’s maximum exposure to credit risk in relation to financial assets.
The Group’s credit risk on cash and cash equivalents and derivative financial assets was limited because the counterparties were banks with strong credit ratings assigned by international credit rating agencies. The Group’s credit risk was primarily attributable to its trade receivables. The amounts presented in the Consolidated Balance Sheet were net of allowances for doubtful receivables, estimated by the Group’s management based on prior experience and their assessment of the current economic environment. Note 15 provides further details regarding the recovery of trade receivables.
Financials
139
Mel
rose
Ind
ustr
ies
PLC
A
nnua
l Rep
ort 2
017

23. Financial instruments and risk management continuedCapital riskThe Group manages its capital to ensure that entities in the Group will be able to continue as a going concern.
The capital structure of the Group as at 31 December 2017 consists of net debt, which includes the borrowings disclosed in note 18, after deducting cash and cash equivalents and equity attributable to equity holders of the parent, comprising Issued share capital, Reserves and Retained earnings as disclosed in the Consolidated Statement of Changes in Equity.
Liquidity riskThe Melrose Group’s net debt position at 31 December 2017 was £571.8 million (31 December 2016: £541.5 million).
Melrose has a five year multi-currency US $1.25 billion committed bank facility which was entered into on 6 July 2016 to assist with the acquisition of Nortek and consists of a US $350 million term loan facility and a US $900 million revolving credit facility.
The facility has two financial covenants. There is a net debt to underlying EBITDA (underlying operating profit before depreciation and amortisation) covenant and an interest cover covenant, both of which are tested half yearly, each June and December.
The first of these covenants is set at a maximum 3.5x leverage for each of the half yearly measurement dates for the remainder of the term of the facility. For the year ended 31 December 2017 it was approximately 1.9x (31 December 2016: 1.9x), showing significant headroom compared to the covenant test.
The interest cover covenant is set at 4.0x or higher throughout the life of the facility and was 19.6x at 31 December 2017 (31 December 2016: 20.7x), affording comfortable headroom compared to the covenant test.
At 31 December 2017 the term loan was fully drawn down and the revolving credit facility was drawn down by US $455 million, split US $274 million and £134 million. The core currency of Nortek is US $, and debt is drawn down to protect the Melrose Group as efficiently as possible from currency fluctuations on net assets and profit.
In addition, there are a number of uncommitted overdraft, guarantee and borrowing facilities made available to the Melrose Group. These uncommitted facilities have been lightly used.
Cash, deposits and marketable securities amounted to £16.3 million at 31 December 2017 (31 December 2016: £42.1 million) and are offset against gross debt of £588.1 million (31 December 2016: £583.6 million) to arrive at the net debt position of £571.8 million (31 December 2016: £541.5 million). The combination of this cash and the size of the bank facility allows the Directors to consider that the Melrose Group has sufficient access to liquidity for its current needs.
The Board takes careful consideration of counterparty risk with banks when deciding where to place Melrose’s cash on deposit.
Fair valuesThe Directors consider that the financial assets and liabilities have fair values not materially different to the carrying values.
Foreign exchange contractsAs at 31 December 2017, the Group held foreign exchange forward contracts to mitigate expected exchange rate fluctuations on cash flows on sales to customers and purchases from suppliers. These instruments operate as cash flow hedges unless the amounts involved are small. The terms of the currency pairs with total principals in excess of Sterling £1.0 million equivalent were as follows:
31 December 2017 Selling currency
millions
31 December 2017 Average hedged
rate
31 December 2016 Selling currency
millions
31 December 2016 Average hedged
rate
Sell Australian Dollar/Buy Sterling AUD 1.9 GBP/AUD 1.73 AUD 6.1 GBP/AUD 1.74Sell Canadian Dollar/Buy US Dollar CAD 21.1 USD/CAD 1.29 CAD 19.7 USD/CAD 1.32Sell Euro/Buy Czech Koruna EUR 28.8 EUR/CZK 26.08 EUR 31.3 EUR/CZK 26.89Sell Euro/Buy Polish Zloty – – EUR 1.2 EUR/PLN 4.33Sell Euro/Buy Sterling EUR 19.3 GBP/EUR 1.11 EUR 14.4 GBP/EUR 1.17Sell Euro/Buy US Dollar EUR 8.7 EUR/USD 1.18 EUR 12.6 EUR/USD 1.13Sell Sterling/Buy Czech Koruna GBP 1.4 GBP/CZK 28.79 GBP 3.8 GBP/CZK 31.95Sell Sterling/Buy Euro GBP 9.9 GBP/EUR 1.13 GBP 15.3 GBP/EUR 1.16Sell Sterling/Buy US Dollar GBP 6.5 GBP/USD 1.31 GBP 5.0 GBP/USD 1.26Sell US Dollar/Buy Canadian Dollar USD 32.7 USD/CAD 1.30 USD 22.6 USD/CAD 1.32Sell US Dollar/Buy Chinese Renminbi USD 165.5 USD/CNY 6.76 USD 142.3 USD/CNY 7.10Sell US Dollar/Buy Euro – – USD 2.7 EUR/USD 1.12Sell US Dollar/Buy Mexican Peso USD 14.6 USD/MXN 19.37 USD 14.7 USD/MXN 19.69Sell US Dollar/Buy Polish Zloty – – USD 1.7 USD/PLN 3.87Sell US Dollar/Buy Sterling USD 15.3 GBP/USD 1.31 USD 15.0 GBP/USD 1.34
The foreign exchange contracts all mature between January 2018 and January 2019.
The fair value of the contracts at 31 December 2017 was a net asset of £4.5 million (31 December 2016: net liability of £2.3 million).
Notes to the financial statementsContinued
140M
elro
se In
dus
trie
s P
LC
Ann
ual R
epor
t 201
7

23. Financial instruments and risk management continuedHedge of net investments in foreign entitiesIncluded in interest-bearing loans at 31 December 2017 were the following amounts which were designated as hedges of net investments in the Group’s subsidiaries in the USA and were being used to reduce the exposure to the foreign exchange risks.
Borrowings in local currency designated as hedges of net investments:
31 December 2017
£m
31 December 2016
£m
US Dollar 461.4 590.5
Interest rate risk managementThe Melrose bank facility carries a cost of LIBOR plus a margin.
The Melrose Group holds interest rate swap arrangements to fix the cost of LIBOR. The profile of the interest rate swaps has been designed to hedge, on average, 70% of the interest exposure on the projected gross debt as it reduces over the five year term. Under the terms of these swap arrangements, the Melrose Group will pay a weighted average fixed cost of 1.0% up to 31 December 2019, and 0.9% until the remaining swaps terminate on 6 July 2021.
The margin depends on the Melrose Group leverage, and ranges from 0.85% to 2.00%; as at 31 December 2017 the margin was 1.35% (31 December 2016: 1.35%). The interest on the swaps is payable annually in arrears on 1 July. The bank margin is payable monthly.
The interest swaps are designated as cash flow hedges and were highly effective throughout 2017. The fair value of the contracts at 31 December 2017 was an asset of £8.2 million (31 December 2016: £7.1 million).
Interest rate sensitivity analysisAssuming the net debt held as at the Balance Sheet date was outstanding for the whole year, a one percentage point rise in market interest rates for all currencies would increase/(decrease) profit before tax by the following amounts:
Year ended 31 December
2017 £m
Year ended 31 December
2016 £m
Sterling (0.4) (0.1)US Dollar (1.4) (1.4)
Foreign currency riskThe Melrose Group trades in various countries around the world and is exposed to many different foreign currencies. The Melrose Group therefore carries an exchange rate risk that can be categorised into three types, transaction, translation and disposal related risk. The Board policy is designed to protect against the majority of the cash risks but not the non-cash risks.
The most common exchange rate risk is the transaction risk the Group takes when it invoices a sale in a different currency to the one in which its cost of sale is incurred. This is addressed by taking out forward cover against approximately 60% to 80% of the anticipated cash flows over the following twelve months, placed on a rolling quarterly basis and for 100% of each material contract. This does not eliminate the cash risk but does bring some certainty to it.
Foreign currency sensitivity analysisCurrency risks are defined by IFRS 7: “Financial instruments: Disclosures” as the risk that the fair value or future cash flows of a financial asset or liability will fluctuate because of changes in foreign exchange rates.
The following table details the transactional impact of hypothetical changes in foreign exchange rates on financial assets and liabilities at the Balance Sheet date, illustrating the increase/(decrease) in Group operating profit caused by a 10 per cent strengthening of the US Dollar, Euro and Chinese Renminbi against Sterling compared to the year end spot rate. The analysis assumes that all other variables, in particular other foreign currency exchange rates, remain constant. The Group operates in a range of different currencies, and those with a notable impact are noted here:
Year ended 31 December
2017 £m
Year ended 31 December
2016 £m
US Dollar (2.1) (7.4)Euro 0.5 0.6 Chinese Renminbi (1.8) (1.3)
The relatively high sensitivity on the US Dollar in 2016 was due to a currency swap for £55.0 million, that was put in place ahead of the prior year end, to swap excess Sterling cash in order to temporarily reduce the US Dollar debt. Adjusting for the currency swap, the sensitivity on the US Dollar at 31 December 2016 would be a loss of £1.3 million. This currency swap matured in 2017.
The following table details the impact of hypothetical changes in foreign exchange rates on financial assets and liabilities at the Balance Sheet date, illustrating the increase/(decrease) in Group equity caused by a 10 per cent strengthening of the US Dollar, Euro and Chinese Renminbi against Sterling. The analysis assumes that all other variables, in particular other foreign currency exchange rates, remain constant.
Financials
141
Mel
rose
Ind
ustr
ies
PLC
A
nnua
l Rep
ort 2
017

23. Financial instruments and risk management continued31 December
2017 £m
31 December 2016
£m
US Dollar 10.2 12.1Euro (1.6) (1.6)Chinese Renminbi 7.7 8.8
In addition, the change in equity due to a 10 per cent strengthening of the US Dollar against Sterling for the translation of net investment hedging instruments would be a decrease of £51.3 million (31 December 2016: decrease £65.6 million). However, there would be no overall effect on equity because there would be an offset in the currency translation of the foreign operation.
Fair value measurements recognised in the Balance Sheet Foreign currency forward contracts are measured using quoted forward exchange rates and yield curves derived from quoted interest rates matching the maturities of the contracts.
Interest rate swap contracts are measured using yield curves derived from quoted interest rates.
The following table sets out the Group’s assets and liabilities that are measured and recognised at fair value:
Recurring fair value measurements
31 December 2017
Current £m
31 December 2017
Non-current £m
31 December 2017 Total
£m
31 December 2016
Current £m
31 December 2016
Non-current £m
31 December 2016 Total
£m
Derivative financial assetsForeign currency forward contracts 5.8 – 5.8 1.9 – 1.9Interest rate swaps 4.1 4.1 8.2 1.9 5.2 7.1Total recurring financial assets 9.9 4.1 14.0 3.8 5.2 9.0Derivative financial liabilitiesForeign currency forward contracts (1.3) – (1.3) (4.2) – (4.2)Total recurring financial liabilities (1.3) – (1.3) (4.2) – (4.2)
The fair value of these financial instruments are derived from inputs other than quoted prices that are observable for the asset or liability, either directly (i.e. as prices) or indirectly (i.e. derived from prices) and they are therefore categorised within Level 2 of the fair value hierarchy set out in IFRS 13: “Fair value measurement”. The Group’s policy is to recognise transfers into and out of the different fair value hierarchy levels at the date the event or change in circumstances that caused the transfer to occur. There have been no transfers between levels in the year.
24. Issued capital and reserves
Share Capital
31 December 2017
£m
31 December 2016
£m
Allotted, called-up and fully paid 1,941,200,503 (31 December 2016: 1,886,746,589) ordinary shares of 48/7p each (31 December 2016: 48/7p each) 133.1 129.412,831 (31 December 2016: nil) 2017 Melrose Incentive Plan Shares of £1 each – –
133.1 129.4
The rights of each class of share are described in the Directors’ Report.
On 1 June 2017 the number of ordinary shares in issue increased by 54,453,914 following the crystallisation of the Incentive Plan (2012) which increased the number of ordinary shares in issue from 1,886,746,589 to 1,941,200,503.
During the course of the year, 12,831 of the Incentive Plan (2017) options issued to the Directors and senior management were exercised and resulted in the creation of 12,831 of Incentive Shares (2017) with a nominal value of £1 each.
Translation reserve The Translation reserve contains exchange differences on the translation of subsidiaries with a functional currency other than Sterling and exchange gains or losses on the translation of liabilities that hedge the Company’s net investment in foreign subsidiaries.
Hedging reserveThe Hedging reserve represents the cumulative fair value gains and losses on derivative financial instruments for which cash flow hedge accounting has been applied.
Merger reserve and Other reservesThe Merger reserve represents the excess of fair value over nominal value of shares issued in consideration for the acquisition of subsidiaries. Other reserves comprise accumulated adjustments in respect of Group reconstructions.
Notes to the financial statementsContinued
142M
elro
se In
dus
trie
s P
LC
Ann
ual R
epor
t 201
7

25. Cash flow statement
Note
Year ended31 December
2017£m
Year ended31 December
2016£m
Reconciliation of underlying operating profit to cash generated by continuing operationsUnderlying operating profit 6 278.4 104.1Adjustments for:Depreciation of property, plant and equipment 30.9 15.9Amortisation of computer software and development costs 3.8 2.2Restructuring costs paid and movements in provisions (73.4) (37.6)Defined benefit pension contributions paid (4.2) (10.5)(Increase)/decrease in inventories (8.1) 15.0Decrease in receivables 8.1 22.5Decrease in payables (16.1) (9.3)Acquisition costs (7.6) (41.3)Tax paid (15.9) (5.9)Interest paid (15.6) (4.5)Incentive scheme tax related payments (147.9) –Net cash from operating activities 32.4 50.6
Net debt reconciliation
31 December2016
£mCash flow
£m
Other non-cash
movements £m
Foreign exchange difference
£m
31 December 2017
£m
Bank borrowings (582.0) (56.0) (0.9) 51.4 (587.5)Finance leases (1.6) 1.0 – – (0.6)Gross debt (583.6) (55.0) (0.9) 51.4 (588.1)Cash 42.1 (23.0) – (2.8) 16.3Net debt (541.5) (78.0) (0.9) 48.6 (571.8)
Net debt is presented in the closing Balance Sheet at year end exchange rates. For bank covenant testing purposes net debt is converted using average exchange rates for the year, which increases net debt at 31 December 2017 by £22.8 million (31 December 2016: decreases net debt by £51.1 million) to £594.6 million (31 December 2016: £490.4 million).
26. Commitments and contingenciesFuture total minimum rentals payable under non-cancellable operating leases were as follows:
31 December 2017
£m
31 December 2016
£m
Amounts payable:Within one year 17.8 21.9After one year but within five years 47.8 55.1Over five years 30.9 24.0
96.5 101.0
The Group leases properties, plant, machinery and vehicles for operational purposes. Property leases vary in length. Plant, machinery and vehicle leases typically run for periods of up to five years.
Capital commitmentsAt 31 December 2017, there were commitments of £9.4 million (31 December 2016: £2.4 million) relating to the acquisition of new plant and machinery.
27. Related partiesTransactions between the Company and its subsidiaries, which are related parties, have been eliminated on consolidation and are not disclosed in this note.
The Group did not enter into any significant transactions in the ordinary course of business with joint ventures during the current or prior year.
Sales to and purchases from Group companies are priced on an arm’s length basis and generally are settled on 30 day terms.
Financials
143
Mel
rose
Ind
ustr
ies
PLC
A
nnua
l Rep
ort 2
017

27. Related parties continuedRemuneration of key management personnelThe remuneration of the Directors, who are the key management personnel of the Group, is set out below in aggregate for each of the categories specified in IAS 24: “Related party disclosures”. Further information about the remuneration of individual Directors is provided in the audited part of the Directors’ Remuneration Report on page 84.
Year ended 31 December
2017 £m
Year ended 31 December
2016 £m
Short-term employee benefits 3.2 3.2Share-based payments 6.6 2.7
9.8 5.9
In addition, the 2012 Incentive Plan crystallised during the year and gains attributable to the Directors amounted to £167.1 million (2016: £nil).
28. Post Balance Sheet eventsOn 17 January 2018 the Melrose Group announced the terms of a firm offer to acquire the entire issued share capital of GKN plc and on 1 February 2018 issued a public offer document containing the full terms and conditions of the offer.
In conjunction with this offer, the Company entered into a senior term and revolving credit facilities agreement with Lloyds Bank plc and Royal Bank of Canada as original lenders which is subject to the acquisition taking place. The new facilities agreement provides for term facilities and revolving credit facilities in an aggregate principal amount up to £2.6 billion, US $2.0 billion and €0.5 billion. The maturity of the facilities ranges from three years and six months to five years, after the date of the agreement of the new facility.
On 1 February 2018 Melrose announced that Brush had commenced consultations with employees in relation to restructuring its Turbogenerator business to reflect the reduced levels of activity. These reduced levels have been caused by worldwide environmental policy which has triggered a fall in volumes in the gas turbine market of over 60% from its peak in 2011. This in turn has resulted in Brush’s turbogenerator sales falling.
This restructuring involves the intended closure of the turbogenerator production facility at Ridderkerk, Netherlands and the transfer of its 4-pole turbogenerator production to the facility in Plzen , Czech Republic, while the factory in Changshu, China has already been closed. In the UK, Brush has entered into consultation with its workforce about the future of 2-pole turbogenerator production at the Loughborough, UK facility, which accounts for approximately half the workforce at the site. The 520-strong workforce employed at Brush’s other UK sites in the transformers, switchgear and mobile generator businesses remain unaffected.
The cash cost of these restructuring items is estimated to be £40 million and is expected to be materially complete by the end of 2018.
29. Contingent liabilitiesAs a result of acquisitions made by the Group, certain contingent legal and warranty liabilities were identified as part of the fair value review of the acquisition Balance Sheet. Whilst it is difficult to reasonably estimate the timing and ultimate outcome of these claims, the Directors’ best estimate has been included in the Balance Sheet where they existed at the time of acquisition and hence were recognised in accordance with IFRS 3: “Business combinations”. Where a provision has been recognised, information regarding the different categories of such liabilities and the amount and timing of outflows is included within note 19.
Given the nature of the Group’s business many of the Group’s products have a large installed base, and any recalls or reworks related to such products could be particularly costly. The costs of product recalls or reworks are not always covered by insurance. Recalls or reworks may have a material adverse effect on the Group’s financial condition, results of operations and cash flows.
The Group has contingent liabilities representing guarantees and contract bonds given in the ordinary course of business on behalf of trading subsidiaries. No losses are anticipated to arise on these contingent liabilities. The Group does not have any other significant contingent liabilities.
Notes to the financial statementsContinued
144M
elro
se In
dus
trie
s P
LC
Ann
ual R
epor
t 201
7

Company Balance Sheet for Melrose Industries PLC
Notes
31 December 2017
£m
31 December 2016
£m
Fixed assetsInvestment in subsidiaries 3 2,213.4 2,209.9
Debtors:Amounts falling due within one year 4 – 14.1Amounts falling due after one year 4 25.4 –
Creditors: amounts falling due within one year 5 (192.6) (1.0)Net current (liabilities)/assets (167.2) 13.1Total assets less current liabilities 2,046.2 2,223.0Provisions 6 (0.3) (12.8)Net assets 2,045.9 2,210.2Capital and reserves Issued share capital 7 133.1 129.4Share premium account 1,492.6 1,492.6Merger reserve 108.7 112.4Retained earnings 311.5 475.8Shareholders’ funds 2,045.9 2,210.2
The Company reported a loss for the financial year ended 31 December 2017 of £21.3 million (2016: profit of £224.0 million).
The financial statements were approved by the Board of Directors on 20 February 2018 and were signed on its behalf by:
Geoffrey Martin Simon PeckhamGroup Finance Director Chief Executive20 February 2018 20 February 2018
Registered number: 09800044
Company Statement of Changes in EquityIssued share
capital £m
Share premium account
£m
Merger reserve
£m
Retained earnings
£mTotal equity
£m
At 1 January 2016 10.0 – 2,500.9 253.6 2,764.5 Profit for the year (note 2) – – – 224.0 224.0Total comprehensive income – – – 224.0 224.0Return of Capital – – (2,388.5) – (2,388.5)Dividends paid – – – (5.8) (5.8)Issue of share capital 119.4 1,492.6 – – 1,612.0Credit to equity for equity-settled share-based payments – – – 4.0 4.0At 31 December 2016 129.4 1,492.6 112.4 475.8 2,210.2 Loss for the year (note 2) – – – (21.3) (21.3)Total comprehensive expense – – – (21.3) (21.3)Incentive scheme related(1) 3.7 – (3.7) (115.5) (115.5)Dividends paid – – – (63.0) (63.0)Credit to equity for equity-settled share-based payments – – – 10.1 10.1Deferred tax on share-based payment transactions – – – 25.4 25.4At 31 December 2017 133.1 1,492.6 108.7 311.5 2,045.9
(1) On 31 May 2017, the Incentive Plan (2012) crystallised. Of the 50,000 options in issue, 23,494 were withheld by the Company in exchange for a cash payment sufficient to allow holders to meet their income tax and employee national insurance liabilities in respect of the Incentive Plan (2012). This resulted in 23,494 options being exercised for £115.5 million in cash and being paid to the tax authorities on behalf of the option holders. The remaining 26,506 options were converted into 54,453,914 ordinary shares of 48/7 pence each and resulted in a £3.7 million increase to Issued share capital and an equivalent reduction to the Merger reserve.
Financials
145
Mel
rose
Ind
ustr
ies
PLC
A
nnua
l Rep
ort 2
017

Notes to the Company Balance Sheet
1. Significant accounting policiesBasis of accountingMelrose Industries PLC (the Company) is a company incorporated in the United Kingdom under the Companies Act. The address of the registered office is given on the back cover. The nature of the Group’s operations and its principal activities are set out in the Strategic Report on pages 2 to 57.
The financial statements have been prepared under the historical cost convention and in accordance with Financial Reporting Standard 102 (FRS 102) issued by the Financial Reporting Council.
The functional currency of Melrose Industries PLC is considered to be pounds Sterling because that is the currency of the primary economic environment in which the Company operates.
Melrose Industries PLC meets the definition of a qualifying entity under FRS 102 and has therefore taken advantage of the disclosure exemptions available to it in respect of its separate financial statements. Melrose Industries PLC is consolidated in its Group financial statements. Exemptions have been taken in these separate Company financial statements in relation to share-based payments, presentation of a cash flow statement, the remuneration of key management personnel and financial instruments.
The principal accounting policies are consistent with the prior period and are summarised below.
Going concernThe Directors have, at the time of approving the financial statements, a reasonable expectation that the Company has adequate resources to continue in operational existence for the foreseeable future. Thus they continue to adopt the going concern basis of accounting in preparing the financial statements. Further detail is contained in the Directors’ statement of going concern on page 40 of the Finance Director’s review.
InvestmentsInvestments in subsidiaries are measured at cost less impairment.
For investments in subsidiaries acquired for consideration including the issue of shares qualifying for merger relief, cost is measured by reference to the nominal value of the shares issued plus fair value of other consideration. Any premium is ignored.
Impairment of assetsAssets are assessed for indicators of impairment at each balance sheet date. If there is objective evidence of impairment, an impairment loss is recognised in profit or loss as described below.
Non-financial assetsAn asset is impaired where there is objective evidence that, as a result of one or more events that occurred after initial recognition, the estimated recoverable value of the asset has been reduced. The recoverable amount of an asset is the higher of its fair value less costs to sell and its value in use.
Where indicators exist for a decrease in impairment loss, the prior impairment loss is tested to determine reversal. An impairment loss is reversed on an individual impaired asset to the extent that the revised recoverable value does not lead to a revised carrying amount higher than the carrying value had no impairment been recognised.
Financial instrumentsFinancial assets and financial liabilities are recognised when the Company becomes a party to the contractual provisions of the instrument. Financial liabilities are classified according to the substance of the contractual arrangements entered into.
Financial assets and liabilitiesAll financial assets and liabilities are initially measured at transaction price (including transaction costs).
Financial assets and liabilities are only offset in the Balance Sheet when, and only when there exists a legally enforceable right to set off the recognised amounts and the Company intends either to settle on a net basis, or to realise the asset and settle the liability simultaneously.
Financial assets are derecognised when and only when a) the contractual rights to the cash flows from the financial asset expire or are settled, b) the Company transfers to another party substantially all of the risks and rewards of ownership of the financial asset, or c) the Company, despite having retained some, but not all, significant risks and rewards of ownership, has transferred control of the asset to another party.
Financial liabilities are derecognised only when the obligation specified in the contract is discharged, cancelled or expires.
146M
elro
se In
dus
trie
s P
LC
Ann
ual R
epor
t 201
7

1. Significant accounting policies continuedShare-based paymentsThe Company issues equity-settled share-based payments to certain employees. The required disclosures are included in the Group consolidated financial statements.
Equity-settled share-based payments are measured at fair value (excluding the effect of non-market based vesting conditions) at the date of grant. The fair value determined at the grant date of the equity-settled share-based payments is expensed on a straight-line basis over the vesting period, based on the Company’s estimate of the shares that will eventually vest and adjusted for the effect of non-market based vesting conditions.
Fair value is measured by use of the Black Scholes pricing model. The expected life used in the model has been adjusted, based on the Directors’ best estimate, for the effects of non-transferability, exercise restrictions, and behavioural considerations.
Where equity-settled share-based payments are made available to employees of the Company’s subsidiaries, these are treated as increases in equity over the vesting period of the award with a corresponding increase in the Company’s investment in subsidiaries.
TaxationCurrent tax, including UK corporation tax and foreign tax, is provided at amounts expected to be paid (or recovered) using the tax rates and laws that have been enacted or substantively enacted by the Balance Sheet date.
Deferred tax is recognised in respect of all timing differences that have originated but not reversed at the Balance Sheet date where transactions or events that result in an obligation to pay more tax in the future or a right to pay less tax in the future have occurred at the Balance Sheet date. Timing differences are differences between the Company’s taxable profits and its results as stated in the financial statements that arise from the inclusion of gains and losses in tax assessments in periods different from those in which they are recognised in the financial statements.
ProvisionsProvisions are recognised when the Company has a present obligation (legal or constructive) as a result of a past event, it is probable that an outflow of resources embodying economic benefits will be required to settle the obligation and a reliable estimate can be made of the amount of the obligation. If the effect of the time value of money is material, provisions are determined by discounting the expected future cash flows at a rate that reflects the current market assessment of the time value of money and, where appropriate, the risks specific to the liability. Where discounting is used, the increase in the provision due to the passage of time is recognised as a finance cost.
Critical accounting judgements and key sources of estimation uncertaintyThere were no critical accounting judgements that would have a significant effect on the amounts recognised in the parent Company financial statements or key sources of estimation uncertainty at the Balance Sheet date that would have a significant risk of causing a material adjustment to the carrying amounts of assets and liabilities within the next financial year.
2. Loss for the year As permitted by section 408 of the Companies Act 2006, the Company has elected not to present its own Profit and Loss Account for the year. Melrose Industries PLC reported a loss for the financial year ended 31 December 2017 of £21.3 million (2016: profit of £224.0 million).
The auditor’s remuneration for audit services to the Company is disclosed in note 7 to the Group consolidated financial statements.
Directors’ remuneration is disclosed in the Directors’ Remuneration Report on pages 80 to 90. There were no other employees of the Company in the year.
3. Investment in subsidiaries£m
At 1 January 2017 2,209.9Additions 3.5At 31 December 2017 2,213.4
During the year, the Company increased its investment in Melrose Holdings Limited by £3.5 million, all of which related to equity-settled share-based payments that were made available to employees of subsidiaries.
Financials
147
Mel
rose
Ind
ustr
ies
PLC
A
nnua
l Rep
ort 2
017

Equity interest %
ArgentinaCorrientes Avenue 311, 7, Capital Federal, 1043Nordyne Argentina SRL 100Australia 2 Fawley Avenue, Narangba, Queensland, 4504 Bristol Meci Australasia Pty Limited 100Hawker Siddeley Switchgear Pty Limited 100U 2 11-21 Forge St, Blacktown, New South Wales, 2148 Nortek Australia Pty Limited 100Belgium Jean en Maurits Sabbestraat 130A/A000, 8930 Menen Nortek Global HVAC Belgium NV 100Brazil Rod. Br 101 Norte, Serra Pelada, Espirito Santo,
29161-901Nordyne do Brasil Distribuidora de Ar Condicionado Ltda 100British Virgin IslandsWickhams Cay 1, P.O. Box 3140, Road Town, TortolaNortek Trading Limited 100CanadaEdmonton, Alberta, T5J 3N6 Brush Canada Services Inc./Services Brush Canada Inc. 1001 Germain Street, Suite 1500, Saint John,
New Brunswick, E2L 4H82GIG Technologies Canada, Inc. 1001140 Tristar Drive, Mississauga Ontario, L5T 1H9Broan-NuTone Canada ULC 1001300 – 1969 Upper Water Street, Purdy’s Wharf Tower II,
Halifax Nova Scotia, B3J 2VIErgotron Canada Corporation 100605 Rue Rocheleau, Drummondville, Quebec, J2C 6L8Innergy Tech, Inc. 1001502D Quebec Avenue, Saskatoon, Saskatchewan,
S7K 1V7Nortek Air Solutions Canada, Inc. 1009100 Rue du Parcours, Montreal, Quebec, H1J 2Z1Nortek Air Solutions Quebec, Inc. 100550 Lemire Boulevard, Drummondville, Quebec,
J2C 7W9Venmar Ventilation ULC 100China8 Changhong Road, Changshu Economic Development
Zone, Jiangsu Province, 215500Brush Electrical Machines (Changshu) Co. Limited 100Building 2 558 Taibo Road, Anting Town, Jiading
District. Shanghai 201814FKI Engineering Shanghai Limited 100Zone 6, Daxin Jituan, Chenjiang Town, Huicheng
District, Guangdong, 516229Guangdong Broan IAQ Systems Co. Limited 100The 3rd Industry Area, Juzhou Shijie, Dongguan,
GuangdongDongguan Ergotron Precision Technology Co Limited 100Dongguan Ergotron Precision Technology Design Services
Co Limited 100172 Hangcheng Avenue, Baoan District, Shenzhen Shi,
Guangdong Sheng, 518126Linear Electronics (Shenzhen) Co Limited 100
Equity interest %
Room 28D2, 895 Yan’an West Road, Changning District, Shanghai
Nortek (Shanghai) Trading Co Limited 100Colombia 1301, 13/F Bank of America Tower, 12 Harcourt Road,
Central MiOS Colombia 42Czech RepublicEdvarda Beneše 564/39, Doudlevce, 301 00 Plzen Brush SEM s.r.o. 100France44 Rue du Louvre, 75001 Paris Ergotron France SARL 100Z.I. de Rosarge, 230, rue de la Dombes, Les Echets,
01706 Miribel Cedex, LyonNortek Global HVAC France SAS 100GermanyTeichhorn 4-6, 24119, KronshagenErgotron Deutschland GmbH 100Hong Kong 28/F Bank of East Asia Harbour View Centre,
56 Gloucester Road, Wanchai Broan-NuTone (HK) Limited 1006 Sun Yip Street, 19/F Honour Industrial Centre,
Chai WanLinear HK Manufacturing Limited 1001301 13/F Bank of America Tower, 12 Harcourt Road,
Central MiOS Hong Kong 42MiOS Limited 42JapanShiroyama Trust Tower, 4-3-1, Toranomon, Minatuo-ku,
Tokyo Ergotron Japan KK 100MaltaMarsa Industrial Estate, Marsa, MRS 3000Mediterranean Power Electric Company Limited 26Mexico Avenue de los Olivos 100-A, Parque Industrial El Pajio,
Tecata, Baja California, 21438Broan Building Products-Mexico S de RL de CV 100Vicente Guerrero 2822, Anáhuac, 64500 San Nicolas de
los Graza, Nuevo Leon Miller de Mexico S de RL de CV 100Nortek Global HVAC de Mexico SA de RL de CV 100RomaniaBulevardul Poitiers, Las iMiOS Romania SRL 42Saudi ArabiaP.O.Box 2091, Riyadh 11451 Huntair Arabia 49The NetherlandsBeeldschermweg 3, 3821 AH AmersfoortErgotron Nederland BV 100Ringdijk 390B, 2983 GS, Postbus 3007, 2980 DA,
RidderkerkBrush HMA BV 100
3. Investment in subsidiaries continued The following subsidiaries and significant holdings were owned by the Company as at 31 December 2017:
Notes to the Company Balance SheetContinued
148M
elro
se In
dus
trie
s P
LC
Ann
ual R
epor
t 201
7

Equity interest %
Strawinskylaan 3127 8e Verdiepin, Amsterdam, Noord-Holland, 1077 ZX
CES Holding BV 100Nortek Holding BV 100Nortek International Holdings BV 100United Kingdom11th Floor, The Colmore Building, 20 Colmore Circus
Queensway, Birmingham, B4 6ATAlcester Capricorn 100Alcester EP1 Limited 100Alcester Number 1 Limited 100Ambi-Rad Group Limited 100Brush Electrical Engineering Company Limited 100Brush Electrical Machines Limited 100Brush Holdings Limited 100Brush Properties Limited 100Brush Scheme Trustees Limited 100Brush Switchgear Limited 100Brush Transformers Limited 100Colmore Lifting Limited 100Colmore Overseas Holdings Limited 100Danks Holdings Limited 100Eachairn Aerospace Holdings Limited 100Eaton-Williams (Millbank) Limited 100Eaton-Williams Exports Limited 100Eaton-Williams Group Limited 100Eaton-Williams Holdings Limited 100Eaton-Williams Limited 100Eaton-Williams Products Limited 100Eaton-Williams Service Limited 100Edenaire Limited 100Electro Dynamic Limited 100Ergotron UK Limited 100FKI Plan Trustees Limited 100Harrington Generators International Limited 100Hawker Siddeley Switchgear Limited 100McKechnie 2005 Pension Scheme Trustee Limited 100Melrose Holdings Limited 100Melrose Intermediate Limited 100Melrose PLC 100Melrose UK 4 Limited 100Melrose UK Holdings Limited 100Melrose USD 1 Limited 100Nortek (UK) Limited 100Nortek Global HVAC (UK) Limited 100Precision Air Control Limited 100Precision House Management Services Limited 100Reznor (UK) Limited 100Sageford UK Limited 100Vapac Humidity Control Limited 100Whipp & Bourne Limited 100
Equity interest %
USA601 Braddock Avenue, Turtle Creek, Pittsburgh,
Pennsylvania, 15145Brush Aftermarket North America Inc. 100Generator and Motor Services of Pennsylvania, LLC 100421 West Main Street, Franklin, Frankfort, Kentucky,
40601Barcom Asia Holdings, LLC 1002711 Centerville Road, Suite 400, New Castle,
Wilmington, DelawareBNSS LP, Inc. 100926 West State Street, Hartford, Wisconsin, 53027Broan-NuTone, LLC 1001800 South McDowell Boulevard, Petaluma, California,
94954Core Brands, LLC 1001181 Trapp Road, Eagan, Minnesota, 55121Ergotron, Inc. 1003121 Hartsfield Road, Tallahassee, Florida, 32303GTO Access Systems, LLC 10019855 South West 124th Avenue, Tualatin, Oregon,
97062Huntair Middle East Holdings, Inc. 1002077 Convention Center Concourse, Suite 175, Atlanta,
Georgia, 30337Linear HK, LLC 100Melrose North America, Inc. 100Neveda Holdco Corp 100Nortek Distribution Services, LLC 100Nortek Global HVAC de Puerto Rico, LLC 100Nortek Global HVAC, Latin America, Inc. 100Nortek Home Control Holdings, LLC 100Nortek, Inc. 100Nortek International, Inc. 100Nortek Shared Services, LLC 1001950 Camino Vida Roble, Suite 150, Carlsbad,
California, 92008Nortek Security & Control, LLC 1002547 Three Mile Road, Grand Rapids, MichiganOperator Speciality Company, Inc. 1002277 Harbor Bay Parkway, Alameda, California, 94502Zephyr Ventilation, LLC 1008000 Phoenix Parkway, O’Fallon, Missouri, 63368Nortek Air Solutions, LLC 100Nortek Global HVAC, LLC 100
Each of the subsidiaries listed are included in the consolidated financial statements of the Company and are held in each case by a subsidiary undertaking, except for Melrose Holdings Limited which is held directly by Melrose Industries PLC.
3. Investment in subsidiaries continued
Financials
149
Mel
rose
Ind
ustr
ies
PLC
A
nnua
l Rep
ort 2
017

4. Debtors 31 December
2017 £m
31 December 2016
£m
Amounts falling due within one year:Amounts owed by Group undertakings – 14.1Amounts falling due after one year: Deferred tax 25.4 –
25.4 14.1
Amounts owed by Group undertakings are either interest-bearing or non interest-bearing depending on the type and duration of the receivable relationship.
The Directors consider that amounts owed by Group undertakings approximate to their fair value.
The deferred tax included in the Balance Sheet is as follows:
31 December 2017
£m
31 December 2016
£m
Tax losses available for carry forward 25.3 –Other timing differences 0.1 –
25.4 –
The tax losses may be carried forward indefinitely.
£m
At 1 January 2017 –Amount credited to equity 25.4At 31 December 2017 25.4
5. Creditors31 December
2017 £m
31 December 2016
£m
Amounts falling due within one year:Amounts owed to Group undertakings 191.6 –Accruals and other payables 1.0 1.0
192.6 1.0
Amounts owed to Group undertakings are repayable on demand and are either interest-bearing or non interest-bearing depending on the type and duration of the payable relationship.
The Directors consider that amounts owed to Group undertakings approximate to their fair value.
6. Provisions Incentive
plan related £m
Total £m
At 1 January 2017 12.8 12.8Charge to profit and loss account 11.4 11.4Utilised (23.9) (23.9)At 31 December 2017 0.3 0.3
The provision for Incentive Plan (2017) related costs relates to employer national insurance costs which are expected to be incurred when the Incentive Plan (2017) matures. Further details of the plan are set out in the Directors’ Remuneration Report. The costs are expected to be incurred within three years.
Notes to the Company Balance SheetContinued
150M
elro
se In
dus
trie
s P
LC
Ann
ual R
epor
t 201
7

7. Issued share capital
Share Capital
31 December 2017
£m
31 December 2016
£m
Allotted, called-up and fully paid 1,941,200,503 (31 December 2016: 1,886,746,589) ordinary shares of 48/7p each (31 December 2016: 48/7p each) 133.1 129.412,831 (31 December 2016: nil) Incentive Shares (2017) of £1 each – –
133.1 129.4
The rights of each class of share are described in the Directors’ Report.
On 1 June 2017 the number of ordinary shares in issue increased by 54,453,914 following the crystallisation of the Incentive Plan (2012)which increased the number of ordinary shares in issue from 1,886,746,589 to 1,941,200,503.
During the course of the year, 12,831 of the Incentive Plan (2017) options issued to the Directors and senior management were exercised and resulted in the creation of 12,831 of Incentive Shares (2017) with a nominal value of £1 each.
8. Related party transactionsThe Company has taken the exemption in FRS 102.33: “Related party information” not to disclose intercompany balances and transactions in the year with fully owned subsidiary undertakings.
Financials
151
Mel
rose
Ind
ustr
ies
PLC
A
nnua
l Rep
ort 2
017

Glossary
Alternative Performance Measures (APMs)In response to the Guidelines on APMs issued by the European Securities and Markets Authority (ESMA), additional information is provided on the APMs used by the Group below.
In the reporting of financial information, the Group uses certain measures that are not required under IFRS. These additional measures (commonly referred to as Alternative Performance Measures) provide additional information on the performance of the business and trends to shareholders. These measures are consistent with those used internally, and are considered critical to understanding the financial performance and financial health of the Group. APMs are considered to be a key measure to monitor how the businesses are performing because this provides a more meaningful comparison of how the business is managed and measured on a day-to-day basis and achieves consistency and comparability between reporting periods.
These alternative performance measures may not be directly comparable with similarly titled profit measures reported by other companies and they are not intended to be a substitute for, or superior to, IFRS measures.
Income Statement Measures
APM Proforma revenue and proforma revenue growth
Closest equivalent statutory measure
Revenue and movement in revenue per the Income Statement.
Reconciling items to statutory measure
Full year impact of acquisitions, revenue from exited sales channels and translational currency impacts.
Definition and purpose
The year-on-year change in revenue from sales that are continuing, retranslating the current year revenue at the average actual periodic exchange rates used in the prior year.
This measure includes the full year impact of businesses acquired and excludes the impact of exited sales channels from both years to provide a more direct comparative of year-on-year performance.
This measure is presented as a means of eliminating the effects of exchange rate fluctuations, acquisitions and business closures on the year-on-year reported results.
Group – Revenue2017 £m
2016 £m %
Statutory 2,092.2 889.3Full year impact of acquisitions – 1,187.3Exited sales channels (28.8) (108.4)Impact of foreign exchange (100.0) –Proforma revenue at
constant currency 1,963.4 1,968.2 flat
Nortek – Revenue2017 £m
2016 £m %
Statutory (note 5) 1,873.2 642.9Full year impact of acquisitions – 1,187.3Exited sales channels (28.8) (108.4)Impact of foreign exchange (92.5) –Proforma revenue at
constant currency 1,751.9 1,721.8 +2%
Brush – Revenue2017
£m2016 £m %
Statutory (note 5) 219.0 246.4Impact of foreign exchange (7.5) –Proforma revenue at
constant currency 211.5 246.4 -14%
APM Non-underlying items
Closest equivalent statutory measure
None.
Reconciling items to statutory measure
See note 6.
Definition and purpose
Those items which the Group excludes from its underlying profit metrics in order to present a further measure of the Group’s performance.
Underlying profit/(loss) excludes items which are significant in size or volatility or by nature are non-trading or non-recurring, and excludes any item released to the Income Statement that was previously a fair value item booked on acquisition.
The Board consider the underlying results to be a key measure to monitor how the businesses are performing because this provides a more meaningful comparison of how the business is managed and measured on a day-to-day basis and achieves consistency and comparability between reporting periods.
The underlying measures are used to partly determine the variable element of remuneration of senior management throughout the Group and are also in alignment with performance measures used by certain external stakeholders. The underlying measures are also one measure used to value individual businesses as part of the “Buy, Improve and Sell” Melrose strategy model.
APM Underlying operating profit/(loss)
Closest equivalent statutory measure
Operating profit/(loss) (1).
Reconciling items to statutory measure
Non-underlying items (note 6).
Definition and purpose
Profit before the impact of non-underlying items, finance costs, finance income and tax.
As discussed above, the Group uses underlying profit measures to provide a useful and more comparable measure of the ongoing performance of the Group. These are adjusted from statutory measures to remove non-underlying items, the nature of which are disclosed above.
152M
elro
se In
dus
trie
s P
LC
Ann
ual R
epor
t 201
7

Income Statement Measures continued
APM Underlying operating margin
Closest equivalent statutory measure
Operating margin (2).
Reconciling items to statutory measure
Non-underlying items (note 6).
Definition and purpose
Underlying operating profit as a percentage of revenue.
APM Proforma underlying operating profit growth
Closest equivalent statutory measure
Movement in operating profit/(loss) (1) per the Income Statement.
Reconciling items to statutory measure
Non-underlying items (note 6) full year impact of acquisitions and translational currency impacts.
Definition and purpose
The year-on-year change in underlying operating profit including the full year impact of acquisitions, retranslating the current year underlying operating profit at the average actual periodic exchange rates used in the prior year.
This measure is presented as a means of eliminating the effects of exchange rate fluctuations and acquisitions on the year-on-year reported results.
To aid comparability, the full year impact of acquisitions includes an additional charge of £7.6 million for divisional long-term incentive plans in 2016 as if Nortek were owned for the full year.
Group – Underlying operating profit 2017 £m
2016 £m %
As reported 278.4 104.1Full year impact of acquisitions – 83.9Impact of foreign exchange (15.1) –At constant currency 263.3 188.0 +40%
Nortek – Underlying operating profit 2017 £m
2016 £m %
As reported (note 5) 284.3 86.3Full year impact of acquisitions – 91.5Impact of foreign exchange (14.5) –At constant currency 269.8 177.8 (a) +52%(a) Translated at an average GBP:USD exchange rate of 1.3554 equates to $241.0 million.
Nortek – Underlying operating profit 2017 £m
2015 £m %
As reported (note 5) 284.3 –Full year impact of acquisitions – 144.0 Impact of foreign exchange (43.6) –At constant currency 240.7 144.0 (a) +67%(a) Translated at an average GBP:USD exchange rate of 1.5284 equates to $220.1 million.
Brush – Underlying operating profit2017
£m2016 £m %
As reported (note 5) 17.5 32.0Impact of foreign exchange (0.6) –At constant currency 16.9 32.0 -47%
APM Underlying EBITDA
Closest equivalent statutory measure
None.
Reconciling items to statutory measure
Not applicable.
Definition and purpose
Underlying operating profit before depreciation and impairment of property, plant and equipment and before the amortisation and impairment of computer software and development costs.
Underlying EBITDA is one measure used to value individual businesses as part of the “Buy, Improve and Sell” Melrose strategy model and by certain external stakeholders to measure performance.
Underlying EBITDA 2017 £m
2016 £m
Underlying operating profit 278.4 104.1Depreciation 30.9 15.9Amortisation 3.8 2.2Underlying EBITDA 313.1 122.2
APM Underlying profit/(loss) before tax
Closest equivalent statutory measure
Profit/(loss) before tax.
Reconciling items to statutory measure
Non-underlying items (note 6).
Definition and purpose
Profit before the impact of non-underlying items and tax.
As discussed above, the Group uses underlying profit measures to provide a useful and more comparable measure of the ongoing performance of the Group. These are adjusted from statutory measures to remove non-underlying items, the nature of which are disclosed above.
APM Underlying profit/(loss) after tax
Closest equivalent statutory measure
Profit/(loss) after tax.
Reconciling items to statutory measure
Non-underlying items (note 6).
Definition and purpose
Profit after tax attributable to owners of the parent and before the impact of non-underlying items.
As discussed above, the Group uses underlying profit measures to provide a useful and more comparable measure of the ongoing performance of the Group. These are adjusted from statutory measures to remove non-underlying items as well as non-underlying tax and the tax effects of non-underlying items, the nature of which are disclosed above.
(1) Operating profit/(loss) is not defined within IFRS but is a widely accepted profit measure being profit/(loss) before finance costs, finance income and tax.
(2) Operating margin is not defined within IFRS but is a widely accepted profit measure being derived from operating profit/(loss)(1) divided by revenue.
Financials
153
Mel
rose
Ind
ustr
ies
PLC
A
nnua
l Rep
ort 2
017

Income Statement Measures continued
APM Underlying Income Statement tax rate
Closest equivalent statutory measure
Effective tax rate.
Reconciling items to statutory measure
Non-underlying items, non-underlying tax and the tax impact of non-underlying items (note 6).
Definition and purpose
The income tax charge for the Group excluding non-underlying tax and the tax impact of non-underlying items divided by underlying profit before tax.
This measure is a useful indicator of the ongoing tax rate for the Group.
Underlying Income Statement tax rate2017 £m
2016 £m
Tax credit per Income Statement 3.7 30.3 Non-underlying tax (26.4) (10.4)Tax impact of non-underlying items (44.1) (45.9)Underlying tax charge (66.8) (26.0)Underlying profit before tax 257.7 96.4Underlying Income Statement tax rate 25.9% 27.0%
APM Underlying diluted earnings per share
Closest equivalent statutory measure
Diluted earnings per share.
Reconciling items to statutory measure
Non-underlying items (note 6).
Definition and purpose
Profit after tax attributable to owners of the parent and before the impact of non-underlying items, divided by the weighted average number of ordinary shares in issue during the financial year adjusted for the effects of any potentially dilutive options.
The Board considers this to be a key measure of performance.
APM
Proforma underlying diluted earnings per share and proforma underlying diluted earnings per share growth
Closest equivalent statutory measure
Diluted earnings per share.
Reconciling items to statutory measure
Full year impact of acquisitions, non-underlying items (note 6) and translational currency impacts.
Definition and purpose
Underlying diluted earnings per share adjusted to include the full year impact of businesses acquired and, for growth purposes, translational currency impacts.
This measure uses the proforma underlying operating profit, described above, and to aid comparability, this measure also makes allowance for the same net finance costs, effective tax rate and number of shares in both periods to aid comparability.
Proforma underlying diluted earnings per share2017 £m
2017 constant currency
£m2016 £m
Proforma underlying operating profit 278.4 263.3 188.0 Finance costs (proforma) (20.7) (20.7) (20.7)Tax (proforma) (66.8) (62.8) (43.3)Underlying proforma profit after tax 190.9 179.8 124.0Number of shares (million) 1,941.2 1,941.2 1,941.2Proforma underlying diluted
earnings per share 9.8p 9.3p 6.4p
Proforma underlying diluted earnings per share growth of 45% at constant currency, and 54% using actual average exchange rates for both years.
APM Interest cover
Closest equivalent statutory measure
None.
Reconciling items to statutory measure
Not applicable.
Definition and purpose
Underlying EBITDA as a multiple of net interest payable on bank loans and overdrafts.
This measure is used for bank covenant testing.
Balance Sheet Measures
APM Net debt
Closest equivalent statutory measure
Cash and cash equivalents less interest-bearing loans and borrowings.
Reconciling items to statutory measure
Reconciliation of net debt (note 25).
Definition and purpose
Net debt comprises total borrowings (interest-bearing loans and finance leases) and cash and cash equivalents.
Net debt is one measure that could be used to indicate the strength of the Group’s Balance Sheet position and is a useful measure of the indebtedness of the Group.
APM Net debt at average exchange rates
Closest equivalent statutory measure
Cash and cash equivalents less interest-bearing loans and borrowings.
Reconciling items to statutory measure
Translational currency impacts.
Definition and purpose
Net debt (as above) is presented in the Balance Sheet translated at year end exchange rates. For bank covenant testing purposes net debt is converted using average exchange rates for the year.
Net debt
31 December 2017 £m
31 December 2016 £m
As reported 571.8 541.5 Impact of foreign exchange 22.8 (51.1)At average exchange rates 594.6 490.4
GlossaryContinued
154M
elro
se In
dus
trie
s P
LC
Ann
ual R
epor
t 201
7

Balance Sheet Measures continued
APM Leverage or net debt to underlying EBITDA
Closest equivalent statutory measure
None.
Reconciling items to statutory measure
Not applicable.
Definition and purpose
Net debt at average exchange rates divided by underlying EBITDA for existing businesses at each year end.
This measure is used for bank covenant testing.
APM Working capital
Closest equivalent statutory measure
Inventories, trade and other receivables less trade and other payables.
Reconciling items to statutory measure
Not applicable.
Definition and purpose
Working capital comprises inventories, current and non-current trade and other receivables, and current and non-current trade and other payables.
Cash Flow Measures
APM Underlying operating cash flow (pre capex)
Closest equivalent statutory measure
Net cash from operating activities.
Reconciling items to statutory measure
Non-working capital items.
Definition and purpose
Underlying operating cash flow (pre capex) is calculated as underlying EBITDA adjusted for movements in working capital.
This measure provides additional useful information in respect of cash generation and is consistent with how business performance is measured internally.
Underlying operating cash flow2017 £m
2016 £m
Underlying EBITDA 313.1 122.2 (Increase)/decrease in inventory (8.1) 15.0 Decrease in receivables 8.1 22.5 Decrease in payables (16.1) (9.3)Underlying operating cash flow 297.0 150.4
APMUnderlying profit conversion to cash (pre capex) percentage
Closest equivalent statutory measure
None.
Reconciling items to statutory measure
Not applicable.
Definition and purpose
Underlying operating cash flow (pre capex) as a percentage of underlying EBITDA, being 95% in 2017 and 123% in 2016.
This is a key performance measure that is used by the Board to measure performance.
Other Measures
APM Capital expenditure (capex)
Closest equivalent statutory measure
Additions to non-current assets.
Reconciling items to statutory measure
Refer to definition.
Definition and purpose
Calculated as the purchase of property, plant and equipment and computer software, and expenditure on capitalised development costs during the year, excluding any assets acquired as part of a business combination.
APM Capital expenditure to depreciation ratio
Closest equivalent statutory measure
None.
Reconciling items to statutory measure
Not applicable.
Definition and purpose
Capital expenditure divided by depreciation of property, plant and equipment and amortisation of computer software and development costs.
APM Dividend per share
Closest equivalent statutory measure
None.
Reconciling items to statutory measure
Not applicable.
Definition and purpose
Amount payable by way of dividends in terms of pence per share.
Financials
155
Mel
rose
Ind
ustr
ies
PLC
A
nnua
l Rep
ort 2
017

Notice of Annual General Meeting
This document is important and requires your immediate attention. If you are in any doubt as to the action you should take, you should consult your stockbroker, bank, solicitor, accountant, fund manager or other independent financial adviser authorised under the Financial Services and Markets Act 2000 if you are resident in the United Kingdom or, if not, another appropriately authorised independent financial adviser.
If you have sold or otherwise transferred or sell or otherwise transfer all of your shares in Melrose Industries PLC (the “Company”), please send this document, together with the accompanying form of proxy, as soon as possible to the purchaser or transferee or to the agent through whom the sale or transfer was effected for delivery to the purchaser or transferee.
Notice is given that the Annual General Meeting of the Company will be held at Saddlers’ Hall, 40 Gutter Lane, London EC2V 6BR at 11.00 a.m. on 10 May 2018 for the purposes set out below. Resolutions 1 to 14 (inclusive) will be proposed as ordinary resolutions and resolutions 15 to 18 (inclusive) as special resolutions.
Ordinary resolutions1. To receive the Company’s audited financial statements for the
financial year ended 31 December 2017, together with the Directors’ Report, Strategic Report and the Auditor’s Report on those financial statements.
2. To approve the Directors’ Remuneration Report for the year ended 31 December 2017, as set out on pages 80 to 90 of the Company’s 2017 Annual Report.
3. To declare a final dividend of 2.8 pence per ordinary share for the year ended 31 December 2017.
4. To re-elect Christopher Miller as a Director of the Company.
5. To re-elect David Roper as a Director of the Company.
6. To re-elect Simon Peckham as a Director of the Company.
7. To re-elect Geoffrey Martin as a Director of the Company.
8. To re-elect Justin Dowley as a Director of the Company.
9. To re-elect Liz Hewitt as a Director of the Company.
10. To re-elect David Lis as a Director of the Company.
11. To elect Archie G. Kane as a Director of the Company.
12. To re-appoint Deloitte LLP as auditor of the Company to hold office from the conclusion of this meeting until the conclusion of the next Annual General Meeting of the Company at which accounts are laid.
13. To authorise the Audit Committee to determine the remuneration of the auditor of the Company.
In resolutions 14 to 18 (inclusive):“Acquisition” means the acquisition of all or any part of the issued and to be issued share capital of GKN plc by the Company or any wholly owned subsidiary of the Company, to be implemented by way of the Offer (or by way of Scheme, under certain circumstances described in the Offer Document);
“Offer” means the offer made by Melrose to acquire the entire issued and to be issued share capital of GKN plc on the terms and subject to the conditions set out in the Offer Document (and, where the context admits, any subsequent revision, variation, extension or renewal of such offer including any election or alternative available in connection with it);
“Offer Document” means the offer document dated 13 March 2018 containing (among other things) the terms and conditions of the Offer;
“Scheme” means, should the Acquisition be implemented by way of a scheme of arrangement under Part 26 of the Companies Act 2006, the scheme of arrangement between GKN plc and the shareholders of GKN plc to implement the Acquisition, with or subject to any modification, addition or condition approved or imposed by the High Court of Justice of England and Wales; and
“the Offer becoming effective” means (a) the Acquisition becoming or being declared wholly unconditional, or (b) if the Company elects to implement the Acquisition by way of a Scheme, the Scheme becoming effective in accordance with its terms.
14. That, in accordance with section 551 of the Companies Act 2006 (the “Act”), the directors of the Company (the “Directors”) be and are generally and unconditionally authorised to allot shares in the Company, or to grant rights to subscribe for or to convert any security into shares in the Company (“Rights”):
(A) up to an aggregate nominal amount of £44,370,297 and, subject to and conditional on the Offer becoming effective, up to an additional aggregate nominal amount of £67,377,007; and
(B) comprising equity securities (as defined in section 560 of the Act) up to an aggregate nominal amount of £88,740,594 and, subject to and conditional on the Offer becoming effective, up to an additional aggregate nominal value of £134,754,013 (such amount or amounts to be reduced by the aggregate nominal amount of any allotments or grants made under paragraph (A) of this resolution) in connection with an offer by way of a rights issue:
(i) to ordinary shareholders in proportion (as nearly as may be practicable) to their existing holdings; and
(ii) to holders of other equity securities as required by the rights of those securities or, subject to such rights, as the Directors otherwise consider necessary,
and so that the Directors may impose any limits or restrictions and make any arrangements which they consider necessary or appropriate to deal with treasury shares, fractional entitlements, record dates, legal, regulatory or practical problems in, or under the laws of any territory or any other matter, such authorities to expire at the conclusion of the Company’s next Annual General Meeting after this resolution is passed or, if earlier, at the close of business on 30 June 2019, but, in each case, so that the Company may make offers or agreements before the authority expires which would or might require shares to be allotted or Rights to be granted after the authority expires, and so that the Directors may allot shares or grant Rights in pursuance of any such offer or agreement notwithstanding that the authority conferred by this resolution has expired.
Special resolutions15. That, subject to the passing of resolution 14, the Directors be
and are generally empowered to allot equity securities (as defined in section 560 of the Act) for cash pursuant to the authorities granted by resolution 14 and/or to sell ordinary shares held by the Company as treasury shares for cash, in each case as if section 561 of the Act did not apply to any such allotment or sale, provided that this power shall be limited:
(A) to the allotment of equity securities in connection with an offer of equity securities (but in the case of an allotment pursuant to the authority granted under paragraph (B) of resolution 14, such power shall be limited to the allotment of equity securities in connection with an offer by way of a rights issue only):
156M
elro
se In
dus
trie
s P
LC
Ann
ual R
epor
t 201
7

(i) to ordinary shareholders in proportion (as nearly as may be practicable) to their existing holdings; and
(ii) to holders of other equity securities, as required by the rights of those securities or, subject to such rights, as the Directors otherwise consider necessary,
and so that the Directors may impose any limits or restrictions and make any arrangements which they consider necessary or appropriate to deal with treasury shares, fractional entitlements, record dates, legal, regulatory or practical problems in, or under the laws of, any territory or any other matter; and
(B) to the allotment (otherwise than in circumstances set out in paragraph (A) of this resolution) of equity securities pursuant to the authority granted by paragraph (A) of resolution 14 or sale of treasury shares up to a nominal amount of £6,655,545 and, subject to and conditional on the Offer becoming effective, up to an additional nominal amount of £10,106,551,
such powers to expire at the conclusion of the Company’s next Annual General Meeting after this resolution is passed or, if earlier, at the close of business on 30 June 2019, but, in each case, so that the Company may make offers or agreements before the power expires which would or might require equity securities to be allotted (and/or treasury shares sold) after the power expires and so that the Directors may allot equity securities (and/or sell treasury shares) in pursuance of any such offer or agreement notwithstanding that the power conferred by this authority has expired.
16. That, subject to the passing of resolution 14 and in addition to any power granted under resolution 15, the Directors be and are generally empowered to allot equity securities (as defined in section 560 of the Act) for cash pursuant to the authorities granted by resolution 14 and/or to sell ordinary shares held by the Company as treasury shares for cash, in each case as if section 561 of the Act did not apply to any such allotment or sale, provided that this power shall be:
(A) limited to the allotment of equity securities pursuant to the authority granted by sub paragraph (A) of resolution 14 or sale of treasury shares up to a nominal amount of £6,655,545 and, subject to and conditional on the Offer becoming effective, up to an additional nominal amount of £10,106,551; and
(B) used only for the purposes of financing (or refinancing, if the authority is to be used within six months of the original transaction) a transaction which the Directors determine to be an acquisition or other capital investment of a kind contemplated by the Statement of Principles on Disapplying Pre-Emption Rights most recently published by the Pre-Emption Group prior to the date of this notice of the Annual General Meeting,
such powers to expire at the conclusion of the Company’s next Annual General Meeting after this resolution is passed or, if earlier, at the close of business on 30 June 2019, but, in each case, so that the Company may make offers or agreements before the power expires which would or might require equity securities to be allotted (and/or treasury shares sold) after the power expires and so that the Directors may allot equity securities (and/or sell treasury shares) in pursuance of any such offer or agreement notwithstanding that the power conferred by this authority has expired.
17. That the Company be and is generally and unconditionally authorised to make one or more market purchases (within the meaning of section 693 of the Act) of ordinary shares in the capital of the Company provided that:
(A) the maximum aggregate number of ordinary shares authorised to be purchased is 194,120,050 and, subject to and conditional on the Offer becoming effective, an additional 294,774,404 ordinary shares;
(B) the minimum price which may be paid for an ordinary share is the nominal value of an ordinary share at the time of such purchase;
(C) the maximum price which may be paid for an ordinary share is not more than the higher of:
(i) 105% of the average of the middle-market quotation for an ordinary share as derived from the Daily Official List of the London Stock Exchange for the five business days immediately preceding the day on which the ordinary share is purchased; and
(ii) the higher of the price of the last independent trade and the highest current independent bid on the trading venue where the purchase is carried out, in each case, exclusive of expenses;
(D) this authority shall expire at the conclusion of the Company’s next Annual General Meeting after this resolution is passed or, if earlier, at the close of business on 30 June 2019;
(E) the Company may make a contract of purchase of ordinary shares under this authority which would or might be executed wholly or partly after the expiry of this authority, and may make a purchase of ordinary shares in pursuance of any such contract; and
(F) any ordinary shares purchased pursuant to this authority may either be held as treasury shares or cancelled by the Company, depending on which course of action is considered by the Directors to be in the best interests of shareholders at the time.
18. That a general meeting other than an Annual General Meeting may be called on not less than 14 clear days’ notice.
RecommendationThe Board believes that each of the resolutions to be proposed at the Annual General Meeting is in the best interests of the Company and its shareholders as a whole. Accordingly, the Directors unanimously recommend that ordinary shareholders vote in favour of all of the resolutions proposed, as the Directors intend to do in respect of their own beneficial holdings.
By order of the Board
Jonathon Crawford Company Secretary 10 April 2018
Registered Office: 11th Floor The Colmore Building 20 Colmore Circus Queensway Birmingham West Midlands B4 6AT
Shareholder Information
157
Mel
rose
Ind
ustr
ies
PLC
A
nnua
l Rep
ort 2
017

Explanatory notes to the proposed resolutionsResolutions 1 to 14 (inclusive) are proposed as ordinary resolutions, which means that for each of those resolutions to be passed, more than half the votes cast must be cast in favour of the resolution. Resolutions 15 to 18 (inclusive) are proposed as special resolutions, which means that for each of those resolutions to be passed, at least three-quarters of the votes cast must be cast in favour of the resolution.
Resolution 1 – Receipt of 2017 Annual Report and financial statementsThe Directors are required to lay the Company’s financial statements, the Strategic Report and the Directors’ and auditor’s reports on those financial statements (collectively, the “2017 Annual Report”) before shareholders each year at the Annual General Meeting (“AGM”).
Resolution 2 – Approval of Directors’ remuneration report The Directors’ remuneration report (the “Directors’ Remuneration Report”) is presented in two sections:
• the annual statement from the Chairman of the Remuneration Committee; and
• the annual report on remuneration.
The annual statement from the Chairman of the Remuneration Committee, set out on pages 80 to 82 of the 2017 Annual Report, summarises, for the year ended 31 December 2017, the major decisions taken on Directors’ remuneration, any substantial changes relating to Directors’ remuneration made during the year and the context in which those changes occurred and decisions that have been taken.
The annual report on remuneration, set out on pages 80 to 90 of the 2017 Annual Report, provides details of the remuneration paid to Directors in respect of the year ended 31 December 2017, including base salary, taxable benefits, short-term incentives, long-term incentives vested in the year, pension-related benefits, any other items in the nature of remuneration and any sum(s) recovered or withheld during the year in respect of amounts paid in earlier years.
The Directors’ Remuneration Report is subject to an annual advisory shareholder vote by way of an ordinary resolution. Resolution 2 is to approve the Directors’ Remuneration Report.
Resolution 3 – Declaration of final dividendThe Board is recommending, and shareholders are being asked to approve, the declaration of a final dividend of 2.8p per ordinary share for the year ended 31 December 2017. The final dividend will, subject to shareholder approval, be paid on 21 May 2018 to the holders of ordinary shares whose names are recorded on the register of members of the Company at the close of business on 6 April 2018.
Resolutions 4 to 10 (inclusive) – Re-election of Directors In accordance with the UK Corporate Governance Code (the “Code”) and the Company’s Articles of Association (the “Articles”), every Director will stand for re-election at the AGM (with the exception of Archie G. Kane, who is standing for election). Biographical details of each Director can be found on pages 62 to 63 of the 2017 Annual Report. All of the non-executive Directors standing for re-election are currently considered independent under the Code.
Notice of Annual General MeetingContinued
Resolution 11 – Election of DirectorIn accordance with the Articles, Archie G. Kane is standing for election as a Director of the Company following his appointment to the Board with effect from 5 July 2017. Biographical details for Archie G. Kane can be found on page 63 of the 2017 Annual Report.
Resolution 12 – Re-appointment of auditor The Company is required to appoint auditors at each general meeting at which accounts are laid before shareholders, to hold office until the next such meeting.
The Audit Committee has reviewed the effectiveness, performance, independence and objectivity of the existing external auditor, Deloitte LLP, on behalf of the Board, and concluded that the external auditor was in all respects effective.
This resolution proposes the re-appointment of Deloitte LLP until the conclusion of the next AGM.
Resolution 13 – Authority to agree auditor’s remunerationThis resolution seeks authority for the Audit Committee to determine the level of the auditor’s remuneration.
Resolution 14 – Authority to allot sharesThis resolution seeks shareholder approval to grant the Directors the authority to allot shares in the Company, or to grant rights to subscribe for or convert any securities into shares in the Company (“Rights”), pursuant to section 551 of the Act (“Section 551 authority”). The authority contained in paragraph (A) of the resolution will be limited to an aggregate nominal amount of £44,370,297, being approximately one-third of the Company’s issued ordinary share capital as at 9 April 2018 (being the last business day prior to the publication of this notice) and, subject to and conditional on the Offer becoming effective, an additional aggregate nominal amount of £67,377,007, being an amount which, when aggregated with £44,370,297, provides an authority in respect of one-third of the Company’s expected issued ordinary share capital following the Acquisition.
In line with guidance issued by the Investment Association, paragraph (B) of this resolution would give the Directors authority to allot shares in the Company or grant Rights in connection with a rights issue up to aggregate nominal amount of £88,740,594, representing approximately two-thirds of the Company’s issued ordinary share capital as at 9 April 2018, and, subject to and conditional on the Offer becoming effective, an additional aggregate nominal amount of £134,754,013, being an amount which, when aggregated with £88,740,594, provides an authority in respect of two-thirds of the Company’s expected issued ordinary share capital following the Acquisition. This resolution provides that such amounts, when aggregated, shall be reduced by the aggregate nominal amount of any allotments or grants under paragraph (A).
The Company does not hold any shares in treasury.
If approved, the Section 551 authority shall, unless renewed, revoked or varied by the Company, expire at the end of the Company’s next AGM after the resolution is passed or, if earlier, at the close of business on 30 June 2019. The exception to this is that the Directors may allot shares or grant Rights after the authority has expired in connection with an offer or agreement made or entered into before the authority expired. The Directors have no present intention to exercise the Section 551 authority.
158M
elro
se In
dus
trie
s P
LC
Ann
ual R
epor
t 201
7

Explanatory notes to the proposed resolutions continuedResolutions 15 to 16 – Partial disapplication of pre-emption rightsThese resolutions seek shareholder approval to grant the Directors the power to allot equity securities of the Company pursuant to sections 570 and 573 of the Act (the “Section 570 and 573 power”) without first offering them to existing shareholders in proportion to their existing shareholdings.
The power is limited to allotments for cash in connection with pre-emptive offers, subject to any arrangements that the Directors consider appropriate to deal with fractions and overseas requirements and otherwise for cash up to a maximum nominal value of £13,311,090, representing approximately 10% of the Company’s issued ordinary share capital as at 6 April 2017 (being the last business day prior to the publication of this notice) and, subject to and conditional on the Offer becoming effective, up to an additional nominal value of £20,213,102, being an amount which, when aggregated with £13,311,090, provides an authority in respect of 10% of the Company’s expected issued ordinary share capital following the Acquisition.
The Directors intend to adhere to the guidelines set out in the Pre-Emption Group’s Statement of Principles (as updated in March 2015) and not to allot shares for cash on a non pre-emptive basis pursuant to a relevant authority in resolutions 15 or 16:
• in excess of an amount equal to 5% of the Company’s issued ordinary share capital (excluding treasury shares) in any one-year period, whether or not in connection with an acquisition or specified capital investment; or
• in excess of an amount equal to 7.5% of the Company’s issued ordinary share capital in a rolling three-year period,
in each case other than in connection with an acquisition or specified capital investment which is announced contemporaneously with the allotment or which has taken place in the preceding six-month period and is disclosed in the announcement of the allotment.
If approved, the Section 570 and 573 power shall apply until the end of the Company’s next AGM after the resolution is passed or, if earlier, until the close of business on 30 June 2019. The exception to this is that the Directors may allot equity securities after the power has expired in connection with an offer or agreement made or entered into before the power expired. The Directors have no present intention to exercise the Section 570 and 573 power.
Resolution 17 – Authority to purchase own sharesThis resolution seeks shareholder approval to grant the Company the authority to purchase its own shares pursuant to sections 693 and 701 of the Act.
This authority is limited to an aggregate maximum number of 194,120,050 ordinary shares, representing 10% of the Company’s issued ordinary share capital as at 9 April 2018 and, subject to and conditional on the Offer becoming effective, an additional 294,774,404 ordinary shares, being an amount which, when aggregated with 194,120,050 ordinary shares, provides an authority in respect of 10% of the Company’s expected issued ordinary share capital following the Acquisition.
The maximum price which may be paid for an ordinary share will be an amount which is not more than the higher of: (i) 5% above the average of the middle market quotation for an ordinary share as derived from the Daily Official List of the London Stock Exchange for the five business days immediately preceding the day on which the ordinary share is purchased; and (ii) the higher of the price of the last independent trade and the highest current independent bid on the trading venue where the purchase is carried out (in each case, exclusive of expenses).
If approved, the authority shall, unless varied, revoked or renewed, expire at the end of the Company’s next AGM after the resolution is passed or, if earlier, at the close of business on 30 June 2019. The Directors have no present intention of exercising all or any of the powers conferred by this resolution and will only exercise their authority if it is in the interests of shareholders generally.
Resolution 18 – Notice period for general meetings other than AGMsThis resolution seeks shareholder approval to allow the Company to continue to call general meetings (other than AGMs) on 14 clear days’ notice. In accordance with the Act, as amended by the Companies (Shareholders’ Rights) Regulations 2009, the notice period required for general meetings of the Company is 21 days unless shareholders approve a shorter notice period (subject to a minimum period of 14 clear days). In accordance with the Act, the Company must make a means of electronic voting available to all shareholders for that meeting in order to be able to call a general meeting on less than 21 clear days’ notice.
The Company intends to only use the shorter notice period where this flexibility is merited by the purpose of the meeting and is considered to be in the interests of shareholders generally, and not as a matter of routine. AGMs will continue to be held on at least 21 clear days’ notice.
The approval will be effective until the Company’s next AGM, when it is intended that a similar resolution will be proposed.
Shareholder Information
159
Mel
rose
Ind
ustr
ies
PLC
A
nnua
l Rep
ort 2
017

Explanatory notes as to the proxy, voting and attendance procedures at the Annual General Meeting (AGM)1. The holders of ordinary shares in the Company are entitled to
attend the AGM and are entitled to vote. A member entitled to attend, speak and vote at the AGM is also entitled to appoint a proxy to exercise all or any of his/her rights to attend, speak and vote at the AGM in his/her place. Such a member may appoint more than one proxy, provided that each proxy is appointed to exercise the rights attached to different shares. A proxy need not be a member of the Company.
2. A form of proxy is enclosed with this notice. To be effective, a form of proxy must be completed and returned, together with any power of attorney or authority under which it is completed or a certified copy of such power or authority, so that it is received by the Company’s registrars at the address specified on the form of proxy not less than 48 hours (excluding any part of a day that is not a working day) before the stated time for holding the meeting (or, in the event of an adjournment, not less than 48 hours before the stated time of the adjourned meeting (excluding any part of a day which is not a working day)). Returning a completed form of proxy will not preclude a member from attending the meeting and voting in person.
3. Any person to whom this notice is sent who is a person nominated under section 146 of the Act to enjoy information rights (a “Nominated Person”) may, under an agreement between him/her and the shareholder by whom he/she was nominated, have a right to be appointed (or to have someone else appointed) as a proxy for the AGM. If a Nominated Person has no such proxy appointment right or does not wish to exercise it, he/she may, under any such agreement, have a right to give instructions to the shareholder as to the exercise of voting rights. The statement of the rights of shareholders in relation to the appointment of proxies in paragraphs 1 and 2 opposite does not apply to Nominated Persons. The rights described in paragraphs 1 and 2 can only be exercised by the holders of ordinary shares in the Company.
4. To be entitled to attend and vote at the AGM (and for the purposes of the determination by the Company of the number of votes they may cast), members must be entered on the Company’s register of members by 6.30 p.m. on 8 May 2018 (or, in the event of an adjournment, on the date which is two days, excluding any day which is not a working day, before the time of the adjourned meeting). Changes to entries on the register of members after this time shall be disregarded in determining the rights of any person to attend or vote at the meeting.
5. As at 9 April 2018 (being the last business day prior to the publication of this notice), the Company’s issued share capital consists of 1,941,200,503 ordinary shares of 48/7p each, carrying one vote each.
6. CREST members who wish to appoint a proxy or proxies through the CREST electronic proxy appointment service may do so by using the procedures described in the CREST Manual (available at www.euroclear.com). CREST Personal Members or other CREST sponsored members, and those CREST members who have appointed a service provider(s), should refer to their CREST sponsor or voting service provider(s), who will be able to take the appropriate action on their behalf.
Notice of Annual General MeetingContinued
7. In order for a proxy appointment or instruction made using the CREST service to be valid, the appropriate CREST message (a “CREST Proxy Instruction”) must be properly authenticated in accordance with Euroclear UK & Ireland Limited’s specifications, and must contain the information required for such instruction, as described in the CREST Manual. The message, regardless of whether it constitutes the appointment of a proxy or is an amendment to the instruction given to a previously appointed proxy, must, in order to be valid, be transmitted so as to be received by the issuer’s agent (ID RA19) by 11.00 a.m. on 8 May 2018. For this purpose, the time of receipt will be taken to be the time (as determined by the time stamp applied to the message by the CREST Application Host) from which the issuer’s agent is able to retrieve the message by enquiry to CREST in the manner prescribed by CREST. After this time any change of instructions to proxies appointed through CREST should be communicated to the appointee through other means.
8. CREST members and, where applicable, their CREST sponsors, or voting service providers should note that Euroclear UK & Ireland Limited does not make available special procedures in CREST for any particular message. Normal system timings and limitations will, therefore, apply in relation to the input of CREST Proxy Instructions. It is the responsibility of the CREST member concerned to take (or, if the CREST member is a CREST Personal Member, or sponsored member, or has appointed a voting service provider, to procure that his/ her CREST sponsor or voting service provider(s) take(s)) such action as shall be necessary to ensure that a message is transmitted by means of the CREST system by any particular time. In this connection, CREST members and, where applicable, their CREST sponsors or voting system providers are referred, in particular, to those sections of the CREST Manual concerning practical limitations of the CREST system and timings.
9. The Company may treat as invalid a CREST Proxy Instruction in the circumstances set out in Regulation 35(5) (a) of the Uncertificated Securities Regulations 2001.
10. Any corporation which is a member can appoint one or more corporate representatives who may exercise on its behalf all of its powers as a member provided that they do not do so in relation to the same shares.
11. Under section 527 of the Act, members meeting the threshold requirements set out in that section have the right to require the Company to publish on a website a statement setting out any matter relating to: (i) the audit of the Company’s accounts (including the auditor’s report and the conduct of the audit) that are to be laid before the AGM; or (ii) any circumstance connected with an auditor of the Company ceasing to hold office since the previous meeting at which annual accounts and reports were laid in accordance with section 437 of the Act. The Company may not require the shareholders requesting any such website publication to pay its expenses in complying with sections 527 or 528 of the Act. Where the Company is required to place a statement on a website under section 527 of the Act, it must forward the statement to the Company’s auditor not later than the time when it makes the statement available on the website. The business which may be dealt with at the AGM includes any statement that the Company has been required under section 527 of the Act to publish on a website.
160M
elro
se In
dus
trie
s P
LC
Ann
ual R
epor
t 201
7

Explanatory notes as to the proxy, voting and attendance procedures at the Annual General Meeting (AGM) continued12. Any member holding ordinary shares attending the meeting
has the right to ask questions. The Company must answer any such questions relating to the business being dealt with at the meeting but no such answer need be given if: (i) to do so would interfere unduly with the preparation for the meeting or involve the disclosure of confidential information; (ii) the answer has already been given on a website in the form of an answer to a question; and/or (iii) it is undesirable in the interests of the Company or the good order of the meeting that the question be answered.
13. Voting at the AGM will be by poll. The Chairman will invite each shareholder, corporate representative and proxy present at the meeting to complete a poll card indicating how they wish to cast their votes in respect of each resolution. In addition, the Chairman will cast the votes for which he has been appointed as proxy. Poll cards will be collected during the meeting. Once the results have been verified by the Company’s registrar, Equiniti, they will be notified to the UK Listing Authority, announced through a Regulatory Information Service and will be available to view on the Company’s website.
14. A copy of this notice, and other information required by section 311A of the Act, can be found at www.melroseplc.net
15. You may not use an electronic address provided in either this Notice of AGM or any related documents (including the form of proxy) to communicate with the Company for any purposes other than those expressly stated.
16. The following documents will be available for inspection at the Company’s registered office during normal business hours (Saturdays, Sundays and public holidays excepted) from the date of this notice until the date of the AGM and at the place of the AGM for 15 minutes prior to and during the meeting:
(A) copies of all service agreements under which Directors of the Company are employed by the Company or any subsidiaries; and
(B) a copy of the terms of appointment of the non-executive Directors of the Company.
17. You may register your vote online by visiting Equiniti’s website at www.sharevote.co.uk. In order to register your vote online, you will need to enter the Voting ID, Task ID and Shareholder Reference Number which are set out on the enclosed form of proxy. The return of the form of proxy by post or registering your vote online will not prevent you from attending the AGM and voting in person, should you wish. Alternatively, shareholders who have already registered with Equiniti’s online portfolio service, Shareview, can appoint their proxy electronically by logging on to their portfolio at www.shareview.co.uk using your usual user ID and password. Once logged in simply click “View” on the “My Investments” page, click on the link to vote then follow the on screen instructions. A proxy appointment made electronically will not be valid if sent to any address other than those provided or if received after 11.00 a.m. on 8 May 2018.
Shareholder Information
161
Mel
rose
Ind
ustr
ies
PLC
A
nnua
l Rep
ort 2
017

Company and shareholder information
As at 31 December 2017, there were 6,808 holders of ordinary shares of 48/7 pence each in the Company. Analysis of these shareholdings as at 31 December 2017 are set out in the table below.
Shareholder analysis
Balance RangesTotal number
of holdingsPercentage
of holdersTotal number
of sharesPercentage
issued capital
1–5,000 5,217 76.63% 4,490,871 0.23%5,001–50,000 1,051 15.44% 15,321,105 0.79%50,001–500,000 274 4.02% 51,292,654 2.64%Over 500,000 266 3.91% 1,870,095,873 96.34%Total 6,808 100.00% 1,941,200,503 100.00%
Held by
Individuals 4,884 71.74% 11,492,756 0.59%Institutions 1,924 28.26% 1,929,707,747 99.41%
6,808 100.00% 1,941,200,503 100.00%
Financial calendar 2018Ex-dividend date for final dividend 5 April 2018Record date for final dividend 6 April 2018Annual General Meeting 10 May 2018Payment date of final dividend 21 May 2018Announcement of interim results August 2018Intended payment of interim dividend October 2018Preliminary announcement of 2018 results March 2019
RegistrarEquiniti Aspect House Spencer Road Lancing West Sussex BN99 6DA
Tel: 0371 384 2946 or +44 (0) 121 415 0851 (from outside UK)
Lines are open from 8.30 a.m. to 5.30 p.m. Monday to Friday, excluding UK public holidays.
BrokersInvestec 2 Gresham Street London EC2V 7QP
J.P. Morgan Cazenove 25 Bank Street London E14 5JP
Legal advisersSimpson Thacher & Bartlett LLP CityPoint One Ropemaker Street London EC2Y 9HU
BankersBank of America Merrill Lynch Barclays Bank PLC BNP Paribas Citizens Bank Commerzbank AG HSBC Bank plc J.P. Morgan Limited Lloyds Bank plc Royal Bank of Canada BayernLB ICBC ING Santander UK PLC Unicredit Wells Fargo Bank International
A range of shareholder information is available at Equiniti’s online portfolio service www.shareview.co.uk, where you can register for a Shareview Portfolio to access information about your holding and undertake a number of activities, including appointing a proxy, changing a dividend mandate and updating your address. To register, you will need your 11 digit Shareholder Reference Number (SRN), which can be found on your proxy form or dividend voucher.
Gifting your sharesIf you have a small number of shares and the dealing costs or minimum fee make it uneconomical to sell them, you may like to donate them to benefit charities through ShareGift, a registered charity. Further information is available on the ShareGift website at www.sharegift.org or call +44 (0) 20 7930 3737.
Share fraud warningMany companies have become aware that their shareholders have received unsolicited phone calls or correspondence concerning investment matters. Fraudsters use persuasive and high-pressure tactics to lure investors into scams. They may offer to sell shares that turn out to be worthless or non-existent, or to buy shares at an inflated price in return for an upfront payment. For more detailed information on this kind of activity or to report a scam, please call the Financial Conduct Authority’s Consumer Helpline on 0800 111 6768 or visit www.fca.org.uk/consumers/scams
162M
elro
se In
dus
trie
s P
LC
Ann
ual R
epor
t 201
7

Notes
163
Mel
rose
Ind
ustr
ies
PLC
A
nnua
l Rep
ort 2
017

Notes
164M
elro
se In
dus
trie
s P
LC
Ann
ual R
epor
t 201
7

This Report is printed on material which is derived from sustainable sources. Both the manufacturing paper mill and printer are registered to the Environmental Management System ISO 14001 and are Forest Stewardship Council® (FSC) chain-of-custody certified.
Designed and produced by SampsonMay Telephone: 020 7403 4099 www.sampsonmay.com

Melrose
BuyImproveSell
Melro
se Industries P
LC A
nnual Report 2017
www.melroseplc.netLondon Stock ExchangeCode: MROSEDOL: BZ1G432LEI: 213800RGNXXZY2M7TR85
Melrose Industries PLC
Registered Office11th Floor, The Colmore Building20 Colmore Circus QueenswayBirminghamWest Midlands B4 6AT
Tel: +44 (0) 121 296 2800Fax: +44 (0) 121 296 2839
Registered Number: 09800044
North America OfficeGateway Center Building One2077 Convention Center ConcourseSuite 175 College Park AtlantaGA 30337USA
Tel: +1 404 941 2100Fax: +1 404 941 2772
Head OfficeLeconfield HouseCurzon StreetLondonW1J 5JA
Tel: +44 (0) 20 7647 4500Fax: +44 (0) 20 7647 4501