Annual report 2017 - Elkem– Foundry Products 14 – Carbon 16 Risk and compliance 18 Health and...
68
Annual report 2017 DELIVERING YOUR POTENTIAL
Transcript of Annual report 2017 - Elkem– Foundry Products 14 – Carbon 16 Risk and compliance 18 Health and...

Annual report 2017
DELIVERINGYOUR POTENTIAL

B ELKEM ANNUAL REPORT 2017 ELKEM ANNUAL REPORT 2017 1
ContentsElkem – an overview
Production siteSales O�ceHQ
Financials Unit 2017 2016 2015 2014* Revenues NOK million 16 658 14 226 14 541 12 694
EBITDA NOK million 2 098 1 618 2 207 1 248
EBIT NOK million 1 355 941 1 310 574
Profit for the year NOK million 1 012 758 835 208
Total assets NOK million 16 348 14 813 14 477 14 565
Net interest-bearing assets / (liabilities) NOK million (1 742) (1 729) (1 928) (3 530)
Equity NOK million 8 333 7 459 6 167 4 788
Equity ratio Per cent 51 50 43 33
ROCE Per cent 13 10 15 7
No. of employees Full time equivalent 3 942 3 806 3 628 3 459
KEY FIGURES ELKEM
95
About Elkem Elkem is one of the world’s leading companies in the environmentally responsible manufacture of metals and materials. Elkem is a fully-integrated producer with operations throughout the silicon value chain from quartz to silicon and downstream silicone specialities as well as speciality ferro- silicon alloys and carbon materials. In 2017 the turnover was NOK 16 658 million and the EBITDA NOK 2 098 million. Elkem is owned by Bluestar Elkem International Luxembourg, which is controlled by China National Bluestar.
As part of Elkem's growth strategy, Elkem resumed management responsibility for Jiangxi Bluestar Xinghuo Organix Silicone (Xinghuo) and Bluestar Silicone Material Co., Ltd. (Yongdeng) in June 2017. This move further develops Elkem’s integrated silicon value chain. Elkem thereby gains access to high growth markets in China with significant upstream capacity, improved supply of full product range to specialty customers in China and in creasing penetration of high value-added products in the specialty segment in China. Elkem now operates 27 manufacturing sites with about 6 100 employees, of which about 2 200 are employees of Xinghuo and Yongdeng. Including the Chinese plants, Elkem's revenue in 2017 was NOK 21 368 million and the EBITDA was NOK 3 154 million.
Highlights 2017 2
Words from the CEO 4
Corporate management 5
Elkem’s business strategy 6
Words from chairman of the board 8
Elkem’s divisions 9 – Silicones 10 – Silicon Materials 12 – Foundry Products 14 – Carbon 16
Risk and compliance 18
Health and safety 20
Corporate governance 22
Report from the board of directors 24
Financial statement Elkem AS group 33
Financial statement Elkem AS 95
Auditor’s report 128
Financials Unit 2017 Revenues NOK million 21 368
EBITDA NOK million 3 154
EBIT NOK million 1 936
Profit for the year NOK million 1 249
Total assets NOK million 25 507
No. of employees Full time equivalent 6 022
KEY FIGURES ELKEM INCLUDING XINGHUO AND YONGDENG
* Elkem Silicones was acquired in 2015 and is included in comparable figures. Elkem Solar was divested in 2015 and is excluded in comparable figures. Please refer to accounting principles in consolidated financial statement for Elkem AS group for more details.
Production site
Sales office
Headquarters
09 24
33

2 ELKEM ANNUAL REPORT 2017 ELKEM ANNUAL REPORT 2017 3
Management responsibility for Xinghuo and YongdengAs part of Elkem’s growth strategy Elkem assumed management responsibility and integrated Bluestar Xinghuo Silicones and Yongdeng Silicon Materials into the Elkem group. With this integration the Elkem group will grow to about 6 100 people, a truly global company with strong Chinese, French and Norwe-gian roots. The company will have high attention on values and social responsi-bility, taking care of employees, the environment and society.
CEO Helge Aasen with Mr. Dazhuang Wang at the time of including responsibility of Xinghuo and Yongdeng.
Highlights 2017
Elkem Carbon opens energy recovery and sulphur treatment facilityThe new facilities at the Fiskaa plant will save energy equivalent to 800 households and cut sulphur emissions by 620 tonnes.
Elkem assumes full ownership of the Paraguay plant
Elkem purchased all the shares in the Paraguay plant and plans to
commence production in March 2018.
50 year anniversary for Elkem Chicoutimi plantElkem’s Chicoutimi ferrosilicon plant celebrated 50 years of operation since its first casting on 1 July 1967.
Celebrating 100 years at FiskaaElkem marks the 100-year anniversary at the Fiskaa plant. In March the plant reached an all-time high in production.
Renaming of the Silicones division The Silicones division changed its name from Bluestar Silicones to Elkem Silicones.
10 years anniversary of Elkem SiliconesElkem Silicones celebrated 10 years within the Chinese group Bluestar, and 60 years of producing silicones in the iconic plant of Saint Fons.
Inauguration of Elkem South Asia’s foundry alloy plant in Nagpur
After 30 years of presence in the Indian market, Elkem opens a new plant in Nagpur.
Foundry Products opens new plant in China
Elkem celebrated the opening of a new foundry plant in Shizuishan
city, Gansu province.
25 000
20 000
15 000
10 000
5 000
0
3 500
3 000
2 500
2 000
1 500
1 000
500
0
REVENUE (MNOK) EBITDA (MNOK)
MARGIN (%)
2017** 2017**2015*
* Elkem AS group. ** Elkem AS group including Xinghuo and Yongdeng.
2015*
15%
9%
15%
2016** 2016**

4 ELKEM ANNUAL REPORT 2017 ELKEM ANNUAL REPORT 2017 5
Solid results and a bright outlook
2017 was a successful year for Elkem. We delivered very good financial results, supported by favourable market conditions in most of our business segments, and good operational performance. The result was in line with 2015, when Elkem recorded its best ever financial year.
All Elkem’s business divisions contributed to solid financial results for 2017. Market demand for Silicones division is strong and the division continues to deliver on its specialisation strategy. Our Silicon Materials division performed well with good contribution from the new Rana plant. Foundry Products experienced a good year, driven by higher prices and increased sales of specialty products. The Carbon division delivered yet again a stable and satisfying result.
As part of Bluestar’s and Elkem’s growth strategy, we assumed the management responsibility for two plants in China in June of 2017: Xinghuo Silicones and Yongdeng Silicon Materials. I am pleased to report that the integration of both plants into the Elkem group has been highly successful. Particularly Xinghuo has seen tremendous improvements in profitability. Improved markets and higher prices have contributed to the positive results, and we are impressed with the significant improvement in productivity and cost efficiency. We expect continuous improvements in operational efficiency to support continued solid financial performance from our Chinese operations.
An important part of our business strategy is further specialisation in order to improve value creation and reduce exposure to commodity cycles. An important focus area will be to capture growth in the fast growing Chinese and Indian markets for silicones. The product portfolios in the Foundry Products and Silicones divisions already have a high share of specialty products, and our ambition is to accelerate this development further.
Global mega trends drive consumption of Silicon and provide attractive opportunities for our products in end markets that are growing at rates faster than GDP. Digitalisation is fuelling our growth, with steady increases in the use of electronics. Renewable energy derived from solar technologies and windmills is another major growth driver. Urbanisation in general is driving demand for our products within construction and infra-structure. In addition, the per capita consumption of silicones in developing countries continues to grow rapidly with improved standard of living, particularly in China.
Sustainability is important to Elkem. In our Elkem Business System we define it as “elimination of waste” when we continuously strive to minimise the negative environmental and social impact of our activities and our long term goal is zero-emissions. To remain competitive and continue to be an attractive employer, we must demonstrate responsibility towards the environment and an important initiative in 2017 was the completion of a sulphur-cleaning system at our carbon plant in Kristiansand. At our Salten plant in Northern Norway, we are about to complete the feasibility study on an energy recovery system, which will be one of the largest within the worldwide silicon industry.
The most important focus of all is making sure that every one of our colleagues returns home safely from work, every day. A year without fatalities and an H1 rate of 1.1 (number of lost time injuries per 1 000 000 working hours) show that our systematic efforts are yielding results. With continuous daily focus we will continue our ongoing efforts towards our goal of zero injuries.
Elkem is an organisation of knowledge workers in all functions and at all levels of the organisation. We embrace our diversity in geography, cultures, individuals and functions, and believe that a key success factor to our strategy implementation is empowered people. Elkem Business System, our values and ethical standards, form a common foundation for all Elkem employees globally. Our target of motivating and enabling every employee in Elkem to work with continuous improve-ment every day is the most powerful driver for further development of the company.
In 2017, we have delivered on our business strategy of product specialisation, systematic efficiency improvements and growth. We expect to see continued good market conditions and improved financial performance for Elkem in 2018. I would like to thank all my Elkem colleagues for their hard work and valuable contributions.
HELGE AASEN CEO Elkem AS
WORDS FROM THE CEO
Corporate management
HELGE AASENChief executive
officer
TROND SÆTERSTAD
Senior vice president
Silicon Materials
MORTEN VIGAChief financial
officer
FRÉDÉRIC JACQUIN
Senior vice president
Silicones
KATJA LEHLANDSenior
vice president Human
Resources
ASBJØRN SØVIKSenior
vice president Carbon
INGE GRUBBEN- STRØMNES
Senior vice president
Business Development
JEAN VILLENEUVESenior
vice president Foundry Products
HÅVARD I. MOESenior
vice president Elkem
Technology
LOUIS VOVELLESenior
vice president Innovation and R&D
Global mega trends drive consumption of Silicon and provide attractive opportunities for our products in end markets that are growing at rates faster than GDP.

6 ELKEM ANNUAL REPORT 2017 ELKEM ANNUAL REPORT 2017 7
Elkem business strategy
Improve operational efficiency and value chain optimisation Based on Elkem’s significant experience and low-cost heritage, continuous improvements in operational efficiencies and finding synergies across the group will be a key pillar in the group’s strategy going forward. The Elkem Business System, together with operational excellence, economies of scale, low-cost power, an integrated value chain from raw materials to end products, and advanced energy recovery systems will continue to be fundamental for making cost improvements. Additionally, continued investment in research and development should ensure techno-logical improvements that reduce costs and improve production efficiencies, as well as the development of new products and applications.
Elkem will continue to pursue operational excellence by utilising its internal “cost roadmap” programmes to identify and support cost reduction projects in a standardised manner throughout the group. Elkem actively implements intra-plant bench- marking activities to transfer best practices, process expertise and technological competence across its operational footprint.
Elkem aims to continue value chain optimisation through upstream integration with the two siloxane plants in Europe and Asia and further optimisation of the value chain process from quartz to siloxane. Elkem continuously focuses on strategic sourcing of raw materials in order to remain a fully integrated low-cost producer, by further investing in high purity quartz mines to secure sufficient reserves.
Improving sales of speciality productsThe group intends to pursue its specialty strategy to reduce cyclicality and increase sales of higher-margin specialty products across each division, by building on its long-term customer relationships and extensive product-focused research and development base. The focus on attractive specialty segments is particularly
important for the Silicones and Foundry Products divisions and Elkem intends to focus on the most attractive end markets.
Elkem believes that there is substantial room for further increased penetration in the specialty products segment, especially in China. The group also intends to continue efforts to drive specialty volumes through investments, CRM tools, sales and marketing efforts, and addressing new market opportunities such as implants, 3D printing, robots and electric vehicles.
Focus on organic and acquisitive growth Elkem continuously evaluates attractive options for growth, particularly through capacity expansion in underserved or growing regions, and will actively continue to pursue these opportunities. Capacity expansions are aimed at driving revenues and allow Elkem to capture a greater market share.
Elkem’s goal is to increase its production capacity, either by capacity expansion at existing plants, new greenfield investments or through mergers and acquisitions. As part of this strategy, Elkem has concluded a number of projects over the past two years, including the acquisition of Fesil Rana Metall AS, the iron foundry business of Minex, the start-up of the greenfield carbon plant in Malaysia and the construction of a greenfield plant in Paraguay for production of ferrosilicon. In addition, Elkem has relocated and expanded its foundry alloy plant in China and its downstream silicones plant in Brazil.
In addition, Elkem intends to pursue selected bolt-on acquisitions, as it believes there are potential opportunities for capacity expansion and entrance into new product sub-segments. Elkem’s size and geographic reach, combined with its broad base of skills and resources, render it well-positioned to capitalise on these growth opportunities.
Elkem’s strategy is based on making systematic cost improvements, further product specialisation and an ambition to strengthen the group’s position across all business segments and markets. Elkem has strong positions in most regions, and has significantly increased its presence in the Asia-Pacific region, with management responsibility for Xinghuo Silicones and Yongdeng Silicon Materials.
COMPANY STRATEGY
GLOBAL MEGATRENDS FAVOUR INCREASED DEMAND FOR ELKEM’S PRODUCTS
Continue focus on speciality products
Improving efficiency in the integrated value chain
Further strengthen market positions across all business segments and markets
Licence to operate
Financial strength
Attracting talent
GLOBAL MEGATRENDS CREATE SPECIFIC NEEDS DRIVING DEMAND FOR ELKEM’S SOLUTIONS
• Lightweighting of cars
• Greater fuel efficiency
• Reduced emissions
• Growing use of solar panels and wind energy
• Increased energy storage
• Improved solutions for construction and infrastructure
• Higher quality products
• Textiles / clothing
• Affordable comfort and personal care
• Healthcare
• Well-being
• Connected home, work and city
• Sensor tracking technology
Advanced materials shaping the future
Sustainability
Energydemandgrowth
Increased standardof living
Rapid urbanisation
COMPANY STRATEGY
OUR VISION
FUNDAMENTALS FOR GROWTH
Ageing andgrowing population
Digitalisation

8 ELKEM ANNUAL REPORT 2017 ELKEM ANNUAL REPORT 2017 9
Delivering in every aspect
Elkem delivered in every major aspect in 2017; operationally and strategically as well as within sustainability.
Health, safety and environment are the backbone of every metallurgical and chemical company, and have always been a strong focus for the Elkem management. I am pleased to report that Elkem finished the year without any major incidents and with a good safety performance. I think this speaks for the quality of Elkem as an employer, and of the company's consistant efforts on improving health, safety and environment.
Strategically, 2017 will be a milestone year in Elkem’s history, with Elkem taking over management responsibility for Xinghuo and Yongdeng from June 2017. This change makes Elkem a different business today in terms of size and global footprint.
I have been impressed to see the pace at which this management integration gained traction over the course of 2017. Several factors contributed to this. Firstly, Chinese pragmatism and their willingness and ability to react quickly to new learnings. And secondly, the effects from Elkem Business System, which has led to a more systematic, process-driven approach to problem solving.
Operationally, 2017 was a very good year for Elkem and the Xinghuo and Yongdeng plants. We saw a clear increase, not only in revenue, but also in earnings. We were supported by some favourable market conditions, but also delivered on several important internal goals. We improved efficiency, developed better sales channels and increased our focus on profitable markets and further specialisation. These factors all contributed to our improved results.
The progress we are seeing in China clearly demonstrates that combining the strengths of different cultures makes us truly stronger. Valuable learning is exchanged in both directions, and I am confident that knowledge gained from our Chinese operations will improve Elkem’s European operations as well.
WORDS FROM THE CHAIRMAN OF THE BOARD
Elkem’s divisions
Strategically, 2017 will be a milestone year in Elkem’s history, with Elkem taking over management responsibility for Xinghuo and Yong- deng from June 2017. This change makes Elkem a different business today in terms of size and global footprint.
There were also a few smaller but very important strategic developments throughout the year. In December the new foundry alloy plant in India celebrated its opening, and by the end of the year the new foundry alloy plant in China was ready for production, marking an important contribution to future earning potential in the company. Also the progress with our new ferrosilicon plant in Paraguay shows that Elkem is making continuous progress in its strategic development as it becomes a larger and more profitable company.
Elkem shall continue to grow, organically as well as through selected acquisitions. From an M&A perspective, we will continue to monitor the market for new opportunities that could strengthen Elkem. Organically, I think the biggest potential is within silicones, and particularly in China. This is simply because the Chinese economy is growing strong, even a bit stronger than most people expected.
However, our main challenge is not about finding business opportunities, but finding the right ones. We will therefore continue to carefully identify, assess and pursue the business opportunities which are the most profitable and sustainable in the future. I would like to express my sincere thanks to all of Elkem’s employees for their strong support and relentless efforts to develop the company further.
MICHAEL KOENIGChairman of the board

10 ELKEM ANNUAL REPORT 2017 ELKEM ANNUAL REPORT 2017 11
Products and applications Silicones are polymers and can be manufactured into many forms including solids, liquids, semi-viscous pastes, greases, oils and rubber. They are flexible and can resist moisture, chemicals, heat, cold and ultraviolet radiation and can be encountered every day without noticing them, e.g. silicone rubber in cars to protect electronics, silicones in the gel on a wound dressing, and sealing and insulating materials in electrical equipment.
Due to its wide range of application areas, silicones are used in a large number of products and industries. As a result, trends in silicone demand generally tend to be driven by macro trends such as GDP growth, urbanisation and increased mobility. Some of the applications are used in a diverse range of industries including electrical and electronics, construction, transportation, health and personal care, chemicals and machinery, textiles and paper.
Silicones
ELKEM’S DIVISIONS
The Silicones division produces siloxanes and a comprehensive range of silicones, which are a family of specialty, high performance products and materials, produced by reacting silicon with methyl chloride. Silicones are found in a large variety of products used in daily life. The Silicones division is one of the leading producers of airbag coating, paper coating and other specialty products such as defoamers and lubricants.
Summing up 2017It has been a good year for Elkem Silicones. We have enjoyed good and profitable growth and the integration of the Xinghuo plant has been according to plan. The division has enjoyed growth in specialities and excellent market conditions. The Elkem Silicones team and the Xinghuo team have united and are working towards delivering our true potential. Elkem Silicones has become a truly global team and has both the ambition and potential to play a leading role in this industry. MilestonesThe most important milestones for us have been the management inte-gration with our Chinese business units and fully ramping up the Xinghuo site. We have also captured two new large customers due to our dedication to R&D and our superior customer service, which is essential for future growth in high-value and large-volume segments. We also celebrated our 10-year anniversary as Bluestar Silicones, and became Elkem Silicones. The journey we have made as a company can be compared to growth from infancy to adulthood. As an infant, we were exposed to constant change and exposure in many different situations. As a teenager, we grew quickly with ideas, filled with energy and passion. Now we are slowly moving on to adulthood, with all the responsibilities and possibilities that come with it. Elkem’s business strategy Our key focus has been further developments in specialities. This is our number one priority in order to become a sustainable industry leader. We have also significantly strengthened our market position, particularly in China through the integration with Xinghuo.
Silicones have thousands of appli cations and improve the performance and reliability of millions of modern products. Silicones produced by Elkem Silicones are found in products such as release coatings, rubber, textile coating, healthcare, personal care, mould making, speciality fluids, sealing and bonding and construction.
Upstream capacity of more than 300 000 tonnes per year of siloxane (inluding Xinghuo) and more than 250 000 tonnes capacity per year of inter mediates and silicones.
Roussillon and Saint-Fons, France; Lübeck, Germany; Caronno, Italy; Santa Perpetua, Spain; York, USA; Shanghai and Joinville, Brazil. In addition, China and Elkem has management responsibility for Xinghuo Silicones, China.
PRODUCTS CAPACITY PLANTS
* Excluding Xinghuo. ** The division's share of the group revenues is calculated including the division's intra group transactions.
Unit 2017 2016 Share of group 2017** Revenue NOK million 5 451 5 029 33%
No. of emplyees Full-time equivalent 1 426 1 401 37%
KEY NUMBERS*
ELKEM ANNUAL REPORT 2017 11
Frédéric Jacquin has been the SVP of Silicones in Elkem since 2015. Mr. Jacquin has previously worked 11 years in Bluestar Silicones International. He held the position as Vice President of Marketing and Sales before he was appointed CEO of Bluestar Silicones in early 2015. He has a long experience with specialty chemicals and has thereby acquired a broad and in-ternational experience in specialty chemicals business development and industrial marketing.
INTERVIEW with SVP Elkem Silicones, Frédéric Jacquin

12 ELKEM ANNUAL REPORT 2017 ELKEM ANNUAL REPORT 2017 13
Silicon Materials
ELKEM’S DIVISIONS
The Silicon Materials division manufactures and sells silicon and Elkem Microsilica® for a large number of applications. The division delivers products to customers in the chemical, solar, electronics, aluminium, construction, refractory, oil and gas industries worldwide.
Summing up 2017 It has been a good year for the Silicon Materials division. A main focus this year has been the take-over and integration of the two new plants in our division. Elkem Rana, located in Mo Industrial Park, and Yongdeng plant located in Gansu province in China. Both plants have contributed to solid financial results. We are currently executing an upgrade programme at Elkem Rana investing about NOK 150 million. The investment programme will reduce fugitive emissions, improve safety and increase capacity by equipment upgrades. At Elkem Salten, we are executing main study to realise energy recovery system to recover 275 GWh electrical power. For the Yongdeng plant we have an ongoing upgrade programme to improve operations even more and to reduce emissions from the plant.
We have continued our work to improve our integrated value chain – from quartz to silicones. Joint technical teams from the plants, divisions and corporate R&D have achieved excellent results in improving productivity and cost reductions along the value chain.
Elkem business strategy The significant size of our metallurgical operations brings many advantages such as access to high quality raw materials, economies of scale, process understanding and technology development and dominant position for development and sales of Elkem Microsilica®. In addition, our integrated value chain from quartz to silicones facilitate realization of significant synergies. Going forward, Elkem Silicon Materials has a growth strategy. The growth is targeted for selected speciality segments of the market where we have competitive advantages.
Silicon produced in different purities and sizes according to customer needs.Elkem Microsilica®, which is used in construction, refractory, oilfield and polymer industries, because of its many unique properties.
215 000 tonnes of silicon and 300 000 tonnes of Microsilica® per year.
Salten, Thamshavn, Bremanger and Rana, all in Norway.
PRODUCTS CAPACITY PLANTS
Tana and Mårnes, both in Norway, and Explotación de Rocas Industriales y Minerals SA (Erimsa), Spain.
QUARTZ MINES
ELKEM ANNUAL REPORT 2017 13
Trond Sæterstad has been the SVP of Elkem Silicon Materials since 2012. Mr. Sæterstad has previously held the position as Senior Vice President of Elkem Solar AS and has been the former plant manager at Elkem plants both for silicon and ferroalloy before he was appointed SVP of Elkem Silicon Materials.
Products and applications Silicon Materials comprise a wide range of versatile products including high purity silicon and microsilica. The common denominator for the product category is the element silicon (Si), which serves as the backbone for various individual products. Silicon production builds on quartz and quartzite, which consist of Si and oxygen (O2), “SiO2”. Quartz is one of the most abundant minerals on the earth. The silicon production process consists of heating quartz and coal in a high temperature electric arc furnace together with woodchips and coal-based reductants leading to a carbothermal reduction of quarts.
Silicon has a number of favourable chemical and physical properties, including semi-conductivity, making it highly versatile for numerous industrial and electronic appli cations. As such, it has a wide array of applications predominantly as an alloy with aluminium and in the production of silicones and polysilicon, as set forth below.
Aluminium alloys: Silicon is used as an alloying agent in the aluminium industry due to its ability to increase the castability, corrosion resistance, hardness, tensile strength, wear-resistance and weldability of aluminium. The automotive industry commonly uses aluminium alloys to produce engine blocks, chassis, body sheets and wheel rims.
Silicones: Silicones are silicon-based polymers found in both speciality applications and numerous everyday industrial and consumer products such as lubricants, greases, resins and skin and hair care products. In recent years, silicones have become increasingly more relevant in various sectors such as healthcare due to their strong chemical and physical properties relative to other materials.
Polysilicon: Polysilicon is a high purity, polycrystalline form of silicon, used in the electronics industry, in semi-conductors and photovoltaic (PV) cells for the solar industry, and in optical fibre.
INTERVIEW with SVP Elkem Silicon Materials, Trond Sæterstad
Unit 2017 2016 Share of group 2017 Revenue NOK million 5 534 4 540 33%
No. of emplyees Full-time equivalent 902 899 23%
KEY NUMBERS*
* Excluding Yongdeng.

14 ELKEM ANNUAL REPORT 2017 ELKEM ANNUAL REPORT 2017 15
Foundry Products
ELKEM’S DIVISIONS
The Foundry Products division provides metal treatment solutions to iron foundries and is a supplier of high quality speciality ferrosilicon to the steel industry. The auto-motive, engineering, pipe and steel industries are important markets for the division.
Summing up 2017The year was very good for our division; we increased our sales of foundry alloys with 21%. We also completed the construction of a new plant in China, which will help us to realise our vision of becoming a true global leader in metal treatment solutions for the iron industry.
MilestonesA main highlight of 2017 was the construction and opening of our new foundry alloy plant in China in December. This is an important step in the journey that we started back in 2013, when we first set our vision of becoming a true global industry leader. At that point, we had a strong footprint in North America and Europe, and identified the need for local production in Asia. The construction of a new plant in China began shortly thereafter. This new plan will help us further realise our speciality strategy, delivering tailor-made solutions to customers that will both reduce costs and increase efficiency.
Elkem business strategy We are constantly working on specialisation within our product portfolio, and have improved our market share of foundry products in 2017. We have also managed to keep our cost level down, remaining at a similar level to our 2016 results.
The division is a supplier of high quality speciality ferrosilicon and provides metal treatment solutions to iron foundries.
The division has a total production capacity of approximately 307 000 tonnes per year, based on its current product mix of ferrosilicon-magnesium (nodularisers), inoculants and ferrosilicon.
Elkem Bremanger and Elkem Bjølvefossen, Norway; Elkem Iceland; Elkem Chicoutimi, Canada; Elkem Foundry China (EFC), Shizuishan, China; Nagpur, India. Paraguay under construction.
PRODUCTS CAPACITY PLANTS
ELKEM ANNUAL REPORT 2017 15
Jean Villeneuve has been the SVP of Foundry Products of Elkem since 2011. Mr. Villeneuve has worked in Elkem since 1979, as Plant Manager from 2006 to 2008 for Elkem Chicoutimi and as Gen-eral Manager Americas from 2008 to 2011 before he was appointed SVP of Foundry Products.
Products and applications The market for foundry products can be divided into two segments, ferrosilicon and foundry alloys. Ferrosilicon used in the steel industry, notably in electrical and engineering steels and stainless steel. Foundry Alloys are used in the iron foundry industry.
Ferrosilicon is an alloy of iron and silicon, with silicon content ranging from 45% to 90%. It is produced in an electric arc furnace similar to silicon, where quartz or quartzite is reduced by carbon, normally in the form of coal and other reductants. In contrast to the production of silicon, scrap iron, millscale or other sources of iron are added into the furnace. Ferrosilicon is mainly used in the steel industry where it is generally used to remove oxygen from the steel and as an alloying element to
enhance certain qualities of steel, including strength and elasticity, and lowers the electrical conductivity and magnetostriction. Specialty ferrosilicon, such as low aluminium, low carbon, and high purity ferrosilicon, are generally used in the production of specialty steels, which are used in a number of high-end applications like transformers/motors, ball bearings and stainless steel.
Foundry alloys are specialty alloys based on ferrosilicon with a specific addition of other active elements. These elements are most often added in the ladle after the smelting process to achieve the desired properties. Foundry alloys are mainly used in the production of iron castings to improve their properties such as tensile strength, ductility and impact properties, and to refine the homogeneity of the iron foundry structure.
INTERVIEW with SVP Elkem Foundry Products, Jean Villeneuve
* The division share of the group revenues is calculated including the division intra group transactions.
Unit 2017 2016 Share of group 2017* Revenue NOK million 4 247 3 642 25%
No. of emplyees Full-time equivalent 752 734 20%
KEY NUMBERS

16 ELKEM ANNUAL REPORT 2017 ELKEM ANNUAL REPORT 2017 17
Carbon
ELKEM’S DIVISIONS
The Carbon division produces carbon materials. The main products are Søderberg electrode paste, lining materials, pre-baked electrodes and specialty carbon products for various metallurgical smelting processes and primary aluminium industries.
Summing up 2017In 2017, I was most pleased with the way we worked towards achieving our financial results, and that our attention on EHS resulted in no serious H1/H2 injuries. We were set back by increased raw materials cost towards the end of the year, but managed to offset the negative effect with productivity improvements. In the end, the results were in line with previous record numbers in 2016 and 2015, and at the Fiskaa plant we have reached an all-time high. Milestones We reached some major environmental milestones this year. Our sulphur cleaning installation at Fiskaa was completed on time, below budget and with good quality. This is an important sustainability measure and will provide energy savings equivalent to 800 households. It will also reduce sulphur emissions by 620 tonnes. Elkem business strategy This year we have focused on critical process management (CPM) activities in order to make our processes more efficient and increased our R&D work to become even more sustainable in the future. We expect to see results from this work in 2018, with “greener products” and lower emissions in our processes. We have strengthened our market position with the product Elgraph (recarburizer), and want to expand further in 2018.
Søderberg electrode paste, lining materials, pre-baked electrodes and specialty carbon products for various metallurgical smelting processes and primary aluminium industries.
Carbon has an annual production capacity of approximately 260,000 tonnes of Søderberg electrode paste and approximately 105,000 tonnes of other carbon products, depending on the product mix.
Kristiansand, Norway; Shizuishan, China; Sarawak, Malaysia; Carboindustrial and Carboderivados, Vitoria, Brazil; Ferroveld JV, eMalahleni, South Africa
PRODUCTS CAPACITY PLANTS
ELKEM ANNUAL REPORT 2017 17
Asbjørn Søvik has been the SVP of Carbon in Elkem since 2007. Mr. Søvik has worked in Elkem since 1995 and was previously responsible for business develop-ment in Elkem corporate. He has an extensive international man-agement experience from plants and divisions in the United States, Brazil and Norway. He has a broad knowledge of most of Elkem’s different functions, such as raw materials, energy, operations and markets & sales.
Products and applications Carbon products, such as electrodes, are used in electric arc furnaces and by the aluminium and iron foundries industries. Søderberg electrode paste is the most common electrode system used in submerged arc furnaces to ensure that the raw material reaches the required process temperatures. It is used by producers of silicon, ferrosilicon, ferrochromium, ferronickel, ferromanganese, silicomanganese, calcium carbide and copper and platinum matte.
Recarburisers are carbon additives that are added to the furnace during smelting to allow for increased use of scrap in the raw materials mix, or to achieve certain required properties in final casting parts. Cathode ramming paste and high-density cathode blocks are used in the aluminium industry and contribute to extended pot life and stable operation. Their main function is to ensure the tightness of the cathodic container to prevent any infiltration of bath and metal.
INTERVIEW with SVP Elkem Carbon, Asbjørn Søvik
* The division share of the group revenues is calculated including the division intra group transactions.
Unit 2017 2016 Share of group 2017* Revenue NOK million 1 577 1 375 9%
No. of emplyees Full-time equivalent 421 420 11%
KEY NUMBERS
18 ELKEM ANNUAL REPORT 2017 ELKEM ANNUAL REPORT 2017 19
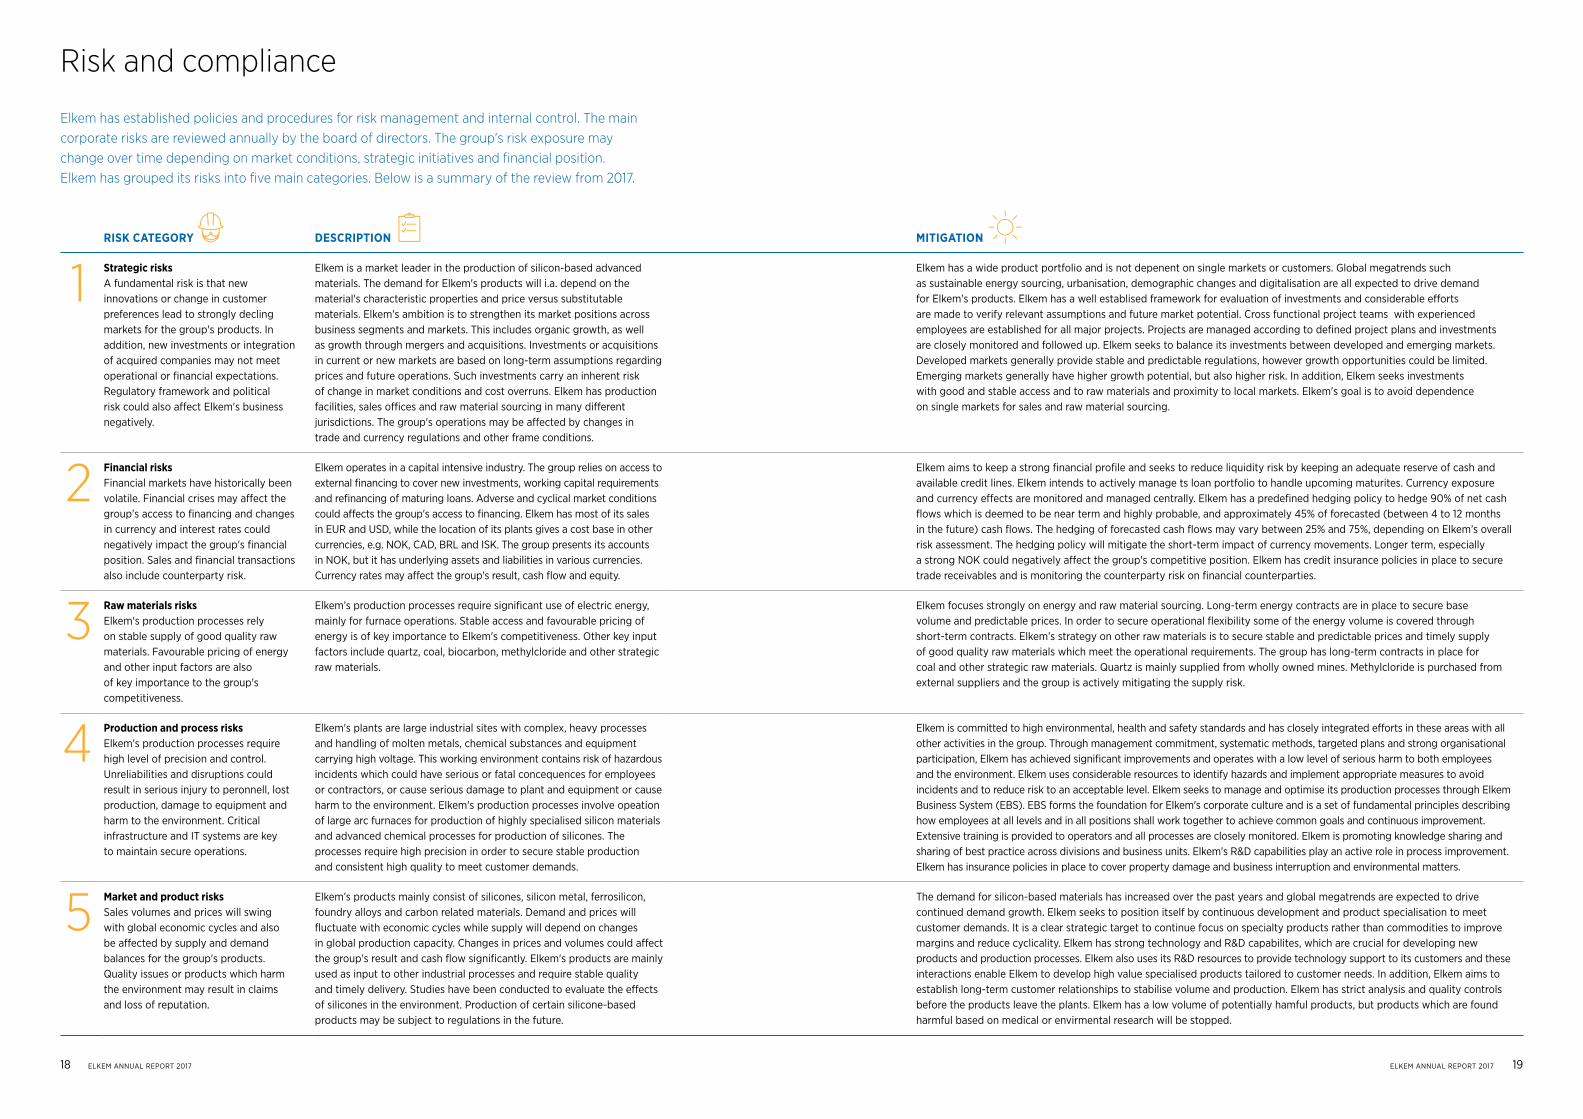
Risk and compliance
RISK CATEGORY DESCRIPTION MITIGATION
1 Strategic risks A fundamental risk is that new innovations or change in customer preferences lead to strongly decling markets for the group's products. In addition, new investments or integration of acquired companies may not meet operational or financial expectations. Regulatory framework and political risk could also affect Elkem's business negatively.
Elkem is a market leader in the production of silicon-based advanced materials. The demand for Elkem's products will i.a. depend on the material's characteristic properties and price versus substitutable materials. Elkem's ambition is to strengthen its market positions across business segments and markets. This includes organic growth, as well as growth through mergers and acquisitions. Investments or acquisitions in current or new markets are based on long-term assumptions regarding prices and future operations. Such investments carry an inherent risk of change in market conditions and cost overruns. Elkem has production facilities, sales offices and raw material sourcing in many different jurisdictions. The group's operations may be affected by changes in trade and currency regulations and other frame conditions.
Elkem has a wide product portfolio and is not depenent on single markets or customers. Global megatrends such as sustainable energy sourcing, urbanisation, demographic changes and digitalisation are all expected to drive demand for Elkem's products. Elkem has a well establised framework for evaluation of investments and considerable efforts are made to verify relevant assumptions and future market potential. Cross functional project teams with experienced employees are established for all major projects. Projects are managed according to defined project plans and investments are closely monitored and followed up. Elkem seeks to balance its investments between developed and emerging markets. Developed markets generally provide stable and predictable regulations, however growth opportunities could be limited. Emerging markets generally have higher growth potential, but also higher risk. In addition, Elkem seeks investments with good and stable access and to raw materials and proximity to local markets. Elkem's goal is to avoid dependence on single markets for sales and raw material sourcing.
2 Financial risks Financial markets have historically been volatile. Financial crises may affect the group's access to financing and changes in currency and interest rates could negatively impact the group's financial position. Sales and financial transactions also include counterparty risk.
Elkem operates in a capital intensive industry. The group relies on access to external financing to cover new investments, working capital requirements and refinancing of maturing loans. Adverse and cyclical market conditions could affects the group's access to financing. Elkem has most of its sales in EUR and USD, while the location of its plants gives a cost base in other currencies, e.g. NOK, CAD, BRL and ISK. The group presents its accounts in NOK, but it has underlying assets and liabilities in various currencies. Currency rates may affect the group's result, cash flow and equity.
Elkem aims to keep a strong financial profile and seeks to reduce liquidity risk by keeping an adequate reserve of cash and available credit lines. Elkem intends to actively manage ts loan portfolio to handle upcoming maturites. Currency exposure and currency effects are monitored and managed centrally. Elkem has a predefined hedging policy to hedge 90% of net cash flows which is deemed to be near term and highly probable, and approximately 45% of forecasted (between 4 to 12 months in the future) cash flows. The hedging of forecasted cash flows may vary between 25% and 75%, depending on Elkem’s overall risk assessment. The hedging policy will mitigate the short-term impact of currency movements. Longer term, especially a strong NOK could negatively affect the group's competitive position. Elkem has credit insurance policies in place to secure trade receivables and is monitoring the counterparty risk on financial counterparties.
3 Raw materials risksElkem's production processes rely on stable supply of good quality raw materials. Favourable pricing of energy and other input factors are also of key importance to the group's competitiveness.
Elkem’s production processes require significant use of electric energy, mainly for furnace operations. Stable access and favourable pricing of energy is of key importance to Elkem's competitiveness. Other key input factors include quartz, coal, biocarbon, methylcloride and other strategic raw materials.
Elkem focuses strongly on energy and raw material sourcing. Long-term energy contracts are in place to secure base volume and predictable prices. In order to secure operational flexibility some of the energy volume is covered through short-term contracts. Elkem’s strategy on other raw materials is to secure stable and predictable prices and timely supply of good quality raw materials which meet the operational requirements. The group has long-term contracts in place for coal and other strategic raw materials. Quartz is mainly supplied from wholly owned mines. Methylcloride is purchased from external suppliers and the group is actively mitigating the supply risk.
4 Production and process risksElkem's production processes require high level of precision and control. Unreliabilities and disruptions could result in serious injury to peronnell, lost production, damage to equipment and harm to the environment. Critical infrastructure and IT systems are key to maintain secure operations.
Elkem's plants are large industrial sites with complex, heavy processes and handling of molten metals, chemical substances and equipment carrying high voltage. This working environment contains risk of hazardous incidents which could have serious or fatal concequences for employees or contractors, or cause serious damage to plant and equipment or cause harm to the environment. Elkem's production processes involve opeation of large arc furnaces for production of highly specialised silicon materials and advanced chemical processes for production of silicones. The processes require high precision in order to secure stable production and consistent high quality to meet customer demands.
Elkem is committed to high environmental, health and safety standards and has closely integrated efforts in these areas with all other activities in the group. Through management commitment, systematic methods, targeted plans and strong organisational participation, Elkem has achieved significant improvements and operates with a low level of serious harm to both employees and the environment. Elkem uses considerable resources to identify hazards and implement appropriate measures to avoid incidents and to reduce risk to an acceptable level. Elkem seeks to manage and optimise its production processes through Elkem Business System (EBS). EBS forms the foundation for Elkem's corporate culture and is a set of fundamental principles describing how employees at all levels and in all positions shall work together to achieve common goals and continuous improvement. Extensive training is provided to operators and all processes are closely monitored. Elkem is promoting knowledge sharing and sharing of best practice across divisions and business units. Elkem's R&D capabilities play an active role in process improvement. Elkem has insurance policies in place to cover property damage and business interruption and environmental matters.
5 Market and product risksSales volumes and prices will swing with global economic cycles and also be affected by supply and demand balances for the group's products. Quality issues or products which harm the environment may result in claims and loss of reputation.
Elkem’s products mainly consist of silicones, silicon metal, ferrosilicon, foundry alloys and carbon related materials. Demand and prices will fluctuate with economic cycles while supply will depend on changes in global production capacity. Changes in prices and volumes could affect the group's result and cash flow significantly. Elkem's products are mainly used as input to other industrial processes and require stable quality and timely delivery. Studies have been conducted to evaluate the effects of silicones in the environment. Production of certain silicone-based products may be subject to regulations in the future.
The demand for silicon-based materials has increased over the past years and global megatrends are expected to drive continued demand growth. Elkem seeks to position itself by continuous development and product specialisation to meet customer demands. It is a clear strategic target to continue focus on specialty products rather than commodities to improve margins and reduce cyclicality. Elkem has strong technology and R&D capabilites, which are crucial for developing new products and production processes. Elkem also uses its R&D resources to provide technology support to its customers and these interactions enable Elkem to develop high value specialised products tailored to customer needs. In addition, Elkem aims to establish long-term customer relationships to stabilise volume and production. Elkem has strict analysis and quality controls before the products leave the plants. Elkem has a low volume of potentially hamful products, but products which are found harmful based on medical or envirmental research will be stopped.
Elkem has established policies and procedures for risk management and internal control. The main corporate risks are reviewed annually by the board of directors. The group's risk exposure may change over time depending on market conditions, strategic initiatives and financial position. Elkem has grouped its risks into five main categories. Below is a summary of the review from 2017.

20 ELKEM ANNUAL REPORT 2017 ELKEM ANNUAL REPORT 2017 21
Health and safety
20 ELKEM ANNUAL REPORT 2017 ELKEM ANNUAL REPORT 2017 21
Environment, health and safety (EHS) is at the backbone of Elkem’s business and is always our first priority. We work systematically to maintain and improve a high standard on energy efficiency, efficient natural resource utilisation, and reduced emissions. Most important is the safety of our employees, and we have a zero-harm philosophy when it comes to health and safety.
EHS MANAGEMENT SYSTEM Historically, Elkem has experienced the consequences of not fully controlling the EHS challenges through serious injuries, illnesses, fatalities, major fires and environmental effects. This is why the Elkem policy makes EHS its top priority. This is also why Elkem uses substantial resources every year to understand and evaluate risks, in order to prevent harm caused by Elkem activities.
MAJOR CHALLENGES AND PRIORITISED IMPROVEMENT AREAS IN 2017
Safety Main safety efforts for 2017 have focused on individual behaviour and the Silicones division’s implementation of Elkem’s EHS management system with tools and standards.
• Individual behaviour continues to be the main cause of almost all injuries in Elkem. Special behaviour- related programmes have been initiated and were implemented at many plants through 2016 and 2017.
• The total number of recordable injuries for 2017 including contractor injuries was 43. Only six of them were defined as medium to high severity injuries.
• One-day basic training was carried out in 2017 for all employees in the Silicones division to implement Elkem’s
EHS philosophy, tools and standards. The division is also now integrated in the Elkem EHS audit programme.
• There has also been special efforts to improve technical safety and process safety during 2017.
HealthHealth performance is measured by employee sick leave, where the long-term trend is flat. Elkem is increasing its focus on measuring working environment exposures. Elkem is also looking at new tools and models to measure activities for improvement in this area:
• Dust in the work environment is a major concern for smelters. The DUSTEX project was initiated in Norway in 2017, after The Norwegian Labour Inspection Authority issued an order to reduce dust exposure in workplaces. Two of five Elkem plants have received final approval for compliance with the order. The other three plants are working to ensure compliance in cooperation with the authorities.
• Elkem has also participated as a pilot in the develop-ment of a tool for measuring efforts to reduce work environment exposure by the Federation of Norwegian Industries. This gives an exciting potential for more structured and goal-oriented efforts to improve the work environment.
“FOKUS” is Elkem’s programme for environment, health and safety in the workplace. "FOKUS" is closely connected to the Elkem Business System (EBS) and emphasises many of the same principles and tools. FOKUS builds on five basic principles:
1 Improvement has no limits.
2 Zero-harm philosophy: All incidents and injuries are preventable.
3 All incidents and/or injuries will always have one or more causes. Causes will always be associated with unsafe conditions, unsafe actions, or a combination of both. Reporting and investigating all incidents and injuries allows us to identify root causes and eliminate them before they can cause more serious harm.
4 Effective prevention of harm requires hazard identification, risk analysis and the implementation of actions to reduce unacceptable risk to an acceptable level.
5 Success depends on all employees being actively involved in health and safety work and sharing the responsibly for a safe working environment.

22 ELKEM ANNUAL REPORT 2017 ELKEM ANNUAL REPORT 2017 23
The board has adopted instructions for its work and administrative procedures. These instructions are pursuant to the Public Limited Liability Companies Act. The board instructions also include separate instructions for the CEO.
Elkem’s board meets regularly and the CEO shall each year, in consultation with the chairman, propose a meeting plan and a main agenda for the board meet-ings. The board normally schedules four meetings each year, with additional meetings held on an ad hoc basis.
No board member may participate in discussions or decisions, which have particular personal interest or significance to them or someone close to them.
The board receives monthly management reports, which contain an overview of financial performance, market development, update on main projects and status on environment, health and safety.
The board has currently not appointed any board committees.
Risk management and internal control Elkem has established policies and procedures for risk management and internal control. Governing documents and other tools have been dedicated to the areas of sustainability and social responsibility to safeguard basic human rights, the employees’ rights as workers, environ-mental concerns, a sustainable utilization of natural resources and business integrity. Elkem does not permit or tolerate engagement in any form of corruption and has implemented an anti-corruption policy that defines different forms of corruption and how it must be avoided.
Assessment of risks include all aspects of the operation and is delegated as a line responsibility. This includes
strategic risks, financial risks, raw material risks, production and process risks and market and product risks. A review of the main risk areas is part of the annual review of the group’s strategic plan. The board and corporate manage-ment are regularly updated on the group’s performance and decisive measures are taken when needed.
The group’s internal control function is exercised through monthly reviews of the business activities at the group management level. The monthly reviews are conducted according to stated agendas and checklists.
A detailed authority structure has been developed to determine who can make decisions at various levels in the organisation.
Elkem has a CSR steering committee, which is responsible for defining and obtaining necessary approvals from the corporate management and the board, and following up governing documents for corporate social responsibility. The committee is also responsible for Elkem's sustaina-bility reporting, including progress on environmental, social and economic development within the Global Reporting Initiative (GRI).
AuditorElkem’s auditor is appointed by Bluestar. KPMG is the group’s auditor from 2016.
The auditor is present in at least one board meeting each year, normally to present the results of the interim audit. An annual meeting is held between the board and the auditor without the presence of the CEO or other members of the executive management.
Elkem is a dedicated responsible partner aiming to help customers and other stakeholders delivering their potential. Our mission is to contribute to a sustainable future by providing advanced silicon and carbon solutions that create value for our stakeholders globally. Elkem operates its business under the Elkem Business System (EBS), which is dedicated to lean manufacturing and efficient operational processes. This system for continuous improvement is underpinned by Elkem’s values: Involvement, Respect, Precision and Continuous Improve-ment, which form the foundation for how we work.
Elkem has a strong commitment to sustainable development and responsible business behaviour and is a signatory to the UN Global Compact. Elkem’s corporate social responsibility policy (CSR) is according to the UN Global Compact’s ten principles for human rights, labour rights, environment and anti-corruption. CSR forms an important part of Elkem's business culture. All employees are obliged to follow Elkem's policies and principles, to report discrepancies according to company guidelines, and to help investigate and correct discrepancies.
The group intends to follow the principles in the Norwegian Code of Practice for Corporate Governance, where applicable.
BusinessElkem was founded in 1904 and is a market leader in the production of silicon-based advanced materials. Elkem is a fully integrated producer with operations throughout the silicon value chain from quartz to silicon and downstream silicone specialities, as well as speciality ferrosilicon alloys and carbon materials.
Elkem’s business scope is defined by our articles of association:
The object of the company is to develop and engage in industry, mining, trade and transportation as well as exploration and exploitation of natural resources. The company may also develop, acquire and exploit patents, inventions and technical knowhow. The company may
participate directly or by other means in companies engaged in activities outlined above or activities that promote or support such objects.
Equity As of 31 December 2017, the group’s equity was NOK 8 333 million, which is equivalent to 51% of total assets. Elkem will focus on having an efficient capital allocation, taking into consideration capital expenditure plans, financing requirements and maintaining the appropriate strategic flexibility. The board considers the group’s financial position to be strong.
Elkem’s shares are 100% owned by Bluestar Elkem International Co. Ltd. S.A., which is controlled by China National Bluestar (Group) Co. Ltd. (Bluestar).
Board of directors In 2017 Elkem's board of directors consisted of eight members. The owner Bluestar appoints six members of the board, and two members are elected by the employees.
Mr. Michael Koenig, the CEO of Bluestar, is chairman of the board. Elkem’s CEO Helge Aasen is board member elected by the owners and also sits on Bluestar’s board of directors. This is in line with Bluestar practice.
Please refer to note 5 of the consolidated financial statement for overview of remuneration of the board of directors and executive personnel.
The work of the board of directorsThe board of directors shall ensure proper organisation of the company’s activities, adopt plans and budgets, oversee the day-to-day management and the company’s activities in general and ensure that the activities, accounting and administration of the assets are satis factorily monitored.
Corporate governance
Good corporate governance is a pre requisite for value creation and trustworthiness. Elkem’s governance documents set out our principles and guide the way we conduct business.

24 ELKEM ANNUAL REPORT 2017 | REPORT FROM THE BOARD OF DIRECTORS ELKEM ANNUAL REPORT 2017 | REPORT FROM THE BOARD OF DIRECTORS 25
OPERATING REVENUES (MNOK) GROSS OPERATING PROFIT (MNOK) EQUITY RATIO (%)
18 000
16 000
14 000
12 000
10 000
8 000
6 000
4 000
2 000
0
2 500
2 000
1 500
1 000
0
60%
50%
40%
30%
20%
10%
0%
16%
14%
12%
10%
8%
6%
4%
2%
0%
2017 2017 2017
Gross operating profit
Gross operating margin
2013 2013 20132014 2014 20142015 2015 20152016 2016 2016
Report from the board of directors
Strong results and business progress
ABOUT ELKEM Elkem is one of the world’s leading Groups for environmentally responsible production of materials. Its principal products are silicones, silicon, ferrosilicon, foundry alloys, carbon materials and microsilica. The Group has more than 3940 employees and reports four business areas: Silicones, Silicon Materials, Foundry Products and Carbon.
Elkem has production facilities in Europe, North and South America, Africa and Asia, as well as an extensive network of sales offices and agents covering the most important markets.
Elkem has centralised support functions and head-quarters in Oslo, Norway.
As at 31.12.2017 Elkem AS is owned 100% by Bluestar Elkem International Co. Ltd. S.A., which is under the control of China National Bluestar Group Co. Ltd (Bluestar).
ELKEM’S PERFORMANCE IN 2017 Elkem delivered strong results in 2017 following improved market conditions and delivering on its strategic plan via cost- and efficiency improvement programs, increased speciality products sales and focus on organic and acquisitive growth. Safety performance was better in 2017 than 2016, but Elkem still has improvement potentials and a zero accident ambition. Financial results were strong, following a year of near finance crisis price levels in 2016. Elkem has spent substantial time and resources on integrating new assets into the Elkem Group, and Elkem is positioned for further growth in 2018.
Operating revenues improved by 17% year-on-year. Gross operating profit 1 margin ended at 12.6%, which is an improvement from 2016. Equity ratio 2 ended at 51%, which is strong and enables Elkem for step-change growth and acquisitions.
During 2017, Elkem carried out several initiatives that supports Elkem’s ambition for growth:
• Elkem celebrated the opening of a new Foundry plant in Shizuishan City, Ningxia province on 12 December. The new plant strengthens Elkem’s footprint in China, increasing its capacity of special ferro-alloy materials from 10 000 mt per year to 30 000 mt per year.
• Elkem Carbon completed its environment friendly energy recovery and Sulphur treatment facility in Kristiansand. The plant will save energy equivalent to 800 households and cut Suplhur emissions by 620 mt per year.
• On 30 September, Elkem increased the ownership from 50% to 100% of a new Ferrosilicon and foundry alloy plant being constructed in Paraguay. The plant will have 1 furnace with a capacity of 11 000 mt. Elkem plans to ramp-up the plant during 1st half of 2018.
• During the year, Bluestar Silicones (BSI) changed its name to Elkem Silicones, marking a stronger integration to Elkem post Elkem’s acquisition of BSI in 2015.
1 Gross operating profit: Gross operating profit (loss), excluding other gains and losses is also referred to as EBITDA (Earnings Before Interest Taxes Depreciation and Amortization) in Elkem.
2 Equity ratio: defined as Total equity / Total equity and liabilities.
26 ELKEM ANNUAL REPORT 2017 | REPORT FROM THE BOARD OF DIRECTORS ELKEM ANNUAL REPORT 2017 | REPORT FROM THE BOARD OF DIRECTORS 27
pared to NOK 718 million in 2016. The increase is partially explained by the acquisition of Elkem Rana and Elkem Nagpur.
Profit before income tax ended at NOK 1,281 million positive for the year. Net finance items recognized in profit or loss amounted to NOK 100 million negative while foreign exchange loss amounted to NOK 8 million. Income from associates and joint ventures amounted to NOK 34 million positive.
The consolidated profit for the year was NOK 1,012 million positive, including NOK 269 million tax expense for the year, giving an effective tax rate of 21%.
The main items recognized in the consolidated state-ment of other comprehensive income relates to cash flow hedges (foreign currency hedges and power price hedges). These items had a net positive effect of NOK 55 million for 2017, compared to a net positive effect of NOK 647 million in 2016. The positive effects in 2016 was largely related to positive cash flow hedges effects of NOK 930 million countered by tax effects on cash flow hedges of NOK 238 million and currency translation differences of NOK 65 million. In 2017 hedging of net investment in foreign operations amounted to NOK 209 million negative, countered by tax effects hedging of net investment in foreign operations of NOK 48 million and currency translation differences of NOK 226 million.
Cash flow and statement of financial positionCash flow from operating activities was NOK 1,534 million positive for the year. Operating profit was NOK 1,355 million positive. Amortisation, depreciation and impairment changes amounted to NOK 793 million. Changes in net working capital and in other balance sheet items was NOK 255 million due to increased activity resulting in higher accounts receivables and inventory partially countered by increased accounts payables. Interest payments made amounted to NOK 92 million. Taxes paid amounted to NOK 198 million for the year.
Cash flow from investing activities amounted to outflow of NOK 927 million for the year. Elkem invested NOK 712 million into maintenance, EHS, and productivity improvement initiatives during the year. In addition, Elkem invested NOK 299 million into growth and step-change investments. The strategic investments in 2017 were primarily related to Silicones’ specialisation volume development, energy recovery and Sulphur treatment at Carbon Fiskaa plant, capacity increases and relocation of Elkem Foundry China and technical and environmental upgrades at the Elkem Rana plant within the Silicon Materials.
Cash flow from financing activities was NOK 355 million negative. Dividends paid to the owner amounted to NOK 144 million, and repayment of interest-bearing loans and borrowings amounted to NOK 245 million.
Elkem’s financial position continued to improve during the year. Elkem’s equity was NOK 8,333 million at the end of the year, including non-controlling interest. The equity ratio improved from 50% in 2016 to 51% in 2017. The strong equity ratio constitutes a healthy basis for further expansion and growth.
Net interest-bearing debt 4 amounted to NOK 1,742 million per 31.12.2017. Cash and cash equivalents amounted to NOK 1,601 million, in addition to NOK 2,331 million in undrawn credit facilities.
The board of directors confirms that the company satisfies the going concern assumption, and that the 2017 financial statements have been prepared on this basis. GOVERNANCE Elkem considers good corporate governance to be a prerequisite for value creation and trustworthiness. The Norwegian Code of Practice for Corporate Governance (Code of Practice) is primarily intended for companies listed on regulated markets. However, the group intends to follow the principles in the Code of Practice.
The board of directors is responsible for managing the group and ensuring proper organisation and monitoring of the group’s activities. Elkem has govern-ance documents approved by the board, setting out the principles for how the group should conduct its business.
The board of directors consists of eight members, six of which are appointed by Bluestar and two which are elected by the employees. The board had four regular board meetings scheduled in 2017. In addition, the board had extraordinary meetings scheduled during the year. During the year, board member Dazhuang Wang was replaced by Zhigang Hao.
Elkem’s executive management team was unchanged during 2017.
Risk ManagementElkem aims to manage risk in a systematic and profes-sional manner. The group has policies and procedures in place to secure proper risk management and internal control. Assessment of risks is delegated as a line
• As part of Elkem’s growth strategy, Elkem resumed management responsibility for Jiangxi Bluestar Xinghuo Organix Silicone (Xinghuo) and Bluestar Silicone Material Co., Ltd. (Yongdeng) towards the end of June. These two companies were per 31.12.2017 owned by Bluestar. Yongdeng will be organised as part of the Silicon Materials, whereas Xinghuo Silicones will be organised as part of Silicones. On 30 January 2018, Elkem AS entered into an agreement with Bluestar Elkem Investment HK Ltd to purchase Xinghuo and Yongdeng. The share purchase agree-ment is subject to IPO of Elkem AS.
Elkem is persistent to strengthen its market position in the coming years and will target a sustainable improvement culture working along the principles of Elkem Business Systems (EBS) to achieve Environ-ment, Health and Safety (EHS), quality, time and cost improvements.
Thanks to great work from our employees and in adherence to EBS principles, Elkem is well positioned to future growth complemented by a strong statement of financial position.
As part of Elkem’s strategic direction, Elkem is planning an IPO during first quarter of 2018. Elkem was acquired by Bluestar in 2011, and has since then become a global integrated advanced material company with the acquisition of Bluestar Silicones in 2015 and the planned acquisition of Xinghuo and Yongdeng during first half of 2018. As part of the planned IPO and acquisition, Elkem is planning to refinance the debt and seek a healthy basis for further growth. Please see the section subsequent events for further details.
Financial resultsOperating income for the Elkem group amounted to NOK 16,658 million compared to NOK 14,226 million in 2016. The operating income increased by 17%, due to higher sales prices, improved sales volumes and acquisitions. Silicones improved operating income mainly due to increased sales volume and improved sales prices. Silicon Materials operating income in-creased mainly due to acquisition of Rana, in addition to improved sales prices. Foundry Products operating income improved in 2017 helped by increased sales prices, improved sales volumes in particular for speciality products, and acquisition of Nagpur in India. Carbon increased operating income due to increased sales volumes.
Elkem’s gross operating profit ended at strong NOK 2,098 million compared to NOK 1,618 million in 2016. The improvement in gross operating profit was supported by positive development in sales prices,
in particular FeSi prices, favourable currency hedge effects, and positive sales volume improvements from all business areas. This was only partially countered by increased raw materials prices and other cost increases in 2017.
Silicones experienced 6% improved sales volume overall, whereof most of the growth came in the Surface business area. The sales volume in 2016 was negatively impacted by raw material availability issues following maintenance stops by certain suppliers. This was followed by a strong recovery in 2017 driven by an increase in specialties volumes split between the Surface and eXtensio business area. Sales prices also improved in the period helped by high demand in particular during the second half of 2017. The overall silicones market demand was strong in 2017 combined with tighter supply especially in Europe and China, which led to strong price increases.
Silicon Materials experienced positive contribution from the acquisition of Elkem Rana. This business was acquired in December 2016, whereby only 1 month was included into the 2016 financial statements compared to 12 months in 2017. In addition to positive contribution from Elkem Rana, sales prices contributed positively. On average, CRU 3 reference price for silicon increased by 19% during 2017 compared to 2016. In addition, Silicon Material’s focus on cost roadmap helped to position the silicon smelters to the low end on CRU’s competitive cost curve.
Foundry Products experienced a CRU reference ferro-silicon price increase of 38% on average during 2017 resulting in an improved gross operating profit com-pared to 2016. In addition, sales volume increased during the year, in particular sales of speciality products. The positive contribution from sales prices and sales volume was partially countered by increased raw materials prices.
Carbon delivered a satisfactory gross operating profit in 2017. Sales prices and raw material prices developed unfavourably during the year contributing negatively to the results, whereas sales volumes improved in the period countering the negative development.
Operating profit was NOK 1,355 million in 2017 com-pared to NOK 941 million in 2016. Impairment losses was NOK 17 million in 2017 compared to NOK 12 million in 2016. Other gains and losses was NOK 49 million in 2017 compared to NOK 52 million in 2016. Amortisations and depreciations was NOK 776 million in 2017 com-
3 CRU: CRU offers business intelligence on the global metals, mining and fertilizer industries through market analysis and price assessments. 4 Please refer to Note 22 Interest-bearing assets/liabilities

28 ELKEM ANNUAL REPORT 2017 | REPORT FROM THE BOARD OF DIRECTORS ELKEM ANNUAL REPORT 2017 | REPORT FROM THE BOARD OF DIRECTORS 29
hazards and implement appropriate measures to reduce risk to an acceptable level, so that all employees and contractors performing work at Elkem can leave their jobs just as healthy as they were when they arrived.
Absenteeism is the key performance indicator for health in Elkem. The average rate of absenteeism measured in percent of available working days for 2017 was 3.5%. This is lower than in 2016, but in line with normal variations the past 5 years. This also represents a normal level taking into account the combination of European and non-European plants. Ongoing activities to increase health and wellbeing at Elkem locations include working environment assessments and improvement efforts in the areas of ergonomics, chemical control and noise and dust reduction.
The employee Lost Work Time Injury Rate (H1 = number of lost time injuries per 1.000.000 working hours) for 2017 was 1.6 (2.4 in 2016) while the employee Total Recordable Rate (TRR = H1+H2 = total number of lost work time, medical treatment and restricted work injuries per 1.000.000 working hours) was 4.5 (5.3 in 2016). This represents a good improvement from 2016. Most plants continue to have very good results and two business areas (Foundry Products and Silicones) have shown great improvement in 2017.
None of the recordable injuries for own employees caused long term injury or loss of function.
Recordable contractor injuries are managed in the same manner as own employee injuries even though they are recorded in separate statistics. There were 12 incidents of contractor Lost Work Time injuries in 2017 compared to 20 in 2016.
Gender equalityElkem is committed to provide equal opportunities for all our employees in an inclusive work culture. We appreciate and recognise that every individual is unique and valuable, and should be respected for his or her individual abilities. We do not accept any form of harassment or discrimination based on gender, religion, race, national or ethnic origin, cultural background, social group, disability, sexual orientation, marital status, age or political opinion. Elkem will provide equal employment opportunities and treat all our employees – and job seekers - fairly.
The company has a well-established policy and practice to ensure that there is no discrimination. The policy and established practises include code of conduct, recruit-ment, compensation and benefits, working conditions, possibilities for promotion, development and protection against harassment.
In 2017 the overall share of female employees in Elkem was 22%, which was the same as in 2016. Amongst managers the share was 28%, and amongst white collar workers 36%, slightly up from the previous year. Amongst operators the share of women was only 7%. 22% of the employees that left Elkem were women. Elkem monitors the rate of female employees per country to be able to take specific measures to improve the gender balance where appropriate.
Our recruitment policy states that we will encourage female applicants, both through recruitment advertise-ments and by actively encouraging suitable internal candidates to apply. In our trainee programme we actively prioritise young women applicants and the rate of female trainees was 66% in 2017.
Elkem’s policy is equal pay and equal work hours for men and women. Flexible arrangements can be made for employees where appropriate. We are constantly working to improve the automation of our processes, reducing the amount of physically demanding tasks and thereby improving employee health and increasing the number of female operators.
In order to increase the focus on diversity and discrimination across Elkem, we have developed a specific training module about diversity in our leadership programmes. The goal is to teach our leaders the value of diversity, how to lead diverse teams and how they can increase the diversity in their teams, e.g. to avoid unconscious bias and unintended discrimination.
External environmentElkem converts natural resources such as water, coal, ores and minerals into products that are essential in global economic growth for present and future generations. This conversion of natural resources causes emissions, discharges, and waste. All emissions, discharges and wastes are recorded and dealt with in compliance with public permits at our sites. Elkem is committed to environmentally responsible production and works continuously to reduce our impact on the external environment.
The main environmental focus during 2017 has been on reducing emissions of NOx, SO2 and some volatiles, and on reducing discharge of suspended substances and oxygen depleting substances to water. Special efforts include:
• From 2017 waste to landfill has been included as a main KPI in Elkem’s monthly EHS reporting for selected plants to visualize and further increase the focus on waste reduction.
responsibility to ensure clear ownership for own activities and efficient processes. Corporate manage-ment and the board of directors are updated on the development and the overall risk picture for Elkem on a regular basis through internal business reviews and management reports as well as an annual risk review.
Elkem has a corporate social responsibility (CSR) steering committee. The steering committee defines, obtains approval and follows up CSR governing docu-ments in Elkem. The purpose is to safeguard basic human rights, the employees’ rights as workers, environmental concerns, sustainable utilisation of natural resources and business integrity. Elkem does not permit or tolerate engagement in any form of corruption and has implemented policies for anti-corruption, competition law compliance and whistle blowing.
The group is exposed to several risk factors, which could have considerable effect on its business performance. Elkem has grouped its main risks into five categories, strategic risk, financial risk, raw materials risk, produc-tion and process risk and market and product risk.
The most significant risk is related to prices and sales volumes for silicon related materials, as well as costs for key raw materials, energy and other consumables. The demand for silicon related materials has increased over the past years and the growth is expected to exceed the growth in global GDP. Demand and prices will however fluctuate based on economic cycles and competition, and significant price and volume changes can be observed depending on the overall business sentiment. The executive management and the board closely follow up Elkem’s financial performance and the market development. Elkem’s strategy is to focus on specialised products to meet customer demands and improve pricing stability. In addition, Elkem aims to keep a strong financial profile with adequate equity and liquidity reserves to handle and mitigate the effects of economic downturns.
Elkem’s strategy on raw materials and energy is to secure timely supply, and stable and predictable prices to reduce net exposure through the cycles. The group has long-term contracts in place to secure volume of key input factors. Long-term energy contracts are in place to secure base volume and predictable prices. In order to secure operational flexibility some of the energy volume is covered through short-term contracts. Quartz is mainly sourced from own mines.
Elkem has sales revenues and operating costs in various currencies, mainly EUR and USD. The group aims to mitigate the currency risk by sourcing raw materials and
other costs in the same currencies as the group’s sales revenues. However, the location of Elkem’s plants give rise to net cost base in certain currencies, e.g. Norwe-gian kroner, Canadian dollars, Brazilian real and Icelandic krone. Elkem has a predefined hedging programme to hedge 90% of the net exposure on a 0-3 month rolling basis, and approximately 45% of forecasted cash flows on a 4-12 month rolling basis, to even out effects of currency movements on result and cash flow. The hedging of forecasted cash flows may vary between 25% and 75%. In 2017, the Elkem board of directors approved a mandate to hedge up to 75% of net cash flows in EUR and USD for 2018. Forward contracts are mainly used as hedging instruments. The group's use of financial instruments and hedge accounting are disclosed in note 26.
Elkem is actively managing liquidity risk. The group has centralised its liquidity management and monitors the liquidity development through short- and long- term cash forecasts and daily reporting of the liquidity position. The policy is to have a liquidity buffer of minimum 10% of expected annual revenue. The liquidity buffer may consist of cash and undrawn credit facilities. An overview of the group's financing is included in note 22.
Counterparty risk is managed centrally and the main part of the accounts receivables is insured by a reputable credit insurance company. Elkem is monitoring the credit risk also for financial trading counterparties. Further information about the group's financial risk and capital management policies are disclosed in note 27.
Social responsibilityElkem is a signatory to the UN Global Compact and has made a strong commitment to socially responsible and sustainable business practices. Our definition of corporate social responsibility is based on the Global Compact’s ten principles for human rights, labour rights, environment and anti-corruption. All employees are obliged to follow Elkem’s policies and principles and to report discrepancies according to company guidelines. Our sustainability report details our commitment and activities related to social responsibility, and is written within the framework of the Global Reporting Initiative.
The latest sustainability report can be found online at www.elkem.com/sustainability.
Health and safetyElkem is committed to high environmental, health and safety standards and has closely integrated efforts in these areas with all other activities throughout the company. Elkem uses considerable resources to identify

30 ELKEM ANNUAL REPORT 2017 | REPORT FROM THE BOARD OF DIRECTORS ELKEM ANNUAL REPORT 2017 | REPORT FROM THE BOARD OF DIRECTORS 31
Elkem will pursue operational excellence by utilising its internal “cost roadmap” programme to identify and support cost reduction projects in a standardised manner and transfer best practices, process expertise and technological competence across the group.Elkem also focuses on strategic raw material sourcing to remain a fully integrated low-cost producer.
Improving sales of specialty productsElkem intends to pursue its specialty strategy to increase sales of higher margin products and reduce cyclicality through building on its long-term customer relationships and extensive research and development base.
Elkem believes that there is substantial room for further increased specialty products sales and the group intends to continue efforts to drive specialty volumes through investments, sales and marketing efforts and addressing new market opportunities.
Focus on organic and acquisitive growth Elkem continuously evaluates attractive options for growth, particularly through capacity expansion in underserved or growing regions. Elkem’s goal is to increase its production capacity, either by capacity expansion at existing plants, new greenfield investments or through merger and acquisitions.
In addition, Elkem intends to pursue selected bolt- on acquisitions as it believes there are potential opportunities for capacity expansion and entrance into new product sub-segments.
Management responsibility for Chinese assets of the Bluestar GroupIn order to strengthen the silicones value chain of Bluestar, Elkem assumed the management responsibility of Xinghuo and Yongdeng from end of June 2017. Elkem has also previously worked closely with Xinghuo and Yongdeng to support product development and operational excellence.
Xinghuo is located in Jiangxi province in China and produces organic silicone monomer and organic silicone-related downstream products. The facility has an annual production capacity of approximately 220,000 tonnes of siloxane and 120,000 tonnes downstream production capacity. The plant employed 1,649 employees as of 31 December 2017.
Yongdeng is located in Gansu province in China. The main product is silicon metal and the plant has a production capacity of approximately 55,000 tonnes of silicon and 25,000 tonnes of Microsilica. The plant employed 522 employees as of 31 December 2017.
The two Chinese entities were not legally or financially integrated in Elkem as of 31. December 2017, but Elkem management has full day-to-day management responsi-bilities. The management integration is expected to create significant synergies in the areas of technology, supply and distribution and production.
On 30 January 2018, Elkem AS group entered into an agreement with Bluestar Elkem Investment Co. Ltd. to purchase all the shares in Xinghuo and Yongdeng.
The management responsibility and legal integration of Xinghuo and Yongdeng strengthens Elkem’s position in China which is the fastest growing consumer of the products in Elkem’s portfolio.
FINANCIAL PROSPECTS Forward-looking statements are normally subject to considerable uncertainty.
Elkem is sensitive to changes in the macro-economic development. World Economic Outlook, issued by International Monetary Fund in October 2017, expects global growth to increase from 3.6% in 2017 to 3.7% in 2018. The prices for silicon and ferrosilicon have shown an increasing trend from second half of 2017 and into 2018. Based on this the market conditions for Elkem’s products seem relatively good.
However, raw material prices are also expected to increase, especially energy and coal. The Norwegian krone has remained weak compared to USD and EUR in particular during 2017 and a strengthening of the Norwegian krone will have negative effects on Elkem’s results.
A key focus area for Elkem in 2018 is to further develop the Silicone value chain and continue the integration of acquired businesses and to continue to deliver on the strategic goals of cost and products specialisation.
ELKEM ASElkem AS is the parent company of the Elkem group. The company’s accounts have been presented in accordance with the Norwegian Accounting Act and generally accepted accounting practices in Norway. The accounts are prepared on the basis of a going concern assumption.
For Elkem AS the operating income amounted to NOK 7,177 million compared to NOK 7,011 million in 2016. The operating income increased by 2%. Elkem AS operates in the silicon, ferrosilicon and foundry alloys market and experienced the same improvement in prices and sales volumes as the group during 2017. The operating profit ended at NOK 333 million compared to NOK 550 million
• Fiskaa Carbon finalized the installation of a scrubber capable of reducing their total So2 emissions by 50% (600 tons per year) with financial support from the Norwegian So2 fund in 2017.
• New projects for energy recovery, including recovery of 34 GWh at Fiskaa industrial park.
Our environmental efforts are further described and accounted for in our sustainability report.
STRATEGIC OVERVIEW
Foundation The Elkem Business System (EBS) plays an important role in all of Elkem's operations. EBS is first and foremost about improving customer satisfaction. The aim is to secure excellence in EHS, delivery, quality and cost. EBS is designed and aligned to support the strategic direction and operational goals of Elkem and will drive the behaviour in the organisation to foster a culture of operational excellence, continuous improvement and deep learning.
EBS is built on four basic principles: • Make to use puts the customer first, both internal
and external. • Empowered people is a conviction that the people
who perform the tasks are the experts. Elkem ascribes 70% of its success to human input.
• Eliminating waste is to drive for perfection and sustainability. Waste includes all unnecessary costs and inefficient use of resources.
• Processes in control is about stable, predictable and consistent processes where unwanted variations are removed.
The Four Values of Elkem are closely linked to our Business System and are• Respect for the law, the environment, our employees,
colleagues, customers, suppliers, owners, the society, local communities and cultures.
• Precision in developing and following the highest quality standards for best practice and operational excellence so that we can measure and continuously improve them.
• Continuous improvement of the value chain by experimenting, implementing new solutions, and continuously eliminating waste using scientific methods.
• Involvement of everyone in the organization to identify problems and opportunities and to participate in implementing improvements.
Research and developmentElkem has almost 400 people involved in Research and Development (R&D) activities and devotes considerable
effort and resources to R&D, in order to create and develop innovative products, develop environmentally friendly and energy efficient production technologies and to optimise the full value chains.
Throughout its more than 110-year history, Elkem has supplied and commissioned several hundred furnaces worldwide, and has extensive experience with silicon related processes and other metals and materials. Elkem Pilot Plant is a R&D centre with core competence in metallurgical high temperature processes. Projects and experiments carried out at Elkem Pilot Plant have been decisive for Elkem’s development and progress.
Silicones has research centres worldwide, with the Lyon Research & Innovation Centre as the main hub. The aim is to constantly source innovation opportunities inside and outside the company to develop and com-mercialise new silicone technologies. In addition, there is strong cooperation with a broad range of partners: business and industrial partners, universities and research centres, competitive clusters, start-ups and many other institutions throughout the world. Relation-ships with outside experts allow us to quickly identify new technologies or to work on new developments in existing technologies.
In 2017 Elkem’s R&D expenses related to processes, products and business development, including improve-ment projects and technical support to customers were NOK 413 million where of NOK 53 million was capitalised and NOK 360 million was expensed.
Strategic priorities Elkem’s strategy is based on systematic cost improve-ments, further product specialisation and an ambition to strengthen the group’s position across all business segments. It is important to focus on cost and continuous improvement as Elkem operates in highly competitive and global markets. In addition, the focus on product specialisation and strengthening of the market position are important to enable the group to take advantage of global mega trends which are expected to impact societies, economies and businesses.
Improve operational efficiencies and value chain optimisation The Elkem Business System together with operational excellence, economies of scale, low cost power, integrated value chain from raw materials to end- products and advanced energy recovery systems, will continue to be fundamental for cost improvements. In addition, Elkem will continue to invest in research and development to ensure technological improvements that reduce costs and improve production efficiencies as well as the development of new products and applications.

32 ELKEM ANNUAL REPORT 2017 | REPORT FROM THE BOARD OF DIRECTORS ELKEM ANNUAL REPORT 2017 | REPORT FROM THE BOARD OF DIRECTORS 33
previous year. The decrease is in large parts explained by other gains and losses related to operating activities, which was positive by NOK 221 million in 2016 and decreased to NOK 53 million negative in 2017. The change in other gains and losses compared to the previous year is explained by the effects of the forward contracts and the development of power prices affecting the valuation of power contracts, reference is made to note 9.
For Elkem AS the financial position weakened during the year. Elkem AS’ equity was NOK 4,421 million at the end of the year. The equity ratio decreased from 42% in 2016 to 38% in 2017, mainly due to increase in interest-bearing liabilities. Profit for the year was NOK 310 million. The net interest-bearing debt amounted to NOK 3,324 million per 31.12.2017. Cash and cash equivalents amounted to NOK 847 million.
Allocation of the net profit for the parent companyThe net profit for the year was NOK 309 925 thousands. The board of directors proposes the following allocation (in NOK thousands):
Transfer from other paid in capital: -170 000Additional dividend for 2016: 170 000Transfer to retained earnings: 309 925
Allocated 309 925
Subsequent eventsOn 30 January 2018 Elkem AS group signed an agreement with Bluestar Elkem Investment Co. Ltd. to purchase all the shares in Bluestar Silicone Material Co., Ltd. (Yongdeng) and Jiangxi Bluestar Xinghuo Organix Silicone (Xinghuo) for a purchase price of RMB 3,274 million. The transaction is expected to be closed during first half of 2018. The transaction will be executed in parallel and is dependent on a successful IPO of Elkem AS.
In relation to the planned acquisition of Xinghuo and Yongdeng and the planned IPO of Elkem AS, Elkem signed a refinancing debt agreement with four banks on 12 February 2018. The financing consist of a revolving credit facility (RCF) of EUR 250 million, a term loan of EUR 400 million, and a bridge financing of EUR 500 million. The loan agreement allows for the refinancing of Elkem including Xinghuo and Yongdeng. The financing is underwritten by Nordea, DNB, Citibank and Natixis. The loan agreement is subject to successful IPO of Elkem AS.
Further details may be found in Note 33.
Financial statement Elkem AS group
Oslo, 21 February 2018
Michael Koenig Chairman of the board
Yougen Ge
Helge Aasen CEO
Einar Støfringshaug
Olivier de Clermont-Tonnerre
Zhigang Hao
Marianne Færøyvik
Sverre S. Tysland

34 ELKEM ANNUAL REPORT 2017 | FINANCIAL STATEMENT ELKEM AS GROUP ELKEM ANNUAL REPORT 2017 | FINANCIAL STATEMENT ELKEM AS GROUP 35
Consolidated statement of income Consolidated statement of other comprehensive income
AMOUNTS IN NOK 1000 AMOUNTS IN NOK 1000
1 January - 31 December Note 2017 2016 Revenues 16 441 894 14 045 397
Other operating income 215 988 180 772
Total operating income 4 16 657 882 14 226 169
Raw materials and energy for smelting (8 125 907) (6 899 039)
Employee benefit expenses 5 (2 857 634) (2 559 950)
Other operating expenses 7, 8 (3 575 874) (3 149 390)
Gross operating profit (loss) 2 098 467 1 617 790
Amortisations and depreciations 12 (776 023) (717 781)
Impairment losses 12 (16 809) (11 818)
Other gains and losses 9 49 313 52 438
Operating profit (loss) 1 354 948 940 629
Income from associates and joint ventures 13, 14 34 144 22 130
Finance income 10 19 219 22 617
Foreign exchange gains (losses) 10 (7 701) 49 661
Finance expenses 10 (119 376) (88 501)
Profit (loss) before income tax 1 281 234 946 537
Income tax (expense) benefit 11 (269 390) (188 567)
Profit (loss) for the year 1 011 844 757 969
Attributable to:
Non-controlling interest’s share of profit (loss) 38 682 36 119
Owners of the parent’s share of profit (loss) 973 162 721 850
Consolidated earnings per share (Basic / Diluted)
Earnings per share (one share) 973 162 721 850
1 January - 31 December Note 2017 2016 Profit (loss) for the year 1 011 844 757 969
Other comprehensive income: Items that will not be reclassified to profit or loss
Remeasurements of post employment benefit obligation 6 971 (55 177)
Tax effects on remeasurements of post employment benefit obligation 11 2 264 13 587
Share of other comprehensive income from associates and joint ventures 13, 14 - -
3 235 (41 590)
Items that will be reclassified to profit or loss in subsequent periods
Currency translation differences 225 938 (64 508)
Hedging of net investment in foreign operations (208 865) 25 449
Tax effects hedging of net investment in foreign operations 11 48 039 (6 108)
Cash flow hedges 26 (5 973) 930 150
Tax effects on cash flow hedges 11 (4 444) (238 356)
Share of other comprehensive income from associates and joint ventures 13, 14 (325) (1 141)
Change in value of available-for-sale financial assets 492 1 718
54 862 647 204
Other comprehensive income for the year, net of tax 58 097 605 614
Total comprehensive income for the year 1 069 941 1 363 583
Attributable to:
Non-controlling interest’s share of comprehensive income 40 125 32 019
Owners of the parent’s share of comprehensive income 1 029 816 1 331 564
Total comprehensive income for the year 1 069 941 1 363 583

36 ELKEM ANNUAL REPORT 2017 | FINANCIAL STATEMENT ELKEM AS GROUP ELKEM ANNUAL REPORT 2017 | FINANCIAL STATEMENT ELKEM AS GROUP 37
1 January - 31 December Note 31.12.17 31.12.16 ASSETS Property, plant and equipment 12 6 568 934 5 909 087
Goodwill 12 326 323 342 645
Other intangible assets 12 719 350 693 013
Deferred tax assets 11 89 584 67 348
Investment in joint ventures 13 97 871 108 978
Interest in associates and other companies 14 111 967 100 516
Derivatives 26 151 574 119 161
Other non-current assets 16 324 615 370 697
Total non-current assets 8 390 218 7 711 445
Inventories 17 3 561 007 3 339 415
Accounts receivable 18 2 264 479 1 870 770
Derivatives 26 33 357 56 388
Other current assets 19 605 595 604 656
Cash and cash equivalents 22 1 493 279 1 230 668
Total current assets 7 957 717 7 101 897 TOTAL ASSETS 16 347 935 14 813 342 EQUITY AND LIABILITIES Paid-in capital 20 2 918 203 3 088 203
Retained earnings 5 313 102 4 283 286
Non-controlling interest 101 557 87 553
Total equity 8 332 862 7 459 042
Interest-bearing non-current liabilities 22 2 681 975 2 834 859
Deferred tax liabilities 11 104 587 114 182
Pension liabilities 6 444 807 425 488
Derivatives 26 378 955 561 131
Provisions and other non-current liabilities 24 389 859 463 560
Total non-current liabilities 4 000 183 4 399 220
Accounts payable 1 836 888 1 527 587
Income tax payables 138 668 99 387
Interest-bearing current liabilities 22 661 189 277 970
Derivatives 26 246 683 128 001
Provisions and other current liabilities 25 1 131 462 922 135
Total current liabilities 4 014 890 2 955 080 TOTAL EQUITY AND LIABILITIES 16 347 935 14 813 342
Consolidated statement of financial position
AMOUNTS IN NOK 1000
Oslo, 21 February 2018
Michael Koenig Chairman of the board
Yougen Ge
Helge Aasen CEO
Einar Støfringshaug
Olivier de Clermont-Tonnerre
Zhigang Hao
Marianne Færøyvik
Sverre S. Tysland
Consolidated statement of changes in equity
AMOUNTS IN NOK 1000
Share Other Total Foreign Cash flow Other Total Total Non- Total capital paid-in paid-in currency hedge retained retained owners controlling capital capital translation reserve earnings earnings share interest reserve Balance 1 January 2017 2 010 000 1 078 203 3 088 203 399 667 (442 177) 4 325 796 4 283 286 7 371 489 87 553 7 459 042
Profit (loss) for the year - - - - - 973 162 973 162 973 162 38 682 1 011 844
Other comprehensive income for the year - - - 63 669 (10 417) 3 402 56 654 56 654 1 443 58 097
Total comprehensive income for the year - - - 63 669 (10 417) 976 564 1 029 816 1 029 816 40 125 1 069 941
Dividends to equity holders 1) - (170 000) (170 000) - - - - (170 000) (26 121) (196 121)
Balance 31 December 2017 2 010 000 908 203 2 918 203 463 336 (452 594) 5 302 360 5 313 102 8 231 305 101 557 8 332 862
Share Other Total Foreign Cash flow Other Total Total Non- Total capital paid-in paid-in currency hedge retained retained owners controlling capital capital translation reserve earnings earnings share interest reserve Balance 1 January 2016 2 010 000 1 078 203 3 088 203 440 734 (1 133 971) 3 648 862 2 955 625 6 043 828 123 219 6 167 047
Profit (loss) for the year - - - - - 721 850 721 850 721 850 36 119 757 969
Other comprehensive income for the year - - - (41 067) 691 794 (41 013) 609 714 609 714 (4 100) 605 614
Total comprehensive income for the year - - - (41 067) 691 794 680 837 1 331 564 1 331 564 32 019 1 363 583
Dividends to equity holders - - - - - - - - (40 364) (40 364)
Changes in the composition of the group 2) - - - - - (3 903) (3 903) (3 903) (27 321) (31 224)
Balance 31 December 2016 2 010 000 1 078 203 3 088 203 399 667 (442 177) 4 325 796 4 283 286 7 371 489 87 553 7 459 042
1) Of the NOK 170 million in dividend paid, NOK 26 million was net settled against loans to shareholders.
2) See note 30 Changes in composition of the group.

38 ELKEM ANNUAL REPORT 2017 | FINANCIAL STATEMENT ELKEM AS GROUP ELKEM ANNUAL REPORT 2017 | FINANCIAL STATEMENT ELKEM AS GROUP 39
AMOUNTS IN NOK 1000
Consolidated statement of cash flows
1 January - 31 December Note 2017 2016 Operating profit (loss) 1 354 948 940 629
Changes in fair value commodity contracts (79 093) (77 598)
Amortisation, depreciation and impairment changes 12 792 832 729 599
Changes in working capital 1) (139 377) 98 410
Changes in provisions, pension obligations and other (116 049) (123 900)
Interest payments received 12 412 13 919
Interest payments made (91 693) (77 151)
Other financial items (1 034) 160
Income taxes paid (198 456) (200 104)
Cash flow from operating activities 1 534 490 1 303 964
Investments in property, plant and equipment and intangible assets 12 (930 344) (755 281)
Sale of property, plant and equipment 12 5 814 3 860
Dividend received 25 037 26 190
Acquisition of subsidiaries, net of cash acquired 32 4 063 (439 788)
Acquisition of Joint ventures and other shares (19 528) -
Loan to associate and joint venture (12 150) (34 258)
Other investments / sales (226) 277
Cash flow from investing activities (927 334) (1 199 000)
Dividends paid to non-controlling interests (26 121) (40 364)
Dividends paid to owner of the parent (143 947) -
Payments due to increase in ownership interest in subsidiaries 30 - (31 224)
New interest-bearing loans and borrowings 22 60 175 110 115
Repayment of interest-bearing loans and borrowings 22 (245 005) (204 603)
Cash flow from financing activities (354 898) (166 076)
Change in cash and cash equivalents 252 258 (61 112)
Currency exchange differences 10 353 (13 812)
Cash and cash equivalents opening balance 1 230 668 1 305 592
Cash and cash equivalents closing balance 22 1 493 279 1 230 668
1 | General information and basis for presentation
The consolidated financial statements for Elkem AS (hereafter Elkem AS group/the group), including notes, for the year 2017 were approved by the Board of Directors of Elkem AS on 21 February 2018. Elkem AS is a limited liability company located in Norway. Elkem AS is fully owned by Bluestar Elkem International Co. Ltd S.A., Luxembourg, which is under control of China National Bluestar (group) Co. Ltd (Bluestar), a company registered and domiciled in China.
Elkem AS group is one of the world’s leading companies in the environmentally friendly manufacture of metals and materials. The main activities are related to production and sale of silicon materials, silicones, ferrosilicon, speciality alloys for the foundry industry, carbon products and microsilica. Elkem AS group serves several global industries, such as construction, transport, engineering, packaging, aluminium, chemicals, release coatings, healthcare products and electronic markets, and has organised its business to handle market presence and customer focus. Elkem AS group has multiple production facilities located in Europe, North America, South America, Africa and Asia, and an extensive network of sales offices and agents covering most important markets. Core production processes are focused on converting high quality raw material to specialised metals and materials through high temperature melting processes and further processing. Thus, the business has a high consumption of electrical power, and is also capital intensive, due to the requirement for large and complex processing plants.
The presentation currency of Elkem AS group is NOK (Norwegian Krone). All financial information is presented in NOK thousand, unless otherwise stated. As a result of rounding adjustments, the figures in one or more columns included in the consolidated financial statements, may not add up to the total.
BASIS FOR PREPARATIONThe consolidated financial statements include the financial statements of Elkem AS and entities controlled directly and indirectly by Elkem AS. The group controls an entity when the group is exposed to, or has rights to, variable returns from its involvement with the entity and has the ability to affect those returns through its power over the entity. Subsidiaries are fully consolidated from the date on which control is transferred to the group. They are deconsolidated from the date that control ceases.
The consolidated financial statements are prepared and based on International Financial Reporting Standards as adopted by the EU (IFRS). All subsidiaries are using accounting policies consistent within the group, and all intra-group transactions, balances, income and expenses are eliminated in full on consolidation.
The consolidated financial statements have been prepared on the basis of the going concern assumption.
2 | Significant accounting policies
The financial statements are prepared on a historical cost basis, with the exception of derivative financial instruments and financial assets available for sale, which are measured at fair value.
CHANGES IN ACCOUNTING POLICIES, CHANGES IN ACCOUNTING ESTIMATES AND ERRORSChange in accounting policies and errors are recognised retrospectively by restating the comparative amounts for the prior period presented, including the opening balance of the prior year. Change in accounting estimate is recognised prospectively by including it in profit or loss in the period of the change and future periods, if the change affects both.
SEGMENTSElkem AS group’s segments are based on the organisation of the group and correspond to the internal management reporting to the chief operating decision maker, defined as the CEO.
AMOUNTS IN NOK 1000
Notes to the consolidated financial statement
1) See note 4 Operating segments for definition of working capital.

40 ELKEM ANNUAL REPORT 2017 | FINANCIAL STATEMENT ELKEM AS GROUP ELKEM ANNUAL REPORT 2017 | FINANCIAL STATEMENT ELKEM AS GROUP 41
BUSINESS COMBINATIONSBusiness combinations are generally accounted for using the acquisition method in accordance with IFRS 3. The consideration transferred in a business combination is measured at fair value, and goodwill is measured as the excess of the sum of consideration transferred, and net identifiable value of transferred assets and liabilities. Acquisition-related costs are expensed as incurred.
Business combinations involving entities under common control, are accounted for according to the “pooling of interest method”, also called “the merger method”. This method involves the following:• Assets and liabilities of the combining entities are reflected at their carrying amounts• No new goodwill is recognised as a result of the combination• The statement of income reflects the result of the combining entities for the full year, irrespective
of when the combination took place. Comparable figures are restated.
Acquisitions of non-controlling interests are accounted for as transactions with owners in their capacity as owners, and therefore, no goodwill is recognised as a result. Adjustments to non-controlling interests arising from transactions that do not involve the loss of control, is based on a proportionate amount of the net assets of the subsidiary.
INVESTMENT IN ASSOCIATESAssociates are those entities in which the group has significant influence, but no control over the financial and operating policies. Significant influence is presumed to exist when the group holds between 20% and 50% of the voting power of another entity. Investment in associates are accounted for using the equity method. Under the equity method, the investment is initially recognised at cost, and the carrying amount is increased or decreased to recognize the investor’s share of the profit or loss and other comprehensive income of the investee after the date of acquisition. The group’s investment in associates includes goodwill identified on acquisition.
Upon disposal of an associate that results in the group losing significant influence over that associate, any retained investment is measured at fair value at that date.
JOINT ARRANGEMENTS“The group applies IFRS 11 to all joint arrangements. Under IFRS 11 investments in joint arrangements are classified as either joint operations or joint ventures, depending on the contractual rights and obligations of each investor.
Joint ventures are accounted for using the equity method. Under the equity method, the investment is initially recognised at cost, and the carrying amount is increased or decreased to recognise the investor’s share of the profit or loss, and other comprehensive income of the investee after the date of acquisition.
The group’s interest in joint operations is recognised in relation to its interest in the joint operation:• Assets, including its share of any assets held jointly• Liabilities, including its share of any liabilities incurred jointly• Revenue from the sale of its share of the output arising from the joint operation• Share of the revenue from the sale of the output by the joint operation• Expenses, including its share of any expenses incurred jointly
FOREIGN CURRENCIES
Separate financial statementsEach entity in the group determines its functional currency based on the economic environment in which it operates, and items included in the financial statements of each entity are measured using that functional currency. When preparing the financial statements of each individual group entity, transactions in currencies other than the entity’s functional currency are recognised in the functional currency, using the transaction date’s currency rate.
Monetary items denominated in foreign currencies are translated using the closing rate at the end of the reporting period, and any gains / losses are reported in the statement of income. Currency gains / losses related to operating activities, i.e. receivables, payables, bank accounts for operating purposes including short term intragroup balances, are classified as a part of other gains and losses. Currency effects included in finance income and expenses are only related to financing activities like loans, long term placements and dividends.
Foreign currency differences are recognised in other comprehensive income for the following items:• loans to subsidiaries treated as a part of the net investment • a financial asset or liability designated as a hedging instrument in a cash flow hedge, to the extent
that the hedge is effective• loans and currency in foreign currencies, designated as hedging instruments in a hedge of a net
investment in a foreign operation
Financial statementsIn consolidation of the statement of income and the statement of financial position for the separate group entities with other functional currency than the group’s presentation currency, it is translated directly into the presentation currency as follows:• Assets and liabilities are translated using the exchange rate on the balance sheet date• Income and expenses are translated using an average exchange rate per month• Equity transactions, except net profit or loss for the period, are translated using the transaction date rates All resulting exchange differences are booked as a separate component in other comprehensive income (OCI).
Any goodwill arising on the acquisition of a foreign operation, and any fair value adjustment to the carrying amount of assets and liabilities arising on the acquisition, are treated as assets and liabilities of the foreign operation, and translated at the closing rate. On disposal of a foreign entity, the deferred cumulative amount recognised in other comprehensive income relating to that particular foreign operation, is recognised in the statement of income.
GOODWILLGoodwill is initially measured as the excess of the cost of an acquisition over the group’s share of the fair values of the acquired entity’s net identifiable assets at the acquisition date. If the fair value of the group’s interest in the net assets of the acquired subsidiary exceeds the cost of the acquisition (negative goodwill), the differences are recognised directly in profit and loss. Goodwill is carried at cost less accumulated impairment losses. Goodwill is tested for impairment annually, or more frequently when there is an indication of impairment. An impairment loss recognised for goodwill is not reversed in subsequent periods.
INTANGIBLE ASSETSIntangible assets are stated in the financial statements at cost less accumulated amortisation and accumulated impairment losses. Intangible assets acquired in business combinations are recognised at fair value at the acquisition date. Intangible assets with a finite useful life are amortised, using the straight-line method. The estimated useful lives and amortisation method are reviewed at the end of each reporting period.
An intangible asset is derecognised on disposal, or when the group expects no future economic benefits to be derived from its use. Gain or loss arising from derecognition of an intangible asset, measured as the difference between the net disposal proceeds and the carrying amount of the asset, is recognised in profit or loss.
Expenditure on research activities is recognised as an expense in the period in which it is incurred. An intangible asset arising from an internal development project is recognised in the statement of financial position if the group can demonstrate technically feasibility of completing the intangible asset, has the intention to complete it, ability to use it, can demonstrate that it will generate probable future economic benefits and the cost can be reliably measured.
PROPERTY, PLANT AND EQUIPMENTProperty, plant and equipment (PPE) are stated in the statement of financial position at cost less accumulated depreciation and accumulated impairment losses. Property, plant and equipment acquired in business combinations are recognised at fair value at the acquisition date. Properties in the course of construction are carried at cost less any recognised impairment loss. Such properties are classified to the appropriate categories of property, plant and equipment when completed and ready for the intended use. When parts of an item of property, plant and equipment have different useful lives, they are accounted for as separate items.
Initial cost includes expenditures that are directly attributable to the acquisition of the asset, cost of materials, direct labour, any other costs directly attributable to bringing the assets to working condition for their intended use and estimated dismantling or removing charges.

42 ELKEM ANNUAL REPORT 2017 | FINANCIAL STATEMENT ELKEM AS GROUP ELKEM ANNUAL REPORT 2017 | FINANCIAL STATEMENT ELKEM AS GROUP 43
Subsequent costs are included in the asset’s carrying amount or recognised as a separate asset, as appropriate, when future benefits are probable and the cost can be measured reliably. The carrying amount of the replaced part is derecognised. Major periodic maintenance that is carried out less frequently than every year, is capitalised and depreciated over the period until the next periodic maintenance is performed. All other repairs and maintenance are charged to the statement of income when incurred.
Depreciations are calculated based on estimated useful life and expected residual value for each recognised item of PPE, and are recognised in profit or loss using the straight-line method. The estimated useful lives, residual values (if any) and depreciation method is reviewed, and if necessary adjusted, at least annually. Depreciation commences when the assets are ready for their intended use.
An item of property, plant and equipment is derecognised upon disposal or when no future economic benefits are expected to arise from the continued use of the asset. Any gain or loss arising on disposal or retirement of an PPE, determined as the difference between the sales proceeds and the carrying amount of the asset, is recognised under other operating income or other operating expenses in the statement of income.
IMPAIRMENT OF TANGIBLE AND INTANGIBLE ASSETSAt the end of each reporting period, the group’s management reviews the carrying amounts of its tangible and intangible assets in order to determine whether there is any indication of impairment. If any such indication exists, the recoverable amount of the asset is estimated in order to determine the extent of the impairment loss. The recoverable amount is the higher of fair value less the costs to sell, or its value in use. Value in use is the present value of the future cash flow expected to be derived from the asset or the cash generating unit to which it belongs, after taking into accounts all other relevant information.
The group’s cash generating units are reflecting the company’s business areas, which are the basis for the management review and monthly reports. The capitalised value of tangible and intangible assets within the cash generating units is measured against the value in use of tangible assets, intangible assets and working capital within these units.
LEASINGLeases are classified as financial leases whenever the terms of the lease transfer substantially all the risks and rewards of ownership to the lessee. All other leases are classified as operating leases. Assets held under finance leases are initially recognised as assets of the group at the lower of fair value of the asset and the present value of the minimum lease payment. The corresponding liability to the lessor is included in the statement of financial position as a finance lease obligation. Each lease payment is allocated between the liability and finance charges, so as to achieve a constant rate on the finance balance outstanding.
NON-DERIVATIVE FINANCIAL ASSETS NOT AT FAIR VALUE THROUGH PROFIT OR LOSSPurchases and sales of financial assets are recognised at the date of transaction on which the group is committed to the purchase or the sale of the asset.
At initial recognition, the financial assets are carried in the statement of financial position at fair value plus any transaction costs directly attributable to the acquisition or issue of the asset. Financial assets are derecognised once the right to future cash flows have expired or been transferred to a third party, and once the group has transferred substantially all the risk and rewards of control of these assets.
Financial assets with a maturity exceeding one year are classified as non-current financial assets. Short-term investments that do not meet the definitions of a cash equivalent, and financial assets with a maturity of less than one year, are classified as current financial assets.
FINANCIAL ASSETS AT FAIR VALUE THROUGH PROFIT OR LOSSThese are financial assets classified as held for trading as the group has acquired the assets for the purpose of selling it in the near term. The assets are carried at fair value in the statement of financial position, with gains or losses recognised in the statement of income.
FINANCIAL ASSETS AVAILABLE FOR SALEAvailable-for-sale financial assets are non-derivatives that are either designated in this category or not classified in any of the other categories. These assets are included in non-current assets in
the statement of financial position, unless the management intends to sell the investment within twelve months after the reporting period.
Included in this group are investments in equity instruments that do not have a quoted market price in an active market, which therefore are measured at cost. Such investments are subject to regularly review for impairment.
LOANS AND RECEIVABLESThis category includes accounts receivable, bills receivable, loans, restricted / guarantee deposits, and cash and cash equivalents.
Loans and receivables are non-derivative financial assets with fixed or determinable payments that are not quoted in a regulated market. After initial recognition, they are recognised at amortised cost using the effective interest method. Gains and losses are recognised in the statement of income when the loans and receivables are derecognised or impaired, as well as through the amortisation process.
Accounts, bills and other receivables are initially recognised at fair value, which in most cases corresponds to their nominal amount. The carrying amount is subsequently measured at amortised cost using the effective interest rate method, less any impairment provision. Short-term receivables with no stated interest rate are recognised at their nominal amount.
Cash and cash equivalents are held for the purpose of meeting short term fluctuations in liquidity, rather than for investment purposes. Bank overdrafts are shown within interest-bearing current liabilities on the statement of financial position. Restricted deposits are presented separately in the statement of financial position, and are not included the cash and cash equivalents presented in the statement of cash flows.
If there is objective evidence of impairment, or if there is a risk that the group may not recover the contractual amounts at the contractual maturity dates, an impairment loss is recognised in the statement of income. The provision is equal to the difference between the carrying amount and the estimated future recoverable cash flows.
NON-DERIVATIVE FINANCIAL LIABILITIESNon-derivative financial liabilities include interest-bearing liabilities, bills payable and accounts payable. The liabilities are initially recognised at fair value of the amount required to settle the associated obligation, net of prepaid costs directly attributable to the liability. Subsequently and insofar, as they are not designated as liabilities at fair value through profit or loss, such liabilities are recognised at amortised cost using the effective interest rate method, and the difference between the cost and the amount of repayment being recognised in the statement of income over the term of the interest-bearing liabilities.
DERIVATIVE FINANCIAL INSTRUMENTS INCLUDING DERIVATIVE HEDGING INSTRUMENTS AND NON-FINANCIAL CONTRACTS WITH NET SETTLEMENTS THAT ARE TO BE TREATED AS FINANCIAL DERIVATIVESDerivatives are initially recognised at fair value at the date when the derivative contracts are entered into. Transaction costs that are directly attributable to the acquisition of financial assets or liabilities at fair value through profit or loss, are recognised immediately in the statement of income. Subsequently the derivatives are remeasured to their fair value at the end of each reporting period. The resulting gain or loss is recognised in the statement of income immediately, unless the derivative is designated and is effective as a hedging instrument, in which case the change in fair value is recognised in profit or loss in the same period(s) as the hedged objects affects the profit or loss. Financial assets are derecognised when the rights to receive cash flows from the investments have expired or have been transferred and the group has transferred substantially all risks and rewards of ownership. Financial liabilities are derecognised when they are extinguished.
Hedge accountingThe group can designate certain derivatives as hedging instruments for fair value hedges and cash flow hedges. At the inception of the hedge relationship, the entity documents the relationship between the hedging instrument and the hedged item, along with its risk management objectives and its strategy for undertaking various hedge transactions.

44 ELKEM ANNUAL REPORT 2017 | FINANCIAL STATEMENT ELKEM AS GROUP ELKEM ANNUAL REPORT 2017 | FINANCIAL STATEMENT ELKEM AS GROUP 45
i) Fair value hedgesChanges in the fair value of derivatives that are designated and qualify as fair value hedges, are recognised in the statement of income immediately, together with any changes in the fair value of the hedged asset or liability that are attributable to the hedged risk.
ii) Cash flow hedgesThe effective portion of changes in the fair value of derivatives that are designated and qualify as cash flow hedges, are recognised in other comprehensive income and accumulated under the heading of cash flow hedging reserve. The gain or loss relating to the ineffective portion is recognised immediately in the statement of income.
iii) Net investment hedges Hedges of net investments in foreign operations are accounted for similarly to cash flow hedges. Any gain or loss on the hedging instrument relating to the effective portion of the hedge is recognised in other comprehensive income and included in foreign currency translation reserve in equity. The gain or loss relating to the ineffective portion is recognised immediately in profit or loss within other gains and losses. Gains and losses accumulated in equity are reclassified to profit or loss when the foreign operation is partially disposed of or sold.
When a hedging instrument expires or is sold, or when a hedge no longer meets the criteria for hedge accounting, any cumulative gain or loss existing in comprehensive income at that time remains in equity and is recognised in the statement of income when the forecast transaction is ultimately recognised in the statement of income. When a forecast transaction is no longer expected to occur, the cumulative gain or loss reported in equity, is immediately transferred to the statement of income.
Commodity contract within the scope of IAS 39Non-financial commodity contracts where the relevant commodity is readily convertible to cash, and where the contracts are not for own use, fall within the scope of IAS 39 Financial instruments – recognition and measurement. Such contracts are treated as derivatives in accordance with IAS 39. The group currently has energy contracts in Norway that do not meet the own use criteria according to IAS 39.5, since the power under the contracts are delivered in another grid area than the plants are located. Transfer between different grid areas is assessed to be net settlement according to IFRS as this is considered to be two different transactions. The contracts must therefore be treated as derivatives and are booked at fair value through profit or loss. Commodity contracts within the scope of IAS 39 are classified as current assets or liabilities, unless they are expected to be realised more than 12 months after the reporting period. In that case, they are classified as non-current assets. See notes 9 Other gains and losses, 26 Financial instruments and 27 Financial risk and capital management.
INVENTORIESInventories are measured at the lower of cost and net realisable value. The cost of inventory is measured at the cost of raw materials, energy for smelting, direct labour, other direct costs and production overhead cost based on the higher of actual and normal capacity. Net realisable value represents the estimated selling price for inventories less estimated costs of completion and variable selling expenses.
Cost of goods sold is included in different lines in the statement of income based on nature; Raw materials and energy for smelting, Employee benefits and Other operating cost, for the remaining part.
Entities within the group sell goods to other group entities, consequently finished goods from one entity become raw materials or semi finished goods for an other group entity. The classification of goods in Elkem AS group’s financial statements is based on the separate entity’s classification.
TAXATION
Income taxes Current tax assets and liabilities are measured at the amount expected to be recovered or paid to the tax authorities. Current tax payable includes any adjustment to tax payable in respect of previous years. Income tax is recognised in the statement of income except to the extent that it relates to items recognised directly in equity or in other comprehensive income. The group includes deductions for uncertain tax positions when it is probable that the tax position will be sustained in a tax review. The group records provisions relating to uncertain or disputed tax positions at the amount expected
to be paid. The provision is reversed if the disputed tax position is settled in favour of the group and can no longer be appealed.
Interest and penalties related to income taxes are classified as tax expense in the statement of income, and accrued interest and penalties are included in income tax payables in statement of financial position.
Deferred tax Deferred tax assets and liabilities are calculated using the liability method with full allocation for all temporary differences between the tax base and the carrying amount of assets and liabilities in the consolidated financial statements, including tax losses carried forward. Deferred tax relating to items outside profit or loss are recognised in correlation with the underlying transaction either in other comprehensive income or directly in equity. Deferred tax assets and liabilities are not recognised if the temporary difference arises from the initial recognition of goodwill. Deferred tax assets are recognised in the statement of financial position to the extent that it is more likely than not that the tax assets will be utilised against deferred tax liabilities or future taxable income. Deferred tax assets arising from tax losses are recognised when there is convincing evidence of recoverability. The tax rates substantively enacted at the end of the reporting period and undiscounted amounts are used. Deferred tax assets and liabilities are offset if there is a legally enforceable right to offset current tax liabilities and assets, and they relate to income taxes levied by the same tax authority on the same taxable entity, or on different tax entities, but they intend to settle current tax liabilities and assets on a net basis, or their tax assets and liabilities will be realised simultaneously.
EMPLOYEE RETIREMENT BENEFITS
Defined contribution plansDefined contribution plans comprise of arrangements whereby the company makes monthly contri-butions to the employees’ pension plans, and where the future pensions are determined by the amount of the contributions and the return on the individual pension plan asset. The contributions are expensed as incurred, there are no further obligation related to the contribution plans. Prepaid contributions are recognised as an asset.
Long-term employee benefits are presented as a part of provisions.
Defined benefit plansDefined benefit plans are recognised at present value of future liabilities considered retained at the end of the reporting period, calculated separately for each plan. Plan assets are recorded at fair value, and deducted in calculating the net pension liability. Past service cost arising due to amendments in the benefit plans are expensed as incurred. Accumulated effects of changes in estimates and financial and actuarial assumptions are recognised as other comprehensive income. Service costs are classified as part of employee benefit expenses and other employee remuneration and net interest on pension liabilities / assets are presented as a part of finance expenses.
Multi-employer defined benefit plans where available information is insufficient to be able to calculate each participant’s obligation, are accounted for as contribution plans.
PROVISIONSA provision is recognised when the group has a present obligation and it is probable that an outflow of resources is required to settle the obligation. The amount recognised is the best estimate of the consideration required to settle the obligation, taking into account the risks and uncertainties surrounding the obligation, known at the end of the reporting period. Provisions are measured at present value, unless the time value is assessed to be immaterial.
CONTINGENT LIABILITIESContingent liabilities are liabilities which are not recognised because they are possible obligations that have not yet been confirmed, or they are present obligations where an outflow of resources is not probable. Any significant contingent liabilities are disclosed in the notes.
CONTINGENT ASSETSContingent assets are not recognised, but disclosed in the notes if probable.

46 ELKEM ANNUAL REPORT 2017 | FINANCIAL STATEMENT ELKEM AS GROUP ELKEM ANNUAL REPORT 2017 | FINANCIAL STATEMENT ELKEM AS GROUP 47
REVENUE RECOGNITION AND OTHER INCOMERevenue is recognised when it is probable that a transaction will generate future economic benefits for the group and the revenue can be measured reliably. Revenue is measured at the fair value of the considerations received or receivable, net of any taxes, rebates and discounts. Revenue and expenses that relate to the same transaction are recognised simultaneously.
Revenue from sale of goods is recognised when the significant risk and reward of ownership of the goods are transferred to the buyer, according to the agreed delivery term for each sale. Delivery terms are based on Incoterms 2010 issued by International Chamber of Commerce, and the main terms are “F” terms, where the buyer arranges and pays for the main carriage. The risk and reward are transferred to buyer when the goods are handed to the carrier engaged by the buyer. “C” terms, where the group arranges and pays for the main carriage but without assuming the risk of the main carriage. The risk and reward are transferred buyer when the goods are handed over to the carrier engaged by the seller. “D” terms, where the group arranges and pays for the carriage and retain the risk and reward of the goods until delivery at agreed destination. The ownership is transferred to buyer upon arrival at agreed destination, usually the purchaser’s warehouse.
Revenue from sale of services is recognised when the services have been provided, and are presented as other operating revenue. External sales of electric power are recognised in income on the basis of the price agreed with the customer upon delivery.
Income from insurance settlements are recognised when it is virtually certain that the group will receive the compensation, and presented as other operating income. Interest income is recognised on accrual basis. Dividends are recognised when shareholders’ right to receive dividends is determined by the shareholder’s meeting.
GRANTSGrants are recognised when it is reasonable assured that the group will comply with the conditions attached to them, and the grants will be received. Grants relating to property, plant and equipment are deducted from the carrying amount of the asset. The grant is recognised as income over the lifetime of a depreciable asset by reducing the depreciation charge. Grants related to expenses are classified as other operating income.
CO2 emission quotasCO2 emission quotas allocated from the government are classified as grants, measured at nominal value (zero). The CO2 quotas are meant to cover CO2 emissions from the group’s plants in Norway. If actual emissions exceed the allocated emission quotas, additional quotas are purchased. Purchased CO2 quotas are recognised at cost as other operating expenses, and any sale of CO2 quotas are recognised as Revenue, according to transaction price.
CO2 compensationThe Norwegian government has, from 2013, established a CO2 compensation scheme to compensate for CO2 costs included in the power prices. The extent of the scheme may vary considerably from year to year depending on the future carbon price. This compensation scheme applies for the Norwegian plants, and is recognised as other operating income when there is reasonable assurance that the entity will comply with the conditions attached and the grants will be received.
STATEMENT OF CASH FLOWSThe statement of cash flows is prepared under the indirect method. Cash inflows and outflows are shown separately for investing and financing activities, while operating activities include both cash and non-cash effect items. Interest received and paid and other financial expenses, such as bank guarantee expenses, are reported as a part of operating activities. Net currency gains or losses related to financing activities are reported as part of financing activities. Dividend received from joint ventures and associates are included in investing activities.
EVENTS AFTER THE REPORTING PERIODEvents after the reporting period related to the group’s financial position at the end of the reporting period, are considered in the financial statement. Events after the reporting period that have no effect on the group’s financial position at the end of the reporting period, but will have effect on future financial position, are disclosed if the future effect is material.
NEW INTERPRETATIONS AND CHANGES TO EXISTING STANDARDS NOT YET ADOPTEDIASB has published a number of new standards and amendments to standards and interpretations that are not effective for the annual period ending 31 December 2017. New and amended standards and interpretations expected to be relevant for the Elkem AS group’s financial position, performance or disclosure are disclosed below. The standards that could entail material changes are the new IFRS 16 Leases, IFRS 15 Revenue from Contracts with Customers and IFRS 9 Financial Instruments, all approved by EU.
Estimated effect of implementing the new IFRS 16 Leases is presented in note 8 Operating lease.
Elkem AS group has not identified any changes from the implementation of IFRS 15 Revenue from Contracts with Customers that is expected to have a material effect on the financial statements other than additional information in the notes. The standard is effective from 1 January 2018.
IFRS 9 Financial Instruments was finalised in 2014 and involves changes related to classification and measurement, hedge accounting and impairment of financial instruments. The standard will replace IAS 39 Financial Instruments: Recognition and Measurement. The standard shall be implemented retrospec-tively, with the exception for hedge accounting that shall mainly be implemented prospectively. Elkem AS group has chosen to continue to apply the hedge accounting according to the requirements of IAS 39 instead of IFRS 9. The new impairment model for financial instruments is based on expected credit losses, rather than on incurred credit losses. Elkem AS group is covered by credit insurance for its main customers. Elkem AS group has not identified changes from the implementation of the standard that is expected to have material effect on the financial statements. The standard is effective from 1 January 2018.
3 | Accounting estimates
The preparation of the consolidated financial statements according to IFRS requires management to make judgments, estimates and assumptions that affect the application of accounting policies and the reported amounts of assets, liabilities, income and expenses. Actual results may differ from these estimates.
Estimates and judgements are continually evaluated and are based on historical experience and other factors, including expectations of future events that are believed to be reasonable under the circumstances. Revisions of reported estimates are recognised in the period in which the estimates are revised and in any future period affected.
The management makes estimates and assumptions concerning the future, the resulting accounting estimates will, by definition, seldom equal the actual outcome. The estimates and assumptions that have a significant risk of causing a material adjustment to the carrying amounts of assets and liabilities within the next financial year are addressed below.
PROPERTY, PLANT AND EQUIPMENT, INTANGIBLE ASSETS AND GOODWILLThe valuation of assets in connection with business combinations and testing of property, plant and equipment, intangible assets and goodwill for impairment (see note 12 Property, plant and equipment, Intangible assets and goodwill), is to a large extent based on estimated future cash flows. These calcula-tions require the use of estimates for cash flows and the choice of discount rate before tax for discounting the cash flows. Tangible and intangible assets including goodwill, are tested for impairment if there are indicators that an asset may be impaired. Indicators of impairment will typically be changes in technological development and changes in the competitive situation. Intangible assets that are not amortised and goodwill are, as a minimum, tested annually for impairment.
Estimated useful lives, residual values (if any) included in calculation of depreciation and amortisation are reviewed, and if necessary adjusted, at least annually.
DEFERRED TAX ASSETSThe group performs annual tests for impairment of deferred tax assets. Part of the basis for recognising deferred tax assets is based on applying the loss carried forward against future taxable income in the group, which requires use of estimates for calculating future taxable income.

48 ELKEM ANNUAL REPORT 2017 | FINANCIAL STATEMENT ELKEM AS GROUP ELKEM ANNUAL REPORT 2017 | FINANCIAL STATEMENT ELKEM AS GROUP 49
FINANCIAL INSTRUMENTSFair value for financial instruments are based on observable prices and assumptions derived from observable prices for comparable instruments. Net booked value as of 31 December 2017 is in total negative NOK 389 million, see note 26 Financial instruments for further details and note 27 Financial risk and capital management for sensitivity.
PROVISIONSElkem AS group has several types of provisions due to its operations. The main types of provisions are related to commitments to restore the site of operations to its original conditions after use, environmental measurements and litigations. Such liabilities are normally uncertain in timing and amount, and recog-nised amounts are estimates based on the available information at the end of reporting period. The estimates are updated when new or updated information is available. See note 24 Provisions and other non-current liabilities.
4 | Reportable segments
Elkem AS group has four reportable segments; Silicones, Silicon materials, Foundry products and Carbon.
The Silicones division produces and sells a range of silicone based products across various sub-sectors including release coatings, engineering elastomers, healthcare products, specialty fluids, emulsions and resins. The Silicones division produces siloxanes and a comprehensive range of silicones, which are a family of specialty, high performance products and materials, as well as commoditized products produced by reacting silicon with methyl chloride through various chemical reactions and formulations.
The Silicon materials division produces and sells various grades of metallurgical silicon and microsilica for use in a wide range of end applications. The Silicon Materials division manufactures and sells silicon and microsilica for a large number of applications, including for the production of silicones.
The Foundry Products division provides metal treatment solutions to iron foundries and is a supplier of high quality speciality ferrosilicon to the steel industry.
The Carbon division produces carbon electrode materials, lining materials and speciality carbon products for metallurgical processes for the production of a range of metals. The Carbon division produces carbon materials used in the production of silicon and ferroalloys.
Other comprise Elkem AS group management and centralised functions within finance, sales, logistics, power purchase and technology. External sales of power are included in revenue from sale of goods is NOK 418,180 thousand in 2017 (NOK 349,855 thousand).
Eliminations comprise intersegment sales and profit. Transactions between operating segments are conducted on an arm’s length basis in a manner similar to transactions with third parties.
Elkem AS group identifies its segments according to the organisation and reporting structure decided by group management. Operating segments are components of a business that are evaluated regularly by the chief operating decision maker, defined as the CEO, for the purpose of assessing performance and allocating resources. Elkem AS group operating segments represent separately managed business areas with unique products serving different markets. Segment performance is evaluated based on gross operating profit and operating profit (loss) before other gains and losses. Elkem AS group’s financing and taxes are managed on a group basis and are not allocated to operating segments.
Elkem AS group has several smaller and larger external customers, no single customer amount to 10% or more of total operating income.
Revenue from sale of goods is affected by realised effects from the group’s hedging program and is included in other, see note 26 Financial instruments (section hedge accounting).
2017 Silicones Silicon Foundry Carbon Other Eliminations Total materials Products Revenue from sale of goods 5 315 918 4 836 448 3 986 532 1 310 248 564 739 - 16 013 885
Other revenue 1) 40 986 44 807 46 654 46 964 248 598 - 428 009
Other operating income 83 396 60 663 38 956 4 984 27 989 - 215 988
Total operating income from external customers 5 440 300 4 941 918 4 072 142 1 362 196 841 326 - 16 657 882
Revenue from other group segments 10 595 592 082 175 114 214 455 376 444 (1 368 690) -
Total operating income 5 450 895 5 534 000 4 247 256 1 576 651 1 217 770 (1 368 690) 16 657 882
Operating expenses (4 916 742) (4 828 515) (3 539 876) (1 302 916) (1 336 574) 1 365 208 (14 559 415)
Gross operating profit 534 153 705 485 707 380 273 735 (118 804) (3 482) 2 098 467
Operating profit (loss) before other gains and losses 274 692 480 644 492 277 208 888 (147 384) (3 482) 1 305 635
Cash flow from operations 2) 287 621 545 762 328 807 163 372 (81 362) 3 157 1 247 357
Working capital 3) 695 151 1 160 267 1 360 293 309 753 37 181 (33 354) 3 529 291
Capital employed 4) 3 131 156 2 863 892 3 280 388 830 796 171 595 (33 354) 10 244 473
Reinvestments 5) (711 733)
Strategic investments 6) (299 158)
Movement CAPEX payables 80 547
Cash flow from investments in property, plant and equipment and intangible assets (930 344)
2016 Silicones Silicon Foundry Carbon Other Eliminations Total materials Products
Revenue from sale of goods 4 870 532 3 881 820 3 420 807 1 162 891 391 341 - 13 727 391
Other revenue 1) 95 764 73 002 47 104 9 917 92 219 - 318 006
Other operating income 60 728 64 939 31 147 6 178 17 780 - 180 772
Total operating income from external customers 5 027 024 4 019 761 3 499 058 1 178 986 501 340 - 14 226 169
Revenue from other group segments 2 198 520 390 142 963 196 089 273 245 (1 134 885) -
Total operating income 5 029 222 4 540 151 3 642 021 1 375 075 774 585 (1 134 885) 14 226 169
Operating expenses (4 616 236) (3 867 261) (3 139 405) (1 099 814) (1 028 173) 1 142 510 (12 608 379)
Gross operating profit (loss) 412 986 672 890 502 616 275 261 (253 588) 7 625 1 617 790
Operating profit (loss) before other gains and losses 148 158 488 309 304 752 219 612 (280 265) 7 625 888 191
Cash flow from operations 2) 248 557 621 132 309 200 214 407 (295 705) 1 764 1 099 355
Working capital 3) 803 346 1 174 133 1 152 619 279 420 100 510 (29 742) 3 480 286
Capital employed 4) 2 849 342 2 827 841 2 738 915 777 297 225 719 (29 742) 9 389 372
Reinvestments 5) (616 845)
Strategic investments 6) (179 470)
Movement CAPEX payables 41 034
Cash flow from investments in property, plant and equipment and intangible assets (755 281)
1) Other revenue mainly consist of sale of services. .
2) Elkem AS group definition of cash flow from operations is gross operating profit (loss) including changes in working capital and reinvestments.
3) Working capital consists of accounts receivable, inventory, accounts payable, other current assets, other current liabilities. The definition of accounts receivable and inventory correspond with the definition for the group. Other current assets does not include short term receivables to related parties, tax receivables, grants that are net settled against tax payables, restricted deposits and accrued interest, see note 19 Other current assets. Other current liabilities does not include short-term provision and liabilities to other related parties within China National Bluestar group, see note 25 Provision and other current liabilities. Accounts payable does not include accounts payable related to purchase of non-current assets, NOK 146 million as of 31 December 2017 (NOK 60 million).
4) Capital employed consists of working capital as defined above, and property, plant and equipment. The definition of property, plant and equipment corresponds with the definition for the group.
5) Reinvestments generally consist of maintenance capital expenditure to maintain existing activities or that involve investments designed to improve health, safety or the environment.
6) Strategic investments generally consist of investments which result in capacity increases at Elkem’s existing plants or that involve an investment made to meet demand in a new geographic or product area.

50 ELKEM ANNUAL REPORT 2017 | FINANCIAL STATEMENT ELKEM AS GROUP ELKEM ANNUAL REPORT 2017 | FINANCIAL STATEMENT ELKEM AS GROUP 51
1) The identification of non-current assets is based on location of operation. Excluded from non-current assets are financial instruments, deferred tax assets, post-employment benefit assets, and rights arising under insurance contracts.
Total operating income by geographic market (customer location) 2017 2016 Nordic countries 2 033 454 1 537 040
United Kingdom 838 614 663 971
Germany 2 153 125 2 110 424
France 574 089 584 478
Italy 679 086 586 826
Poland 354 052 318 919
Luxembourg 568 517 281 462
Other European countries 2 189 196 1 667 185
Europe 9 390 133 7 750 304
Africa 165 142 112 217
North America 2 173 373 2 106 207
South America 981 217 880 824
America 3 154 590 2 987 031
China 1 211 387 1 030 290
Japan 694 001 675 183
South Korea 522 327 437 043
Other Asian countries 1 457 782 1 168 473
Asia 3 885 497 3 310 989
Rest of the world 62 520 65 628
Total 16 657 882 14 226 169
Information about geographical areas. Non-current assets 1) 2017 2016 Norway 2 821 018 2 840 677
Other Nordic countries 537 440 555 013
United Kingdom 4 487 4 415
Germany 57 611 55 585
France 2 452 347 2 187 079
Italy 87 904 71 392
Other European countries 290 373 270 097
Europe 6 251 179 5 984 258
Africa 74 689 72 249
USA 381 418 343 304
Canada 414 843 431 365
Brazil 330 430 317 740
Other South American countries 292 871 42 516
America 1 419 561 1 134 924
China 212 488 141 424
Japan 3 501 3 696
Other Asian countries 187 641 188 384
Asia 403 630 333 505
Rest of the world - -
Total 8 149 059 7 524 936
Details of other operating income 2017 2016 Sale of fixed assets 5 202 4 040
Insurance settlement 23 118 216
Grants1) 186 350 175 777
Other 1 317 739
Total other operating income 215 988 180 772
1) See note 29 Grants.
2017 2016 Salaries and other benefits (2 253 966) (1 993 557)
Employer’s national insurance contribution (453 202) (432 723)
Employee retirement benefits 1) (95 787) (79 347)
Other payments / benefits (54 680) (54 323)
Total employee benefit expenses (2 857 634) (2 559 950)
Number of full time equivalents in Elkem AS group 3 851 3 652
Salary and other compensations to the CEO 2017 2016 Salary, including holiday pay (5 417) (5 111)
Bonus 1) (4 932) (3 148)
Free car (130) (130)
Other compensation (31) (28)
Pension cost (693) (640)
Compensation to members of the board 2017 2016 Payment to board members in total (500) (489)
5 | Employee benefit expenses
1) See note 6 Employee retirement benefits.
1) In addition to the performance bonus, a strategic project bonus of NOK 3,542 thousand was paid in 2017. In 2016 an additional strategic bonus of NOK 407 thousand and ChemChina award of NOK 604 thousand was paid.
Salary, wages and other compensations above include the following compensations:
Senior staff compensation Helge Aasen is the CEO of Elkem AS.
6 | Employee retirement benefits
The group has both defined contribution and defined benefit plans. For defined contribution plans the cost is equal to the group’s contribution to the employee’s pension savings during the period. For defined benefit plans the cost is calculated based on actuarial valuation methods, taking assumptions related to the employee’s salary, turnover, mortality, discount rate, etc. into consideration.
Defined contribution plansDefined contribution plans comprise arrangements whereby the company makes annual contributions to the employee’s pension plan, and where the employee’s future pension is determined by the amount of the contributions and the return on the pension plan asset. In addition a multi-employer plan where sufficient information to calculate each participant’s pension obligation is not available should be accounted for as it is a defined contribution plan.
The group’s Norwegian entities are participants in the early retirement scheme AFP. This is as a multi- employer plan accounted for as a defined contribution plan, in accordance with the Ministry of Finance’s conclusion. The participants in the pension plan is jointly responsible for 2/3 of the plan’s pension obligation, the government is responsible for the remaining part. The yearly pension premium paid by the participants in 2017 is 2.5% of the employees salary between 1 and 7.1 G, covering this year’s pension payments and contribution to a security fund for future pension obligations. The premium in per cent of salary for 2018 is equal to 2017. Employees in the group’s Norwegian entities are primarily covered by pension plans that are classified as contribution plans.

52 ELKEM ANNUAL REPORT 2017 | FINANCIAL STATEMENT ELKEM AS GROUP ELKEM ANNUAL REPORT 2017 | FINANCIAL STATEMENT ELKEM AS GROUP 53
Breakdown of net pension expenses 2017 2016 Current service expenses (27 989) (23 704)
Accrued employer’s national insurance contribution (345) (290)
General administration expenses (559) (820)
Net pension expenses, defined benefit plans (28 893) (24 814)
Curtailment/settlement of pension plans 4 106 11 241
Defined contribution plans (57 496) (52 160)
Early retirement scheme AFP (Norway) (13 504) (13 614)
Pension contribution expenses (66 894) (54 533)
Net pension expenses total (95 787) (79 347)
In addition, interest expenses on net pension liabilities is recognised as a part of finance expenses (8 758) (9 640)
Net liabilities arising from defined benefit obligations 2017 2016 Present value of funded pension obligation (422 642) (434 716)
Fair value of plan assets 385 561 395 299
Net funded pension obligation (37 081) (39 417)
Present value of unfunded pension obligation (407 325) (383 122)
Net value of funded and unfunded obligations (444 406) (422 539)
Net pension liabilities (444 406) (422 539)
Net pension assets 401 2 949
Net pension liabilities (444 807) (425 488)
Net pension liabilities (444 406) (422 539)
Defined benefit plansDefined benefit plans are pension plans where the group is responsible for paying pensions at a certain level, based on employees’ salaries when retiring. The group has funded and unfunded benefit plans in Norway, France, Germany, UK, Canada, Japan and South Africa, distributed as follows: Norway 16 per cent, France 45 per cent, other Europe 21 per cent, Canada 16 per cent, other countries 2 per cent, based on net pension obligation per 31 December 2017. In Norway most of the pension plans comprise pension on salaries above a certain level (12G, where G refers to the national insurance scheme’s basic amount in Norway, amounting to NOK 93,634 for 2017) and closed individual retirement schemes, plans which are unfunded. In Canada provisions are made for medical insurance as well as pension benefit plans.
Net interest is calculated based on net pension liability at the start of the period, multiplied by the discount rate. Any difference between actual return on pension assets and the interest income calculated as a part of the net interest, will be recognised directly in OCI. Interest on net pension liabilities are presented as a part of Finance expenses.
Movement in defined benefit obligations 2017 2016 Opening balance (817 838) (757 368)
Current service expenses and social contribution tax (28 022) (23 994)
Interest expenses (22 865) (23 938)
Actuarial gains / (losses) 8 234 (64 736)
Benefits paid 46 732 40 710
Business combinations and disposals - (27 288)
Curtailments/settlements 60 494 11 241
Other changes (42 050) (5 570)
Currency translation (34 651) 33 104
Present value of pension obligation as at 31 December (829 967) (817 838)
Movement in fair value of plan assets 2017 2016 Opening balance 395 300 363 633
Interest income 14 107 14 298
Administration cost (559) (820)
Actuarial gains / (losses) (7 263) 9 559
Contributions from employer 16 166 15 648
Benefits paid (24 920) (21 229)
Business combinations and disposals - 26 509
Curtailments/settlements (56 388) -
Other changes 40 785 4 800
Currency translation 8 333 (17 099)
Fair value of plan assets as at 31 December 385 561 395 300
Pension contribution funds 2017 2016 Current part of contribution fund 2 928 6 094
Long-term part of contribution fund 1 200 2 760
4 128 8 854
Movement in the defined benefit obligations and plan assets
In addition, some Norwegian entities have pension contribution funds, mainly based on excess pension assets from settlement of the defined benefit plans in 2010. The pension contribution funds are classified as long-term pension funds, except next year’s expected contributions which are classified as short-term (see note 16 Other non-current assets).
Breakdown of pension plan assets (fair value) as at 31 December Distribution % Fair value of Distribution % Fair value 2017 plan assets 2016 of plan assets 2017 2016 Cash, cash equivalents and money market investments 2 % 9 553 10 % 40 124
Bonds 45 % 172 080 40 % 156 610
Shares 52 % 199 336 49 % 194 518
Property 1 % 4 593 1 % 4 049
Total pension fund 100 % 385 561 100 % 395 300
2017 2016
Actual return on plan assets 4,8 % 20 860 6,1 % 22 352

54 ELKEM ANNUAL REPORT 2017 | FINANCIAL STATEMENT ELKEM AS GROUP ELKEM ANNUAL REPORT 2017 | FINANCIAL STATEMENT ELKEM AS GROUP 55
Net pension liabilities 2017 2016 Pension obligations (829 967) (817 838)
Pension plan assets 385 561 395 299
(444 406) (422 539)
Remeasurement effects recognised in other comprehensive income this period 2017 2016 Changes in actuarial gain / (loss) in pension obligation 8 234 (64 736)
Changes in actuarial gain / (loss) in pension assets (7 263) 9 559
971 (55 177)
Summary of pension liabilities and remeasurements
Assumptions regarding future mortality are set based on actuarial advice in accordance with published statistics and experience in each country.
Sensitivity on pension liabilities based on changes in main actuarial assumptionsThe defined benefit pension schemes exposes the group to actuarial risks such as investment risk, interest rate risk, salary growth risk, mortality risk and longevity risk. A decrease in corporate bond yields, a rise in inflation or an increase in life expectancy would result in an increase to plan liabilities. The sensitivity analysis below shows estimated effects in the defined pension liabilities based on reasonable changes in the main assumptions. The calculations are based on a change in one assumption while holding all other assumptions constant. Negative amounts shows an expected decrease in the net pension liability.
As the group’s main pension plans are defined contribution plans, there are no group policies for funding of the defined benefit plans. This is managed locally, based on the terms and status for the individual plan.
The principal assumptions used for the actuarial valuations in 2017 and 2016 Norway France Canada Germany UK Discount rate 2.2% (2.0%) 1.5% (1.0%) 3.5% (3.8%) 1.7% (1.8%) 2.4% (2.6%)
Expected rate of salary increase 2.3% (2.0%) 2,5% (2.5%) 3,5% (3.5%) 3.0% (3.0%) 3.3% (3.4%)
Annual regulation of pensions paid 1.0% (1.0%) - - 2.0% (2.0%) -
Change in public pension base rate (G) 2.3% (2.0%) - - - -
Expected contribution for the pension plans next year and average duration Norway France Canada Germany UK for the main defined benefit plans Contribution to be paid to defined pension plans next year 4 809 38 116 16 031 1 569 4 058
Weighted average duration of the defined benefit obligation 8 years 10 years 18 years 15 years 15 years
Assumption Discount rate Life expectancy Salary growth 0.5% increase 0.5% decrease 1 year increase 1 year decrease 0.5% increase 0.5% decrease
2017: Effect on the pension liability in NOK million (51) 56 28 (29) 21 (20)
2016: Effect on the pension liability in NOK million (53) 58 25 (25) 25 (23)
2017 2016 Loss on disposal of fixed assets (1 216) (2 464)
Freight and commission expenses (1 031 434) (835 773)
Leasing expenses (163 255) (139 667)
External services 1) (1 393 075) (1 250 508)
Insurance expenses (55 718) (58 786)
Impairment losses receivables (4 897) (7 329)
Other operating expenses 2) 3) (926 279) (854 865)
Total other operating expenses (3 575 874) (3 149 390)
Audit and other services 2017 2016 KPMG:
– Audit fee (12 296) (8 348)
– Other assurance services (187) (1 268)
– Tax services (287) -
– Other services (298) -
PwC and other audit firms:
– Audit fee (1 579) (4 858)
– Other assurance services (1 002) (680)
– Tax services (5 188) (5 568)
– Other services (3 591) (1 880)
Total (24 428) (22 602)
7 | Other operating expenses
1) Including services from auditor, see specification below.
2) Including change in direct costs on inventory.
3) Including capitalised salary on fixed asset projects of NOK 65,442 thousand (NOK 69,566 thousand). During 2017, Elkem AS group expensed NOK 359,600 thousand (NOK 338,753 thousand) as research and development related to processes, products and business development, including improvement projects and technical customer support to customers. In addition, capitalised R&D expenses amounts to NOK 53,530 thousand (NOK 52,341 thousand).
Grants received relating to research and development amount to NOK 81,000 thousand (NOK 65,907 thousand) are included in other operating income. KPMG is the group auditor of Elkem AS group. KPMG succeeded PwC as Elkem AS group auditor with effect from the fiscal year 2016. The following table shows fees to KPMG and fees to PwC and other audit firms.
In addition to the above, services of NOK 21,969 thousand in other service from KPMG have been provided and invoiced through Elkem AS to Bluestar Elkem International Co., Ltd. S.A. with NOK 16,057 thousand in 2017 and NOK 5,912 thousand in 2016.
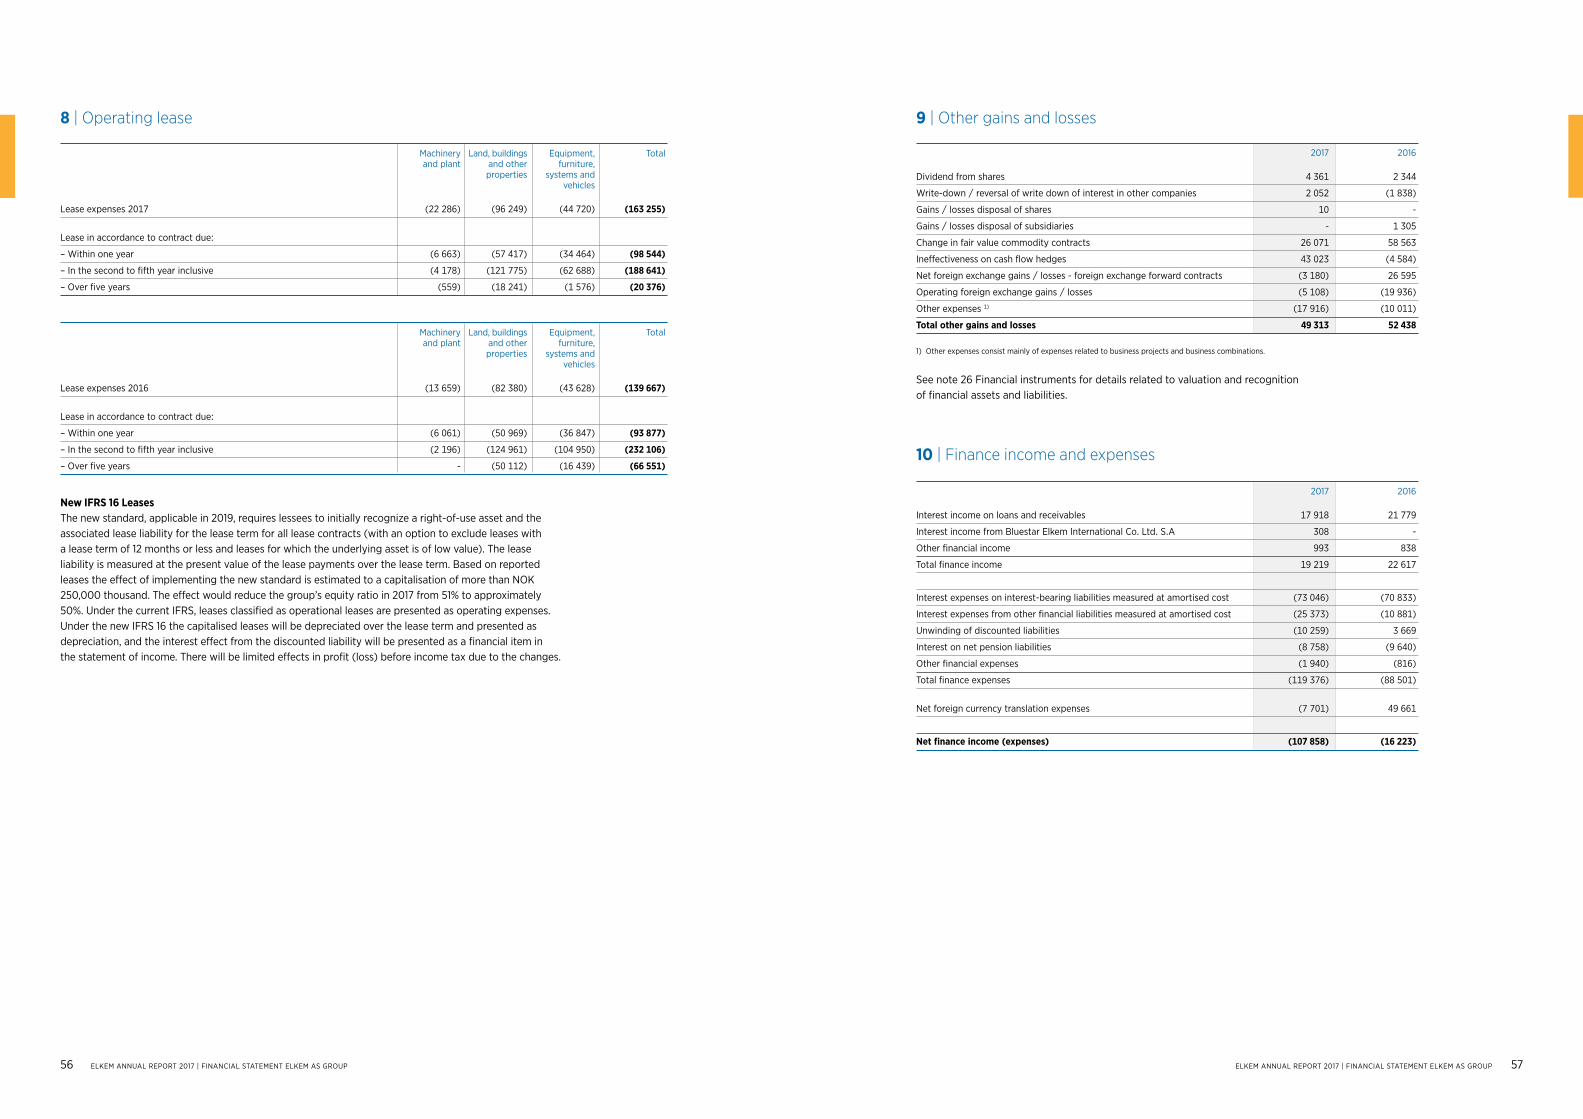
56 ELKEM ANNUAL REPORT 2017 | FINANCIAL STATEMENT ELKEM AS GROUP ELKEM ANNUAL REPORT 2017 | FINANCIAL STATEMENT ELKEM AS GROUP 57
8 | Operating lease
New IFRS 16 LeasesThe new standard, applicable in 2019, requires lessees to initially recognize a right-of-use asset and the associated lease liability for the lease term for all lease contracts (with an option to exclude leases with a lease term of 12 months or less and leases for which the underlying asset is of low value). The lease liability is measured at the present value of the lease payments over the lease term. Based on reported leases the effect of implementing the new standard is estimated to a capitalisation of more than NOK 250,000 thousand. The effect would reduce the group’s equity ratio in 2017 from 51% to approximately 50%. Under the current IFRS, leases classified as operational leases are presented as operating expenses. Under the new IFRS 16 the capitalised leases will be depreciated over the lease term and presented as depreciation, and the interest effect from the discounted liability will be presented as a financial item in the statement of income. There will be limited effects in profit (loss) before income tax due to the changes.
Machinery Land, buildings Equipment, Total and plant and other furniture, properties systems and vehicles Lease expenses 2017 (22 286) (96 249) (44 720) (163 255)
Lease in accordance to contract due:
– Within one year (6 663) (57 417) (34 464) (98 544)
– In the second to fifth year inclusive (4 178) (121 775) (62 688) (188 641)
– Over five years (559) (18 241) (1 576) (20 376)
Machinery Land, buildings Equipment, Total and plant and other furniture, properties systems and vehicles Lease expenses 2016 (13 659) (82 380) (43 628) (139 667)
Lease in accordance to contract due:
– Within one year (6 061) (50 969) (36 847) (93 877)
– In the second to fifth year inclusive (2 196) (124 961) (104 950) (232 106)
– Over five years - (50 112) (16 439) (66 551)
2017 2016 Interest income on loans and receivables 17 918 21 779
Interest income from Bluestar Elkem International Co. Ltd. S.A 308 -
Other financial income 993 838
Total finance income 19 219 22 617
Interest expenses on interest-bearing liabilities measured at amortised cost (73 046) (70 833)
Interest expenses from other financial liabilities measured at amortised cost (25 373) (10 881)
Unwinding of discounted liabilities (10 259) 3 669
Interest on net pension liabilities (8 758) (9 640)
Other financial expenses (1 940) (816)
Total finance expenses (119 376) (88 501)
Net foreign currency translation expenses (7 701) 49 661
Net finance income (expenses) (107 858) (16 223)
10 | Finance income and expenses
2017 2016 Dividend from shares 4 361 2 344
Write-down / reversal of write down of interest in other companies 2 052 (1 838)
Gains / losses disposal of shares 10 -
Gains / losses disposal of subsidiaries - 1 305
Change in fair value commodity contracts 26 071 58 563
Ineffectiveness on cash flow hedges 43 023 (4 584)
Net foreign exchange gains / losses - foreign exchange forward contracts (3 180) 26 595
Operating foreign exchange gains / losses (5 108) (19 936)
Other expenses 1) (17 916) (10 011)
Total other gains and losses 49 313 52 438
9 | Other gains and losses
1) Other expenses consist mainly of expenses related to business projects and business combinations.
See note 26 Financial instruments for details related to valuation and recognition of financial assets and liabilities.

58 ELKEM ANNUAL REPORT 2017 | FINANCIAL STATEMENT ELKEM AS GROUP ELKEM ANNUAL REPORT 2017 | FINANCIAL STATEMENT ELKEM AS GROUP 59
Income tax recognised in profit or loss 2017 2016 Profit (loss) before income tax 1 281 234 946 537
Current taxes (259 305) (158 281)
Deferred taxes (10 086) (30 286)
Total income tax (expense) benefit (269 390) (188 567)
Income taxes recognised in other comprehensive income (OCI) 2017 2016 Remeasurements of post employment benefit obligation 2 264 13 587
Hedging of net investment in foreign operations 48 039 (6 108)
Cash flow hedges (4 444) (238 356)
Total tax charged to OCI 45 859 (230 877)
Deferred tax assets and deferred tax liabilities 31.12.17 31.12.16 Cash flow hedges recognised in other comprehensive income 135 191 139 635
Property, Plant, Equipment and Intangible assets (449 146) (446 245)
Pension fund 116 965 118 629
Other differences (60 467) (37 681)
Accounts receivable 3 377 (1 378)
Inventories (11 168) (51 759)
Provisions 100 538 95 745
Debt forgivenes 1) 376 139 448 547
Tax losses to carry forward 451 347 415 510
Deferred tax assets (liabilities) 662 776 681 003
Not recognised deferred tax asset to tax losses to carry forward (300 666) (279 290)
Not recognised deferred tax asset other items 1) (377 113) (448 547)
Net deferred tax assets (liabilities) recognised (15 003) (46 834)
Reconciliation of income tax (expense) benefit 2017 2016 Profit (loss) before income tax 1 281 234 946 537
Expected income taxes, 24% of profit before tax (25%) (307 496) (236 634)
Tax effects of:
Difference in tax rates for each individual jurisdiction (8 844) (12 252)
Permanent differences
Tax effect of income from Norwegian controlled foreign companies (NOKUS) (6 907) (6 619)
Tax effect share of profit (loss) associates and joint ventures 7 458 4 667
Tax effects other permanent differences 26 857 10 407
Other effects
Tax effect of changes in not recognised deferred tax assets 14 306 65 500
Tax credits utilised 12 014 (1 199)
Tax effect change in tax rate 1) 11 177 6 190
Other current tax paid 2) (24 065) (33 258)
Previous year tax adjustment 6 110 14 631
Income tax (expense) benefit (269 390) (188 567)
Effective tax rate 21 % 20 %
11 | Taxes
1) The effect relates mainly to changes in tax rate from 24% to 23% in Norway and 38,6% to 21% in USA from 2018 and in 2016 changes in tax rate from 25% to 24% in Norway from 2017. The changes in tax rates were approved by the governments before year end the respective years.
2) Other current tax relates mainly to withholding tax on dividend from subsidiaries.
1) See section other maters below.
Change in net deferred tax assets and deferred tax liabilities 2017 2016 1 January (46 834) 199 493
Recognised in profit or loss for the year (10 086) (30 286)
Effect of business combination (5 689) 12 303
Recognised in other comprehensive income 45 859 (230 877)
Foreign currency exchange differences 1 747 2 533
31 December (15 003) (46 834)
Deferred taxes 31.12.17 31.12.16 Deferred tax assets 89 584 67 348
Deferred tax liabilities (104 587) (114 182)
Net deferred tax assets (liabilities) (15 003) (46 834)
31.12.17 Tax losses to carryforward Gross tax Net tax Not recognised Recognised tax losses to losses to tax loss loss carryforward carryforward carryforward carryforward France 1 067 494 355 648 (207 641) 148 007
Brazil 249 603 84 865 (84 865) -
USA 3 963 1 530 - 1 530
UK 5 458 928 - 928
Malaysia 16 732 4 016 (3 812) 204
Paraguay 33 038 3 304 (3 304) -
India 3 054 1 057 (1 045) 12
Total related to loss carryforward 1 379 342 451 348 (300 667) 150 681
31.12.16 Tax losses to carryforward Gross tax Net tax Not recognised Recognised tax losses to losses to tax loss loss carryforward carryforward carryforward carryforward France 955 235 328 509 (199 721) 128 788
Brazil 234 689 79 794 (75 450) 4 344
USA 7 929 3 062 - 3 062
UK 3 686 737 (733) 4
Malaysia 14 108 3 386 (3 386) -
Croatia 109 22 - 22
Total related to loss carryforward 1 215 756 415 510 (279 290) 136 220
The major part of the taxable loss can be carried forward for an unlimited period.
Deferred tax assets not recognised current yearWhen an entity has a history of recent losses, the deferred tax assets arising from unused tax losses is recognised only to the extent that there is convincing evidence that sufficient future taxable profit will be generated. Other tax related matters Elkem Silicones France SAS has four Elkem AS group internal debt-forgiveness agreements where internal loans were converted to equity and the converted amounts were treated as taxable income. Elkem Silicones France SAS can only utilise the agreements to the extent that the company has an accounting profit according to IFRS. All debt that is repaid under the agreements can be deducted against taxable income. Nominal value of the agreements as of 31 December 2017 are EUR 136 million (EUR 148 million). Elkem Silicones France SAS has repaid NOK 114,534 thousand (NOK 47,100 thousand) that gives a tax credit of NOK 38,186 thousand (NOK 15,703 thousand). The amount is included in tax effect of changes in not recognised deferred tax assets in the reconciliation of income tax (expense) benefit above.

60 ELKEM ANNUAL REPORT 2017 | FINANCIAL STATEMENT ELKEM AS GROUP ELKEM ANNUAL REPORT 2017 | FINANCIAL STATEMENT ELKEM AS GROUP 61
The respective agreements expire in 8 years 10 years 11 years 12 years
The respective agreements expire in 9 years 11 years 12 years 13 years
Pending tax issues with the tax authorities See note 24 Provisions and other non-current liabilities.
Property, plant and equipment
Depreciations start when the asset is ready for its intended use. Land is not depreciated.
Debt forgiveness in 2010 2012 2013 2014 Total Gross value of debt forgiveness 835 036 196 896 157 517 268 438 1 457 887
Usage 2017 (114 534) - - - (114 534)
Total debt that can be reversed 720 502 196 896 157 517 268 438 1 343 353
Deferred tax asset not recognised 1) 201 741 55 131 44 105 75 163 376 139
Debt forgiveness in 2010 2012 2013 2014 Total Gross value of debt forgiveness 817 675 181 705 145 364 247 728 1 392 472
Usage 2016 (47 100) - - - (47 100)
Total debt that can be reversed 770 575 181 705 145 364 247 728 1 345 372
Deferred tax asset not recognised 256 910 60 580 48 464 82 593 448 547
1) Based on tax rate 28%, which is applicable in France from 2019, compared to 33,3% per today.
1) See note 31 Business combinations.
12 | Property, plant and equipment, intangible assets and goodwill
2017 Land and Buildings Machinery Equipment, Construction Total other and plants furniture and in progress property transport- vehicles Opening balance Net booked value 2017 114 078 1 431 076 3 754 746 182 526 426 660 5 909 087
Additions 646 2 895 9 030 4 863 912 447 929 881
Disposals - (16) (1 536) (279) - (1 831)
Business combination 1) 26 704 - 4 070 1 311 251 657 283 742
Reclassification 1 336 189 (4 378) 5 086 (479) 1 754
Transferred from CiP 28 764 41 616 472 542 23 348 (566 270) -
Impairment losses (255) (772) (14 527) (1 255) - (16 809)
Depreciation expenses (4 436) (104 630) (538 753) (38 727) - (686 546)
Foreign currency exchange differences 7 438 25 281 94 567 1 817 20 554 149 657
Closing balance Net booked value 2017 174 275 1 395 639 3 775 761 178 690 1 044 569 6 568 934
Fixed assets under financial leasing
Included in Net booked value - - 2 955 719 - 3 674
Historical cost 229 780 3 104 394 10 444 606 567 483 1 044 569 15 390 832
Accumulated depreciation (44 198) (1 696 745) (6 570 795) (388 157) - (8 699 895)
Accumulated impairment losses (11 307) (12 010) (98 050) (636) - (122 003)
Closing balance Net booked value 2017 174 275 1 395 639 3 775 761 178 690 1 044 569 6 568 934
Estimated useful life 0–50 years 5–50 years 3–50 years 3–20 years
Depreciation plan Straight-line Straight-line Straight-line Straight-line
2016 Land and Buildings Machinery Equipment, Construction Total other and plants furniture and in progress property transport- vehicles Opening balance Net booked value 2016 110 050 1 331 921 3 403 958 161 142 595 138 5 602 208
Additions 856 554 22 442 6 496 663 362 693 710
Disposals - (50) (1 683) (527) - (2 261)
Business combination 1) - 116 017 232 153 1 270 8 367 357 808
Reclassification 2) (137) (10 064) (7 786) 427 - (17 560)
Transferred from CiP 10 023 110 987 664 265 53 272 (838 548) -
Impairment losses - (7 079) (4 646) (93) - (11 818)
Depreciation expenses (2 369) (93 463) (501 569) (37 464) - (634 865)
Foreign currency exchange differences (4 345) (17 747) (52 387) (1 998) (1 659) (78 135)
Closing balance Net booked value 2016 114 078 1 431 076 3 754 746 182 526 426 660 5 909 087
Fixed assets under financial leasing
Included in Net booked value 21 193 - 10 408 1 378 - 32 979
Historical cost 160 860 3 022 230 9 812 611 531 801 426 660 13 954 162
Accumulated depreciation (36 071) (1 579 672) (5 962 242) (348 647) - (7 926 630)
Accumulated impairment losses (10 711) (11 482) (95 624) (628) - (118 445)
Closing balance Net booked value 2016 114 078 1 431 076 3 754 746 182 526 426 660 5 909 087
Estimated useful life 0–50 years 5–50 years 3–50 years 3–20 years
Depreciation plan Straight-line Straight-line Straight-line Straight-line
1) See note 31 Business combinations.
2) In 2014 when Elkem group purchased assets from MSCH Europe GmbH, the right to use the technology related to the production process was included. In 2016 the value of the technology, NOK 17,560 thousand, is reclassified from Machinery and plants to intangible assets. The estimated useful life is not changed, and the reclassification does not affect comparable figures in the statement of income.
2017 Goodwill Other Technology New IT systems Intangible Total other intangible and licences products and assets under intangible assets programmes construction assets
Opening balance Net booked value 2017 342 645 105 479 153 976 162 385 118 539 152 635 693 013
Additions - 226 - - 1 613 84 825 86 664
Business combination (19 900) (2 038) - - 336 - (1 702)
Reclassification - 672 (984) - (1 442) - (1 754)
Transferred from CiP - - 6 594 99 726 20 762 (127 082) -
Amortisation - (6 214) (20 022) (38 325) (24 916) - (89 477)
Foreign currency exchange differences 3 578 3 781 11 690 10 145 9 6 981 32 605
Closing balance Net booked value 2017 326 323 101 906 151 254 233 931 114 900 117 359 719 350
Historical cost 326 323 173 898 476 853 548 397 339 890 117 359 1 656 397
Accumulated amortisation - (71 135) (325 599) (314 466) (224 990) - (936 190)
Accumulated write-downs - (857) - - - - (857)
Closing balance Net booked value 2017 326 323 101 906 151 254 233 931 114 900 117 359 719 350
Estimated useful life Indefinite 3–10 years 3–15 years 3–16 years 3–10 years
Amortisation plan Straight-line Straight-line Straight-line Straight-line
Additions in 2017 mainly consist of development projects of NOK 53,530 thousand.
Intangible assets and goodwill

62 ELKEM ANNUAL REPORT 2017 | FINANCIAL STATEMENT ELKEM AS GROUP ELKEM ANNUAL REPORT 2017 | FINANCIAL STATEMENT ELKEM AS GROUP 63
2016 Goodwill Other Technology New IT systems Intangible Total other intangible and licences products and assets under intangible assets programmes construction assets
Opening balance Net booked value 2016 244 088 63 681 168 533 189 076 120 805 101 398 643 493
Additions - 6 517 102 - 5 547 93 292 105 458
Disposals (23) - - - - - -
Business combination 98 030 36 289 - - 8 - 36 297
Reclassification - 12 617 3 138 869 937 - 17 560
Transferred from CiP - - 5 720 16 722 14 237 (36 679) -
Amortisation - (2 988) (21 242) (35 793) (22 893) - (82 916)
Foreign currency exchange differences 550 (10 637) (2 275) (8 489) (102) (5 376) (26 879)
Closing balance Net booked value 2016 342 645 105 479 153 976 162 385 118 539 152 635 693 013
Historical cost 342 645 166 153 436 128 416 141 318 256 152 635 1 489 314
Accumulated amortisation - (59 883) (282 153) (253 757) (199 717) - (795 510)
Accumulated write-downs - (790) - - - - (790)
Closing balance Net booked value 2016 342 645 105 479 153 976 162 385 118 539 152 635 693 013
Estimated useful life Indefinite 3–10 years 3–15 years 3–16 years 3–10 years
Amortisation plan Straight-line Straight-line Straight-line Straight-line
Additions in 2016 mainly consist of development projects of NOK 52,926 thousand.
Goodwill Impairment tests are performed by comparing the carrying amount for the asset or the Cash Generating Unit (CGU) including goodwill, with the recoverable amount. The recoverable amount is based on value in use, calculated using the discounted cash flow method. A CGU is the lowest level at which independent cash inflows can be measured.
Impairment test goodwill and intangible assets
Goodwill per entity/CGU Silicon Silicones Foundry Carbon Total 2017 materials products Elkem Foundry Hingna Nagpur - - 40 418 - 40 418
Elkem Rana AS 39 965 - - - 39 965
Elkem Oilfield Chemical FZCO 19 139 - - - 19 139
Elkem Materials Process Services BV 142 - - - 142
Elkem Participacòes Indústria e Comércio Limitada - - - 10 325 10 325
Ferroveld JV - - - 49 161 49 161
Elkem Carbon China Comp Ltd - - - 1 000 1 000
NEH Inc. 21 479 - 55 663 14 259 91 401
Silicones - 74 771 - - 74 771
Total Goodwill 80 725 74 771 96 081 74 745 326 323
Goodwill per entity/CGU Silicon Silicones Foundry Carbon Total 2016 materials products Elkem Foundry Hingna Nagpur - - 36 979 - 36 979
Elkem Rana AS 61 903 - - - 61 903
Elkem Oilfield Chemical FZCO 20 110 - - - 20 110
Elkem Materials Process Services BV 142 - - - 142
Elkem Participacòes Indústria e Comércio Limitada - - - 10 930 10 930
Ferroveld JV - - - 46 559 46 559
Elkem Carbon China Comp Ltd - - - 1 000 1 000
NEH Inc. 22 565 - 58 476 14 979 96 020
Silicones - 69 003 - - 69 003
Total Goodwill 104 719 95 455 69 003 73 468 342 645
WACC Growth Foundry products 7.8% 2.0 %
Silicon materials 7.8% 2.0 %
Carbon 8.9% 2.0 %
Silicones 8.7% 2.0 %
Discounted cash flow models are applied to determine the value in use for the cash-generating units. Management in each CGU has projected cash flows based on forecast and strategy plans covering a four-year period. Currency rates and power prices are based on external official sources such as Reuters and Nasdaq. Beyond the explicit forecast period of four years, the cash flows are extrapolated using constant nominal growth rates.
Key assumptionsKey assumptions used in the calculation of value in use are growth rate, gross operating profit (loss) levels, capital expenditure and discount rates.
Growth rates: The expected growth rates for a cash-generating unit converge from its current level experienced over the last few years, to the long-term growth level in the market in which the entity operates. The growth rates used to extrapolate cash flow projections beyond the explicit forecast period, are based on management’s past experience,assumptions in terms of market share and expectations for the market development in which the entity operates.
Gross operating profit (loss) levels: The gross operating profit (loss) level represents the operating margin before depreciation and amortisation, and it is estimated based on the current level and expected future market development, which also takes into consideration committed operational efficiency programs. Changes to the outcome of these initiatives may affect future estimated gross operating profit (loss) levels.
Capital expenditure (“Capex”): A normalised capex is assumed in the long run. Estimated capital expenditures do not include capital expenditures that significantly enhance the current performance, as such effects generally are not included in the cash flow projections.
Discount rates: The required rate of return was calculated by the WACC method. The cost of a company’s equity and liabilities, weighted to reflect its capital structure of 50:50 respectively, derive from its weighted average cost of capital. The WACC rates used in discounting the future cash flows, are based on Norwegian 10 year risk-free interest rate for Foundry products, Silicon Materials and Carbon. For Silicones the interest rate is based on the European 10 year bond rate. The rates are adjusted for inflation differential and country risk premium. The discount rates also take into account the debt premium, market risk premium, corporate tax rate and asset beta.
The following post-tax discount rates (WACC) and sustained growth rate for year five and forward have been used for the impairment tests:
Impairment – test results and conclusion Value in use for each CGU exceeds carrying amount. The impairment tests indicate no requirement for write-down.
Sensitivity of estimated cash flows An increase of 1 percentage point in WACC will not result in an impairment for the Elkem AS group. A change of 10 % in other key assumptions will not result in an impairment for the Elkem AS group.

64 ELKEM ANNUAL REPORT 2017 | FINANCIAL STATEMENT ELKEM AS GROUP ELKEM ANNUAL REPORT 2017 | FINANCIAL STATEMENT ELKEM AS GROUP 65
Elkem AS group has interests in the following jointly controlled arrangements:
There is no quoted market price for the investments.
See note 28 Related party transactions for transactions with joint arrangements. There are no contingent liabilities or commitments related to the joint ventures.
13 | Joint arrangements
Name of entity Business office Country Principal activities Elkem Ferroveld JV Ferrobank Emalahleni South Africa Electrode paste production
Dehong Elkem Materials Co. Ltd Dehong, Yunnan China Microsilica production
Elkania DA Hauge i Dalane Norway Microfine weighting material
Elkem Uruguay SA (formerly Igazú Alloys S.A.) Montevideo Uruguay Production of foundry products
North Sea Container Line AS Haugesund Norway Shipping services
Klafi EHF Gradating, Akranes Iceland Transportation/harbour services
Salten Energigjenvinning AS Oslo Norway Energy production
Name of entity % equity % equity 2017 2016 interest 2017 interest 2016 Classification 1) Classification 1)
Elkem Ferroveld JV 50 % 50 % JO JO
Dehong Elkem Materials Co. Ltd 2) - - - JO
Elkania DA 50 % 50 % JO JO
Elkem Uruguay SA 3) - 50 % - JV
North Sea Container Line AS 50 % 50 % JV JV
Klafi EHF 50 % 50 % JV JV
Salten Energigjenvinning AS 4) 50 % - JV JV
1) JO is equal to joint operations and JV is equal to joint ventures.
2) Liquidated during 2016.
3) The remaining shares in Elkem Uruguay SA (formerly Igazú Alloys S.A.) were purchased in September 2017, see note 31 business combination. The company’s results are included as a joint venture up to the date its remaining shares were purchased. No gain or loss is recognised from remeassurement of previously held equity interests due to the transaction.
4) Incorporated 1 June 2017.
2017 2016 Total interest in joint ventures 1 January 108 978 52 935
Acquired shares 19 528 60 272
Disposal of shares in Joint ventures (28 519) -
Dividend received (12 000) (15 000)
Share of profit (loss) for the year 17 682 1 408
Currency translation differences transferred to income on disposal (4 835) -
Currency translation differences (2 963) 9 363
Total interest in joint ventures 31 December 97 871 108 978
Summary of financial information for joint ventures 2017 Current assets, including cash and cash equivalents NOK 105,683 thousand 211 124
Non-current assets 31 932
Current liabilities, including current financial liabilities NOK 0 42 607
Non-current liabilities, including non-current financial liabilities NOK 4,707 thousand 4 707
Net assets/equity 195 742
Group’s carrying amount 97 871
Total revenue 489 772
Total expenses, including depreciation and amortisation NOK 2,768 thousand (458 057)
Financial income, including interest income NOK 1,054 thousand 1 054
Financial expenses, including interest expenses NOK 146 thousand 2 981
Tax expense (388)
Total profit for the year 35 363
Other comprehensive income -
Total comprehensive income 35 363
Group’s share of profit for the year 17 682
Group’s share of other comprehensive income -
Summary of financial information for joint ventures 2016 Current assets, including cash and cash equivalents NOK 91,851 thousand 171 551
Non-current assets 289 129
Current liabilities, including current financial liabilities NOK 5,373 thousand 41 464
Non-current liabilities, including non-current financial liabilities NOK 200,531 thousand 201 261
Net assets/equity 217 955
Group’s carrying amount 108 978
Total revenue 423 875
Total expenses, including depreciation and amortisation NOK 2,197 thousand (417 845)
Financial income, including interest income NOK 785 thousand 785
Financial expenses, including interest expenses NOK 298 thousand (3 433)
Tax expense (567)
Total profit for the year 2 815
Other comprehensive income -
Total comprehensive income 2 815
Group’s share of profit for the year 1 408
Group’s share of other comprehensive income -

66 ELKEM ANNUAL REPORT 2017 | FINANCIAL STATEMENT ELKEM AS GROUP ELKEM ANNUAL REPORT 2017 | FINANCIAL STATEMENT ELKEM AS GROUP 67
31.12.17 31.12.16 Interest in associates 60 644 54 543
Interest in other companies 51 323 45 973
Total interest in associates and other companies 111 967 100 516
2017 2016 Total interest in associates at opening balance 54 543 47 788
Share of profit 16 462 20 722
Dividend received (13 037) (11 190)
Part of other comprehensive income (325) -
Other changes 3 001 (2 777)
Total interest in associates 60 644 54 543
14 | Interest in associates and other companies
Name of entity Principal activities Country Proportion Net assets Total Group’s Carrying of shares/ operating share of amount votes (%) income profit
Elkem Chartering AS Deep sea charter services Oslo, NO 25 % 91 528 91 418 7 638 22 882
Euro Nordic Agencies Belgium NV Ship agencies services Antwerp, BE 50 % 2 780 124 084 557 1 390
Euro Partnership BV Ship management services Moerdijk, NL 50 % 60 638 489 5 310 30 319
Combined Cargo Warehousing BV Warehousing Moerdijk, NL 33 % 18 342 23 463 2 957 6 053
Total interest in associates 16 462 60 644
Name of entity Principal activities Country Proportion Net assets Total Group’s Carrying of shares/ operating share of amount votes (%) income profit
Elkem Chartering AS Deep sea charter services Oslo, NO 25 % 62 276 93 877 7 740 15 569
Euro Nordic Agencies Belgium NV Ship agencies services Antwerp, BE 50 % 1 494 564 282 747
Euro Partnership BV Ship management services Moerdijk, NL 50 % 66 426 20 650 10 325 33 213
Combined Cargo Warehousing BV Warehousing Moerdijk, NL 33 % 15 194 28 790 2 375 5 014
Total interest in associates 20 722 54 543
As at 31 December 2017 Elkem AS group has interest in the following associates
As at 31 December 2016 Elkem AS group has interest in the following associates
15 | Group entities
Company Functional Country of 2017 2016 Owner currency incorporation Equity Equity interest interest
Aleaciones Yguazú S.A.1) USD Paraguay 100 % 50 % Elkem Uruguay SA
Elkania DA NOK Norway 50 % 50 % Elkem AS
Elkem Carbon (China) Comp Ltd CNY China 100 % 100 % Elkem Carbon Singapore Pte. Ltd.
Elkem Carbon AS NOK Norway 100 % 100 % Elkem AS
Elkem Carbon Malaysia Sdn. Bhd. MYR Malaysia 100 % 100 % Elkem Carbon AS
Elkem Carbon Singapore Pte. Ltd. SGD Singapore 100 % 100 % Elkem Carbon AS
Elkem Chartering Holding AS NOK Norway 80 % 80 % Elkem AS
Elkem Distribution Center B.V. EUR Netherlands 100 % 100 % Elkem AS
Elkem Egypt for Industry, Contracting & Trading S.A.E USD Egypt 100 % 100 % Elkem International AS
Elkem Ferroveld JV ZAR South Africa 50 % 50 % Elkem Carbon AS
Elkem Foundry (China) Co. Ltd CNY China 100 % 100 % Elkem AS
Elkem Foundry Invest AS NOK Norway 100 % 100 % Elkem AS
Elkem GmbH EUR Germany 100 % 100 % Elkem AS
Elkem Iberia SLU EUR Spain 100 % 100 % Elkem AS
Elkem International AS NOK Norway 100 % 100 % Elkem AS
Elkem International Trade (Shanghai) Co. Ltd. CNY China 100 % 100 % Elkem International AS
Elkem Island EhF NOK Iceland 100 % 100 % Elkem AS
Elkem Japan K.K JPY Japan 100 % 100 % Elkem AS
Elkem LTD GBP United Kingdom 100 % 100 % Elkem AS
Elkem Madencilik Metalurji Sanayi Ve Ticaret Ltd STI EUR Turkey 100 % 100 % Elkem International AS
Elkem Materials Delaware Inc. USD USA 100 % 100 % Elkem Materials Inc
Elkem Materials Inc. USD USA 100 % 100 % NEH LLC
Elkem Materials Processing (Tianjin) Co.,Ltd CNY China 100 % 100 % Elkem AS
Elkem Materials Processing Services BV EUR Netherlands 100 % 100 % Elkem AS
Elkem Materials South America Ltda BRL Brazil 100 % 100 % Elkem Materials Inc
Elkem Metal Canada Inc CAD Canada 100 % 100 % Elkem AS
Elkem Milling Services GmbH EUR Germany 100 % 100 % Elkem AS
Elkem Nordic A.S. DKK Denmark 100 % 100 % Elkem AS
Elkem Oilfield Chemicals FZCO AED Dubai 51 % 51 % Elkem AS
Elkem Participacòes Indústria e Comércio Limitada BRL Brazil 100 % 100 % Elkem Carbon AS
Elkem Rana AS NOK Norway 100 % 100 % Elkem AS
Elkem S.a.r.l. EUR France 100 % 100 % Elkem AS
Elkem S.r.l. EUR Italy 100 % 100 % Elkem AS
Elkem Siliconas España S.A.U EUR Spain 100 % 100 % Elkem AS
Elkem Silicones (UK) Ltd GBP United Kingdom 100 % 100 % Elkem AS
Elkem Silicones Brasil Ltda BRL Brazil 100 % 100 % Elkem AS
Elkem Silicones Canada Corp. CAD Canada 100 % 100 % Elkem AS
Elkem Silicones Czech Republic s.r.o CZK Czech Republic 100 % 100 % Elkem AS
Elkem Silicones Finland OY EUR Finland 100 % 100 % Elkem AS
Elkem Silicones France SAS EUR France 100 % 100 % Elkem AS
Elkem Silicones Germany GmbH EUR Germany 100 % 100 % Elkem AS
Elkem Silicones Hong Kong Co. Limited HKD Hong Kong 100 % 100 % Elkem AS
Elkem Silicones Poland p. z o.o PLN Poland 100 % 100 % Elkem AS
Elkem Silicones Scandinavia AS NOK Norway 100 % 100 % Elkem AS
Elkem Silicones Services S.à.r.l EUR France 100 % 100 % Elkem AS
Elkem Silicones Shanghai Co. Limited CNY China 100 % 100 % Elkem AS
Elkem Silicones USA Corp. USD USA 100 % 100 % Elkem AS
Elkem Siliconi Italia S.r.l EUR Italy 100 % 100 % Elkem AS
Elkem Singapore Materials Pte. Ltd SGD Singapore 100 % 100 % Elkem AS
Elkem South Asia Private Limited INR India 100 % 100 % Elkem AS

68 ELKEM ANNUAL REPORT 2017 | FINANCIAL STATEMENT ELKEM AS GROUP ELKEM ANNUAL REPORT 2017 | FINANCIAL STATEMENT ELKEM AS GROUP 69
31.12.17 31.12.16 Long-term pension contribution fund 1) 1 200 2 760
Defined benefit pension asset 1) 401 2 949
Long-term deposit pension guarantee 2) 18 775 17 905
Restricted deposits 3) 76 136 78 028
Other deposits 29 504 34 785
Prepaid lease 1 284 2 897
Grants receivable 5) 155 425 136 234
Loans to joint arrangements and associates 4) 8 921 52 682
Receivables from joint ventures 4) - 14 269
Prepayments to supplier 28 023 9 776
Other long-term receivables 4 946 18 411
Total other non-current assets 324 615 370 697
16 | Other non-current assets
1) In September 2017 Elkem Foundry Invest AS purchased the remaining 50% of the shares in Elkem Uruguay SA (formerly Iguazú Alloys S.A.). For more information see note 30 Changes in the composition of the group and note 31 Business combinations.
2) The companies are dormant and were liquidated in January 2018.
3) On 1 January 2017 Nor-Kvarts AS merged with Elkem AS.
4) The companies were liquidated during 2016.
1) See note 6 Employee retirement benefits.
2) Long-term deposit pension guarantee is related to unfunded pension liabilities for salaries above 12G.
3) The restricted deposits are related to tax litigation in Elkem AS group’s business in Brazil, see note 24 Provisions and other long term liabilities.
4) See note 28 Related party transactions.
5) See note 29 Grants.
31.12.17 31.12.16 Finished goods 2 238 276 2 111 814
Work in progress 231 964 251 356
Raw materials 713 843 652 333
Operating materials and spare parts 376 925 323 912
Total inventories 3 561 007 3 339 415
31.12.17 31.12.16 Accounts receivable 2 157 318 1 819 355
Accounts receivable, related parties 59 422 33 304
Provision for doubtful accounts (36 425) (31 840)
Bills receivable 1) 84 165 49 951
Total accounts receivable 2 264 479 1 870 770
31.12.17 31.12.16 Not due 1 778 456 1 583 220
1–30 days 296 148 167 715
31–60 days 67 864 33 938
61–90 days 29 987 17 004
More than 90 days 44 285 50 782
Total accounts receivable 2 216 740 1 852 659
Movement in allowance for doubtful accounts 31.12.17 31.12.16 Opening balance (31 840) (27 466)
Provisions / losses on doubtful accounts during the year (8 697) (10 577)
Reversed provisions 5 683 5 401
Foreign currency exchange differences (1 571) 803
Closing balance (36 425) (31 840)
Overdue by 31.12.17 31.12.16 0-3 months (5 319) (6 231)
3-6 months (4 130) (3 650)
6-12 months (840) (1 241)
Over a year (26 137) (20 719)
Total impaired overdue receivables (36 425) (31 840)
17 | Inventories
18 | Accounts receivable
Provisions for write-down of inventories as at 31 December 46 690 64 605
Analysis of gross accounts receivable by age, presented based on the due date
Elkem AS group applies for credit insurance for all customers. In cases where credit insurance coverage is refused, other methods of securing the sales income are used. Other methods used for securing the sales are, among others, prepayment, letter of credit, documentary credit, guarantee, etc.
Analysis of current receivables that are past due date and impaired, by age
1) A bill receivable is a document where the customer formally agrees to pay for delivered goods or services at maturity date, and are normally guaranteed by a financial institution. A bill receivable is transferable and can be used to pay accounts payable. The bills receivable-document effectively replaces, for the specified amount, the open debt exchanged for the bill. Bills receivable are used by Elkem AS group’s Chinese entities, and the duration is normally below six months.
Company Functional Country of 2017 2016 Owner currency incorporation Equity Equity interest interest
Elkem Uruguay SA 1) USD Uruguay 100 % 50 % Elkem Foundry Invest AS
Euro Nordic Belgium BVBa 4) EUR Belgium - - Euro Nordic Logistics BV
Euro Nordic Logistics BV EUR Netherlands 80 % 80 % Elkem Chartering Holding AS
Euro Nordic Netherlands BV EUR Netherlands 80 % 80 % Euro Nordic Logistics BV
Explotacion de Rocas Industriales y Minerales S.A. EUR Spain 100 % 100 % Elkem AS
Dehong Elkem Materials Co. Ltd 4) CNY China - - Elkem AS
Gimtrade Ltd.2) GBP United Kingdom 100 % 100 % Elkem LTD.
Iniconce, S.L EUR Spain 97 % 97 % Explotacion de Rocas Industriale sy Minerales S.A.
Mill Street Ltd.2) GBP United Kingdom 100 % 100 % Elkem LTD.
NEH LLC USD USA 100 % 100 % Elkem AS
NorenoComercial Importada e Exportadora Limitada BRL Brazil 100 % 100 % Elkem Participacòes Indústria e Comércio Limitada
Nor-Kvarts AS 3) NOK Norway - 100 % Elkem AS
Norsil, S.A. EUR Spain 100 % 100 % Iniconce, S.L
Tifwer Trade S.A.1) USD Uruguay 100 % 50 % Elkem Uruguay SA

70 ELKEM ANNUAL REPORT 2017 | FINANCIAL STATEMENT ELKEM AS GROUP ELKEM ANNUAL REPORT 2017 | FINANCIAL STATEMENT ELKEM AS GROUP 71
31.12.17 31.12.16 Pension contribution fund, short-term part 1) 2 928 6 094
Restricted deposits 3 773 3 771
Prepayments 123 248 66 670
Grants receivable 2) 29 288 133 090
Grants receivable, settled net against taxes payable 2) 55 929 51 366
VAT receivables 316 722 265 656
Corporate income tax receivables 24 989 51 093
Other receivables 48 717 26 916
Total other current assets 605 595 604 656
Overview of finance lease 31.12.17 31.12.16 Within one year 1 059 4 394
Between 1 and 5 years 401 1 527
Over 5 years - -
Total lease payments 1 460 5 921
Less future finance charges 120 (91)
Present value of lease obligations 1 580 5 830
Less amount due for settlement within 12 months 1 179 4 333
Total non-current finance lease obligations 401 1 497
19 | Other current assets
Leasing payments current year 4 311 35 787
See also note 22 Interest-bearing assets / liabilities.
20 | Shareholder information
Elkem AS is the parent company of Elkem AS group. As of 31 December 2017 Elkem AS is 100% owned by Bluestar Elkem International Co. Ltd S.A. Elkem AS has its registered company address: Drammensveien 169, 0277 Oslo, Norway.
Share Capital Share capital as at 31 December 2017 in Elkem AS is NOK 2,010 million, divided in 1 share. There has been no changes in number of shares outstanding during the periods presented.
21 | Finance lease liabilities
Elkem AS group leases some of its manufacturing equipment under finance lease. Interest rates range from 3.06% to 6.99%.
The group has options to purchase the equipment for a nominal amount at the end of the lease term. The obligations under finance lease are secured by the lessors title to the leased assets.
1) See note 6 Employee retirement benefits.
2) See note 29 Grants.
31.12.17 31.12.16 Non-current interest-bearing liabilities
Loans from other related parties within China National Bluestar group 6 873 6 341
Financial leases 1) 401 1 497
Loans from external part, other than bank 79 521 -
Bank financing 2 595 180 2 827 021
Total non-current interest-bearing liabilities 2 681 975 2 834 859
Current interest-bearing liabilities
Financial leases 1) 1 179 4 333
Bank financing 595 558 211 700
Loans from external part, other than bank 60 625 58 433
Accrued interest 3 827 3 504
Total current interest-bearing liabilities 661 189 277 970
Total interest-bearing liabilities 3 343 164 3 112 829
Interest-bearing assets
Cash and bank balances 1 493 279 1 230 668
Restricted deposits 98 683 99 704
Loans to joint arrangements 8 921 52 682
Accrued interest income 215 1 010
Total interest-bearing assets 1 601 098 1 384 064
Net interest-bearing assets / (liabilities) (1 742 066) (1 728 765)
22 | Interest-bearing assets / liabilities
1) See note 21 Finance lease liabilities.
1) The main part of interest-bearing liabilities are expected to be refinanced in March / April 2018, see note 33 Events after the reporting period.
Interest-bearing liabilities by currency Currency NOK Currency NOK amount 31.12.17 amount 31.12.16 EUR 317 115 3 121 933 326 453 2 965 922
USD 26 513 217 511 5 772 49 747
NOK (6 086) (6 086) 97 163 97 163
Other currencies - 9 806 - (3)
Total interest-bearing liabilities 3 343 164 3 112 829
Maturity of interest-bearing liabilities Loans from Financial Loans from Bank Accrued Total as at 31 December 2017 other related leases external party, financing 1) interest parties other than bank 2018 - 1 179 60 625 595 558 3 827 661 189
2019 6 873 401 12 471 596 954 - 616 699
2020 - - 12 644 1 786 706 - 1 799 350
2021 - - 13 062 64 634 - 77 696
2022 - - 13 494 67 628 - 81 122
2023 and later - - 27 850 87 679 - 115 528
Total 6 873 1 580 140 146 3 199 159 3 827 3 351 585
Prepaid loan fees - - - (8 420) - (8 420)
Total interest-bearing liabilities 6 873 1 580 140 146 3 190 739 3 827 3 343 164

72 ELKEM ANNUAL REPORT 2017 | FINANCIAL STATEMENT ELKEM AS GROUP ELKEM ANNUAL REPORT 2017 | FINANCIAL STATEMENT ELKEM AS GROUP 73
Covenant Elkem AS group related to drawn loan of NOK 2,834 million 31.12.17 31.12.16 Loan covenant (NOK 3,023 million) in Elkem AS Total Equity NOK 8 332 862 7 459 042
Total Assets NOK 16 347 935 14 813 342
Equity ratio 51,0 % 50,4 % > 30%
Gross operating profit (loss) NOK 2 098 467 1 617 790
Net finance charges NOK 66 747 61 639
Interest cover ratio 31,44 26,25 > 4.00
Maturity of interest-bearing liabilities Loans from Financial Loans from Bank Accrued Total as at 31 December 2016 other related leases external party, financing interest parties other than bank 2017 - 4 333 - 270 133 3 504 277 970
2018 6 341 1 452 - 550 479 - 558 272
2019 - 45 - 504 442 - 504 487
2020 - - - 1 639 614 - 1 639 614
2021 - - - 48 533 - 48 533
2022 and later - - - 97 065 - 97 065
Total 6 341 5 830 - 3 110 266 3 504 3 125 941
Prepaid loan fees - - - (13 112) - (13 112)
Total interest bearing liabilities 6 341 5 830 - 3 097 154 3 504 3 112 829
Net investment hedge Elkem AS has entered into a bank loan amounting to EUR 275 million that is included in the line item bank financing above. The spot rate of the loan has been designated as a hedge of the net investment in the group’s subsidiaries with EUR as functional currency. The fair value and carrying amount of the borrowing at 31 December 2017 was NOK 2,498 million (NOK 2,707 million). The foreign exchange loss of NOK 208,865 thousand (a gain of NOK 25,449 thousand) on translation of the borrowing from EUR to NOK at the end of the reporting period is recognised in other comprehensive income and accumulated in the foreign currency translation reserve, in statement of changes in equity. There was no ineffectiveness to be recorded from net investments in foreign entity hedges.
Credit facilities As of 31 December 2017 the group has undrawn total granted credit facilities of NOK 2,331 million. As of 31 December 2016 the group has drawn NOK 62 million of total granted credit facilities of NOK 2,167 million. The drawn amounts are classified as short term bank financing. The main revolving credit facilities are granted to Elkem AS but the facilities can be utilised by Elkem AS and its subsidiaries. The main facilities amount to EUR 200 million (NOK 1,969 million) and NOK 250 million respectively. See note 27 Financial risk and capital management for more information, section liquidity risk.
Loan covenant Elkem AS group has covenants related to its two main external interest bearing loan facilities. In addition to the covenants on these two loan facilities there are loan covenants related to the credit facilities in Elkem Metal Canada Inc of CAD 2 million. Elkem Metal Canada Inc. is not in breach with its covenants at the end of 2017 and 2016.
For the two main credit facilities and term loans in Elkem AS group, the loan covenants relates to the financial performance of Elkem AS group as specified in the table below.
Movement in interest-bearing liabilities 31.12.16 Cash flows Non-cash changes 31.12.17
Receipts/ Debt Re- Business Foreign Payments conversion classification combination exchange changesLoans from other related parties within China National Bluestar group 6 341 - - - - 532 6 873
Financial leases 1 497 (4 311) - 3 154 - 61 401
Loans from external part, other than bank - - - - 76 868 2 653 79 521
Bank financing 2 827 021 (55 883) - (496 216) 84 207 236 051 2 595 180
Total movement non-current interest-bearing liabilities 2 834 859 (60 194) - (493 062) 161 075 239 297 2 681 975
Financial leases 4 333 - - (3 154) - - 1 179
Bank financing 211 704 (116 080) - 495 881 - 4 053 595 558
Loans from external part, other than bank 58 433 (8 556) - 335 7 639 2 774 60 625
Total movement current interest-bearing liabilities 274 470 (124 636) - 493 062 7 639 6 827 657 362
Total movement interest-bearing liabilities 3 109 329 (184 830) - - 168 714 246 124 3 339 337
Mortgaged liabilities 31.12.17 31.12.16 Mortgaged liabilities 117 664 67 847
Mortgaged provisions - 55 596
Book value mortgaged assets 31.12.17 31.12.16 Building 380 461 163 029
Machinery and plant 45 028 843
Other assets 35 934 92 034
Guarantee commitments 31.12.17 31.12.16 Guarantee commitment KLIF (Climate and Pollution Agency) 31 274 4 618
Other guarantees 118 107
23 | Pledge of assets and guarantees
Pledges The main part of Elkem AS group’s interest-bearing liabilities are neither pledged nor guaranteed. Details of liabilities that have pledged assets related to them are stated below:
Elkem AS group makes limited use of guarantees, see specification below.

74 ELKEM ANNUAL REPORT 2017 | FINANCIAL STATEMENT ELKEM AS GROUP ELKEM ANNUAL REPORT 2017 | FINANCIAL STATEMENT ELKEM AS GROUP 75
Litigation The provisions due to litigations are mainly related to tax cases in the Carbon division in Brazil. Opening balance also consists of provisions related to tax reassessments for value added tax and withholding tax in the Silicones division. The tax reassessment cases regarding withholding tax were concluded in 2016 and the tax reassessment cases regarding VAT were closed in 2017.
Tax cases in Brazil can take a substantial amount of time before resolution by the tax authorities, hence the time of settlement is uncertain. Provisions are made for each case based on the estimated amount expected to be paid, including interest and penalties. In accordance with Brazilian regulations, agreed amounts have been transferred to restricted bank accounts and are adjusted for interest. The restricted cash is included in other non-current assets, see note 16 Other non-current assets.
Site restoration Elkem AS group has provisions for future remediation work related to the necessary site remediation work that it will have to undertake in respect of its quartz mines and for site remediation work on land areas where waste from the production is disposed of. Total provision NOK 33,399 thousand (NOK 26,930 thousand).
Provisions include the following: Litigations Site Contracts Employee Other Total restoration obligation benefits provisions provisions Balance 1 January 2017 171 731 77 437 256 911 76 455 7 969 590 503
Additional provisions recognised 28 669 24 480 - 7 063 2 648 62 860
Additions business combinations - - (1 552) - - (1 552)
Used during the year (76 696) (13 219) (49 260) (9 404) (7 547) (156 126)
Foreign currency exchange differences (4 734) 3 023 - 3 989 (233) 2 045
Balance 31 December 2017 118 970 91 721 206 099 78 103 2 837 497 730
Hereof classified as provisions and other non-current liabilities 96 728 52 145 123 885 71 866 2 837 347 461
Hereof classified as provisions and other current liabilities 22 242 39 576 82 214 6 237 - 150 269
118 970 91 721 206 099 78 103 2 837 497 730
Provisions include the following: Litigations Site Contracts Employee Other Total restoration obligation benefits provisions provisions Balance 1 January 2016 262 398 68 227 - 73 652 9 101 413 378
Additional provisions recognised 26 633 11 830 2 590 13 347 7 390 61 790
Additions business combinations - - 254 321 - - 254 321
Used during the year (129 316) (1 828) - (5 770) (8 021) (144 935)
Foreign currency exchange differences 12 016 (792) - (4 774) (501) 5 949
Balance 31 December 2016 171 731 77 437 256 911 76 455 7 969 590 503
Hereof classified as provisions and other non-current liabilities 97 225 59 385 202 754 68 931 1 118 429 413
Hereof classified as provisions and other current liabilities 74 506 18 052 54 157 7 524 6 851 161 090
171 731 77 437 256 911 76 455 7 969 590 503
31.12.17 31.12.16 Total provisions 347 461 429 413
Deferred Income 42 398 33 915
Other non-current liabilities - 232
Total provisions and other non-current liabilities 389 859 463 560
24 | Provisions and other non-current liabilities Elkem AS group has worldwide operations representing potential exposure towards environmental consequences. Elkem AS group has established clear procedures to minimise environmental emissions, well within public emission limits. Total provision of NOK 58,323 thousand (NOK 50,507 thousand) relates to estimated clean-up costs related to a closed production site and landfills.
Contracts obligation The provisions regarding contracts obligation mainly relates to the purchase of Fesil Rana. The provision is calculated based on differences between contract price and market price at date of purchase, 1 December 2016 and subsequently measured at cost. The contracts lasts until 31 December 2020.
Employee benefits Employee benefits consist of provisions related to jubilee and long-service benefits and post-employment benefits mainly in the silicones division. Estimated duration of the obligation is approximately 9 years.
Contingent liabilities Elkem AS group has a potential future obligation for remediation work of the fjord nearby the Carbon plant in Kristiansand in Norway. A decision from Miljødirektoratet was received in 2017 requiring Elkem to submit a clean-up plan for specific pollution in the Kristiansandfjord within April 2018. No legal proceedings are running. The assessment of the potential future obligation is uncertain and no provision has been made at the end of reporting period.
31.12.17 31.12.16 Employee withholding taxes, social security, vacation pay, etc. 635 115 548 290
VAT payable 142 136 53 678
Deferred income 52 242 26 693
Provisions, short term part 1) 150 269 161 090
Liabilities to other related parties within China National Bluestar group 1 204 1 077
Accrued expenses 143 409 117 229
Other current liabilities 7 087 14 078
Provisions and other current liabilities 1 131 462 922 135
25 | Provisions and other current liabilities
1) See note 24 Provisions and other non-current liabilities.
26 | Financial instruments
Financial assets and liabilities by category 31 December 2017
Note Assets at Derivatives Financial Loans and Non- Total fair value used for assets receivables financial through hedging available assets profit or loss for sale
Interest in associated and other companies 14 - - 51 323 - 60 644 111 967
Derivatives, non-current 126 249 25 325 - - - 151 574
Other non-current assets 16 - - - 269 803 54 812 324 615
Accounts receivable 18 - - - 2 264 479 - 2 264 479
Derivatives, current 625 32 733 - - - 33 357
Other current assets 19 - - - 92 763 512 832 605 595
Cash and cash equivalents 22 - - - 1 493 279 - 1 493 279
Total 126 874 58 058 51 323 4 120 324 628 288

76 ELKEM ANNUAL REPORT 2017 | FINANCIAL STATEMENT ELKEM AS GROUP ELKEM ANNUAL REPORT 2017 | FINANCIAL STATEMENT ELKEM AS GROUP 77
1) In addition to the hedging instruments specified below, currency effect of EUR loan is designated as a hedging instrument in a cash flow hedge of highly probable future sales. See note 22 Interest-bearing assets and liabilities.
2) The group applies hedge accounting for certain contracts and certain parts of power contracts. The negative value reported as ‘Liabilities at fair value through profit and loss’ is representing the value of parts of power contracts where hedge accounting is not applied.
Note Liabilities at fair value Derivatives Financial Non- Total through profit or loss used for liabilities at financial hedging amortised liabilities cost
Interest-bearing liabilities, non-current 1) 22 - 21 908 2 660 067 - 2 681 975
Derivatives, non-current 17 968 360 988 - - 378 955
Provisions and other non-current liabilities 24 - - - 389 859 389 859
Accounts payable - - 1 836 888 - 1 836 888
Interest-bearing liabilities, current 1) 22 - 4 382 656 807 - 661 189
Derivatives, current 2) (18 072) 264 755 - - 246 683
Provisions and other current liabilities 25 - - - 1 131 462 1 131 462
Total (104) 652 032 5 153 762 1 521 321
Note Liabilities at fair value Derivatives Financial Non- Total through profit or loss used for liabilities at financial hedging amortised liabilities cost
Interest-bearing liabilities, non-current 1) 22 - 1 953 2 832 906 - 2 834 859
Derivatives, non-current (7 998) 569 129 - - 561 131
Provisions and other non-current liabilities 24 - - - 463 560 463 560
Accounts payable - - 1 527 587 - 1 527 587
Interest-bearing liabilities, current 1) 22 - 318 277 652 - 277 970
Derivatives, current 2) (21 152) 149 153 - - 128 001
Other current liabilities 25 - - - 922 135 922 135
Total (29 150) 720 553 4 638 145 1 385 695
Note Assets at Derivatives Financial Loans and Non- Total fair value used for assets receivables financial through hedging available assets profit or loss for sale
Interest in associated and other companies 14 - - 45 973 - 54 543 100 516
Derivatives, non-current 83 113 36 048 - - - 119 161
Other non-current assets 16 - - - 315 998 54 699 370 697
Accounts receivable 18 - - - 1 870 770 - 1 870 770
Derivatives, current 2 607 53 782 - - - 56 388
Other current assets 19 - - - 188 227 416 429 604 656
Cash and cash equivalents 22 - - - 1 230 668 - 1 230 668
Total 85 720 89 829 45 973 3 605 662 525 671
Financial assets and liabilities by category 31 December 2016
Fair value measurementFinancial instruments at fair value through profit or loss and financial assets available for sale are measured using different levels of input. There are no material differences between fair value and amortised cost for financial liabilities and financial assets at amortised cost.
Level 1 inputs are quoted prices (unadjusted) in active markets for identical assets or liabilities that the entity can access at the measurement date. Level 2 inputs are inputs, other than quoted prices, included within Level 1 that are observable for the asset or liability, either directly or indirectly. Level 3 inputs are unobservable inputs for the asset or liability.
LEVEL 1:Financial assets measured at level 1 apply to external noted shares. The noted shares are measured based on the listed price. Dividends from the external shares are classified as other gains and losses.
LEVEL 2:Financial assets and liabilities measured at level 2 applies to forward foreign exchange contracts, commodity contracts and embedded foreign currency derivatives. The contracts are measured at fair value by estimating the future cash flows.
LEVEL 3:The financial assets and liabilities at fair value through profit or loss measured at level 3 consist of power contracts with Statkraft (one contract bought from Norske Skog in 2010 and swap contracts) and a contract called “30-øringen” based on how the power price in the contract is determined. The usage of power from the contract bought from Norske Skog is restricted to industrial purposes, and the power from the 30-øring contract are restricted to be used at Elkem AS plants. The contracts are assessed to be settled net in cash and are therefore within the scope of IAS 39 and recognised as financial instruments.
When valuing these contracts observable data is used, such as power price, currency rates, CPI and CfD, when available. The power prices for long-term electricity contracts in Norway are not directly observable in the market for the whole contract length. Power prices are observable until 2026, CfD to 2021 and the currency rates are observable until 2022. Valuation of the contracts for the remaining periods are based on the latest observable data adjusted for CPI, if relevant.
See note 27 Financial risk and capital management for sensitivity analysis.
Elkem AS group’s assets and liabilities measured at fair value as at 31 December 2017 Level 1 Level 2 Level 3 Total Financial assets at fair value through profit or loss - 625 126 249 126 874
Derivatives designated in a hedging relationship - 58 058 - 58 058
Financial assets available for sale 11 166 40 157 51 323
Total assets 11 166 58 682 166 406 236 254
Financial liabilities at fair value through profit or loss - 88 520 (88 624) (104)
Derivatives designated in a hedging relationship 26 290 208 421 417 322 652 032
Total liabilities 26 290 296 940 328 698 651 928
Elkem AS group’s assets and liabilities measured at fair value as at 31 December 2016 Level 1 Level 2 Level 3 Total Financial assets at fair value through profit or loss - 2 607 83 113 85 720
Derivatives designated in a hedging relationship - 89 829 - 89 829
Financial assets available for sale 9 262 - 36 711 45 973
Total assets 9 262 92 436 119 824 221 522
Financial liabilities at fair value through profit or loss - 91 650 (120 800) (29 150)
Derivatives designated in a hedging relationship 2 271 49 514 668 769 720 553
Total liabilities 2 271 141 164 547 968 691 403

78 ELKEM ANNUAL REPORT 2017 | FINANCIAL STATEMENT ELKEM AS GROUP ELKEM ANNUAL REPORT 2017 | FINANCIAL STATEMENT ELKEM AS GROUP 79
Assessment of fair value of contracts with StatkraftThe Elkem AS group pays fixed power prices to Statkraft, specified for each contract / year in the contracts.
Assumptions for valuation of the contracts• Discount rate: 1.68% (1.68%) p.a. based on the estimated risk of the contract, including credit risk.• Power prices: Market prices at 31 December for the duration of the contract.• CfD’s: Four year average historic CfD prices based on Nord Pool Spot prices.• Currency rate EUR: Market prices tradable for the group as of 31 December for the duration
of the contract.
As of 1 January 2013, the Statkraft contract bought from Norske Skog has been designated as a hedging instrument in a cash flow hedge of highly probable future purchases. Changes in fair value for the power contract are therefore from the same date booked against OCI. Realised effects from the fair value as at 31 December 2012 are booked through profit or loss. Swap contracts with Statkraft and embedded derivatives EUR are booked according to hedge accounting principles from 1 January 2016.
Assessment of fair value of 30-øring contractThe 30-øre power contracts last until 31 December 2030. For the years 2018 - 2020 the price under the contract is fixed except if the spot price at the relevant grid points exceed a certain threshold, in which case the price equals the spot price. For the last 10 years of the contract the price is fixed based on the average spot price the preceding four years, adjusted for inflation. The fixed price and the threshold price are based on a start date and adjusted with inflation annually thereafter.
Assumptions for valuation of the contract• Discount rate: 3.6% (3.6%) p.a. based on the estimated risk of the contract including credit risk.• Inflation: 2.0% p.a., (2,0% p.a.)• Power prices: Market prices per 31 December 2017 until 2027, thereafter prices are based on 2027,
adjusted with inflation rate.• CfD’s: Four year average historic CfD prices based on Nord Pool Spot prices.• Currency rate EUR: Market prices tradable for the group as of 31 December 2017 until 2022,
thereafter prices equal to 2022 rates.
Changes in fair value for the “30-øringen” contract are presented as a part of other gains and losses.
In addition, level 3 includes shares in unlisted external companies. These shares are booked at cost and written down if the value of the company is assessed to be lower than cost.
Specification of movements in measurement on level 3 2017 2016 Opening balance 01.01 (428 144) (813 530)
Transfer to / from other levels - (4 829)
Change in fair value recognised in OCI, cash flow hedges 136 421 236 481
Settlement 56 310 99 652
Disposal (141) (261)
Acquisition 29 75
Other changes in fair value through profit or loss 70 320 56 060
Translation effects 2 913 (1 793)
Closing balance 31.12 (162 292) (428 144)
Purchase Purchase Sale Sale Type of Currency Due Fair value Notional currency ccy 1000 currency ccy 1000 instrument deal rate NOK thousand amount 1)
NOK thousand
USD 1 269 JPY 142 510 Fwd 0,0089 2018 32 10 388
NOK 9 355 AUD 1 500 Fwd 6,2366 2018 (257) 9 618
CAD 28 035 EUR 18 800 Fwd 1,4912 2018 (3 341) 185 082
NOK 2 504 556 EUR 261 875 Fwd 9,5639 2018 (87 625) 2 578 107
CAD 1 869 NOK 12 075 Fwd 0,1548 2018 44 12 230
NOK 90 837 GBP 8 500 Fwd 10,6867 2018 (3 511) 94 294
NOK 115 004 JPY 1 406 000 Fwd 0,0818 2018 12 063 102 491
NOK 741 675 USD 91 200 Fwd 8,1324 2018 (2 181) 748 205
NOK 110 393 JPY 1 316 000 Fwd 0,0839 2019 12 603 95 930
NOK 107 766 JPY 1 268 000 Fwd 0,0850 2020 11 969 92 431
NOK 4 059 624 EUR 396 375 Embedded 2) 10,2419 2018-2034 (183 669) 3 902 236
Total fair value currency exchange contracts 3) (243 875)
Purchase Purchase Sale Sale Type of Currency Due Fair value Notional currency ccy 1000 currency ccy 1000 instrument deal rate NOK thousand amount 1)
NOK thousand
CAD 7 517 EUR 5 200 Fwd 1,4455 2017 449 47 244
NOK 1 227 584 EUR 132 050 Fwd 9,2964 2017 17 788 1 199 713
CAD 1 499 GBP 800 Fwd 1,8743 2017 1 092 8 499
NOK 46 356 GBP 4 200 Fwd 11,0372 2017 1 592 44 618
NOK 146 124 JPY 1 980 000 Fwd 0,0738 2017 (740) 145 810
NOK 536 836 USD 65 800 Fwd 8,1586 2017 (29 286) 567 104
CAD 3 951 USD 3 000 Fwd 1,3171 2017 (463) 25 856
NOK 524 796 EUR 58 000 Fwd 9,0482 2018 (12 850) 526 947
NOK 88 663 JPY 1 036 000 Fwd 0,0856 2018 10 352 76 292
NOK 101 569 USD 13 000 Fwd 7,8130 2018 (9 884) 112 042
NOK 89 917 JPY 1 036 000 Fwd 0,0868 2019 10 128 76 292
NOK 87 003 JPY 988 000 Fwd 0,0881 2020 9 351 72 758
NOK 1 889 767 EUR 199 408 Embedded 2) 9,4769 2017-2027 (62 384) 1 811 685
Total fair value currency exchange contracts 3) (64 855)
Details of financial instruments Details of foreign exchange contracts as at 31 December 2017
Details of foreign exchange contracts as at 31 December 2016
1) Notional value of the contracts, based on currency rates 31.12.
2) Embedded derivatives EUR in commodity contracts.
3) The spot element of currency forward contracts with duration more than 3 months are designated as hedging instruments is a cash flow hedge of highly probable future sales, hence this part is classified as ‘Derivatives used for hedging’ in the table ‘Financial assets and liabilities classified by category’. The interest element of these contracts and contracts of duration < 3 months are classified as ‘Assets/liabilities at fair value through profit and loss’.

80 ELKEM ANNUAL REPORT 2017 | FINANCIAL STATEMENT ELKEM AS GROUP ELKEM ANNUAL REPORT 2017 | FINANCIAL STATEMENT ELKEM AS GROUP 81
Details of power contracts and other commodity contracts within the scope of IAS 39 as at 31 December 2017
Details of power contracts and other commodity contracts within the scope of IAS 39 as at 31 December 2016
1) Notional value of underlying asset at the end of reporting period, calculated as volume * price * currency rate at 31.12 (if other currencies than NOK).
2) Certain power contracts and part of power contract Statkraft are designated as hedging instruments, the remaining contracts/parts of contracts are classified as ‘Assets/liabilities at fair value through profit and loss’.
Volume Due Fair value Notional GWh / Oz amount 1)
Forward contracts financial institutions 299 2018 5 678 74 263
Commodity contract “30-øringen” 501 2018 (20 146) 146 653
Commodity contract “30-øringen” 6 016 2019-2030 126 249 1 692 993
Commodity contracts Statkraft 1 498 2018 (78 671) 446 722
Commodity contracts Statkraft 3 000 2019-2020 (170 177) 925 792
Commodity contract Statkraft, swap 201 2018 (15 521) 65 218
Commodity contract Statkraft, swap 605 2019-2034 (44 183) 195 834
Commodity contracts Platinum 900 2018 11 4 085
Commodity contracts Platinum 980 2019 (73) 7 752
Fair value contracts within scope of IAS 39 2) (196 832)
Volume Due Fair value Notional GWh / Oz amount 1)
Forward contracts financial institutions 307 2017 16 161 71 858
Forward contracts financial institutions 140 2018 6 216 26 113
Forward contracts other (26) 2017 (1 165) (5 611)
Commodity contract “30-øringen” 501 2017 (10 713) 141 589
Commodity contract “30-øringen” 6 517 2018 - 2030 83 113 1 688 680
Commodity contracts Statkraft 1 498 2017 (47 231) 436 685
Commodity contracts Statkraft 4 498 2018-2020 (415 054) 1 372 513
Commodity contract Statkraft, swap 201 2017 (8 250) 60 187
Commodity contract Statkraft, swap 806 2018-2027 (66 721) 240 913
Commodity contracts Platinum 4 560 2017 (5 085) 38 514
Fair value contracts within scope of IAS 39 2) (448 728)
Hedge Accounting Elkem group is applying hedge accounting for parts of the foreign exchange forward contracts, for embedded EUR derivatives in power contracts and for certain power contracts. The currency exchange contracts are designated in a cash flow hedge to hedge currency fluctuations in highly probable future sales, mainly in USD and EUR. Realised effects from these contracts, a loss of NOK 41,393 thousand (loss NOK 175,569 thousand), is therefore booked as an adjustment of the sales revenue. Also embedded EUR derivatives in power contracts are designed as hedging instruments to hedge currency fluctuations in highly probable future sales. Realised effects from these contracts are a loss of NOK 1,215 thousand (no realisation in 2016). Effects from other currency forward contracts, both unrealised and realised, are booked directly to other gains and losses. Certain commodity contracts power are designated as hedging instruments in a cash flow hedge of price fluctuations for highly probable future purchases. Hence, the effective part of change in fair value is booked against OCI, and booked as an adjustment of the power cost (part of COGS) when realised. The realised effect for these contracts was in 2017 a loss of NOK 60,003 thousand (loss of NOK 157,371 thousand). An ineffectiveness gain of NOK 43,023 thousand (loss of NOK 4,6 thousand) is booked as other gains / losses.
The table below shows fair value for the derivative financial instruments, classified by type of hedging
Derivative financial instruments 2017 2017 2016 2016 Assets Liabilities Assets Liabilities fair value fair value fair value fair value Forward foreign exchange contracts – cash flow hedges 52 380 126 300 68 617 94 030
Forward power contract Statkraft – cash flow hedges - 435 530 - 692 336
Forward power contract Statkraft swap – cash flow hedges - (18 208) - (23 567)
Forward power contracts embedded derivatives – cash flow hedges - 82 120 - (44 517)
Forward power contracts financial institutions – cash flow hedges 5 678 - 21 212 -
Currency effect loan EUR – cash flow hedge 1) - 26 290 - 2 271
Total derivative instruments 58 058 652 032 89 829 720 553
Less non-current portion:
Forward foreign exchange contracts – cash flow hedges 25 325 - 29 832 22 734
Forward power contract Statkraft – cash flow hedges - 300 773 - 596 837
Forward power contract Statkraft swap – cash flow hedges - (12 195) - (9 932)
Forward power contracts embedded derivatives – cash flow hedges - 72 409 - (40 510)
Forward power contracts financial institutions – cash flow hedges - - 6 216 -
Currency effect loan EUR – cash flow hedge 1) - 21 908 - 1 953
Current portion of derivative instruments 32 733 269 136 53 781 149 471
1) See note 22 Net interest-bearing assets / liabilities.

82 ELKEM ANNUAL REPORT 2017 | FINANCIAL STATEMENT ELKEM AS GROUP ELKEM ANNUAL REPORT 2017 | FINANCIAL STATEMENT ELKEM AS GROUP 83
The table below shows the movements in OCI related to hedging instruments
The table below shows the movements in OCI related to hedging instruments
Accumulated gains / losses from cash flow hedges recognised in OCI are expected to be recycled to profit or loss in the period of 2018–2034, see further details in the tables above specifying financial instruments by duration.
Derivative financial instruments recognised against OCI Opening Net change Reclassified Closing balance 2017 in fair value to P&L balance 2017 Change in fair value from derivatives designated as a hedge of future sales (25 413) (89 900) 41 393 (73 920)
Change in fair value from derivatives designated as a hedge of future need for power (Financial institutions) 1) 21 213 (3 170) (12 365) 5 678
Change in fair value from derivatives designated as a hedging of future need for power (Statkraft) 2) (643 424) 133 137 80 946 (429 342)
Change in fair value from derivatives designated as a hedging of future need for power (Statkraft swap) 3) 23 567 3 284 (8 643) 18 208
Change in fair value from embedded derivatives designated as a hedge of future sales 4) 44 517 (127 852) 1 215 (82 120)
Change in fair value from derivatives designated as a hedge of future sales 5) (2 271) (26 161) 2 143 (26 290)
Total gains / losses (before tax) in OCI 31.12. (581 812) (110 663) 104 689 (587 785)
Derivative financial instruments recognised against OCI Opening Net change Reclassified Closing balance 2016 in fair value to P&L balance 2016 Change in fair value from derivatives designated as a hedge of future sales (445 545) 244 562 175 569 (25 413)
Change in fair value from derivatives designated as a hedge of future need for power (Financial institutions) 1) (95 518) 72 131 44 599 21 213
Change in fair value from derivatives designated as a hedging of future need for power (Statkraft) 2) (970 899) 214 752 112 723 (643 424)
Change in fair value from derivatives designated as a hedging of future need for power (Statkraft swap) 3) - 23 567 - 23 567
Change in fair value from embedded derivatives designated as a hedge of future sales 4) - 44 517 - 44 517
Change in fair value from derivatives designated as a hedge of future sales 5) - (2 271) - (2 271)
Total gains / losses (before tax) in OCI 31.12. (1 511 961) 597 258 332 891 (581 812)
1) Contracts with other financial institutions.
2) Contract with Statkraft. As of 1 January 2013, the Statkraft contract has been designated as a hedging instrument in a cash flow hedge of highly probable future purchases. Changes in fair value for the power contract are therefore from the same date booked against OCI. Changes in fair value up to 31 December 2012 were booked in the statement of income, classified as other gains and losses. Reversal of unrealised effects from these contracts will be offset by realised effects, only the interest element will affect the statement of income.
3) Power contracts swap, with Statkraft. Hedge accounting applied from 2016.
4) Embedded derivatives EUR power contracts. Hedge accounting applied from 2016.
5) Currency effects loan EUR.
1) Contracts with Nasdaq and other financial institutions.
2) Contract with Statkraft. As of 1 January 2013, the Statkraft contract has been designated as a hedging instrument in a cash flow hedge of highly probable future purchases. Changes in fair value for the power contract are therefore from the same date booked against OCI. Changes in fair value up to 31 December 2012 were booked in the statement of income, classified as other gains and losses. Reversal of unrealised effects from these contracts will be offset by realised effects, only the interest element will affect the statement of income.
3) Power contracts swap, with Statkraft. Hedge accounting applied from 2016.
4) Embedded derivatives EUR power contracts. Hedge accounting applied from 2016.
5) Currency effects loan EUR.
Offsetting financial assets and liabilities
Financial assets subject to offsetting
The following financial assets are subject to offsetting
Financial liabilities subject to offsetting
The following financial liabilities are subject to offsetting
2017 Gross amount Gross amount Net amounts Financial Cash collateral Net amount of financial of financial of financial instruments pledged assets liabilities set assets not set off off in the recognised / in the statement of presented statement of financial financial position position Commodity contracts, embedded derivatives 2 028 (2 028) - - - -
Commodity contracts NASDAQ and other financial institutions 6 846 (1 168) 5 678 - - 5 678
Foreign exchange forward contracts 52 973 - 52 973 (26 895) - 26 078
Total 61 847 (3 196) 58 651 (26 895) - 31 756
2016 Gross amount Gross amount Net amounts Financial Cash collateral Net amount of financial of financial of financial instruments pledged assets liabilities set assets not set off off in the recognised / in the statement of presented statement of financial financial position position Commodity contracts, embedded derivatives 6 457 (6 457) - - - -
Commodity contracts NASDAQ and other financial institutions 22 804 (1 592) 21 212 - - 21 212
Foreign exchange forward contracts 70 059 - 70 059 (7 714) - 62 345
Total 99 320 (8 049) 91 271 (7 714) - 83 557
2017 Gross amount Gross amount Net amounts Financial Cash collateral Net amount of recognised of financial of financial instruments pledged financial liabilities set assets not set off liabilities off in the recognised / in the statement of presented statement of financial financial position position Commodity contracts, embedded derivatives 185 697 (2 028) 183 669 - - 183 669
Commodity contracts NASDAQ and other financial institutions 1 168 (1 168) - - - -
Foreign exchange forward contracts 113 210 - 113 210 (26 895) - 86 315
Total 300 075 (3 196) 296 879 (26 895) - 269 984
2016 Gross amount Gross amount Net amounts Financial Cash collateral Net amount of recognised of financial of financial instruments pledged financial liabilities set assets not set off liabilities off in the recognised / in the statement of presented statement of financial financial position position Commodity contracts, embedded derivatives 68 842 (6 457) 62 384 - - 62 384
Commodity contracts NASDAQ and other financial institutions 1 592 (1 592) - - - -
Foreign exchange forward contracts 72 529 - 72 529 (7 714) - 64 815
Total 142 963 (8 049) 134 914 (7 714) - 127 200

84 ELKEM ANNUAL REPORT 2017 | FINANCIAL STATEMENT ELKEM AS GROUP ELKEM ANNUAL REPORT 2017 | FINANCIAL STATEMENT ELKEM AS GROUP 85
27 | Financial risk and capital management
IntroductionElkem AS group operates in an international and cyclical industry which expose the business to a variety of financial risks such as currency risk, liquidity risk, interest rate risk, credit risk and risks relating to prices of finished goods and raw materials. The financial risks affect the group’s income and/or the value of financial instruments held. Financial risks related to its operations are monitored and handled centrally at Elkem AS group level. Elkem AS group has financial risk policies in place, approved by its board of directors.
FINANCIAL RISK FACTORS
(a) Market risk
(i) Currency risk
Transaction risk – cash flow hedge Elkem AS group has sales revenue and operating costs in various currencies. The prices of finished goods are to a large extent determined in international markets, primarily in US Dollar and Euro. This is partly offset by purchase of raw materials denominated in the same currencies. Elkem AS group has net positive cash flows in most currencies, mainly US dollar and Euro, but has a net cost position in certain other currencies, mainly Norwegian krone but also in Canadian dollars, Brazilian real and Icelandic krona.
Elkem AS group’s policy is to hedge foreign exchange risk against functional currency to even out fluctuations in result and cash flow. The target is to hedge net cash flow for 0–3 months on a 90% hedging ratio. Net cash flow for 4–12 months should be hedged on a rolling basis based on a 45% hedging ratio. The hedging ratio for 4–12 months may vary between 25% and 75%. Elkem AS group decided to increase the hedging ratio for EUR and USD to 75% for 2018. Elkem AS group also has a hedge in JPY until 2020 related to a long-term customer contract. Elkem AS group uses hedge accounting for all cash flow hedges over 3 months.
In 2017, Elkem AS group realised a loss of NOK 41 million from this hedging program (loss of NOK 175 million).
Foreign exchange – sensitivity analysis on financial instruments Elkem AS group is presenting its accounts in Norwegian krone, but it has underlying assets and liabilities in various currencies. These effects are monitored and managed centrally.
The table bellow shows currency effect by lines in the financial statement:
Sensitivity on profit and loss from financial instruments: The sensitivity related to financial instruments on Elkem AS group’s profit or loss, is based on a strengthening / weakening of all currencies by 10% against the Norwegian krone, which is the presentation currency for Elkem AS group. If the Norwegian krone is strengthened by 10% against all other currencies, the isolated effect on financial instruments would have been a reduced profit before tax of approximately NOK 205 million (NOK 273 million).
Sensitivity on statement of financial position from financial instruments: The sensitivity related to financial instruments on Elkem AS group’s statement of financial position, is based on a weakening / strengthening of all currencies by 10% against the Norwegian krone, which is the presentation currency for Elkem AS group. If the Norwegian krone is strengthened by 10% against all other currencies, the isolated effect on financial instruments would have given an reduced equity of NOK 49 million (NOK 92 million). This effect does not include the effects from the sensitivity on profit or loss as calculated above.
Currency effect included in financial statement 2017 2016 Net foreign exchange gains / losses – foreign exchange forward contracts – included in other gains and losses (3 180) 26 595
Operating foreign exchange gains / losses - included in Other gains and losses (5 108) (19 936)
Net foreign currency exchange gain/loss on financing activities (7 701) 49 661
Currency translation differences - included in comprehensive income 225 938 (64 508)
(ii) Price risk
Elkem AS group is exposed to fluctuations in market prices both in the investment portfolio and in the operating business related to individual contracts. The main part of short-term price risk is hedged.
The investment portfolio is limited, see note 14 Interest in other companies.
Commodity pricesThe business is exposed to changes in market prices for raw materials and finished goods. The group seeks to minimise the exposure by entering into sales and purchase contracts with similar duration and volume.
Elkem AS group’s main production capacity is focused towards specialised products. These products require special types of raw materials that have fixed customer specifications. Elkem AS group has acquired several raw material sources and / or enters into medium to long-term contracts with raw material suppliers.
Power Elkem AS group purchases power contracts to minimise the future exposure to changes in power prices. These contracts are either financial instruments, physical commodity contracts that both meet and do not meet the criteria for own use according to IFRS.
Changes in fair value of commodity contracts, defined as financial instruments, reflect unrealised gains or losses and are calculated as the difference between market price and contract price, discounted to present value. Valuation techniques are used for available market information as much as possible.Techniques that reflect how the market could be expected to price instruments, are used in non-observable markets.
Elkem AS group’s portfolio of commodity contracts consists mostly of physical energy contracts. Electric power is a key input factor for Elkem AS group. Elkem AS group’s estimated future power exposure is partly hedged by long-term power contracts in addition to several contracts in the medium- term. Optimisation of 24-hour-, seasonal- and capacity utilisation variations are solved through utilising financial and physical contracts that are traded bilaterally, or at Nasdaq OMX. The purpose of the hedging activities is to reduce volatility in the power cost and increase the predictability of the cost base. Fair value of commodity contracts is especially sensitive for future changes in energy prices.
Valuation of the power contractsThe valuation technique used for valuing the power contracts is described in note 26 Financial instruments.
Sensitivity analysis - power contractsSensitivity on the Statkraft and the “30-øringen” contracts is as follows (figures in NOK million):
“30-øringen” contract Fair value Adjusted NPV 31.12.2017 Discount rate (used 3.6%) change to 0% 106,1 158,3
Discount rate (used 3.6%) change to 5% 106,1 90,5
CPI (used 2%) change to 1% 106,1 158,5
CPI (used 2%) change to 3% 106,1 49,6
Power price decrease -10% 106,1 18,3
Power price increase + 10% 106,1 187,7
Statkraft contract (NSG) Fair value Adjusted NPV 31.12.2017 Power price decrease -10% (248,80) (357,60)
Power price increase + 10% (248,80) (140,00)
Discount rate (used 1.68%) change to 0% (248,80) (255,20)
Discount rate (used 1.68%) change to 5% (248,80) (237,00)

86 ELKEM ANNUAL REPORT 2017 | FINANCIAL STATEMENT ELKEM AS GROUP ELKEM ANNUAL REPORT 2017 | FINANCIAL STATEMENT ELKEM AS GROUP 87
(iii) Interest rate risks
Elkem AS group’s interest rate risk arises from interest-bearing liabilities from external financial institutions. Elkem AS group’s liabilities are mainly drawn in EUR.
Elkem AS group has a floating interest rate policy and is hence exposed to fluctuating interest rates. Industry conditions are cyclical and prices and sales volumes for Elkem AS group’s products tend to correlate with general economic conditions. During an economic downturn sales prices and volumes are expected to go down, while prices and volumes tend to go up during an economic upturn. A floating interest rate policy is seen as appropriate from a financial risk perspective. Interest-rates have stayed low for a number of years due to a low-rate economic environment. However, many central banks have inflation targets and intend to adjust interest rates to control the general rise in the price level. With floating interest rates the group will normally be in a position to benefit from lower interest rates in an economic downturn, but a floating rate policy will also leave the group exposed to increased future interest rates.
As at 31 December 2017 Elkem AS group has the following interest-bearing assets and liabilities
SensitivityThe interest rate sensitivity is based on a parallel shift in the interest rates that Elkem AS group is exposed to. If interest rates had been 50 basis points higher for a full year, based on net debt as at 31 December 2017, with all other variables held constant, the profit after tax would have been NOK 6.3 million lower (NOK 6.3 million). An overview of Elkem’s debt portfolio is presented in note 22 Interest-bearing assets / liabilities.
(b) Counterparty credit risk
Credit risk is the risk of financial losses to the group if a customer or counterparty fails to meet contractual obligations. For Elkem AS group this arises mainly to accounts receivable and financial trading counterparties.
Accounts receivable are generally secured by credit insurance from a reputable credit insurance company. Credit limits for each customer and overdue receivables are monitored at Elkem AS group level. For customers where credit insurance cannot be obtained, other methods are generally used to secure the sales proceeds, such as prepayment, letter of credit, documentary credit or guarantees. In particular, when sales are made in countries with a high political risk, or to remote customers, trade finance products are used to reduce the credit risk. Approximately 85 - 90% of Elkem AS group’s revenue is covered by credit insurance, trade finance or prepayments. Elkem AS group realised credit losses of NOK 4.9 million in 2017 (NOK 7.3 million). The maximum exposure to credit risk for the group is NOK 2,273 million per 31 December 2017 (NOK 1,937 million). Please also refer to note 18 accounts receivable.
Evaluation of financial counterparties is based on external credit ratings from Moody’s and / or Standard and Poor’s. The general policy is that financial counterparties should have a rating equal to, or higher than, A- (or the equivalent) from the rating agencies, but exceptions may be made on a case-by-case basis, mainly for local banks in emerging markets.
Elkem AS group has not had any losses in 2017 or 2016 related to financial counterparties.
(c) Liquidity risk
Liquidity risk is the risk that the group will encounter difficulty in meeting the obligations associated with its financial liabilities. Elkem AS group is exposed to liquidity risk related to its operations and financing.
Elkem AS group’s cash flow will fluctuate due to economic conditions and financial performance. In order to assess its future operational liquidity risk, short-term and long-term cash flow forecasts are provided. The short-term forecast is updated each week, and the long-term cash flow projection is updated each quarter. In order to mitigate the operational liquidity risk, Elkem AS group has cash and revolving credit facilities
Floating Fixed Total Interest-bearing liabilities 3 343 164 - 3 343 164
Interest-bearing assets 1 601 098 - 1 601 098
Net exposure 1 742 066 - 1 742 066
with banks. As at 31 December 2017 Elkem AS group has unrestricted cash of NOK 1,493 million (NOK 1,231 million). In addition, revolving credit facilities amount to NOK 2,330 million (NOK 2,105 million), of which NOK 2,330 million is undrawn (NOK 2,105 million).
The external loan agreements contains two financial covenants. The ratio of gross operating profit (loss) to consolidated net Interest payable, as defined herein, for each measurement period, where the period is calculated as the 12 months ending on the last day of a financial quarter, must exceed 4. Additionally, the ratio of total equity to total assets must be more than 30% at all times. Elkem comply with these covenants as of 31 December 2017 and complied with the covenants as of 31 December 2016.
The policy is to have cash and available credit facilities to cover known capital needs and generally not less than 10% of annual revenue. In addition, the policy is to ensure that the main credit facilities have a remaining maturity of at least 12 months. The maturity profile of the credit facilities per 31 December 2017 for Elkem AS group is shown in the table below.
The table below analyses the group’s non-derivative financial liabilities and net-settled derivative financial liabilities into relevant maturity groupings based on the remaining period at the end of reporting period to the contractual maturity date. Derivative financial liabilities are included in the analysis if their contractual maturities are essential for an understanding of the timing of the cash flows. The amounts disclosed in the table are the contractual undiscounted cash flows, and the amounts are without interest payments.
A total overview of Elkem AS group’s debt portfolio and instalment profile is presented in note 22 Interest-bearing assets / liabilities.
CAPITAL MANAGEMENTAs of 31 December 2017, Elkem AS group’s equity was NOK 8,332 million, including minority interests of NOK 102 million. The equity ratio was 51%.
Generally, the Elkem AS group aims to have a leverage ratio in the level of 1.5 - 2.0x. Leverage ration is defined as Net interest bearing debt as defined in note 22 Interest-bearing liabilities and assets divided by gross operating profit.
Elkem AS group will focus on having an effective capital allocation and intends to pay dividends reflecting the underlying earnings and cash flow. When deciding the dividend level, Elkem will take into consideration capital expenditure plans, financing requirement and maintaining the appropriate strategic flexibility. Elkem AS group is managing its financing and liquidity position to reduce liquidity risk and to ensure that the company can meet its financial obligations at all times. See note 33 Events after the reporting period for information about new loan agreements.
Year / maturity 2018 2020 Total Total amount of credit facilities 361 1 969 2 330
At 31 December 2017 Less than 6 months Between Between Over 6 months and 1 year 1 and 2 years 2 and 5 years 5 years Interest-bearing liabilities 331 919 328 091 616 299 1 958 167 115 529
Financial lease 589 589 401 - -
Accounts payable 1 836 888 - - - -
At 31 December 2016 Less than 6 months Between Between Over 6 months and 1 year 1 and 2 years 2 and 5 years 5 years Interest-bearing liabilities 138 571 135 067 556 820 2 192 589 97 065
Financial lease 2 167 2 167 1 452 45 -
Accounts payable 1 527 587 - - - -

88 ELKEM ANNUAL REPORT 2017 | FINANCIAL STATEMENT ELKEM AS GROUP ELKEM ANNUAL REPORT 2017 | FINANCIAL STATEMENT ELKEM AS GROUP 89
100% of the shares in Elkem AS group are held by Bluestar Elkem International Co. Ltd S.A., see note 20 Shareholder information. Balances and transactions between Elkem AS and subsidiaries have been eliminated in the consolidated financial statements and are not disclosed in this note. Details of trans-actions between the group and other related parties are disclosed below.
Information about transactions between related parties outside Elkem AS group
The main transactions between Elkem AS group and parties outside Elkem AS group are:• Sale of management and technology services to Elkem Solar AS• Power supply and sale of raw materials to Elkem Solar AS• Purchase of short and deep sea transport from North Sea Containerline AS and Elkem Chartering AS• Purchase of warehousing from Combined Cargo Warehousing BV• Sale of silicone to companies within China National Bluestar group• Purchase of raw materials from companies within China National Bluestar group, mainly from
Jiangxi Bluestar Xinghuo Silicones Co Ltd
Elkem AS group also has loans from other related parties within China National Bluestar group. The main loans are given from:• Bluestar Silicones Investment Co. Ltd
The sale and purchase from related parties outside Elkem AS group are made on terms equivalent to those that prevail in arm’s length transactions. Prices are set upon negotiations between the parties.
Outstanding balances at year-end are unsecured, and the short-term receivables and payables are interest free, with an exception of the short-term loans. The long-term loans are interest-bearing, and the interest is calculated based on interbank rates (for example LIBOR and EURIBOR) plus a margin.
2017 Trade sales Trade Sale of Purchase of Interest Interest purchases services services income expenses Bluestar Elkem International Co. Ltd S.A. - - 11 547 - 305 -
Joint arrangements and associates - - 59 426 (144 146) 2 384 -
Other related parties within China National Bluestar group 166 456 (343 454) 85 374 (1 839) - -
Total 166 456 (343 454) 156 347 (145 985) 2 689 -
2016 Trade sales Trade Sale of Purchase of Interest Interest purchases services services income expenses Bluestar Elkem International Co. Ltd S.A. - - 324 - - -
Joint arrangements and associates 121 245 (41 917) 103 160 (177 850) 2 556 -
Other related parties within China National Bluestar group 32 875 (295 574) 21 980 (1 035) - -
Total 154 120 (337 491) 125 464 (178 885) 2 556 -
28 | Related party transactions
Loans from / to related parties 31.12.17 31.12.16 Loans to joint arrangements 8 920 52 682
Receivables to joint arrangements - 14 269
Loans from other related parties within China National Bluestar group (6 873) (7 416)
Accrued interest on loans from other related parties within China National Bluestar group - -
Receivables from Bluestar Elkem International Co. Ltd S.A - 324
Payables to joint arrangements and associates (10 039) (12 656)
Receivables from joint arrangements and associates 5 387 2 227
Payables to other related parties within China National Bluestar group (79 474) (24 918)
Receivables from other related parties within China National Bluestar group 59 421 32 980
Transactions with key management personnelInformation on transactions with key management personnel is included in note 5 Employee benefit expenses.
Information about eliminated transactions between related parties within Elkem AS group Elkem AS group follows internationally accepted principles for transactions between related parties within the group. In general, Elkem AS group seeks to use transaction based methods (comparable uncontrolled price, transactional net margin method, cost plus and resale price method) in order to set the price for the transaction. Elkem AS group’s set-up for sales is based both on an agent structure and as a distribution network.
The related party transactions in Elkem AS group can be divided as follows:
1. Buy-sell of productsa. Supply of raw materials to manufacturers (sales from sourcing companies)b. Sale/supply of finished goods from one Elkem manufacturer to another Elkem manufacturer (as in-bound to further production)c. Distribution of manufactured goods (directly from the plant or indirectly for resale by distributors)d. Flow-through (products are sold to and from Elkem AS due to treatment of indirect taxes)
2. Servicesa. Sales agent/commissionaire servicesb. Order handling services performed for a large part of the companies by one service company (EDC)c. General services (cost plus)
i. Sourcing services ii. Technical support services (assistance from one company to another)iii. Management services / Divisional management services / Cash management services
d. Toll manufacturing services (milling services)3. Financial services
a. Cash poolb. Group loans
Elkem AS group has received the following government grants 2017 2016 Funding from the Norwegian government R&D 33 407 25 813
Funding from the French government R&D 44 276 40 094
Funding from other R&D 3 317 -
CO2 Compensation from the Norwegian Environment Agency 1) 76 955 86 333
Funding related to energy recovery 25 767 28 666
Other grants 25 895 23 701
Total government grants received 209 617 204 607
29 | Grants
1) The current Co2 compensation programme will end in 2020.
Elkem AS group has received the following grants from other than government 2017 2016 Norwegian NOx fund for reduced emission of NOx 1) 6 150 48 777
Norwegian emission fund for reduced emission of So2 1) 12 165 32 222
Other grants received from other than government - 250
Total other grants received 18 315 81 249
1) The industry in Norway pays a fee for their emission of NOx and So2 to two different foundations. The two foundations are self-financed by the fee and their purpose is to support projects that reduces So2 and NOx emission from the industry in Norway.

90 ELKEM ANNUAL REPORT 2017 | FINANCIAL STATEMENT ELKEM AS GROUP ELKEM ANNUAL REPORT 2017 | FINANCIAL STATEMENT ELKEM AS GROUP 91
30 | Changes in the composition of the group
Elkem AS group has in 2017 invested NOK 84,304 thousand related to increase its ownership in Iguazú Alloys S.A from 50% to 100% and purchase of convertible shareholder loans. In 2016 Elkem AS group invested NOK 471,012 thousand related to acquisition of subsidiaries and business (business combination). See note 31 Business combination for more information.
In December 2016 Elkem AS group has nvested NOK 31,224 thousand related to increase of the ownership in Nor-Kvarts from 66.7% to 100%.
Changes in ownership interests in subsidiaries are accounted for as equity transactions. The effect on the equity attributable to owners of the parent is presented in the table below.
Effect of changes in composition of the group 2016 Net consideration received (paid) (31 224)
Adjustment to non-controlling interest 27 321
Adjustment to equity attributable to owners of the parent (3 903)
Grants received is included in the financial statement as follows:
Other operating income 186 350 175 777
Deduction of carrying amount of fixed assets 41 582 110 079
Total 227 932 285 856
Receivables related to grants 240 642 320 690
Deferred income related to grants (3 007) (6 252)
31 | Business combinations
Business combinations 2017In September 2017 Elkem AS group invested NOK 84,304 thousand related to increase its ownership in Igazú Alloys S.A from 50% to 100% and purchase of convertible shareholder loans. The amount comprises of loans from former shareholder reduced by cash and cash equivalents of the acquiree. The loan will be settled by annual payments over a seven years period. Iguazù Alloys owns a ferrosilicon plant in Paraguay that are under construction. The plant is expected to open in March 2018.
This transaction is considered a business combination according to IFRS 3. Acquisition method is applied by netting the fair value of consideration given to the transferee (the “acquisition cost”), excluding cost related to the acquisition, with the fair value of the acquired assets, liabilities and contingent liabilities assumed at the acquisition date. The acquisition cost of a purchase is equal to the fair value of the assets transferred, the equity instruments issued and the liabilities incurred or assumed at the acquisition date. The fair values of assets and liabilities under contingent consideration agreements are likewise included.
Elkem AS group’s management was required to allocate values in excess/deficit of the carrying amount of equity to assets acquired and liabilities assumed.
Acquisition-related costs of NOK 2.1 million is recognised in profit or loss in the line item other gains and losses. The tables below summarises the consideration transferred and the amounts recognised for assets acquired and liabilities assumed after the business combination.
For the period from purchase to 31 December 2017 Iguazú Alloys has contributed NOK 0.0 million to oper-ating revenue and contributed negatively NOK 4.2 million to profit (loss) for the year. If the acquisition date of business combination was of 1 January 2017, the operating revenue of Elkem AS group would have increased by NOK 0.0 million and profit would have decreased by NOK 6.2 million.
The net assets recognised are based on provisional assessment of their fair value, as the business combinations were performed close to year-end and the valuation has not been completed.
Adjustments recognised related to business combinations in 2016In 2017 Elkem AS group has adjusted the initial amounts for assets and liabilities recognised related to the purchases of Fesil Rana and Minex, see more information below. The following items are affected and adjustments recognised during 2017.
Business combinations 2016Elkem AS group has in 2016 invested NOK 439,788 thousand related to acquisition of new subsidiaries and business (business combination). The amount comprises cash consideration transferred reduced by cash and cash equivalents of the acquiree.
1 December 2016 Elkem AS group acquired 100% of the shares in Fesil Rana Metall AS, a producer of standard and speciality ferrosilicon and microsilica from Fesil AS.
9 December 2016 Elkem AS group acquired, through purchase of assets, the iron foundry business of the Indian Company Minex Metallurgical Co.Ltd, a leading provider of speciality alloys.
Consideration Iguazú alloys Loans from former shareholder 84 507
Contingent consideration -
Consideration transferred 84 507
Fair value of previously held equity interest including convertible shareholder loans 1) 84 507
Total 169 014
Amounts for assets and liabilities recognised Iguazú alloys Property, plant and equipment 283 742
Other intangible assets 336
Inventories 2 141
Other current assets 11 847
Cash and cash equivalents 203
Provisions and other non-current liabilities (122 012)
Accounts payable (6 336)
Provisions and other current liabilities (907)
Total 169 014
Goodwill -
Total 169 014
1) The purchase price is equal to the book value of the equity interest at the acquisition-date, hence no gain or loss is recognised as a result of remeasuring of the previously held equity interest.
Amounts for assets and liabilities recognised Total fair value Adjustments Adjusted fair recognised in 2016 value recognised Goodwill 98 030 (19 900) 78 130
Other intangible assets 36 297 (2 038) 34 259
Other non-current assets (including deferred tax assets) 13 404 (5 709) 7 695
Inventories 223 938 25 339 249 277
Provisions and other non-current liabilities (204 041) (1 552) (205 593)
Adjustment of purchase price (cash received) (3 860)
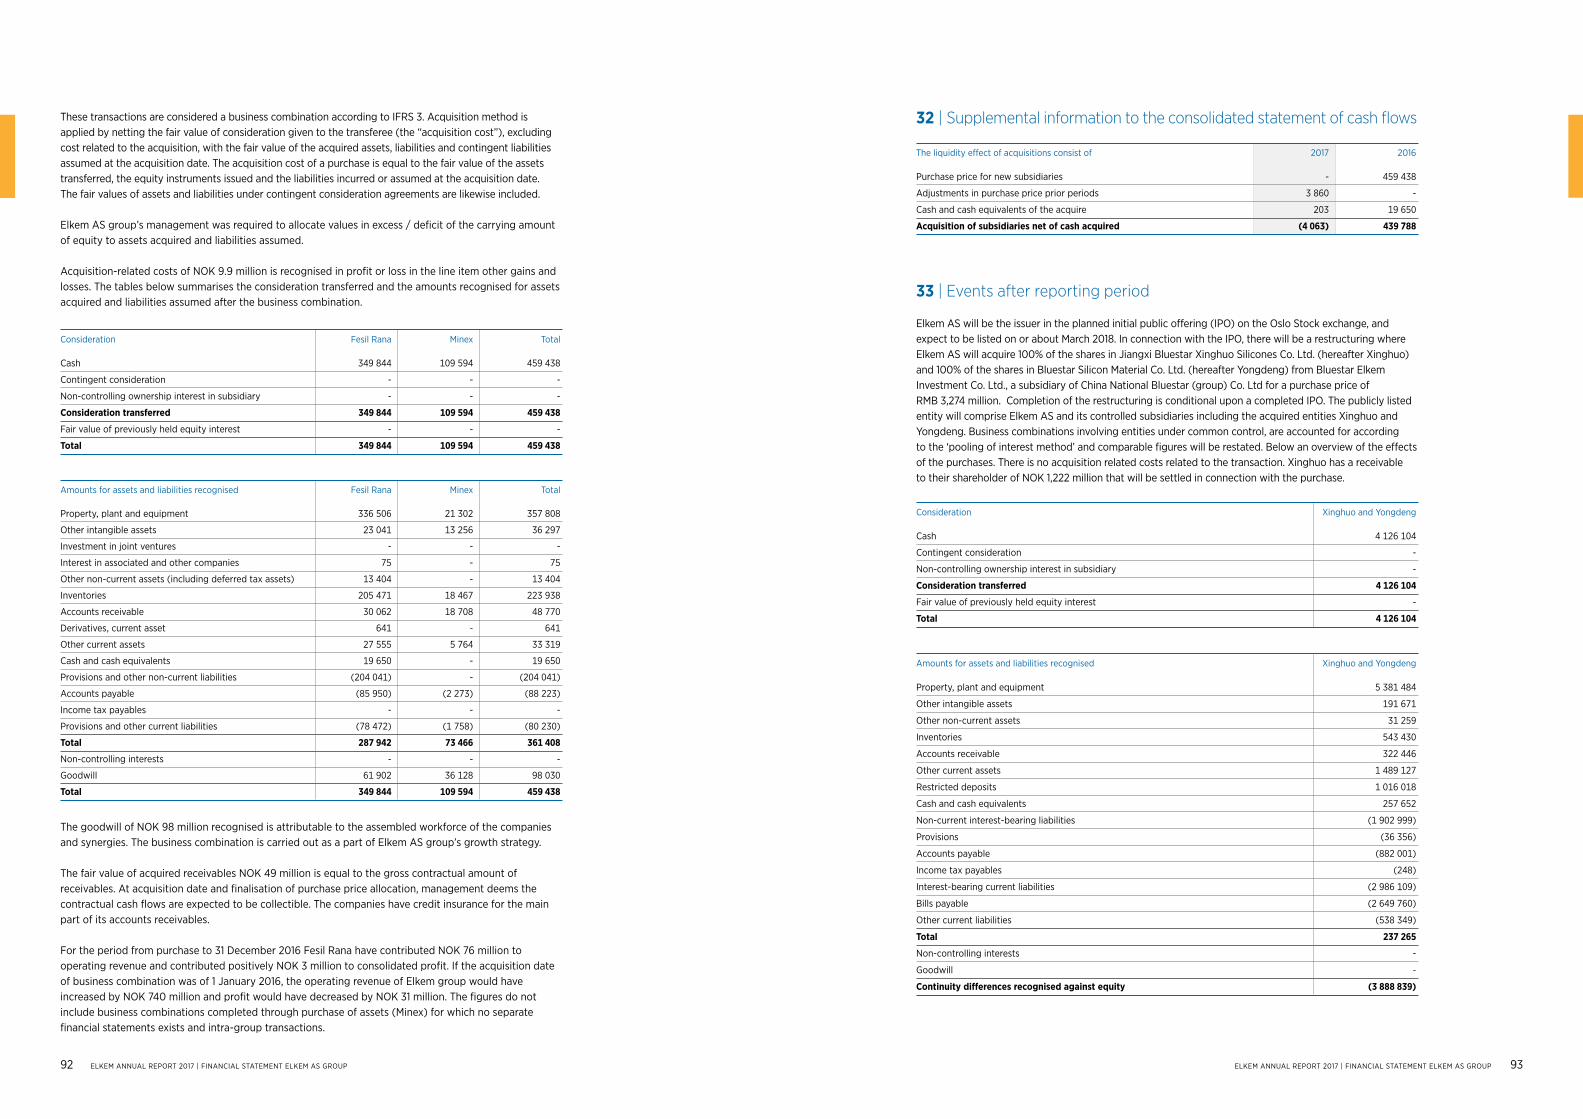
92 ELKEM ANNUAL REPORT 2017 | FINANCIAL STATEMENT ELKEM AS GROUP ELKEM ANNUAL REPORT 2017 | FINANCIAL STATEMENT ELKEM AS GROUP 93
These transactions are considered a business combination according to IFRS 3. Acquisition method is applied by netting the fair value of consideration given to the transferee (the “acquisition cost”), excluding cost related to the acquisition, with the fair value of the acquired assets, liabilities and contingent liabilities assumed at the acquisition date. The acquisition cost of a purchase is equal to the fair value of the assets transferred, the equity instruments issued and the liabilities incurred or assumed at the acquisition date. The fair values of assets and liabilities under contingent consideration agreements are likewise included.
Elkem AS group’s management was required to allocate values in excess / deficit of the carrying amount of equity to assets acquired and liabilities assumed.
Acquisition-related costs of NOK 9.9 million is recognised in profit or loss in the line item other gains and losses. The tables below summarises the consideration transferred and the amounts recognised for assets acquired and liabilities assumed after the business combination.
Consideration Fesil Rana Minex Total Cash 349 844 109 594 459 438
Contingent consideration - - -
Non-controlling ownership interest in subsidiary - - -
Consideration transferred 349 844 109 594 459 438
Fair value of previously held equity interest - - -
Total 349 844 109 594 459 438
Amounts for assets and liabilities recognised Fesil Rana Minex Total Property, plant and equipment 336 506 21 302 357 808
Other intangible assets 23 041 13 256 36 297
Investment in joint ventures - - -
Interest in associated and other companies 75 - 75
Other non-current assets (including deferred tax assets) 13 404 - 13 404
Inventories 205 471 18 467 223 938
Accounts receivable 30 062 18 708 48 770
Derivatives, current asset 641 - 641
Other current assets 27 555 5 764 33 319
Cash and cash equivalents 19 650 - 19 650
Provisions and other non-current liabilities (204 041) - (204 041)
Accounts payable (85 950) (2 273) (88 223)
Income tax payables - - -
Provisions and other current liabilities (78 472) (1 758) (80 230)
Total 287 942 73 466 361 408
Non-controlling interests - - -
Goodwill 61 902 36 128 98 030
Total 349 844 109 594 459 438
The goodwill of NOK 98 million recognised is attributable to the assembled workforce of the companies and synergies. The business combination is carried out as a part of Elkem AS group’s growth strategy.
The fair value of acquired receivables NOK 49 million is equal to the gross contractual amount of receivables. At acquisition date and finalisation of purchase price allocation, management deems the contractual cash flows are expected to be collectible. The companies have credit insurance for the main part of its accounts receivables.
For the period from purchase to 31 December 2016 Fesil Rana have contributed NOK 76 million to operating revenue and contributed positively NOK 3 million to consolidated profit. If the acquisition date of business combination was of 1 January 2016, the operating revenue of Elkem group would have increased by NOK 740 million and profit would have decreased by NOK 31 million. The figures do not include business combinations completed through purchase of assets (Minex) for which no separate financial statements exists and intra-group transactions.
Elkem AS will be the issuer in the planned initial public offering (IPO) on the Oslo Stock exchange, and expect to be listed on or about March 2018. In connection with the IPO, there will be a restructuring where Elkem AS will acquire 100% of the shares in Jiangxi Bluestar Xinghuo Silicones Co. Ltd. (hereafter Xinghuo) and 100% of the shares in Bluestar Silicon Material Co. Ltd. (hereafter Yongdeng) from Bluestar Elkem Investment Co. Ltd., a subsidiary of China National Bluestar (group) Co. Ltd for a purchase price of RMB 3,274 million. Completion of the restructuring is conditional upon a completed IPO. The publicly listed entity will comprise Elkem AS and its controlled subsidiaries including the acquired entities Xinghuo and Yongdeng. Business combinations involving entities under common control, are accounted for according to the ‘pooling of interest method’ and comparable figures will be restated. Below an overview of the effects of the purchases. There is no acquisition related costs related to the transaction. Xinghuo has a receivable to their shareholder of NOK 1,222 million that will be settled in connection with the purchase.
33 | Events after reporting period
Consideration Xinghuo and Yongdeng Cash 4 126 104
Contingent consideration -
Non-controlling ownership interest in subsidiary -
Consideration transferred 4 126 104
Fair value of previously held equity interest -
Total 4 126 104
Amounts for assets and liabilities recognised Xinghuo and Yongdeng Property, plant and equipment 5 381 484
Other intangible assets 191 671
Other non-current assets 31 259
Inventories 543 430
Accounts receivable 322 446
Other current assets 1 489 127
Restricted deposits 1 016 018
Cash and cash equivalents 257 652
Non-current interest-bearing liabilities (1 902 999)
Provisions (36 356)
Accounts payable (882 001)
Income tax payables (248)
Interest-bearing current liabilities (2 986 109)
Bills payable (2 649 760)
Other current liabilities (538 349)
Total 237 265
Non-controlling interests -
Goodwill -
Continuity differences recognised against equity (3 888 839)
The liquidity effect of acquisitions consist of 2017 2016 Purchase price for new subsidiaries - 459 438
Adjustments in purchase price prior periods 3 860 -
Cash and cash equivalents of the acquire 203 19 650
Acquisition of subsidiaries net of cash acquired (4 063) 439 788
32 | Supplemental information to the consolidated statement of cash flows
ELKEM ANNUAL REPORT 2017 | FINANCIAL STATEMENT ELKEM AS 9594 ELKEM ANNUAL REPORT 2017 | FINANCIAL STATEMENT ELKEM AS GROUP
New loan agreementsIn connection with the Listing, Elkem plans to enter into several loan facilities agreements in an aggregate principal amount of approximately EUR 1,150 million (collectively, the “New Loan Facilities Agreements”), to refinance the facilities under the Syndicated Loan Facilities Agreement as well as certain additional outstanding indebtedness, including indebtedness assumed in connection with the acquisitions of Xinghuo Silicones and Yongdeng Silicon Materials as well as to finance general corporate purposes and working capital needs. Any such refinancing of indebtedness in China will be subject to compliance with Chinese law and regulations relating to exchange controls. The assumed debt obligations of Xinghuo and Yongdeng consist of short-term and long-term bank loans, including bank bills. Certain local loan facilities in China will be maintained in order to have RMB (Renminbi, Chinese currency) denominated debt and to facilitate the use of local cash flows to service local debt. Elkem has, however, ensured through the New Loan Facilities Agreements that it has capacity to complete a full refinancing of the Chinese debt if needed. The New Loan Facilities Agreements covers the Group’s total anticipated debt financing needs.
The New Loan Facilities Agreement will consist of three facilities: (i) a single currency loan facility in an aggregate amount of EUR 400 million (the “Facility A Loan”), (ii) a multicurrency revolving loan facility in an aggregate amount of EUR 250 million (the “Facility B Loan”) and (iii) a multicurrency term loan facility in an aggregate amount of EUR 500 million (the “Facility C Loan”). The Facility A Loan, Facility B Loan and Facility C Loan, respectively, under the New Loan Facilities Agreements are unsecured. The interest rate for borrowings under the New Loan Facilities Agreements will be an interest rate per annum equal to EURIBOR, LIBOR or NIBOR (depending on currency drawn under the facility) plus a margin of 1.50%. for the Facility A Loan, 1.20% for the Facility B Loan and for the Facility C Loan the margin will be 0.90% per annum from the date of the New Loan Facilities Agreements and increase by 0.10% per annum on each date which falls at three-monthly intervals after the date of the New Loan Facilities Agreements.
The New Loan Facilities Agreement will contain two financial covenants. The ratio of Gross operating profit to Consolidated Net Interest Payable, as defined in note 22 interest-bearing liabilities and assets, for each measurement period, which period is calculated as the 12 months ending on the last day of a financial quarter, must not be less than 4.0:1.0. Additionally, the ratio of total equity to total assets must be more than 30% at all times.
The New Loan Facilities Agreement will contain a mandatory prepayment clause upon change of control. Change of control is defined as China National Bluestar Co. Ltd. ceasing, directly or indirectly, to have the power (whether by way of ownership of shares, proxy, contract, agency or otherwise) to cast, or control the casting of, more than 50% of the maximum number of votes that might be cast at a general meeting of the Company, or hold beneficially more than 50% of the issued share capital and/or the economic interest of the Company, or after the Listing has occurred, the shares in the Company cease to be listed on the Oslo Stock Exchange or on the principle stock exchange in any of Copenhagen, Frankfurt, London, Paris or Stockholm.
Financial statement Elkem AS

96 ELKEM ANNUAL REPORT 2017 | FINANCIAL STATEMENT ELKEM AS ELKEM ANNUAL REPORT 2017 | FINANCIAL STATEMENT ELKEM AS 97
Income statement – Elkem AS
AMOUNTS IN NOK 1000
1 January - 31 December Note 2017 2016 Revenues 4 7 067 818 6 900 847
Other operating income 4 108 731 110 132
Total operating income 7 176 549 7 010 979
Raw materials and energy for smelting (3 852 686) (3 962 601)
Employee benefit expenses 5, 6 (969 322) (912 939)
Amortisation and depreciation 12 (329 235) (318 435)
Impairment losses 12 (14 573) (8 052)
Other gains/losses related to operating activities 9 (53 020) 221 465
Other operating expenses 7, 8 (1 624 430) (1 480 646)
Total operating expenses (6 843 266) (6 461 208)
Operating profit (loss) 333 283 549 771
Income from subsidiaries 13 303 958 115 893
Income from joint ventures and associates 14 (500) -
Write down on shares in subsidiaries 13 - (2 857)
Net gain (loss) from investments 303 458 113 036
Finance income 10 46 534 55 782
Foreign exchange gains (losses) 10 (239 774) 103 227
Finance expenses 10 (86 964) (89 961
Profit (loss) before income tax 356 537 731 855
Tax (expenses) / income 11 (46 612) (146 920)
Profit (loss) for the year 309 925 584 935
Balance sheet – Elkem AS
AMOUNTS IN NOK 1000
Note 31.12.17 31.12.16 ASSETS Property, plant and equipment 12 1 934 399 1 902 936
Intangible assets 12 338 069 430 394
Deferred tax assets 11 - -
Investments in subsidiaries 13 4 680 044 4 644 888
Investments in joint ventures 14 19 028 -
Investments in associates and other companies 15 13 968 12 669
Derivatives 27 25 325 36 028
Other non-current assets 16 911 782 760 233
Total non-current assets 7 922 615 7 787 148
Inventories 17 1 137 148 1 182 337
Accounts receivable 18 967 413 789 742
Derivatives 27 33 326 56 388
Other current assets 19 580 221 290 154
Cash and cash equivalents 20 846 796 292 468
Total current assets 3 564 904 2 611 089 TOTAL ASSETS 11 487 519 10 398 237 EQUITY AND LIABILITIES Paid-in capital 21 2 918 203 3 088 203
Retained earnings 21 1 502 574 1 284 671
Total equity 4 420 777 4 372 874
Non-current interest-bearing liabilities 23 2 633 985 2 895 032
Deferred tax liabilities 11 47 692 127 967
Pension liabilities 6 65 321 65 405
Derivatives 27 210 134 147 596
Provisions and other non-current liabilities 25 56 319 50 934
Total non-current liabilities 3 013 451 3 286 934
Accounts payable 751 543 584 277
Income tax payables 11 88 866 30 956
Current interest-bearing liabilities 23 2 631 340 1 728 799
Derivatives 27 146 449 62 843
Other current liabilities 26 435 093 331 554
Total current liabilities 4 053 291 2 738 429 TOTAL EQUITY AND LIABILITIES 11 487 519 10 398 237
Oslo, 21 February 2018
Michael Koenig Chairman of the board
Yougen Ge
Helge Aasen CEO
Einar Støfringshaug
Olivier de Clermont-Tonnerre
Zhigang Hao
Marianne Færøyvik
Sverre S. Tysland

98 ELKEM ANNUAL REPORT 2017 | FINANCIAL STATEMENT ELKEM AS ELKEM ANNUAL REPORT 2017 | FINANCIAL STATEMENT ELKEM AS 99
Cash flow statement – Elkem AS
AMOUNTS IN NOK 1000
1 January - 31 December Note 2017 2016 Operating profit 333 283 549 771
Changes fair value financial instruments 4 179 (385 935)
Amortisation, depreciation and impairment changes 12 343 808 326 487
Changes in working capital 1) 136 341 (6 418)
Changes in provisions, pension obligations and other (108 625) (136 792)
Interest payments received 43 426 5 441
Interest payments made (78 491) (59 723)
Income taxes paid (35 541) (14 461)
Cash flow from operating activities 638 380 278 370
Investments in property, plant and equipment and intangible assets 12 (290 723) (208 210)
Sale of property, plant and equipment 12 10 2 425
Cash effect from merged companies - 62 974
Acquisition of subsidiaries (30 314) (451 673)
Acquisition of joint ventures (19 528) 150
Increase / decrease in loans to joint ventures - -
Increase / decrease in loans to subsidiaries 280 883 (245 864)
Dividend 181 010 169 093
Other investments /sales (111) 150
Cash flow from investing activities 121 227 (671 105)
Dividend 21 (143 947) 0
New loans raised 50 302 59 560
Repayment of loans (111 683) (97 810)
Cash flow from financing activities (205 328) (38 250)
Change in cash and cash equivalents 554 279 (430 985)
Currency exchange differences 49 (116)
Net change in cash and cash equivalents 554 328 (431 101)
Cash and cash equivalents Opening balance 20 292 468 723 569
Cash and cash equivalents Closing balance 20 846 796 292 468
1) Working capital consists of accounts receivable, inventory, accounts payable, other current assets and other current liabilities. The definition of accounts receivable and inventory correspond with the definition for the group. Other current assets does not include short-term receivables to related parties, tax receivables, grants receivable, settled net against taxes payable and accrued interest, see note 19 Other current assets. Other current liabilities does not include short-term provision and liabilities to other related parties within China National Bluestar group, see note 25 Provision and other current liabilities.
1 | General information
Elkem AS is a company located in Norway, producing silicon, ferrosilicon and microsilica. The company is fully owned by Bluestar Elkem International Co. Ltd. S.A., Luxembourg.
2 | Significant accounting policies
The financial statements have been prepared in accordance with the Norwegian Accounting Act and generally accepted accounting principles in Norway. The accounts are prepared on the basis of a going concern assumption.
CHANGES IN ACCOUNTING POLICIES AND CLASSIFICATIONChanges in accounting policies are recognised directly in the equity, and the opening balance is adjusted as if the new accounting policy had always been applied. Last year’s figures are changed correspondingly, for comparative purposes.
ACCOUNTING ESTIMATESIn the event of uncertainty, the best estimate is applied, based on the information available when the annual accounts are prepared. Estimates and underlying assumptions are reviewed on an ongoing basis. Revisions to accounting estimates are recognised in the period in which the estimates are revised and in any future periods affected. See note 3 Accounting estimates.
FOREIGN CURRENCY TRANSLATIONElkem AS’s functional currency is Norwegian Kroner (NOK). Transactions in currencies other than the entity’s functional currency are translated using the transaction date’s currency rate. If the currency exposure of a transaction is designated as a part of a hedging relationship, realised effects from the associated hedging instrument is classified in the same line in the financial statements as the hedged transaction. Monetary items in foreign currencies are presented at the exchange rate applicable on the balance sheet date. Currency gains / losses related to operating activities, i.e. receivables, payables, bank accounts for operating purposes, are classified as a part of other gains / losses related to operating activities. As a result of this, currency effects included in finance income and expenses are only related to loans and dividends.
REVENUE RECOGNITIONRevenue is recognised when it is probable that transactions will generate future economic benefits for the company and the revenue can be measured reliably. Revenue is measured at the fair value of the considerations received or receivable, net of any taxes, rebates and discounts. Revenue and expenses that relate to the same transaction are recognised simultaneously. When products are sold with warranties, the expected warranty amounts are recognised as expenses at the time of the sale, and are subsequently adjusted for any changes in estimates or actual outcome.
Revenue from sale of goods is recognised when the significant risk and reward of the ownership of the goods have passed to the buyer, according to the agreed delivery term for each sale. Delivery terms are based on Incoterms 2010 issued by International Chamber of Commerce, and the main terms are “F” terms, where the buyer arranges and pays for the main carriage. The risk and reward are passed to the buyer when the goods are handed over to the carrier engaged by the buyer. “C” terms, where the group arranges and pays for the main carriage but without assuming the risk of the main carriage. The risk and reward are passed to the buyer when the goods are handed over to the carrier engaged by the seller. “D” terms, where the group arranges and pays for the carriage and retain the risk and reward of the goods until delivery at agreed destination. The risk is transferred to the buyer upon arrival at agreed destination, usually the purchaser’s warehouse.
Revenue from sale of services is recognised when the services have been provided. External sales of electric power are recognised in income on the basis of the price agreed with the customer upon delivery.
AMOUNTS IN NOK 1000
Notes to the financial statement – Elkem AS

100 ELKEM ANNUAL REPORT 2017 | FINANCIAL STATEMENT ELKEM AS ELKEM ANNUAL REPORT 2017 | FINANCIAL STATEMENT ELKEM AS 101
Initial cost includes expenditures that are directly attributable to the acquisition of the asset, cost of materials, direct labour, any other costs directly attributable to bringing the assets to working condition for their intended use and estimated dismantling or removing charges, and capitalised borrowing costs.
Subsequent costs are included in the asset’s carrying amount or recognised as a separate asset, as appropriate, when future benefits are probable and the cost can be measured reliably. The carrying amount of the replaced part is derecognised. Major periodic maintenance that is carried out less frequently than every year, is capitalised and depreciated over the period until the next periodic maintenance is performed. All other repairs and maintenance are charged to the income statement when incurred.
Depreciation is recognised using the straight-line method. The estimated useful life, residual values and depreciation method are reviewed at the end of each reporting period.
An item of property, plant and equipment is derecognised upon disposal or when no future economic benefits are expected to arise from the continued use of the asset. Any gain or loss arising on the disposal or retirement is determined as the difference between the sales proceeds and the carrying amount of the asset, and is recognised in the income statement.
IMPAIRMENT OF TANGIBLE AND INTANGIBLE ASSETSAt the end of each reporting period, the carrying amounts of tangible and intangible assets are reviewed to determine whether there is any indication of impairment. If any such indications exist, the recoverable amount of the individual asset is estimated in order to determine the extent of the impairment loss/write-down. If it is not possible to estimate the recoverable amount of the individual asset, the recoverable amount of the lowest possible cash generating unit, to which the asset belongs, is estimated. The recoverable amount is the higher of fair value less costs to sell, or its value in use. Value in use is the present value of the future cash flows expected to be derived from use of the cash generating unit, after taking into account all other relevant information. If an impairment loss for assets other than goodwill is recognised in a previous period, the entity assesses whether there are indications that the impairment may have decreased or no longer exists. If so, the impairment loss/write-down is reversed, based on an updated estimate of the recoverable amount, but not exceeding the carrying amount that would have been determined had no impairment loss been recognised for the asset.
LEASINGLeases are classified as financial leases whenever the terms of the lease transfer substantially all the risks and rewards of ownership to the lessee. All other leases are classified as operating leases.
Assets held under finance leases are initially recognised as assets at the present value of the minimum lease payment. The corresponding liability to the lessor is included in the financial statements as a finance lease obligation. Each lease payment is allocated between the liability and finance charges so as to achieve a constant rate on the obligation.
NON-DERIVATIVE FINANCIAL ASSETS AND LIABILITIESPurchases and sales of financial assets are recognised at the date of transaction on which Elkem AS is committed to the purchase or sale of the asset.
At initial recognition, the financial assets are carried in the balance sheet at fair value plus any transaction costs directly attributable to the acquisition or issue of the asset. Financial assets are derecognised once the right to future cash flows have expired or when substantially all risks and rewards related to control of the assets are transferred to a third party.
Financial assets with a maturity exceeding one year are classified as non-current financial assets. Short-term investments that do not meet the definitions of a cash equivalent and financial assets with a maturity of less than one year are classified as current financial assets. Non-current financial assets are recognised and subsequently measured at cost less any impairment loss, if the impairment is assessed not to be temporary.
Financial assets classified as held for trading are assets that have been acquired for the purpose of selling in the near term. These assets are carried in the balance sheet at fair value with gains or losses recognised in the income statement.
Income from insurance settlements are recognised when it is virtually certain that the group will receive the compensation, and presented as other operating income. Interest income is recognised on accrual basis. Dividends are recognised when shareholders’ right to receive dividends is determined by the shareholder’s meeting. Sales revenues are presented net of VAT and discounts.
INVESTMENT IN SUBSIDIARIES, ASSOCIATES AND JOINTLY CONTROLLED ENTITIESSubsidiaries are companies in which Elkem AS has controlling interests, normally obtained when Elkem AS owns more than 50% of the shares.
Associates are those entities in which Elkem AS has significant influence, but no control, over the financial and operating policies. Significant influence is presumed to exist when Elkem AS holds between 20% and 50% of the voting power of another entity. Jointly controlled entities are those entities over whose activities Elkem AS has joint control, established by contractual agreement and requiring unanimous consent for strategic financial and operating decisions.
SubsidiariesInterests in subsidiaries are recognised at cost less any write-down for impairment. An impairment loss is recognised if the impairment is considered not to be temporary.
AssociatesInvestments in associates are valued at cost and impairment loss is recognised if the carrying amount exceeds the recoverable amount. The impairment is reversed if the basis for the write-down is no longer present. Dividend received from associated companies are included in the income statement.
Joint venturesElkem AS’s interests in jointly controlled entities, which operates within Elkem AS’ main business areas (silicon materials and foundry products), are accounted for by proportionate consolidation. Elkem AS combines its share of the Joint ventures’ individual income and expenses, assets and liabilities and cash flows on a line-by-line basis with similar items in the financial statements. Elkem AS’s interests in joint controlled entities, which do not operate within Elkem AS’ business areas, are accounted for using the equity method. Under the equity method, the investment is initially recognised at cost, and the carrying amount is increased or decreased to recognise the investor’s share of the profit or loss and other comprehensive income of the investee after the date of acquisition.
INTANGIBLE ASSETSIntangible assets are stated in the financial statement at cost less subsequent accumulated amortisation and subsequent accumulated impairment losses. Intangible assets with a finite useful life are amortised, using the straight-line method. The estimated useful life and amortisation method are reviewed at the end of each reporting period.
An intangible asset is derecognised on disposal, or when no future economic benefits from its use are expected to be derived. Gain or loss arising from derecognition of an intangible asset, measured as the difference between the net disposal proceeds and the carrying amount of the asset, is recognised in the income statement.
Expenditure on research activities is recognised as an expense in the period in which it is incurred. An intangible asset arising from an internal development project is recognised if the company can demonstrate technical feasibility in completing the intangible asset, has intention to complete it, ability to use it, can demonstrate that it will generate probable future economic benefits and the cost can be reliably measured.
PROPERTY, PLANT AND EQUIPMENTProperty, plant and equipment are presented at cost, less accumulated depreciations and any accumulated impairment losses. Construction in progress are carried at cost, less any recognised impairment loss. Such assets are classified to the appropriate class of property, plant and equipment when completed and ready for its intended use. Significant parts of an item of property, plant and equipment which have different useful life, are accounted for as separate items. Depreciation commences when the assets are ready for their intended use.

102 ELKEM ANNUAL REPORT 2017 | FINANCIAL STATEMENT ELKEM AS ELKEM ANNUAL REPORT 2017 | FINANCIAL STATEMENT ELKEM AS 103
When a forecast transaction is no longer expected to occur, the cumulative gain or loss that was reported in equity is immediately transferred to the income statement.
INVENTORIESInventories are recognised at the lowest of cost and net realisable value. The cost of inventory comprises of the costs incurred in bringing the goods to their current condition and location, such as raw materials, energy for smelting, direct labour, other direct costs and production overhead costs based on normal capacity. Net realisable value represents the estimated selling price for inventories less estimated costs of completion and variable selling expenses.
Cost of goods sold is included in different lines in the income statement based on nature; raw materials and energy for smelting, employee benefits and other operating cost, for the remaining part.
TAXATION
Income taxes Current tax assets and liabilities are measured at the amount expected to be recovered or paid to the tax authorities. Current tax payable includes any adjustment to tax payable in respect of previous years. Income tax is recognised in the income statement except to the extent that it relates to items recognised directly in equity. Income tax relating to items recognised directly in equity is recognised in equity, not in the income statement.
Uncertain tax positions are included when it is probable that the tax position will be sustained in a tax review, and provisions are made relating to uncertain or disputed tax positions at the amount expected to be paid. The provision is reversed when the disputed tax position is settled in favour of the entity and can no longer be appealed.
Deferred tax Deferred tax assets and liabilities are calculated using the liability method with full allocation for all temporary differences between the tax base and the carrying amount of assets and liabilities in the financial statements, including tax losses carried forward. Deferred tax relating to items outside profit or loss is recognised outside profit and loss. Deferred tax items are recognised in correlation to the underlying transaction either in other profit and loss or directly in equity. If the temporary difference arises from the initial recognition of goodwill, the deferred tax assets and liabilities are not recognised.
Deferred tax assets are recognised in the balance sheet to the extent it is more likely than not that the tax assets will be utilised. The enacted tax rate at the end of the reporting period and undiscounted amounts are used. Deferred tax assets arising from tax losses are recognised when there is convincing evidence of recoverability. Deferred tax assets and liabilities are offset if there is a legally enforceable right to offset current tax liabilities and assets.
EMPLOYEE BENEFITS
Defined contribution plansDefined contribution plans comprise arrangements whereby the company makes monthly contributions to the employees’ pension plans, and where the future pensions are determined by the amount of the contributions and the return on the individual pension plan asset. Payments related to the contribution plans are expensed as incurred, as a part of employee benefit expenses.
Defined benefit plansDefined benefit plans are recognised at present value of future liabilities considered retained at the end of the reporting period. Plan assets are recorded at fair value. Changes in benefit liabilities due to changes in benefit plans, are distributed over average remaining contribution time. Actuarial gains / losses due to changes in financial and actuarial assumptions are recognised directly in equity. Net pension benefit costs are classified as part of employee benefit expenses. Net interest on pension liabilities/assets are presented as a part of finance expenses.
PROVISIONSA provision is recognised when a present obligation exists and it is probable that an outflow of resources is required to settle the obligation. The amount recognised is the best estimate of the consideration
LOANS AND RECEIVABLESLoans and receivables are non-derivative financial assets with fixed or determinable payments that are not quoted in a regulated market. They are recognised at amortised cost using the effective interest method. Gains and losses are recognised in the consolidated income statement when the loans and receivables are derecognised or impaired, as well as through the amortisation process. An impairment loss is recognised when the carrying amount exceeds the estimated recoverable amount.
The category includes operating receivables, deposits, guarantees and loans. These assets are classified in the balance sheet as other non-current assets or other current assets, if the repayment schedule is less than one year.
TRADE AND OTHER RECEIVABLESTrade and other receivables are recognised at nominal value less provisions for doubtful accounts.
CASH AND CASH EQUIVALENTSCash and cash equivalents are held for the purpose of meeting short term fluctuations in liquidity, rather than for investment purposes. Cash and cash equivalents comprise cash fund and short term deposits. Bank overdrafts are shown within current interest bearing liabilities in the balance sheet. Elkem AS’ deposits and drawings within the Group Bank Accounts are netted by offsetting deposits against withdrawals. The subsidiaries’ deposits and drawings are classified as current assets / liabilities.
DERIVATIVE FINANCIAL INSTRUMENTSDerivatives are initially recognised at fair value on the date the derivative contracts are entered into, and are subsequently remeasured to their fair value at the end of the reporting period. The resulting gain or loss is recognised in the income statement immediately, unless when the derivative is designated and is effective as a hedging instrument. If the derivative is designated as a hedging instrument, timing of recognition in the income statement depends on the nature of the hedging relationship.
Commodity contracts that do not qualify as hedging instruments are booked at the lower of cost and fair value.
Embedded derivatives are separated from the host contract and booked at fair value, as an independent derivative.
Contracts for the entity’s own use are contracts which are entered into and continue to be held for the purpose of the receipt of a non-financial item according to the company’s usage requirements. This applies to power purchase contracts intended for use in the plant’s production processes. Such contracts are booked in the balance sheet at cost and in the income statement on realisation.
HEDGE ACCOUNTINGElkem AS may designate certain derivatives as hedging instruments for fair value hedges and cash flow hedges. At the inception of the hedge relationship, the entity documents the relationship between the hedging instrument and the hedged item, along with its risk management objectives and its strategy for undertaking various hedge transactions.
Fair value hedgesChanges in the fair value of derivatives that are designated and qualify as fair value hedges, are recognised in profit or loss immediately together with any changes in the fair value of the hedged asset or liability that are attributable to the hedged risk.
Cash flow hedgesThe effective portion of changes in the fair value of derivatives that are designated and qualify as cash flow hedges, are recognised in the equity and accumulated under the heading of cash flow hedging reserve. The gain or loss relating to the ineffective portion is recognised immediately in the income statement. Gains / losses recognised in the equity are reclassified into the income statement in the same period(s) as the hedged assets / liabilities.
When a hedging instrument expires or is sold, or when a hedge no longer meets the criteria for hedge accounting, any cumulative gain or loss existing in the equity at that time remains in equity and is recognised when the forecast transaction is ultimately recognised in the income statement.

104 ELKEM ANNUAL REPORT 2017 | FINANCIAL STATEMENT ELKEM AS ELKEM ANNUAL REPORT 2017 | FINANCIAL STATEMENT ELKEM AS 105
required to settle the obligation, taking into account the risks and uncertainties surrounding the obligation, known at the end of the reporting period. Provisions are measured at present value, unless the time value is assessed to be immaterial.
GRANTSGrants are recognised when there is reasonable assurance that Elkem AS will comply with the conditions attaching them, and that the grants will be received. Grants are recognised in the income statement over the periods necessary to match them with the cost they are intended to compensate.
CONTINGENT ASSETS AND LIABILITIESContingent assets are not recognised, but presented in the notes if probable. Contingent liabilities are liabilities that are not recognised because they are possible obligations that have not yet been confirmed, or they are present obligations where an outflow of resources are not probable. Any significant contin-gent liabilities are disclosed in the notes.
EVENTS AFTER THE REPORTING PERIODEvents after the reporting period related to Elkem AS’s financial position at the end of the reporting period, are considered in the financial statement. Events after the reporting period that have no effect on the Company’s financial position at the end of the reporting period, but will have effect on future financial position, are disclosed if the future effect is material.
3 | Accounting estimates
In the event of uncertainty, the best estimate is applied, based on the information available when the annual accounts are prepared.
PROPERTY PLANT AND EQUIPMENTThe estimated useful lives, residual values (if any) and depreciation method is reviewed, and if necessary adjusted, at least annually.
DEFERRED TAX ASSETSElkem AS performs annual tests for impairment of deferred tax assets. Part of the basis for recognising deferred tax assets is based on applying the loss carried forward against future taxable income for the company. This requires the use of estimates when calculating future taxable income.
FINANCIAL INSTRUMENTSElkem AS holds financial instruments such as forward exchange contracts and commodity contracts which are booked at fair value. For commodity contracts nominated in EUR, the embedded EUR derivative is separated from the host contract and booked at fair value. Hedge accounting is applied for these contracts. Commodity contracts that do not qualify as hedging instruments are booked at the lower of cost and fair value. Fair value for the contracts are based on observable prices and assumptions derived from observable prices for comparable instruments.
Net booked value of contracts booked at fair value as at 31 December 2017 is in total negative NOK 298 million, see note 27 Financial instruments for more information.
By type 2017 2016 Revenue from sale of goods 1) 5 557 908 5 384 881
Revenue from sale of goods – group 1 139 938 1 232 236
Other operating revenue 175 609 211 730
Other operating revenue – group 194 363 72 000
Total revenue 7 067 818 6 900 847
Other operating income 108 731 110 132
Total operating income 7 176 549 7 010 979
Details of other operating income: 2017 2016 Sale of fixed assets 10 2 364
Insurance settlement 14 890 249
Grants 1) 93 831 107 520
Total other operating income 108 731 110 132
Operating income by geographic market 2017 2016 Nordic countries 1 197 441 1 375 392
United Kingdom 470 116 354 075
Germany 1 342 774 1 343 490
France 539 555 610 055
Italy 358 847 334 463
Poland 179 855 158 394
Luxembourg 601 685 286 893
Switzerland 13 125 12 379
Netherlands 64 788 41 010
Other European countries 966 643 606 087
Europe 5 734 828 5 122 238
Africa 17 394 16 988
North America 225 965 541 691
South America 21 261 31 463
America 247 226 573 154
China 86 292 108 462
Japan 298 879 447 553
South Korea 300 367 437 838
Other Asian countries 478 745 291 179
Asia 1 164 283 1 285 032
The rest of the world 12 819 13 567
Total operating income 7 176 549 7 010 979
4 | Operating income
1) Included in Revenue from sale of goods is sale of power NOK 444,754 thousand in 2017 and 385,294 thousand in 2016.
1) See note 29 Grants.

106 ELKEM ANNUAL REPORT 2017 | FINANCIAL STATEMENT ELKEM AS ELKEM ANNUAL REPORT 2017 | FINANCIAL STATEMENT ELKEM AS 107
2017 2016 Salaries and other benefits (803 187) (764 226)
Employer’s national insurance contribution (96 958) (96 613)
Employee retirement benefits 1) (55 742) (44 008)
Other payments / benefits (13 435) (8 091)
Total employee benefit expenses (969 322) (912 939)
Breakdown of net pension expenses 2017 2016 Current service expenses (2 605) (1 692)
Accrued employer’s national insurance contribution (254) (203)
Net pension expenses, defined benefit plan (2 859) (1 895)
Defined contribution plan (41 293) (30 355)
Early retirement scheme (AFP) (11 590) (11 758)
Total pension cost (55 742) (44 008)
2017 2016 Present value of pension obligation (PBO) (65 321) (65 405)
Fair value of plan assets - -
Net unfunded pension obligation (65 321) (65 405)
Active participants in pension scheme for salary above 12G 56 52
Retired participants 67 77
Summary of pension obligation and remeasurements 2017 2016 Pension obligations (65 321) (65 405)
Effects from remeasurement of pension liabilities recognised in Equity / Deferred tax (339) (1 765)
Total effects from remeasurement of pension liabilities recognised in Equity / Deferred tax as of 31.12 (13 563) (13 224)
Salary and other compensations to the CEO 2017 2016 Salary, including holiday pay (5 417) (5 111)
Bonus 1) (4 932) (3 148)
Free car (130) (130)
Other compensation (31) (28)
Pension cost (693) (640)
Compensation to members of the board 2017 2016 Payment to board members in total (500) (489)
5 | Employee benefit expenses 6 | Retirement benefits
1) See note 6 Retirement benefits.
1) In addition to the performance bonus, a strategic project bonus of NOK 3,542 thousand were paid in 2017. In 2016 an additional strategic bonus of NOK 407 thousand and ChemChina award of NOK 604 thousand were paid.
Number of full time equivalents in Elkem AS 1 044 1 038
Salary, wages and other compensations above include the following compensations
Retirement age for the CEO is 65-70 years. Pension from the age of 70 and other pensions regarding spouse, children and disability are paid in accordance with the general pension policy of the company. In addition to the general pension policy of the company, CEO is entitled to an annual early retirement pension, from the age of 65, of 60% of pensionable salary.
The CEO is also entitled to a performance bonus equivalent to maximum 100% of the base salary, based on the company performance.
The following applies for the CEO upon termination by the company: Termination payment equal to 12 months’ salary is to be paid on the last working day, severance payment equivalent to 18 months’ salary.
Loans and guarantees to employeesThere are no loans or guarantees to board members or the CEO.
Defined contribution plansPension for employees in Elkem AS are mainly covered by pension plans that are classified as contribution plans.
Defined contribution plans comprise arrangements whereby the company makes annual contributions to the employee’s pension plan, and where the employee’s future pension is determined by the amount of the contributions and the return on the pension plan asset. In addition a multi-employer plan where sufficient information to calculate each participant’s pension obligation is not available should be accounted for as it is a defined contribution plan.
Elkem AS’ contributions to the employees individual pension plan assets constitutes 5% of base salary up to 7.1G and 15% between 7.1 and 12G. G refers to the national insurance scheme’s basic amount in Norway, amounting to NOK 93,634 for 2017. A separate plan for pension on salary above 12 G is established, and accounted for under defined benefit plans.
Elkem AS participates in the early retirement scheme AFP. This is as a multi-employer plan accounted for as a defined contribution plan, in accordance with the Ministry of Finance’s conclusion. The participants in the pension plan is jointly responsible for 2/3 of the plan’s pension obligation, the government is responsible for the remaining part. The yearly pension premium paid by the participants in 2017 is 2.5% of the employee’s salary between 1 and 7.1 G, covering this years pension payments and contribution to a security fund for future pension obligations. The premium in per cent of salary for 2018 is equal to 2017.
Defined benefit plansAll defined benefit plans are unfunded and relate to closed retirement schemes, closed individual and retirement schemes and a separate plan for pension on salary above 12G.
Net interest is calculated based on pension liability at the start of the period multiplied by the discount rate and is presented as a part of financial expenses. Remeasurements of the defined benefit plans are recognized directly in equity.
The company’s retirement schemes meet the minimum requirement in the Norwegian Act of Mandatory Occupational Pension.
Senior staff compensation Helge Aasen is the CEO of Elkem AS.

108 ELKEM ANNUAL REPORT 2017 | FINANCIAL STATEMENT ELKEM AS ELKEM ANNUAL REPORT 2017 | FINANCIAL STATEMENT ELKEM AS 109
Economical assumptions 2017 2016 Discount rate 1) 2.2% 2.0%
Change in public pension rate (G) 2.25% 2.0%
Annual regulation of pensions paid 1.0 % 1.0%
8 | Operating lease
1) The discount rate is based on high quality corporate bonds reflecting the timing of the benefit payments.
1) See note 8 Operating lease.
The company’s chosen assumptions are in line with “Guide to Pension Assumptions” published by The Norwegian Accounting Standard Board, September 2017.
During 2017, Elkem AS expensed NOK 118,789 thousand (NOK 116,640 thousand) as research and development related to processes, products and business development, including technical customer support and improvement projects.
Grants received relating to research and development amount to NOK 30,444 thousand (NOK 20,364 thousand) are included in other operating income.
In addition to the above, services of NOK 21,969 thousand in other service from KPMG have been provided and invoiced through Elkem AS to Bluestar Elkem International Co., Ltd. S.A. with NOK 16,057 thousand in 2017 and NOK 5,912 thousand in 2016.
Fees to auditors are reported exclusive of VAT.
2017 2016 Travel expenses (45 126) (42 109)
Machinery, tools, fixtures and fittings (270 512) (250 210)
Repair, maintenance and other operating expenses (132 689) (117 246)
Other external expenses (fees, transport, IT services, etc.) (261 737) (228 845)
Loss on accounts receivables (4 725) (6 388)
Other energy and fuel expenses (75 667) (81 287)
Commission expenses (82 390) (83 918)
External distribution expenses (459 308) (415 343)
Rental/leasing expenses 1) (53 094) (47 369)
Miscellaneous manufacturing, administration and selling expenses (239 182) (207 931)
Total other operating costs (1 624 430) (1 480 646)
Audit and other services 2017 2016 KPMG:
– Audit fee (3 703) (1 939)
– Other assurance services (167) (1 268)
– Tax services - -
– Other services (152) -
PwC and other audit firms:
– Audit fee (272) (1 442)
– Other assurance services (407) (258)
– Tax services - (626)
– Other services (15) (79)
Total audit fees (4 716) (5 611)
7 | Other operating expenses
2017 Machinery Land, buildings Equipment, Total and plant and other furniture, properties systems and vehicles Lease expenses current year (13 266) (37 455) (2 373) (53 094)
Lease in accordance with contract due:
Within one year (183) (14 182) - (14 365)
In the second to fifth year inclusive - (40 704) - (40 704)
Over five years - - - 0
2016 Machinery Land, buildings Equipment, Total and plant and other furniture, properties systems and vehicles Lease expenses current year (9 532) (36 137) (1 700) (47 369)
Lease in accordance with contract due:
Within one year (474) (15 427) (758) (16 660)
In the second to fifth year inclusive (277) (46 171) (1 955) (48 403)
Over five years - (28 821) - (28 821)
2017 2016 Realised currency gains / (losses) from forward contracts (40 001) (149 081)
Unrealised currency gains / (losses) from forward contracts (58 376) 412 099
Other currency gains / (losses) operational 58 584 (23 480)
Realised effects other financial instruments 1) (9 028) (26 506)
Unrealised effects other financial instruments (4 199) 8 091
Ineffectiveness on cash flow hedges power - 342
Other gains / losses related to operating activities (53 020) 221 465
9 | Other gains / losses related to operating activities
1) Other financial instruments consist of power contracts and embedded derivatives EUR. See note 27 for more information.

110 ELKEM ANNUAL REPORT 2017 | FINANCIAL STATEMENT ELKEM AS ELKEM ANNUAL REPORT 2017 | FINANCIAL STATEMENT ELKEM AS 111
2017 2016 Interest income 1 643 3 371
Interest income – group 41 930 50 509
Dividend 1 290 1 550
Other financial income 1 671 352
Total finance income 46 534 55 782
Interest expenses (65 472) (63 941)
Interest expenses – group (18 044) (21 157)
Interest expenses net pension liabilities (2 103) (2 310)
Other financial expenses (1 345) (2 553)
Total finance expenses (86 964) (89 961)
Net foreign currency exchange gain / loss 1) (239 774) 103 227
Net Finance income / (expenses) (280 204) 69 048
Deferred tax assets and deferred tax liabilities 31.12.17 31.12.16 Cash flow hedges charged to equity 13 395 (21 431)
Property, plant, equipment and intangible asset (115 015) (133 197)
Pension liabilities 15 024 15 492
Other differences 56 433 57 128
Accounts receivable 1 909 258
Inventory (25 342) (42 417)
Provisions 5 905 (3 800)
Deferred tax assets (liabilities) (47 692) (127 967)
Deferred tax 31.12.17 31.12.16 Opening balance - net deferred tax assets (liabilities) (127 967) 33 452
Charged to Profit and Loss 46 847 (114 786)
Changes in deferred tax hedges charged to equity 34 826 (45 310)
Change in actuary gains/losses charged to equity (54) 309
Other items charged to equity - (1 615)
Changes in group contributions to subsidiaries (1 348) -
Foreign currency exchange differences 4 (17)
Net deferred tax assets (liabilities) (47 692) (127 967)
Income tax recognised in profit or loss 2017 2016 Current tax expenses (90 959) (34 019)
Previous year tax adjustment (848) (2 453)
Deferred tax 46 847 (114 786)
Other taxes (1 652) 4 338
Total tax expenses recognised in profit (46 612) (146 920)
2017 2016 Profit before tax 356 537 731 855
Applicable tax rate Norway 24 % 25 %
Tax expense at applicable tax rate (85 569) (182 964)
Permanent differences
Tax effect of income from Norwegian controlled foreign companies (NOKUS) (6 907) (6 619)
Dividend within the Tax exemption method 14 502 16 886
Debt forgiveness 1) 27 454 11 775
Tax effect merger - 8 729
Impairment of shares / reversal of impairment - (981)
Tax effects other permanent differences (1 017) (1 390)
Other effects
Previous year tax adjustment (848) (2 453)
Tax effect change in corporate tax rate 2) 7 425 5 759
Other current tax paid (1 652) 4 338
Income tax for the year (46 612) (146 920)
Effective tax rate 13 % 20 %
10 | Finance income and expenses
11 | Taxes
1) Foreign exchange gain / loss in 2017 and 2016 is mainly related to the bank loans in EUR.
1) Elkem AS has four debt forgiveness agreements with Elkem Silicones France SAS. Nominal value of the agreements as of 31 December are NOK 1,343 million (EUR 136 million), book value NOK 0,-. Elkem Silicones France SAS has repaid NOK 115 million under this agreement in 2017, the gain is classified as income from subsidiaries. The effect of repayment is tax exempted.
2)The effect relates mainly to changes in tax rate from 24 per cent to 23 per cent in Norway from 2018. The changes in tax rates were approved by the governments before year end the respective years.
The table below shows the reconciliation of accounting profit and tax expense (-). Accounting profit is multiplied by the applicable tax rate
Property, plant and equipment
12 | Property, plant and equipment, intangible assets and goodwill
2017 Land and Buildings Machinery Equipment, Construction Total other and plants furniture and in progress property transport- vehicles Opening balance Net booked value 2017 24 136 458 793 1 198 287 40 188 181 532 1 902 936
Additions - - 882 27 277 388 278 297
Disposals - - - - - -
Transferred from CiP 25 533 12 868 186 239 6 276 (230 916) -
Impairment losses (255) (780) (13 491) (47) - (14 573)
Depreciation expenses (3 300) (47 763) (171 238) (9 962) - (232 263)
Foreign currency exchange differences - - - 2 - 2
Closing balance Net booked value 2017 46 114 423 118 1 200 679 36 484 228 004 1 934 399
Fixed assets under financial leasing
included in Net booked value - - - 719 - 719
Historical cost 90 386 1 213 772 3 630 462 122 966 228 004 5 285 590
Accumulated depreciation (43 332) (779 667) (2 366 955) (86 339) - (3 276 293)
Accumulated impairment losses (940) (10 987) (62 828) (143) - (74 898)
Closing balance Net booked value 2017 46 114 423 118 1 200 679 36 484 228 004 1 934 399
Estimated useful life 0-50 years 5-40 years 3-30 years 3-20 years
Depreciation plan Straight-line Straight-line Straight-line Straight-line

112 ELKEM ANNUAL REPORT 2017 | FINANCIAL STATEMENT ELKEM AS ELKEM ANNUAL REPORT 2017 | FINANCIAL STATEMENT ELKEM AS 113
2016 Land and Buildings Machinery Equipment, Construction Total other and plants furniture and in progress property transport- vehicles Opening balance Net booked value 2016 23 120 444 587 1 079 677 43 344 277 056 1 867 784
Additions - - 45 8 264 530 264 583
Disposals - (50) 0 (11) - (61)
Transferred from CiP 3 390 65 263 284 452 6 949 (360 054) -
Impairment losses - (6 897) (1 118) (37) - (8 052)
Depreciation expenses (2 374) (44 111) (164 759) (10 064) - (221 307)
Foreign currency exchange differences - - (10) (1) - (11)
Closing balance Net booked value 2016 24 136 458 793 1 198 287 40 188 181 532 1 902 936
Fixed assets under financial leasing
included in Net booked value 21 193 - - 1 378 - 22 571
Historical cost 61 350 1 201 761 3 513 783 117 499 181 532 5 075 926
Accumulated depreciation (36 071) (732 474) (2 255 437) (77 177) - (3 101 159)
Accumulated impairment losses (1 144) (10 494) (60 059) (134) - (71 831)
Closing balance Net booked value 2016 24 136 458 793 1 198 287 40 188 181 532 1 902 936
Estimated useful life 0-50 years 5-40 years 3-30 years 3-20 years
Depreciation plan Straight-line Straight-line Straight-line Straight-line
2017 Other IT systems Intangible Total intangible and assets under intangible assets programmes construction assets
Opening balance Net booked value 2017 321 778 97 943 10 673 430 394
Additions - 1 138 3 509 4 647
Reclassification / Transferred from CiP (794) 4 619 (3 825) -
Reversal of impairment losses - - - -
Amortisation (80 171) (16 801) - (96 972)
Closing balance Net booked value 2017 240 813 86 899 10 357 338 069
Historical cost 803 601 216 501 10 357 1 030 459
Accumulated amortisation (562 788) (129 602) - (692 390)
Closing balance Net booked value 2017 240 813 86 899 10 357 338 069
Estimated useful life 3-10 years 3-10 years
Amortisation plan Straight-line Straight-line
2016 Other IT systems Intangible Total intangible and assets under intangible assets programmes construction assets
Opening balance Net booked value 2016 402 224 110 650 10 824 523 698
Additions - 1 338 2 486 3 824
Reclassification / Transferred from CiP - 2 637 (2 637) -
Reversal of impairment losses - - - -
Amortisation (80 447) (16 682) - (97 128)
Closing balance Net booked value 2016 321 778 97 943 10 673 430 394
Historical cost 805 339 210 162 10 673 1 026 174
Accumulated amortisation (483 561) (112 219) - (595 780)
Closing balance Net booked value 2016 321 778 97 943 10 673 430 394
Estimated useful life 3-10 years 3-10 years
Amortisation plan Straight-line Straight-line
2016 Country Other share Equity Profit Book value Vote rights (%) 31.12.17 31.12.17 31.12.17
Elkem Carbon AS Norway 100 % 820 748 148 056 112 915
Elkem Chartering Holding AS Norway 80 % 14 900 13 219 747
Elkem Distribution Center B.V. Netherlands 100 % 20 910 1 168 186
Elkem Foundry (China) Co. Ltd. China 100 % 64 183 (2 705) 66 242
Elkem Foundry Invest AS Norway 100 % 71 275 (1 224) 70 119
Elkem GmbH Germany 100 % 15 781 1 681 1 309
Elkem Iberia SLU Spain 100 % 7 580 1 853 476
Elkem Island EHF Iceland 100 % 1 597 540 46 506 783 790
Elkem International AS Norway 100 % 70 347 (54) 5 427
Elkem International Trade (Shanghai) Co. Ltd.1) China 11 % 149 214 7 867 558
Elkem Japan K.K Japan 100 % 86 344 5 306 15
Elkem LTD. United Kingdom 100 % 5 025 438 18 983
Elkem Madencilik Metalurji Sanayi Ve Ticaret Ltd STI 1) Turkey 1 % 5 365 730 77
Elkem Materials Processing (Tianjin) Co.,Ltd China 100 % 2 653 (151) 793
Elkem Materials Processing Services BV Netherlands 100 % 5 365 730 962
Elkem Metal Canada Inc Canada 100 % 909 000 61 272 5 870
Elkem Milling Services GmbH Germany 100 % 32 598 6 568 12 486
Elkem Nordic A.S. Denmark 100 % 10 560 4 353 5 139
Elkem Oilfield Chemicals FZCO Arabic Emirates 51 % 80 439 58 419 12 546
Elkem Rana AS Norway 100 % 342 027 70 363 351 233
Elkem S.a.r.l. France 100 % 14 226 610 0
Elkem S.r.l. Italy 100 % 26 620 5 170 6 397
Elkem Siliconas España S.A.U Spain 100 % 126 231 2 800 125 444
Elkem Silicones (UK) Ltd United Kingdom 100 % 55 523 4 656 60 227
Elkem Silicones Brasil Ltda Brasil 100 % (22 341) (42 514) 23 009
Elkem Silicones Canada Corp. Canada 100 % 13 381 2 008 5 824
Elkem Silicones Czech Republic s.r.o Czech Republic 100 % 5 295 2 606 2 226
Elkem Silicones Finland OY Finland 100 % 6 932 1 379 5 438
Intangible assets
The book value of a power contract against Statkraft of 1.5 TWh. as of 31 December 2017 is NOK 240 million and included in other intangible assets. The notional amount of the underlying asset at the end of reporting period, volume * price, is NOK 1,373 million.
The book value of a power contract against Statkraft of 1.5 TWh. as of 31 December 2016 is NOK 320 million and included in other intangible assets. The notional amount of the underlying asset at the end of reporting period, volume * price, is NOK 1,810 million.
13 | Investments in subsidiaries
1) Elkem AS and subsidiary owns 100% of Elkem Madencilik Metalurji Sanayi Ve Ticaret Ltd and Elkem International Trade (Shanghai) Co. Ltd.

114 ELKEM ANNUAL REPORT 2017 | FINANCIAL STATEMENT ELKEM AS ELKEM ANNUAL REPORT 2017 | FINANCIAL STATEMENT ELKEM AS 115
2016 Country Other share Equity Profit Book value Vote rights (%) 31.12.17 31.12.17 31.12.17
Elkem Silicones France SAS France 100 % 2 295 176 130 192 2 147 832
Elkem Silicones Germany GmbH Germany 100 % 163 966 15 745 129 657
Elkem Silicones Hong Kong Co. Limited Hong Kong 100 % 105 506 11 907 101 968
Elkem Silicones Poland p. z o.o Poland 100 % 8 917 2 278 3 712
Elkem Silicones Scandinavia AS Norway 100 % 20 646 3 123 15 188
Elkem Silicones Services S.à.r.l France 100 % (27 307) (1 833) 0
Elkem Silicones Shanghai Co. Limited China 100 % 118 647 9 348 107 382
Elkem Silicones USA Corp. USA 100 % 273 019 31 468 260 294
Elkem Siliconi Italia S.r.l Italy 100 % 39 122 3 678 23 998
Elkem Singapore Materials Pte. Ltd Singapore 100 % 29 897 160 46
Elkem South Asia Private Limited India 100 % 129 688 8 456 33 563
Explotacion de Rocas Industriales y Minerales S.A.2) Spain 100 % 103 991 11 853 80 460
NEH LLC USA 100 % 297 957 6 831 97 506
Total subsidiaries 4 680 044
2) Elkem AS acquired 100% of the shares following the merger of Nor-Kvarts AS on 1st January 2017.
1) Shares in the company were acquired in June 2017.
1) See note 11 taxes for more information.
2) In January 2016 Dehong Ltd was liquidated resulting in a gain of NOK 1,250 thousand.
Income on investments in subsidiaries 2017 2016 Dividend from subsidiaries 60 424 67 543
Repayment of debt forgiveness 1) 114 534 47 100
Income on disposal 2) - 1 250
Group contribution received 129 000 -
Total income 303 958 115 893
2017 2016 Total interest in joint ventures 1 January - -
Acquired shares in Joint ventures/change of ownership 19 528 -
Share of profit / (loss) (500) -
Total interest in joint ventures 31 December 19 028 -
Elkania DA Total 2017 Current assets 15 451 15 451
Non-current assets 4 427 4 427
Current liabilities 17 101 17 101
Non-current liabilities 7 506 7 506
Net assets (4 729) (4 729)
Total revenue 2 825 2 825
Total expenses (3 863) (3 863)
Financial items (148) (148)
Tax 208 208
Total profit / (loss) for the year (978) (978)
Elkania DA Total 2016 Current assets 14 199 14 199
Non-current assets 5 028 5 028
Current liabilities 15 412 15 412
Non-current liabilities 7 566 7 566
Net assets (3 751) (3 751)
Total revenue 5 390 5 390
Total expenses (5 172) (5 172)
Financial items (155) (155)
Tax (98) (98)
Total profit for the year (35) (35)
Write-down / reversal of write-down on investments in subsidiaries 2017 2016 Write-down subsidiaries - (2 857)
Total write-down - (2 857)
Net gain/loss from investments in subsidiaries 303 958 113 036
14 | Investments in joint ventures
Company Country Owner share Owner share Accounting address Voting rights Voting rights method 2017 2016
Elkania DA Hauge i Dalane Norway 50 % 50 % Proportionate
Salten Energigjenvinning AS 1) Oslo Norway 50 % 0 % Equity
Main figures for the investments accounted for by proportionate consolidation. The figures are Elkem AS portion.
Owner share Book value Book value (%) 31.12.17 31.12.16 Elkem Chartering AS 25,0 % 8 529 8 529
Other companies 5 440 4 140
Total investments in associates and other companies 13 968 12 669
31.12.17 31.12.16 Long-term deposit pension guarantee 18 775 17 905
Pension Contribution Fund, long-term 1 200 2 760
Loans to joint arrangements 7 246 7 098
Loan to subsidiaries 1) 883 257 717 922
Other non-current assets 1 304 14 548
Total other non-current assets 911 782 760 233
15 | Investments in associates and other companies
16 | Other non-current assets
1) See note 28 Related party transactions.

116 ELKEM ANNUAL REPORT 2017 | FINANCIAL STATEMENT ELKEM AS ELKEM ANNUAL REPORT 2017 | FINANCIAL STATEMENT ELKEM AS 117
31.12.17 31.12.16 Finished goods 583 436 661 925
Work in progress 176 612 197 566
Raw materials 219 323 171 828
Operating materials and spare parts 157 776 151 018
Total inventories 1 137 148 1 182 337
31.12.17 31.12.16 Accounts receivables 668 805 551 309
Accounts receivables - related parties 306 948 244 800
Provision for doubtful accounts (8 340) (6 367)
Total accounts receivables 967 413 789 742
31.12.17 31.12.16 Not due 514 417 463 752
1 - 30 days 117 235 60 573
31 - 60 days 20 975 3 524
61 - 90 days 4 770 7 308
More than 90 days 11 408 16 151
Total accounts receivables 668 805 551 309
Overdue by 31.12.17 31.12.16 less than 90 days (1 304) (3 292)
61 - 90 days (2 965) (2 203)
more than 90 days (4 071) (872)
Total receivables written-down (8 340) (6 367)
Movement in allowance for doubtful debts 31.12.17 31.12.16 Opening balance (6 367) (700)
Impairment losses recognised on receivables (5 108) (5 680)
Reversed impairment losses 3 135 13
Balance as of 31 December (8 340) (6 367)
17 | Inventories
18 | Accounts receivable
As of 31 December 2017 inventories were written down by NOK 1,042 thousand.As of 31 December 2016 inventories were written down by NOK 14,356 thousand.
ShareholdersElkem AS is the parent company of Elkem AS group. As of 31 December 2017 Elkem AS was 100% owned by Bluestar Elkem International Co. Ltd S.A. Elkem AS has its registered company address: Drammensveien 169, 0277 Oslo, Norway.
Share capitalShare capital as of 31 December 2017 in Elkem AS is NOK 2,010,000 thousand, divided in 1 share.
The following is an analysis of gross accounts receivables by age, presented based on the due date:
The following is an analysis of current receivables that are past due date and written-down, by age
Elkem applies for credit insurance for all customers when this can be obtained. In cases where credit insurance coverage is refused, other methods of securing the sales income are used. Other methods used for securing the sales are, among others, prepayment, letter of credit, documentary credit, guarantee etc.
31.12.17 31.12.16 Pension contribution fund, short term part 1) 2 182 5 214
Grants receivable 2) 66 756 113 677
Grants receivable, settled net against taxes payable 2) 7 779 -
VAT receivables 125 336 79 543
Prepayments 14 940 14 875
Receivable group entities related to Group Bank Accounts 214 102 68 744
Receivable group contribution 129 000 -
Other current assets 20 127 8 100
Total other current assets 580 221 290 154
31.12.17 31.12.16 Cash and bank balances 846 796 292 468
Cash and cash equivalents 846 796 292 468
19 | Other current assets
20 | Cash and cash equivalents
21 | Equity
1) See note 6 Retirement benefits.
2) See note 29 Grants.
1) See note 30 Merger Elkem AS and subsidiaries.
Share Other paid Total paid Retained Total capital in capital in capital earnings equity
Equity 31.12.16 2 010 000 1 078 203 3 088 203 1 284 671 4 372 874
Hedging - - - (112 706) (112 706)
Actuarial gain / loss - - - (394) (394)
Currency translation - - - 72 72
Merger 1) - - - 21 006 21 006
Dividend (170 000) (170 000) - (170 000)
Profit for the year - - - 309 925 309 925
Equity 31.12.17 2 010 000 908 203 2 918 203 1 502 574 4 420 777
Changes in equity

118 ELKEM ANNUAL REPORT 2017 | FINANCIAL STATEMENT ELKEM AS ELKEM ANNUAL REPORT 2017 | FINANCIAL STATEMENT ELKEM AS 119
Share Other paid Total paid Fund Other Total Total capital in capital in capital equity retained equity earnings Equity 01.01.16 2 010 000 1 078 203 3 088 203 2 311 552 324 554 635 3 642 838
Hedging - - - - 144 347 144 347 144 347
Actuarial gain / loss - - - - (1 458) (1 458) (1 458)
Currency translation Joint ventures - - - (2 311) 927 (1 384) (1 384)
Merger - - - - 3 596 3 596 3 596
Profit for the year - - - - 584 935 584 935 584 935
Equity 31.12.16 2 010 000 1 078 203 3 088 203 - 1 284 671 1 284 671 4 372 874
Changes in equity
FundFund is valuation variances in conjunction with Dehong who is consolidated by proportionate consolidation. The company was liquidated in 2016.
Overview of finance lease 31.12.17 31.12.16 Within one year 196 2 582
Between 1 and 5 years 17 258
Over 5 years - -
Total lease payments 213 2 840
Less future finance charges 120 (32)
Present value of lease obligations 333 2 808
Less amount due for settlement within 12 months 316 2 560
Total non-current finance lease obligations 17 248
Leasing cost current year 591 2 565
22 | Finance lease liabilities
Elkem AS leases some of its manufacturing equipment under a finance lease. Interest rates range from 3.50% to 6.99%. Elkem AS’s obligations under a finance lease are secured by the lessor’s title to the leased assets. Elkem AS has the right to prolong some leasing agreements, and the right to keep the leased equipment after the closed leasing period for some leasing agreements.
31.12.17 31.12.16 Non-current interest-bearing liabilities
Financing from subsidiaries 164 358 118 243
Financial leases 1) 17 248
Bank financing and other liabilities 2 469 610 2 776 541
Total non-current interest-bearing liabilities 2 633 985 2 895 032
Current interest-bearing liabilities
Financing from subsidiaries 2 030 323 1 616 239
Financial leases 1) 316 2 560
Bank financing 544 830 48 532
Loans from external part, other than bank 52 652 58 433
Accrued interest 3 219 3 035
Total current interest-bearing liabilities 2 631 340 1 728 799
Total interest-bearing liabilities 5 265 325 4 623 831
Interest-bearing assets
Cash and bank balances 846 796 292 468
Restricted deposits 18 847 17 905
Non-current loans to subsidiaries 883 258 717 922
Non-current loans to joint arrangements 7 246 7 098
Current loans to subsidiaries 185 586 40 258
Total interest-bearing assets 1 941 733 1 075 651
Net interest-bearing assets / (liabilities) (3 323 592) (3 548 180)
23 | Interest-bearing assets / liabilities
1) See note 22 Finance lease liabilities.
Interest-bearing liabilities by currency Currency NOK Currency NOK amount 31.12.17 amount 31.12.16 EUR 355 615 3 500 957 328 227 2 982 036
USD 71 418 585 914 24 742 213 243
NOK 585 943 585 943 755 392 755 392
Other currencies - 592 511 - 673 160
Total interest-bearing liabilities 5 265 325 4 623 831
Maturity of interest-bearing liabilities at 31.12.2017 Group Financial Loans from Bank Accrued Total financing leases external part, financing interest other than bank 2018 2 030 323 316 52 652 544 830 3 219 2 631 340
2019 - 17 - 544 830 - 544 847
2020 - - - 1 775 430 - 1 775 430
2021 - - - 52 590 - 52 590
2022 - - - 52 590 - 52 590
2023 and later 164 358 - - 52 590 - 216 948
Total 2 194 681 333 52 652 3 022 860 3 219 5 273 745
Prepaid loan fees - - - (8 420) - (8 420)
Total interest bearing liabilities 2 194 681 333 52 652 3 014 440 3 219 5 265 325

120 ELKEM ANNUAL REPORT 2017 | FINANCIAL STATEMENT ELKEM AS ELKEM ANNUAL REPORT 2017 | FINANCIAL STATEMENT ELKEM AS 121
Maturity of interest-bearing liabilities at 31.12.2016 Group Financial Loans from Bank Accrued Total financing leases external part, financing interest other than bank 2017 1 616 239 2 560 - 106 965 3 035 1 728 799
2018 - 248 - 502 798 - 503 046
2019 - - - 502 798 - 502 798
2020 - - - 1 638 460 - 1 638 460
2021 - - - 48 533 - 48 533
2022 and later 118 243 - - 97 065 - 215 308
Total 1 734 482 2 808 - 2 896 619 3 035 4 636 944
Prepaid loan fees - - - (13 113) - (13 113)
Total interest bearing liabilities 1 734 482 2 808 - 2 883 506 3 035 4 623 831
Covenant Elkem AS group 31.12.17 31.12.16 Loan covenant Total Equity NOK 8 332 862 7 459 042
Total Assets NOK 16 347 935 14 813 342
Equity ratio 51 % 50 % > 30%
EBITDA NOK 2 098 467 1 617 790
Net finance charges NOK 66 747 61 639
Interest cover ratio 31,44 26,25 > 4.00
Elkem AS is granted credit facilities of EUR 200,000 thousand (NOK 1,968,960 thousand) and NOK 250,000 thousand, a total of NOK 2,218,930 thousand in granted credit facilities. Both facilities remained undrawn at 31 December 2017 and 31 December 2016.
The credit facilities and the term loans in Elkem AS contain financial covenants. The financial covenants and the calculations for the drawn loan of NOK 3,022,860 thousand (2,838,187 thousand) is described below:
WarrantiesElkem AS has provisions related to warranties when selling parts used for building of furnaces.
Employee benefitsEmployee benefits consist of provisions for long-service benefits.
Site restorationElkem AS has provisions for future remediation work related to the necessary site remediation work that it will have to undertake in respect of its quartz mines. In addition Elkem AS has provisions for future remediation work related to necessary site remediation work that will have to undertake on sites used for waste disposal.
Obligation to financeElkem AS purchased Elkem Silicones in 2015. The subsidiary Elkem Silicones Services S.à.r.l has a negative equity when Elkem AS purchased Elkem Silicones and Elkem AS has a obligation to fund the company’s continued operations.
Guarantee commitments 31.12.17 31.12.16 Guarantees given on behalf of subsidiaries regarding environmental obligations 31 274 4 618
Guarantees given on behalf of subsidiaries regarding financing 133 953 70 359
24 | Guarantees
31.12.17 31.12.16 Warranties 2 570 -
Employee benefits 266 273
Site restoration 26 460 23 638
Obligation to finance subsidiary 27 023 27 023
Provisions 56 319 50 934
31.12.17 31.12.16 Social securities tax and withholding tax employees 59 213 55 734
Value added tax 82 420 18 738
Payroll payables 153 538 135 911
Payables to subsidiaries 24 246 19 711
Provisions 3 201 -
Group contribution - 12 392
Other short-term liabilities 112 475 89 068
Total other current liabilities 435 093 331 554
25 | Provisions and other non-current liabilities
26 | Other current liabilities
Derivatives are initially recognised at fair value at the date on which a derivative contract is entered, and are subsequently remeasured at their fair value. The method of recognising the resulting gain or loss depends on whether the derivative is designated as a hedging instrument, and if so, the nature of the hedging.
Foreign exchange forward contractsElkem AS’s Treasury department enters into foreign forward contracts to meet Elkem Groups foreign currency exposure. Hedge accounting is not applied for these contracts, they are classified as held for trading and booked at fair value through profit and loss.
Elkem AS’s Treasury department also offers internal currency hedging for major purchase/sale-contracts entered into by the subsidiaries. Such contracts (Fxt) can not be designated in a hedging relationship, changes in fair value are recognised through profit and loss. At 31 December 2017 there are no currency contracts against subsidiaries in the balance sheet.
27 | Financial instruments
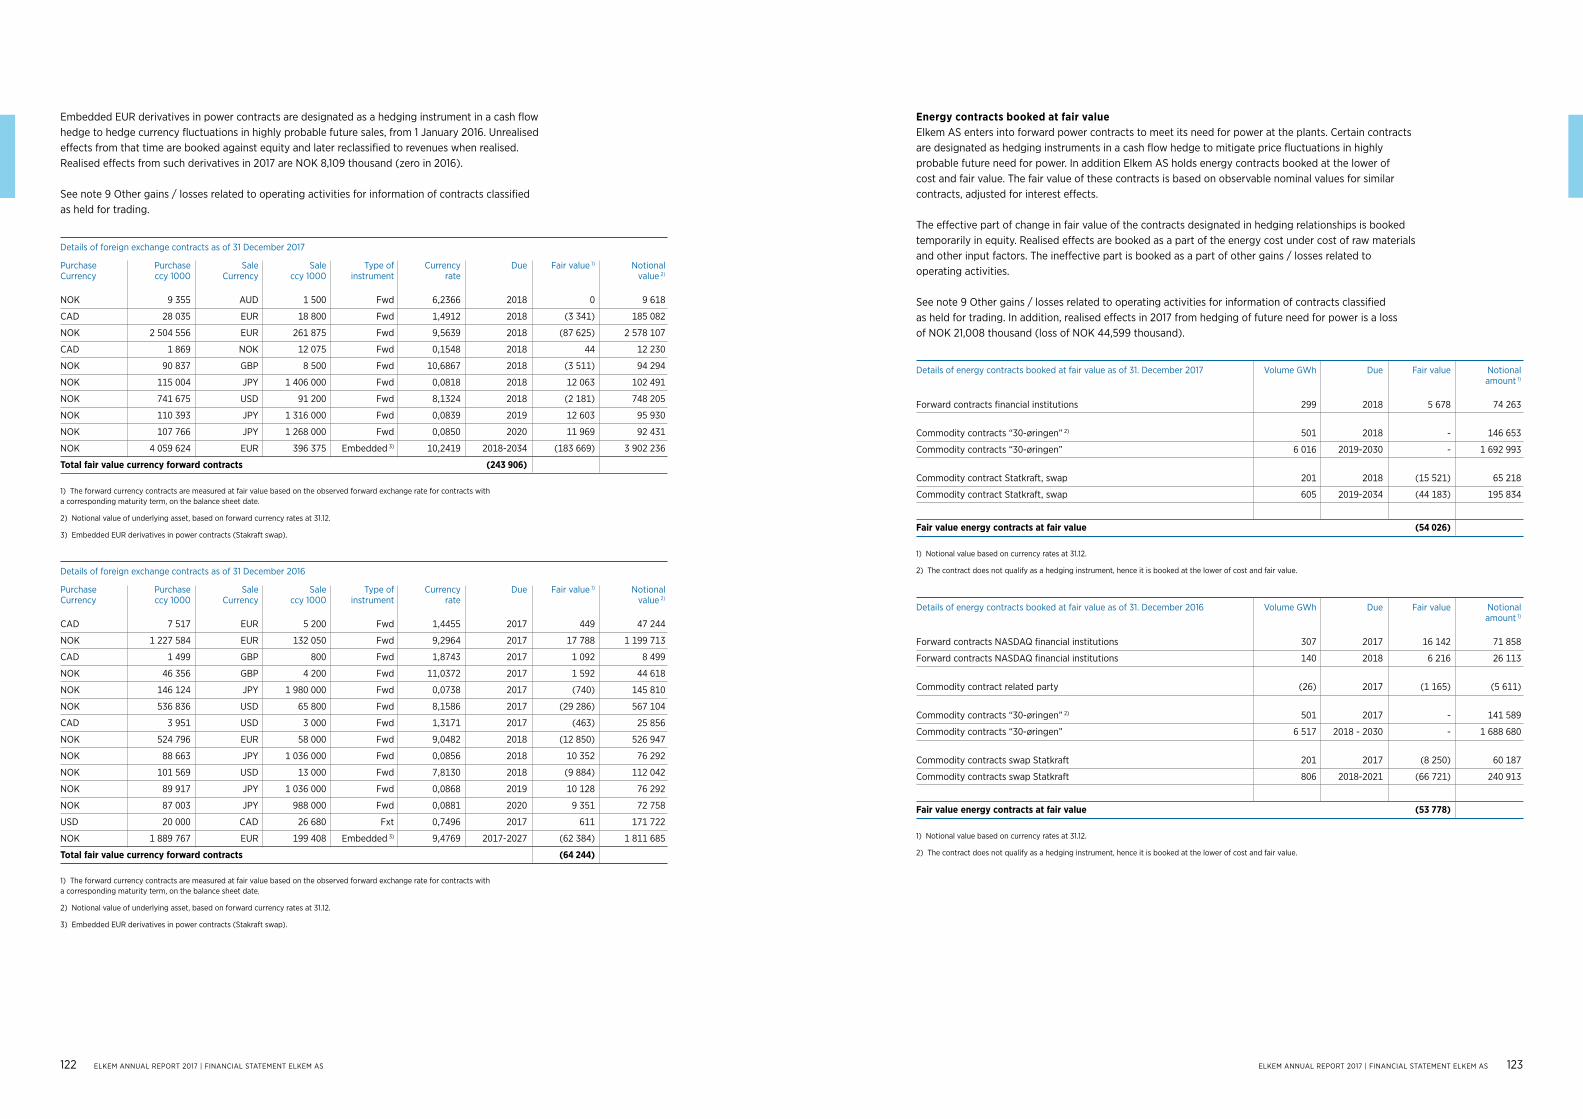
122 ELKEM ANNUAL REPORT 2017 | FINANCIAL STATEMENT ELKEM AS ELKEM ANNUAL REPORT 2017 | FINANCIAL STATEMENT ELKEM AS 123
Embedded EUR derivatives in power contracts are designated as a hedging instrument in a cash flow hedge to hedge currency fluctuations in highly probable future sales, from 1 January 2016. Unrealised effects from that time are booked against equity and later reclassified to revenues when realised.Realised effects from such derivatives in 2017 are NOK 8,109 thousand (zero in 2016).
See note 9 Other gains / losses related to operating activities for information of contracts classified as held for trading.
Energy contracts booked at fair valueElkem AS enters into forward power contracts to meet its need for power at the plants. Certain contracts are designated as hedging instruments in a cash flow hedge to mitigate price fluctuations in highly probable future need for power. In addition Elkem AS holds energy contracts booked at the lower of cost and fair value. The fair value of these contracts is based on observable nominal values for similar contracts, adjusted for interest effects.
The effective part of change in fair value of the contracts designated in hedging relationships is booked temporarily in equity. Realised effects are booked as a part of the energy cost under cost of raw materials and other input factors. The ineffective part is booked as a part of other gains / losses related to operating activities.
See note 9 Other gains / losses related to operating activities for information of contracts classified as held for trading. In addition, realised effects in 2017 from hedging of future need for power is a loss of NOK 21,008 thousand (loss of NOK 44,599 thousand).
Details of foreign exchange contracts as of 31 December 2017
Purchase Purchase Sale Sale Type of Currency Due Fair value 1) Notional Currency ccy 1000 Currency ccy 1000 instrument rate value 2)
NOK 9 355 AUD 1 500 Fwd 6,2366 2018 0 9 618
CAD 28 035 EUR 18 800 Fwd 1,4912 2018 (3 341) 185 082
NOK 2 504 556 EUR 261 875 Fwd 9,5639 2018 (87 625) 2 578 107
CAD 1 869 NOK 12 075 Fwd 0,1548 2018 44 12 230
NOK 90 837 GBP 8 500 Fwd 10,6867 2018 (3 511) 94 294
NOK 115 004 JPY 1 406 000 Fwd 0,0818 2018 12 063 102 491
NOK 741 675 USD 91 200 Fwd 8,1324 2018 (2 181) 748 205
NOK 110 393 JPY 1 316 000 Fwd 0,0839 2019 12 603 95 930
NOK 107 766 JPY 1 268 000 Fwd 0,0850 2020 11 969 92 431
NOK 4 059 624 EUR 396 375 Embedded 3) 10,2419 2018-2034 (183 669) 3 902 236
Total fair value currency forward contracts (243 906)
Details of foreign exchange contracts as of 31 December 2016
Purchase Purchase Sale Sale Type of Currency Due Fair value 1) Notional Currency ccy 1000 Currency ccy 1000 instrument rate value 2)
CAD 7 517 EUR 5 200 Fwd 1,4455 2017 449 47 244
NOK 1 227 584 EUR 132 050 Fwd 9,2964 2017 17 788 1 199 713
CAD 1 499 GBP 800 Fwd 1,8743 2017 1 092 8 499
NOK 46 356 GBP 4 200 Fwd 11,0372 2017 1 592 44 618
NOK 146 124 JPY 1 980 000 Fwd 0,0738 2017 (740) 145 810
NOK 536 836 USD 65 800 Fwd 8,1586 2017 (29 286) 567 104
CAD 3 951 USD 3 000 Fwd 1,3171 2017 (463) 25 856
NOK 524 796 EUR 58 000 Fwd 9,0482 2018 (12 850) 526 947
NOK 88 663 JPY 1 036 000 Fwd 0,0856 2018 10 352 76 292
NOK 101 569 USD 13 000 Fwd 7,8130 2018 (9 884) 112 042
NOK 89 917 JPY 1 036 000 Fwd 0,0868 2019 10 128 76 292
NOK 87 003 JPY 988 000 Fwd 0,0881 2020 9 351 72 758
USD 20 000 CAD 26 680 Fxt 0,7496 2017 611 171 722
NOK 1 889 767 EUR 199 408 Embedded 3) 9,4769 2017-2027 (62 384) 1 811 685
Total fair value currency forward contracts (64 244)
1) The forward currency contracts are measured at fair value based on the observed forward exchange rate for contracts with a corresponding maturity term, on the balance sheet date.
2) Notional value of underlying asset, based on forward currency rates at 31.12.
3) Embedded EUR derivatives in power contracts (Stakraft swap).
1) Notional value based on currency rates at 31.12.
2) The contract does not qualify as a hedging instrument, hence it is booked at the lower of cost and fair value.
1) Notional value based on currency rates at 31.12.
2) The contract does not qualify as a hedging instrument, hence it is booked at the lower of cost and fair value.
1) The forward currency contracts are measured at fair value based on the observed forward exchange rate for contracts with a corresponding maturity term, on the balance sheet date.
2) Notional value of underlying asset, based on forward currency rates at 31.12.
3) Embedded EUR derivatives in power contracts (Stakraft swap).
Details of energy contracts booked at fair value as of 31. December 2017 Volume GWh Due Fair value Notional amount 1)
Forward contracts financial institutions 299 2018 5 678 74 263
Commodity contracts “30-øringen” 2) 501 2018 - 146 653
Commodity contracts “30-øringen” 6 016 2019-2030 - 1 692 993
Commodity contract Statkraft, swap 201 2018 (15 521) 65 218
Commodity contract Statkraft, swap 605 2019-2034 (44 183) 195 834
Fair value energy contracts at fair value (54 026)
Details of energy contracts booked at fair value as of 31. December 2016 Volume GWh Due Fair value Notional amount 1)
Forward contracts NASDAQ financial institutions 307 2017 16 142 71 858
Forward contracts NASDAQ financial institutions 140 2018 6 216 26 113
Commodity contract related party (26) 2017 (1 165) (5 611)
Commodity contracts “30-øringen” 2) 501 2017 - 141 589
Commodity contracts “30-øringen” 6 517 2018 - 2030 - 1 688 680
Commodity contracts swap Statkraft 201 2017 (8 250) 60 187
Commodity contracts swap Statkraft 806 2018-2021 (66 721) 240 913
Fair value energy contracts at fair value (53 778)

124 ELKEM ANNUAL REPORT 2017 | FINANCIAL STATEMENT ELKEM AS ELKEM ANNUAL REPORT 2017 | FINANCIAL STATEMENT ELKEM AS 125
2017 Trade sales Trade Services Services Interest Interest purchases sales purchases income expenses Bluestar Elkem International Co., Ltd. S.A. - - 11 547 - 308 -
Other related parties within China National Bluestar group - - 325 - - -
Subsidiaries 1 137 788 (1 772 414) 252 513 (168 152) 41 177 (19 921)
Joint arrangements and associates - - - (133 862) 148 -
Total 1 137 788 (1 772 414) 264 385 (302 015) 41 633 (19 921)
2016 Trade sales Trade Services Services Interest Interest purchases sales purchases income expenses Bluestar Elkem International Co., Ltd. S.A. - - 718 - - -
Other related parties within China National Bluestar group 73 495 (10 695) 61 919 (12 332) - -
Subsidiaries 1 232 237 (1 474 347) 118 860 (156 470) 50 509 (21 158)
Joint arrangements and associates - - - (113 649) 155 -
Total 1 305 731 (1 485 042) 181 498 (282 452) 50 664 (21 158)
28 | Related party transaction
100% of the shares in Elkem AS is held by Bluestar Elkem International Co., Ltd S.A. Details of transactions between Elkem AS and other related parties are disclosed below.
Information about transactions between related parties Elkem follows internationally accepted principles for transactions between related parties. In general, Elkem seeks to use transaction based methods (comparable uncontrolled price, cost plus and resale price method) in order to set the price for the transaction. The majority of the transactions between related parties relate to products involving:
• Raw materials (quartz) from quarries to plants• Electrode paste from Carbon plants to FeSi and Silicon plants• Surplus raw materials between plants• Ad-hoc supplies of finished goods to Elkem’s internal distributors• Purchase of short and deep sea transport• Sale of management and technology services• Sale of power supply• Rent of plant facilities and related services
Elkem’s set-up for sales is based on an agent structure, rather than a distribution network. Elkem has also sourced companies that purchase key raw materials and other supplies from selected suppliers world-wide. In both activities above, the transaction between the related parties is a delivered service, either sales-service or sourcing-service. Additionally, Elkem has internal help chains that are established to serve several operating units more efficiently.
Elkem AS also have both long-term receivables and long-term payables to related parties. The group loans are normally interest-bearing and interest is calculated based on interbank rates (for example NIBOR) and a margin.
Commitments with related partiesElkem AS have no commitments to related parties.
Transactions with key management personnelInformation on transactions with key management personnel is included in note 5 Employee benefit expenses.
The current CO2 compensation programme will end in 2020.
Loans from/to related parties 31.12.17 31.12.16 Non-current loans from Other related parties within China National Bluestar group (6 869) (6 339)
Non-current loans from subsidiaries (157 489) (111 904)
Current loans from subsidiaries (2 030 323) (1 616 239)
Non-current deposit subsidiaries 883 258 717 922
Other receivables from subsidiaries 214 102 68 744
Non-current loans to joint arrangements and associates 7 246 7 098
Current loans to joint arrangements and associates - -
Accounts receivables Bluestar Elkem International Co., Ltd. S.A. 621 354
Accounts receivables other related parties within China National Bluestar group 201 189
Accounts receivables subsidiaries 306 127 244 669
Accounts receivables joint arrangements and associates - -
Accounts payables from other related parties within China National Bluestar group (1 077) (1 077)
Accounts payables from subsidiaries (365 963) (176 007)
Accounts payables from joint arrangements and associates (10 039) (12 656)
Elkem has received the following government grants 2017 2016 Funding from the Norwegian government R&D 30 444 20 364
CO2 Compensation from the Norwegian Environment Agency 60 495 84 418
Funding related to energy recovery 14 188 27 741
Other government grants 393 86
Total government grants received 105 520 132 609
Elkem has received the following grants from other 2017 2016 Norwegian NOx fund for reduced emission of NOx 1) 6 150 48 777
Other grants received other than government 2 500 250
Total other grants received 8 650 49 027
29 | Grants
1) The industry in Norway pays a fee for their emission of NOx to the Norwegian NOx fund. The fund is self-financed by the fee and their purpose is to support projects that reduces the NOx emission from the industry in Norway.
Grants received is included in the financial statement as follows:
Other operating income 93 831 107 520
Deduction of carrying amount of fixed assets 20 339 74 116
Total 114 170 181 636
Receivables related to grants 74 535 113 677
Deferred income related to grants (3 007) (6 252)
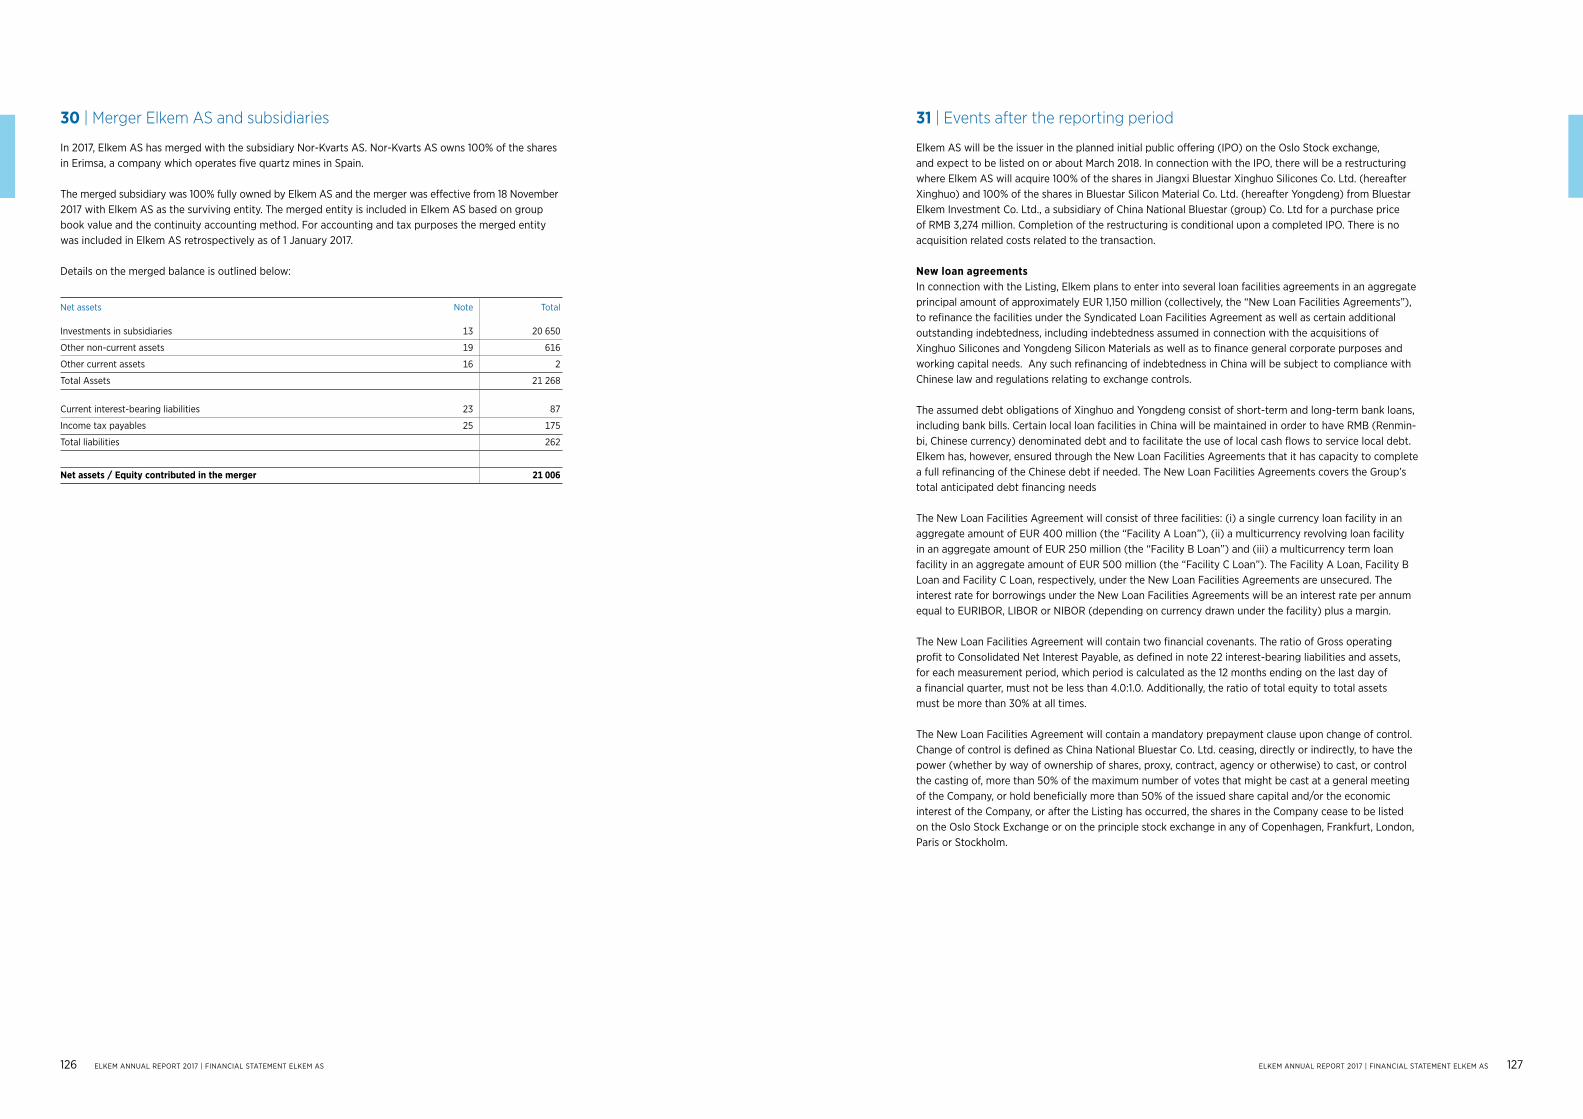
126 ELKEM ANNUAL REPORT 2017 | FINANCIAL STATEMENT ELKEM AS ELKEM ANNUAL REPORT 2017 | FINANCIAL STATEMENT ELKEM AS 127
30 | Merger Elkem AS and subsidiaries 31 | Events after the reporting period
In 2017, Elkem AS has merged with the subsidiary Nor-Kvarts AS. Nor-Kvarts AS owns 100% of the shares in Erimsa, a company which operates five quartz mines in Spain.
The merged subsidiary was 100% fully owned by Elkem AS and the merger was effective from 18 November 2017 with Elkem AS as the surviving entity. The merged entity is included in Elkem AS based on group book value and the continuity accounting method. For accounting and tax purposes the merged entity was included in Elkem AS retrospectively as of 1 January 2017.
Details on the merged balance is outlined below:
Elkem AS will be the issuer in the planned initial public offering (IPO) on the Oslo Stock exchange, and expect to be listed on or about March 2018. In connection with the IPO, there will be a restructuring where Elkem AS will acquire 100% of the shares in Jiangxi Bluestar Xinghuo Silicones Co. Ltd. (hereafter Xinghuo) and 100% of the shares in Bluestar Silicon Material Co. Ltd. (hereafter Yongdeng) from Bluestar Elkem Investment Co. Ltd., a subsidiary of China National Bluestar (group) Co. Ltd for a purchase price of RMB 3,274 million. Completion of the restructuring is conditional upon a completed IPO. There is no acquisition related costs related to the transaction.
New loan agreementsIn connection with the Listing, Elkem plans to enter into several loan facilities agreements in an aggregate principal amount of approximately EUR 1,150 million (collectively, the “New Loan Facilities Agreements”), to refinance the facilities under the Syndicated Loan Facilities Agreement as well as certain additional outstanding indebtedness, including indebtedness assumed in connection with the acquisitions of Xinghuo Silicones and Yongdeng Silicon Materials as well as to finance general corporate purposes and working capital needs. Any such refinancing of indebtedness in China will be subject to compliance with Chinese law and regulations relating to exchange controls. The assumed debt obligations of Xinghuo and Yongdeng consist of short-term and long-term bank loans, including bank bills. Certain local loan facilities in China will be maintained in order to have RMB (Renmin-bi, Chinese currency) denominated debt and to facilitate the use of local cash flows to service local debt. Elkem has, however, ensured through the New Loan Facilities Agreements that it has capacity to complete a full refinancing of the Chinese debt if needed. The New Loan Facilities Agreements covers the Group’s total anticipated debt financing needs
The New Loan Facilities Agreement will consist of three facilities: (i) a single currency loan facility in an aggregate amount of EUR 400 million (the “Facility A Loan”), (ii) a multicurrency revolving loan facility in an aggregate amount of EUR 250 million (the “Facility B Loan”) and (iii) a multicurrency term loan facility in an aggregate amount of EUR 500 million (the “Facility C Loan”). The Facility A Loan, Facility B Loan and Facility C Loan, respectively, under the New Loan Facilities Agreements are unsecured. The interest rate for borrowings under the New Loan Facilities Agreements will be an interest rate per annum equal to EURIBOR, LIBOR or NIBOR (depending on currency drawn under the facility) plus a margin.
The New Loan Facilities Agreement will contain two financial covenants. The ratio of Gross operating profit to Consolidated Net Interest Payable, as defined in note 22 interest-bearing liabilities and assets, for each measurement period, which period is calculated as the 12 months ending on the last day of a financial quarter, must not be less than 4.0:1.0. Additionally, the ratio of total equity to total assets must be more than 30% at all times.
The New Loan Facilities Agreement will contain a mandatory prepayment clause upon change of control. Change of control is defined as China National Bluestar Co. Ltd. ceasing, directly or indirectly, to have the power (whether by way of ownership of shares, proxy, contract, agency or otherwise) to cast, or control the casting of, more than 50% of the maximum number of votes that might be cast at a general meeting of the Company, or hold beneficially more than 50% of the issued share capital and/or the economic interest of the Company, or after the Listing has occurred, the shares in the Company cease to be listed on the Oslo Stock Exchange or on the principle stock exchange in any of Copenhagen, Frankfurt, London, Paris or Stockholm.
Net assets Note Total Investments in subsidiaries 13 20 650
Other non-current assets 19 616
Other current assets 16 2
Total Assets 21 268
Current interest-bearing liabilities 23 87
Income tax payables 25 175
Total liabilities 262
Net assets / Equity contributed in the merger 21 006

128 ELKEM ANNUAL REPORT 2017 | FINANCIAL STATEMENT ELKEM AS ELKEM ANNUAL REPORT 2017 | FINANCIAL STATEMENT ELKEM AS 129
Auditor’s report
128 ELKEM ANNUAL REPORT 2017 | AUDITOR’S REPORT AUDITOR’S REPORT | FINANCIAL STATEMENT ELKEM AS 129

130 ELKEM ANNUAL REPORT 2017 | FINANCIAL STATEMENT ELKEM AS ELKEM ANNUAL REPORT 2017 | FINANCIAL STATEMENT ELKEM AS 131
EDITOR: Odd-Geir LyngstadTEXT: Elkem
DESIGN: Burson-MarstellerPHOTO: Nicolas Tourrenc / Elkem, iStock
PRINT: gelato.com130 ELKEM ANNUAL REPORT 2017 | AUDITOR’S REPORT

Elkem AS
VISITING ADDRESS:Drammensveien 169 0277 Oslo, Norway
POSTAL ADDRESS:P.O.Box 334 Skøyen NO -0213 Oslo
TELEPHONE: +47 22 45 01 00 FAX: +47 22 45 01 55www.elkem.com