First quarter report 2021 1 | P a g e - Elkem
25
First quarter report 2021 1 | P a g e
Transcript of First quarter report 2021 1 | P a g e - Elkem

First quarter report 2021 1 | P a g e

First quarter report 2021 2 | P a g e
Contents
Highlights 1st quarter 2021 ............................................................................................................................................. 3
Key figures ..................................................................................................................................................................... 3
Delivering on growth and profitability ............................................................................................................................ 4
Financial review ............................................................................................................................................................. 5
Group results ............................................................................................................................................................. 5
Cash flow ................................................................................................................................................................... 5
Financial position ....................................................................................................................................................... 6
Segments ....................................................................................................................................................................... 7
Silicones ..................................................................................................................................................................... 7
Silicon Products ......................................................................................................................................................... 7
Carbon Solutions ....................................................................................................................................................... 7
Outlook for the second quarter ...................................................................................................................................... 8
Condensed consolidated interim statement of profit or loss ......................................................................................... 9
Condensed consolidated interim statement of comprehensive income ...................................................................... 10
Condensed consolidated interim statement of financial position ................................................................................ 11
Condensed consolidated interim statement of cash flows .......................................................................................... 12
Condensed consolidated interim statement of changes in equity ............................................................................... 13
Notes to the condensed consolidated interim financial statements ............................................................................ 14
Note 1 General information, basis for preparation and judgements, estimates and assumptions .......................... 14
Note 2 Operating segments ..................................................................................................................................... 14
Note 3 Fixed assets, right-of-use assets, goodwill and intangible assets ............................................................... 17
Note 4 Other items ................................................................................................................................................... 18
Note 5 Finance income and expenses .................................................................................................................... 19
Note 6 Interest-bearing assets and liabilities ........................................................................................................... 19
Note 7 Cash flow hedging ........................................................................................................................................ 20
Note 8 Number of shares ......................................................................................................................................... 20
Appendix - Alternative performance measures (APMs) .......................................................................................... 22

First quarter report 2021 3 | P a g e
Highlights 1st quarter 2021 ▪ Elkem is delivering on its growth strategy and ambition to be a leading integrated provider of silicones solutions
▪ The operating revenue for the first quarter reached another all-time high with the best quarterly result since third quarter 2018
▪ The board has approved a strategic expansion of the Silicones plant in China to strengthen Elkem’s position in the fastest growing silicones market and to support the specialisation strategy
▪ The market outlook is positive in all major regions, based on good demand and attractive prices
Key figures
(NOK million, except where specified) 1Q 2021 1Q 2020 YTD 2021 YTD 2020 FY 2020
Total operating income 7,193 5,798 7,193 5,798 24,691
EBITDA 1,231 590 1,231 590 2,684
EBITDA margin (%) 17 % 10 % 17 % 10 % 11 %
EBIT 806 197 806 197 957
Profit (loss) for the period (1)684 251 684 251 239
Earning per share (EPS) (NOK per share) 1.17 0.43 1.17 0.43 0.41
Equity ratio (%) 41 % 40 % 41 % 40 % 41 %
Net interest-bearing debt (NIBD) 7,668 6,772 7,668 6,772 8,058
Cash flow from operations 590 -88 590 -88 1,522
ROCE - annualised (%) 17 % 4 % 17 % 4 % 5 %(1) Owners of the parent's share of prof it (loss)

First quarter report 2021 4 | P a g e
Delivering on growth and profitability In the first quarter of 2021, Elkem delivered all-time high operating income and the best quarterly result since the third quarter 2018. The strong results reflected Elkem’s growth and specialisation strategy in a market with attractive fundamentals and its strong culture for operational excellence. On 26 April, Elkem approved a strategic expansion in China, the world’s fastest-growing silicones market. The NOK 3.8 billion project will further support Elkem’s growth and specialisation strategy. Elkem’s total operating income for the first quarter 2021 was NOK 7,193 million, which was another all-time high and up 24% from the corresponding quarter last year. Earnings before interest, taxes, depreciation and amortisation (EBITDA) amounted to NOK 1,231 million in the quarter, which was more than doubled compared to first quarter 2020 and the best since the third quarter 2018. Earnings per share (EPS) was NOK 1.17 in the quarter. Elkem’s main business segments all showed a strong development in the first quarter 2021. Strong demand in all major regions has positively impacted sales volumes and realised prices. Silicones prices in China have increased to attractive levels during the first quarter. In March, Elkem also announced global price increases for silicones. For silicon and ferrosilicon the market prices have risen consistently during the first quarter and reached the highest levels in several years. Also, the market for carbon products was good driven by strong global steel markets. Elkem’s operational performance was strong in the quarter with high and stable production. The productivity improvement programme with the target to realise annual cost improvements of more than NOK 350 million was still progressing ahead of plan and reached an annual run rate of NOK 230 million by end of first quarter. Elkem continues to deliver on its growth strategy and ambition to be a leading integrated provider of silicones solutions. On 26 April 2021, the board approved a NOK 3.8 billion strategic expansion of the Xinghuo Silicones plant in China to strengthen Elkem’s position in the fastest growing silicones market and to further support the specialisation strategy. In addition to supporting Elkem´s specialisation and growth strategy, the project will also significantly improve Elkem’s overall cost position and environmental profile based on state-of-the-art technology. The project will increase the plant’s production capacity by more than 50% for high quality upstream products and enable Elkem to further drive specialty volumes by increasing access to high purity products and critical by-products where Elkem has developed an attractive backlog of downstream products to offtake upstream volumes. The project will also significantly improve the environmental performance by reducing the energy consumption by 57%, reducing use of raw materials by 11% and giving a 30% reduction of solid waste. Improved environmental performance was one of the key decision parameters for Elkem, in line with the company’s high ambition level on Environment, Social and Governance (ESG) factors. During the first quarter, Elkem also successfully raised MNOK 1,250 in the bond market for refinancing of debt maturities December 2021. The bond transaction was significantly oversubscribed and demonstrated Elkem’s strong financial position. Elkem’s advanced battery materials activities are proceeding according to plan. The pilot plant in Kristiansand was commissioned in April 2021 and has started industrial scale production. Qualification processes are ongoing with several battery cell producers. The potential large-scale battery materials plant at Herøya represents a significant green value creation opportunity and Elkem is currently in the process to invite external investors to take part in the project. This will enable a swift development, and position Elkem as a significant and attractive supplier to the battery industry. The group’s equity as at 31 March 2021 amounted to NOK 13,440 million, which gave a ratio of equity to total assets of 41%. Net interest-bearing debt was NOK 7,668 million, which gave a ratio of net interest-bearing debt to EBITDA of 2.3 times. The leverage ratio has been improved over the past two quarters due to higher EBITDA and lower net-interest bearing debt. Elkem had cash and cash equivalents of NOK 4,183 million as at 31 March 2021 and undrawn credit lines of close to NOK 3,900 million. The market sentiment is positive for all divisions and Elkem will continue to develop its market positions and focus on sustainable growth. The silicones market is strong and market reference prices in China are expected to remain at attractive levels in the second quarter. The announced global price increases will gradually become effective from the second quarter. The result for the Silicones division will be impacted by maintenance stops in China and France. The combined EBITDA effect is limited to NOK 150 million. Demand and market prices for silicon- and ferrosilicon-based products are expected to level out. However, realised contract prices will increase due to time-lag effects. Steel and ferroalloys markets are still strong, giving continued attractive market conditions for carbon products.
First quarter report 2021 5 | P a g e
Financial review
Group results
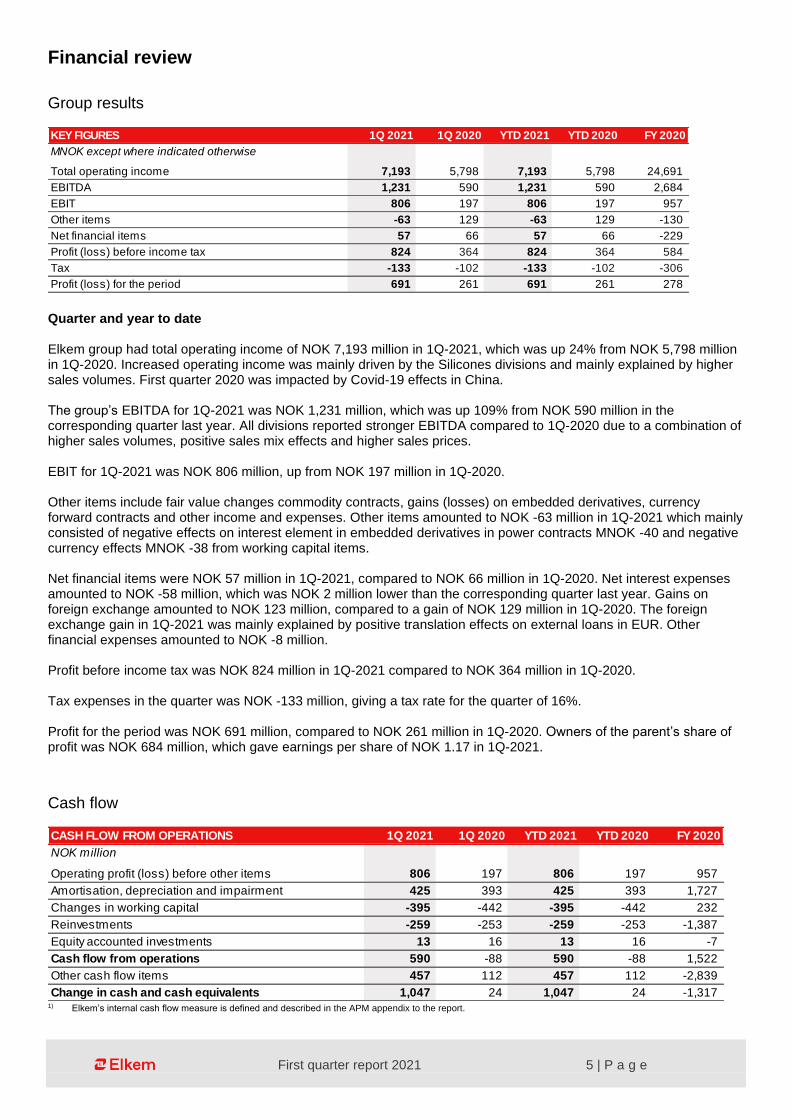
Quarter and year to date Elkem group had total operating income of NOK 7,193 million in 1Q-2021, which was up 24% from NOK 5,798 million in 1Q-2020. Increased operating income was mainly driven by the Silicones divisions and mainly explained by higher sales volumes. First quarter 2020 was impacted by Covid-19 effects in China. The group’s EBITDA for 1Q-2021 was NOK 1,231 million, which was up 109% from NOK 590 million in the corresponding quarter last year. All divisions reported stronger EBITDA compared to 1Q-2020 due to a combination of higher sales volumes, positive sales mix effects and higher sales prices. EBIT for 1Q-2021 was NOK 806 million, up from NOK 197 million in 1Q-2020. Other items include fair value changes commodity contracts, gains (losses) on embedded derivatives, currency forward contracts and other income and expenses. Other items amounted to NOK -63 million in 1Q-2021 which mainly consisted of negative effects on interest element in embedded derivatives in power contracts MNOK -40 and negative currency effects MNOK -38 from working capital items. Net financial items were NOK 57 million in 1Q-2021, compared to NOK 66 million in 1Q-2020. Net interest expenses amounted to NOK -58 million, which was NOK 2 million lower than the corresponding quarter last year. Gains on foreign exchange amounted to NOK 123 million, compared to a gain of NOK 129 million in 1Q-2020. The foreign exchange gain in 1Q-2021 was mainly explained by positive translation effects on external loans in EUR. Other financial expenses amounted to NOK -8 million. Profit before income tax was NOK 824 million in 1Q-2021 compared to NOK 364 million in 1Q-2020. Tax expenses in the quarter was NOK -133 million, giving a tax rate for the quarter of 16%. Profit for the period was NOK 691 million, compared to NOK 261 million in 1Q-2020. Owners of the parent’s share of profit was NOK 684 million, which gave earnings per share of NOK 1.17 in 1Q-2021.
Cash flow
1) Elkem’s internal cash flow measure is defined and described in the APM appendix to the report.
KEY FIGURES 1Q 2021 1Q 2020 YTD 2021 YTD 2020 FY 2020
MNOK except where indicated otherwise
Total operating income 7,193 5,798 7,193 5,798 24,691
EBITDA 1,231 590 1,231 590 2,684
EBIT 806 197 806 197 957
Other items -63 129 -63 129 -130
Net financial items 57 66 57 66 -229
Profit (loss) before income tax 824 364 824 364 584
Tax -133 -102 -133 -102 -306
Profit (loss) for the period 691 261 691 261 278
CASH FLOW FROM OPERATIONS 1Q 2021 1Q 2020 YTD 2021 YTD 2020 FY 2020
NOK million
Operating profit (loss) before other items 806 197 806 197 957
Amortisation, depreciation and impairment 425 393 425 393 1,727
Changes in working capital -395 -442 -395 -442 232
Reinvestments -259 -253 -259 -253 -1,387
Equity accounted investments 13 16 13 16 -7
Cash flow from operations 590 -88 590 -88 1,522
Other cash flow items 457 112 457 112 -2,839
Change in cash and cash equivalents 1,047 24 1,047 24 -1,317

First quarter report 2021 6 | P a g e
Quarter and year to date Cash flow from operations was NOK 590 million in 1Q-2021, compared to NOK -88 million in 1Q-2020. The increase was mainly explained by higher operating profit. Reinvestments were NOK 259 million in 1Q-2021, which amounted to 62% of depreciation and amortisation (D&A). Strategic investments were included in other cash flow items and amounted to NOK 184 million, down from NOK 200 million in 1Q-2020. The strategic investments were primarily related to Silicones R&D centre, silicones specialisation projects and the battery materials project. Elkem raised new bond loans of NOK 1,250 million in February 2021. In connection with the bond issue, Elkem bought back NOK 419 million in the existing bond loan maturing in December 2021. The net proceeds from the bond transactions mainly explained the positive effect in other cash flow items. Change in cash and cash equivalents was NOK 1,047 million in 1Q-2021. Currency exchange differences was NOK -19 million. As at 31 March 2021 the total cash and cash equivalents amounted to NOK 4,183 million.
Financial position
1) Excluding receivables from related parties, loans to external parties, accrued interest income and non-current other restricted deposits
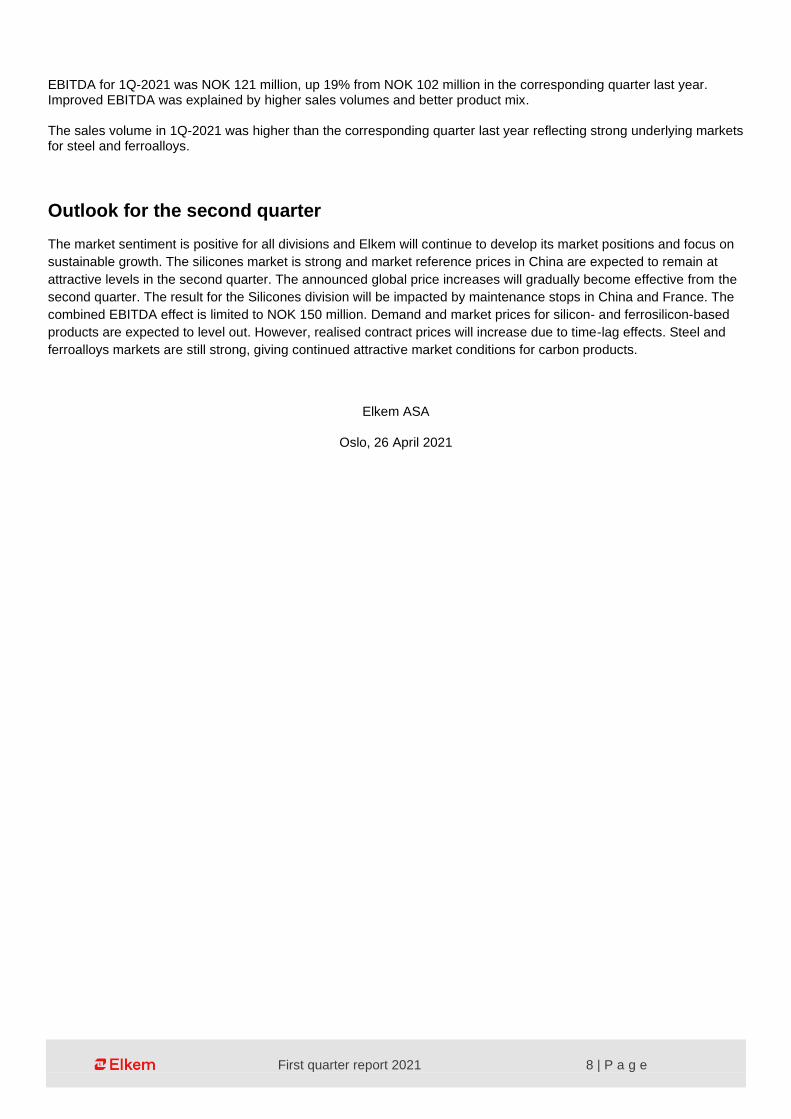
Quarter and year to date Elkem’s equity as at 31 March 2021 was NOK 13,440 million, up NOK 805 million from 31 December 2020. Profit for the period was NOK 691 million. Other comprehensive income and other changes in equity was NOK 114 million. The equity ratio as at 31 March 2021 was 41%. Compared to year-end 2020, the equity ratio was unchanged. Net-interest bearing debt as at 31 March 2021 was NOK 7,668 million, which was down NOK 390 million from 31 December 2020. The reduction was explained by translation effects from a stronger NOK and positive cash flow. The leverage ratio was 2.3 times as at 31 March 2021.
FINANCIAL POSITION FY 2020
Total equity (NOK million) 12,635
Equity ratio (%) 41 %
EPS (NOK per share) 0.41
Net interest bearing debt (NOK million) (1) 8,058
Leverage ratio based on LTM EBITDA (ratio) 3.0
1.17 0.43
13,440 13,243
41 % 40 %
1Q 2021 1Q 2020
2.82.3
7,668 6,772

First quarter report 2021 7 | P a g e
Segments
Silicones
Quarter and year to date The Silicones division had total operating income of NOK 3,723 million in 1Q-2021 up 48% from NOK 2,523 million in 1Q-2020. Increased operating income was mainly explained by higher sales volumes. The first quarter 2020 was negatively impacted by Covid-19 effects in China. EBITDA for 1Q-2021 was NOK 587 million, up 209% from 1Q-2020. The significant EBITDA improvement was mainly explained by higher sales volumes but also positive impact from higher sales prices. The strong sales volumes reflect good underlying demand in all major regions and strong operational performance.
Silicon Products
Quarter and year to date The Silicon Products division had total operating income of NOK 3,136 million in 1Q-2021, which was up 6% from 1Q-
2020. Higher operating income was mainly explained by higher sales prices and higher sales volumes.
The EBITDA for Silicon Products was NOK 526 million in 1Q-2021, up 41% from NOK 374 million in 1Q-2020. Higher EBITDA was explained by higher sales prices and higher sales volumes. In addition, the EBITDA was positively impacted by sales mix effects with higher sales of speciality products. The strong sales volumes and positive sales mix effects reflect demand recovery and tight supply/demand market balance.
Carbon Solutions
Quarter and year to date The Carbon Solutions division reported total operating income of NOK 486 million in 1Q-2021, up 2% from 1Q-2020. Higher sales volumes in the quarter were partly offset by currency effects due to stronger NOK.
KEY FIGURES 1Q 2021 1Q 2020 YTD 2021 YTD 2020 FY 2020
MNOK except where indicated otherwise
Total operating income 3,723 2,523 3,723 2,523 12,800
EBITDA 587 190 587 190 1,326
EBITDA margin 16 % 8 % 16 % 8 % 10 %
Sales volume (thousand mt) 107 70 107 70 372
KEY FIGURES 1Q 2021 1Q 2020 YTD 2021 YTD 2020 FY 2020
MNOK except where indicated otherwise
Total operating income 3,136 2,945 3,136 2,945 10,804
EBITDA 526 374 526 374 1,221
EBITDA margin 17 % 13 % 17 % 13 % 11 %
Sales volume (thousand mt)1) 131 125 131 125 479
1) Excluding Microsilica and quartz
KEY FIGURES 1Q 2021 1Q 2020 YTD 2021 YTD 2020 FY 2020
MNOK except where indicated otherwise
Total operating income 486 475 486 475 1,870
EBITDA 121 102 121 102 438
EBITDA margin 25 % 21 % 25 % 21 % 23 %
Sales volume (thousand mt ) 70 65 70 65 256
First quarter report 2021 8 | P a g e
EBITDA for 1Q-2021 was NOK 121 million, up 19% from NOK 102 million in the corresponding quarter last year. Improved EBITDA was explained by higher sales volumes and better product mix. The sales volume in 1Q-2021 was higher than the corresponding quarter last year reflecting strong underlying markets for steel and ferroalloys.
Outlook for the second quarter The market sentiment is positive for all divisions and Elkem will continue to develop its market positions and focus on
sustainable growth. The silicones market is strong and market reference prices in China are expected to remain at
attractive levels in the second quarter. The announced global price increases will gradually become effective from the
second quarter. The result for the Silicones division will be impacted by maintenance stops in China and France. The
combined EBITDA effect is limited to NOK 150 million. Demand and market prices for silicon- and ferrosilicon-based
products are expected to level out. However, realised contract prices will increase due to time-lag effects. Steel and
ferroalloys markets are still strong, giving continued attractive market conditions for carbon products.
Elkem ASA
Oslo, 26 April 2021

First quarter report 2021 9 | P a g e
Condensed consolidated interim statement of profit or loss
Year
Amounts in NOK million Note 2021 2020 2021 2020 2020
Revenue 2 7,033 5,672 7,033 5,672 24,025
Other operating income 2 153 123 153 123 631
Share of profit (loss) from equity accounted companies 2 7 4 7 4 35
Total operating income 7,193 5,798 7,193 5,798 24,691
Raw materials and energy for production (3,506) (2,921) (3,506) (2,921) (12,858)
Employee benefit expenses (1,072) (1,021) (1,072) (1,021) (4,028)
Other operating expenses (1,384) (1,266) (1,384) (1,266) (5,121)
Amortisation and depreciation 3 (420) (393) (420) (393) (1,710)
Impairment losses 3 (5) (0) (5) (0) (17)
Operating profit (loss) before other items 806 197 806 197 957
Other items 4 (63) 129 (63) 129 (130)
Operating profit (loss) 743 326 743 326 827
Share of profit (loss) from equity accounted financial investments 25 (29) 25 (29) (15)
Finance income 5 5 9 5 9 31
Foreign exchange gains (losses) 5 123 129 123 129 17
Finance expenses 5 (71) (71) (71) (71) (278)
Profit (loss) before income tax 824 364 824 364 584
Income tax (expenses) benefits (133) (102) (133) (102) (306)
Profit (loss) for the period 691 261 691 261 278
Attributable to:
Non-controlling interests' share of profit (loss) 8 10 8 10 39
Owners of the parent's share of profit (loss) 684 251 684 251 239
Year
Earnings per share 2021 2020 2021 2020 2020
Basic earnings per share in NOK 1.17 0.43 1.17 0.43 0.41
Diluted earnings per share in NOK 1.17 0.43 1.17 0.43 0.41
Weighted average number of outstanding shares (million) 8 582 581 582 581 581
Weighted average number of outstanding shares diluted (million) 8 586 581 586 581 581
First quarter
First quarter Year to date
Year to date

First quarter report 2021 10 | P a g e
Condensed consolidated interim statement of comprehensive income
Year
Amounts in NOK million 2021 2020 2021 2020 2020
Profit (loss) for the period 691 261 691 261 278
Remeasurement of defined benefit pension plans 2 - 2 - (55)
Tax effects on remeasurements of defined benefit pension plans (0) - (0) - 13
Change in fair value of equity instruments - (1) - (1) 7
Share of other comprehensive income (loss) from equity accounted companies - - - - -
Total items that will not be reclassified to profit or loss 1 (1) 1 (1) (35)
Currency translation differences (206) 1,556 (206) 1,556 47
Hedging of net investment in foreign operations 132 (453) 132 (453) (168)
Tax effects hedging of net investment in foreign operations (29) 100 (29) 100 37
Cash flow hedges 272 (1,501) 272 (1,501) (148)
Tax effects on cash flow hedges (60) 330 (60) 330 33
Share of other comprehensive income (loss) from equity accounted companies 5 (9) 5 (9) (11)
Total items that may be reclassified to profit or loss 114 23 114 23 (211)
Other comprehensive income, net of tax 116 23 116 23 (245)
Total comprehensive income 807 284 807 284 32
Attributable to:
Non-controlling interests' share of comprehensive income 6 25 6 25 40
Owners of the parent's share of comprehensive income 801 258 801 258 (8)
Total comprehensive income 807 284 807 284 32
First quarter Year to date

First quarter report 2021 11 | P a g e
Condensed consolidated interim statement of financial position
Amounts in NOK million Note 31 March 2021 31 March 2020 31 December 2020
ASSETS
Property, plant and equipment 3 13,971 14,840 14,131
Right-of-use assets 3 875 657 875
Goodwill 3 909 521 919
Other intangible assets 3 1,330 882 1,319
Deferred tax assets 89 295 96
Investments in equity accounted companies 194 118 183
Derivatives 7 131 9 59
Other assets 363 411 432
Total non-current assets 17,861 17,733 18,015
Inventories 5,323 5,867 5,241
Trade receivables 3,324 2,823 2,796
Derivatives 7 165 13 148
Other assets 1,336 1,188 1,212
Restricted deposits 6 368 363 322
Cash and cash equivalents 6 4,183 4,744 3,154
Total current assets 14,700 14,998 12,873
TOTAL ASSETS 32,561 32,731 30,888
EQUITY AND LIABILITIES
Paid-in capital 8 6,338 6,623 6,296
Retained earnings 7,001 6,498 6,232
Non-controlling interests 100 122 108
Total equity 13,440 13,243 12,635
Interest-bearing liabilities 6 8,332 9,434 7,189
Deferred tax liabilities 402 140 336
Employee benefit obligations 658 674 679
Derivatives 7 194 741 252
Provisions and other liabilities 325 274 326
Total non-current liabilities 9,910 11,263 8,782
Trade payables 3,452 3,403 3,157
Income tax payables 161 24 65
Interest-bearing liabilities 6 2,690 1,255 3,292
Bills payable 6 1,196 1,189 1,053
Employee benefit obligations 657 695 740
Derivatives 7 20 744 101
Provisions and other liabilities 1,035 916 1,064
Total current liabilities 9,210 8,226 9,471
TOTAL EQUITY AND LIABILITIES 32,561 32,731 30,888

First quarter report 2021 12 | P a g e
Condensed consolidated interim statement of cash flows
Year
Amounts in NOK million Note 2021 2020 2021 2020 2020
Operating profit (loss) 743 326 743 326 827
Amortisation, depreciation and impairment 3 425 393 425 393 1,727
Changes in working capital (395) (442) (395) (442) 232
Equity accounted companies 13 16 13 16 (7)
Changes fair value of derivatives 43 (146) 43 (146) (196)
Changes in provisions, bills receivables and other 221 674 221 674 (69)
Interest payments received 5 9 5 9 28
Interest payments made (55) (59) (55) (59) (239)
Income taxes paid (253) (52) (253) (52) (192)
Cash flow from operating activities 747 720 747 720 2,111
Investments in property, plant and equipment and intangible assets (616) (561) (616) (561) (2,201)
Acquisition of subsidiaries, net of cash acquired - - - - (1,032)
Acquisition/capital contribution of/to joint ventures - - - - (40)
Other investments / sales 1 (1) 1 (1) 10
Cash flow from investing activities (615) (562) (615) (562) (3,262)
Dividends paid to non-controlling interests (14) - (14) - (29)
Dividends paid to owners - - - - (349)
Capital increase 39 - 39 - -
Net sale (purchase) of treasury shares (36) - (36) - -
Net changes in bills payable and restricted deposits 99 91 99 91 113
Payment of lease liabilities (32) (27) (32) (27) (104)
New interest-bearing loans and borrowings 1,544 426 1,544 426 1,636
Payment of interest-bearing loans and borrowings (685) (624) (685) (624) (1,433)
Cash flow from financing activities 916 (134) 916 (134) (166)
Change in cash and cash equivalents 1,047 24 1,047 24 (1,317)
Currency exchange differences (19) 224 (19) 224 (24)
Cash and cash equivalents opening balance 3,154 4,496 3,154 4,496 4,496
Cash and cash equivalents closing balance 4,183 4,744 4,183 4,744 3,154
First quarter Year to date
First quarter report 2021 13 | P a g e
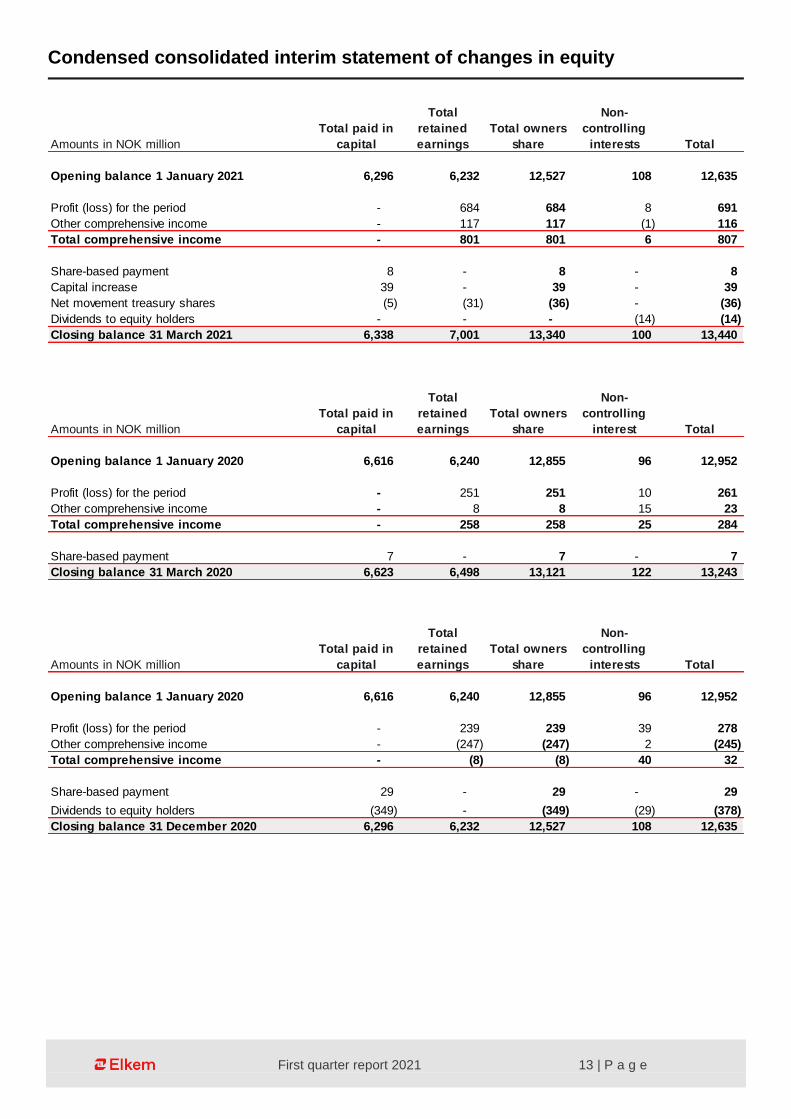
Condensed consolidated interim statement of changes in equity
Amounts in NOK million
Total paid in
capital
Total
retained
earnings
Total owners
share
Non-
controlling
interests Total
Opening balance 1 January 2021 6,296 6,232 12,527 108 12,635
Profit (loss) for the period - 684 684 8 691
Other comprehensive income - 117 117 (1) 116
Total comprehensive income - 801 801 6 807
Share-based payment 8 - 8 - 8
Capital increase 39 - 39 - 39
Net movement treasury shares (5) (31) (36) - (36)
Dividends to equity holders - - - (14) (14)
Closing balance 31 March 2021 6,338 7,001 13,340 100 13,440
Amounts in NOK million
Total paid in
capital
Total
retained
earnings
Total owners
share
Non-
controlling
interest Total
Opening balance 1 January 2020 6,616 6,240 12,855 96 12,952
Profit (loss) for the period - 251 251 10 261
Other comprehensive income - 8 8 15 23
Total comprehensive income - 258 258 25 284
Share-based payment 7 - 7 - 7
Closing balance 31 March 2020 6,623 6,498 13,121 122 13,243
Amounts in NOK million
Total paid in
capital
Total
retained
earnings
Total owners
share
Non-
controlling
interests Total
Opening balance 1 January 2020 6,616 6,240 12,855 96 12,952
Profit (loss) for the period - 239 239 39 278
Other comprehensive income - (247) (247) 2 (245)
Total comprehensive income - (8) (8) 40 32
Share-based payment 29 - 29 - 29
Dividends to equity holders (349) - (349) (29) (378)
Closing balance 31 December 2020 6,296 6,232 12,527 108 12,635

First quarter report 2021 14 | P a g e
Notes to the condensed consolidated interim financial statements
Note 1 General information, basis for preparation and judgements, estimates and assumptions Elkem ASA is a limited liability company located in Norway and whose shares are publicly traded at Oslo Stock Exchange. Elkem ASA’s condensed consolidated financial statements for the first quarter of 2021 were approved at the meeting of the board of directors on 26 April 2021. Following changes in Elkem's internal reporting to management the composition of Elkem's operating and reporting segments has changed as of the first quarter of 2021. Segment information for prior periods has been restated to align with the new segment presentation. For further information see Note 2 Operating segments to these Condensed interim financial statements. Basis for preparation The condensed consolidated interim financial statements comprise Elkem ASA and its subsidiaries (Elkem/the Group) and the Group’s investments in associates and interests in joint arrangements. Elkem’s interim financial statements are prepared in accordance with International Financial Reporting Standards (IFRS) as endorsed by the European Union. The condensed interim statements are prepared in compliance with the International Accounting Standard (IAS) 34 Interim Financial Reporting and should be read in conjunction with the consolidated financial statements in Elkem’s Annual Report for 2020. The accounting policies applied are consistent with those applied in the annual consolidated financial statements 2020. The interim financial statements are unaudited. The presentation currency of Elkem is NOK (Norwegian krone). All financial information is presented in NOK million, unless otherwise stated. One or more columns included in the interim report may not add up to the total due to rounding. Judgements, estimates and assumptions The preparation of consolidated interim financial statements in conformity with IFRS requires management to make judgments, estimates and assumptions each reporting period. The main judgements, estimates and assumptions are described in the annual consolidated financial statements for 2020 (note 3).
Note 2 Operating segments Elkem has three reportable segments; Silicones, Silicon Products and Carbon Solutions. - The Silicones division produces and sells a range of silicone-based products across various sub-sectors
including release coatings, engineering elastomers, healthcare products, specialty fluids, emulsions and resins. - The Silicon Products division produces various grades of metallurgical silicon, ferrosilicon, foundry alloys and
microsilica for use in a wide range of end applications. - The Carbon Solutions division produces carbon electrode materials, lining materials and specialty carbon
products for metallurgical processes for the production of a range of metals. - Other comprise Elkem group management and centralised functions within finance, logistics, power purchase,
technology, digital office and strategic projects such as biocarbon and battery projects. - Eliminations comprise intersegment sales and profit. Transactions between operating segments are conducted
on an arm's length basis in a manner similar to transactions with third parties. In the first quarter of 2021, Elkem changed its internal reporting to management, impacting the composition of Elkem’s operating and reporting segments. To further streamline operations in China, Elkem Silicone Material (Lanzhou) Co., Ltd. (Yongdeng Silicon) is included in Silicones division from 1 January 2021, previously reported in Silicon Products division. Comparative figures are restated. Elkem identifies its segments according to the organisation and reporting structure used by group management. Segments performance are evaluated based on EBITDA and operating profit (loss) before other items (EBIT). EBITDA is defined as Elkem’s profit (loss) for the period, less income tax (expenses) benefits, finance expenses, foreign exchange gains (losses), finance income, share of profit from equity accounted financial investments, other items,

First quarter report 2021 15 | P a g e
impairment loss and amortisation and depreciation. Elkem's definition of EBITDA may be different from other companies. Elkem’s financing and taxes are managed on a group basis and are not allocated to operating segments.
First quarter 2021
Silicones
Silicon
Products
Carbon
Solutions Other
Elimi-
nations Total
Revenue from sale of goods 3,678 2,845 426 9 6,958
Other revenue 5 16 4 50 75
Other operating income 29 117 1 6 153
Share of profit from equity accounted companies - - - 7 7
Total operating income from external customers 3,713 2,977 430 72 7,193
Operating income from other segments 10 159 56 101 (326) -
Total operating income 3,723 3,136 486 174 (326) 7,193
Operating expenses (3,136) (2,610) (366) (192) 341 (5,963)
EBITDA 587 526 121 (18) 15 1,231
Operating profit (loss) before other items (EBIT) 332 393 100 (35) 15 806
First quarter 2020 *)
Silicones
Silicon
Products
Carbon
Solutions Other
Elimi-
nations Total
Revenue from sale of goods 2,483 2,719 414 (35) 5,581
Other revenue 7 19 3 62 92
Other operating income 25 81 2 15 123
Share of profit from equity accounted companies 0 0 - 4 4
Total operating income from external customers 2,515 2,819 419 45 5,798
Operating income from other segments 8 126 57 91 (282) -
Total operating income 2,523 2,945 475 136 (282) 5,798
Operating expenses (2,333) (2,571) (374) (203) 273 (5,208)
EBITDA 190 374 102 (67) (9) 590
Operating profit (loss) before other items (EBIT) (45) 245 82 (76) (9) 197
*) 2020 figures have been restated, see text above and note 1
Year to date 31 March 2021
Silicones
Silicon
Products
Carbon
Solutions Other
Elimi-
nations Total
Revenue from sale of goods 3,678 2,845 426 9 6,958
Other revenue 5 16 4 50 75
Other operating income 29 117 1 6 153
Share of profit from equity accounted companies - - - 7 7
Total operating income from external customers 3,713 2,977 430 72 7,193
Operating income from other segments 10 159 56 101 (326) -
Total operating income 3,723 3,136 486 174 (326) 7,193
Operating expenses (3,136) (2,610) (366) (192) 341 (5,963)
EBITDA 587 526 121 (18) 15 1,231
Operating profit (loss) before other items (EBIT) 332 393 100 (35) 15 806

First quarter report 2021 16 | P a g e
Year to date 31 March 2020 *)
Silicones
Silicon
Products
Carbon
Solutions Other
Elimi-
nations Total
Revenue from sale of goods 2,483 2,719 414 (35) 5,581
Other revenue 7 19 3 62 92
Other operating income 25 81 2 15 123
Share of profit from equity accounted companies 0 0 - 4 4
Total operating income from external customers 2,515 2,819 419 45 5,798
Operating income from other segments 8 126 57 91 (282) -
Total operating income 2,523 2,945 475 136 (282) 5,798
Operating expenses (2,333) (2,571) (374) (203) 273 (5,208)
EBITDA 190 374 102 (67) (9) 590
Operating profit (loss) before other items (EBIT) (45) 245 82 (76) (9) 197
*) 2020 figures have been restated, see text above and note 1
Year 2020 *)
Silicones
Silicon
Products
Carbon
Solutions Other
Elimi-
nations Total
Revenue from sale of goods 12,558 9,699 1,625 (217) 23,665
Other revenue 37 146 16 161 360
Other operating income 162 380 6 83 631
Share of profit from equity accounted companies - (1) - 36 35
Total operating income from external customers 12,757 10,224 1,647 64 24,691
Operating income from other segments 43 580 223 412 (1,258) -
Total operating income 12,800 10,804 1,870 476 (1,258) 24,691
Operating expenses (11,474) (9,582) (1,432) (743) 1,224 (22,007)
EBITDA 1,326 1,221 438 (267) (34) 2,684
Operating profit (loss) before other items (EBIT) 269 685 349 (312) (34) 957
*) 2020 figures have been restated, see text above and note 1

First quarter report 2021 17 | P a g e
Note 3 Fixed assets, right-of-use assets, goodwill and intangible assets
31 March 2021
Property, plant
and equipment
Right-of-use
assets Goodwill
Other intangible
assets
Cost
Opening balance 31,759 1,087 919 2,753
Additions 358 34 - 81
Reclassifications (2) - - 2
Disposals (33) (21) - (7)
Currency translation differences (358) (14) (11) (76)
Closing balance 31,725 1,085 909 2,753
Accumulated depreciation
Opening balance (15,043) (212) - (1,433)
Addition (348) (30) - (42)
Disposals 24 20 - 3
Currency translation differences 181 11 - 50
Closing balance (15,186) (211) - (1,422)
Impairment losses
Opening balance (2,584) - - (1)
Addition (1) - - (4)
Disposals 5 - - 4
Currency translation differences 13 - - 0
Closing balance (2,567) - - (1)
Net book value 31 March 2021 13,971 875 909 1,330
31 March 2020
Property, plant
and equipment
Right-of-use
assets Goodwill
Other intangible
assets
Cost
Opening balance 29,437 702 466 1,987
Additions 427 31 - 30
Reclassifications (4) (0) - 4
Disposals (18) (3) - (0)
Currency translation differences 3,265 91 55 284
Closing balance 33,107 820 521 2,305
Accumulated depreciation
Opening balance (13,668) (123) - (1,209)
Addition (337) (24) - (32)
Reclassifications (0) 0 - -
Disposals 9 2 - 0
Currency translation differences (1,281) (19) - (181)
Closing balance (15,278) (163) - (1,422)
Impairment losses
Opening balance (2,567) - - (1)
Disposals 3 - - -
Currency translation differences (426) - - (0)
Closing balance (2,990) - - (1)
Net book value 31 March 2020 14,840 657 521 882

First quarter report 2021 18 | P a g e
Note 4 Other items
1) In 2021 the fair value changes mainly relates to Elkem's platinum contracts. In previous periods the fair value changes mainly relates to
changes of the 30-øring power contract, see note 25 Financial assets and liabilities to the consolidated financial statements for the year ended 31 December 2020. Due to changes in the price structure of the 30-øringen contract from 2021, the contract is designated as a hedging instrument from 1 January 2021. This mean that fair value changes from 1 January 2021 is recognised as raw materials and energy for production in statement of profit or loss in the same period(s) as the hedged objects affects the profit or loss.
31 December 2020
Property, plant
and equipment
Right-of-use
assets Goodwill
Other intangible
assets
Cost
Opening balance 29,437 702 466 1,987
Additions 2,011 369 - 207
Reclassifications (21) - - 22
Business combinations 163 52 506 510
Disposals (364) (43) - (7)
Currency translation differences 532 7 (53) 33
Closing balance 31,759 1,087 919 2,753
Accumulated depreciation
Opening balance (13,668) (123) (1,209)
Additions (1,421) (115) (174)
Reclassifications - (1) -
Disposals 261 24 4
Currency translation differences (215) 3 (54)
Closing balance (15,043) (212) - (1,433)
Impairment losses
Opening balance (2,567) - (1)
Addition (17) - - -
Disposals 79 - - -
Currency translation differences (80) - - (0)
Closing balance (2,584) - - (1)
Net book value 31 December 2020 14,131 875 919 1,319
Year
2021 2020 2021 2020 2020
Change in fair value commodity contracts1)5 (85) 5 (85) (144)
Embedded EUR derivatives power contracts, interest element (40) 214 (40) 214 234
Ineffectiveness on cash flow hedges 1 0 1 0 (12)
Net foreign exchange gains (losses) - forward currency contracts 9 13 9 13 49
Operating foreign exchange gains (losses) (38) 191 (38) 191 (83)
Total other gains / (losses) (63) 332 (63) 332 44
Dividends from other shares 1 0 1 0 1
Change in fair value from other shares measured at fair value through profit or loss (1) (2) (1) (2) 0
Gains (losses) on disposal of subsidiaries - 0 - 0 -
Restructuring expenses - (199) - (199) (158)
Other 0 (3) 0 (3) (18)
Total other income / (expenses) (0) (203) (0) (203) (174)
Total other items (63) 129 (63) 129 (130)
Year to dateFirst quarter

First quarter report 2021 19 | P a g e
Note 5 Finance income and expenses
Note 6 Interest-bearing assets and liabilities
Year
2021 2020 2021 2020 2020
Interest income on loans and receivables 5 9 5 9 27
Other financial income 0 0 0 0 4
Total finance income 5 9 5 9 31
Foreign exchange gains (losses) 123 129 123 129 17
Interest expenses on interest-bearing liabilities measured at amortised cost (51) (58) (51) (58) (221)
Interest expenses from other items measured at amortised cost (5) (6) (5) (6) (22)
Interest expenses on lease liabilities (7) (5) (7) (5) (17)
Capitalised interest expenses 1 - 1 - 4
Unwinding of discounted liabilities (1) 0 (1) 0 (10)
Interest on net pension liabilities (1) (2) (1) (2) (7)
Other financial expenses (6) (1) (6) (1) (4)
Total finance expenses (71) (71) (71) (71) (278)
Net Finance income (expenses) 57 66 57 66 (229)
First quarter Year to date
31 March 2021 31 March 2020 31 December 2020
Lease liabilities 554 360 566
Loans from external parties, other than bank 3,157 4,295 1,996
Bank financing 4,621 4,779 4,627
Total non-current interest-bearing debt 8,332 9,434 7,189
Lease liabilities 107 91 97
Loans from external parties, other than banks 1,958 21 2,407
Bank financing, current 592 1,112 762
Accrued interest 33 31 27
Total current interest-bearing debt 2,690 1,255 3,292
Bills payable, current 1,196 1,189 1,053
Restricted deposits bills payable, current 363 358 315
Net bills payable 833 831 737
Cash and cash equivalents 4,183 4,744 3,154
Other restricted deposits, current 5 5 6
Other restricted deposits, non-current 40 43 39
Receivables from related parties 1 1 1
Loans to external parties 8 8 8
Accrued interest income 1 2 1
Total other interest-bearing assets 4,238 4,803 3,209
Net interest-bearing assets / (liabilities) (7,618) (6,718) (8,009)

First quarter report 2021 20 | P a g e
Note 7 Cash flow hedging Hedge Accounting Elkem is applying hedge accounting for parts of its forward currency contracts, certain parts of EUR loans, for embedded EUR derivatives in power contracts and for certain power contracts. Forward currency contracts and embedded derivatives are designated in a cash flow hedge to hedge currency fluctuations in highly probable future sales, mainly in USD and EUR. The power contracts designated as hedging instruments in a cash flow hedge of price fluctuations for highly probable future purchases. Hence, the effective part of change in fair value of the hedging instruments is booked against OCI and booked as an adjustment to revenue and energy for production respectively, when realised.
1) Hedge accounting is applied for some of the contracts /part of contracts.
See note 25 Financial assets and liabilities, note 26 Hedging and note 27 Financial risk to the consolidated financial statements for the year ended 31 December 2020.
Note 8 Number of shares The development in share capital and other paid-in equity is set out in the Condensed consolidated interim statement of changes in equity.
Derivatives as at 31 March 2021
Purchase contracts
Nominal
value Fair value
Hereof
recognised
in OCI
Within
1 year
Within
2 years
Within
3 years
Within
4 years or
more
Forward currency contracts 2,715 283 252 136 20 24 71
Embedded EUR derivatives 4,174 (68) (129) (15) (21) (23) (70)
Power contracts1)2,210 (144) (78) 17 (9) (11) (74)
Platinum contracts 35 12 - - - - -
Total derivatives 82 45 138 (10) (10) (73)
EUR loan designed as cash flow hedging instrument 160 (16) (5) (5) (5) -
Total 30 132 (15) (15) (73)
Effects to be recycled from OCI
Year
Realised effects hedge accounting, recycled from OCI 2021 2020 2021 2020 2020
Realised effects from forward currency contracts, Revenue 22 (37) 22 (37) (164)
Realised effects from embedded derivatives EUR, Revenue (9) (11) (9) (11) (45)
Realised effects from EUR loans, Revenue 0 0 0 0 (11)
Realised effects from power contracts, Raw materials and energy for production 31 (100) 31 (100) (450)
Total realised hedging effects recycled from OCI 44 (148) 44 (148) (670)
First quarter Year to date
Numbers are in million shares
Shares
outstanding
Treasury
shares
Total issued
shares
As at 1 January 2021 581,310,344 - 581,310,344
Capital increase 1,675,000 1,675,000
Increase treasury shares 1,000,000- 1,000,000 -
As at 31 March 2021 581,985,344 1,000,000 582,985,344
Year
Numbers are in million shares 2021 2020 2021 2020 2020
Weighted average number of shares outstanding 582,027,872 581,310,344 582,027,872 581,310,344 581,310,344
Effects of dilution from share-based payment 3,768,017 - 3,768,017 - 94,282
Weighted average number of outstanding shares diluted 585,795,889 581,310,344 585,795,889 581,310,344 581,404,626
First quarter Year to date

First quarter report 2021 21 | P a g e
In the annual general meeting held on 8 May 2020, the board of directors was granted an authorisation to repurchase
the company’s own shares within a total nominal value of up to NOK 290,655,172. The maximum amount that can be
paid for each share is NOK 150 and the minimum is NOK 1. The authorisation is valid until the annual general meeting
in 2021, but not later than 30 June 2021. The authorisation can be used to acquire shares as the board of directors
deems appropriate, provided however, that acquisition of shares shall not be by subscription. As at 31 March NOK 5
million of this authorisation was used, representing repurchase of 1,000,000 treasury shares for a total purchase price
of NOK 36 million.
In the annual general meeting held on 8 May 2020, the board of directors was granted an authorisation to increase the
company’s share capital with an amount up to NOK 290,655,172. The authorisation is valid until the annual general
meeting in 2021, but not later than 30 June 2021. The authorisation can be used to cover share capital increases
against contribution in kind and in connection with mergers.
In the annual general meeting held on 8 May 2020, the board of directors was granted an authorisation to increase the
share capital by up to NOK 40,000,000 to be used in connection with the issuance of new shares under share
incentive scheme. The authorisation is valid until the annual general meeting in 2021, but not later than 30 June 2021.
The authorisation does not cover capital increases against contribution in kind or capital increases in connection with
mergers. NOK 5,000,000 of this authorisation was used on 11 February 2021 in connection with exercise of share
options where 1,675,000 shares was issued at par value NOK 5. The subscription price was 23.53 per share, which
gives a capital increase of NOK 39 million.
On 29 July 2020 8,000,000 options are granted to members of the management and certain other key employees.
Each option gives the option holder the right to subscribe or purchase one share in the Elkem at an exercise price of
NOK 19.10, which is equal to the share price at closing on the first 20 working days of July 2020. The options will vest
over a period of three years from grant with one-third vesting each year and the first one-third vesting on 29 July 2021.
The options will expire two years after vesting, i.e. on 29 July 2023, 2024 and 2025, respectively. As at 31 March 2021
21,825,000 options are granted to members of the management and certain other key employees.

First quarter report 2021 22 | P a g e
Appendix - Alternative performance measures (APMs) An APM is defined as a financial measure of historical or future financial performance, financial position, or cash flows, other than a financial measure defined or specified in the applicable financial reporting framework (IFRS). Elkem uses EBITDA and EBITDA margin to measure operating performance at the group and segment level. In particular, Management regards EBIT and EBITDA as useful performance measures at segment level because income tax, finance expenses, foreign exchange gains (losses), finance income, other items are managed on a group basis and are not allocated to each segment. Elkem uses Cash flow from operations to measure the segments cash flow performance, this measure is excluding items that are managed on a group level. Elkem uses ROCE, or return on capital employed as measures of the development of the group’s return on capital. Elkem relies on these measures as part of its capital allocation strategy. Elkem uses net interest-bearing debt less non-current interest-bearing assets / EBITDA as leverage ratio for measuring the group's financial flexibility and ability for step-change growth and acquisitions. The APMs presented herein are not measurements of performance under IFRS or other generally accepted accounting principles and should not be considered as a substitute for measures of performance in accordance with IFRS. Because companies calculate the APMs presented herein differently, Elkem’s presentation of these APMs may not be comparable to similarly titled measures used by other companies. Elkem’s financial APMs, EBITDA and EBIT - EBITDA is defined as Elkem’s profit (loss) for the period, less income tax (expenses) benefits, finance expenses,
foreign exchange gains (losses), finance income, share of profit from equity accounted financial investments, other items, impairment loss and amortisation and depreciation.
- EBITDA margin is defined as EBITDA divided by total operating income. - EBIT, also referred to as operating profit (loss) before other items is defined as Elkem’s profit (loss) for the period,
less income tax (expenses) benefits, finance expenses, foreign exchange gains (losses), finance income, share of profit from equity accounted financial investments and other items.
Below is a reconciliation of EBIT and EBITDA
First quarter 2021
Silicones
Silicon
Products
Carbon
Solutions Other
Elimi-
nations Elkem
Profit (loss) for the period 691
Income tax (expense) benefit 133
Finance expenses 71
Foreign exchange gains (losses) (123)
Finance income (5)
Share of profit from equity accounted financial investments (25)
Other items 63
EBIT 332 393 100 (35) 15 806
Impairment losses 5
Amortisations and depreciations 420
EBITDA 587 526 121 (18) 15 1,231
First quarter 2020
Silicones
Silicon
Products
Carbon
Solutions Other
Elimi-
nations Elkem
Profit (loss) for the period 261
Income tax (expense) benefit 102
Finance expenses 71
Foreign exchange gains (losses) (129)
Finance income (9)
Share of profit from equity accounted financial investments 29
Other items (129)
EBIT (45) 245 82 (76) (9) 197
Impairment losses 0
Amortisations and depreciations 393
EBITDA 190 374 102 (67) (9) 590

First quarter report 2021 23 | P a g e
Elkem’s financial APMs, Cash flow from operations - Cash flow from operations is defined as cash flow from operating activities, less income taxes paid, interest
payments made, interest payments received, changes in provision, pension obligations and other, changes in fair value commodity contracts, other items (from the statement of profit or loss) and including reinvestments.
- Reinvestments generally consist of maintenance capital expenditure to maintain existing activities or that involve investments designed to improve health, safety or the environment.
- Strategic investments generally consist of investments which result in capacity increases at Elkem’s existing plants or that involve an investment made to meet demand in a new geographic or product area.
Year to date 31 March 2021
Silicones
Silicon
Products
Carbon
Solutions Other
Elimi-
nations Elkem
Profit (loss) for the year 691
Income tax (expense) benefit 133
Finance expenses 71
Foreign exchange gains (losses) (123)
Finance income (5)
Share of profit from equity accounted financial investments (25)
Other items 63
EBIT 332 393 100 (35) 15 806
Impairment losses 5
Amortisations and depreciations 420
EBITDA 587 526 121 (18) 15 1,231
Year to date 31 March 2020
Silicones
Silicon
Products
Carbon
Solutions Other
Elimi-
nations Elkem
Profit (loss) for the year 261
Income tax (expense) benefit 102
Finance expenses 71
Foreign exchange gains (losses) (129)
Finance income (9)
Share of profit from equity accounted financial investments 29
Other items (129)
EBIT (45) 245 82 (76) (9) 197
Impairment losses 0
Amortisations and depreciations 393
EBITDA 190 374 102 (67) (9) 590
Year 2020
Silicones
Silicon
Products
Carbon
Solutions Other
Elimi-
nations Elkem
Profit (loss) for the year 278
Income tax (expense) benefit 306
Finance expenses 278
Foreign exchange gains (losses) (17)
Finance income (31)
Share of profit from equity accounted financial investments 15
Other items 130
EBIT 269 685 349 (312) (34) 957
Impairment losses 17
Amortisations and depreciations 1,710
EBITDA 1,326 1,221 438 (267) (34) 2,684

First quarter report 2021 24 | P a g e
1) Periodisations reflect the difference between payment date and accounting date of the investment.
Elkem’s financial APMs, ROCE - ROCE, Return on capital employed, is defined as EBIT divided by the average capital employed, where capital
employed comprises working capital, property, plant and equipment, right-of-use assets, investments equity
accounted companies and trade payables and prepayments related to purchase of non-current assets.
- Working capital is defined as accounts receivable, inventory, other current assets, accounts payable, employee
benefit obligations and other current liabilities. Accounts receivable are defined as trade receivables less bills
receivable. Other current assets are defined as other current assets less current receivables to related parties,
current interest-bearing receivables, tax receivables, grants receivable and accrued interest income. Accounts
payable are defined as trade payables less CAPEX payables. Other current liabilities are defined as provisions
and other current liabilities less current provisions, contingent considerations, contract obligations, and liabilities to
related parties.
- Capital employed consists of working capital as defined above, property, plant and equipment, right-of-use assets,
investments equity accounted companies, grants payable, trade payables and prepayments related to purchase of
non-current assets.
- Average capital employed is defined as the average of the opening and ending balance of capital employed for
the relevant reporting period.
Below is a reconciliation of working capital and capital employed, which are used to calculate ROCE:
Year
2021 2020 2021 2020 2020
Reinvestments (259) (253) (259) (253) (1,387)
Strategic investments (184) (200) (184) (200) (835)
Periodisations1)(173) (108) (173) (108) 22
Investments in property, plant and equipment and intangible assets (616) (561) (616) (561) (2,201)
First quarter Year to date
Year
2021 2020 2021 2020 2020
Cash flow from operating activities 747 720 747 720 2,111
Income taxes paid 253 52 253 52 192
Interest payments made 55 59 55 59 239
Interest payments received (5) (9) (5) (9) (28)
Changes in provisions, bills receivables and other (221) (674) (221) (674) 69
Changes in fair value commodity contracts (43) 146 (43) 146 196
Other items 63 (129) 63 (129) 130
Reinvestments (259) (253) (259) (253) (1,387)
Cash flow from operations 590 (88) 590 (88) 1,522
First quarter Year to date

First quarter report 2021 25 | P a g e
Elkem’s financial APMs, Leverage ratio
- Net interest-bearing debt that is used to measured leverage ratio is excluding non-current other restricted
deposits, receivables from related parties, loans to external parties and accrued interest income. These assets are
not easily available to be used to finance the group's operations. Below a calculation of Elkem's leverage ratio.
Working capital bridge from statutory accounts to company definition
31 March 2021 31 March 2020 31 December 2020
Inventories 5,323 5,867 5,241
Trade receivables 3,324 2,823 2,796
Bills receivable (878) (503) (920)
Accounts receivable 2,446 2,320 1,875
Other assets, current 1,336 1,188 1,212
Other receivables to related parties interest-free (0) (0) (0)
Grants receivables (274) (253) (525)
Tax receivables (303) (160) (105)
Accrued interest (1) (2) (1)
Other current assets included in working capital 758 773 581
Trade payables 3,452 3,403 3,157
Trade payables related to purchase of non-current assets (209) (249) (448)
Accounts payable included in working capital 3,244 3,154 2,709
Employee benefit obligations 657 695 740
Provisions and other liabilities, current 1,035 916 1,064
Provisions, contingent considerations and contract obligations (275) (274) (287)
Liabilities to related parties (15) (79) (64)
Other current liabilities included in working capital 744 563 713
Working capital 3,883 4,549 3,536
Property, plant and equipment 13,971 14,840 14,131
Right-of-use assets 875 657 875
Investments equity accounted companies 194 118 183
Grants payable (15) (16) (15)
Trade payables and prepayments related to purchase of non-current
assets
(203) (239) (381)
Capital employed 18,705 19,909 18,329
31 March 2021 31 March 2020 31 December 2020
Net interest-bearing assets / (liabilities) (7,618) (6,718) (8,009)
Other restricted deposits, non-current (40) (43) (48)
Receivables from related parties (1) (1)
Loans to external parties (8) (8)
Accrued interest income (1) (2) (1)
Net interest-bearing debt (7,668) (6,772) (8,058)
EBITDA (LTM) 3,324 2,394 2,684
Leverage ratio 2.3 2.8 3.0