ANNUAL REPORT 2017 - benteler.com · BENTELER Electric Drive System referred to above we offer ......
113
ANNUAL REPORT 2017
Transcript of ANNUAL REPORT 2017 - benteler.com · BENTELER Electric Drive System referred to above we offer ......
ANNUAL REPORT 2017

Key Performance Indicators
2017 2016
External revenue € Million 7,856 7,423
Employees including trainees* 27,955 27,917
Personnel expenses € Million 1,445 1,431
Investments € Million 429 440
Depreciation and amortization € Million 279 226
Cash flow from profit € Million 403 338
Shareholders' equity € Million 1,102 1,092
Equity ratio % 21.4 22.9
Total assets € Million 5,138 4,766
EBIT € Million 206.8 191.2
Consolidated profit € Million 100.8 110.9
Europe 61.6 %
Africa 2.0 %Automotive 78.4 % 6.0 % South America
8.9 % Distribution11.2 % Asia/Pacific
12.7 % Steel/Tube
19.2 % North America
REVENUE BY SEGMENT 1.2
FINANCIAL YEAR 1 JANUARY - 31 DECEMBER 1.1
REVENUE BY REGION 1.3
*annual average; measured as full-time equivalents; excluding contract workers
2 THE BENTELER GROUP Key Performance Indicators ANNUAL REPORT 2017
BENTELER is a global company that develops, manufactures and sells prod-ucts, systems and services for the automotive, energy and mechanical engineering sectors. Our 30,000 employees at 144 sites in 39 countries off er fi rst-class manufacturing and sales expertise, with passion and customer focus. We leverage our size and international scope to serve the market responsively jointly with our business partners.
BENTELER is owned by the fourth generation of its founding family. Under the holding company BENTELER International AG, registered in Salzburg, Aus-tria, business operations are organized in three Divisions: BENTELER Automo-tive, BENTELER Steel/Tube and BENTELER Distribution. With technological excellence and eff ective implementation we develop solutions that make a diff erence – for customers, employees and society.
BENTELER. The family of driven professionals. Since 1876.
Foreword by the Executive Board __________________________________________________________________________ 4
Personnel matters ________________________________________________________________________________________________________________________________________________________________________________________________ 6
Locations _________________________________________________________________________________________________________________________________________________________________________________________________________________________________________________________________________ 7
Group management report ___________________________________________________________________________________________________________________________ 8
Consolidated fi nancial statements _________________________________________________________ 33
Short profile of the BENTELER Group
Contents
3 ANNUAL REPORT 2017THE BENTELER GROUP Contents

Foto: Jens Erbeck (l. to r.): Guido Huppertz, Ralf Göttel, Isabel Diaz Rohr,
Executive Board of BENTELER International AG.
4 ANNUAL REPORT 2017THE BENTELER GROUP Foreword by the Executive Board

Ladies and Gentlemen, How long does it take to create a world first? From the first spark of inspiration to the finished prototype? In our case pre-cisely 125 days: we developed the BENTELER Electric Drive Sys-tem (BEDS) in barely 18 weeks in 2017. It is one of the ways we are responding to the megatrend of e-mobility. It is also an example of our innovative capability, focus on solutions and implementation strengths, which are precisely what our cus-tomers need. It shows that we are able to take advantage of our size and broad knowledge base to look ahead and serve the market jointly with our business partners.
In short, it proves that we can respond to changing markets and take on intense competition. That is demonstrated by the figures for the 2017 financial year: in all three Divisions BENTELER achieved significant revenue growth, outpacing the market. Our EBIT was also well above the 2016 level.
The Automotive Division increased its revenue – particularly in the growth markets of Asia, Eastern Europe and Brazil, where it was able to take advantage of market opportunities due to its proximity to customers. That is also reflected in the result, which improved for the fourth time in succession. Particularly noteworthy are the regions of Mercosur and North America, where the team managed to achieve a turnaround as a result of operational and commercial measures.
In the Steel/Tube Division we are seeing the effects of increas- ed demand for OCTG tubes, which led to a significant increase in revenues compared to 2016, as well as the effects of the measures aimed at increasing efficiency in the Operating Unit Welded. That is reflected in the figures: despite the budgeted start-up costs for the hot rolling mill in Shreveport, USA, earn-ings remained at the previous year's level – hence above the expected level.
The Distribution Division is benefiting from the improved mar-ket situation and the rise in the level of prices: Revenues from
classic tube trading were substantially higher. The expansion of our sales expertise and the optimization of our logistics – for example with the new central warehouse in Duisburg – have also paid off.
These successes can be traced back to the 2022 strategy devel-oped in the previous year. This is based on three pillars: con-tinued consistent development of the core business, growth focused on future technologies and markets, as well as a cor-porate culture geared to performance.
─ BENTELER has wide expertise in materials, which we deploy to meet individual customer requirements – from exclusive niche products to large-scale series production. As an interna-tional group we concentrate on the latter: BENTELER Automo-tive therefore mainly produces components made of hot-formed steel and aluminum. The entire interest in the fiber composite components manufacturer BENTELER-SGL was there-fore sold at the end of 2017 to the former partner, SGL Group. For the same reason we recently signed the agreement to sell the foundry at Farsund in Norway.
─ We target our investments where they hold most promise over the long term. For the Automotive Division e-mobility offers opportunities particularly in China: within a few years one electric vehicle in two around the world will have been manufactured in Asia. BENTELER is already one of the leading manufacturers of battery trays; with the BENTELER Electric Drive System referred to above we offer attractive system solutions for both established OEMs and new market participants. And we have operated in China since 2002. We will continue to deepen the many years of good collaboration with Chinese partners – and both open new plants and strengthen our development expertise in Asia. For the Steel/Tube Division the opportunities are to be found in oil and gas exploration in the USA, as can be seen from the rising volumes produced at the hot rolling mill at
Shreveport, which rose more than threefold within a year. The Distribution Division, with its central processing center in Slovakia, is benefiting from the strong growth in automo-tive production in Eastern Europe.
─ BENTELER has always been successful when it has acted with courage, ambition and respect. Our corporate values – courage, ambition and respect – therefore make up the third pillar of the strategy. They enable BENTELER to be a reliable and at the same time responsive market participant – qualities that will also be important in the future. We continue to operate in a competitive environment, but the market is sound and the global economy is growing. We are strategically well placed and our order book is promis-ing. We are therefore confident of achieving our targets and will continue to pursue our 2022 strategy consistently in 2018.
Success – as was demonstrated again last year – is a shared endeavor. The Executive Board of BENTELER International AG, together with the Division managements, therefore wishes to express its gratitude to our employees for their commit-ment, to our customers for their continuing trust and to our shareholders for their valued support.
Salzburg, March 2018
Ralf Göttel, Chief Executive Officer
Guido Huppertz, Chief Financial Officer
Isabel Diaz Rohr, Member of the Executive Board
BENTELER International AG
5 ANNUAL REPORT 2017THE BENTELER GROUP Foreword by the Executive Board

THE EXECUTIVE BOARD OF BENTELER INTERNATIONAL AG
Ralf Göttel, Schönau am Königssee, Germany from April 1, 2017 (Chairman of the Executive Board, responsibilities: Strategy & M&A, Compliance & Board Affairs, Procure-ment, Divisions)
Guido Huppertz, Bergheim bei Salzburg, Austriafrom February 1, 2017 (responsibilities: Finance & Controlling, Legal & Insurance, Tax, Internal Audit)
Isabel Diaz Rohr, Schönau am Königssee, Germany(responsibilities: Human Resources, IT, Communication/Marketing)
Hubertus Benteler, Salzburg, Austria, until March 31, 2017
Boris Gleißner, Seekirchen, Austria until January 31, 2017
Personnel Matters
THE SUPERVISORY BOARD OF BENTELER INTERNATIONAL AG
Dr. Ralf Bethke, Deidesheim, Germany Chairman (until May 2017, Chairman of the Supervisory Board of K+S AG, Kassel, Germany)
Dr. Ulrich Dohle, Stuttgart, Germany Vice Chairman (former Chairman of the Executive Board of Rolls-Royce Power Systems AG, Friedrichshafen, Germany)
Boudewijn Beerkens, Amsterdam, Netherlands until March 31, 2017 (CSOO of COFRA Holding AG, Zug, Switzerland)
Hubertus Benteler, Salzburg, Austria from April 1, 2017 (until March 31, 2017, Chairman of the Executive Board of BENTELER International AG)
Christian Caspar, Zürich, Switzerland (Director Emeritus at McKinsey & Company, Inc., Zürich, Switzerland)
Axel Prym, Roetgen, Germany (former Managing Director of William Prym GmbH & Co. KG, Stolberg, Germany)
Frederik Vaubel, Düsseldorf, Germany (Managing Director of Vaubel Entwicklungs- und Beteiligungs GmbH, Düsseldorf, Germany)
THE MANAGEMENT BOARDS OF THE DIVISIONS
BENTELER AUTOMOTIVE
Laurent Favre (CEO from April 1, 2017)Oliver Lang (from April 1, 2017)James T. Sheehan (until December 31, 2017)Dr. Christian Terlinde (until August 31, 2017)Ralf Göttel (until March 31, 2017)
BENTELER STEEL / TUBE
Dr. Andreas Hauger (CEO)André Sombecki Christian Wiethüchter (from November 1, 2017)
BENTELER DISTRIBUTION
Dr. Arthur Jaunich (CEO from October 1, 2017)Torsten O. BeerHeike E. Weishaupt (from October 1, 2017)Dr. Jost A. Massenberg (until September 30, 2017)
MANAGEMENT BOARD OF BENTELER BUSINESS SERVICES GMBH
Dirk Ringelkamp André Sombecki
6 THE BENTELER GROUP Personnel Matters ANNUAL REPORT 2017

1.4
PLANTS
SUBSIDIARIES AND TRADING COMPANIES
83
61 COUNTRIES
39CLOSE TO YOU WORLDWIDE
With 144 locations worldwide, BENTELER is a business partner that is always by your side. But we believe customer proxi-mity is about more than just geography: BENTELER supports its partners strategi-cally – from the product idea through to series production. With many years of expertise, cross-sector know-how and an ambition to develop the ideal solution.
BENTELER Locations
7 ANNUAL REPORT 2017THE BENTELER GROUP BENTELER Locations

ANNUAL REPORT 2017GROUP MANAGEMENT REPORT Contents
Contents
Business and General Conditions 9
Result of Operations 11
Assets and Financial Position 15
Risk Report 19
Report on Research and Development Activities 23
Report on Environmental and Energy Management 26
HR Report 27
Forecast 29
Disclaimer 32
GROUP MANAGEMENT REPORT
8

ANNUAL REPORT 2017GROUP MANAGEMENT REPORT Business and General Conditions
The global economy is currently experiencing a power ful upturn. According to the Institute for the World Economy (IfW) in Kiel, global production gath-ered pace markedly throughout 2017. The 3.8% growth in global production marks the strongest rise since 2011. Business activity is trending higher simultaneously in almost all major economies.
Towards the end of 2016 global trade picked up sharply and continued to expand appreciably in the course of 2017, taking growth in the summer of 2017 to 5% compared to the previous year. An important factor in the revival was the considerably stronger expansion of external trade in the Asia region, particularly China. The marked expansion of investments worldwide was also significant.
GDP grew by 6.8% in 2017 compared to the previ-ous year in China, by 6.4% in India and by 5.2% in the emerging markets of East Asia. The economies of resource-rich countries in Latin America and Russia consolidated further in 2017, recording moderate growth of 1.4% and 1.7% respectively. This is due particularly to a revival of production in the com-modity-exporting countries. The recession in Brazil came to an end and production in Russia is now clearly trending higher again.
Growth in the developed countries is robust at 2.4%, partly driven by strong demand growth in developing and emerging markets. Growth stands at 2.3% in the USA and 2.4% in the euro area.
Business and General Conditions
Global vehicle production maintains growth trajectory in 2017
After automobile production grew strongly in 2016 by 4.8% to 93.1 million cars, 2017 saw growth of 2.3% to 95.3 million. The world’s three largest automobile manufacturers, Volkswagen, Renault-Nissan and Toyota, have a combined share of 33%. General Motors, on the other hand, is no longer among the three largest automotive manufacturers in the world, as its production volumes have fallen with the sale of Opel. Volkswagen remains the sec-tor leader with annual growth of 4.8% to 10.8 mil-lion units manufactured in 2017. Renault-Nissan is now the second-largest automobile manufacturer in the world, as a result of strong growth of 5.5% to 10.5 million vehicles manufactured in 2017. Toyota remains the third-largest automobile manu-facturer with 10.3 million units produced.
Automobile production in Europe differs greatly across the regions. Whereas Western Europe achieved a slight rise of 1.4% in car production, vehicle production in Eastern Europe grew substan-tially by 8.6% compared to 2016. Russia is signifi-cantly impacting the positive trend in Eastern Europe with an increase of around 19.1% in 2017, but this only represents a recovery of production volumes to the 2014 level. The Czech and Turkish markets also continued to outpace global growth in the automotive industry in 2017. The UK, Spain and Germany saw falls in production due to their greater
dependence on the British market. Italy and France, by contrast, with their stronger focus on southern European markets, contributed to the growth in the Western European region.
Automobile production in North America, with the USA as the largest production market, fell to 17.1 million cars in 2017, representing a decline of 3.9% compared to the previous year. Despite exceptional demand due to storm damage, it was not possible to ramp up production in the USA and demand was met predominantly from inventory. Following the launch of new models and follow-up programs in Mexico in 2016, these contributed to a production rise of approximately 13.6% in 2017 as a whole, setting a new record of almost 4 million cars.
South America achieved a marked increase in auto-mobile production in 2017, recording a total of around 3.3 million cars, equivalent to an increase of 20.3% compared to 2016. The upturn is buoyed particularly by a recovery in the Brazilian market, which saw a rise of 26.1% compared to 2016. Both exports and the domestic market contributed to the rise. Vehicle production in South America, however, remained well below the level in 2013, when 3.5 million vehicles were produced.
The Asia-Pacific region once again expanded its share of global car production in 2017, producing around 49.7 million vehicles, 2.5% more than in 2016. China, the world’s largest vehicle producer,
9
ANNUAL REPORT 2017GROUP MANAGEMENT REPORT Business and General Conditions
produced around 27.6 million vehicles in 2017, approximately 2.0% more than in 2016. The limit ed size of the increase is due particularly to the very strong performance in 2016, when the government provided large subsidies for new vehicles. In the Japan/Korea region vehicle production rose sharply in 2017 to 13.4 million, representing a rise of 3.6% compared to the previous year. The main reasons for this were the favorable economic trends in Japan and lower oil prices.
Recovery in the steel tube market
The steel tube market benefited from an improved demand situation in 2017. The key factor affecting the development of the global tube market remains activity in oil and gas exploration. The positive trend in oil prices in 2017 is being driven on the one hand by the further tightening of OPEC output and by a sustained high level of demand worldwide. The oil price rose significantly by an annual average of 12% compared to 2016, with the benchmark WTI grade standing at around $51/bbl in 2017. The trend con-tinued at the end of 2017 with the price of WTI oil rising above $60 a barrel.
As a consequence of the continued rise in the oil price the US rig count rose continuously from mid-2016 with a time lag of around four months. The US rig count measures the number of active oil wells in the USA. According to Baker Hughes the figure rose to
929 at the end of 2017, representing a marked increase of 41% compared to the end of 2016. This resulted in a run-down of customers’ tube invento-ries and consequent restocking. After the previous years’ slump the use of OCTG (Oil Country Tubular Goods) products in North America has now clearly recovered compared to 2016, as evidenced by growth of around 64% to 5.9 million tons in 2017.
The steel tube industry in the Europe region recorded a continued recovery in prices and volumes in 2017. Prices of seamless and welded tubes rose strongly above the previous year's level in 2017, particularly due to the rise in raw material prices. Competition remains intensive, however, leading to increasing market consolidation. With regard to steel-process-ing industries, Eurofer, the European steel associa-tion, emphasizes the positive trend in 2017, buoyed by strong growth in industrial output in the EU. Robust growth is expected in 2017 in the sectors of importance to BENTELER. The mechanical engineering and construction industry sectors are set to grow by 4.0%, whereas growth of 3% is expected in the automotive industry in 2017.
10

ANNUAL REPORT 2017GROUP MANAGEMENT REPORT Result of Operations
BENTELER Group – Marked increase in revenue across all three Divisions
BENTELER develops solutions that make a difference – for customers, employees and society. With tech-nological excellence and highly effective execution the company develops, produces and sells products, systems and services for the automotive, energy and mechanical engineering sectors. In 2017 the BENTELER Group generated revenues of €7,856 mil-lion, representing a rise of €433 million compared
Result of Operations
to the previous year. The prior-year revenues of €7,423 million still included €182 million in res-pect of the strip steel trading business, which was sold to Casper Benteler GmbH on May 31, 2016. Excluding this one-off effect, the revenues of the BENTELER Group rose sharply by €615 million, or 8.5%.
All three Divisions of the BENTELER Group contributed to the rise in revenues on a comparable basis: Revenues in the Automotive Division rose by 7.1%
compared to the previous year, to €6,296 million. Automotive accounts for 78.4% of Group revenue. Revenue in the Steel/Tube Division rose by 24.0%, taking its share of Group revenue to 12.7%. After adjustment for the sale of the strip steel trading business in 2016 and its revenue share of €182 mil-lion, the Distribution Division recorded a similar rise in revenues of 9.1%. Its share of Group revenues was 8.9%.
2016201520142013 2017 * adjusted by €182 million revenue in 2016 in respect of the disposal of the strip steel business on May 31, 2016.
7,4237,5987,5567,4257,856
2017 2016 Change
IN € MILLION %
Automotive 6,296 5,880 416 7.1
Steel/Tube 1,023 825 198 24.0
Distribution 716 838 -122 -14.6
Distribution comparable* 716 656 60 9.1
Division revenues 8,035 7,543 492 6.5
Internal revenues, other -179 -119 -60
External revenue 7,856 7,423 433 5.8
External revenue comparable * 7,856 7,241 615 8.5
REVENUE PERFORMANCE SINCE 2013 2.1
IN € MILLION
REVENUE BY DIVISION 2.2
11
Text direkt anschließen?

ANNUAL REPORT 2017GROUP MANAGEMENT REPORT Result of Operations
(previous year)
Automotive 78.4 %
(78.0)
12.7 % Steel/Tube
(10.9)
8.9 % Distribution
(11.1)
Automotive Division achieves significant rise in revenues
BENTELER operates as a strategic partner develop-ing solutions globally in close collaboration with customers and partners. The company takes cus-tomer proximity literally and is expanding its pro-duction capacity in the growth markets where cus-tomers need solutions. It offers its entire product portfolio in all significant markets around the world. BENTELER Automotive develops and manu-factures modules and components for bodies, chassis and engines. As a highly innovative partner BENTELER Automotive also offers its customers sys-tem solutions and supports them throughout the
value chain – from development and production through to assembly. The Division generated rev-enue of €6,296 million in 2017, representing a rise of €416 million or 7.1% compared to the previous year.
Key contributors to the revenue increase were the growth regions of Eastern Europe, particularly as a result of the new module plant at Września in Poland, and the Asia-Pacific region with the new module plant at Shenyang in China. The recovery of the Brazilian market and the rise in revenues from the new Itatiaia module plant for Land Rover is also contributing to the positive revenue trend. The Southern European region is benefiting from rising revenues from Volkswagen at the Palmela (Portugal) and Vigo (Spain) sites. Revenues in the Western European region remain fairly constant. The North America region has recorded a decline in revenue, but this is more than offset by the effects referred to above. In addition to the aforemen-tioned volume rise, a smaller proportion of the revenue increase is due to higher raw material prices.
The Chassis and Modules Business Unit focuses on developing and manufacturing chassis cross-mem-bers, subframes and control arms, and on assem-bling complete front and rear axles. The revenue generated by this Unit in 2017 amounted to €3,527 million, representing a rise of 6.5% com-
pared to the previous year. The rise was due in particular to the new module plants at Września (Poland) and Shenyang (China).
The Structures Business Unit increased its revenue by 6.9% compared to 2016 to €1,895 million. The biggest rise in this Unit was in the Southern Europe region at the sites at Vigo and Migennes. This Unit manufactures safety components such as bumpers, roof frames, A and B pillars, door beams, and instrument panel supports, as well as press parts for external and internal use.
Revenue in the Engine and Exhaust Systems Busi-ness Unit rose by 3.5% year-on-year to €715 mil-lion. This Unit develops and produces components and systems to optimize fuel consumption and reduce exhaust gas emissions.
In addition to the three Business Units, there are smaller business areas with different focuses. BENTELER Mechanical Engineering produces machinery and tools for the Automotive industry. The BENTELER Defense area provides vehicle protection solutions for a variety of customer and market segments. The Group’s entire interest in the fiber composite components manu-facturer BENTELER-SGL was sold at the end of 2017 to the former partner, SGL Group. BENTELER Automo-tive is thus focusing on its core areas of hot-formed steel and aluminum components for volume vehi-cles produced by automobile manufacturers.
REVENUE BY SEGMENT 2.3
12

ANNUAL REPORT 2017GROUP MANAGEMENT REPORT Result of Operations
Increased sales volume and revenue in the difficult Steel/Tube market
BENTELER Steel/Tube develops and produces seamless and welded quality steel tubes. As one of the leading manufacturers, the Division offers its customers problem-solving expertise worldwide, ranging from material development to tube applications. The Steel/Tube Division’s 2017 revenue amounted to €1,023 million, up 24.0% on the previous year's level of €825 million.
The Operating Unit Seamless produces and sells seamless tubes for the automotive, oil and gas exploration, energy technology, construction, and mechanical engineering market segments world-wide. Revenue increased by 36.6% year-on-year in 2017, primarily due to rising demand for OCTG tubes and the continued start-up of the new hot rolling mill in the USA.
The Operating Unit Welded produces welded tubes for various applications in the automotive industry as well as for other industries, such as mechanical and plant engineering. Revenue in 2017 increased by 10.2% compared to the previous year. This was mainly due to positive price effects of passing on higher steel prices to customers.
Price-driven rise in revenue in the tube trading unit of the Distribution Division
BENTELER Distribution supplies steel and stainless steel tubes to customers via an international logis-tics network and offers a variety of tube processing solutions in addition to technical consulting. Its business focuses on the mechanical engineering and hydraulic segments, on the automotive, con-struction and energy sectors, and on industrial goods and downstream trading.
In the reporting year the Distribution Division gen-erated revenue of €716 million. Revenue in the previous year still included €182 million in respect of the strip steel trading business, which was sold on May 31, 2016 to Casper Benteler GmbH. Revenue in the classic tube trading unit rose by 9.1% year-on-year in 2017, particularly due to higher prices.
Rise in earnings before interest and tax
The BENTELER Group’s consolidated earnings before interest and tax (EBIT) rose to €206.8 million in 2017, representing an increase of €15.6 million or 8.2% compared to 2016.
BENTELER Automotive achieved a marked rise in EBIT compared to the previous year. The improvement in earnings was driven primarily by the North America and Mercosur regions. Both continued their upturn with significantly higher positive results compared to the previous year. In North America operational improvement measures are taking effect, while in Mercosur a cyclical recovery is under way after sev-eral years of deep recession and successfully imple-mented cost-reduction measures.
EBIT in the Steel/Tube Division remained constant at the previous year’s level despite higher revenue. While the Operating Unit Seamless in Germany was able to improve its positive results due to an order-driven improvement in capacity utilization compared to the previous year, EBIT in the USA was, as budgeted, lower than in the previous year due to the start-up of the plant at Shreveport and the associated costs. In the Operating Unit Welded positive contributions to results came particularly from operational efficiency improve-ment measures and an improved margin due to the market and product mix.
Distribution achieved a slight increase in the oper-ating result before tax and interest compared to the previous year. The earnings performance here was positively impacted by the measures taken to raise
13

ANNUAL REPORT 2017GROUP MANAGEMENT REPORT Result of Operations
prices and optimize logistics as well as the higher price level.
The BENTELER Group generated a consolidated net profit of €100.8 million in fiscal 2017, compared to €110.9 million in the previous year. The decline was due on the one hand to the higher tax rate of 29% compared to 22% in the previous year, and on the other hand to the higher net finance result of €66.4 million compared to €49.1 million in 2016.
14

ANNUAL REPORT 2017GROUP MANAGEMENT REPORT Assets and Financial Position
Investments still exceed depreciation and amortization
The BENTELER Group invested €429 million in 2017. Investments were therefore considerably higher than the depreciation and amortization of €279 million. The BENTELER Group is thus investing strongly in its future growth. Of the total volume of investments, €413 mil-lion related to property, plant and equipment while intangible assets accounted for €16 million.
Total investment by the Automotive Division amounted to €386 million in 2017. €289 million or 73% of this went to project-specific investments, production facilities and equipment for the Division. The major investment projects in 2017 concerned hot-forming lines/presses at Klášterec (Czech Repub-
Assets and Financial Position
lic), Chongqing (China), Talle (Germany), Gebze (Tur-key), Vigo (Spain) and project-specific investments at Raufoss (Norway), Spartanburg (USA), Puebla Assembly (Mexico), Chongqing, Tianjin and Shanghai Huizhong (all in China) as well as infrastructure for the new Klášterec site (Czech Republic).
Investments in the Steel/Tube Division amounted to €27 million. The previous year’s figure included €60 million for the development of the hot rolling mill at Shreveport, Louisiana, USA. The Distribution Division invested €10 million during the past financial year.
Continued high level of cash and cash equivalents
Cash flow from profit in the 2017 financial year amounted to €402.8 million, exceeding the previous year’s figure of €337.7 million by €65 million. At €272 million, working capital was €76 million lower in December 2017 than at the end of 2016. Cash flow from investing activities decreased by €171 mil-lion year-on-year to €314.1 million. This was there-fore covered from the cash flow from profit.
2017 2016 Change
IN € MILLION %
Automotive 386 338 48 14
Steel/Tube 27 84 -57 -68
Distribution 10 12 -2 -17
Other companies 6 6 0 0
Total investments* 429 440 -11 -3
* additions to intangible assets and property, plant and equipment
2017 2016
IN € MILLION
Cash flow from operating activities 347.3 433.1
(of which: cash flow from profit) 402.8 337.7
Cash flow from investing activities -314.1 -485.2
Cash flow from financing activities 300.3 85.8
Effect of exchange rate changes on cash and cash equivalents -8.9 4.2
Cash and cash equivalents at beginning of period 357.6 319.6
Cash and cash equivalents at end of period 682.3 357.6
INVESTMENTS 2.4
STATEMENT OF CASH FLOWS 2.5
15

ANNUAL REPORT 2017GROUP MANAGEMENT REPORT Assets and Financial Position
Cash flow from financing activities amounted to €300.3 million in the reporting year. The net cash flow from the drawing of loans, the placement of bond loans and other financing activities of €487 million exceeded the net outflow of funds from scheduled repayments of €153 million and is being used for the early refinancing of future scheduled repayments. Dividend payments to shareholders led to a further cash outflow of €34 million.
At €682.3 million, the cash and cash equivalents during the reporting year were €325 million higher than in the previous year. Cash and cash equiva-lents represented 13.3% of total assets, compared to 7.5% in the previous year.
Rise in total assets
Total assets amounted to €5,138 million on Decem-ber 31, 2017, representing a rise of 7.8% on the previous year. Non-current assets declined by €70 million to €2,548 million. This is mainly due to a decline in the carrying value of investments in associates of €29 million and property, plant and equipment of €42 million. Additions of €429 mil-lion to property, plant and equipment and intan-gible assets were offset by depreciation and amortization of €279 million and disposals at a residual carrying value of €75 million (including the sale of joint venture interests in BENTELER-SGL amounting to €42 million).
Compared to the previous year current assets (excluding cash and cash equivalents) increased by €118 million to €1,908 million. The changes in fis-cal 2017 resulted mainly from higher inventories and trade receivables.
The Group had a high level of cash and cash equiva-lents at the end of 2017, increasing by €325 million to €682 million. As a result of central cash pool liquidity management, most of these funds are deposited at BENTELER International Aktienge-sellschaft and are available on a daily basis.
Sound financing structure
Equity amounted to €1,102 million, €10 million higher than in the previous year. The equity increase results primarily from the consolidated net profit of €101 million in 2017. The change in the foreign cur-rency translation reserve of €70 million, the dividend payment for 2016 in the amount of €26 million and dividends paid to non-controlling interests totaling €8 million, resolved by the Annual General Meeting in March 2017, resulted in a decrease in equity.
Assets
Non-current assets
Inventories
Other current assets
Liquidity
Assets Equity and liabilities
5,138
2,548
887
1,021
682
4,766
2,618
803
987
3582017 2016 2017 2016
5,138
1,092
1.904
1.771
1,102
2,052
1,985
4,766
GROUP BALANCE SHEET STRUCTURE 2.6
IN € MILLION
Equity and liabilities
Shareholders' equity
Non-current liabilities
Current liabilities
16

ANNUAL REPORT 2017GROUP MANAGEMENT REPORT Assets and Financial Position
Non-current liabilities amounted to €2,052 million at the end of 2017, representing a rise of €148 million compared to the previous year. The growth resulted mainly from a rise in non-current financial liabilities, while long-term provisions declined by €20 million. Other long-term liabilities decreased by €38 million.
Current liabilities increased by €214 million to €1,985 million, particularly due to higher trade payables. Current financial liabilities were €49 million higher and short-term provisions €48 million lower than the 2016 level.
Working capital decreased by €76 million to €272 million and amounted to 3.5% of revenue, com-pared to 4.7% in the previous year. The decrease compared to 2016 was due particularly to the increase in trade payables.
Non-current capital (equity and non-current liabili-ties) amounted to €3,154 million, equivalent to 61% of the increased total assets, slightly below the pre-vious year’s level. It covered non-current assets by 124%, ensuring financing with matching maturities.
The equity ratio of 21.4% was below the previous year's level of 22.9%. This was due to the significant increase in total assets despite slightly higher equity.
Net financial liabilities at €1,088 million remained €27 million below the previous year's level of €1,115 million. Although the level of investments clearly exceeded depreciation and amortization, the net gearing decreased. The gearing rate, calculated as the ratio of net financial liabilities to equity, remained at the previous year's level of 0.99. The dynamic gear-ing, calculated as the ratio of net financial liabilities
1) Equity: Total assets 2) Cash flow from profit: Investments 3) Net financial debt* 5): Equity 4) Net financial debt* 5): Cash flow from profit 5) Net financial debt = non-current and current financial debt less cur-
rent receivables and other current financial assets (excluding derivati-ves) and less cash and cash equivalents. A current financial receivable from the accounts receivable facility reserve amounting to €75,277 thousand has not been deducted.
6) Net financial debt* 5): EBITDA 11)
7) EBIT : Equity 8) EBIT : Intangible assets + property, plant and equipment + working
capital9) (averaged between beginning and end of the year) 9) Working capital = (inventories + trade receivables from third parties,
affiliated companies and equity investments) less (trade payables to third parties, affiliated companies and equity investments + advance payments received)
10) EBIT = Result of operating activities 11) EBITDA = EBIT 10) + Depreciation and amortization
* The definition of net financial debt has been amended in the current annual report for 2017 and the previous year (limited to ‘current’ recei-vables/other financial assets)
2017 2016
Equity ratio (%) 1) 21.4 22.9
Internal financing ratio 2) 0.94 0.77
Gearing rate 3) 0.99 1.02
Net financial debt to cash flow from profit 4) 2.70 3.30
Net financial debt to EBITDA 6) 2.24 2.67
Return on equity (%) 7) 18.8 17.5
ROCE (%) 8) 7.7 7.1
Working capital 9) 272.5 348.2
EBIT (€ milion) 10) 206.8 191.2
EBITDA (€ milion) 11) 485.7 417.3
KEY FINANCIAL RATIOS 2.7
Equity and liabilities
Shareholders' equity
Non-current liabilities
Current liabilities
17

ANNUAL REPORT 2017GROUP MANAGEMENT REPORT Assets and Financial Position
2017
429 279
2015
455 230
2016
440 226
2011
386 203
2012
444 209
2013
349 224
2014
489 228
to EBITDA, improved to 2.2 in 2017 compared to 2.7 in the previous year.
Central cash and foreign exchange management
The BENTELER Group manages its financing cen-trally. Liquidity surpluses or shortages are pooled by BENTELER International Aktiengesellschaft by way of internal investment and borrowing capa-bilities. This allows surpluses from individual Group companies to be used by other Group com-panies as required.
As a rule, capital expenditure is financed out of cash flow for the long term, and working capital is financed mainly by short-term funding. Non-cur-rent assets are continuously financed out of cash flow and by taking out appropriate long-term loans with matching maturities.
In order to finance working capital, the company had cash resources of €682 million available at December 31, 2017, plus a strategic liquidity reserve of unuti-lized written confirmed short- and long-term credit lines totaling €400 million (prior year: €400 million). All credit commitments are free of collateral and financial covenants.
A large proportion of the Group’s internal goods and services transactions are cleared through BENTELER
International Aktiengesellschaft so that payment transactions can be regulated cost-effectively.
Branches
There are no branches.
TOTAL INVESTMENTS, DEPRECIATION AND AMORTIZATION, AND CASH FLOW FROM PROFIT 2.8
IN € MILLION
0
50
150
200
250
300
350
400
450
100
Investments Depreciation and amortization Cash flow from profit
335 303
154
304
375
277
338
403
2010
247 198
18

ANNUAL REPORT 2017GROUP MANAGEMENT REPORT Risk Report
Comprehensive risk management
The business activity of the BENTELER Group inevita-bly entails risks. Responsible management and close control of risks is a key element of the compa-ny's management. The primary aim is to take full advantage of all business opportunities while keep-ing risks constantly under control. Through our group-wide risk management system we limit all identifiable key risks by taking appropriate meas-ures and precautions. The risk management system regularly undergoes a thorough review and its con-trolling effect within the Group is developed on a continual basis.
BENTELER International Aktiengesellschaft, as a stra-tegic holding company, manages the Divisions by setting goals. A comprehensive management infor-mation system monitors goal achievement and it tracks all relevant key performance indicators in terms of actual, planned, and projected figures. In the event of a negative deviation from planning, the Divisions initiate appropriate countermeasures at an early stage.
Each month, all Divisions report on their economic performance and highlight opportunities and risks that may affect planned results and future develop-ments. An aggregate risk status report is also sub-mitted to the management bodies every six months, on the basis of an inventory of possible risks that might pose a threat to the company as an
Risk Report
ongoing concern. In a cascading reporting system, the status of risks and pertinent measures is described for this purpose on the basis of defined indicators for probability and financial damage potential. Officers are appointed to take specific responsibility for each risk and the associated measures. The systematic risk management process helps management detect risks in a timely manner and initiate suitable precautionary measures to prevent or avoid the risks.
The BENTELER Group also has a company-wide internal control system that arranges organizational safeguards, procedural rules, and system audits. Internal Auditing regularly reviews all business areas of the company. The matters it examines include compliance with guidelines, the regularity and efficiency of business processes and reporting, and the proper functioning of risk management.
Some particularly important risks are transferred to insurance companies by an internal service pro-vider. In particular, claims resulting from any recalls or liability issues are covered, as are property dam-age and losses caused by disruption to operations. In turn, risks that are only covered to a limited extent are reinsured for third-party insurance com-panies by BENTELER Reinsurance.
Particular attention is paid to risks resulting from changes in demand due to business cycles and from the financial sector, specific customer and supplier
risks, and risks resulting from changes in the supply markets. Management also carefully monitors pro-ject, quality, foreign exchange, IT, and liquidity risks.
Risks arising from the influence of economic demand
The company’s business planning identifies oppor-tunities in terms of new products, customers, and markets. However, these opportunities also entail risks to sales volumes, revenue, profits, liquidity and investments, resulting from unplanned overruns – or even more importantly, underruns – of production volumes for vehicle models for which BENTELER sup-plies products. Economic fluctuations also signifi-cantly influence business in steel tubes, in both trading and production.
When there is a lack of positive stimulus from the global economy in the markets of relevance to BENTELER, the Group faces economic risks. The r elevant country-specific conditions are monitored constantly.
In recent years, BENTELER has initiated numerous projects and turned them into standard procedures, to adapt cost structures to demand in the various Divisions and to manage those structures within nar-row bounds. Planning of measures to increase reve-nue are an integral part of corporate management. A
19

ANNUAL REPORT 2017GROUP MANAGEMENT REPORT Risk Report
further key focus was on the Group's cash flow management. The Group furthermore aims to safe-guard its liquidity position in the long term and to build up reserves for growth projects, through effi-cient investment and working capital manage-ment.
Specific customer and supplier risks
Adverse economic performance among individual contracting partners could have consequences for the BENTELER Group’s revenue and earnings. The com-pany limits these risks by diversifying its customer and supplier base as much as possible, and by con-stantly monitoring important market indicators and other early warning signs.
The BENTELER Group could incur losses if the credit rating of individual customers deteriorates with the result that payment is delayed or defaulted on, or that planned sales volumes cannot be achieved. The company operates intensive debtor management to counteract this risk. The Divisions’ sales and financ-ing officers regularly track customers’ economic situ-ation, their payment performance, and the possibil-ity of protection against risks, for example by insuring a portion of receivables.
To meet its obligations as a supplier, the BENTELER Group must rely on materials and services provided by numerous other companies. Existing suppliers
could have difficulties in supplying BENTELER, or suitable new suppliers might have to be found at short notice, thus hampering the company’s own business. The Automotive Division has a particularly large number of specialized suppliers. Here the pur-chasing department applies an extensive range of successful tools for monitoring and mitigating risk. For example, suppliers’ creditworthiness is continu-ally monitored with the aid of external and internal information sources. Specialized purchasing teams make sure that, if a crisis arises, the Division’s sup-plies – and thus its ability to serve its end custom-ers – are secure.
Changes in procurement markets
Fluctuations in the price of steel, aluminum, scrap metal, and alloys pose a considerable risk for the BENTELER Group. If prices of raw materials rise, for example, it is not always immediately possible to pass on the full amount of the increase to custom-ers by raising selling prices. This can have a nega-tive impact on profitability and, in turn, an adverse effect on earnings performance. Conversely, delays in passing on lower procurement prices can also have a positive influence on earnings.
The BENTELER Group sources considerable quantities of steel. It passes on most changes in procurement prices to the customer. Fixed-price adjustment clauses exist with customers and suppliers with
regard to aluminum purchasing. Temporary differ-ences that may arise in terms of price adjustment are also minimized by means of external hedging trans-actions with banks.
Project risks
The Automotive Division is involved in complex development and production projects. The inherent risks of these projects include unexpected technical difficulties in the Division or its project partners. Those, in turn, may sometimes lead to higher costs for the start of series production and/or higher investments than were originally budgeted. To avert or reduce these risks, the Division applies extensive standards for project control. These also call for regular project reviews to permit early counter-measures when needed. Suppliers are included in this process, and are audited periodically.
Major investments by the Steel/Tube Division
BENTELER Steel/Tube has broadened its presence primarily in the North American market with the construction of a rolling mill in the US state of Louisiana. As this is the Steel/Tube Division’s first large-scale project in the US, particularly extensive potential risks have been identified. These include in particular the start-up of the hot rolling mill, expansion of the sales network, and utilization of
20

ANNUAL REPORT 2017GROUP MANAGEMENT REPORT Risk Report
future capacities, which are heavily dependent on oil prices due to the focus on the OCTG segment. Special steering committees have been set up to limit potential risks. The mill’s current start-up phase is an opportunity to identify any weaknesses in the manufacturing process at an early stage and to implement any improvements in good time.
Quality risks
Shortcomings in development, production, or logistics at BENTELER plants or suppliers can cause parts to be delivered to customers late or in faulty condition. Such problems may expose BENTELER to claims for damages. The BENTELER Group has therefore introduced extensive operating proce-dures governing process reliability, quality man-agement, and process audits at its own plants and for its suppliers. To mitigate such risks in their own production operations, the Divisions constantly refine their production methods and conduct pre-ventive maintenance on their equipment. The BENTELER Group has taken out insurance to limit residual risks to the company as a result of any liability or claims. Claims can also result from pur-chases of defective materials. Through a coopera-tive arrangement with an insurance broker, the BENTELER Group also offers advantageous options for its external suppliers to take out product liabil-ity and recall insurance.
Risks from property damage and business interruption
The system for operational risk prevention reviews and classifies operational risks at the Group’s plants, derives measures for damage prevention on that basis, prepares emergency plans for business processes, and introduces an annual operational safety report.
Foreign exchange risks and interest rate risks
The BENTELER Group’s international business oper-ations, especially in purchasing and sales, exposes it to foreign exchange risks as a result of fluctuations in exchange rates. Its central financing and foreign exchange management restrict foreign exchange risks by applying an information system and coordinated hedging transactions. The BENTELER Group controls risks arising from changing interest rates by largely matching maturities when it borrows refinancing funds, and by using derivatives. Further informa-tion on financing instruments can be found in the notes to the consolidated financial statements.
IT risks
The use of modern information technologies plays a decisive role in the handling and guaranteeing of busi-
ness processes within the BENTELER Group. Failures of systems or networks also pose potential risks such as breaches of data integrity and confidentiality. Our cen-tral IT ensures error-free and failure-proof operation, as well as the continued development of measures.
Compliance risks
The BENTELER Group conducts its business responsibly and in compliance with the laws of the countries in which it operates. Potential risks include in particular violations of antitrust and competition law and export control provisions, as well as corruption and discrimi-nation. These risks are contained by means of appro-priate guidelines and continuous training of our employees.
21

ANNUAL REPORT 2017GROUP MANAGEMENT REPORT Report on Research and Development Activities
BENTELER makes it happen. Solution-focused devel-opment work creates sustainable values for our cus-tomers. In products and systems, materials and pro-cesses, our success and progress is anchored in our tradition stretching back over 140 years. BENTELER invests large sums in research and development to devise solutions for our customers. In 2017 BENTELER filed 81 patent applications and the research and development budget amounted to €87 million.
The challenges relating to digitization as well as products and systems in the innovative field of mobility are being addressed through intensive and efficient innovation management. Start-ups in the leading-edge fields of Industry 4.0 and electromo-bility are closely involved through partnerships with “garage33" and “STARTUP AUTOBAHN”. BENTELER ensures that the latest technologies are always deployed in the company through international, cross-sector internal collaboration as well as coop-eration with universities and scientific institutes.
Success through innovation at BENTELER Automotive
BENTELER sees innovation as encompassing not only the idea and the invention itself, but also the suc-cessful implementation of a new idea or a new busi-ness concept in the market. That means not only technological expertise but also rapid development and market introduction. High market volatility,
Report on Research and Development Activities
regional regulatory divergences in a globalized world and ever greater requirements in terms of system content and system knowledge are placing the high-est demands on innovation management and devel-opment processes. For this reason BENTELER creates international cross-functional project teams for selected projects, which use agile project manage-ment methods such as “SCRUM” to deliver success in the shortest possible time. A prime example of this is the BENTELER Electric Drive System (BEDS). A pro-totype was developed for the Shanghai Autoshow in April 2017 in only 125 days from the initial idea through to presentation at the event. BEDS com-bines all BENTELER Automotive components and subsystems – such as structural parts, crash-manage-ment systems, chassis systems, battery trays and thermomanagement – and packages them as an overall system competence. This project demon-strated the agility of a cross-sector German-Chinese project team.
The mobility megatrend
Mobility is a very significant megatrend for BENTELER. This trend is being spurred in part by autonomous driving but particularly by electromobility. Following the successful completion of the e-mobility cross- sector project house and the creation of the BEDS prototype for the Shanghai Autoshow, innovative module and system solutions are being developed in this technological environment. Alongside numerous
customer projects for battery trays and electrified axles, the BEDS is also being implemented as a cus-tomer-focused total system approach. In the R&D field research is being conducted into a large number of innovative solutions relating to crash structures, battery trays, thermomanagement for batteries and electronics and for electrified axle systems. The focus remains on the development of functional integra-tion and, for example, the integration of an induc-tive charger into the axle of an electrically driven vehicle. This creates a clear additional benefit for our customers, as they no longer have to bear the cost of integration. It is important to collaborate with com-petent partners, particularly in the field of electro-mobility. The focus is therefore on the development of an efficient partner network in complementary technology disciplines.
Sustainability through lightweight construction
Lightweight construction is becoming an increasingly significant technology. It is making a substantial con-tribution both in the field of mobility and in the mega trend of sustainability. In technological circles the term decarbonization is used, which encompasses all measures that are developed and applied to avoid CO2. As well as avoiding fossil fuels such as coal and oil, it is also important to take advantage of physics as fully as possible. And that means keeping transported masses as light as possible. This is where lightweight construction comes in. Every kilogram of mass that
22

ANNUAL REPORT 2017GROUP MANAGEMENT REPORT Report on Research and Development Activities
has to be transported requires energy. BENTELER spe-cializes in the development of high-tensile steel solu-tions that can be achieved with limited wall thick-nesses due to high strengths and thus offer solutions for lightweight construction. Aluminum structures in the structural and axle areas also offer major potential in this regard. The latest development involves hybrid systems, in which two or more different materials can be combined to take full advantage of the mater ial-specific characteristics of each constituent. The connection technology plays a very important role here. In these technologies BENTELER Automotive demonstrates many solutions that can be used to meet the customer's specific requirements.
Innovation and development at BENTELER Steel/Tube
The generation of customer added value through innovation and differentiation from our market competitors are the essential focal points in the development of steel and tube solutions for tomor-row's markets. This is based on our targeted inno-vation management. Future scenarios are used to deduce the relevant trends for the three market segments of energy, industry and automotive and form the basis for our innovation work. BENTELER Steel/Tube is thus able to adapt to changes in the future and to generate innovative ideas for future products, processes and business models at an early stage and implement them on a targeted basis.
Our innovative strength is being further enhanced through the collaboration with “garage33“. This regional partnership not only allows collaboration with start-ups from Ostwestfalen-Lippe, but also gives BENTELER Steel/Tube the opportunity to embrace further innovations and work on disruptive ideas in its own “garage”.
The foundations for the development of new, inno-vative products for tomorrow's markets are laid by the Predevelopment Department, which focuses on the development of new steel materials, new func-tional surfaces and the modeling and simulative optimization of our core processes. A notable mile-stone in 2017 was the commissioning of the new surface laboratory for the efficient development of new functional coatings. The expansion of FEM sim-ulations means that from this year it is possible to map, analyze and optimize both internal processes and selected manufacturing processes used by our customers. This enables BENTELER Steel/Tube not only to predict the behavior of new steels in pro-duction, but also to support customers’ product launches.
Product and process developments for the automotive market segment
The developments for the automotive market seg-ment were focused on the themes of lightweight construction, safety and electromobility.
A key factor for success in efficient lightweight con-struction is the consistent use of high-strength materials. In 2017 new, innovative lightweight steel materials were successfully implemented in thin-walled, welded drawn drive shaft tubes and also for tubular stabilizers in commercial vehicles. The targeted development of materials and pro-cesses enabled BENTELER Steel/Tube to secure a unique position for these products and applications with regard to dynamic load capacity. The produc-tion portfolio for seamless precision tubes is also being successfully expanded for truck chassis stabi-lizers. Hot-rolled axle tubes for commercial vehicles from the Dinslaken plant with materials developed for specific customers have been deployed since 2017 by a number of well-known manufacturers in Europe.
The requirements of improved crash performance for cars with simultaneous weight reduction due to reduced component wall thickness mandate the use of new kinds of innovative high-performance materials. BENTELER Steel/Tube meets these require-ments through the use of welded tubes made of high-manganese steels, for example for A pillars or crash boxes. The extreme deformation capability of high-manganese steels compared to traditional steel materials allows challenging designs com-bined with high component strength and low weight. The validation of the first components by OEMs was successfully completed in 2017.
23

ANNUAL REPORT 2017GROUP MANAGEMENT REPORT Report on Research and Development Activities
In the field of electromobility the focus in 2017 was on axle concepts based on welded tubes. Light-weight solutions using optimized microalloyed or multiphase materials were developed jointly with customers. This allows significant compensation of the additional weights in electric vehicles resulting from batteries. Prototypes for a large electrical vehi-cle platform were successfully developed with tubes made by BENTELER Steel/Tube.
Product and process developments for the industry and energy market segments
In the industry and energy market segments the consistent focus remained on a customer-oriented product portfolio. In the hydraulics sector activity centered on the increased efficiency of hydraulic machinery. Against this background BENTELER Steel/ Tube focused on the targeted development of materials for hydraulic tubes meeting customer requirements for increased pressure resistance and fatigue characteristics, weight savings, performance improvements and optimized operational safety.
Another focus was on activities aimed at wider market penetration for hydraulic tubes with our unique Zistaplex® and Zista® Seal surfaces. These technologies were successfully introduced and established for a variety of new customers in the commercial vehicles, agricultural and construction machinery sectors.
With BENTELER Terradrill (BTD), BENTELER Steel/Tube has established a strong brand for mineralogical drill tubes in recent years. The product range was expanded on a targeted basis in 2017 in collabora-tion with our customers. Tubes with guaranteed exceptionally low residual stresses were successfully added to the portfolio. A high-alloy steel was also used for the first time to meet the most demanding drill tube requirements.
The product portfolio in the energy market segment was systematically expanded. A focal point was the development of new materials to be used in chal-lenging environmental conditions, such as in oil exploration in the Gulf regions. The materials were successfully produced and supplied to our custom-ers for a major contract of several thousand tons. In addition, sales and development worked closely together to expand our market system in perforat-ing gun systems for ‘hollow carriers’. Perforating guns are used to start oil and gas exploration by penetrating rock with small explosive charges.
24

ANNUAL REPORT 2017GROUP MANAGEMENT REPORT Report on Environmental and Energy Management
As a company with international operations, the BENTELER Group is aware of its responsibility to pre-serve resources – the production of safety-relevant products and systems requires particularly valuable resources. As a corporate goal, environmental pro-tection ranks equally with high product quality and employee safety, because efficient production pro-cesses and environmentally friendly technologies protect not only the environment but also our busi-ness. We also play an active social role in the loca-tions in which we manufacture. Developing solu-tions that make a difference also includes protecting society and our environment.
Continuity and standards compliance in these oper-ations is supported by an environmental and energy management system. All sites are certified and reg-ularly audited in accordance with the EN ISO 14001 environmental management standard and/or the EN ISO 50001 energy management standard.
In everyday business operations, environmental protection is a responsibility incumbent on all teams and sites in the BENTELER Group. The range of industrial responsibilities includes aspects such as water protection, emission controls, waste manage-ment, and hazardous materials transportation, but also energy management and emissions trading.
This requires a broad range of specialist knowledge that is just as proficient in the sciences as it is in energy tax legislation, current CO2 accounting meth-
Report on Environmental and Energy Management
ods, and other areas of applied environmental pro-tection.
We see proactive environmental management as one of the key building blocks of our responsible sustainability policy, as set out in 2017 in the over-view of our activities in the area of sustainability. It reflects a holistic approach to social responsibility – comprehensive and forward-looking.
Automotive Division
As in the previous year, numerous energy efficiency projects and resource-saving measures were identi-fied and implemented in 2017. Regular discussions in global teams and the further development of a knowledge bank within the BENTELER Automotive Division were intensified by Division-wide exchanges as part of the “FM Journey” project. It was conse-quently possible to launch further projects to boost energy efficiency. An example of optimization of energy efficiency projects at BENTELER Automotive in 2017 was the optimization of the hydropresses, allowing a marked reduction in ongoing consump-tion.
BENTELER Automotive was also successfully certified in accordance with the ISO 14001 and ISO 50001 standards in 2017. Work started on the certification of the environmental management system in accord-
ance with the revised ISO 14001:2015 standard dur-ing the year.
In this context, numerous projects to improve energy efficiency and the responsible use of resources were initiated and implemented. All these measures have a positive effect on energy con-sumption and create an improved CO2 balance.
Steel/Tube Division
The basic idea of production-integrated recycling has been practiced by Steel/Tube since the 1970s: the Division’s own electro-steel plant processes only scrap steel and this 100% recycling makes a substantial contribution to sustainability. Further-more, the by-products of steel production such as steel slag are processed for high-quality construc-tion materials for road construction – further relieving pressure on the environment through the preservation of natural resources.
Sustainability as a business strategy element is the past, present and future of production and plan-ning for the company and is reflected in all the var-ious complex processes at BENTELER Steel/Tube.
A standardized evaluation procedure at each site ensures that all activities and their environmental aspects are inspected regularly in order to system-atically accelerate their continuous improvement
25

ANNUAL REPORT 2017GROUP MANAGEMENT REPORT Report on Environmental and Energy Management
while reducing emissions, avoiding waste and pro-tecting water resources.
The results of the annual external audit of our envi-ronmental/energy management system confirm the effectiveness of this evaluation process and certify our system with the highest standards for treatment of water, raw materials and hazardous substances, emissions, risks and energy.
As in past years, further energy saving potential was identified and the corresponding measures imple-mented in 2017. The themes addressed range from the renewal of lighting through increased insulation in production halls and administrative buildings through to process optimization in energy use and waste heat recovery.
In addition to the process-related optimization measures adopted at all Steel/Tube sites to continu-ously increase energy efficiency, the production hall lighting at the Paderborn site, for example, was switched to low-energy LED technology. Further measures to increase insulation and thus reduce demand for heating energy (window replacement, insulation of facade and roof cladding) were imple-mented at the Paderborn and Dinslaken sites.
Overall, a significant reduction was achieved in the specific energy requirement, enabling the company
to make a further important contribution to climate protection.
BENTELER Steel/Tube is taking part in the Energy Effi-ciency Network for electrical steel with ten other German electrical steel plants, which was founded under a corresponding agreement by the federal government and various industry associations. The aim is to exchange experience and ideas to boost energy efficiency.
Awards from the Federal Ministry for the Environ-ment and Economics demonstrate the great impor-tance of this commitment and confirm the direction we have taken in our environmental protection: forwards!
26

ANNUAL REPORT 2017GROUP MANAGEMENT REPORT HR Report
The BENTELER Group has set itself strong growth objectives: The company aims to increase the total revenues from the current level of around €7.9 bil-lion in 2017 to more than €11.3 billion in 2022. This corresponds to average annual growth of 7.6%. At the same time BENTELER faces many challenges. These include in particular growing competitive pres-sure, the increased internationalization of the busi-ness, changing market conditions, and an increas-ingly changeable economic environment.
The BENTELER Group believes that with its strategy it is well placed to meet these challenges and continue its growth course. A key component in this objective is the continued development of the corporate cul-ture towards a high-performance organization, because to achieve long-term success, BENTELER needs a strong, efficient workforce with employees who think in an entrepreneurial way, assume indi-vidual responsibility, and respond flexibly to changes. On the basis of our corporate values of courage, ambition and respect, our employees develop solutions every day that make a difference. Their expertise and motivation are the keys to busi-ness success. We therefore constantly optimize our organization and continually develop our employees and managers.
That also demands professionalism and excellence on the part of the HR management, because attract-ing and developing our workforce lays the founda-
HR Report
tion for our future. In a fast-changing world this is crucial in order to meet future challenges flexibly and hence successfully. Finally, the positive attitude and performance, skills and commitment of each individual contribute to the success of the BENTELER Group as a whole.
Number of employees
On average over 2017, BENTELER had 27,955 FTEs (full-time equivalents) worldwide, 38 more than in the previous year. In the Automotive Division, the average workforce rose by 629 or 2.9% FTEs to 22,190. In the Steel/Tube Division, the average number of employees rose by 4 FTEs compared to the previous year to 3,701 FTEs. In the Distribution Division, the average number of employees rose by 20 FTEs to 1,458 FTEs. The average number of employees in other companies (including holding companies and BENTELER Glass Processing Equip-ment) amounted to 606 FTEs in 2017, representing a reduction of 615 FTEs compared to the previous year due to the disposal of BENTELER Engineering Services at the end of 2016 with a total of 638 FTEs.
The company is well aware of the great importance of building its ranks for the future, and trains young people in a variety of skilled trades. BENTELER pro-vided training for 688 young people worldwide in 2017 (prior year: 764).
BENTELER employed an average of 273 FTEs in Aus-tria in the reporting year. The Group had 8,816 FTEs in Germany and 18,866 FTEs in other countries.
Employee recruitment, loyalty and development
As in the previous year, further measures were taken in 2017 to define an approach to attract candidates in the target group and to ensure a user-friendly and professional recruitment process worldwide. Our successful employer branding campaign posi-tions us as an employer with international promo-tional prospects and wide-ranging development potential. The BENTELER careers website therefore offers a wealth of country-specific content and is constantly updated with information on engaging and relevant themes. The company further intensi-fied cooperation with target universities in order to attract students and graduates as future employees as early as possible. In addition, the recruitment through social networks was strengthened and potential candidates were contacted directly by the company. As well as appealing to external candidates, our focus is naturally also on our own employees. Ongoing training and individual development were once again among our highest priorities during the reporting year.
27

ANNUAL REPORT 2017GROUP MANAGEMENT REPORT HR Report
The focus in 2017 was once again on the expansion of professional talent management, for which exist-ing processes and tools were further professional-ized and new programs developed and expanded. HR plays a vital role in the implementation of these tools, but our management remains a critical factor in successful talent management. 2017 therefore saw the launch of a cross-division talent management program for the first management tier at BENTELER. The aim of the two-module workshop format with the sustainability concept is to enable our managers to identify and promote talent and high-potential employees earlier and even more effectively, because our objective remains to fill as many positions as possible internally.
An additional focus during the year was on the fur-ther development of the company culture. Our aim is to achieve a culture characterized by courage, ambition and respect. The rollout of these three new corporate values was initiated on a top-down basis in the form of individual workshops, in which the teams adopted a creative yet vigorous approach to the personal and company-specific understand-ing of the values, clarified expectations and made agreements. This process is being continued through the introduction and use of further formats in 2018.
Outlook
We will continue to provide intensive support for the development of our employees in 2018. The processes for the recruitment and induction of new employees, continuing education, talent manage-ment, performance assessment and remuneration are being further professionalized through substan-tially improved data collection and systems integra-tion. We will focus particularly on the theme of digitization of HR work. A digitization strategy was adopted for this purpose, which will be imple-mented gradually from 2018. In 2018 we are start-ing to implement the functional components in the field of learning management and recruitment. As part of a multi-year program further HR processes will be implemented more fully in the field of tal-ent management, but also in HR administration through the use of modern IT solutions.
We are confident that with a corporate culture characterized by ambition, courage, and respect, as well as our excellently trained employees and executives, we are well prepared for the future challenges posed by demographic change and the consequent shortage of specialists.
We regard all these measures as a crucial invest-ment in the future of our company. Our employees are and will continue to be the foundation for our success!
28

ANNUAL REPORT 2017GROUP MANAGEMENT REPORT Forecast
Focus remains on long-term, profitable growth
The BENTELER Group continues to pursue its cor-porate goals of a constant, long-term increase in corporate value while maintaining financial inde-pendence. The company is well positioned thanks to its extensive product portfolio and geographic presence to take advantage of market opportunities and meet new challenges. Across its three Divisions, BENTELER Automotive, BENTELER Steel/Tube and BENTELER Distribution, the company offers proven competence along the entire value chain: BENTELER takes customer proximity literally and expands into growth markets. We therefore operate in those locations around the world where our customers need us. The BENTELER Group also offers high-ca-liber production and distribution coupled with the advantages of a slim and efficient family enterprise.
Global economic momentum remains moderate
The moderate upturn in the world economy is expected to continue over the next two years. The general growth of the economy is being supported by a continued highly expansionary monetary pol-icy. From 3.8% in 2017, global GDP growth of 3.9% and 3.6% is forecast for 2018 and 2019 respec-tively.
For the euro area, the Kiel Institute for the World Economy (IfW) forecasts moderate economic growth.
Forecast
The eurozone economy is forecast to grow by 2.3% in 2018. The economic expansion broadened and strengthened in 2017 and early indicators point to a continued strong rise in output.
Production in the United States is expected to increase by 2.5% after growth of 2.3% in 2017. The main drivers of the economy remain continued positive consumer sentiment and rising disposable incomes. Moreover, investment conditions are good in view of the rise in profits and favorable financing conditions.
In China economic expansion is expected to slow grad ually during the forecast period to 6.1% in 2019 compared to 6.8% in 2017. The spotlight is moving to the containment of rising debt and the structural shift towards a service-oriented economy with socially and ecologically more sustainable growth.
The recovery continues in the other emerging mar-kets, buoyed by higher commodity prices and a robust international economy.
While the risks emanating from the political envi-ronment appear to be declining overall, risks from the financial environment have become more man-ifest again. It is quite possible, therefore, that the forthcoming normalization of monetary policy will trigger sudden uncertainty in the capital markets leading to sharp corrections in asset prices, yields and exchange rates. Particularly at risk are those emerging markets whose integration is largely
fueled by net capital flows from abroad and whose indebtedness has risen strongly.
Sustained growth trend in the Automotive Division
Market forecasts for vehicle production point to fur-ther growth in the global market in 2018. This trend is buoyed by rising production volumes in all markets. In South America in particular a further recovery is expected with a high percentage increase in vehicle production.
The BENTELER Automotive Division is ideally placed to serve global OEM platform projects. Major growth opportunities remain untapped in Asia and Eastern Europe. At the same time, specific plans are being devised for the future positioning of the various BENTELER Automotive locations in Europe to maintain and enhance the company’s competitive capability.
There will also be some changes in the Automotive Division at regional level in 2018. Key among these is the withdrawal from the BENTELER-SGL joint ven-ture (Austria) and the transfer of the Farsund (Nor-way) plant to the global automotive supplier Chas-six. Furthermore the expansion of our presence in China with the new plants at Chongqing, Wuhan and Tianjin and the formation of the joint venture with FAWAY are enlarging the global footprint of BENTELER Automotive.
29

ANNUAL REPORT 2017GROUP MANAGEMENT REPORT Forecast
The "European Manufacturing Strategy" (EMS) will focus among other things on the strengthening of the sites in Germany. This is reflected in new invest-ments, for example in a new press at the Talle plant and Industry 4.0 pilot projects aimed at making the German plants more competitive.
Following the world premiere of the BENTELER Electric Drive System in 2017, the Business Units are taking further steps in electromobility, such as expanding the organization and winning further development contracts for electrically powered vehicles.
Our portfolio management is a further focal point in this regard. This means on the one hand invest-ments in the right products, customers and regions in order to free up resources for our defined target portfolio and concentrate on the core business. BENTELER is also a partner in the “STARTUP AUTO-BAHN” aimed at accelerating and improving access to and agile implementation of innovative ideas.
Steel/Tube Division remains focused on interna-tionalization
Although the expected recovery of the oil market continued in the second half of 2017, the market environment remains challenging. A key success fac-tor for 2018 remains the further expansion of pro-duction volumes for the hot rolling mill at Shreveport in the USA. The trends in oil prices across global mar-
kets affect sales for tubes used in oil and gas extrac-tion. Most forecasts assume a sustained recovery in the oil and gas market. In addition to the constant development of the US business and efficiency and volume increases at the German plants, the focus is also on servicing additional markets outside the established core markets of Europe.
Distribution Division intensifies activities for differentiation
In a market environment with only moderate growth in sales volumes and constant prices, the Distribution Division aims to improve earnings particularly through margin improvements and efficiency gains in 2018.
The objective is to increase the value-added share through customer-specific logistics solutions, an expanded offering of higher-value processing and an expansion of the automotive supplier business.
In addition to the continued streamlining of struc-tures, the focus is particularly on better use and optimization of the in-house logistics and produc-tion network. This notably includes the start-up and stabilization of the central production site in Slovakia and the development of a new warehouse and pro-duction site in Switzerland, which will replace the old site and lead to efficiency improvements.
BENTELER Group continues to increase profitability in 2018
In 2018 the BENTELER Group expects to increase revenues by around 4% and to further improve its operating results across all three Divisions. In the medium term, based on the implementation of the improvement measures identified across all Div-isions and the continued start-up of the hot rolling mill at Shreveport, USA, we expect to achieve a sig-nificant increase in profitability.
Long-term outlook
The increases in profitability and competitiveness form the basis for the five-year plan of all Divisions of the BENTELER Group.
Revenue is expected to increase to more than €11.3 billion by 2022. All business areas will contribute to this growth. The divisional strategies developed under the guidance of the strategic holding company in Salzburg, Austria, remain valid. Thanks to its sound financing structure, the BENTELER Group will still be able to take advantage of market opportuni-ties as they arise. With all the imponderables of eco-nomic developments, the same conservative financ-ing principles will apply as in the past: capital expenditure will be financed from cash flow, the equity ratio is to return to 30%, and as a rule, gear-
30

ANNUAL REPORT 2017GROUP MANAGEMENT REPORT Forecast
ing is not to exceed 50%. Moreover, non-current assets are to be financed with long-term funds. The dynamic gearing, calculated as net financial debt/ EBITDA, will always remain below 3 and will stabilize at 1.5 in the long term.
31

ANNUAL REPORT 2017GROUP MANAGEMENT REPORT Disclaimer
This management report contains forward-looking statements about expected developments. These statements are based on current assessments and inherently entail risks and uncertainties. Actual events may differ from the statements formulated here.
Salzburg, February 9, 2018
The Board of Directors Ralf Göttel Guido Huppertz Isabel Diaz Rohr
Disclaimer
32

ANNUAL REPORT 2017CONSOLIDATED FINANCIAL STATEMENTS Contents
Contents
CONSOLIDATED FINANCIAL STATEMENTS
Consolidated Income Statement 35
Consolidated Statement of Comprehensive Income 36
Consolidated Statement of Financial Position 37
Consolidated Statement of Cash Flows 39
Consolidated Statement of Changes in Equity 41
Notes to the Consolidated Financial Statements 43
General Information 43
Information on the Company 43Basis of preparation 43New accounting standards 44Consolidation 49─ Principles of consolidation 49─ Companies included in the consolidated financial statements 50Accounting policies 51─ Foreign currency translation 52─ Recognition of income and expenses 52─ Government grants 53─ Intangible assets 53
─ Property, plant and equipment 54─ Impairments 54─ Investments in associates 56─ Borrowing costs 56─ Inventories 56─ Deferred taxes 56─ Financial instruments 57─ Cash and cash equivalents 57─ Employee benefits 58─ Provisions 58─ Leasing 59─ Assumptions and estimates 59
Notes to the Consolidated Income Statement 60
Revenue 60Cost of sales 60Other operating income 60Other operating expenses 60Net finance result 61Income taxes 62
33

ANNUAL REPORT 2017CONSOLIDATED FINANCIAL STATEMENTS Contents
Notes to the Consolidated Statement of Financial Position 63
Intangible assets 63Property, plant and equipment 66Investments in associates 69Deferred tax assets and liabilities 70Other non-current receivables and assets 71Inventories 72Receivables 72─ Trade receivables 72─ Receivables from construction contracts 73─ Other current receivables and assets 73Cash and cash equivalents 74Equity 74Provisions 75Provisions for pensions and similar obligations 76Financial liabilities 80Income tax liabilities 80Other current liabilities 80
Additional information 81
Financial risk management 81─ Foreign exchange risk 81─ Interest rate risk 82─ Commodity price risk 82─ Default risk 84─ Liquidity risk 84─ Capital management 87Derivative financial instruments and hedge accounting 87Additional information concerning financial instruments 88Consolidated statement of cash flows 97Contingent liabilities and contingent assets 98Number of employees 99Governing bodies 99Related party transactions 100Events after the reporting period 101Auditor’s fees and services 101Proposed appropriation of profit 101
34

ANNUAL REPORT 2017CONSOLIDATED FINANCIAL STATEMENTS Consolidated Income Statement (IFRS)
Consolidated Income Statement (IFRS)for the financial year from January 1, 2017 to December 31, 2017
€ THOUSAND NOTe 2017 2016
Sales 6) 7,856,114 7,423,354
Cost of sales 7) -7,115,918 -6,688,564
Gross profit 740,196 734,790
Selling expenses -215,085 -202,440
Administration expenses -319,012 -336,745
Research and development expenses -87,404 -94,245
Other operating income 8) 138,329 125,693
Other operating expenses 9) -50,272 -35,875
EBIT 206,752 191,177
Financial result 10) -66,383 -49,101
Income from associates 14) 1,396 481
Result before tax 141,765 142,557
Income taxes 11) -41,005 -31,612
Result for the period 100,760 110,945
of which:
Attributable to owners of parent company 90,413 103,541
Non-controlling interests 10,347 7,404
CONSOLIDATED INCOME STATEMENT (IFRS) 3.1
35

ANNUAL REPORT 2017CONSOLIDATED FINANCIAL STATEMENTS Consolidated Statement of Comprehensive Income (IFRS)
CONSOLIDATED STATEMENT OF COMPREHENSIVE INCOME (IFRS) 3.2
€ THOUSAND NOTe 2017 2016
Result for the period 20) 100,760 110,945
Items that will not be reclassified to the consolidated income statement in future periods:
Actuarial gains (losses) -5,440 -22,682
Income taxes on these components of other comprehensive income 2,805 6,286
-2,635 -16,396
Items which can be reclassified to the consolidated income statement in future periods:
Gains (losses) on exchange differences on translation for foreign operations -73,286 15,651
Reclassification of exchange differences on translation of divested foreign operations recognized in the income statement 0 139
Gains (losses) on the measurement of cash flow hedges 6,913 -4,420
Reclassification of amounts of cash flow hedges recognized in the income statement 11,977 11,750
Income taxes on these components of other comprehensive income -5,496 -1,434
-59,892 21,686
Total comprehensive income 38,233 116,235
of which:
Attributable to owners of parent company 30,848 110,627
Non-controlling interests 7,385 5,608
Consolidated Statement of Comprehensive Income (IFRS)for the financial year from January 1, 2017 to December 31, 2017
36

ANNUAL REPORT 2017CONSOLIDATED FINANCIAL STATEMENTS Consolidated Statement of Financial Position (IFRS) for the period ended December 31, 2017
Consolidated Statement of Financial Position (IFRS) for the period ended December 31, 2017
€ THOUSAND NOTe DECEMBER 31, 2017 December 31, 2016
Intangible assets 12) 34,167 45,251
Goodwill 12) 6,442 6,442
Property, plant and equipment 13) 2,308,879 2,350,811
Investments in associates 14) 11,223 40,581
Deferred tax assets 15) 130,619 144,066
Non-current income tax receivables 596 260
Other non-current receivables and assets 16) 55,922 30,348
Non-current assets 2,547,847 2,617,760
Inventories 17) 887,282 803,487
Trade receivables 18.1) 700,147 623,127
Receivables from contract production 18.2) 11,663 8,095
Current income tax receivables 54,258 40,372
Other current receivables and assets 18.3) 254,959 315,414
Cash and cash equivalents 19) 682,259 357,618
Current assets 2,590,567 2,148,114
Total assets 5,138,415 4,765,874
Assets
CONSOLIDATED STATEMENT OF FINANCIAL POSITION AS AT DECEMBER 31, 2017 (IFRS) 3.3
37

ANNUAL REPORT 2017CONSOLIDATED FINANCIAL STATEMENTS Consolidated Statement of Financial Position (IFRS) for the period ended December 31, 2017
CONSOLIDATED STATEMENT OF FINANCIAL POSITION AS AT DECEMBER 31, 2017 (IFRS) 3.3
Consolidated Statement of Financial Position (IFRS) for the period ended December 31, 2017Liabilities
€ THOUSAND NOTe DECEMBER 31, 2017 December 31, 2016
Issued capital 200 200
Retained earnings 175,275 175,275
Other reserves 861,635 857,898
Equity attributable to owners of parent company 1,037,110 1,033,373
Non-controlling interests 64,851 58,219
Total shareholders' equity 20) 1,101,961 1,091,592
Non-current financial liabilities 23) 1,537,439 1,332,802
Deferred tax liabilities 15) 36,302 34,853
Other non-current liabilities 24,750 62,861
Pension provisions 22) 401,496 395,747
Other non-current provisions 21) 51,729 77,412
Non-current liabilities 2,051,716 1,903,675
Current financial liabilities 23) 258,128 209,230
Trade payables 1,258,322 1,044,280
Current income tax liabilities 24) 15,555 11,992
Other current liabilities 25) 361,329 365,247
Other current provisions 21) 91,403 139,857
Current liabilities 1,984,738 1,770,607
Liabilities 4,036,453 3,674,281
Total shareholders’ equity and liabilities 5,138,415 4,765,874
38

ANNUAL REPORT 2017ANNUAL REPORT 2017
Consolidated Statement of Cash Flows (IFRS)for the financial year from January 1, 2017 to December 31, 2017
€ THOUSAND 2017 2016
Cash flow from operating activities
EBIT 206,752 191,177
Interest paid -68,949 -75,550
Interest received 10,216 13,440
Dividends received 2,473 45
Income taxes paid / received (net) -39,214 -26,587
Depreciation, amortization and impairment of property, plant and equipment and intangible assets 278,987 226,162
Changes in non-current provisions -22,564 20,333
Other non-cash transactions 35,075 -11,347
Cash flow from profit 402,777 337,673
Changes in inventories -126,925 -49,912
Changes in trade receivables -121,146 -76,063
Changes in trade payables and prepayments received 298,402 206,437
Changes in working capital 50,331 80,462
Changes in current provisions -43,967 -491
Changes in other receivables -4,332 -5,723
Changes in other liabilities -15,899 16,104
Changes in other assets and liabilities -41,589 5,117
Cash flow from operating activities 347,321 433,142
See Note 29.
CONSOLIDATED STATEMENT OF CASH FLOWS (IFRS) 3.4
CONSOLIDATED FINANCIAL STATEMENTS Consolidated Statement of Cash Flows (IFRS)3939
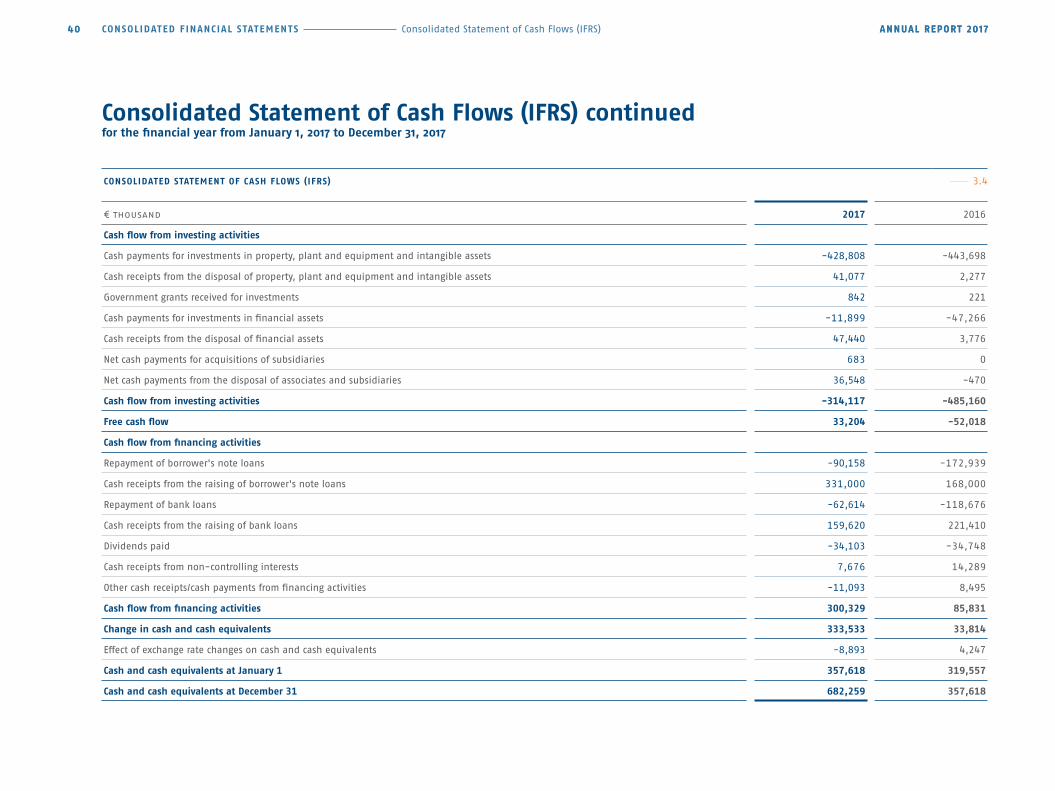
ANNUAL REPORT 2017CONSOLIDATED FINANCIAL STATEMENTS Consolidated Statement of Cash Flows (IFRS) ANNUAL REPORT 2017
CONSOLIDATED STATEMENT OF CASH FLOWS (IFRS) 3.4
€ THOUSAND 2017 2016
Cash flow from investing activities
Cash payments for investments in property, plant and equipment and intangible assets -428,808 -443,698
Cash receipts from the disposal of property, plant and equipment and intangible assets 41,077 2,277
Government grants received for investments 842 221
Cash payments for investments in financial assets -11,899 -47,266
Cash receipts from the disposal of financial assets 47,440 3,776
Net cash payments for acquisitions of subsidiaries 683 0
Net cash payments from the disposal of associates and subsidiaries 36,548 -470
Cash flow from investing activities -314,117 -485,160
Free cash flow 33,204 -52,018
Cash flow from financing activities
Repayment of borrower's note loans -90,158 -172,939
Cash receipts from the raising of borrower's note loans 331,000 168,000
Repayment of bank loans -62,614 -118,676
Cash receipts from the raising of bank loans 159,620 221,410
Dividends paid -34,103 -34,748
Cash receipts from non-controlling interests 7,676 14,289
Other cash receipts/cash payments from financing activities -11,093 8,495
Cash flow from financing activities 300,329 85,831
Change in cash and cash equivalents 333,533 33,814
Effect of exchange rate changes on cash and cash equivalents -8,893 4,247
Cash and cash equivalents at January 1 357,618 319,557
Cash and cash equivalents at December 31 682,259 357,618
Consolidated Statement of Cash Flows (IFRS) continuedfor the financial year from January 1, 2017 to December 31, 2017
4040

ANNUAL REPORT 2017CONSOLIDATED FINANCIAL STATEMENTS Consolidated Statement of Changes in Equity (IFRS) ANNUAL REPORT 2017
Consolidated Statement of Changes in Equity (IFRS)for the financial year from January 1, 2017 to December 31, 2017
CONSOLIDATED STATEMENT OF CHANGES IN EQUITY (IFRS) 3.5
ANNUAL REPORT 2017
€ THOUSAND Issued capital Retained earnings
Other reserves
€ THOUSAND
Other reservesEquity attributable
to owners of parent company
Non-controlling interests
Total shareholders' equity
Foreign currency translation reserve
Cash flow hedging reserve
Reserve for actuarial gains/losses Other items Total
Balance as at January 1, 2016 200 175,275 – 19,941 – 21,325 – 130,812 Balance as at January 1, 2016 934,403 762,325 937,800 57,827 995,627
Result for the period Result for the period 103,541 103,541 103,541 7,404 110,945
Other income (after tax) 17,319 5,894 – 16,126 Other income (after tax) 7,086 7,086 -1,797 5,290
Company formation Company formation 0 0 14,289 14,289
Other changes 819 Other changes -873 -54 -54 243 189
Dividends paid Dividends paid -15,000 -15,000 -15,000 -19,748 -34,748
Balance at December 31, 2016 = Balance at January 1, 2017 200 175,275 -2,622 -15,431 -146,119 Balance at December 31, 2016 = Balance at January 1, 2017 1,022,071 857,898 1,033,373 58,219 1,091,592
Result for the period Result for the period 90,413 90,413 90,413 10,347 100,760
Other income (after tax) -70,173 13,397 -2,789 Other income (after tax) -59,565 -59,565 -2,962 -62,527
Capital increases Capital increases 0 0 7,676 7,676
Other changes Other changes -1,111 -1,111 -1,111 -327 -1,438
Dividends paid Dividends paid -26,000 -26,000 -26,000 -8,103 -34,103
Balance at December 31, 2017 200 175,275 -72,795 -2,035 -148,908 Balance at December 31, 2017 1,085,373 861,635 1,037,110 64,851 1,101,961
See Note 20. See Note 20.
414141

ANNUAL REPORT 2017CONSOLIDATED FINANCIAL STATEMENTS Consolidated Statement of Changes in Equity (IFRS) ANNUAL REPORT 2017
Consolidated Statement of Changes in Equity (IFRS) continuedfor the financial year from January 1, 2017 to December 31, 2017
€ THOUSAND Issued capital Retained earnings
Other reserves
€ THOUSAND
Other reservesEquity attributable
to owners of parent company
Non-controlling interests
Total shareholders' equity
Foreign currency translation reserve
Cash flow hedging reserve
Reserve for actuarial gains/losses Other items Total
Balance as at January 1, 2016 200 175,275 – 19,941 – 21,325 – 130,812 Balance as at January 1, 2016 934,403 762,325 937,800 57,827 995,627
Result for the period Result for the period 103,541 103,541 103,541 7,404 110,945
Other income (after tax) 17,319 5,894 – 16,126 Other income (after tax) 7,086 7,086 -1,797 5,290
Company formation Company formation 0 0 14,289 14,289
Other changes 819 Other changes -873 -54 -54 243 189
Dividends paid Dividends paid -15,000 -15,000 -15,000 -19,748 -34,748
Balance at December 31, 2016 = Balance at January 1, 2017 200 175,275 -2,622 -15,431 -146,119 Balance at December 31, 2016 = Balance at January 1, 2017 1,022,071 857,898 1,033,373 58,219 1,091,592
Result for the period Result for the period 90,413 90,413 90,413 10,347 100,760
Other income (after tax) -70,173 13,397 -2,789 Other income (after tax) -59,565 -59,565 -2,962 -62,527
Capital increases Capital increases 0 0 7,676 7,676
Other changes Other changes -1,111 -1,111 -1,111 -327 -1,438
Dividends paid Dividends paid -26,000 -26,000 -26,000 -8,103 -34,103
Balance at December 31, 2017 200 175,275 -72,795 -2,035 -148,908 Balance at December 31, 2017 1,085,373 861,635 1,037,110 64,851 1,101,961
See Note 20. See Note 20.
CONSOLIDATED STATEMENT OF CHANGES IN EQUITY (IFRS) 3.5
4242
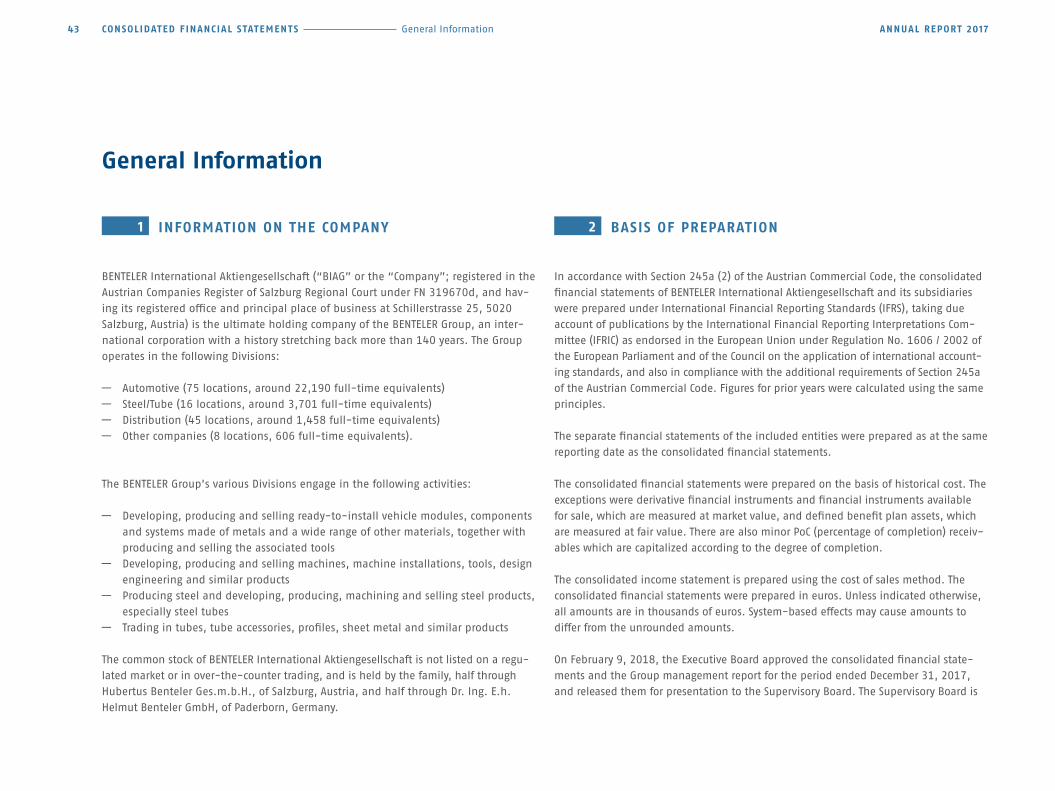
ANNUAL REPORT 2017CONSOLIDATED FINANCIAL STATEMENTS General Information
INFORMATION ON THE COMPANY
BENTELER International Aktiengesellschaft (“BIAG” or the “Company”; registered in the Austrian Companies Register of Salzburg Regional Court under FN 319670d, and hav-ing its registered office and principal place of business at Schillerstrasse 25, 5020 Salzburg, Austria) is the ultimate holding company of the BENTELER Group, an inter-national corporation with a history stretching back more than 140 years. The Group operates in the following Divisions:
─ Automotive (75 locations, around 22,190 full-time equivalents) ─ Steel/Tube (16 locations, around 3,701 full-time equivalents) ─ Distribution (45 locations, around 1,458 full-time equivalents) ─ Other companies (8 locations, 606 full-time equivalents).
The BENTELER Group’s various Divisions engage in the following activities:
─ Developing, producing and selling ready-to-install vehicle modules, components and systems made of metals and a wide range of other materials, together with producing and selling the associated tools
─ Developing, producing and selling machines, machine installations, tools, design engineering and similar products
─ Producing steel and developing, producing, machining and selling steel products, especially steel tubes
─ Trading in tubes, tube accessories, profiles, sheet metal and similar products The common stock of BENTELER International Aktiengesellschaft is not listed on a regu-lated market or in over-the-counter trading, and is held by the family, half through Hubertus Benteler Ges.m.b.H., of Salzburg, Austria, and half through Dr. Ing. E.h. Helmut Benteler GmbH, of Paderborn, Germany.
1
General Information
BASIS OF PREPARATION
In accordance with Section 245a (2) of the Austrian Commercial Code, the consolidated financial statements of BENTELER International Aktiengesellschaft and its subsidiaries were prepared under International Financial Reporting Standards (IFRS), taking due account of publications by the International Financial Reporting Interpretations Com-mittee (IFRIC) as endorsed in the European Union under Regulation No. 1606 / 2002 of the European Parliament and of the Council on the application of international account -ing standards, and also in compliance with the additional requirements of Section 245a of the Austrian Commercial Code. Figures for prior years were calculated using the same principles.
The separate financial statements of the included entities were prepared as at the same reporting date as the consolidated financial statements.
The consolidated financial statements were prepared on the basis of historical cost. The exceptions were derivative financial instruments and financial instruments available for sale, which are measured at market value, and defined benefit plan assets, which are measured at fair value. There are also minor PoC (percentage of completion) receiv-ables which are capitalized according to the degree of completion.
The consolidated income statement is prepared using the cost of sales method. The consolidated financial statements were prepared in euros. Unless indicated otherwise, all amounts are in thousands of euros. System-based effects may cause amounts to differ from the unrounded amounts.
On February 9, 2018, the Executive Board approved the consolidated financial state-ments and the Group management report for the period ended December 31, 2017, and released them for presentation to the Supervisory Board. The Supervisory Board is
2
43

ANNUAL REPORT 2017CONSOLIDATED FINANCIAL STATEMENTS General Information
expected to approve the consolidated financial statements and the Group management report at its ordinary meeting on March 16, 2018.
3 NEW ACCOUNTING STANDARDS
This section lists all standards and interpretations released by the IASB (Interna-tional Accounting Standards Board) and IFRIC that were applied for the first time in the current reporting period, or that must be applied in future periods.
The application of the following new standards and amendments of existing stand-ards became mandatory in the 2017 financial year:
NEW ACCOUNTING STANDARDS – CURRENT REPORTING PERIOD 3.6
Standard / Interpretation
Application obligatory in EU for financial years beginning on or after
Endorsed by the EU as of December 31, 2017
Effects on BENTELER Group
IAS 7 Statement of Cash Flows (amendment: disclosure initiative) January 1, 2017 Yes Additional note
IAS 12 Income Taxes (amendment: recognition of deferred tax assets for unrealized losses) January 1, 2017 Yes Insignificant
44

ANNUAL REPORT 2017CONSOLIDATED FINANCIAL STATEMENTS General Information
The following standards, interpretations and amendments to existing standards have already been published by the IASB, but their application was not yet obligatory for the current reporting period. The Company has decided not to apply them early on a voluntary basis.
NEW ACCOUNTING STANDARDS – CURRENT REPORTING PERIOD 3.7
Publication by IASB
Application obligatory in EU for financial years
beginning on or afterEndorsed by the EU as of December 31, 2017
Effects on BENTELER Group
New standards and interpretations
IFRS 9 Financial Instruments July 24, 2014 January 1, 2018 YesSee separate presentation
IFRS 16 Leases January 13, 2016 January 1, 2019 YesSee separate presentation
IFRS 15 Revenue from Contracts with Customers May 28, 2016 January 1, 2018 YesSee separate presentation
IFRIC 22 Foreign Currency Transactions and Advance Consideration December 8, 2016 January 1, 2018 No Insignificant
IFRS 17 Insurance Contracts May 18, 2017 January 1, 2021 No None
IFRIC 23 Uncertainty over Income Tax Treatments June 7, 2017 January 1, 2019 No Under review
Table continued on page 46
45

ANNUAL REPORT 2017CONSOLIDATED FINANCIAL STATEMENTS General Information
IFRS 15 IFRS 15, Revenue from Contracts with Customers, was published by the IASB in May 2014 and amended in April 2016. The new standard introduces a principles-based five-step model for revenue recognition and replaces standards IAS 11 and IAS 18 as well as interpretations IFRIC 13, IFRIC 15, IFRIC 18 and SIC-31.
The standard applies to annual reporting periods beginning on or after January 1, 2018 and early application is permitted. The new standard can be applied on a full retrospective or modified retrospective basis.
NEW ACCOUNTING STANDARDS – CURRENT REPORTING PERIOD 3.7
Publication by IASB
Application obligatory in EU for financial years
beginning on or afterEndorsed by the EU as of December 31, 2017
Effects on BENTELER Group
Amendments to existing standards and interpretations
IFRS 15Revenue from Contracts with Customers (amendments: date of entry into force) September 12, 2015 January 1, 2018 Yes
See separate presentation
IFRS 15 Revenue from Contracts with Customers (clarifications) April 12, 2016 January 1, 2018 YesSee separate presentation
IFRS 2Share-based Payment (amendments: clarifications of classification and measurement of share-based payment transactions) June 20, 2016 January 1, 2018 No None
IFRS 4 Insurance Contracts (amendments: applying IFRS 9 with IFRS 4) September 12, 2016 January 1, 2018 Yes None
MiscellaneousImprovements to International Financial Reporting Standards, 2014-2016 cycle December 8, 2016
January 1, 2018 / January 1, 2017 No None
IAS 40 Investment Property (amendments: transfers of investment property) December 8, 2016 January 1, 2018 No None
IFRS 9Financial Instruments (amendments: prepayment features with negative compensation) October 12, 2017 January 1, 2019 No
See separate p resentation
IAS 28Investments in Associates and Joint Ventures (amendments: long-term investments in associates and joint ventures) October 12, 2017 January 1, 2019 No Under review
MiscellaneousImprovements to International Financial Reporting Standards, 2015-2017 cycle December 12, 2017 January 1, 2019 No Under review
[CONTINUED]
46

ANNUAL REPORT 2017CONSOLIDATED FINANCIAL STATEMENTS General Information
BENTELER intends to apply IFRS 15 for the first time on January 1, 2018 using the modi-fied retrospective method. BENTELER began an analysis of the potential impacts of the new standard in 2016 and completed it in 2017. Since the analysis was conducted on the basis of the information currently available, amendments may be made in the future based on new information.
Revenues in the Automotive Division are generated from the development, produc-tion and sale of ready-to-install vehicle modules, components and systems made of metals and a wide range of other materials, together with the production and sale of the associated tools. Revenues are also generated from the development, production and sale of machines, machine installations, tools, design engineering and similar products. The Steel/Tube Division generates revenues from steel production and the development, production, machining and sale of steel products, especially steel tubes, while the Distribution Division generates its revenues from trading in tubes, tube accessories, profiles, sheet metal and similar products.
BENTELER expects the application of IFRS 15 to have no material effects on its revenue recognition. Only the provisions on contract costs are expected to have a positive impact on equity of €7.5 million. The balance sheet items concerned are listed below:
ITEMS OF THE STATEMENT OF FINANCIAL POSITION AFFECTED BY THE APPLICATION OF IFRS 15 3.8
€ THOUSAND Assets Liabilities
Other non-current receivables and assets 5,625
Other current receivables and assets 1,875
Retained earnings 7,500
The note disclosures will also increase on the basis of the detailed requirements of IFRS 15. These increased disclosures will concern particularly Section 5, Accounting policies, and Section 6, Revenue.
IFRS 9The IASB published the final version of IFRS 9, Financial Instruments, in July 2014. This standard replaces IAS 39 and all previous versions of IFRS 9. The new standard covers the classification and measurement of financial instruments, impairment and hedge accounting.
IFRS 9 applies to annual reporting periods beginning on or after January 1, 2018. Early application is permitted. With the exception of the provisions on hedge accounting, the new standard is applicable retrospectively. The provisions on hedge accounting are to be applied as far as possible prospectively.
BENTELER intends to introduce IFRS 9 on the corresponding date of initial application without adjustment to comparative information. In 2017 BENTELER analyzed the likely effects of the new standard on classification and measurement, impairment and hedge accounting. Since this analysis was conducted on the basis of the information currently available, the effects may differ on the basis of future information. With the exception of impairments, BENTELER expects the initial application of IFRS 9 to have no material effects on the consolidated financial statements. A decrease in impairments is expected due to the introduction of the expected loss model, which in turn will have a positive effect on equity.
Classification and measurement: BENTELER expects the new classification and measure-ment provisions of IFRS 9 to have no material effects. The financial instruments hith-erto recognized in profit or loss at fair value are expected to continue to be carried at fair value. Through the exercise of the fair value option it is expected that equity in -struments hitherto recognized outside profit or loss at fair value will also continue to
47
Headline fehlt

ANNUAL REPORT 2017CONSOLIDATED FINANCIAL STATEMENTS General Information
be recognized outside profit or loss at fair value. Financial instruments in the loans and receivables category include financial instruments which are held for the collection of cash flows and from which interest and principal payments are expected, so these are carried at amortized cost.
Impairments: Under IFRS 9, impairments must in future be recognized on the basis of expected credit losses and no longer on the basis of incurred credit losses. On the basis of the analysis conducted in 2017, impairments are expected to decrease by approxi-mately €2 million. For its trade receivables and receivables from contract production BENTELER will adopt the simplified approach whereby the expected loss is recognized immediately in respect of the full term.
Hedge accounting: Based on the analysis, all hedge accounting carried out hitherto also meets the requirements of IFRS 9. Since IFRS 9 does not change the basic principles of hedge accounting, BENTELER does not expect any material effects on the consoli-dated financial statements.
IFRS 16IFRS 16, Leases, was published by the IASB in January 2016 and replaces the previous standards IAS 17, IFRIC 4, SIC-15 and SIC-27. The new standard covers the recognition, measurement and presentation of leases and provides for lessees to recognize most leases – as in the case of the recognition provisions for finance leases under IAS 17. Exceptions apply for short-term leases and leases of low-value assets. In future a lease asset (right of use) and a lease liability will be recognized at the inception of a lease. Lease payments will be divided into interest and principal as is already the case under IAS 17. In addition the lease liability and the right of use must be remeasured if certain events occur (e.g. change of lease term). The recognition rules for lessors are broadly the same as the provisions of IAS 17.
The standard applies to annual reporting periods beginning on or after January 1, 2019. Early application is permitted provided there is simultaneous or earlier application of IFRS 15. The new standard can be applied on a full retrospective or modified retrospec-tive basis. BENTELER intends to apply IFRS 16 for the first time on January 1, 2019 using the modified retrospective method. The analysis of the potential effects of the new standard was initiated in 2017. Since the analysis was conducted on the basis of the information currently available, amendments may be made in the future based on new information.
On the basis of the analysis conducted hitherto, BENTELER expects the assets and liabil-ities to increase by the amount of the rental payments under non-cancellable opera-ting leases. The initial application of IFRS 16 is not expected to have any material effect on equity.
The analysis initiated in 2017 will be continued in 2018 in order to assess the effects of the new standard on BENTELER’s consolidated financial statements.
Other information:In addition, there are a number of further standards and amendments that either are not relevant to the Group, or have no influence on the Group’s earnings, assets or li abilities. These will be applied once their application is obligatory in the EU (after endorsement).
48

ANNUAL REPORT 2017CONSOLIDATED FINANCIAL STATEMENTS General Information
4 CONSOLIDATION
4.1 Principles of consolidation
The consolidated financial statements include BIAG and all significant subsidiaries in which BIAG has the power to exercise a controlling influence on the basis of a con-tractual agreement (control relationship). Control is deemed to exist within the meaning of IFRS 10 if BENTELER has power over the investee, is exposed to risk from variable returns and there is a connection between power and variable returns. Sub-sidiaries are fully consolidated in the consolidated financial statements from the date on which the power of control is obtained. Entities are deconsolidated as at the date on which the Group ceases to have control.
Business combinations are recognized using the acquisition method under IFRS 3. In the initial consolidation, identifiable assets and liabilities are measured at fair value. A positive difference between the consideration transferred and the Group’s share of the net fair value of the acquired assets and liabilities is recognized as goodwill. The option of applying the full goodwill method, whereby goodwill resulting in the con-text of an acquisition is also calculated pro rata to the minority interests, has not been exercised. Any negative difference is recognized in profit or loss as at the acqui-sition date, if a review indicates that all assets acquired and liabilities assumed have been correctly identified and measured.
Non-controlling interests represent the share of earnings and net assets that is not attributable to the Group. Any profit or loss attributable to these interests is pre-sented separately in the statement of comprehensive income from the share of profit or loss attributable to the owners of the parent company. In the statement of finan-cial position, non-controlling interests are presented within equity, separately from the equity attributable to the owners of the parent company. Transactions (acquisi-tions and sales) entered into with non-controlling interests that do not result in a loss of control are accounted for as equity transactions.
Associates are entities over which the Company can exercise a significant influence on financial and operating policy decisions but which it cannot control. Associates are accounted for using the equity method. A significant influence is deemed to exist when the Group directly or indirectly holds 20% or more of the voting rights.
Joint ventures are entities that are controlled jointly on the basis of a contractual agreement between two or more parties, and to which the parties have rights to the net assets. In line with IFRS 11, they are reported using the equity method.
With regard to interests held in a joint operation (in which there is no separate jointly managed entity and there are no joint assets), the Group recognizes only the assets it controls, the liabilities and expenses it incurs and the share of the income that it earns from the sale of goods or services by the joint operation.
Investments in entities whose impact on the Group’s financial position and profit or loss is of minor significance, as well as other investments over which the BENTELER Group does not exercise a significant influence, are accounted for in accordance with IAS 39 as financial instruments.
Goodwill that results from the acquisition of a subsidiary is recognized separately in the balance sheet. Goodwill resulting from the acquisition of an associate or joint venture is included in the amortized carrying amount of the investment in the asso-ciate or joint venture. In the event of the sale of a subsidiary, associate or joint ven-ture, the attributable portion of goodwill is taken into account in measuring the net gain or loss on disposal.
Goodwill is tested annually and whenever there is an indication of impairment. For the purposes of the impairment test, goodwill acquired in a business combination is attributed to cash-generating units that are expected to benefit from the synergies of the combination (see Note 5.6 – Impairment).
49

ANNUAL REPORT 2017CONSOLIDATED FINANCIAL STATEMENTS General Information
4.2 Companies included in the consolidated financial statements
OverviewIn the 2017 financial year, the movements in the number of fully consolidated com-panies were as follows:
DEVELOPMENT OF THE CONSOLIDATED GROUP 3.9
AustriaOther
countries Total
Included in consolidation as at December 31, 2016 4 121 125
Addition through new formation - - -
Included for the first time - 1 1
Disposals as a result of mergers/liquidation - -4 -4
Disposals as a result of sale or of loss of control -1 -3 -4
Included in consolidation as at December 31, 2017 3 115 118
Additions during the 2017 financial yearOn January 1, 2017 the subsidiary BENTELER Automotive (Tianjin) Co., Ltd., Tianjin, China, formed in 2016, was fully consolidated for the first time. The first-time inclu-sion resulted in only a limited change to the consolidated statement of financial position. The profit for the period includes losses amounting to €1,015 thousand and revenue includes €134 thousand resulting from the inclusion.
Disposals during the 2017 financial yearIn the 2017 financial year holdings of 50% of the shares of each of the subsidiaries BENTELER SGL GmbH & Co. KG of Paderborn, Germany, and BENTELER SGL Verwaltungs GmbH, Paderborn, Germany, and 100% of the participating interest held by BENTELER
SGL GmbH & Co. KG of Paderborn, Germany, in BENTELER SGL Composite Technology GmbH of Ried im Innkreis, Austria, were sold to SGL TECHNOLOGIES Composites Holding GmbH, Meitingen, Germany. The cash purchase price in the 2017 financial year amounts to €11,975 thousand.
Due to the loss of control the following assets and liabilities were deconsolidated in December 2017:
DECONSOLIDATED NET ASSETS 3.10
€ THOUSAND
Non-current assets 42,370
Inventories 4,558
Trade receivables 6,249
Other receivables 1,136
Cash and cash equivalents 7,629
Total assets 61,942
Provisions 1,379
Financial liabilities 30,484
Trade payables 6,335
Other liabilities 2,717
Total liabilities 40,915
Deconsolidated net assets 21,027
The transaction generated a deconsolidation result amounting to €402 thousand, which is included in the other operating income.
50

ANNUAL REPORT 2017CONSOLIDATED FINANCIAL STATEMENTS General Information
The subsidiary Noord-Nederlandse Schrootverwerking B.V., of Franeker, the Nether-lands, was also sold to H.R. Holding B.V. of Grafhorst, the Netherlands, in the 2017 financial year. The non-cash purchase price in the 2017 financial year amounts to €2,700 thousand.
The following assets and liabilities were therefore deconsolidated in December 2017:
DECONSOLIDATED NET ASSETS 3.11
€ THOUSAND
Non-current assets 653
Inventories 260
Trade receivables 66
Other receivables 134
Cash and cash equivalents 670
Total assets 1,783
Financial liabilities 253
Trade payables 47
Other liabilities 592
Total liabilities 892
Deconsolidated net assets 891
The deconsolidation result amounting to €1,600 thousand is included in other oper-ating income.
In order to simplify the group structure TF-Tec GmbH of Paderborn, Germany was merged with BENTELER Steel Tube GmbH of Paderborn, Germany, on January 1, 2017. Also on January 1, 2017 the subsidiary BMB Ocel s.r.o. of Ostrava-Marianske Hory, Czech Republic, was merged with BENTELER Distribution Czech Republic spol. s.r.o. of Dobríš (Prague), Czech Republic.
In addition BENTELER Benelux B.V. of Breda, Netherlands, was liquidated with effect from July 8, 2017 and BENTELER Automotive Netherlands B.V. of Helmond, the Nether-lands, was liquidated with effect from December 28, 2017.
In the 2016 financial year the participating interests in BENTELER Engineering Services AB of Västra Frölunda, Sweden, BENTELER Engineering Romania S.R.L. of Brasov, Romania, BENTELER Engineering Services B.V. of Helmond, the Netherlands, BENTELER Testing Services B.V., of Helmond, the Netherlands, and BENTELER Engineering Ser-vices GmbH of Paderborn, Germany, were sold with legal effect from January 2017. The retirement of carrying amount of interests in associates in the 2017 financial year amounts to €28,122 thousand and the cash purchase price in the 2017 financial year amounts to €32,872 thousand. The difference concerns an acquired loan.
5 ACCOUNTING POLICIES
The significant accounting policies applied in preparing the Group’s consolidated financial statements are described below. The accounting methods described were applied uniformly throughout the Group for all presented reporting periods.
51

ANNUAL REPORT 2017CONSOLIDATED FINANCIAL STATEMENTS General Information
5.1 Foreign currency translation
Translation to the functional currency (transaction difference)In the separate financial statements of the consolidated companies that are prepared in local currency, monetary items such as receivables, cash in foreign currencies and liabilities owed in foreign currencies are translated at the rate as at the end of the reporting period. The resulting foreign currency translation gains and losses are re cognized through profit or loss as other operating expenses and income. Foreign currency gains and losses of BIAG as the ultimate parent holding company result largely from financing and are recognized in the financial result. Gains and losses which result from a group of similar transactions, such as foreign currency gains and losses within the same currency are netted.
Translation to the reporting currency (translation difference)The annual financial statements of foreign Group companies whose functional currency is not the euro are translated to the Group’s reporting currency, the euro, applying the concept of a functional currency. In general, the functional currency of foreign Group companies is the local national currency. Exceptions are the following companies which have the euro as their functional currency:
─ BENTELER Distribution Hungary Kft., Budapest, Hungary ─ BENTELER Distribution Boru Sanayi ve Ticaret Limited, Cayirova/Kocaeli, Turkey ─ BENTELER Gebze Tasit Sanayi ve Ticaret Limited Sirketi, Cayirova/Kocaeli, Turkey
Assets and liabilities of foreign Group companies are translated at the closing rate at the end of the reporting period. Equity is recognized at historical rates. Positions of the expenses and income are translated to euros at the weighted average exchange rate for the period concerned. The translation differences are recognized as net gains or losses in equity. Any exchange rate differences are recorded as other comprehensive income only when the relevant unit is deconsolidated.
For the most important non-euro currencies of the BENTELER Group, the following exchange rates have been used:
FOREIGN CURRENCY EXCHANGE RATES 3.12
Average rate Closing rate
2017 2016DECEMBER 31,
2017December 31,
2016
BRL 3.65 3.82 3.97 3.43
CHF 1.12 1.09 1.17 1.07
CNY 7.66 7.34 7.81 7.32
CZK 26.30 27.04 25.54 27.02
GBP 0.88 0.82 0.89 0.86
MXN 21.44 20.68 23.67 21.76
NOK 9.37 9.27 9.84 9.09
RUB 66.19 73.35 69.37 64.46
SEK 9.65 9.47 9.84 9.55
USD 1.14 1.10 1.20 1.05
ZAR 15.07 16.15 14.81 14.44
5.2 Recognition of income and expenses
Revenue from the sale of goods and the rendering of services is recognized when the goods or services have been provided, the risks and rewards of ownership have been transferred to the customer, the amount of revenue can be measured reliably and it is probable that the amount will be paid. Moreover, the BENTELER Group may
52

ANNUAL REPORT 2017CONSOLIDATED FINANCIAL STATEMENTS General Information
retain neither any residual right of disposal, such as is commonly associated with ownership, nor any effective right of disposal over the sold assets. Revenue is re cognized under consideration of price reductions such as trade discounts, cus-tomer loyalty bonuses and rebates.
Series production contracts fulfilled within BENTELER Automotive are contracts that cover multiple elements (known as “multiple element arrangements”). Revenue for these contracts is recognized as soon as series production begins.
The associated expenses for a transaction are recognized simultaneously in profit or loss in the period in which the significant risks of ownership for the goods are transferred or the service is rendered to the customer.
For construction contracts, revenue is recognized using the PoC (Percentage of Com-pletion) method. The PoC method is only applied to BENTELER Mechanical Engin-eering companies.
The stage of completion of a contract is determined by the ratio of contract costs incurred up to the reporting date in relation to the estimated total contract costs. Construction contracts are measured with contract costs incurred up to the end of the reporting period, plus the proportion of profit according to the achieved stage of completion. Those revenues, less any prepayments received, are presented in the statement of financial position as receivables from contract production. Variations in contract work, claims and incentive payments are considered to the extent it is probable that they will result in revenue and they are capable of being reliably measured. When the outcome of a construction contract cannot be estimated reli-ably, revenue is recognized only to the extent of contract costs incurred that it is probable will be recoverable. Contract costs associated with the construction con-tract are recognized as expenses in the period in which they are incurred. If it is foreseeable that the total contract costs will exceed the total contract revenue, the expected loss is recognized immediately as an expense.
Interest is recognized as an expense or income on an accrual basis, using the effec-tive interest method. Dividend income from capital investments is recognized when the right to receive payment is established.
5.3 Government grants
Government grants are not recognized until there is reasonable assurance that the Group will comply with the conditions attaching to them and the grants will be re-ceived. Grants related to capital expenditure (grants related to assets) are deducted from the carrying amount of the asset and recognized at a reduced depreciation level over the periods and in the proportions in which depreciation expenses on these assets are recognized.
Grants not related to capital expenditure (expense-related grants) are recognized in profit or loss in the same period in which the relevant expenses they are intended to compensate are incurred.
5.4 Intangible assets
Externally acquired intangible assets are measured at their acquisition costs. Intangi-ble assets are amortized over their economic useful life.
Internally generated intangible assets are capitalized at their manufacturing cost if both the technical feasibility of completing the asset and the ability to use or sell so that probable future economic benefits will be generated can be demonstrated. The BENTELER Group distinguishes between customer-related and non-customer-related development projects. Internally developed intangible assets, which can be used for multiple customers, are capitalized whereas expenses for customer-specific develop-ments (“customer applications”) do not represent a material asset.
53

ANNUAL REPORT 2017CONSOLIDATED FINANCIAL STATEMENTS General Information
Future economic benefits of internally generated assets are derived from business plans. Capitalized costs comprise directly attributable employee costs, material costs and overhead expenditure if it can be directly attributed to preparing the asset for use.
Research and development expenses are recognized in profit or loss when incurred, unless they are to be capitalized under IAS 38.
Amortization of intangible assets is based on the following ranges of useful lives (fig-ures refer to the useful lives of the current and prior reporting period). The amortiza-tion is applied on a straight-line basis:
USEFUL LIVES OF INTANGIBLE ASSETS 3.13
Useful lives in years
Concessions, intellectual property rights 3 – 15
Capitalized development costs 3 – 7
Software 3 – 5
Other intangible assets 3 – 5
Intangible assets (except for goodwill) are derecognized at their gross value in the period in which they are fully amortized.
5.5 Property, plant and equipment
Property, plant and equipment is measured at cost less any accumulated depreciation and any accumulated impairment losses.
The acquisition cost of an item of property, plant and equipment comprises its pur-chase price and any costs directly attributable to bringing the asset to the location and
the condition necessary for it to be capable of operating in the manner intended. Rebates, bonuses and discounts are deducted from the purchase price. The cost of internally generated equipment includes all costs that are directly attributable to the production process, together with a reasonable share of production-related overheads and depreciation. Repair and maintenance costs which generate no additional eco-nomic benefit are not included in the production cost. Borrowing costs directly attrib-utable to the acquisition or production of a qualifying asset are capitalized as part of its cost. A qualifying asset is an asset that takes a period of more than one year to prepare for its intended use or sale. If an asset consists of multiple components with different useful lives, each part of the asset having a significant acquisition value is depreciated separately over its useful life.
Depreciation of property, plant and equipment is based on the following ranges of use-ful lives, and is applied on a straight-line basis. Land is not depreciated:
USEFUL LIVES OF PROPERTY, PLANT AND EQUIPMENT 3.14
Useful lives in years
Business and production buildings 10 – 50
Outdoor facilities 5 – 50
Technical equipment and machinery 4 – 50
Factory and office equipment 3 – 15
5.6 Impairments
Intangible assets and property, plant and equipment with an identifiable useful life are reviewed at the end of each reporting period, in accordance with IAS 36, to
54

ANNUAL REPORT 2017CONSOLIDATED FINANCIAL STATEMENTS General Information
determine whether there are indications of possible impairment – for example, if exceptional events or market developments indicate a possible loss of value. If any such indications are present, the assets are tested for possible impairment. An impairment loss is recognized if the recoverable amount falls below the carrying amount. The recoverable amount is defined as the higher of the value in use and the fair value less costs to sell.
In the BENTELER Group the value in use is the basis for the determination of the recoverable amount. To calculate the value in use, future expected cash flows are discounted at a risk-adjusted after-tax interest rate. Current and expected future income levels are taken into account, together with technological, economic and general development trends, on the basis of approved financial plans.
If the carrying amount exceeds the recoverable amount of the asset, the exceeding amount is recognized as an impairment loss in profit or loss. If the impairment loss exceeds the carrying amount of any goodwill allocated to a cash generating unit (CGU), the impairment loss is allocated to the other assets of the unit. For the impair-ment test, assets are combined at the lowest level for which separate cash flows can be identified. If the cash flows for an asset cannot be identified separately, the impairment test is performed on the basis of the CGU to which the asset belongs.
Impairment losses are reversed if there are indications of an increase in value and the recoverable amount is greater than the carrying amount. The upper limit for reversals of impairment losses is the amortized cost that would have resulted if no impairment had been recognized in previous years. Irrespective of whether there are indications of potential impairment, intangible assets with an indefinite life, as well as goodwill, are tested annually for impairment. Impairment exists if the carrying amount is greater than the recoverable amount.
For the purposes of impairment testing, goodwill has been allocated to the CGUs as follows:
IMPAIRMENT TEST 3.15
€ THOUSAND 2017 2016
Steel/Tube (excluding Shreveport) 5,679 5,679
Distribution 764 764
Total 6,442 6,442
The recoverable amount of the CGUs is based on the value in use, which is calculated using discounted cash flow projections. Cash flow forecasts are calculated based on the business planning for the next five years and extrapolated to perpetuity. The planning assumptions are based on historical experiences and expectations for mar-ket development.
The key assumptions used to calculate the recoverable amount for the Steel/Tube Division (excluding Shreveport), to which goodwill is primarily attributable, concern the discount rate of 6.7% (prior year: 6.9%).
Future cash flows are discounted at a rate based on the average cost of debt and the expected cost of interest on capital employed (weighted average cost of capital, “WACC”). This discount factor reflects current market estimates and the specific risks of the CGU.
The annual goodwill impairment test did not indicate an impairment loss, because the recoverable amount exceeded the carrying amount of the CGU by approximately 36%.
55

ANNUAL REPORT 2017CONSOLIDATED FINANCIAL STATEMENTS General Information
5.7 Investments in associates
At the time of acquisition, investments in associates are recorded at cost. If the cost is below the investor’s share of the fair values of the net identifiable assets of the asso-ciate at the time of acquisition, any negative difference is recognized in profit or loss.
In subsequent periods, the investment in the associate is stated at the investor’s share of the equity, unless there is an impairment loss. The carrying amount is adjusted for the investor’s share of the net profit or loss of the associate, the changes recognized directly in the associate’s other comprehensive income as well as distri-butions received from the investee.
If the recoverable amount is less than the carrying amount of the investment in an associate, the difference in values is recognized as an impairment loss. The recover-able amount is defined as the higher of the value in use and the fair value less costs to sell. The impairment is recognized in the consolidated income statement under “from associates”.
5.8 Borrowing costs
If an intangible asset or an item of property, plant or equipment requires a substan-tial period of time to prepare for its intended use or sale (“qualifying asset”), the borrowing costs directly attributable to the acquisition, production or construction of the qualifying asset are capitalized as part of the asset in accordance with IAS 23. Borrowing costs are capitalized until the assets are ready for their intended use, and are amortized over the economic useful life of the asset. All remaining borrowing costs are recognized in profit or loss as finance expenses in the period in which they are incurred.
5.9 Inventories
Inventories are normally stated at the lower of cost or net realizable value. The net realizable value represents the estimated selling price of the end product on normal market terms, less all estimated costs of completion and the estimated costs neces-sary to make the sale. Recognizable inventory risks are accounted for with appropri-ate write-downs based on coverage analyses.
The cost of inventories is determined using the moving average method, and includes the cost of acquisition and the costs incurred to bring the inventories to their current location and current condition. Production costs include cost of materials, individual production costs, other individual costs and attributable production-related over-heads. Overheads are distributed on the basis of normal capacity utilization.
5.10 Deferred taxes
Deferred tax assets and liabilities are recognized, using the asset and liability method, on all temporary differences between the carrying amounts of assets and liabilities in the consolidated financial statements and those in the balance sheet that provides the tax base as well as on consolidation measures that affect profit or loss at Group level. In addition, deferred tax assets for unused tax loss carryforwards are recognized if it is probable that taxable profits will be available against which the assets can be utilized, and it appears sufficiently certain that the unused tax loss carryforwards can in fact be utilized.
Deferred income tax assets and liabilities are measured at the tax rates and using the tax rules that are expected to apply in the period in which the liability is settled or the asset realized, based on the current legal position.
56

ANNUAL REPORT 2017CONSOLIDATED FINANCIAL STATEMENTS General Information
5.11 Financial instruments
In accordance with IAS 39, and depending on their classification, financial instru-ments are recognized either at (amortized) cost or at fair value.
Interests in unconsolidated entities, as well as securities, belong to the category “Financial assets available for sale”. They are measured at fair value at their initial recognition. If the fair values can be determined reliably, they are applied. Fluctua-tions in the value of financial assets in the “available for sale” category are recog-nized outside profit or loss in other comprehensive income, taking deferred taxes into account. Amounts recognized outside profit or loss are not included in the profit or loss for the period until either the time of their disposal or in the event of an impair-ment of the financial assets concerned.
Trade receivables, loans granted and other receivables and assets are categorized as “Loans and receivables” and are recognized at amortized cost, using the effective interest method where applicable. If collection is in doubt, the receivables are recog-nized at the lower realizable amount.
The BENTELER Group currently makes no use of the “Financial investments held to maturity” category.
Liabilities to banks, other loan liabilities, trade payables, liabilities for puttable equity instruments and other liabilities are recognized in the “Financial liabilities stated at amortized cost” category, at their amortized cost, using the effective inter-est method where applicable. Liabilities for puttable equity instruments include non-controlling interests in the equity of partnerships (limited partners’ shares). These interests are to be recognized as a liability of the BENTELER Group because they can be returned to the issuer in exchange for cash. Liabilities for puttable equity instruments are recognized at their redemption value and any changes are recog-nized in the net finance result.
All financial assets and liabilities are measured at their settlement date. Financial assets and liabilities are derecognized when the rights to payment under the invest-ment are extinguished or transferred, and the Group has transferred substantially all the risks and rewards of ownership.
The BENTELER Group normally uses derivative financial instruments only for risk reduction, especially for reducing interest rate risks, foreign exchange risks and com-modity price risks. Derivatives are recognized as at the trade date. All derivative financial instruments are recognized at fair value, in accordance with IAS 39.
The BENTELER Group uses hedge accounting if the conditions specified in IAS 39 for the formation of hedging relationships are met. Gains or losses on derivative finan-cial instruments for which cash flow hedges were possible are recognized outside profit or loss, in other comprehensive income, as at the date of realization of the underlying transaction. Any changes in profits resulting from the ineffectiveness of these derivative financial instruments are recognized in the consolidated profit or loss in the income statement.
For further information see Note 27 – “Derivative financial instruments and hedge accounting” and Note 28 – “Additional information concerning financial instru-ments”.
5.12 Cash and cash equivalents
Cash and cash equivalents include cash, sight deposits and other short-term, highly liquid financial assets that are exposed only insignificantly to the risk of fluctuations in value, and have an original maturity of not more than three months.
57

ANNUAL REPORT 2017CONSOLIDATED FINANCIAL STATEMENTS General Information
5.13 Employee benefits
The BENTELER Group makes pension commitments in various forms to employees in Ger-many. In all other countries, the BENTELER Group pays into social security pension funds as required by law (government plans) for some of its employees. Alternatively, company retirement benefits are ensured by way of a Group foundation funded by the employees of member companies.
Post-employment benefit plans are classified as either defined benefit plans or defined contribution plans, depending on their economic content, which derives from the under-lying terms and requirements for the plan’s benefits. For defined benefit retirement plans, the pension expense is calculated using the actuarial projected unit credit method provided under IAS 19. For this purpose, the pension payments to be made at the time benefits become payable, taking dynamic parameters into account, are distributed over the employees’ service time, also allowing for future adjustments in income and pensions. The pension obligations are calculated as the present value of the benefit obligation to employees, minus the fair value of plan assets, taking into account any asset ceiling, and are presented entirely under non-current provisions.
Actuarial gains and losses are recognized outside profit or loss, in other comprehensive income, and are shown in the consolidated statement of comprehensive income. Pay-ments for defined contribution plans, however, are recognized as expenses as they become payable.
If a fund asset set up to refinance pension obligations and similar liabilities exceeds those liabilities, the surplus is capitalized only to a limited degree. If payment obligations in connection with fund assets exist under minimum endowment rules for benefits already earned, an additional provision may be recognized if the economic benefit to the Company from a funding surplus, after allowing for minimum endowments still to be paid in, is limited. The limitation is determined by the present value of future refunds from the plan or by reductions in future contributions.
The service cost for pensions and similar obligations is recognized as a personnel expense. The interest expense included in the net pension expense and the return on plan assets are included within the net finance expense in the consolidated income statement.
Severance is paid if an employee is dismissed before regular retirement age, or voluntarily leaves employment in return for a severance payment. Severance payments are recog-nized when the Group has entered into an obligation. Benefits payable more than twelve months after the end of the reporting period are discounted to their present value.
5.14 Provisions
Other provisions are recognized when there is a present legal or constructive obligation to third parties as a result of past events that will probably result in a future cash out-flow whose amount can be estimated reliably. Provisions are measured at the best esti-mate of the amount of the obligation at the end of the reporting period.
Provisions with a residual term of more than one year are measured at their discounted settlement amount. Increases in provisions as a result of accruing interest are recog-nized as part of the net finance result. Expected future cash flows are discounted using a pretax interest rate that reflects current market expectations regarding the effect of interest rates. The employed interest rates are determined specifically for each maturity. For the current reporting period, they ranged from 0.0% to 2.63% (prior year: 0.0% to 2.79%).
Provisions for impending losses from onerous contracts are recognized if the benefits expected to be received under the contract or contract bundles (economic/content con-nection) are less than the unavoidable costs of meeting the obligations under the con-tract.
58

ANNUAL REPORT 2017CONSOLIDATED FINANCIAL STATEMENTS General Information
Warranty and guarantee obligations may arise by virtue of law or contract, or as a ges-ture of goodwill. Performance on these obligations may in particular be expected if the warranty period has not expired, if warranty expenses have been incurred in the past or if a specific case is currently emerging. The provision is recognized at the time at which the underlying products are sold or the service is provided. Initial recognition is based on individual estimates and values from past experience.
5.15 Leasing
Leases that transfer substantially all the risks and rewards of ownership of the leased property to the BENTELER Group, as the lessee, are classified as finance leases. In this case, the leased property is capitalized at the present value of the minimum lease payments, or the lower fair value at the commencement of the lease, and a financial debt is recognized at the same time.
If a transfer of ownership after the expiration of the lease is not sufficiently certain, the asset is depreciated on a straight-line basis over the lease term, if that term is shorter than the expected useful life. Otherwise, the asset is depreciated on a straight-line basis over its expected useful life.
Assets leased under operating leases are not recognized in the consolidated state-ment of financial position. The payments made in this regard are recognized as an expense on a straight-line basis over the term of the lease.
5.16 Assumptions and estimates
In preparing the consolidated financial statements, certain assumptions and esti-mates must be made that affect the amount and recognition of assets and liabilities, income and expenses, and contingent liabilities.
The assumptions and estimates refer primarily to the uniform determination within the Group of the economic useful lives of intangible assets and property, plant and equipment, estimates of percentages of completion for construction contracts, the circumstances under which development expenses can be capitalized, the realization of receivables, measurement of inventory, the recognition and measurement of pen-sion provisions and other provisions, and the possibility of utilizing unused tax loss carryforwards. The assumptions and estimates are based on the knowledge available as at the preparation date of the separate or consolidated financial statements.
Unforeseeable developments outside management’s control may cause actual amounts to differ from the original estimates. In that case, the underlying assump-tions, and if necessary the carrying amounts of the pertinent assets and liabilities, will be adjusted accordingly. Changes are recognized in the period in which they occur, and also in later periods if the changes affect both the current reporting period and subsequent periods.
The following entries in these notes provide further explanations about balance sheet items for which estimates and / or discretionary decisions have a significant effect on the amounts recognized in the consolidated financial statements:
─ Impairment testing (Note 5.4 – Intangible assets, Note 5.5 – Property, plant and equipment and Note 5.6 – Impairment)
─ Recognition and measurement of deferred taxes (Note 15 – Deferred tax assets and liabilities)
─ Recognition and measurement of provisions (especially provisions for onerous con-tracts) (Note 21 – Provisions)
─ Measurement of defined benefit obligations (Note 22 – Provisions for pensions and similar obligations)
59

ANNUAL REPORT 2017CONSOLIDATED FINANCIAL STATEMENTS Notes to the Consolidated Income Statement
REVENUE
Revenues of the BENTELER Group are made up as follows:
REVENUE 3.16
€ THOUSAND 2017 2016
Sales of goods 7,791,260 7,311,413
Construction contracts 64,853 59,199
Other 0 52,742
Total 7,856,114 7,423,354
COST OF SALES
The costs of sales are composed as follows:
COST OF SALES 3.17
€ THOUSAND 2017 2016
Material expenses 5,302,143 4,879,573
Other 1,813,775 1,808,991
Total 7,115,918 6,688,564
OTHER OPERATING INCOME
OTHER OPERATING INCOME 3.18
€ THOUSAND 2017 2016
Insurance claims 1,812 1,177
Foreign currency exchange gains 8,547 15,261
Gain from deconsolidation 2,002 30,360
Income from the reversal of provisions 53,771 25,031
Income from the disposal of property, plant and equipment 22,999 19,034
Government grants 2,652 1,534
Income from the reversal of bad debt allowances 2,150 686
Compensation benefits 17,667 5,057
Miscellaneous 26,728 27,554
Total 138,329 125,693
9 OTHER OPERATING EXPENSES
Other operating expenses mainly consist of depreciation and amortization of the assets of the subsidiary BENTELER Automotive Farsund AS, Farsund, Norway, amounting to €23,355 thousand and currency losses amounting to €17,066 (prior year: €26,934 thousand).
6 8
7
Notes to the Consolidated Income Statement
60

ANNUAL REPORT 2017CONSOLIDATED FINANCIAL STATEMENTS Notes to the Consolidated Income Statement
NET FINANCE RESULT
NET FINANCE RESULT 3.19
€ THOUSAND 2017 2016
Income from derivative financial instruments 54,826 47,696
Interest income from loans and other financial assets 2,251 2,831
Foreign currency exchange income 8,955 15,516
Interest income from bank accounts 5,145 3,637
Accrued interest on provisions 0 121
Other finance income 1,854 5,202
Finance income 73,030 75,004
In the 2017 financial year, other finance income includes the profit attributable to puttable equity instruments.
NET FINANCE RESULT 3.20
€ THOUSAND 2017 2016
Interest expense for financial liabilities 66,319 43,281
Expenses from derivative financial instruments 35,007 65,185
Interest expense for pension obligations 6,303 7,644
Foreign currency translation losses 31,557 7,306
Accrued interest on provisions 228 689
Finance expenses 139,413 124,104
10
61

ANNUAL REPORT 2017CONSOLIDATED FINANCIAL STATEMENTS Notes to the Consolidated Income Statement
INCOME TAXES
INCOME TAXES 3.21
€ THOUSAND 2017 2016
Current tax expense 31,640 30,875
of which for the current reporting period 36,975 32,220
of which for previous periods -5,335 -1,345
Deferred tax expense / tax income 9,365 738
Total tax expense / tax income 41,005 31,612
The following table shows the reconciliation of the expected tax expense and the actual tax expense. To calculate the expected tax expense, the profit before tax is multiplied by a weighted average tax rate of 30% (prior year: 30%).
RECONCILIATION BETWEEN EXPECTED AND DISCLOSED INCOME TAX EXPENSE
3.22
€ THOUSAND 2017 2016
Profit for the period before tax under IFRS 141,765 142,557
Group income tax rate (%) 30 % 30 %
Expected tax expense / tax income for year 42,529 42,767
Effect of changes in tax rates 1,224 -2,384
Effect of differences in tax rates -9,642 -4,449
Effect of income that is exempt from taxation and other deductions -3,329 -9,318
Effect of non-tax-deductible operating expenses and other additions 7,376 6,409
Effect of taxes from previous years recognized during the year -5,667 -3,626
Effect of income taxes not creditable toward income tax (withholding taxes and foreign taxes) 4,806 5,972
Effect of impairments / adjustments 4,111 -1,979
Other effects -403 -1,780
Total tax expense (+) / tax income (-) 41,005 31,612
11
62

ANNUAL REPORT 2017CONSOLIDATED FINANCIAL STATEMENTS Notes to the Consolidated Statement of Financial Position
INTANGIBLE ASSETS
Research expenses, amortization of capitalized development costs and non-capit-alized development costs are recognized as expenses.
TOTAL RESEARCH AND DEVELOPMENT EXPENSES 3.23
€ THOUSAND 2017 2016
Research and development expenses (total) 76,191 87,936
Capitalized development costs 0 -63
Amortization and impairment of capitalized development costs 11,213 6,372
Research and development costs recognized in the consolidated income statement 87,404 94,245
Capitalization ratio (%) * 0.0 % 0.1 %
* Capitalized development costs as a percentage of total research and development costs (before capitalization).
Research and development costs consist primarily of personnel expenses and cost of materials. The BENTELER Group has around 1,200 employees engaged in research and development across 32 locations in 18 countries. Research and development activi-ties focus particularly on lightweight construction through the development, design and production of composite structural parts and aluminum components. In the Automotive Division, the research and development is focused on lightweight con-struction technology as well as safety and efficiency in the context of product and process development. In the Steel/Tube Division, the focus is on the development of behavior and properties of materials.
12
Notes to the Consolidated Statement of Financial Position
Concessions, industrial property rights, similar rights and licenses primarily relate to expenses payable to third parties in connection with the purchase of user software.
The intangible assets do not include any limited property rights. No intangible assets have been pledged as collateral.
As in previous years, capitalized development costs do not include any borrowing costs. At the reporting date, there were contractual obligations to acquire intangible assets in an amount of €2,294 thousand (prior year: €3,319 thousand).
63

ANNUAL REPORT 2017CONSOLIDATED FINANCIAL STATEMENTS Notes to the Consolidated Statement of Financial Position
Movements in intangible assets were as follows:
DEVELOPMENT OF INTANGIBLE ASSETS 3.24
€ THOUSAND
Acquired intangible assets
(excluding goodwill)Acquired goodwill Prepayments
Internally generated intangible assets Total
Cost of acquisition or production
Balance at January 1, 2017 141,329 7,892 5,032 167,084 321,336
Additions 13,034 0 2,618 0 15,653
Changes in the scope of consolidation -795 0 0 -5,305 -6,100
Reclassifications 4,277 0 -4,277 0 0
Disposals -3,849 0 0 -4,365 -8,214
Foreign currency exchange differences -1,192 0 -85 -2,057 -3,333
Balance at December 31, 2017 152,803 7,892 3,289 155,357 319,342
Amortization
Balance at January 1, 2017 116,854 1,450 0 151,339 269,643
Current amortization 11,884 0 0 2,804 14,688
Impairments 365 0 0 8,408 8,773
Changes in the scope of consolidation -555 0 0 -3,953 -4,508
Disposals -3,843 0 0 -2,913 -6,756
Foreign currency exchange differences -1,872 0 0 -1,236 -3,107
Balance at December 31, 2017 122,833 1,450 0 154,450 278,733
Carrying amount
Balance at January 1, 2017 24,475 6,442 5,032 15,745 51,694
Balance at December 31, 2017 29,971 6,442 3,289 907 40,609
64

ANNUAL REPORT 2017CONSOLIDATED FINANCIAL STATEMENTS Notes to the Consolidated Statement of Financial Position
DEVELOPMENT OF INTANGIBLE ASSETS 3.25
€ THOUSAND
Acquired intangible assets
(excluding goodwill)Acquired goodwill Prepayments
Internally generated intangible assets Total
Cost of acquisition or production
Balance at January 1, 2016 132,287 7,892 6,094 165,027 311,300
Additions 8,815 0 3,344 63 12,221
Changes in the scope of consolidation -2,433 0 0 0 -2,433
Reclassifications 4,369 0 -4,369 0 0
Disposals -3,116 0 -23 -8 -3,146
Foreign currency exchange differences 1,407 0 -14 2,002 3,395
Balance at December 31, 2016 141,329 7,892 5,032 167,084 321,336
Amortization
Balance at January 1, 2016 111,160 1,450 0 143,838 256,448
Current amortization 9,710 0 0 6,372 16,082
Impairments 0 0 0 0 0
Changes in the scope of consolidation -2,008 0 0 0 -2,008
Disposals -3,100 0 0 0 -3,100
Foreign currency exchange differences 1,092 0 0 1,129 2,221
Balance at December 31, 2016 116,854 1,450 0 151,339 269,643
Carrying amount
Balance at January 1, 2016 21,127 6,442 6,094 21,189 54,852
Balance at December 31, 2016 24,475 6,442 5,032 15,745 51,694
65

ANNUAL REPORT 2017CONSOLIDATED FINANCIAL STATEMENTS Notes to the Consolidated Statement of Financial Position
PROPERTY, PLANT AND EQUIPMENT
PROPERTY, PLANT AND EQUIPMENT 3.26
€ THOUSAND Land and buildingsTechnical equipment
and machinery
Other equipment, factory and office
equipment
Advance payments and con
struction in progress Total
Cost of acquisition or production
Balance at January 1, 2017 860,728 2,801,385 534,503 865,685 5,062,301
Additions 22,438 179,826 34,518 176,430 413,213
Changes in the scope of consolidation -20,512 -38,104 -3,500 -701 -62,817
Reclassifications 155,715 407,714 31,167 -594,597 0
Disposals -12,117 -91,431 -37,681 -298 -141,527
Foreign currency exchange differences -27,273 -82,864 -16,503 -80,222 -206,861
Balance at December 31, 2017 978,979 3,176,527 542,505 366,297 5,064,308
Depreciation
Balance at January 1, 2017 404,395 1,911,641 395,455 0 2,711,490
Current depreciation 26,203 169,689 37,454 0 233,346
Impairments 0 22,180 0 0 22,180
Changes in the scope of consolidation -5,250 -15,365 -1,835 0 -22,450
Reclassifications 0 0 0 0 0
Disposals -6,303 -66,488 -35,482 0 -108,273
Foreign currency exchange differences -10,819 -57,628 -12,418 0 -80,864
Balance at December 31, 2017 408,226 1,964,029 383,174 0 2,755,429
Carrying amount
Balance at January 1, 2017 456,334 889,744 139,048 865,685 2,350,811
Balance at December 31, 2017 570,754 1,212,498 159,331 366,297 2,308,879
of which from finance lease 7,876 2,919 815 0 11,610
13
66

ANNUAL REPORT 2017CONSOLIDATED FINANCIAL STATEMENTS Notes to the Consolidated Statement of Financial Position
PROPERTY, PLANT AND EQUIPMENT 3.27
€ THOUSAND Land and buildingsTechnical equipment
and machinery
Other equipment, factory and office
equipment
Advance payments and con
struction in progress Total
Cost of acquisition or production
Balance at January 1, 2016 825,879 2,763,868 461,715 692,307 4,743,769
Additions 39,182 92,877 33,784 262,146 427,988
Changes in the scope of consolidation -1,098 -4,082 -3,605 1 -8,784
Reclassifications 16,103 32,859 58,998 -107,960 0
Disposals -24,907 -92,860 -20,569 -1,497 -139,833
Foreign currency exchange differences 5,569 8,724 4,179 20,689 39,161
Balance at December 31, 2016 860,728 2,801,385 534,503 865,685 5,062,301
Depreciation
Balance at January 1, 2016 391,403 1,882,313 342,972 0 2,616,688
Current depreciation 22,575 153,373 34,123 0 210,072
Impairments 0 0 0 0 0
Changes in the scope of consolidation -324 -2,825 -2,464 0 -5,613
Reclassifications 1,210 -39,052 37,843 0 0
Disposals -10,559 -85,798 -19,825 0 -116,182
Foreign currency exchange differences 90 3,630 2,806 0 6,526
Balance at December 31, 2016 404,395 1,911,641 395,455 0 2,711,490
Carrying amount
Balance at January 1, 2016 434,476 881,555 118,743 692,307 2,127,082
Balance at December 31, 2016 456,334 889,744 139,048 865,685 2,350,811
of which from finance lease 14,235 4,593 1,461 0 20,289
67

ANNUAL REPORT 2017CONSOLIDATED FINANCIAL STATEMENTS Notes to the Consolidated Statement of Financial Position
No borrowing costs were capitalized in 2017. In the previous year borrowing costs of €17,770 thousand (after deduction of investment income) were capitalized in con-nection with the hot rolling mill in Shreveport, USA. Interest rates between 1.1% and 5.7% were applied for this purpose.
In the 2017 financial year the BENTELER Group received investment grants amounting to €842 thousand (prior year: €221 thousand), which amount was deducted from the acquisition cost of the property, plant and equipment.
Property, plant and equipment include items with restricted ownership rights at a carrying amount of €2,341 thousand (prior year: €4,448 thousand). As in the previ-ous year, none of the assets within property, plant and equipment are pledged as collateral.
At the reporting date, there were contractual obligations to acquire property, plant and equipment in an amount of €114,228 thousand (prior year: €84,491 thousand).
LeasesThe BENTELER Group is a lessee under various leases. The leases comprise rented buildings as well as technical equipment and machines.
Future minimum lease payments under non-cancellable operating leases are as fol-lows for each of the various periods:
OUTSTANDING MINIMUM LEASE PAYMENTS UNDER OPERATING LEASES
3.28
€ THOUSANDDecember 31,
2017December 31,
2016
Future minimum lease payments
due within one year 43,097 38,544
due within one to five years 102,057 82,558
due after 5 years 49,493 57,766
Total 194,647 178,868
68
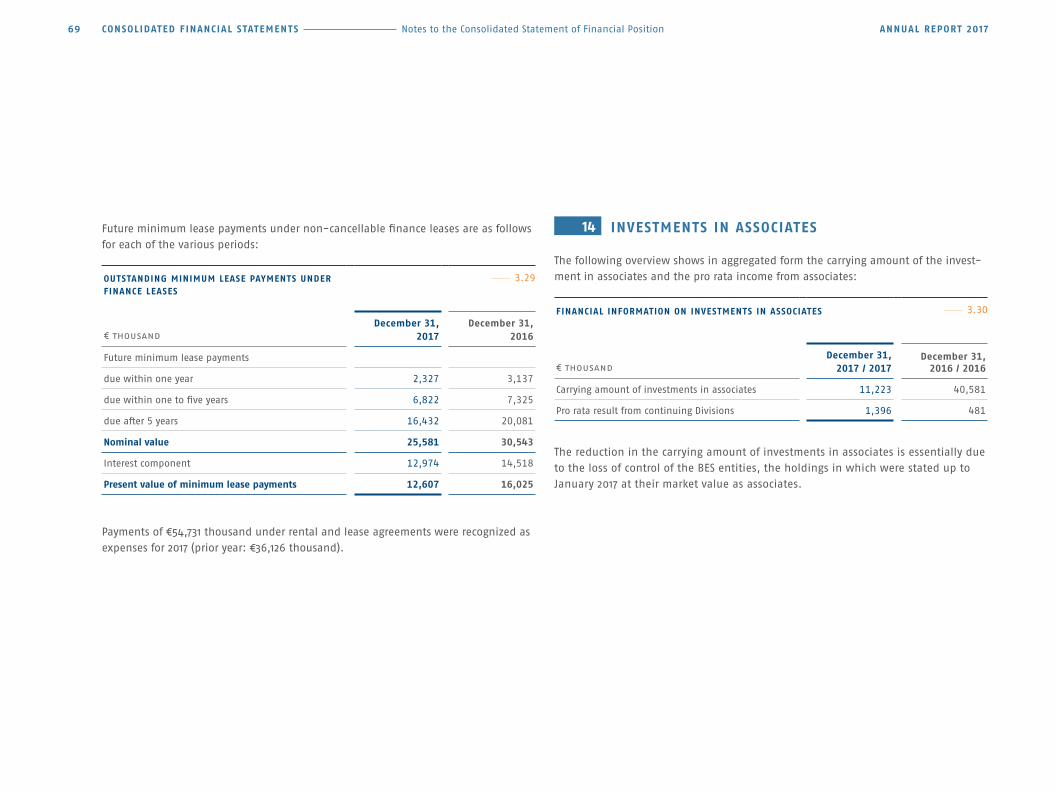
ANNUAL REPORT 2017CONSOLIDATED FINANCIAL STATEMENTS Notes to the Consolidated Statement of Financial Position
Future minimum lease payments under non-cancellable finance leases are as follows for each of the various periods:
OUTSTANDING MINIMUM LEASE PAYMENTS UNDER FINANCE LEASES
3.29
€ THOUSANDDecember 31,
2017December 31,
2016
Future minimum lease payments
due within one year 2,327 3,137
due within one to five years 6,822 7,325
due after 5 years 16,432 20,081
Nominal value 25,581 30,543
Interest component 12,974 14,518
Present value of minimum lease payments 12,607 16,025
Payments of €54,731 thousand under rental and lease agreements were recognized as expenses for 2017 (prior year: €36,126 thousand).
INVESTMENTS IN ASSOCIATES
The following overview shows in aggregated form the carrying amount of the invest-ment in associates and the pro rata income from associates:
FINANCIAL INFORMATION ON INVESTMENTS IN ASSOCIATES 3.30
€ THOUSANDDecember 31,
2017 / 2017December 31,
2016 / 2016
Carrying amount of investments in associates 11,223 40,581
Pro rata result from continuing Divisions 1,396 481
The reduction in the carrying amount of investments in associates is essentially due to the loss of control of the BES entities, the holdings in which were stated up to January 2017 at their market value as associates.
14
69

ANNUAL REPORT 2017CONSOLIDATED FINANCIAL STATEMENTS Notes to the Consolidated Statement of Financial Position
15 DEFERRED TAX ASSETS AND LIABILITIES
Deferred tax assets and liabilities result from temporary differences and unused tax loss carryforwards and are composed as follows:
ALLOCATION OF DEFERRED TAX ASSETS AND LIABILITIES TO ITEMS IN THE STATEMENT OF FINANCIAL POSITION
3.31
€ THOUSAND
December 31, 2017 December 31, 2016
Assets Liabilities Assets Liabilities
Intangible assets 58 -399 2,931 -4,397
Property, plant and equipment 7,102 -123,163 6,420 -185,679
Current and non-current financial assets 1,526 -13,963 1,872 -17,623
Inventories 18,967 -3,351 41,607 -2,695
Current and non-current receivables and other assets 11,845 -21,069 5,889 -25,585
Provisions for pensions 69,315 -8,849 63,120 -3,531
Other provisions 23,053 -16,713 34,533 -13,383
Liabilities 36,025 -5,057 36,462 -3,112
Tax loss carryforwards 111,848 0 167,736 0
Tax credits 11,842 0 4,647 0
Other deferred taxes 0 4,700 0 0
Gross value 291,581 197,264 365,217 256,005
Netting 160,962 -160,962 221,151 -221,151
Recognized in statement of financial position 130,619 36,302 144,066 34,853
Deferred tax assets and liabilities are netted if they concern the same tax authority and they are the subject of an enforceable right.
A significant part of the deferred tax liabilities in property, plant and equipment con-cerns investments in the USA, with bonus depreciation being recognized for tax pur-poses. The resulting deferred tax liabilities in respect of property, plant and equip-ment amounting to €72,246 thousand is matched by unused tax loss carryforwards of equal amount.
The decrease in deferred tax assets and liabilities is essentially due to the change in the US Federal Tax rate from 35% to 21%.
No deferred tax was recognized for unused tax loss carryforwards amounting to €161,892 thousand (prior year: €228,190 thousand).
The unused tax losses can be carried forward as follows:
UNUSED TAX LOSS CARRYFORWARDS 3.32
€ THOUSANDDecember 31,
2017December 31,
2016
Expiring in the next ten years 32,707 51,579
Expiring in more than ten years 0 3,254
Unused tax losses not subject to expiration 129,185 173,357
Total 161,892 228,190
As at December 31, 2017, the Group recognized deferred tax assets for companies that had shown a loss in the previous period. These assets exceeded the deferred tax li abil ities. The basis for recognizing deferred taxes was management’s belief that these
70

ANNUAL REPORT 2017CONSOLIDATED FINANCIAL STATEMENTS Notes to the Consolidated Statement of Financial Position
companies will earn taxable income against which the unused tax losses and deduct-ible temporary differences can be utilized.
As the conditions of IAS 12.39 were fulfilled, no deferred tax liabilities were recog-nized for temporary differences associated with investments in subsidiaries.
Potential dividend distributions to shareholders of BENTELER International Aktienge-sellschaft have no tax implications for the Group. In connection with foreseeable future intra-Group dividend distributions, deferred tax liabilities were recognized for the resulting increase in the tax base for German recipients of dividends by 5% of the gross dividend (notional non-deductible operating expenses) and for the resulting source taxes.
16 OTHER NON-CURRENT RECEIVABLES AND ASSETS
OTHER NON-CURRENT RECEIVABLES AND ASSETS 3.33
€ THOUSANDDecember 31,
2017December 31,
2016
Investments in unconsolidated entities 83 0
Securities 10,615 0
Financial receivables 15,333 7,011
Other tax assets 9,083 4,887
Prepaid expenses 7,086 9,307
Other assets 13,721 9,144
Total 55,922 30,348
The financial receivables consist mainly of derivatives.
7 1

ANNUAL REPORT 2017CONSOLIDATED FINANCIAL STATEMENTS Notes to the Consolidated Statement of Financial Position
17 INVENTORIES
INVENTORIES 3.34
€ THOUSANDDecember 31,
2017December 31,
2016
Raw materials and manufacturing supplies 360,108 348,233
Work in progress 199,683 157,212
Finished products and goods 310,242 284,050
Prepayments 17,249 13,992
Total 887,282 803,487
18 RECEIVABLES
18.1 Trade receivables
TRADE RECEIVABLES 3.35
€ THOUSANDDecember 31,
2017December 31,
2016
Trade receivables, gross 709,627 634,629
Doubtful debt allowances on trade receivables -9,480 -11,502
Carrying amount 700,147 623,127
Trade receivables consist primarily of receivables from third parties and, to a limited extent, receivables from affiliated, unconsolidated entities or associates. Trade
receivables in an amount of €330,693 thousand (prior year: €311,290 thousand) were sold under an accounts receivable facility agreement. The BENTELER Group has a normal residual default risk with regard to the sale of receivables.
Movements in doubtful debt allowances on trade receivables were as follows:
DEVELOPMENT OF DOUBTFUL DEBT ALLOWANCES ON TRADE RECEIVABLES
3.36
€ THOUSAND 2017 2016
Balance as at January 1 11,502 8,297
Additions 2,478 6,552
Reversals -2,150 -686
Utilization -2,431 -2,653
Effects of exchange rates and other changes 81 -8
Balance as at December 31 9,480 11,502
In the event of indications of irrecoverability, the carrying amounts of trade receivables are impaired individually as well as for general credit risks on the basis of a portfolio approach. Allowances for general credit risks were distributed on a percentage basis over the maturity structure of the receivables, based on experience from previous years.
72

ANNUAL REPORT 2017CONSOLIDATED FINANCIAL STATEMENTS Notes to the Consolidated Statement of Financial Position
The maturity structure of unadjusted receivables is as follows:
MATURITY STRUCTURE OF UNADJUSTED RECEIVABLES 3.37
€ THOUSANDDecember 31,
2017December 31,
2016
Receivables that are neither past due nor impaired 657,089 552,048
Receivables that are past due but not impaired 41,948 70,443
less than 30 days past due 33,913 58,798
30 to 60 days past due 649 8,741
61 to 90 days past due 3,059 1,900
more than 90 days past due 4,326 1,004
Receivables with specific doubtful debt allowances 1,110 635
Carrying amount as at December 31 700,147 623,127
At the end of the period on December 31, 2017, as in previous years, no trade receiv-ables had been pledged.
18.2 Receivables from construction contracts
Receivables from long-term construction contracts recognized using the percentage of completion method are calculated as follows:
RECEIVABLES FROM CONSTRUCTION CONTRACTS 3.38
€ THOUSANDDecember 31,
2017December 31,
2016
Incurred contract costs 30,171 31,758
Recognized gains less recognized losses 5,068 4,454
Production orders with outstanding balances receivable from customers 35,239 36,212
Prepayments and partial invoices -23,576 -28,117
Receivables from construction contracts 11,663 8,095
18.3 Other current receivables and assets
OTHER CURRENT RECEIVABLES AND ASSETS 3.39
€ THOUSANDDecember 31,
2017December 31,
2016
Prepaid expenses 19,281 11,993
Other financial assets 120,036 162,752
Other non-financial assets 115,642 140,669
Total 254,959 315,414
73

ANNUAL REPORT 2017CONSOLIDATED FINANCIAL STATEMENTS Notes to the Consolidated Statement of Financial Position
The other financial assets essentially comprise bills receivable, reserves under accounts receivable facilities amounting to €75,277 thousand (prior year: €85,957 thousand) and a short-term loan to Casper Benteler GmbH amounting to €1,281 thousand (prior year: €35,062 thousand). Casper Benteler GmbH is a related party within the meaning of IAS 24. The financial assets also include derivatives amount-ing to €19,112 thousand (prior year: €7,027 thousand). Other non-financial assets primarily include other tax receivables (particularly for value added tax and energy tax) and refund claims.
19 CASH AND CASH EQUIVALENTS
The cash and cash equivalents are available at all times and are not subject to any restrictions.
20 EQUITY
The movements in consolidated equity are shown in the statement of changes in equity, which is presented as a separate part of the financial statements. In particular, it shows the appropriation of profits.
A reverse acquisition took place in 2010. As a result of the continuation of the financial statements of the economic acquirer, the recognized issued capital and reserves are those of the legal subsidiary, BENTELER Business Services GmbH (formerly BENTELER Deutschland GmbH).
The subscribed capital as at December 31, 2017, was €200 thousand, divided into 200,000 registered no-par shares with restricted transferability. Under the Company’s articles of incorporation, two share certificates (global shares) were issued, each for one half of the shares in the same category.
The non-controlling interests (both for the profit and the equity) are primarily related to three Chinese companies. The proportion of revenue is below 1.5% of the Group’s con-solidated revenue and the total assets are below 1.8% of the Group’s total assets and are therefore not considered material.
The movements in the other components of equity were as follows (includes the amount related to non-controlling interests):
DEVELOPMENT OF OTHER COMPONENTS OF EQUITY IN THE CURRENT REPORTING PERIOD
3.40
€ THOUSAND
2017 financial year
Before tax Tax effect After tax
Foreign currency translation effects -73,286 0 -73,286
Effects of cash flow hedging 18,890 -5,496 13,394
Actuarial gains and losses -5,440 2,805 -2,635
Total 59,836 2,691 62,527
74

ANNUAL REPORT 2017CONSOLIDATED FINANCIAL STATEMENTS Notes to the Consolidated Statement of Financial Position
DEVELOPMENT OF OTHER COMPONENTS OF EQUITY IN THE PRIOR REPORTING PERIOD
3.41
€ THOUSAND
2016 financial year
Before tax Tax effect After tax
Foreign currency translation effects 15,790 0 15,790
Effects of cash flow hedging 7,330 -1,434 5,895
Actuarial gains and losses -22,682 6,286 -16,396
Total 438 4,852 5,289
21 PROVISIONS
Provisions in accordance with IAS 37 and obligations for employee benefits under IAS 19 can be summarized as follows:
PROVISIONS 3.42
€ THOUSAND NoteDecember 31, 2017
December 31, 2016
Pension provisions – noncurrent 22) 401,496 395,747
Other provisions for employee benefits 25,521 25,550
Provisions for impending losses 3,985 9,672
Provisions for guarantees and warranties 5,186 13,459
Other provisions 17,037 28,732
Other noncurrent provisions 21) 51,729 77,412
Other provisions for employee benefits 17,970 14,789
Provisions for impending losses 4,423 22,961
Provisions for guarantees and warranties 20,988 38,107
Other provisions 48,023 64,001
Other current provisions 21) 91,403 139,857
75

ANNUAL REPORT 2017CONSOLIDATED FINANCIAL STATEMENTS Notes to the Consolidated Statement of Financial Position
Statement of changes in provisions
Current and non-current provisions changed as follows during the period:
STATEMENT OF CHANGES IN PROVISIONS 3.43
€ THOUSAND
Guarantees and war
ranties EmployeesImpending
lossesOther
provisions Total
Balance at January 1, 2017 51,566 40,338 32,632 92,733 217,270
Changes in the scope of consolidation -228 -100 0 -560 -888
Additions 7,484 23,986 1,371 40,399 73,239
Utilization -5,467 -17,356 -19,549 -41,667 -84,040
Reversals -25,689 -3,382 -5,700 -19,000 -53,771
Reclassifications 0 507 0 -724 -217
Accrued interest 0 228 0 0 228
Foreign currency trans-lation -1,491 -730 -346 -6,121 -8,688
Balance at December 31, 2017 26,174 43,491 8,407 65,059 143,132
of which current 20,988 17,970 4,423 48,023 91,403
of which non-cur-rent 5,186 25,521 3,985 17,037 51,729
The provisions for warranty risks primarily cover deferred risks from customer com-plaints. They are determined on the basis of revenue generated from outside custom-ers during the year, taking historical experience into account. The provisions for warranty risks were reassessed in the 2017 financial year on the basis of these empirical values.
The provisions for employee benefits primarily comprise anniversaries as well as obli-gations under partial retirement agreements and severance. Provisions for partial retirement arrangements mainly have terms of five years or less. Collateral has been placed in a trust account to secure credit balances under the Partial Retirement Block Model under Section 8a of the German Partial Retirement Act. The funds transferred to the trustee are to be managed for the preservation of capital, and may be used in the future solely and irrevocably to meet the associated obligations. The trust assets left after performance of the partial retirement obligations represent plan assets under IAS 19.131. The obligations are shown netted against the fair value of the plan assets.
The other provisions relate primarily to sales deductions, and to a lesser extent to lit-igation risks and other taxes.
Non-current provisions are expected to be used within five years at the latest.
22 PROVISIONS FOR PENSIONS AND SIMILAR OBLIGATIONS
Some employees within the BENTELER Group are currently granted different forms of retirement benefits. Accordingly, the BENTELER Group maintains different defined benefit and defined contribution retirement plans. Defined benefit plans are ap -praised annually by independent experts.
76

ANNUAL REPORT 2017CONSOLIDATED FINANCIAL STATEMENTS Notes to the Consolidated Statement of Financial Position
The actuarial calculation of the amount of the obligation as at each measurement date is based on the following assumptions:
PARAMETERS FOR ACTUARIAL CALCULATIONS 3.44
PerceNTAgeS AS weigHTeD AverAge 2017 2016
Interest rate 1.6 1.7
Rate of increase in pensionable salaries 2.1 2.1
Inflation 1.5 1.4
RECONCILIATION OF THE LIABILITY UNDER DEFINED BENEFIT PLANS WITH PROVISIONS FOR PENSIONS AND SIMILAR OBLIGATIONS
3.45
€ THOUSANDDecember 31,
2017December 31,
2016
Present value of the liability 525,103 523,564
Fair value of plan assets -124,313 -128,258
Net balance 400,790 395,306
Assets not included as per IAS 19.57(b) 706 441
Provision for pensions and other similar commitments as at December 31 401,496 395,747
EXPENSES FROM RETROACTIVE PLAN AMENDMENTS 3.46
€ THOUSAND 2017 2016
Present value of defined benefit obligation as at January 1 523,564 497,334
Current service cost 14,560 14,004
Interest expense 7,497 9,608
Actuarial gains (losses) 5,977 20,769
of which due to change in demographic assumptions -178 -1,159
of which due to change in financial assumptions 9,859 24,982
of which due to experience-based assumptions -3,704 -3,054
Past service costs -372 -118
Settlements -629 6
Gains / losses arising from changes in foreign exchange rates -9,225 324
Employee contributions 1,655 1,729
Payments made -17,412 -16,940
Net change from company acquisitions and disposals -511 -3,153
Present value of defined benefit obligation as at December 31 525,103 523,564
77

ANNUAL REPORT 2017CONSOLIDATED FINANCIAL STATEMENTS Notes to the Consolidated Statement of Financial Position
CHANGES IN PLAN ASSETS 3.47
€ THOUSAND 2017 2016
Fair value of plan assets as at January 1 128,258 127,607
Interest income 1,215 1,962
Revaluation of plan assets 817 -2,683
Settlements -553 0
Gains / losses arising from changes in foreign exchange rates -5,653 1,219
Contributions to the pension plan 17,653 17,567
of which employers 15,998 15,838
of which employees 1,655 1,729
Paid out of plan assets -17,424 -16,954
Net change from company acquisitions and disposals 0 -460
Fair value of plan assets as at December 31 124,313 128,258
CHANGES IN ASSET CEILING 3.48
€ THOUSAND 2017 2016
Unrecognized assets as at January 1 441 1,001
Interest on unrecognized assets recognized in pro-fit or loss 18 40
Other changes in unrecognized assets 247 -600
Unrecognized assets as at December 31 706 441
The average duration of the obligation as at December 31, 2017 is 18 years (prior year: 18 years).
As at the measurement date, the plan assets comprised the following:
COMPONENTS OF PLAN ASSETS 3.49
€ THOUSANDDecember 31,
2017December 31,
2016
Equity instruments (active market) 27,417 29,643
Debt instruments (active market) 7,390 10,706
Insurance contracts 70,764 70,701
Property 14,458 11,338
Other assets 4,284 5,870
Total 124,313 128,258
The expected contributions to the plan for 2018 amount to €15,802 thousand (prior year: €15,817 thousand).
78

ANNUAL REPORT 2017CONSOLIDATED FINANCIAL STATEMENTS Notes to the Consolidated Statement of Financial Position
Changes in actuarial assumptions (ceteris paribus) affect the present value of the defined benefit obligation as shown in the table below:
IMPACT OF CHANGES IN ACTUARIAL PARAMETERS ON THE DEFINED BENEFIT OBLIGATION
3.50
€ THOUSAND
2017 financial year
Change in assumptions
Change inobligation on
decrease of parameter
Change in obligation on
increase of parameter
Interest rate 0.5 % 49,553 -43,272
Rate of pension increase 0.5 % -24,695 30,227
Rate of salary increase 0.5 % -3,212 3,568
IMPACT OF CHANGES IN ACTUARIAL PARAMETERS ON THE DEFINED BENEFIT OBLIGATION
3.51
€ THOUSAND
2016 financial year
Change in assumptions
Change inobligation on
decrease of parameter
Change in obligation on
increase of parameter
Interest rate 0.5 % 50,877 -44,226
Rate of pension increase 0.5 % -24,394 31,092
Rate of salary increase 0.5 % -3,499 3,883
The basis for the determination of the change in assumptions was an analysis of the last months.
79

ANNUAL REPORT 2017CONSOLIDATED FINANCIAL STATEMENTS Notes to the Consolidated Statement of Financial Position
23 FINANCIAL LIABILITIES
FINANCIAL LIABILITIES 3.52
€ THOUSAND
December 31, 2017 December 31, 2016
current noncurrent current noncurrent
Borrower’s note loans 113,581 598,500 89,892 378,638
Liabilities to banks 136,283 927,878 105,975 932,839
Lease liabilities 1,910 10,697 2,399 13,626
Miscellaneous 6,354 364 10,964 7,699
Total 258,128 1,537,439 209,230 1,332,802
As in previous years, liabilities to banks are not secured with either land liens or security interests.
24 INCOME TAX LIABILITIES
The non-current and current income tax liabilities comprise corporate income tax, including the German reunification surtax (“solidarity surcharge”) and local busi-ness income tax (“trade tax”), for the Group’s companies in Germany, as well as comparable income tax liabilities for companies in other countries.
25 OTHER CURRENT LIABILITIES
OTHER CURRENT LIABILITIES 3.53
€ THOUSANDDecember 31,
2017December 31,
2016
Other tax liabilities 70,232 49,637
Pending invoices payable 0 36,808
Liabilities to employees 105,195 97,764
Advance payments received 68,293 42,179
Social security liabilities 19,737 19,328
Miscellaneous other financial liabilities 20,503 21,453
Other non-financial liabilities 77,369 98,078
Total 361,329 365,247
From the 2017 financial year the pending invoices payable are stated in trade payables.
Other tax liabilities that are not related to income tax primarily concern payroll taxes and value added taxes.
Other non-financial liabilities include general deferred expenses and sales allowances.
80

ANNUAL REPORT 2017CONSOLIDATED FINANCIAL STATEMENTS Additional Information
26 FINANCIAL RISK MANAGEMENT
The BENTELER Group is exposed to various financial risks through its business opera-tions and financing transactions. The most significant of these risks are foreign exchange risks, interest rate risks, commodity price risks, default risks and liquidity risks.
The BENTELER Group additionally applies well-established controlling and manage-ment instruments to monitor financial risks. The Group’s reporting system makes it possible to detect, analyze, assess and manage financial risks on a regular basis, by way of the central Group Treasury unit. This system also includes all relevant com-panies in which the Group holds ownership interests.
26.1 Foreign exchange risk
Foreign exchange risks particularly arise where receivables, liabilities and planned transactions are not denominated in an entity’s local currency. The risk of fluctua-tions in future cash flow is mainly due to operating activities, but there is also some risk from financing and investing activities. The most significant foreign exchange risk for the BENTELER Group concerns the volatility of the euro and the US dollar.
The amount of hedging required is evaluated each quarter. Currency derivatives are used to hedge foreign exchange risks. These transactions hedge against changes in exchange rates for cash flows in foreign currencies. The functional currency is hedged, not the Group currency. The hedging horizon is typically between one and three years.
In addition to transaction-related foreign exchange risks, the Group is also exposed to translation risks for the assets and liabilities of subsidiaries outside the eurozone.
Additional Information
These long-term effects are calculated and analyzed continuously, but in general they are not hedged because the line items are of a lasting nature.
For foreign exchange risk, sensitivity analyses were performed to determine the effects of hypothetical changes in exchange rates on the Group’s result (after tax) and equity. As a basis for sensitivity to foreign exchange fluctuations, the analysis used those primary financial instruments recognized as at the end of the reporting period that were not denominated in the functional currencies of the BENTELER Group’s individual companies, together with the derivative financial instruments held in the portfolio. It was assumed that the risk at the reporting date substantially represents the risk for the financial year as a whole. The effects of the translation of foreign sub-sidiaries’ financial statements from foreign currencies into the Group’s reporting cur-rency (the euro) were not included. The Group’s tax rate of 30% (prior year: 30%) was applied as the tax rate.
An increase or decrease in the value of the euro would have the following effects on earnings after tax and equity:
SENSITIVITY ANALYSIS FOR EUR FOREIGN EXCHANGE RISK 3.54
€ THOUSAND 2017 2016
Effect on:Decrease by 10%
Increase by 10%
Decrease by 10%
Increase by 10%
Earnings after tax 279 -228 -589 454
Cash flow hedge reserve 6,016 -4,110 16,246 -17,009
Total equity 6,295 -4,338 15,658 -16,555
81

ANNUAL REPORT 2017CONSOLIDATED FINANCIAL STATEMENTS Additional Information
An increase or decrease in the value of the US dollar would have the following effects on earnings after tax and equity:
SENSITIVITY ANALYSIS FOR USD FOREIGN EXCHANGE RISK 3.55
€ THOUSAND 2017 2016
Effect on:Decrease by 10%
Increase by 10%
Decrease by 10%
Increase by 10%
Earnings after tax 0 0 0 0
Cash flow hedge reserve 5,605 -4,585 11,979 -16,129
Total equity 5,605 -4,585 11,979 -16,129
The sensitivity results mainly from derivatives used to hedge future cash flows in for-eign currency as well as derivatives not designated as hedging instruments.
26.2 Interest rate risk
Interest rate risks for the BENTELER Group arise primarily from its liabilities from bor-rowings. In addition, risks arise from deposits held with banks.
The BENTELER Group counters interest rate risk by continuously monitoring the money market and capital market, and by using derivative interest rate hedges. The focus is on hedging the Group’s financing requirements against increases in market interest rates. To cover this risk (cash flow risk), interest rate swaps were used.
For interest rate risk, sensitivity analyses were performed to determine the effects of hypothetical changes in market interest rates on the Group’s result (after tax) and equity. The analysis is based on variable interest rate holdings of primary financial
instruments and derivative financial instruments as at the reporting date. It was assumed that the risk at the reporting date substantially represents the risk for the financial year as a whole. A Group tax rate of 30% (prior year: 30%) was applied as the tax rate. It was also assumed that all other variables, especially foreign exchange rates, would remain constant.
An increase or decrease in the market interest rates by 100 bps (= 1%) would have the following effects on earnings after tax and equity:
SENSITIVITY ANALYSIS FOR INTEREST RATE RISK 3.56
€ THOUSAND 2017 2016
Effect on:
Increase by 100 bps
= 1%
Decrease by 100 bps
= 1%
Increase by 100
bps = 1%
Decrease by 100
bps = 1%
Earnings after tax 5,643 -10,518 1,741 -5,300
Cash flow hedge reserve 6,534 -6,916 3,832 -3,995
Total equity 12,177 -17,435 5,573 -9,295
26.3 Commodity price risk
The BENTELER Group is exposed to the risk of changes in commodity prices – espe-cially the risk of changes in the price of aluminum and steel – through its procure-ment of intermediate goods and services.
82

ANNUAL REPORT 2017CONSOLIDATED FINANCIAL STATEMENTS Additional Information
26.3.1 Steel price risk
Unlike other industrial metals, the risks and opportunities arising from the volatility of steel prices are mainly passed on to customers on the basis of supply contracts.
26.3.2 Aluminum price risk
The hedging strategy for aluminum price risk has to consider, in addition to the phys-ical security, the complexity of the risk incurred. This obligation represents the vari-ous contract specifications with the automotive manufacturers, including:
─ The temporal divergence between the purchase of commodities and semi- finished products, and the sale of components to automotive manufacturers;
─ A wide variety of fixed prices, formula-based pricing mechanisms and price vali-dities out of a price setting process based on different calculation methods.
On the basis of customers’ planned purchased quantities and the requisition notes of the decentralized units, the production site decides on the production schedule and the required aluminum. At the monthly management meeting, a list of all concluded contracts is drawn up and the aluminum price fixing on the selling or buying side begins the following month. On that basis, BENTELER Treasury enters into commodity swaps with a bank to change the variable prices on the buy and sell side to fixed prices. Different swaps are negotiated for each month, depending on the individual customers’ pricing formulas and the planned and reported volumes.
Sensitivity analyses were conducted for commodity price risk, showing the impact of hypothetical changes in commodity prices on equity. The derivative financial instru-ments recognized as at the reporting date are the basis for commodity price sensitiv-
ity. It was assumed that the risk at the reporting date substantially represents the risk for the financial year as a whole.
26.3.3 Other commodity price risks
Aluminum and the propane gas used for casting processes are subject to price risk. Whereas the risk in the case of propane gas is not currently hedged, the price risk for aluminum is hedged using commodity basis swaps.
The fair value of aluminum and propane gas commodity forwards are based on official market quotations (stock quotes on the LME – London Metal Exchange and Platts price indices for energy and commodity markets).
An increase or decrease in aluminum commodity prices by 10% would have the fol-lowing effects on earnings after tax and equity:
SENSITIVITY ANALYSIS FOR ALUMINUM PRICE RISK 3.57
€ THOUSAND 2017 2016
Effect on:Increase by
10%Decrease by 10%
Increase by 10%
Decrease by 10%
Earnings after tax 0 0 0 0
Cash flow hedge reserve 653 -653 645 -645
Total equity 653 -653 645 -645
83

ANNUAL REPORT 2017CONSOLIDATED FINANCIAL STATEMENTS Additional Information
26.4 Default risk
Default risk describes the risk resulting from the failure of individual business part-ners to fulfill their contractual obligations. The BENTELER Group’s default risk results primarily from receivables from customers. In addition, default risks arise in con-nection with financial transactions, such as the investment of liquid funds or the acquisition of securities.
The BENTELER Group counters the risk of default on receivables in operating activi-ties by means of professional accounts receivable management. Before signing a contract, in particular with key customers, a careful evaluation of the customer’s economic condition and business competence is performed. All relevant customer data are recorded and analyzed centrally, and assessed in an individualized credit rating. In addition, the Group has credit insurance, from which selected customers with good credit ratings are excepted. In ongoing business operations, payment performance is regularly evaluated and monitored, also with reference to dynamic leading indicators. Bad debt provisions recognized for this purpose take account of the default risk on receivables.
Due to its diversified customer structure on the original equipment manufacturer (OEM) side, the Group is not exposed to any significant concentration of default risk. The maximum default risk arising from financial assets involves the risk of default to the carrying amount of the receivable from the respective customer.
26.5 Liquidity risk
Liquidity risk is the risk that the BENTELER Group might not have sufficient financial resources to meet payment obligations. Payment obligations arise particularly in con-nection with the procurement of raw materials and goods for operating activities.
Liquidity risk is monitored by systematic, day-by-day liquidity management whose absolute fundamental requirement is maintaining the Company’s ability to meet its payment obligations at all times. Aligned on a fixed planning horizon, liquidity fore-cast and available committed credit lines in the Group ensure the supply of liquidity in accordance with the planned development. The aim is convenient and cost-effec-tive liquidity, which enables an adequate response to a dynamic market environment and allows opportunity-oriented action. The financial planning process includes a rolling three-month forecast (direct method) and a one- to five-year plan (indirect method). At the end of the period on December 31, 2017, a strategic liquidity reserve of unutilized written confirmed short- and long-term credit lines of a total €400,000 thousand (prior year: €400,000 thousand) was available.
84

ANNUAL REPORT 2017CONSOLIDATED FINANCIAL STATEMENTS Additional Information
The following table shows the undiscounted contractual maturities for financial lia-bilities (including contractual interest payments):
MATURITIES OF FINANCIAL LIABILITIES 3.58
Carrying amountsDecember 31,
2017
Maturity of financial liabilities
€ THOUSAND
in 1 year in 2 to 5 years after 5 years
Interest Repayment Interest Repayment Interest Repayment
Financial debts (non-current and current) 1,795,567 42,019 258,128 69,214 1,148,310 10,685 389,129
Borrower’s note loans 712,081 14,770 113,581 20,445 508,500 2,089 90,000
Liabilities to banks 1,064,161 27,095 136,283 48,365 635,914 8,454 291,964
Liabilities from finance lease 12,607 153 1,910 404 3,532 143 7,165
Other financial debts 6,718 0 6,354 0 364 0 0
Trade payables 1,258,322 0 1,258,322 0 0 0 0
Other liabilities (non-current and current) 45,082 3,660 19,878 4,418 21,113 0 0
Negative market values of derivatives without on-balance-sheet hedging relationship 32,423 2,983 13,054 4,418 15,739 0 0
Negative market values of derivatives with on-balance sheet hedging relationship (hedge accounting) 12,659 676 6,824 0 5,373 0 0
Other financial liabilities 0 0 0 0 0 0 0
Total 3,098,971 45,678 1,536,328 73,632 1,169,423 10,685 389,129
85

ANNUAL REPORT 2017CONSOLIDATED FINANCIAL STATEMENTS Additional Information
MATURITIES OF FINANCIAL LIABILITIES 3.59
Carrying amounts
December 31, 2016
Maturity of financial liabilities
€ THOUSAND
in 1 year in 2 to 5 years after 5 years
Interest Repayment Interest Repayment Interest Repayment
Financial debts (non-current and current) 1,542,032 38,111 209,230 89,681 922,773 16,184 410,028
Borrower’s note loans 468,530 11,289 89,892 19,719 378,638 0 0
Liabilities to banks 1,038,813 26,642 105,975 69,399 539,650 15,798 393,189
Liabilities from finance lease 16,025 181 2,399 563 4,136 386 9,490
Other financial debts 18,663 0 10,964 0 350 0 7,349
Trade payables 1,044,280 0 1,044,280 0 0 0 0
Other liabilities (non-current and current) 119,437 6,650 56,441 7,528 53,564 0 0
Negative market values of derivatives without on-balance-sheet hedging relationship 52,650 683 7,757 2,093 43,177 0 0
Negative market values of derivatives with on-balance sheet hedging relationship (hedge accounting) 29,979 5,967 11,877 5,436 10,387 0 0
Other financial liabilities 36,808 0 36,808 0 0 0 0
Total 2,705,749 44,761 1,309,951 97,210 976,337 16,184 410,028
86

ANNUAL REPORT 2017CONSOLIDATED FINANCIAL STATEMENTS Additional Information
The table above includes all financial liabilities having contractually agreed payments as at the reporting date. Budget figures for future new liabilities are not included. Amounts in foreign currencies are translated at the exchange rate prevailing on 31 December. Variable interest payments on financial liabilities were calculated on the basis of the most recently determined interest rates.
26.6 Capital management
The objective of capital management is to ensure a sound financial profile. In part-icular, the aim is to ensure reasonable dividend payments for shareholders, and to generate benefits for other interest groups. Additionally, the BENTELER Group in-tends to keep sufficient financial resources available to maintain its growth strategy.
The capital management strategy ensures that Group companies have a solid equity base appropriate to local requirements. The goal is to provide the necessary finan-cial and liquidity headroom. The requirement communicated to all Group compa-nies is to secure financing with matching maturities.
The financial profile is actively managed and monitored. Therefore, the main key figure is the equity ratio. The equity ratio is calculated as the ratio of equity shown in the consolidated statement of financial position to total assets. On the reporting date it amounted to 21.4% (prior year: 22.9%).
27 DERIVATIVE FINANCIAL INSTRUMENTS AND HEDGE ACCOUNTING
At the end of the reporting period, the BENTELER Group held derivative financial instruments to hedge foreign exchange risks, interest rate risks and commodity price risks.
The BENTELER Group uses various derivative financial instruments to hedge the above-mentioned risks: currency forwards, currency options, interest swaps, inter-est/currency swaps and commodity forwards. Foreign currency derivatives are held primarily in USD, NOK, MXN, CHF, CNY, BRL, CZK, HUF, DKK, ZAR, RUB, JPY, CAD, PLN, SEK, AUD, GBP, BGN, RON, IDR and INR, interest rate swaps in EUR, USD and ZAR. Business partners are either German or international banks with good credit rat-ings.
The majority of the derivative financial instruments were recognized in the report-ing year as cash flow hedges within hedge accounting relationships. Hedging involves both variable future cash flows from non-current liabilities with terms until 2024 and future operating cash flows in foreign currencies with terms of gen-erally up to 24 months, but not more than 36 months. The employed commodity derivatives hedge variable cash flows until 2018 and primarily relate to aluminum price hedges.
The prospective effectiveness of hedging relationships is determined using the criti-cal terms match method under IAS 39. Retrospective effectiveness is measured using the dollar offset method.
87

ANNUAL REPORT 2017CONSOLIDATED FINANCIAL STATEMENTS Additional Information
The following table shows the types and amounts of foreign currency and interest rate hedges held, including the recognized fair values at the reporting date:
TYPES, AMOUNTS AND FAIR VALUES OF FOREIGN CURRENCY HEDGES AND INTEREST RATE HEDGES HELD IN THE CURRENT REPORTING PERIOD
3.60
€ THOUSAND
December 31, 2017
Nominal volume
Positive market values
Negative mar ket values
Derivatives without on-balance-sheet hedging relationship 1,085,740 9,827 32,423
Interest rate and interest/currency hedges 305,000 0 3,630
Foreign currency hedges 769,292 9,268 27,966
Commodity hedges 11,448 559 827
Derivatives with on-balance sheet hedging relationship (hedge accounting) 1,173,383 24,142 12,659
Interest rate and interest/currency hedges 325,851 2,943 472
Foreign currency hedges 801,652 19,213 11,185
Commodity hedges 45,880 1,987 1,002
TYPES, AMOUNTS AND FAIR VALUES OF FOREIGN CURRENCY HEDGES AND INTEREST RATE HEDGES HELD IN THE PRIOR REPORTING PERIOD
3.61
€ THOUSAND
December 31, 2016
Nominal volume
Positive market values
Negative market values
Derivatives without on-balance-sheet hedging relationship 752,780 2,763 52,650
Interest rate and interest/currency hedges 130,000 0 1,716
Foreign currency hedges 618,735 2,763 50,743
Commodity hedges 4,045 0 191
Derivatives with on-balance sheet hedging relationship (hedge accounting) 1,067,016 11,274 29,979
Interest rate and interest/currency hedges 349,824 2,765 7,715
Foreign currency hedges 675,628 6,703 21,440
Commodity hedges 41,564 1,807 824
The foreign currency hedges without on-balance-sheet hedging relationships are primarily hedging instruments used to hedge internal loans extended in foreign currency to subsidiaries.
28 ADDITIONAL INFORMATION CONCERNING FINANCIAL INSTRUMENTS
The following tables show the carrying amounts of financial assets and liabilities for each individual category of financial instrument and reconcile them with the related items on the statement of financial position for the end of the reporting period as at December 31, 2017, and the prior year.
88

ANNUAL REPORT 2017CONSOLIDATED FINANCIAL STATEMENTS Additional Information
CARRYING AMOUNTS OF FINANCIAL ASSETS AND LIABILITIES BY CATEGORY 3.62
€ THOUSAND
Measurement category pursu-
ant to IAS 39
Carrying amount
December 31, 2017
Measurement pursuant to IAS 39
Value pursuant to IAS 17
Non-financial Items
(Amortized)acquisition cost
Fair value outside profit or loss
Fair value through profit
or loss
Trade receivables 1) 700,147 700,147 0 0 0 0
Receivables from contract production 1) 11,663 11,663 0 0 0 0
Other receivables and assets (non-current and current) 310,881 101,479 34,760 9,827 0 164,814
Securities 2) 10,618 0 10,618 0 0 0
Investments in unconsolidated entities 2) 83 83 0 0 0 0
Financial receivables 1) 101,396 101,396 0 0 0 0
Positive market values: derivatives without on-balance-sheet hedging relationship 3) 9,827 0 0 9,827 0 0
Positive market values: derivatives with on-balance-sheet hedging relationship (hedge accounting) n/a 24,142 0 24,142 0 0 0
Other financial receivables 2) 0 0 0 0 0 0
Other non-financial receivables n/a 164,814 0 0 0 0 164,814
Cash and cash equivalents 1) 682,259 682,259 0 0 0 0
Total 1,704,950 1,495,548 34,760 9,827 0 164,814
of which by measurement category under IAS 39:
1) Loans and receivables 1,495,465 1,495,465 0 0 0 0
2) Financial assets available for sale 10,701 83 10,618 0 0 0
3) Financial assets held for trading 9,827 0 0 9,827 0 0
89

ANNUAL REPORT 2017CONSOLIDATED FINANCIAL STATEMENTS Additional Information
CARRYING AMOUNTS OF FINANCIAL ASSETS AND LIABILITIES BY CATEGORY 3.63
€ THOUSAND
Measurement category pursu-
ant to IAS 39
Carrying amount December 31,
2017
Measurement pursuant to IAS 39
Value pursuant to IAS 17
Non-financialItems
(Amortized) acquisition cost
Fair value outside profit or loss
Fair value through profit or
loss
Financial debts (non-current and current) 1,795,567 1,782,960 0 0 12,607 0
Borrower’s note loans 1) 712,081 712,081 0 0 0 0
Liabilities to banks 1) 1,064,161 1,064,161 0 0 0 0
Liabilities from finance lease n/a 12,607 0 0 0 12,607 0
Other financial debts 1) 6,718 6,718 0 0 0 0
Trade payables 1) 1,258,322 1,258,322 0 0 0 0
Other liabilities (non-current and current) 386,080 0 12,659 32,423 0 340,998
Negative market values: derivatives without on-balance sheet hedging relationship 2) 32,423 0 0 32,423 0 0
Negative market values: derivatives with on-balance sheet hedging relationship (hedge accounting) n/a 12,659 0 12,659 0 0 0
Other financial liabilities 1) 0 0 0 0 0 0
Other non-financial liabilities n/a 340,998 0 0 0 0 340,998
Total 3,439,969 3,041,282 12,659 32,423 12,607 340,998
of which by measurement category under IAS 39:
1) Financial liabilities measured at amortized cost 3,041,282 3,041,282 0 0 0 0
2) Financial liabilities held for trading 32,423 0 0 32,423 0 0
90

ANNUAL REPORT 2017CONSOLIDATED FINANCIAL STATEMENTS Additional Information
CARRYING AMOUNTS OF FINANCIAL ASSETS AND LIABILITIES BY CATEGORY 3.64
€ THOUSAND
Measurement category pursu-
ant to IAS 39
Carrying amount December 31,
2016
Measurement pursuant to IAS 39
Value pursuant to IAS 17
Non-financialItems
(Amortized) acquisition cost
Fair value outside profit or loss
Fair value through profit or
loss
Trade receivables 1) 623,127 623,127 0 0 0 0
Receivables from contract production 1) 8,095 8,095 0 0 0 0
Other receivables and assets (non-current and current) 345,762 155,723 11,277 2,763 0 175,999
Securities 2) 3 0 3 0 0 0
Investments in unconsolidated entities 2) 0 0 0 0 0 0
Financial receivables 1) 155,723 155,723 0 0 0 0
Positive market values: derivatives without on-balance-sheet hedging relationship 3) 2,763 0 0 2,763 0 0
Positive market values: derivatives with on-balance-sheet hedging relationship (hedge accounting) n/a 11,274 0 11,274 0 0 0
Other financial receivables 2) 0 0 0 0 0 0
Other non-financial receivables n/a 175,999 0 0 0 0 175,999
Cash and cash equivalents 1) 357,618 357,618 0 0 0 0
Total 1,334,603 1,144,563 11,277 2,763 0 175,999
of which by measurement category under IAS 39:
1) Loans and receivables 1,144,563 1,144,563 0 0 0 0
2) Financial assets available for sale 3 0 3 0 0 0
3) Financial assets held for trading 2,763 0 0 2,763 0 0
91

ANNUAL REPORT 2017CONSOLIDATED FINANCIAL STATEMENTS Additional Information
CARRYING AMOUNTS OF FINANCIAL ASSETS AND LIABILITIES BY CATEGORY 3.65
€ THOUSAND
Measurement category pursu-
ant to IAS 39
Carrying amount Decem-
ber 31, 2016
Measurement pursuant to IAS 39
Value pursuant to IAS 17
Non-financialItems
(Amortized) acquisition cost
Fair value out-side profit or
loss
Fair value through profit
or loss
Financial debts (non-current and current) 1,542,032 1,526,007 0 0 16,025 0
Borrower’s note loans 1) 468,530 468,530 0 0 0 0
Liabilities to banks 1) 1,038,813 1,038,813 0 0 0 0
Liabilities from finance lease n/a 16,025 0 0 0 16,025 0
Other financial debts 1) 18,663 18,663 0 0 0 0
Trade payables 1) 1,044,280 1,044,280 0 0 0 0
Other liabilities (non-current and current) 428,107 36,808 29,979 52,650 0 308,671
Negative market values: derivatives without on-balance sheet hedging relationship 2) 52,650 0 0 52,650 0 0
Negative market values: derivatives with on-balance sheet hedging relationship (hedge accounting) n/a 29,979 0 29,979 0 0 0
Other financial liabilities 1) 36,808 36,808 0 0 0 0
Other non-financial liabilities n/a 308,671 0 0 0 0 308,671
Total 3,014,419 2,607,095 29,979 52,650 16,025 308,671
of which by measurement category under IAS 39:
1) Financial liabilities measured at amortized cost 2,607,095 2,607,095 0 0 0 0
2) Financial liabilities held for trading 52,650 0 0 52,650 0 0
No reclassifications between categories of financial instruments were performed during the financial year or in the previous year. Reclassifications are taken into account at the end of the reporting period.
92

ANNUAL REPORT 2017CONSOLIDATED FINANCIAL STATEMENTS Additional Information
Fair values and fair value hierarchy
The carrying amount for current primary financial instruments, especially trade receivables and trade payables as well as other current receivables and liabilities, equals the fair value. The fair value of fixed-interest loans and liabilities is the pres-ent value of expected future cash flows. They are discounted at interest rates effective at the end of the reporting period. For variable interest liabilities, the carrying amounts equal their fair values.
The fair value of foreign exchange transactions is calculated as the present value based on the middle spot exchange rate as at the end of the reporting period taking into account any forward premiums or discounts for the residual term of the respec-tive contract compared with the contracted forward rate. For currency options, gener-ally accepted models were used for calculating option prices. The fair value of an option is affected not only by the remaining term of the option, but also by other factors such as the current level and volatility of the underlying exchange rate, or the underlying base interest rate.
Interest rate swaps and interest/currency swaps are measured at fair value by dis-counting expected future cash flows. The market interest rates, which are equivalent to the residual term of the contracts, are used as a basis. In addition, for interest/currency swaps, the exchange rates of those foreign currencies in which the respec-tive payments take place are taken into account.
The fair value of aluminum commodity forwards is based on official market quota-tions (LME – London Metal Exchange).
Measurements are performed both internally and by external financial partners at the end of the period. The measurement of derivatives also incorporates the counterparty risk. Determination is carried out in accordance with IFRS 13 and is based on a unilat-eral approach without taking into account any offsetting agreements. The calculation
is based on a constant estimation of future exposures and a historical default proba-bility according to the rating of the counterparty and/or a rating estimation of the BENTELER Group.
The fair values of financial assets and liabilities are based on the following input data and are categorized according to IFRS 13 in three fair value hierarchies:
─ Level 1 Measured on the basis of quoted prices on active markets for similar instruments.
─ Level 2 Measured on the basis of directly or indirectly observable market inputs other than level 1 quoted prices.
─ Level 3 Measured on the basis of models not based on observable market inputs.
The fair value hierarchy reflects the significance of the input parameters that were used for the determination of the fair values.
93

ANNUAL REPORT 2017CONSOLIDATED FINANCIAL STATEMENTS Additional Information
The following tables show the fair values and carrying amounts of financial assets and liabilities measured at their fair values, classified by fair value hierarchy:
FAIR VALUES AND CARRYING AMOUNTS OF FINANCIAL ASSETS AND LIABILITIES BY FAIR VALUE HIERARCHY
3.66
€ THOUSAND
December 31, 2017
Carrying amount Fair value Level 1 Level 2 Level 3
Other receivables and assets (non-current and current) 44,588 44,588 0 44,588 0
Securities 10,618 10,618 0 10,618 0
Positive market values of derivatives without on-balance-sheet hedging relationship (assets held for trading) 9,827 9,827 0 9,827 0
Positive market values of derivatives with on-balance-sheet hedging rela-tionship (hedge accounting) 24,142 24,142 0 24,142 0
Other liabilities (non-current and current) 45,082 45,082 0 45,082 0
Negative market values of derivatives without on-balance-sheet hedging relationship (assets held for trading) 32,423 32,423 0 32,423 0
Negative market values of derivatives with on-balance sheet hedging relationship (hedge accounting) 12,659 12,659 0 12,659 0
FAIR VALUES AND CARRYING AMOUNTS OF FINANCIAL ASSETS AND LIABILITIES BY FAIR VALUE HIERARCHY
3.67
€ THOUSAND
December 31, 2016
Carrying amount Fair value Level 1 Level 2 Level 3
Other receivables and assets (non-current and current) 14,040 14,040 0 14,040 0
Securities 3 3 0 3 0
Positive market values of derivatives without on-balance-sheet hedging relationship (assets held for trading) 2,763 2,763 0 2,763 0
Positive market values of derivatives with on-balance-sheet hedging rela-tionship (hedge accounting) 11,274 11,274 0 11,274 0
Other liabilities (non-current and current) 82,629 82,629 0 82,629 0
Negative market values of derivatives without on-balance-sheet hedging relationship (assets held for trading) 52,650 52,650 0 52,650 0
Negative market values of derivatives with on-balance sheet hedging relationship (hedge accounting) 29,979 29,979 0 29,979 0
94

ANNUAL REPORT 2017CONSOLIDATED FINANCIAL STATEMENTS Additional Information
The following table shows the fair values and carrying amounts of financial liabilities measured at amortized cost, classified by fair value hierarchy:
FAIR VALUES AND CARRYING AMOUNTS OF FINANCIAL ASSETS AND LIABILITIES BY FAIR VALUE HIERARCHY
3.68
December 31, 2017
€ THOUSANDCarrying amount
Fair value Level 1 Level 2 Level 3
Financial liabilities (non-cur-rent and current) 1,788,849 1,812,195 0 0 1,812,195
Borrower’s note loans 712,081 719,606 0 0 719,606
Liabilities to banks 1,064,161 1,079,720 0 0 1,079,720
Liabilities from finance lease 12,607 12,869 0 0 12,869
FAIR VALUES AND CARRYING AMOUNTS OF FINANCIAL ASSETS AND LIABILITIES BY FAIR VALUE HIERARCHY
3.69
December 31, 2016
€ THOUSANDCarrying amount Fair value Level 1 Level 2 Level 3
Financial liabilities (non-current and current) 1,523,368 1,541,493 0 0 1,541,493
Borrower’s note loans 468,530 477,082 0 0 477,082
Liabilities to banks 1,038,813 1,048,206 0 0 1,048,206
Liabilities from finance lease 16,025 16,205 0 0 16,205
Offsetting financial instruments
The BENTELER Group enters into framework agreements for financial derivative trans -actions. These contractually agree that upon termination of a contract the final value of all transactions is determined and only a single net amount is settled in cash. The requirements for offsetting in the statement of financial position are not met, as normally no net payments are made.
95

ANNUAL REPORT 2017CONSOLIDATED FINANCIAL STATEMENTS Additional Information
OTHER FINANCIAL ASSETS – DERIVATIVES WITH POSITIVE MARKET VALUE
3.70
Values as at December 31, 2017
€ THOUSAND
Financial assets (gross)
Recognized amounts
(gross)
Recognized financial
assets (net)
Effect of enforceable
netting agreements
Netamounts
Foreign currency hedges 28,481 0 28,481 -16,861 11,620
Commodity hedges 2,546 0 2,546 -1,771 1,708
Interest rate swaps 2,943 0 2,943 -846 2,097
Total 33,970 0 33,970 -19,478 14,492
Values as at December 31, 2016
Foreign currency hedges 9,466 0 9,466 -8,610 856
Commodity hedges 1,807 0 1,807 -521 1,286
Interest rate swaps 2,765 0 2,765 0 2,765
Total 14,038 0 14,038 -9,131 4,907
OTHER FINANCIAL LIABILITIES – DERIVATIVES WITH NEGATIVE MARKET VALUE
3.71
Values as at December 31, 2017
€ THOUSAND
Financial Liabilities
(gross)
Recognized amounts
(gross)
Recognized financial
liabilities (net)
Effect of enforceable
netting agreements
Netamounts
Foreign currency hedges 39,151 0 39,151 -16,861 22,290
Commodity hedges 1,829 0 1,829 -1,771 991
Interest rate swaps 4,102 0 4,102 -846 3,256
Total 45,082 0 45,082 -19,478 25,604
Values as at December 31, 2016
Foreign currency hedges 72,183 0 72,183 -8,610 63,573
Commodity hedges 1,015 0 1,015 -521 494
Interest rate swaps 9,432 0 9,432 0 9,432
Total 82,629 0 82,629 -9,131 73,498
96

ANNUAL REPORT 2017CONSOLIDATED FINANCIAL STATEMENTS Additional Information
Net result
The following table shows the net gains/losses (before tax) on financial instruments recognized in the consolidated income statement or in other comprehensive income, broken down by measurement category. The figures do not include effects of finance leases on profit or loss, or those of derivatives used for hedge accounting, since they do not belong to a measurement category under IAS 39.
DETERMINATION OF THE NET AMOUNTS OF OTHER FINANCIAL ASSETS RECOGNIZED IN THE STATEMENT OF FINANCIAL POSITION
3.72
€ THOUSAND 2017 2016
Loans and receivables 7,068 602
Financial assets available for sale 0 0
Derivatives without on-balance sheet hedging rela-tionship (financial assets and liabilities held for tra-ding) 21,513 -17,154
Financial liabilities measured at amortized cost -64,435 -60,662
Total net gains or losses -35,854 -77,214
of which: net interest expense for financial assetsand liabilities not measured at fair value through profit or loss -57,039 -54,194
of which: impairment expense for trade receivables -328 -5,867
of which: gains/losses on financial assets availa-ble for sale recognized outside profit or loss 0 0
The net gain in the “loans and receivables” category results primarily from interest income on financial receivables and adjustments on trade receivables.
The net figure in the “financial assets available for sale” category results from the securities and bonds held by the BENTELER Group, and from unconsolidated owner-ship interests in associates.
The gains and losses on derivatives that do not meet the hedge accounting require-ments under IAS 39 are included in the “derivatives without on-balance-sheet hedging relationship” category. The contrary foreign currency effects from underlying transactions hedged using these derivatives are not shown.
The “financial liabilities measured at amortized cost” category includes interest expenses for financial liabilities.
29 CONSOLIDATED STATEMENT OF CASH FLOWS
The consolidated cash flow statement is prepared in accordance with IAS 7 and pre-sents cash flows from operating, investing and financing activities. The effects of changes in the scope of consolidation are included in the variations of the various balance sheet items; their effects on cash and cash equivalents – and the effects of changes in foreign exchange rates – are disclosed separately.
97

ANNUAL REPORT 2017CONSOLIDATED FINANCIAL STATEMENTS Additional Information
An amount of €788 thousand of investments in property, plant and equipment is related to finance leases and therefore was not cash-effective (prior year: €2,004 thousand).
FINANCIAL DEBTS 3.73
Financial debts Total
€ THOUSANDBorrower’s note loans Liabilities to banks Lease liabilities Miscellaneous
Balance at January 1, 2017 468,530 1,038,813 16,025 18,663 1,542,032
Total cash changes from financing activity 240,842 97,006 -2,400 -8,692 326,755
Non-cash changes due to gain/loss of control of subsidiaries 0 -30,484 0 -5,747 -36,231
Effect of changes in exchange rates 0 -41,174 -3,689 2,307 -42,557
Total of other non-cash changes (loans) 2,709 0 2,672 187 5,568
Balance at December 31, 2017 712,081 1,064,161 12,607 6,718 1,795,567
30 CONTINGENT LIABILITIES AND CONTINGENT ASSETS
The BENTELER Group granted no additional collateral in the reporting period for its borrowings, above and beyond the joint liability of individual Group members to other Group members and the collateral indicated in Note 23 – Financial liabili-ties.
For the contingent liabilities listed below, the principal debtor is not a consoli-dated company. As at the end of the period on December 31, 2017, the Group had granted guarantees to third parties for a total of €491 thousand (prior year: €297 thousand). At the reporting date there were €224 thousand of liabilities to third parties under warranty agreements (through contract performance bonds or supply bonds) (prior year: €661 thousand).
98

ANNUAL REPORT 2017CONSOLIDATED FINANCIAL STATEMENTS Additional Information
Other off-balance-sheet obligations – particularly towards employees, tax author-ities and customs authorities – amount to €16,266 thousand as at December 31, 2017 (prior year: €14,025 thousand).
31 NUMBER OF EMPLOYEES
The BENTELER Group employed an average number of 27,955 full-time equivalents worldwide (prior year: 27,917). Personnel expenses amount to €1,445,434 thousand (prior year: €1,431,129 thousand). These include expenses for defined contribution pension plans amounting to €14,721 thousand (prior year: €14,943 thousand).
32 GOVERNING BODIES
Members of the Executive Board
─ Ralf Göttel, Schönau am Königssee, Germany, from April 1, 2017 (Chairman of the Executive Board, responsibilities: Strategy & M&A, Compliance & Board Affairs, Procurement, Divisions)
─ Guido Huppertz, Bergheim bei Salzburg, Austria, from February 1, 2017 (respon-sibilities: Finance & Controlling, Legal & Insurance, Tax, Internal Audit)
─ Isabel Diaz Rohr, Schönau am Königssee, Germany (responsibilities: Human Resources, IT, Communication/Marketing)
─ Hubertus Benteler, Salzburg, Austria, until March 31, 2017
─ Boris Gleißner, Seekirchen, Austria, until January 31, 2017
Members of the Supervisory Board
─ Dr. Ralf Bethke, Deidesheim, Germany, Chairman (until May 2017, Chairman of the Supervisory Board of K+S AG, Kassel, Germany,)
─ Dr. Ulrich Dohle, Stuttgart, Germany, Vice Chairman (former Chairman of the Executive Board of Rolls-Royce Power Systems AG, Friedrichshafen, Germany)
─ Boudewijn Beerkens, Amsterdam, Netherlands, until March 31, 2017 (CSOO of COFRA Holding AG, Zug, Switzerland)
─ Hubertus Benteler, Salzburg, Austria, from April 1, 2017 (until March 31, 2017, Chairman of the Supervisory Board of BENTELER International AG)
─ Christian Caspar, Zürich, Switzerland (Director Emeritus at McKinsey & Company, Inc., Zürich, Switzerland)
─ Axel Prym, Roetgen, Germany (former Managing Director of William Prym GmbH & Co. KG, Stolberg, Germany)
─ Frederik Vaubel, Düsseldorf, Germany (Managing Director of Vaubel Entwicklungs- und Beteiligungs GmbH, Düsseldorf, Germany)
99

ANNUAL REPORT 2017CONSOLIDATED FINANCIAL STATEMENTS Additional Information
33 RELATED PARTY TRANSACTIONS
The Group’s related parties according to IAS 24 are fundamentally the members of the Supervisory Board and Shareholders’ Committee, the members of the Benteler family, members of Group management and, as entities, the associates of the BENTELER Group and entities controlled or significantly influenced by related parties. Note 32 “Governing bodies” contains further information.
The entities included in the consolidated financial statements of the BENTELER Group have been engaged and/or continue to engage in corporate transactions with related parties.
In addition to the disclosures in Note 18.3, transactions have been conducted with undertakings controlled by related parties which in the 2017 financial year led to material purchases of €31 million. Outstanding trade payables amounted to €0.6 million as at December 31, 2017. No other significant transactions have been con-ducted with related parties that extend beyond their capacity as shareholders or members of governing bodies.
Total remuneration of management in key positions
In the 2017 financial year, BENTELER International Aktiengesellschaft paid total com-pensation to members of management in key positions (15 persons; prior year 14 – comprising members of the Executive Board of BENTELER International Aktienge-sellschaft and the managing directors of the principal subsidiaries) as follows:
TOTAL REMUNERATION OF MANAGEMENT IN KEY POSITIONS 3.74
€ THOUSAND 2017 2016
Short-term payments – fixed 5,552 6,527
Short-term payments – variable 5,939 8,915
Post-employment benefits 2,304 2,452
Severance benefits 6,128 4,236
Total 19,923 22,130
No share-based compensation was granted.
The members of the Supervisory Board of BENTELER International Aktiengesellschaft received remuneration of €375 thousand in the 2017 financial year (prior year: €375 thousand).
100

ANNUAL REPORT 2017CONSOLIDATED FINANCIAL STATEMENTS Additional Information
34 EVENTS AFTER THE REPORTING PERIOD
There were no events or developments of significance subsequent to the end of the reporting period that might have caused a material change in the financial position as at December 31, 2017, or that would require disclosure.
35 AUDITOR’S FEES AND SERVICES
The information required under Section 266(11) of the Austrian Commercial Code regarding the fees paid to the Group’s independent auditor (KPMG Austria GmbH Wirtschaftsprüfungs- und Steuerberatungsgesellschaft) is provided below by category of service:
AUDITOR’S FEES 3.75
€ THOUSAND 2017 2016
Audit of separate and consolidated financial state-ments 252 244
Audit-related services 15 0
Other services 15 0
Total fees 282 244
The figures represent the fees recognized as expenses in the financial year. Services provided by the independent auditor’s network are not included.
36 PROPOSED APPROPRIATION OF PROFIT
Under the terms of the Austrian Stock Corporation Act, the appropriation of profit is to be based on the separate financial statements of BENTELER International Aktienge-sellschaft as at December 31, 2017.
The Executive Board will propose to the Shareholders’ Meeting that a dividend of €23,000,000.00 be distributed from the profit of €350,894,482.50 and that the remaining amount of €327,894,482.50 be carried forward. The dividend will be dis-tributed on March 19, 2018.
Salzburg, February 9, 2018
The Executive Board
Ralf Göttel Guido Huppertz Isabel Diaz Rohr
101

3.76
ANNUAL REPORT 2017CONSOLIDATED FINANCIAL STATEMENTS Additional Information
Appendix to the Notes: List of shareholdings as at December 31, 2017
LIST OF SHAREHOLDINGS AS AT DECEMBER 31, 2017 Investment
2017 2016
1. BENTELER International Aktiengesellschaft, Salzburg, Austria – –
Subsidiaries
Automotive Division
2. BENTELER Aluminium Systems France SNC, Louviers, France 100.0 100.0
3. BENTELER Automobiltechnik Eisenach GmbH, Eisenach, Germany 100.0 100.0
4. BENTELER Automobiltechnik GmbH, Paderborn, Germany 100.0 100.0
5. BENTELER Automotive (Changshu) Company Limited, Changshu, China 100.0 100.0
6. BENTELER Automotive (China) Investment Co. Ltd., Shanghai, China 100.0 100.0
7. BENTELER Automotive (Chongqing) Co. Ltd., Chongqing, China 100.0 100.0
8. BENTELER Automotive (Fuzhou) Co., Ltd., Fuzhou, China 100.0 100.0
9. BENTELER Automotive (Shanghai) Co., Ltd., Shanghai, China 100.0 100.0
10. BENTELER Automotive (Shenyang) Co., Ltd., Shenyang, China 100.0 100.0
11. BENTELER Automotive (Tianjin) Co., Ltd., Tianjin, China 100.0 100.0
12. BENTELER Automotive (Thailand) Ltd., Bangkok, Thailand 100.0 100.0
13. BENTELER Automotive Belgium N.V., Ghent, Belgium 100.0 100.0
14. BENTELER Automotive Canada Corporation, Windsor (Ontario), Canada 100.0 100.0
15. BENTELER Automotive Component (Shanghai) Ltd., Shanghai, China 100.0 100.0
16. BENTELER Automotive Corporation, Auburn Hills, USA 100.0 100.0
17. BENTELER Automotive Farsund AS, Farsund, Norway 100.0 100.0
18. BENTELER Automotive Holland Inc., Holland (Michigan), USA 100.0 100.0
19. BENTELER Automotive India Private Limited, Pune, India 100.0 100.0
20. BENTELER Automotive International GmbH, Paderborn, Germany 100.0 100.0
21. BENTELER Automotive K.K., Tokyo, Japan 100.0 100.0
22. BENTELER Automotive Klášterec s.r.o., Chrastava, Czech Republic 100.0 100.0
23. BENTELER Automotive Korea Ltd., Seoul, South Korea (previously: BENTELER Aluminium Systems Korea Ltd.) 100.0 100.0
24. BENTELER Automotive Poland spolka z o.o., Września, Poland 100.0 100.0
25. BENTELER Automotive Raufoss AS, Raufoss, Norway 100.0 100.0
26. BENTELER Automotive Rumburk s.r.o., Rumburk, Czech Republic 100.0 100.0
27. BENTELER Automotive SAS, Migennes, France 100.0 100.0
28. BENTELER Automotive SK s.r.o., Malacky (Bratislava), Slovakia 100.0 100.0
29. BENTELER Automotive Skultuna AB, Skultuna, Sweden(previously: BENTELER Aluminium Systems Sweden AB) 100.0 100.0
30. BENTELER Automotive Tonder A/S, Tondern, Denmark 100.0 100.0
31. BENTELER Automotive UK Ltd., Corby, United Kingdom 100.0 100.0
102
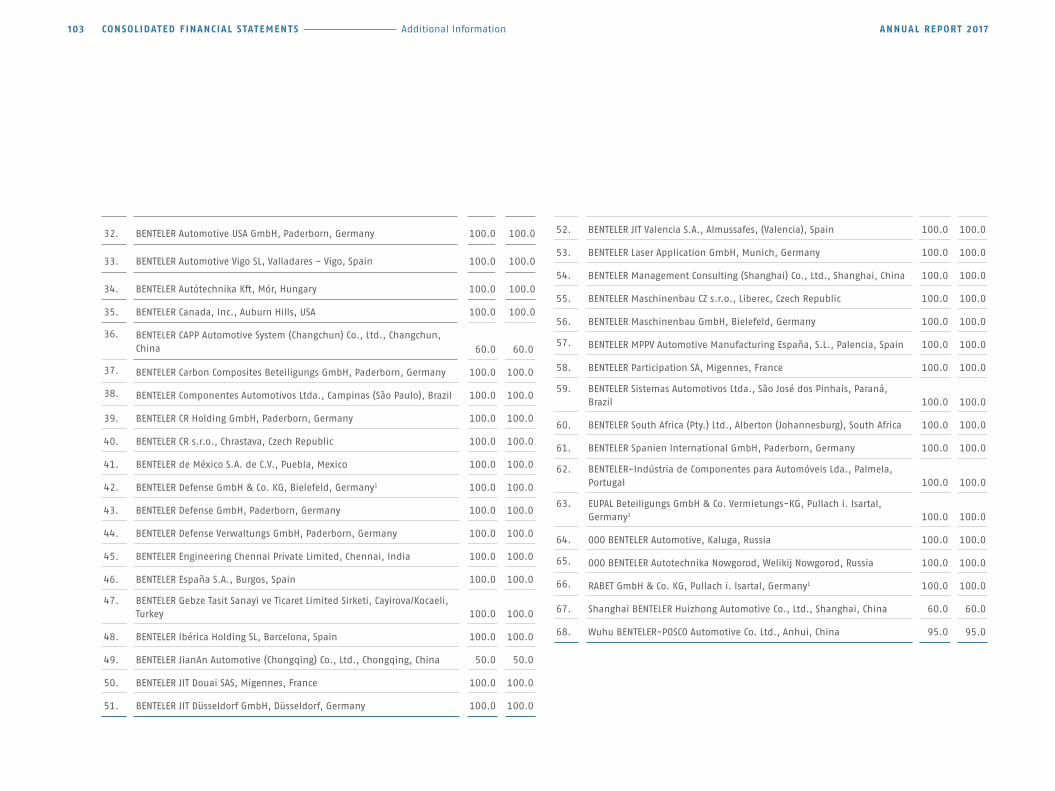
ANNUAL REPORT 2017CONSOLIDATED FINANCIAL STATEMENTS Additional Information
32. BENTELER Automotive USA GmbH, Paderborn, Germany 100.0 100.0
33. BENTELER Automotive Vigo SL, Valladares - Vigo, Spain 100.0 100.0
34. BENTELER Autótechnika Kft, Mór, Hungary 100.0 100.0
35. BENTELER Canada, Inc., Auburn Hills, USA 100.0 100.0
36. BENTELER CAPP Automotive System (Changchun) Co., Ltd., Changchun, China 60.0 60.0
37. BENTELER Carbon Composites Beteiligungs GmbH, Paderborn, Germany 100.0 100.0
38. BENTELER Componentes Automotivos Ltda., Campinas (São Paulo), Brazil 100.0 100.0
39. BENTELER CR Holding GmbH, Paderborn, Germany 100.0 100.0
40. BENTELER CR s.r.o., Chrastava, Czech Republic 100.0 100.0
41. BENTELER de México S.A. de C.V., Puebla, Mexico 100.0 100.0
42. BENTELER Defense GmbH & Co. KG, Bielefeld, Germany1 100.0 100.0
43. BENTELER Defense GmbH, Paderborn, Germany 100.0 100.0
44. BENTELER Defense Verwaltungs GmbH, Paderborn, Germany 100.0 100.0
45. BENTELER Engineering Chennai Private Limited, Chennai, India 100.0 100.0
46. BENTELER España S.A., Burgos, Spain 100.0 100.0
47. BENTELER Gebze Tasit Sanayi ve Ticaret Limited Sirketi, Cayirova/Kocaeli, Turkey 100.0 100.0
48. BENTELER Ibérica Holding SL, Barcelona, Spain 100.0 100.0
49. BENTELER JianAn Automotive (Chongqing) Co., Ltd., Chongqing, China 50.0 50.0
50. BENTELER JIT Douai SAS, Migennes, France 100.0 100.0
51. BENTELER JIT Düsseldorf GmbH, Düsseldorf, Germany 100.0 100.0
52. BENTELER JIT Valencia S.A., Almussafes, (Valencia), Spain 100.0 100.0
53. BENTELER Laser Application GmbH, Munich, Germany 100.0 100.0
54. BENTELER Management Consulting (Shanghai) Co., Ltd., Shanghai, China 100.0 100.0
55. BENTELER Maschinenbau CZ s.r.o., Liberec, Czech Republic 100.0 100.0
56. BENTELER Maschinenbau GmbH, Bielefeld, Germany 100.0 100.0
57. BENTELER MPPV Automotive Manufacturing España, S.L., Palencia, Spain 100.0 100.0
58. BENTELER Participation SA, Migennes, France 100.0 100.0
59. BENTELER Sistemas Automotivos Ltda., São José dos Pinhais, Paraná, B razil 100.0 100.0
60. BENTELER South Africa (Pty.) Ltd., Alberton (Johannesburg), South Africa 100.0 100.0
61. BENTELER Spanien International GmbH, Paderborn, Germany 100.0 100.0
62. BENTELER-Indústria de Componentes para Automóveis Lda., Palmela, Portugal 100.0 100.0
63. EUPAL Beteiligungs GmbH & Co. Vermietungs-KG, Pullach i. Isartal, Germany1 100.0 100.0
64. OOO BENTELER Automotive, Kaluga, Russia 100.0 100.0
65. OOO BENTELER Autotechnika Nowgorod, Welikij Nowgorod, Russia 100.0 100.0
66. RABET GmbH & Co. KG, Pullach i. Isartal, Germany1 100.0 100.0
67. Shanghai BENTELER Huizhong Automotive Co., Ltd., Shanghai, China 60.0 60.0
68. Wuhu BENTELER-POSCO Automotive Co. Ltd., Anhui, China 95.0 95.0
103

ANNUAL REPORT 2017CONSOLIDATED FINANCIAL STATEMENTS Additional Information
Steel/Tube Division
69. BENTELER North America Corporation, Wilmington (Delaware), USA 100.0 100.0
70. BENTELER Rothrist AG, Rothrist, Switzerland 100.0 100.0
71. BENTELER Steel & Tube Corporation, Houston (Texas), USA 100.0 100.0
72. BENTELER Steel Tube GmbH, Paderborn, Germany 100.0 100.0
73. BENTELER Steel/Tube (Nantong) Co. Ltd., Nantong, China 100.0 100.0
74. BENTELER Steel/Tube (UK) Ltd., Wolverhampton, United Kingdom(previously: BENTELER (U.K.) Ltd.) 100.0 100.0
75. BENTELER Steel/Tube Ibérica S.L., Barcelona, Spain 100.0 100.0
76. BENTELER Steel/Tube Manufacturing Corporation, Wilmington (Delaware), USA 100.0 100.0
77. Rohstoff-Handelsgesellschaft Günther Voth GmbH, Paderborn, Germany 62.5 62.5
Distribution Division
78. A/S Thos. Sonne Junr., Middelfart, Denmark 75.0 75.0
79. BENTELER Comercial Ltda., Cotia (São Paulo), Brazil 100.0 100.0
80. BENTELER Distribution (Thailand) Co., Ltd., Bangkok, Thailand 100.0 100.0
81. BENTELER Distribution Austria GmbH, Biedermannsdorf, Austria 100.0 100.0
82. BENTELER Distribution Boru Sanayi ve Ticaret Limited, Cayirova/Kocaeli, Turkey 100.0 100.0
83. BENTELER Distribution Czech Republic spol. s.r.o., Dobríš (Prague), Czech Republic 100.0 100.0
84. BENTELER Distribution Deutschland Beteiligungs GmbH, Duisburg, Germany 100.0 100.0
85. BENTELER Distribution Deutschland GmbH & Co. KG, Duisburg, Germany1 100.0 100.0
86. BENTELER Distribution EOOD, Stara Zagora, Bulgaria 100.0 100.0
87. BENTELER Distribution Estonia OÜ, Saue, Estonia 75.0 75.0
88. BENTELER Distribution France S.à.r.l., La Madeleine de Nonancourt, France 100.0 100.0
89. BENTELER Distribution Hungary Kft., Budapest, Hungary 100.0 100.0
90. BENTELER Distribution India Private Limited, Pune, India 100.0 100.0
91. BENTELER Distribution International GmbH, Düsseldorf, Germany 100.0 100.0
92. BENTELER Distribution Limited, Bolton (Lancashire), United Kingdom 100.0 100.0
93. BENTELER Distribution Poland Sp. z.o.o., Dabrowa Gornicza, Poland 100.0 100.0
94. BENTELER Distribution Singapore Pte Ltd, Singapore, Singapore 100.0 100.0
95. BENTELER Distribution Slovakia, s.r.o., Pusté Úlany, Slovakia 100.0 100.0
96. BENTELER Distribution Ukraine LLC, Lviv, Ukraine 100.0 100.0
97. BENTELER Distribuzione Italia S.p.A., Trezzano sul Naviglio, Italy 100.0 100.0
98. BENTELER Holdings Limited, Bolton (Lancashire), United Kingdom 100.0 100.0
99. BENTELER Trading (Shanghai) Co., Ltd., Shanghai, China 100.0 100.0
100. BENTELER Trgovina d.o.o., Sentjanz, Slovenia 100.0 100.0
101. Heléns Rör A/B, Halmstad, Sweden 75.0 75.0
102. Heléns Rör A/S, Lilleström, Norway 75.0 75.0
103. Heléns Rör A/S, Middelfart, Denmark 75.0 75.0
104. Kindlimann AG, Wil, Switzerland 100.0 100.0
104

ANNUAL REPORT 2017CONSOLIDATED FINANCIAL STATEMENTS Additional Information
105. PT BENTELER Distribution Indonesia, Jakarta, Indonesia 100.0 100.0
106. SC BENTELER Distribution Romania S.R.L., Slatina City, Olt County, Romania 100.0 100.0
107. UAB BENTELER Distribution Lithuania, Vilnius, Lithuania 75.0 75.0
Other
108. BENTELER Capital Corporation, Auburn Hills, USA 100.0 100.0
109. BENTELER Business Services GmbH, Paderborn, Germany 100.0 100.0
110. BENTELER International Beteiligungs GmbH, Salzburg, Austria 100.0 100.0
111. BENTELER Machinery (Shanghai) Co. Ltd., Shanghai, China(previously: BENTELER Engineering Services Shanghai Company Limited) 100.0 100.0
112. BENTELER Netherlands Holding B.V., Helmond, Netherlands 100.0 100.0
113. BENTELER Reinsurance Company DAC, Dublin, Ireland(previously: BENTELER Reinsurance Company Ltd.) 100.0 100.0
114. BENTELER RV GmbH, Paderborn, Germany 100.0 100.0
115. BENTELER Services LLC, Auburn Hills, USA 100.0 100.0
116. BENTELER VV GmbH, Paderborn, Germany 100.0 100.0
117. BLV Versicherungsmanagement GmbH, Dortmund, Germany 55.0 55.0
118. NAPOL GmbH & Co. Objekt Schloss Neuhaus KG, Pullach i. Isartal, Germany1 100.0 100.0
Associated Companies
119. Polarputki Oy, Helsinki, Finland 37.5 37.5
120. Profilanlegg ANS, Raufoss, Norway 26.0 26.0
Companies not included in the consolidated financial statements
121. BENTELER Trgovina d.o.o. u likvidaciji, Zlatar Bistrica, Croatia 100.0 100.0
122. Swissauto Technology AG, Etagnières, Switzerland 100.0 100.0
1 For these companies section 264b of the German Commercial Code applies.
105

ANNUAL REPORT 2017CONSOLIDATED FINANCIAL STATEMENTS Auditor’s report
Report on the consolidated financial statements
Opinion We have audited the consolidated financial statements of Benteler International Aktiengesellschaft, Salzburg, and its subsidiaries (the Group), comprising the Consoli-dated Statement of Financial Position as at December 31, 2017, the Consolidated Income Statement, the Consolidated Statement of Cash Flows and the Consolidated Statement of Comprehensive Income, the Consolidated Statement of Changes in Equity for the year then ended together with the Notes.
In our opinion the consolidated financial statements comply with the legal require-ments and present a true and fair view of the assets and the financial position of the Group as at December 31, 2017 and of its results and cash flows for the year then ended in accordance with International Financial Reporting Standards (IFRS) as adopted by the EU and the additional requirements of section 245a of the Austrian Commercial Code.
Basis for our opinion
We conducted our audit in accordance with Austrian auditing standards. Those standards require that we comply with International Standards on Auditing (ISA). Our responsibilities in accordance with those requirements and standards are detailed in the section entitled “Responsibilities of the auditor for the audit of the consolidated financial statements” in our auditor’s report. We are independent of the Group in accordance with Austrian company and professional law and we have fulfilled our other professional duties in accordance with those requirements. We believe that the audit evidence we have obtained is sufficient and appropriate to serve as a basis for our audit opinion.
Auditor’s report
Responsibility of the management and the Audit Committee for the consolidated financial statements
The Company’s management is responsible for preparing these consolidated financial statements in accordance with IFRS as adopted by the EU and the additional require-ments pursuant to section 245a of the Austrian Commercial Code and for ensuring that they present a true and fair view of the assets, financial position and results of the Group. The management is also responsible for performing the internal controls it deems necessary for the preparation of consolidated financial statements that are free of material misstatement – whether intentional or otherwise.
In preparing the consolidated financial statements the management is responsible for assessing the Group's ability to remain a going concern, declaring any relevant facts connected to the continuation of the business activity and applying the going concern accounting policy, unless the management intends either to liquidate the Group or to discontinue its business activity, or has no realistic alternative to doing so.
The Audit Committee is responsible for monitoring the Group's accounting process.
Responsibilities of the auditor for the audit of the consolidated financial statements
Our objective is to provide sufficient assurance that the consolidated financial state-ment as a whole is free of material misstatement – whether intentional or otherwise – and to issue an auditor's report containing our opinion. Sufficient assurance is a high degree of assurance, but no guarantee that an audit conducted in accordance with Austrian auditing standards which require the application of ISA will in all cases detect material misstatement, if such exists. Misstatements can result from malicious acts or errors and are considered material if they may be reasonably expected, indi-
106

ANNUAL REPORT 2017CONSOLIDATED FINANCIAL STATEMENTS Auditor’s report
vidually or collectively, to influence economic decisions taken by users on the basis of these consolidated financial statements.
As part of an audit in accordance with Austrian auditing standards which require the application of ISA we exercise professional judgment throughout the audit and main-tain a critical approach.
In addition:
─ We identify and assess the risks of material misstatement – whether intentio-nal or otherwise – in the financial statements, plan auditing procedures in res-ponse to such risks, implement those procedures and obtain audit evidence that is sufficient and appropriate to serve as a basis for our audit opinion. The risk that material misstatement resulting from malicious acts may not be detected is greater than in the case of misstatement resulting from errors, since malicious acts may involve fraudulent collaboration, forgery, intentional omissions, misleading repre-sentations or the bypassing of internal controls.
─ We gain an understanding of the internal control system relevant to the audit in order to plan audit procedures that are appropriate in the circumstances, but not for the purpose of expressing an opinion on the effectiveness of the Company’s internal control system.
─ We assess the appropriateness of the accounting policies used by the manage-ment and the tenability of the values estimated by the management in the accounts and associated disclosures.
─ We draw conclusions about the appropriateness of the use of the going concern accounting policy by the management and, on the basis of the audit evidence obtained, whether there is material uncertainty in relation to events or circumstan-ces which may cast significant doubt on the Group's ability to continue its business
activity. If we conclude that there is material uncertainty, we are obliged to draw attention in our auditor's report to the associated disclosures in the consolidated financial statements or, if such disclosures are inappropriate, to modify our audit opinion. We draw our conclusions on the basis of the audit evidence obtained up to the date of our auditor's report. Future events or circumstances may, however, lead to the Group abandoning the continuation of business activity.
─ We assess the overall presentation, structure and content of the consolidated financial statements, including the disclosures, and whether the consolidated financial statements reflect the underlying transactions and events in a manner which presents a true and fair view.
─ We obtain sufficient appropriate audit evidence concerning the financial infor-mation of the units or business activities within the Group in order to issue an opi-nion on the consolidated financial statements. We are responsible for guiding, monitoring and implementing the audit of the consolidated financial statements. We bear sole responsibility for our audit opinion.
─ We exchange information with the Audit Committee among other things on the planned scope and planned time distribution of the audit and with regard to signi-ficant audit findings, including any significant deficiencies in the internal control system which we identify during our audit.
─ We also declare to the audit committee that we have adhered to the relevant professional conduct requirements with regard to independence and exchange information with it on all relationships and other matters which may be reasonably assumed to affect our independence and – where relevant – associated safeguards.
107

ANNUAL REPORT 2017CONSOLIDATED FINANCIAL STATEMENTS Auditor’s report
Report on the Group management report
The Group management report must be examined in accordance with Austrian com-pany law to ascertain that it accords with the consolidated financial statements and whether it has been prepared in accordance with the applicable legal requirements.
The management is responsible for preparing the Group management report in accordance with Austrian company law and special legal provisions.
We have conducted our examination in accordance with the professional principles for the examination of the Group management report.
Opinion
In our opinion the Group management report has been prepared in accordance with the applicable legal requirements and is consistent with the consolidated financial statements.
Declaration
In the light of the knowledge obtained during the audit of the consolidated financial statements and the understanding obtained concerning the Group and its environ-ment, no evidence was found of material misstatement in the Group management report.
Other information
The management is responsible for the other information. The other information inclu-des all information in the annual report, with the exception of the consolidated finan-cial statements, the Group management report and the auditor’s report there on. The annual report is expected to be available to us after the date of the auditor's report.
Our audit opinion concerning the consolidated financial statements does not cover this other information and we shall not provide any assurance on it.
In connection with our audit of the consolidated financial statements our responsibi-lity is to read such other information as soon as it is available and to assess whether, in the light of the understanding obtained in the audit, it materially contradicts the consolidated financial statements or otherwise appears materially incorrect.
Salzburg, February 9, 2018
KPMG Austria GmbH Wirtschaftsprüfungs- und Steuerberatungsgesellschaft
Mag. Cäcilia Gruber Auditor
108

ANNUAL REPORT 2017CONSOLIDATED FINANCIAL STATEMENTS Report of the Supervisory Board
Meetings and committees
The Supervisory Board intensively monitored and supported the development of BENTELER International AG within the framework of its responsibility. The Supervisory Board exercised its powers and fulfilled the duties incumbent upon it under the law and articles of association by means of four regular meetings and three circular reso-lutions during the 2017 financial year. The Executive Board reported regularly, promptly and comprehensively, both in writing and orally, on the course of business, the position of the Company as well as the risk situation and risk management of the Company and its Group companies. In addition, the Chairman of the Executive Board maintained regular contact with the Chairman of the Supervisory Board and kept him informed about the strategy, business development and position of the Company including its Group companies. The Supervisory Board was also informed about the key data in the Consoli-dated Financial Statements, approved them and adopted further corporate planning.
The Personnel Committee met twice in the 2017 financial year, dealing mainly with the bonus system.
The Audit Committee met on three occasions in the 2017 financial year. It principally considered the separate and consolidated financial statements, the financial reporting process, the risk and compliance management system and the audit strategy, as well as monitoring the audit. The Supervisory Board has increased the number of members of the Committee from two to four.
Annual and consolidated financial statements
The annual financial statements and the management report as well as the consoli-dated financial statements and the Group management report of Benteler International AG for the 2017 financial year were examined by the auditor selected by the Annual General Meeting and appointed by the Chairman of the Supervisory Board, KPMG Aus-tria GmbH Wirtschaftsprüfungs- und Steuerberatungsgesellschaft, Kudlichstraße 41-43,
4020 Linz. According to the closing statement, the results of the audit raised no cause for objections. The auditor confirmed that the Company’s accounting, financial state-ments and management report, as well as the consolidated financial statements and the Group management report, comply with the legal requirements and give a true and fair view of the assets, financial position and results of the Company in compliance with proper accounting procedures. The auditor further confirmed that the manage-ment report and the Group management report are consistent with the annual finan-cial statements and consolidated financial statements. The annual financial statements and the management report as well as the consolidated financial statements and the Group management report of the Company have therefore been issued with an unqualified audit opinion. A separate report was supplied to the Chairman of the Supervisory Board by management letter.
The auditor has supplied sufficient explanations to the Supervisory Board with regard to the annual and consolidated financial statements.
The final result of the examination conducted by the Audit Committee of the manage-ment report of the Executive Board, the annual financial statements as well as the con-solidated financial statements and Group management report and the management audit undertaken by the Supervisory Board raised no cause for objections. The Supervisory Board has approved the annual financial statements and the consolidated financial statements. The annual financial statements have thus been adopted in accordance with section 96 paragraph 4 of the Stock Corporation Act. The Supervisory Board endorses the Executive Board’s proposal for appropriation of profit.
The Supervisory Board proposes to appoint KPMG Austria GmbH Wirtschaftsprüfungs- und Steuerberatungsgesellschaft, Kudlichstraße 41-43, 4020 Linz as auditors and as the Group’s independent auditors for the 2018 financial year.
Salzburg, March 16, 2018
Chairman of the Supervisory Board
Report of the Supervisory Board of BENTELER International AG on the 2017 financial year
109

ANNUAL REPORT 2017CONSOLIDATED FINANCIAL STATEMENTS List of Tables and Figures
List of Tables and Figures
No. Description Page
THE BENTELER GROUP
1.1 Key Performance Indicators 2
1.2 Revenue by segment 2
1.3 Revenue by region 2
1.4 BENTELER Locations 7
GROUP MANAGEMENT REPORT
2.1 Revenue performance since 2013 11
2.2 Revenue by Division 11
2.3 Revenue by segment 12
2.4 Investments 15
2.5 Statement of cash flows 15
2.6 Group balance sheet structure 16
2.7 Key financial ratios 17
2.8 Total investments, depreciation and amortization, and cash flow from profit 18
CONSOLIDATED FINANCIAL STATEMENTS
3.1 Consolidated Income Statement (IFRS) 35
3.2 Consolidated Statement of Comprehensive Income (IFRS) 36
3.3 Consolidated Statement of Financial Position (IFRS) as at December 31, 2017 37
3.4 Consolidated Statement of Cash Flows (IFRS) 39
3.5 Consolidated Statement of Changes in Equity (IFRS) 41
3.6 New accounting standards – current reporting period 44
3.7 New accounting standards – current reporting period 45
3.8 Items of the statement of financial position affected by the application of IFRS 15 47
3.9 Development of the consolidated group 50
3.10 Deconsolidated net assets 50
3.11 Deconsolidated net assets 51
3.12 Foreign currency exchange rates 52
3.13 Useful lives of intangible assets 54
3.14 Useful lives of property, plant and equipment 54
3.15 Impairment test 55
3.16 Revenue 60
3.17 Cost of sales 60
3.18 Other operating income 60
3.19 Net finance result 61
3.20 Net finance result 61
3.21 Income taxes 62
3.22 Reconciliation between expected and disclosedincome tax expense 62
3.23 Total research and development expenses 63
3.24 Development of intangible assets 64
3.25 Development of intangible assets 65
3.26 Property, plant and equipment 66
3.27 Property, plant and equipment 67
3.28 Outstanding minimum lease paymentsunder operating leases 68
3.29 Outstanding minimum lease paymentsunder finance leases 69
3.30 Financial information on investments in associates 69
3.31 Allocation of deferred tax assets and liabiliites to itemsin the statement of financial position 70
3.32 Unused tax loss carryforwards 70
3.33 Other non-current receivables and assets 71
3.34 Inventories 72
110

ANNUAL REPORT 2017CONSOLIDATED FINANCIAL STATEMENTS List of Tables and Figures
3.56 Sensitivity analysis for interest rate risk 82
3.57 Sensitivity analysis for aluminum price risk 83
3.58 Maturities of financial liabilities 85
3.59 Maturities of financial liabilities 86
3.60 Types, amounts and fair values of foreign currency hedges and interest ratehedges held in the current reporting period 88
3.61 Types, amounts and fair values of foreign currency hedges and interest ratehedges held in the prior reporting period 88
3.62 Carrying amounts of financial assets and liabilities by category 89
3.63 Carrying amounts of financial assets and liabilities by category 90
3.64 Carrying amounts of financial assets and liabilities by category 91
3.65 Carrying amounts of financial assets and liabilities by category 92
3.66 Fair values and carrying amounts of financial assets and liabilitiesby fair value hierarchy 94
3.67 Fair values and carrying amounts of financial assets and liabilitiesby fair value hierarchy 94
3.68 Fair values and carrying amounts of financial assets and liabilitiesby fair value hierarchy 95
3.69 Fair values and carrying amounts of financial assets and liabilitiesby fair value hierarchy 95
3.70 Other financial assets – derivatives with positive market value 96
3.71 Other financial liabilities – derivatives with negative market value 96
3.72 Determination of the net amounts of other financial assets recognizedin the statement of financial position 97
3.73 Financial debts 98
3.74 Total remuneration of management in key positions 100
3.75 Auditor’s fees 101
3.76 Appendix to the Notes: List of Shareholdings as at December 31, 2017 102
3.35 Trade receivables 72
3.36 Development of doubtful debt allowanceson trade receivables 72
3.37 Maturity structure of unadjusted receivables 73
3.38 Receivables from construction contracts 73
3.39 Other current receivables and assets 73
3.40 Development of other components of equityin the current reporting period 74
3.41 Development of other components of equityin the prior reporting period 75
3.42 Provisions 75
3.43 Statement of changes in provisions 76
3.44 Parameters for actuarial calculations 77
3.45 Reconciliation of the liability under defined benefit plans with provisions for pensions and similar obligations 77
3.46 Expenses from retroactive plan amendments 77
3.47 Changes in plan assets 78
3.48 Changes in asset ceiling 78
3.49 Components of plan assets 78
3.50 Impact of changes in actuarial parameterson the defined benefit obligation 79
3.51 Impact of changes in actuarial parameterson the defined benefit obligation 79
3.52 Financial liabilities 80
3.53 Other current liabilities 80
3.54 Sensitivity analysis for EUR foreign exchange risk 81
3.55 Sensitivity analysis for USD foreign exchange risk 82
111

Published byBENTELER International AG, Salzburg, Austria
Concept, design and typesettingMPM Corporate Communication Solutions, Mainz, Germany
Photography byJens Erbeck
ContactBENTELER International AGCorporate Communications/MarketingSchillerstraße 25–275020 Salzburg, [email protected]

BENTELER International AG
Corporate Communications/MarketingSchillerstraße 25–275020 Salzburg, Austria
BENTELER.
The family of driven professionals.
Since 1876.