Annual Report 2016 - Transcom WorldWide2016.transcom.com/wp-content/uploads/2015/12/Trans... ·...
78
Annual Report 2016
Transcript of Annual Report 2016 - Transcom WorldWide2016.transcom.com/wp-content/uploads/2015/12/Trans... ·...
Annual Report 2016
MORE INFORMATION ABOUT TRANSCOMThis annual report is focused on the annual financial review. The resources listed below provide additional information about Transcom and important activities in 2016.
blog.transcom.com
CONTENTSKey highlights 1Comments from the CEO 2
Annual ReportAdministration report 6
The Transcom share 13Financial overview 14
Consolidated financial statements and notes 15Parent Company financial statements and notes 39Signatures of the Board of Directors 52Auditor’s report 53
Definitions 57
Corporate Governance Report 59Risk management 66Board of Directors 68Group Executive management 70Auditor’s report on Corporate Governance Statement 73
This special website replaces the traditional front section of the annual report, giving you key highlights from 2016. You will also find Transcom’s people & sustainability report here.
On Transcom’s corporate blog, we share stories from around the company. We also try to exemplify how we work together with our clients to enhance their business performance by improving the experience of their customers.
Transcom’s corporate website.
This magazine contains recent stories from around Transcom. It can be downloaded on www.transcom.com.
TALKTALK CUTS THE TALK
The telco’s secret to success P.6
CUSTOMER CARE IN A DIGITAL AGEHOW ONLINE SERVICES ARE BRINGING CUSTOMER SATISFACTION P.13
VIAPLAY’S ONLY VIABLE SOLUTION
Online care in the world of entertainment P.17
A TEAM
LEADER WITH A WINNING
WAY P.12
C U S T O M E R C A R E I N S I G H T S / 2 0 1 7
Hello TRAN
SCOM
The formal annual accounts and the consolidated accounts comprise pages 6–52.This is a translation of the original Swedish Annual Report. In the event of differences between the English translation and the Swedish original, the Swedish Annual Report shall prevail.
2016.transcom.com Transcom.com
Hello Transcom

TRANSCOM OPENS NEW CONTACT CENTER IN POLANDTranscom opened a new contact center in the city of Bialystok in northeastern Poland in 2016. The new site will support growth with clients in Poland, focusing on delivering customer care services in the Polish language on behalf of domestic clients. Transcom’s other two locations in Poland, in Gdansk and Olsztyn, have evolved into important multilingual delivery hubs for clients in major Euro-pean countries. The expansion in Bialystok will allow the other sites in Poland to focus on further expanding their multilingual delivery capacity, meeting the high demand for this type of service.
TRANSCOM EXITED COLOMBIA AND PERUTranscom began a strategic review of its Latin American opera-tions in 2016, as the company has chosen to focus on other mar-kets. At the beginning of 2016, the contact center in Cali, Colombia was closed, and in January 2017, Transcom successfully closed the divestment of its operations in Peru for an equity value of EUR 1.0 million. Transcom’s contact center in Concepción, Chile is the company’s only remaining asset in Latin America.
DIVESTMENT OF CMS DENMARKIn March 2016, Transcom successfully closed the divestment of its Danish Credit Management Services operations (CMS Denmark) for an equity value of EUR 13.0 million. This transaction concluded the divestment of Transcom’s former CMS business unit, in line with the company’s strategy to focus on its core business – outsourced cus-tomer care solutions.
NEW CREDIT FACILITYIn March 2016, Transcom signed a syndicated credit agreement with ING, Nordea and SEB to implement a EUR 90 million multi- currency revolving credit facility. The facility has a tenor of three years with an option to extend for one year. The purpose of the new agreement was to refinance an existing facility which was due to expire in January 2017. Given the change of ownership in Transcom (see below), the company has terminated its credit facility and has together with Altor AB signed a new credit facility with another bank.
PUBLIC OFFER FOR ALL OUTSTANDING SHARES IN TRANSCOMOn December 21, 2016, Altor announced a public cash offer to the shareholders of Transcom to transfer all of their shares in Transcom to Altor. Altor offered SEK 87.50 in cash per share in Transcom. On March 13, 2017, Altor announced that all conditions for completion of the offer had been satisfied and Altor therefore declared the offer unconditional and completes the offer.
Key financial highlights
Key highlights
Revenues EBIT* EUR million EUR million
* Excluding non-recurring items
0
200
400
600
800
20162015201420132012 5
10
15
20
25
■ ■ Revenues EBIT
1Transcom Annual Report 2016
Key highlights

Comments from the CEO
We are continuing to progress well against our mid-term financial targets, despite a challenging first half of the year. In the first and second quarters, we experienced an unexpected temporary volume drop in the English-speaking markets & APAC region, as well as soft volumes in the telecom sector in North Europe. In response, we imple-mented a number of initiatives in order to boost growth, control cost, and raise efficiency. These measures brought about a quick performance recovery during the second half of 2016, as evidenced by the improvement in our EBIT margin from 2.2 percent in the January–June period to 5.5 percent during July–December. This means that we are now within reach of our target to generate an annual EBIT margin of at least 5 percent.
BACK TO POSITIVE ORGANIC GROWTH IN THE LAST QUARTER OF THE YEARWhile we are not yet back to last year’s revenue level, our efforts to win new business in order to fill unused capacity in the English- speaking markets & APAC region started to yield good results during the third quarter. We ramped up new business volumes with several of our existing clients, as well as with a few new clients. The positive trend continued into the fourth quarter, with a fast-improv-ing utilization of available capacity. In Europe, solid growth with clients in other sectors compensated for lower volumes with tele-com clients compared to last year. Our full-year and Q4 financials clearly reflect this positive progression during the year. While organic revenue growth was negative from a full-year perspective
(-4.4 percent), we managed to return to positive organic growth in the fourth quarter (+1.4 percent).
We signed several new client agreements in 2016, both with new clients and with existing ones. In order to build stronger part-nerships with global clients, and facilitate further expansion with them in new geographies, we established a number of new global account teams during the year. We also expanded our footprint in 2016 by opening a new site in the city of Bialystok in Poland. This new site will support growth with clients in Poland, focusing on delivering customer care services in the Polish language on behalf of domestic clients. Our other two locations in Poland, in Gdansk and Olsztyn, have evolved into important multilingual delivery hubs for clients in major European countries. The expansion in Bialystok will allow these other sites in Poland to focus on further expanding their multilingual delivery capacity, meeting the high demand for this type of service.
Because business volumes (demand for customer care sup-port) can vary significantly over time in our industry, it is critical that we keep growing and broadening our client base, while also main-taining a high degree of flexibility and responsiveness. Our target is to generate organic revenue growth of at least 5 percent per year.
IMPROVED EFFICIENCY AND STRENGTHENED COST CONTROLThe fact that we have been filling unused capacity with new busi-ness volumes is a key factor behind our positive profitability trend. But we also made significant progress during the year in terms of improved operational efficiency and cost effectiveness. First, the realignment of our regional management structure in the Conti-
12-month rolling EBIT* margin development, %
1.0
1.5
2.0
2.5
3.0
3.5
4.0
4.5
5.0
Q4Q3Q2Q1Q4Q3Q2Q1Q4Q3Q2Q1Q4Q3Q2Q12013 2014 2015 2016
Mid-term target
* Excluding items affecting comparability
2 Transcom Annual Report 2016
Comments from the CEO
nental Europe region was fully implemented during the fourth quarter. This program is estimated to yield EUR 2.9 million in annual cost savings.
Another key project in 2016 was our Group-wide operational excellence program, which also included a comprehensive internal site benchmarking exercise. A majority of our sites were scrutinized during the year, focusing on root cause analysis and the identifica-tion of best practices. This project has improved the level of trans-parency throughout our organization, contributing to a strength-ened performance culture and internal competition mindset. I am happy to report that the operational excellence program delivered positive results in all regions. We made good progress in terms of reducing staff attrition and sickness, along with improvements in workforce management, recruitment processes and standardiza-tion. Overhead reduction and improved support ratios have also contributed to cost savings. Apart from cost optimization and effi-ciency improvements, we have also managed to make some enhancements from a commercial standpoint as a result of rene-gotiations with clients.
Driving standardization and efficiency across our global business will continue to be an important priority for Transcom, key to pro-tecting and enhancing our competitive position in the marketplace.
INNOVATION AND BUSINESS DEVELOPMENTThe customer care outsourcing industry is growing at an attractive rate, exceeding expected global GDP growth. Transcom anticipates that the global market will grow at an average annual rate of around 4–5 percent up to 2020. At the same time, the nature of customer service is gradually changing, not least because of the migration to digital channels such as apps, social media, chat, and self-service. Customers increasingly expect customer service to be accessible at all times. They also expect to be able to resolve their issues via the channel of their choice, without the hassle of having to switch modes of communication.
We have supported many clients on their digital journeys, help-ing them to manage the shift towards non-voice solutions for cus-tomer care. Today, approximately 30 percent of Transcom’s reve-nue is related to non-voice activities, and that number will keep increasing. We are well-positioned to deliver services via digital, non-voice channels as well as through the traditional voice channel.
Innovation is one of Transcom’s core values, signifying that we are progressive and move quickly to anticipate new customer trends and needs. There are plenty of great opportunities to create value together with our clients, but it is critical that we keep evolv-ing our offerings and capabilities, staying adaptive and proactive in
“ Innovation is one of Transcom’s core val-ues, signifying that we are progressive and move quickly to antici-pate new customer trends and needs.”
3Transcom Annual Report 2016
Comments from the CEO
response to changing market conditions and competitive dynam-ics in our industry. The proliferation of new technologies and changing consumer preferences require us to constantly innovate and refine best practices together with our clients in order to remain competitive. To this end, Transcom’s Innovation Council was established in 2016, with members from different functional as well as operational areas. This group is charged with overseeing the development of Transcom’s value proposition and offerings. They also ensure effective coordination and sharing of best prac-tices internally, and manage the development of partnerships with external parties.
PEOPLE & SUSTAINABILITYTranscom’s customer experience specialists handle 1.5 million interactions with our clients’ customers every day. We hire and train thousands of new people every year. So the way we take care of and develop our people lies at the core of our strategy and activi-ties. By the same token, people are at the focus of Transcom’s sus-tainability strategy. Our stakeholder dialogues have confirmed our view. Transcom’s sustainability program, Transcom Cares, was launched in 2013, focusing on people development, equality & diversity and community engagement. While the focus of our sus-tainability efforts remains unchanged, we reviewed and calibrated our priorities during the year. We also strengthened the program’s governance and processes for target follow-up.
Talent management and training are absolutely central to our people and sustainability strategy. Promoting diversity and equal
opportunity is equally important to us. We strive for gender equality on all levels, and are dedicated to providing equal opportunity employment. We are focused on attracting top talent and retaining people to build a truly global company that is prepared to meet and deliver towards diverse business cultures in all corners of the world.
Transcom adds value to our clients’ businesses by supporting the creation of outstanding customer experiences, while reducing cost and helping to drive growth. The customer care industry is exceptionally data-driven. In order to run the business efficiently and track our performance against key performance indicators, an immense amount of data is collected on millions of customer inter-actions every day. This information can offer crucial insights for Transcom and our clients in terms of enhancing the understanding of customers, and the drivers of loyalty and disloyalty. Our clients entrust us with their customers’ and their own data and they expect us to protect it well. Ensuring customer data protection and secu-rity, as well as taking proactive measures against fraud, are clearly very important sustainability issues for us.
Getting involved in the communities in which we operate not only strengthens our employer brand, but also maintains our license to operate in the markets where we choose to compete. Community engagement has been a part of Transcom’s culture since the beginning, and it is clear that our activities in this area support recruitment and staff retention. I am proud to say that many of our community engagement projects depend on our employees’ passion to contribute their time and energy.
At Transcom, we strive to reduce the environmental impact of
“ Transcom’s customer experience specialists handle 1.5 million interactions with our clients’ customers every day. We hire and train thousands of new people every year.”
4 Transcom Annual Report 2016
Comments from the CEO

our operations, with a particular focus on managing e-waste, limit-ing business travel and lowering energy consumption in our facili-ties. We conduct training and support local initiatives with our employees in order to encourage greater environmental responsi-bility in our workplaces. Our environmental policy, which is in agreement with the precautionary principle, guides us in lowering emissions from air travel, supports us in selecting goods and ser-vices produced with respect for the nature and constitutes a tool for pushing our environmental demands throughout our supply chain.
In addition to the sustainability focus areas we have defined, Transcom fully supports the ten principles of the UN Global Com-pact with respect to human rights, labor rights, environmental care and anti-corruption work. These principles are an integral part of our corporate strategy, business culture and day-to-day operations. Therefore, as part of our on-going pledge to deliver an outstanding customer experience in a global sustainable society, Transcom is a signatory of the UN Global Compact. We are whole-heartedly committed to ensuring that we comply with the UN Global Com-pact and its principles.
Finally, we are committed to offering transparent reporting and communication on sustainability at Transcom. This year, we are taking an important step in further improving our reporting by pub-lishing our first sustainability report in accordance with the GRI Standards (Core option) of the Global Reporting Initiative. You will find the GRI Index at 2016.transcom.com. We have started to report on a number of new KPIs, not least in our focus areas People Development and Equality & Diversity. On this site, you will also find content in other areas, such as business development and finance. Let me also invite you to read Transcom’s magazine, Hello Transcom, which features stories from the year. It is available on transcom.com.
ALTOR ACQUIRES ALL SHARES IN TRANSCOMOn December 21, 2016, Altor AB announced a public cash offer to the shareholders of Transcom, offering SEK 87.50 in cash per share, corresponding to a total value for all outstanding shares in Transcom of SEK 2,294 million. Transcom’s independent Bid Committee unanimously recommended that the shareholders of Transcom accept the offer. On March 13, 2017, Altor announced that all conditions for completion of the offer had been satisfied and Altor therefore declared the offer unconditional and completes the offer. On March 22, 2017, when the final acceptance period expired, Altor owned approximately 98.3 percent of the shares and votes in Transcom. Altor has called for compulsory redemption of the remaining shares. The Board of Directors has applied for delist-ing of Transcom’s shares. Nasdaq Stockholm has approved the application and resolved that the last day of trading in the Transcom share will be April 10, 2017.
Altor has stated that they support Transcom’s strategy, and they are planning to accelerate the implementation of some activities, increase investments to support digitalization and also make tar-geted acquisitions.
Let me close by thanking our clients for their continued support, as well as all 29,000 colleagues for their hard work, commitment and dedication during 2016.
Stockholm, April 5, 2017
Johan ErikssonPresident & CEO of Transcom
5Transcom Annual Report 2016
Comments from the CEO

Transcom is a global customer experience specialist, providing customer care, sales, technical support and collections services through an extensive network of contact centers and work-at-home agents. Transcom’s principal role is to positively impact cus-tomer loyalty and, thus, revenue through making service and sup-port interactions as effortless and enjoyable as possible for our clients’ customers. Transcom’s customer experience specialists engage with customers in multiple channels, including phone, e-mail, chat and social media networks.
Transcom serves clients across the globe in virtually every industry and area of public service. Many of our clients compete in fast-moving, mass consumer markets that demand extreme levels of responsiveness to shifting consumer needs and preferences. Transcom has deep know-how in a wide range of industries, includ-ing telecommunications & media, financial services, retail, and travel. Customer experience is a significant differentiator in all these sectors, and the quality of customer care service delivery continues to play a major role in influencing customer choice when deciding which brands to do business with.
Transcom’s operations add value to clients’ businesses by sup-porting the creation of outstanding customer experiences, while reducing cost and helping to drive growth. Transcom does this directly, by delivering multi-channel customer service and support in a cost-effective way. But Transcom’s goal is also that the Com-pany’s activities benefit other parts of clients’ businesses.
For example, Transcom’s analytics capabilities can generate insights that ultimately contribute to the creation of a differentiated customer experience, setting Transcom’s clients apart in an increasingly competitive marketplace.
As a global specialist of outsourced customer care solutions, Transcom has an important role in helping to make sure that end customers form positive perceptions of their interactions with the companies that Transcom supports. To many of the Company’s
Administration report
The Board of Directors and the CEO of Transcom WorldWide AB (publ), corporate registration number 556880-1277, hereby submit the Annual Report and Consolidated Financial Statements for the 2016 financial year.
Net debt EUR million
38.136.2
24.6
18.1 17.6
0
5
10
15
20
25
30
35
40
20162015201420132012
2016 2015 2014 2013 2012Revenue (EUR million) 586.1 626.5 616.8 653.2 605.6Profit/loss before tax(EUR million) 21.2 17.4 18.8 –12.2 –23.6Profit/loss for the year(EUR million) 16.1 8.7 6.9 –18.6 –30.6Operating margin 4.0% 3.2% 3.5% –0.8% –2.9%Net debt/EBITDA 0.6 0.6 0.9 1.5 2.0
Market definition – what business are we in?
Customer management comprises the processes linking an organi-zation with its existing and potential customers, and includes four sub segments: customer selection, customer acquisition, customer reten-tion and customer extension. Services are delivered via four primary channels:• Telephony, including voice and interactive voice response (IVR)
self-service• Email response management• Web chat• Knowledge management for web-based self-service
Help Desk outsourcing involves first- and second-level help desk support for information technology services, both for internal stake-holders in an organization and external customers.
6 Transcom Annual Report 2016
Administration report
clients, the quality of their customer care operations is fundamen-tal to their ability to execute their service-based strategies to increase loyalty, retention and customer sales. This is why they partner with Transcom, whose core business is to deliver excellent multi-channel customer service and support.
The Company’s services are delivered through a structured and proven process with rigorous quality controls. Continuous improve-ment practices, focused on strengthening service quality and enhanc-ing operational efficiency, are embedded into daily operations.
The impact of the Company’s service delivery on customer experience is constantly validated, e.g. through Customer Satisfac-tion, Customer Effort, and Net Promoter indices.
At the end of 2016, Transcom had approximately 29,000 cus-tomer experience specialists at 52 onshore, offshore and near shore contact centers across 20 countries, delivering services in 33 languages to customers in various industry verticals.
The Transcom Group consisted of the following business seg-ments (regions) at the end of 2016: North Europe, Continental Europe, English-speaking markets & APAC, and Latin America.
In Q1 2016, Transcom made a number of changes to the Group’s regional and management structure, and comparable figures were restated accordingly. The Continental Europe region combines Transcom’s operations in Spain and Portugal with the former Central & South Europe region (excluding the United King-dom). The English-speaking markets & APAC region integrates the UK organization with Transcom’s operations in North America & Asia Pacific. The North Europe region remains unchanged. Follow-ing the closure of Transcom’s contact center in Colombia in Q1 2016 and the divestment of the Peruvian business in January 2017, Transcom’s contact center in Concepción, Chile is the company’s only remaining asset in Latin America. As previously disclosed, Transcom’s Latin American business is under strategic review, as the company has chosen to focus on other markets.
On March 3, 2016, Transcom announced that the Company has successfully closed the divestment of its Danish Credit Man-agement Services operations (CMS Denmark) for an equity value of EUR 13.0 million. CMS Denmark was part of Transcom’s North Europe region in 2015. The divested unit had a turnover of EUR 11.4 million in 2015 and had approximately 80 employees. This trans-action concluded the divestment of Transcom’s former CMS busi-ness unit, in line with the company’s strategy to focus on its core business – outsourced customer care solutions.
FINANCIAL OVERVIEWRevenue developmentRevenue in 2016 amounted to EUR 586.1 million (EUR 626.5 mil-lion). Revenue adjusted for exchange rate impact and divested operations decreased by 4.4 percent in 2016 (EUR 27.7 million). The divestment of CMS Denmark had a EUR 11.4 million negative impact on the revenue comparison with 2015, while currency effects had a EUR 1.3 million negative impact.
Operating resultTranscoms EBIT in 2016 was EUR 23.4 million compared to EUR 20.0 million in 2015. Non-recurring items amounted to positive EUR 0.5
million in 2016 (-3.2), and consisted of EUR 3.0 million in restructuring costs related to changes to the regional and management structure, and a positive EUR 3.5 million capital gain from the divestment of CMS Denmark. EBIT excluding non-recurring items was EUR 22.9 million (23.2).
Depreciation amounted to EUR 7.3 million in 2016 (7.8) and amortization EUR 0.9 million (1.4). SG&A expenses amounted to EUR 97.6 million (102.8).
TaxesIn 2016, the Group’s tax expense amounted to EUR 5.1 million (EUR 8.7 million), with an effective tax rate of 24 percent (50). The effec-tive tax rate is affected by losses for which no deferred tax asset can be recognized. Last year’s tax expense included a EUR 2.5 mil-lion tax audit provision. Excluding the tax audit provision the effec-tive tax rate was 36 percent in 2015.
Cash flow
EUR million2016
Jan–Dec2015
Jan–DecCash flow from operating activities before changes in working capital 17.9 21.5Change in working capital -12.9 -0.9Cash flow from operating activities 5.0 20.6Cash flow for the year -9.3 -15.1
Cash flow from operating activities decreased during 2016 com-pared to the previous year, mainly due to negative working capital and negative cash flow effects from restructuring costs. Cash flow from investments was positively impacted by the sale of CMS Den-mark in Q1 2016, amounting to EUR 12.6 million. A dividend amounting to EUR 4.9 million was paid to the shareholders in Q2 2016.
Debt & Financing
EUR million2016
Dec 312015
Dec 31Gross debt 30.8 42.9Net debt 17.6 18.1Net debt/EBITDA 0.6 0.6Equity 142.7 132.0Cash and cash equivalents 15.4 24.8
Transcom reduced gross debt from EUR 42.9 million at the end of 2015 to EUR 30.8 million at the end of 2016. Net debt as at December 31, 2016 was EUR 17.6 million, compared to EUR 18.1 million at the end of 2015. Net Debt/EBITDA was 0.6, compared to 0.6 at the end of 2015. Transcom is well within its financial cove-nant thresholds.
On March 9, 2016, Transcom announced that the Company has signed a syndicated credit agreement with ING, Nordea and SEB to implement a EUR 90 million multi-currency revolving credit facility. The facility has a tenor of three years with an option to extend for one year. The purpose of the new agreement was to refi-nance an existing facility which was due to expire in January 2017.
7Transcom Annual Report 2016
Administration report

REGIONAL OVERVIEW
As a global player with approximately 29,000 people in 20 countries across five continents, Transcom can provide service wherever our clients have customers. Our global delivery network with 52 sites across five continents is one of the most extensive in our industry. We deliver services from onshore, near shore as well as from offshore contact centers. Our wide geographic presence means that we can offer our clients flexibil-ity with regards to sourcing options and devise solutions that are well-adapted to clients’ needs. During 2016, Transcom’s global business was managed within four segments.
Revenues by region Number of employees
North Europe, 32 % North Europe, 16 %
Continental Europe, 40 %
English-speaking markets & APAC, 40 %
Latin America, 4 % Latin America, 2 %
English-speaking markets & APAC, 24 %
Continental Europe, 42 %
8 Transcom Annual Report 2016
Administration report
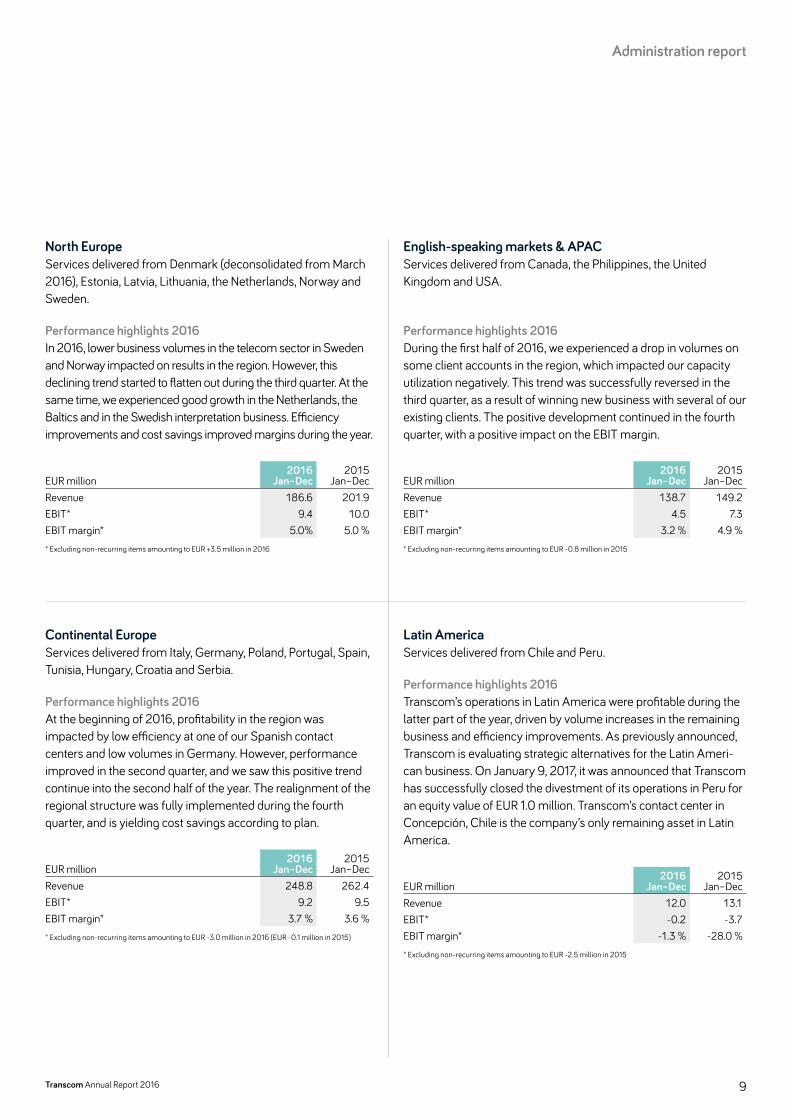
Latin AmericaServices delivered from Chile and Peru.
Performance highlights 2016 Transcom’s operations in Latin America were profitable during the latter part of the year, driven by volume increases in the remaining business and efficiency improvements. As previously announced, Transcom is evaluating strategic alternatives for the Latin Ameri-can business. On January 9, 2017, it was announced that Transcom has successfully closed the divestment of its operations in Peru for an equity value of EUR 1.0 million. Transcom’s contact center in Concepción, Chile is the company’s only remaining asset in Latin America.
EUR million2016
Jan–Dec2015
Jan–DecRevenue 12.0 13.1EBIT* -0.2 -3.7EBIT margin* -1.3 % -28.0 %* Excluding non-recurring items amounting to EUR -2.5 million in 2015
English-speaking markets & APACServices delivered from Canada, the Philippines, the United Kingdom and USA.
Performance highlights 2016During the first half of 2016, we experienced a drop in volumes on some client accounts in the region, which impacted our capacity utilization negatively. This trend was successfully reversed in the third quarter, as a result of winning new business with several of our existing clients. The positive development continued in the fourth quarter, with a positive impact on the EBIT margin.
EUR million2016
Jan–Dec2015
Jan–DecRevenue 138.7 149.2EBIT* 4.5 7.3EBIT margin* 3.2 % 4.9 %* Excluding non-recurring items amounting to EUR -0.8 million in 2015
Continental EuropeServices delivered from Italy, Germany, Poland, Portugal, Spain, Tunisia, Hungary, Croatia and Serbia.
Performance highlights 2016At the beginning of 2016, profitability in the region was impacted by low efficiency at one of our Spanish contact centers and low volumes in Germany. However, performance improved in the second quarter, and we saw this positive trend continue into the second half of the year. The realignment of the regional structure was fully implemented during the fourth quarter, and is yielding cost savings according to plan.
EUR million2016
Jan–Dec2015
Jan–DecRevenue 248.8 262.4EBIT* 9.2 9.5EBIT margin* 3.7 % 3.6 %* Excluding non-recurring items amounting to EUR -3.0 million in 2016 (EUR -0.1 million in 2015)
North EuropeServices delivered from Denmark (deconsolidated from March 2016), Estonia, Latvia, Lithuania, the Netherlands, Norway and Sweden.
Performance highlights 2016In 2016, lower business volumes in the telecom sector in Sweden and Norway impacted on results in the region. However, this declining trend started to flatten out during the third quarter. At the same time, we experienced good growth in the Netherlands, the Baltics and in the Swedish interpretation business. Efficiency improvements and cost savings improved margins during the year.
EUR million2016
Jan–Dec2015
Jan–DecRevenue 186.6 201.9EBIT* 9.4 10.0EBIT margin* 5.0% 5.0 %* Excluding non-recurring items amounting to EUR +3.5 million in 2016
9Transcom Annual Report 2016
Administration report
RESEARCH & DEVELOPMENT Transcom, being a service company, does not carry out any research activities as defined in IAS 38 Intangible assets. Develop-ment activities mainly consist of the development of IT solutions. The Company’s service offering and solutions are continuously developed and refined in order to ensure that Transcom has the right capabilities to keep up with the rapid pace of change in its industry, bringing new and innovative service solutions to market quickly.
PARENT COMPANY Transcom Group’s Parent Company, Transcom WorldWide AB (publ), does not perform CRM services, but is responsible for cor-porate management and administrative services to other Group companies as well as holding company functions. The Parent Company is also the counterparty to a limited number of client contracts. On the closing date, the Company was listed on the Nas-daq Stockholm exchange under the ticker symbol TWW. Transcom WorldWide AB (publ) is a registered company domiciled in Stock-holm, Sweden. The address of the Company’s headquarter is Gjörwellsgatan 30, SE-112 60 Stockholm.
Gross profit was roughly flat compared to 2015. The equity ratio improved to 52 percent (42 percent in 2015) mainly due to a net capital gain of EUR 86.1 million (3.2) as a result of internal reorgan-izations of the legal structure. In 2016, the Parent Company received dividends from Group companies amounting to EUR 46.9 million (66.3) and EUR 4.8 million (8.8) in Group contribution. Impairments of Investment in Group companies, mainly in connec-tion with capital injections to the same Group companies, amounted to EUR 77.1 million (0.1).
Transcom has one foreign branch, in Switzerland. The Swiss branch carried out no operations during the year, and will be dis-continued.
PUBLIC CASH OFFER TO THE SHAREHOLDERS OF TRANSCOM On December 21, 2016, Altor AB announced a public cash offer to the shareholders of Transcom, offering SEK 87.50 in cash per share, corresponding to a total value for all outstanding shares in Transcom of SEK 2,294 million. Transcom’s independent Bid Committee unanimously recommended that the shareholders of Transcom accept the offer.
SIGNIFICANT EVENTS AFTER THE REPORTING PERIOD On January 9, 2017, Transcom announced the successful closing of the divestment of its operations in Peru for an equity value of EUR 1.0 million to BPO Consulting S.A.C.
On 13 March 2017, Altor AB announced that they will complete the public takeover offer to the shareholders of Transcom World-Wide AB (publ). After completion of the offer, Altor holds more than 90 percent of the shares and votes in Transcom and has notified Transcom’s board of directors that Altor has resolved to call for compulsory redemption of the remaining shares in the Company. In light of the above, Transcom’s board of directors no longer finds it motivated for the Company to remain listed and has therefore applied for delisting of the Company’s shares from Nasdaq Stock-holm. Nasdaq Stockholm has approved the application and resolved that the last day of trading in the Transcom share will be Monday 10 April, 2017.
The change in ownership has triggered a change of control clause in the Company’s long-term incentive programs (LTIP 2014, 2015 and 2016), and Transcom’s board of directors has therefore, in accordance with the terms of the programs, resolved to replace the estimated number of shares to be vested by a cash payment to the participants amounting to approximately EUR 1.3 million in total. In addition, the Swap agreement connected to LTIP 2015 was terminated.
Given the change of ownership of the Company, the Company terminated its credit facility and has together with Altor AB signed a new credit facility with another bank.
OUTLOOK Transcom has a solid foundation from which to take the next steps in its development. The Company’s objective is to increase revenue organically, while continuing to improve operational efficiency in order to strengthen margins. As disclosed on February 5, 2015, Transcom has adopted a set of mid-term financial targets: organic revenue growth of at least 5 percent per year, an EBIT margin of at least 5 percent, and a net debt/EBITDA ratio of maximum 1.0.
RISKS AND UNCERTAINTIES There are a number of risk factors that may affect Transcom’s operations which, to varying degrees, have an impact on Transcom’s revenue, operations, profitability and financial position. These risks are monitored and to the extent possible, managed by Transcom. The Group’s risk management and control framework is designed to support the identification, assessment, monitoring,
10 Transcom Annual Report 2016
Administration report

management and control of risks that are significant to the achievement of the Group’s business objectives and to provide reli-able financial information. Transcom’s approach to enterprise risk management, as well as a more comprehensive depiction of risk factors, is described in the Corporate Governance report on pages 66–67. Key risks specific to Transcom’s operations are: • The risk of overcapacity situations in the case of volume reduc-
tions or termination of client contracts. • The risk of significant volume reduction in relation to key clients,
since a significant portion of Transcom’s revenue is generated from a limited number of clients. Furthermore, since Transcom is highly dependent on the Communications and Financial services industries, any future prolonged downturn in these industry verticals may lead to volume reductions.
• The risk of failure to achieve the desired flexibility in staffing in each local market. Transcom is also exposed to the risk of adverse movements in labor costs, legislation or other conditions related to staffing.
• The risks of Transcom’s clients terminating contracts before their scheduled expiration dates, or reduce business volumes, since some of these contracts do not require any termination fees or the possibility by Transcom to invoice any costs to recover client-spe-cific investments. In addition, many client contracts have perfor-mance-related bonus and/or penalty provisions which are driven by Transcom’s performance vis-à-vis agreed-upon performance metrics. In the event that Transcom is unable to deliver on the agreed-upon performance metrics, the Group could face penalties.
• The risk of high staff attrition in some of Transcom’s markets or the inability to attract and retain personnel, since Transcom’s long-term success largely depends on the ability to attract and develop the right people.
• The risk of disruption in technological infrastructure due to host of reasons including natural disaster, lapses from vendors, oper-ating malfunction, lapses in change management procedures, cyber attacks, sabotage, etc. Furthermore, continuity in Transcom’s operations may be affected by natural events, wars, terrorist attacks, other civil disturbances, epidemics, technical failures, etc.
• The risk of adverse foreign exchange movements, involving transaction exposure where Transcom invoices clients in one currency and incurs costs in another currency. Transcom is also exposed to translation exposure due to conversion of assets, liabilities, revenues and costs denominated in non-reporting currencies, into Transcom’s reporting currency, which is the Euro.
The main risks arising from the Group’s financial instruments are liquidity risk, credit/counterparty risk, foreign currency risk, and interest rate risk. The Board of Directors reviews and agrees policies for managing each of these risks. Further information on financial risks is summarized in note 25.
PERSONNEL AND SUSTAINABILITY At the end of 2016, Transcom had approximately 29,000 special-ists in 20 countries. Every year, Transcom hires thousands of new people on whom its business results depend. An engaged, skilled and motivated workforce is key to meeting the Company’s ambi-tious goals. In a people-intensive business like Transcom’s, where long-term success largely depends on the ability to attract and develop the right people, it makes sense to focus our sustainability efforts on people as well. This is reflected in Transcom Cares, the Company’s overarching sustainability governance program, which is focused on people development, equality & diversity, and com-munity engagement.
In order to ensure that Transcom is successful in finding the right people, the Company has a clear goal of becoming an employer of choice in its industry. Besides offering a stimulating working experience, competitive compensation and robust train-ing, the opportunity for career development is one of the key fac-tors that attracts new talents to the Company.
There is a multitude of opportunities for employees to develop and grow at Transcom, which is reflected in the Company’s clearly defined career progression, either as a line manager or specialist. Over 90 percent of our Team Leaders are internally recruited, and almost three out of four Business Managers. When recruiting externally, many candidates come to us through referrals from employees. At the same time, Transcom actively develops the company’s presence on various social networks in order to enhance the company’s employer brand and attract highly skilled candidates. One key project in 2016 was to establish a global career page on LinkedIn.
Programs for continuously upgrading our employees’ skills are an important part of people development at Transcom. Examples of training courses organized during 2016 include stress resist-ance, soft skill trainings, team leader development training, com-munication skills, COPC training, sales training, information secu-rity awareness, and project management.
11Transcom Annual Report 2016
Administration report
Environment Transcom strives to reduce the environmental impact of its opera-tions, with a particular focus on e-waste management, limiting business travel and decreasing energy consumption in its facilities.
There are training programs in place in the area, and the Group supports local initiatives with employees in order to encourage greater environmental responsibility in its workplaces. Our employ-ees are committed to minimizing the impact and to working together to contribute to a better environment. Our environmental policy, which includes respect for the precautionary principle, guides us in lowering emissions from air travel, supports us in selecting goods and services produced with respect for the nature and is a tool to push our environmental demands throughout our supply chain.
In 2016, electricity consumption in our facilities was essentially flat compared to 2015, while CO2 emissions from business travel decreased by 13 percent. CO2 emissions per employee were also slightly lower compared to 2015 (from 0.034 ton per employee to 0.031 ton).
Further information about Transcom’s activities in the area of people and sustainability is available at 2016.transcom.com.
CORPORATE GOVERNANCE Transcom’s Corporate Governance report is published on www.transcom.com, and is also included in this document on pages 59–73.
PROPOSED GUIDELINES ON REMUNERATION FOR SENIOR EXECUTIVES The board of directors proposes that the annual general meeting resolves to adopt guidelines for remuneration to senior executives in accordance with the following:
The remuneration to the senior executives shall consist of a well-balanced combination of fixed salary, variable cash remunera-tion and/or long term incentive programs, pension benefits and other benefits.
Performance targets for variable remuneration may be quanti-tative and/or qualitative and shall aim to fulfill Transcom’s long term strategy. Variable cash remuneration shall not exceed the fixed salary.
Pension benefits shall as far as possible be defined contribution. The managing director’s and the other senior executives’ notice period shall be a maximum 18 months. Fixed salary during notice periods and severance pay are together not to exceed an amount equivalent to the individual’s fixed salary for two years.
In special circumstances and in a certain case, the board of directors may deviate from these guidelines.
The total amount of remuneration granted directly or indirectly by Transcom to the senior executives is fully described in note 5.
THE TRANSCOM SHARE Transcom’s ordinary shares are listed on Nasdaq Stockholm under the ticker symbol TWW. The ISIN code is SE0006168316. Each share entitles the holder to one vote at general meetings of share-holders and each holder may vote for the entire number of shares owned or represented by him or her without any limitation of the voting rights.
As at December 31, 2016, Transcom’s issued capital amounts to EUR 56,083 thousand divided into a total of 26,322,212 ordi-nary shares with one voting right each and 594,372 class C shares, also with one voting right each. All class C shares are held as treasury shares by the Company. The total number of treasury shares amounts to 702,966 (594,372 class C shares and 108,594 ordinary shares).
During September 2016, Transcom issued and repurchased 210,000 class C shares for potential delivery to long-term incentive plan (LTIP) participants. During April 2016, Transcom converted 150,000 class C shares to ordinary shares to be used when vesting long-term incentive plans. 75,805 shares held by Transcom were used when the long-term incentive plan 2013 was vested during the second quarter 2016.
During 2015, 115,000 class C shares were converted to ordi-nary shares. In addition, 108 272 shares held by Transcom were used when the long-term incentive plan 2012 was vested.
As at December 31, 2016, there were two shareholders whose holdings exceeded ten percent of the voting capital: Altor AB (24.3 percent) and Creades AB (10.8 percent).
Further information on the Transcom share can be found in note 17 for the Group and note A17 for the Parent Company.
12 Transcom Annual Report 2016
Administration report
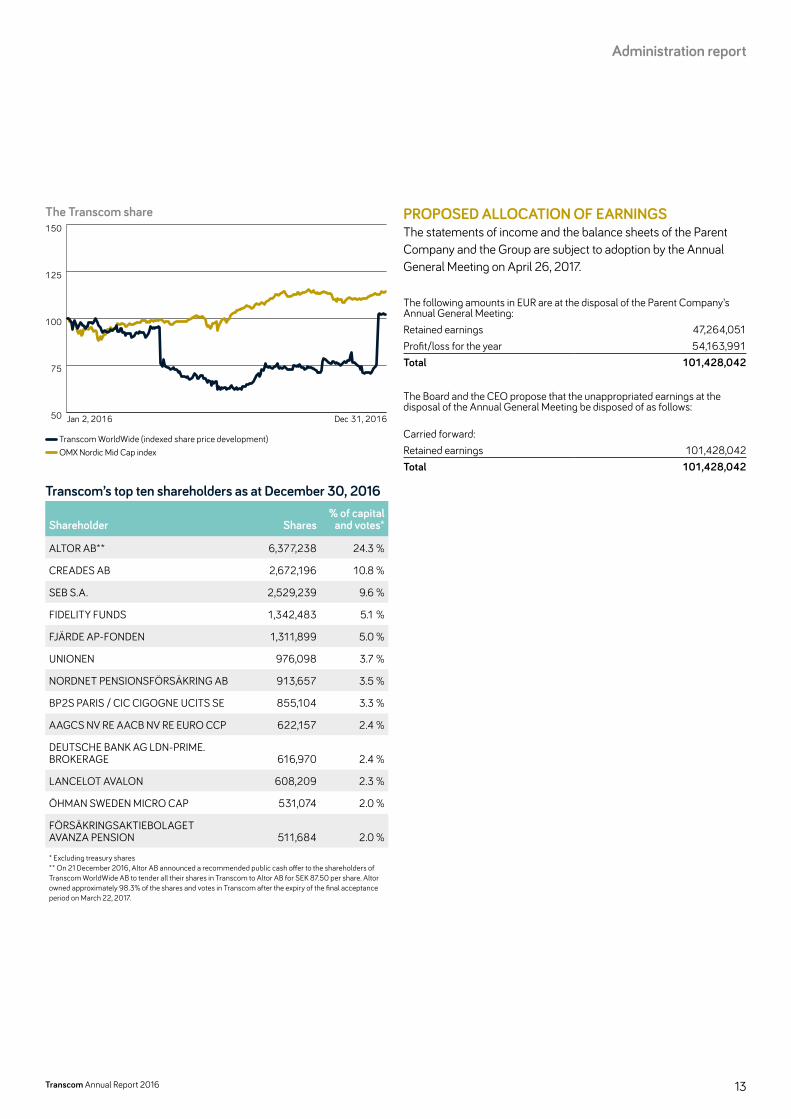
The Transcom share
50
75
100
125
150 OMX Nordic Mid Cap
Transcom
Jan 2, 2016 Dec 31, 2016
Transcom WorldWide (indexed share price development) OMX Nordic Mid Cap index
Transcom’s top ten shareholders as at December 30, 2016
Shareholder Shares% of capital
and votes*
ALTOR AB** 6,377,238 24.3 %
CREADES AB 2,672,196 10.8 %
SEB S.A. 2,529,239 9.6 %
FIDELITY FUNDS 1,342,483 5.1 %
FJÄRDE AP-FONDEN 1,311,899 5.0 %
UNIONEN 976,098 3.7 %
NORDNET PENSIONSFÖRSÄKRING AB 913,657 3.5 %
BP2S PARIS / CIC CIGOGNE UCITS SE 855,104 3.3 %
AAGCS NV RE AACB NV RE EURO CCP 622,157 2.4 %
DEUTSCHE BANK AG LDN-PRIME. BROKERAGE 616,970 2.4 %
LANCELOT AVALON 608,209 2.3 %
ÖHMAN SWEDEN MICRO CAP 531,074 2.0 %
FÖRSÄKRINGSAKTIEBOLAGET AVANZA PENSION 511,684 2.0 %
* Excluding treasury shares ** On 21 December 2016, Altor AB announced a recommended public cash offer to the shareholders of Transcom WorldWide AB to tender all their shares in Transcom to Altor AB for SEK 87.50 per share. Altor owned approximately 98.3% of the shares and votes in Transcom after the expiry of the final acceptance period on March 22, 2017.
PROPOSED ALLOCATION OF EARNINGSThe statements of income and the balance sheets of the Parent Company and the Group are subject to adoption by the Annual General Meeting on April 26, 2017.
The following amounts in EUR are at the disposal of the Parent Company’s Annual General Meeting:Retained earnings 47,264,051Profit/loss for the year 54,163,991Total 101,428,042 The Board and the CEO propose that the unappropriated earnings at the disposal of the Annual General Meeting be disposed of as follows:
Carried forward:Retained earnings 101,428,042Total 101,428,042
13Transcom Annual Report 2016
Administration report
Consolidated financial overview
2016 2015 2014 2013 2012
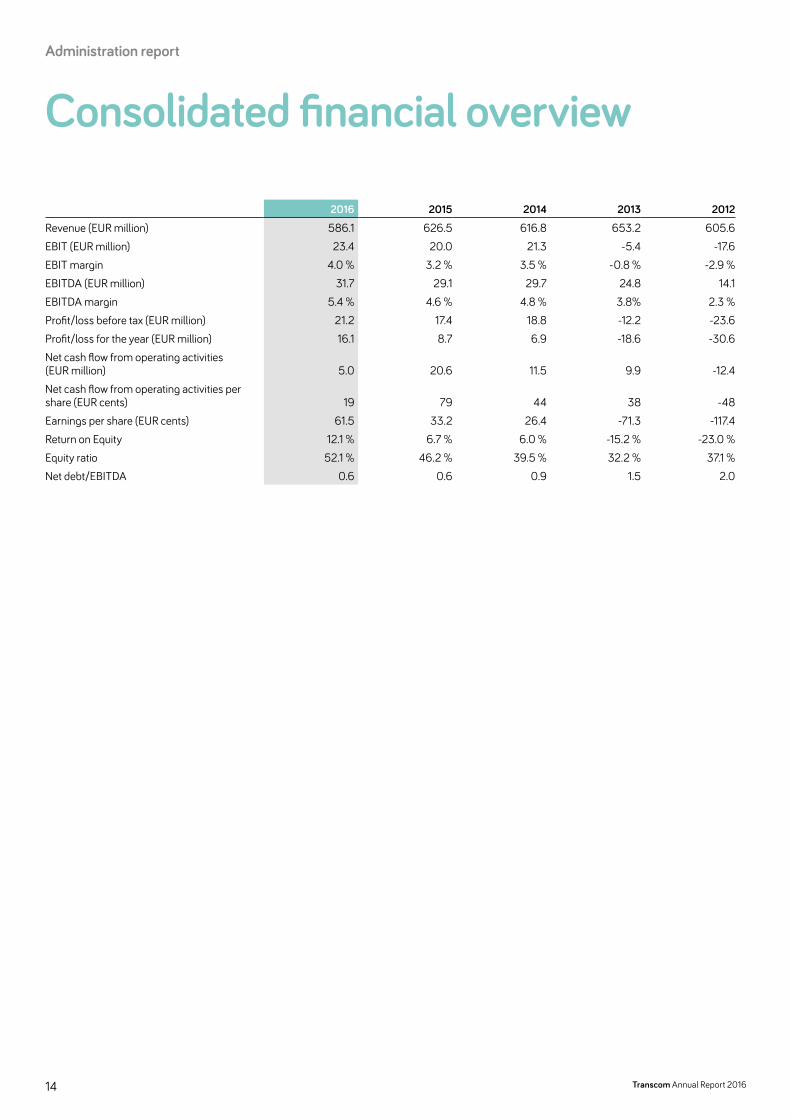
Revenue (EUR million) 586.1 626.5 616.8 653.2 605.6EBIT (EUR million) 23.4 20.0 21.3 -5.4 -17.6EBIT margin 4.0 % 3.2 % 3.5 % -0.8 % -2.9 %EBITDA (EUR million) 31.7 29.1 29.7 24.8 14.1EBITDA margin 5.4 % 4.6 % 4.8 % 3.8% 2.3 %Profit/loss before tax (EUR million) 21.2 17.4 18.8 -12.2 -23.6Profit/loss for the year (EUR million) 16.1 8.7 6.9 -18.6 -30.6Net cash flow from operating activities (EUR million) 5.0 20.6 11.5 9.9 -12.4Net cash flow from operating activities per share (EUR cents) 19 79 44 38 -48Earnings per share (EUR cents) 61.5 33.2 26.4 -71.3 -117.4Return on Equity 12.1 % 6.7 % 6.0 % -15.2 % -23.0 %Equity ratio 52.1 % 46.2 % 39.5 % 32.2 % 37.1 %Net debt/EBITDA 0.6 0.6 0.9 1.5 2.0
14 Transcom Annual Report 2016
Administration report
Consolidated income statementJanuary to December
EUR thousand Note 2016 2015
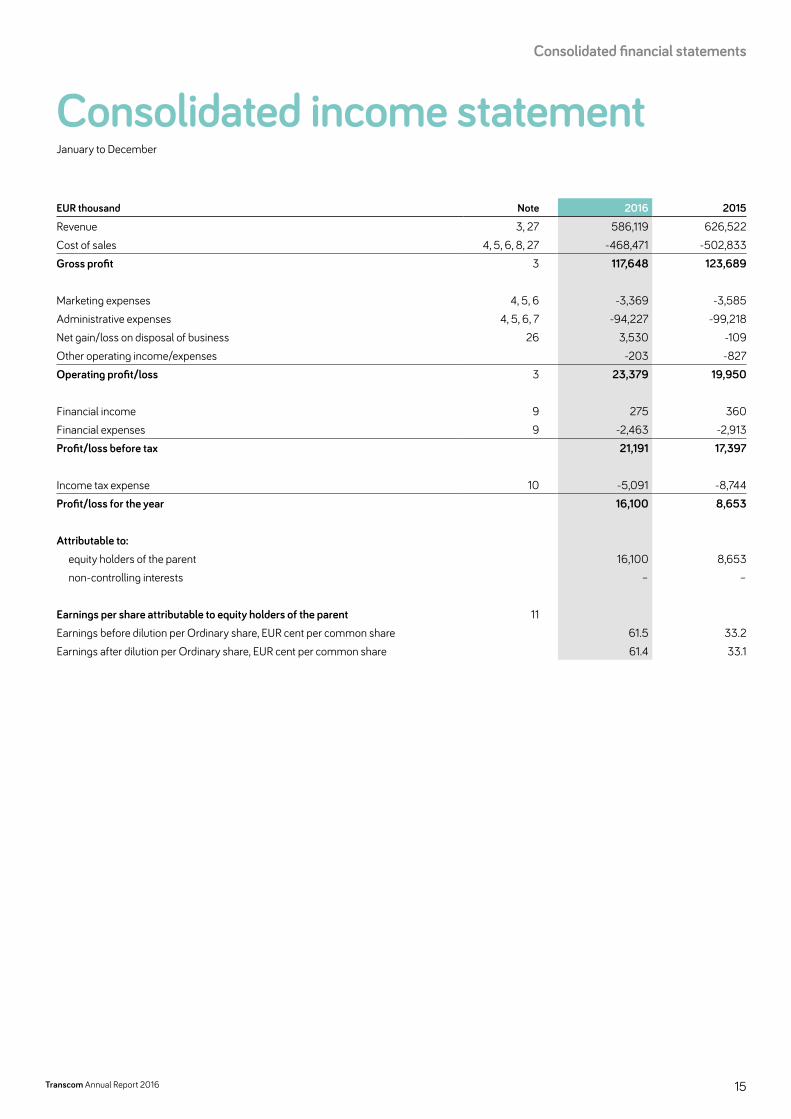
Revenue 3, 27 586,119 626,522Cost of sales 4, 5, 6, 8, 27 -468,471 -502,833Gross profit 3 117,648 123,689
Marketing expenses 4, 5, 6 -3,369 -3,585Administrative expenses 4, 5, 6, 7 -94,227 -99,218Net gain/loss on disposal of business 26 3,530 -109Other operating income/expenses -203 -827Operating profit/loss 3 23,379 19,950
Financial income 9 275 360Financial expenses 9 -2,463 -2,913Profit/loss before tax 21,191 17,397
Income tax expense 10 -5,091 -8,744Profit/loss for the year 16,100 8,653
Attributable to: equity holders of the parent 16,100 8,653 non-controlling interests – –
Earnings per share attributable to equity holders of the parent 11Earnings before dilution per Ordinary share, EUR cent per common share 61.5 33.2Earnings after dilution per Ordinary share, EUR cent per common share 61.4 33.1
15Transcom Annual Report 2016
Consolidated financial statements
Consolidated statement of comprehensive incomeJanuary to December
EUR thousand Note 2016 2015
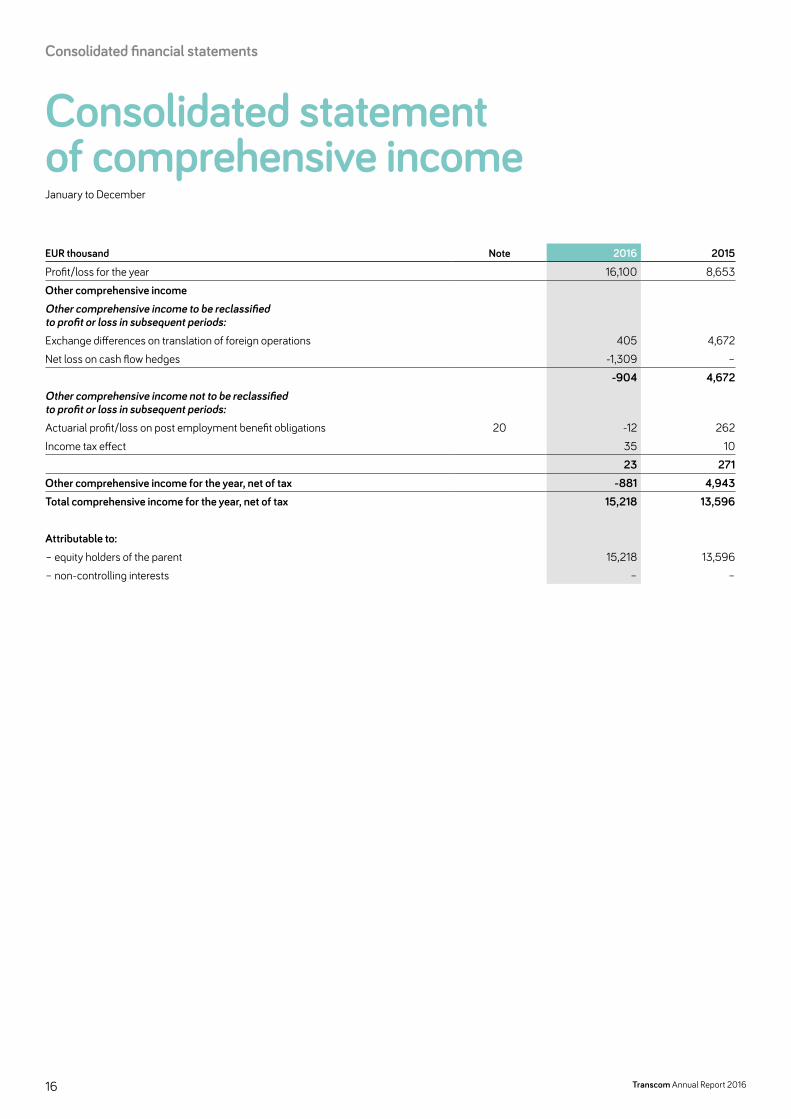
Profit/loss for the year 16,100 8,653Other comprehensive incomeOther comprehensive income to be reclassified to profit or loss in subsequent periods:Exchange differences on translation of foreign operations 405 4,672Net loss on cash flow hedges -1,309 –
-904 4,672Other comprehensive income not to be reclassified to profit or loss in subsequent periods:Actuarial profit/loss on post employment benefit obligations 20 -12 262Income tax effect 35 10
23 271Other comprehensive income for the year, net of tax -881 4,943Total comprehensive income for the year, net of tax 15,218 13,596
Attributable to:– equity holders of the parent 15,218 13,596– non-controlling interests – –
Consolidated financial statements
16 Transcom Annual Report 2016
Consolidated statementof financial positionas at December 31
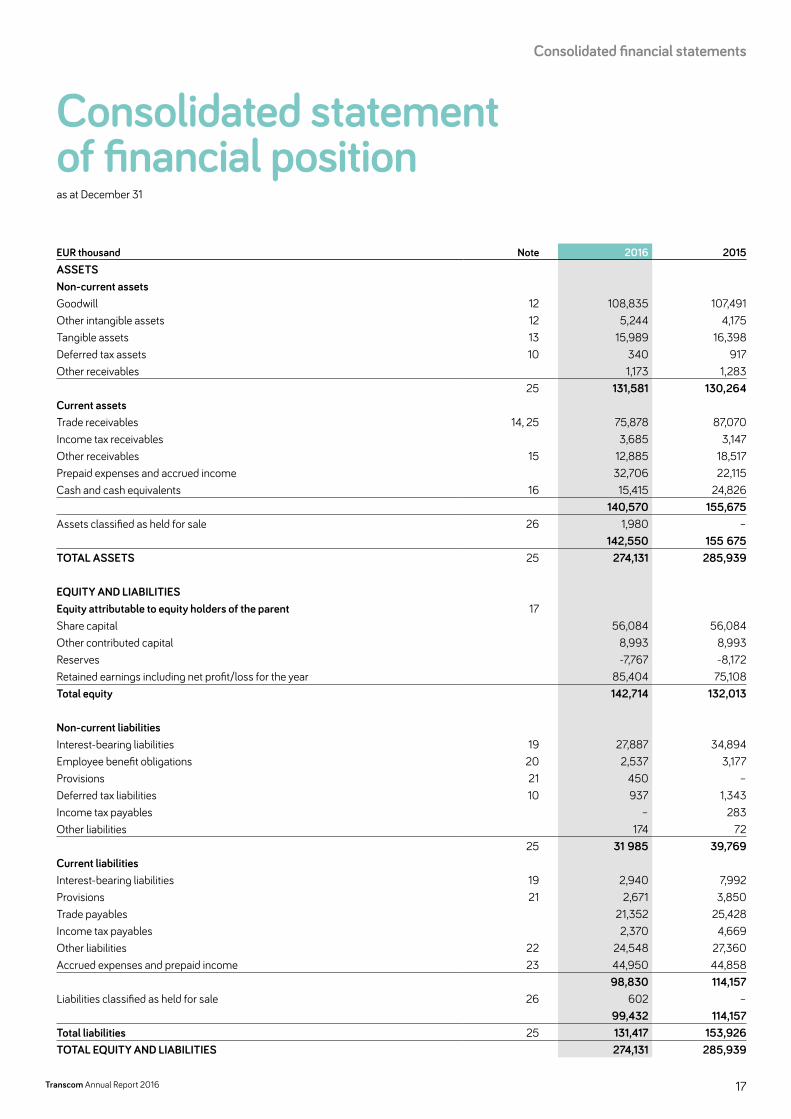
EUR thousand Note 2016 2015ASSETSNon-current assetsGoodwill 12 108,835 107,491Other intangible assets 12 5,244 4,175Tangible assets 13 15,989 16,398Deferred tax assets 10 340 917Other receivables 1,173 1,283
25 131,581 130,264Current assetsTrade receivables 14, 25 75,878 87,070Income tax receivables 3,685 3,147Other receivables 15 12,885 18,517Prepaid expenses and accrued income 32,706 22,115Cash and cash equivalents 16 15,415 24,826
140,570 155,675Assets classified as held for sale 26 1,980 –
142,550 155 675TOTAL ASSETS 25 274,131 285,939
EQUITY AND LIABILITIESEquity attributable to equity holders of the parent 17Share capital 56,084 56,084Other contributed capital 8,993 8,993Reserves -7,767 -8,172Retained earnings including net profit/loss for the year 85,404 75,108Total equity 142,714 132,013
Non-current liabilitiesInterest-bearing liabilities 19 27,887 34,894Employee benefit obligations 20 2,537 3,177Provisions 21 450 –Deferred tax liabilities 10 937 1,343Income tax payables – 283Other liabilities 174 72
25 31 985 39,769Current liabilitiesInterest-bearing liabilities 19 2,940 7,992Provisions 21 2,671 3,850Trade payables 21,352 25,428Income tax payables 2,370 4,669Other liabilities 22 24,548 27,360Accrued expenses and prepaid income 23 44,950 44,858
98,830 114,157Liabilities classified as held for sale 26 602 –
99,432 114,157Total liabilities 25 131,417 153,926TOTAL EQUITY AND LIABILITIES 274,131 285,939
17Transcom Annual Report 2016
Consolidated financial statements
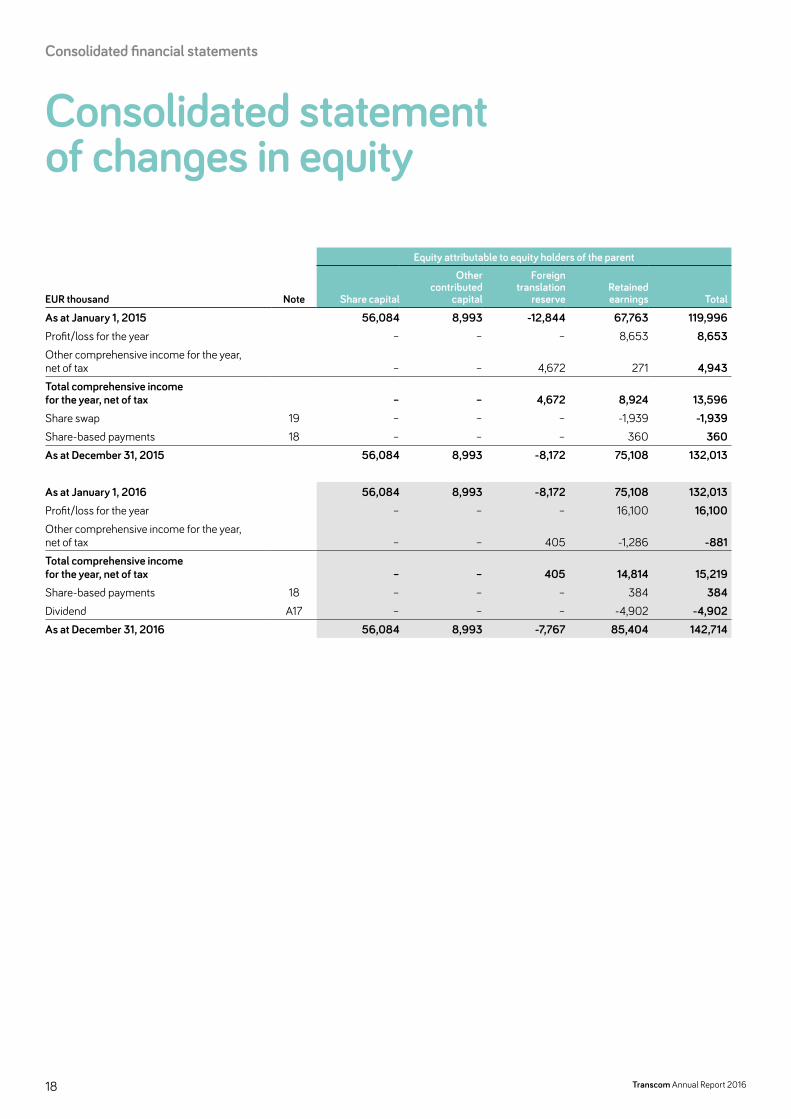
Consolidated statement of changes in equity
Equity attributable to equity holders of the parent
EUR thousand Note Share capital
Other contributed
capital
Foreign translation
reserveRetained earnings Total
As at January 1, 2015 56,084 8,993 -12,844 67,763 119,996Profit/loss for the year – – – 8,653 8,653Other comprehensive income for the year, net of tax – – 4,672 271 4,943Total comprehensive incomefor the year, net of tax – – 4,672 8,924 13,596Share swap 19 – – – -1,939 -1,939Share-based payments 18 – – – 360 360As at December 31, 2015 56,084 8,993 -8,172 75,108 132,013
As at January 1, 2016 56,084 8,993 -8,172 75,108 132,013Profit/loss for the year – – – 16,100 16,100Other comprehensive income for the year, net of tax – – 405 -1,286 -881Total comprehensive incomefor the year, net of tax – – 405 14,814 15,219Share-based payments 18 – – – 384 384Dividend A17 – – – -4,902 -4,902As at December 31, 2016 56,084 8,993 -7,767 85,404 142,714
Consolidated financial statements
18 Transcom Annual Report 2016
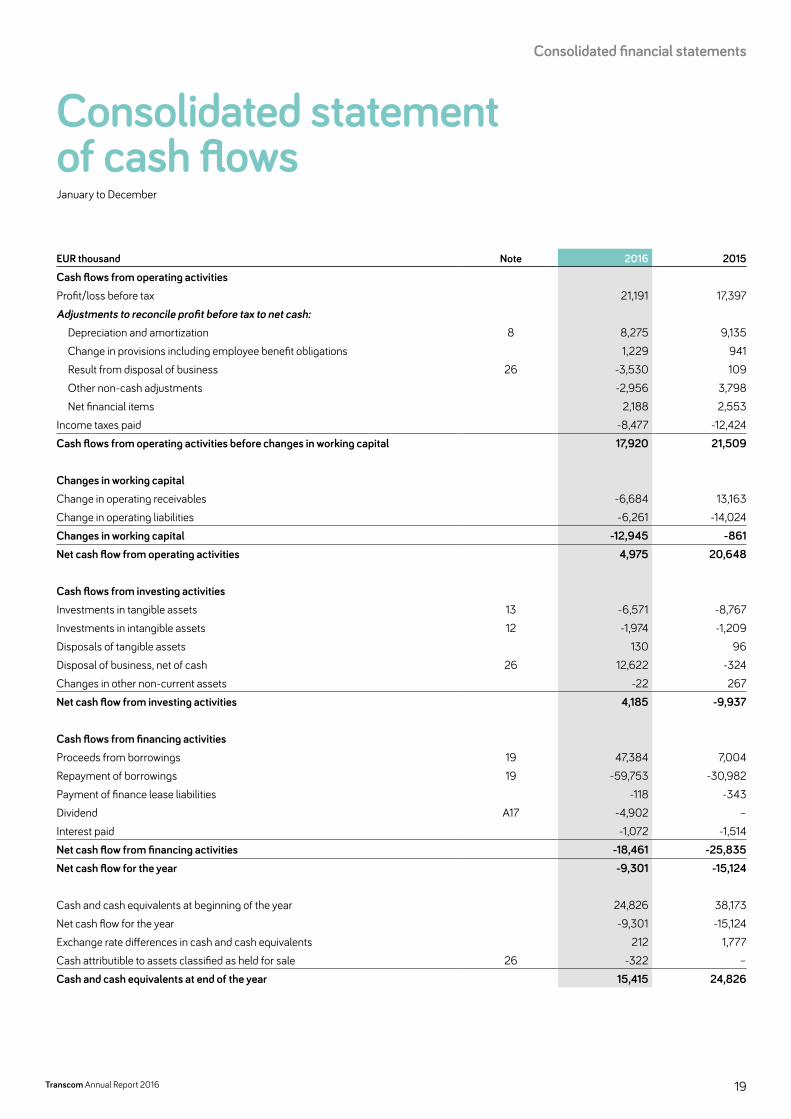
Consolidated statement of cash flowsJanuary to December
EUR thousand Note 2016 2015
Cash flows from operating activitiesProfit/loss before tax 21,191 17,397Adjustments to reconcile profit before tax to net cash:
Depreciation and amortization 8 8,275 9,135Change in provisions including employee benefit obligations 1,229 941Result from disposal of business 26 -3,530 109Other non-cash adjustments -2,956 3,798Net financial items 2,188 2,553
Income taxes paid -8,477 -12,424Cash flows from operating activities before changes in working capital 17,920 21,509
Changes in working capitalChange in operating receivables -6,684 13,163Change in operating liabilities -6,261 -14,024Changes in working capital -12,945 -861Net cash flow from operating activities 4,975 20,648
Cash flows from investing activitiesInvestments in tangible assets 13 -6,571 -8,767Investments in intangible assets 12 -1,974 -1,209Disposals of tangible assets 130 96Disposal of business, net of cash 26 12,622 -324Changes in other non-current assets -22 267Net cash flow from investing activities 4,185 -9,937
Cash flows from financing activitiesProceeds from borrowings 19 47,384 7,004Repayment of borrowings 19 -59,753 -30,982Payment of finance lease liabilities -118 -343Dividend A17 -4,902 –Interest paid -1,072 -1,514Net cash flow from financing activities -18,461 -25,835Net cash flow for the year -9,301 -15,124
Cash and cash equivalents at beginning of the year 24,826 38,173Net cash flow for the year -9,301 -15,124Exchange rate differences in cash and cash equivalents 212 1,777Cash attributible to assets classified as held for sale 26 -322 –Cash and cash equivalents at end of the year 15,415 24,826
19Transcom Annual Report 2016
Consolidated financial statements

Notes to the consolidated financial statements Note 1 Summary of significant accounting and
valuation policies1.1 General Transcom Worldwide AB (publ) (the “Company” or the “Parent Company”) and its Group companies (together, “Transcom” or the “Group”) is a global customer experi-ence specialist, providing customer care, sales, technical support and credit manage-ment services through our extensive network of contact centers and work-at-home agents. We are 29,000 customer experience specialists at 52 contact centers across 20 countries, delivering services in 33 languages to international brands in various industry verticals. Transcom WorldWide AB’s share is listed on the Nasdaq Stock-holm Exchange under the ticker symbol TWW.
The Company is a registered company domiciled in Stockholm, Sweden. The address of the Company’s headquarter is Gjörwellsgatan 30, SE-112 60 Stockholm.
The consolidated financial statements were authorized for issue by the Board of Directors on April 5, 2017. These consolidated financial statements will be submitted for approval at the Annual General Meeting on April 26, 2017.
1.2 Basis of preparationThe consolidated financial statements of Transcom WorldWide AB (publ) have been prepared in accordance with International Financial Reporting Standards (IFRS) as adopted by the European Union. The consolidated financial statements pertain to January 1–December 31 for income statement items and December 31 for balance sheet items.
The preparation of financial statements in conformity with IFRS requires the use of certain critical accounting estimates. It also requires management to exercise its judg-ment in the process of applying the Group’s accounting policies. The areas involving a higher degree of judgment or complexity, or areas where assumptions and estimates are significant to the consolidated financial statements are disclosed in note 2.
1.2.1 Changes in accounting policies and disclosuresNew and amended standards that are effective for the first time for the financial year 2016 and adopted by the Group. • Amendments to IAS 16 and IAS 38 Clarification of Acceptable Methods of Depreci-
ation and Amortization. The amendments clarify the principle in IAS 16 Property, Plant and Equipment and IAS 38 Intangible Assets that revenue reflects a pattern of economic benefits that are generated from operating a business rather than the economic benefits that are consumed through use of the asset. The amendments to the standard have not had any material impact on the Group’s reporting.
• Amendments to IAS 1 Disclosure Initiative – The amendments clarify existing IAS 1 requirements. The amendments to the standard have not had any material impact on the Group’s reporting.
• In the 2012–2014 annual improvements cycle the IASB issued four amendments to four standards in which includes IFRS 5 Non-Current Assets Held for Sale and Discounted Operations; IFRS 7 Financial Instruments Disclosures; IAS 19 Employee Benefits and IAS 34 Interim Financial Reporting. The amendments to the standard has not had any material impact on the Group’s reporting.
Other new and amended standards effective for the first year are considered to not have an effect on the Group.
Standards in issue but not yet effective, up to date of issuance of the Group’s financial statements, are disclosed below. The Group intends to adopt these standards, if applicable, when they become effective. • IFRS 9 Financial Instruments replace IAS 39 Financial Instruments: Recognition
and Measurement and all previous versions of IFRS. IFRS 9 brings together all three aspects of the accounting for financial instruments project: classification and meas-urement, impairment and hedge accounting. The standard is effective on or after 1 January 2018. The Group plan to adopt the new standard on the required effective date. A high-level impact assessment shows that no significant impact on the Group’s balance sheet and equity is expected except; Loans and trade receivables are expected to still be measured at amortized cost under IFRS 9. Credit losses in the Group has historically been very low and are expected to be continued at a low level why a preliminary assessment give no expectations that this could have a material impact on the Group’s equity. The Group’s hedge relationship is expected to still qualify for hedge accounting under IFRS 9. The preliminary assessment may
be subject to changes when more detailed analysis is performed, and the Group will quantify the effect for the Group’s financial statement year 2017.
• IFRS 15 Revenue from Contracts with Customers outlines the principles to measure and recognize revenue. The standard is effective from 1 January 2018, either with a full retrospective application or a modified retrospective application. The Group plan to adopt the new standard on the required effective date. During the year, the Group has performed a preliminary assessment by performing a high-level review of a few of the largest contracts with Clients. The preliminary assessment shows that the contractual term are normally 1-3 years, however the contractual period according to IFRS 15 might be shorter and correspond to the period covered in the specific volume request from the respective Client, which is stipulated in each con-tract and is normally a shorter period, e.g. between 1-6 months. The preliminary assessment shows no material impact is expected regarding revenue recognition but instead more disclosures and more detailed information in existing disclosures in the Group’s financial statements will be required. The preliminary assessment is performed on a high-level and based on currently available information and there-for may be subject to changes. During 2017, the Group will continue to quantify the effect for the Group’s financial statements.
• IFRS 16 Leases sets out the principles for the recognition, measurement, presenta-tion and disclosure of leases and requires lessees to account for all leases under a single on-balance sheet model similar to the accounting for finance leases under IAS 17. The standard includes two recognition exemptions for lessees – leases of “low-value” assets (e.g. personal computers) and short-term leases (i.e., leases with a lease term of 12 months or less). A lessee will recognize a liability to make lease payments and an asset representing the right to use the underlying asset during the lease term. Lessees will be required to separately recognize the interest expense on the lease liability and the depreciation expense on the right-of-use asset. The stand-ard will require more extensive disclosures than under IAS 17. The standard is effec-tive from 1 January 2019 and the Group expect the new standard to have an impact both on the Group’s balance sheet and disclosures in the Group’s financial state-ments. The Group will quantify the effect before the effective date.
• Amendments to IAS 7, IAS 7 Disclosure Initiative. The amendments to IAS 7 State-ment of Cash Flows require an entity to provide disclosures that enable users of financial statements to evaluate changes in liabilities arising from financing activi-ties, including both changes arising from cash flows and non-cash changes. These amendments are effective for annual periods beginning on 1 January 2017 and will result in additional disclosure provided by the Group.
• Amendments to IAS 12, IAS 12 Recognition of Deferred Tax Assets for Unrealized Losses clarifies that an entity needs to consider whether tax law restricts the sources of taxable profits against which it may make deductions on the reversal of that deductible temporary difference. Furthermore, the amendments provide guid-ance on how an entity should determine future taxable profits and explain the cir-cumstances in which taxable profit may include the recovery of some assets for more than their carrying amount. These amendments are effective for annual peri-ods beginning on or after 1 January 2017 and is not expected to have any material impact on the Group’s financial statements.
• Amendments to IFRS 2 Classification and Measurement of Share-based Payment Transactions address the effects of vesting conditions on the measurement of a cash-settled share-based payment transaction, the classification of a share-based payment transaction with net settlement features for withholding tax obligations and accounting where a modification to the terms and conditions of a share-based payment transaction changes its classification from cash settled to equity settled. The amendments are effective for annual periods beginning on or after 1 January 2018 and the Group will quantify the effect but it is not expected to have a material impact on the Group’s financial statements.
Other standards in issue but not yet effective are considered not material for the Group.
1.3 ConsolidationThe consolidated financial statements include the Group companies of which the Group has control. Control is achieved when the Group is exposed, or has rights, to variable returns from its involvement with the investee and has the ability to affect those returns through its power over the investee. There is a presumption that a majority of voting rights result in control. Group companies are fully consolidated from the date on which control is transferred to the Group. They are deconsolidated from the date that control ceases.
Notes to the Consolidated financial statements
20 Transcom Annual Report 2016
The consolidated accounts are prepared according to the acquisition method, which entails acquisitions of subsidiaries being viewed as transactions through which the Group indirectly acquires the subsidiary’s assets and assumes its liabilities and contingent liabilities. The Group’s equity therefore includes only the portion of the subsidiary’s equity added since acquisition. The Group’s cost is determined through an acquisition analysis in connection with the acquisition. This analysis determines, in part, the cost of the holdings or operations and, in part, the fair value of the identifi-able assets, liabilities and contingent liabilities assumed on the date of acquisition. The cost of the subsidiary’s shares or operations consists of the fair value of the com-pensation on the transfer date. The cost includes conditional purchase considerations recognized as liabilities at fair value per the acquisition date.
In acquisitions where there is a positive difference between the cost of the acqui-sition and the net value of acquired assets and assumed liabilities and contingent lia-bilities, the difference is reported as goodwill. When the difference is negative, it is recognized in the Income statement.
Intra-Group receivables and liabilities, revenue and expenses, and unrealized gains and losses that arise from transactions between Group companies are elimi-nated in the consolidated accounts.
1.4 Foreign currency translationItems included in the financial statements of each of the Group’s entities are meas-ured using the currency of the primary economic environment in which the entity operates (‘the functional currency’). The consolidated financial statements are pre-sented in ‘EUR (EUR)’, which is the Group’s presentation currency.
Foreign currency transactions are translated into the functional currency using the exchange rates prevailing at the dates of the transactions or valuation where items are re-measured. Foreign exchange gains and losses resulting from the settle-ment of such transactions and from the translation at year-end exchange rates of monetary assets and liabilities denominated in foreign currencies are recognized in the income statement.
The results and financial position of all the Group companies (none of which has the currency of a hyper-inflationary economy) that have a functional currency differ-ent from the Group’s presentation currency are translated as follows: • assets and liabilities for each statement of financial position presented are trans-
lated at the closing rate at the date of that statement of financial position;• income and expenses for each income statement are translated at average
exchange rates; and• all resulting exchange differences are recognized in other comprehensive income.
On consolidation, exchange differences arising from the translation of the net invest-ment in foreign operations, and of borrowings and other currency instruments desig-nated as hedges of such investments, are recognized directly in other comprehensive income. When a foreign operation is partially disposed of or sold, exchange differ-ences that were recorded in Other comprehensive income are recycled in Other comprehensive income and further recognized in the income statement as part of the gain or loss on sale.
Goodwill and fair value adjustments arising on the acquisition of a foreign entity are treated as assets and liabilities of the foreign entity and translated at the closing rate. Exchange differences arising are recognized directly in other comprehensive income as the year’s change in the foreign translation reserve.
1.5 Property, plant and equipmentAll property, plant and equipment are stated at historical cost less depreciation. Histor-ical cost includes expenditure that is directly attributable to the acquisition of the items.
Subsequent costs are included in the asset’s carrying amount or recognized as a separate asset, as appropriate, only when it is probable that future economic benefits associated with the item will flow to the Group and the cost of the item can be meas-ured reliably. Repairs and maintenance are charged to the income statement during the financial period in which they are incurred.
Depreciation on assets is calculated using the straight-line method to allocate their cost less their residual values over their estimated useful lives, as follows: • Telephone switch 5 years• Fixtures and fittings 3–5 years• Computer, hardware and software 3–7 years• Office improvements and others 3–5 years
The assets’ residual values and useful lives are reviewed, and adjusted if appropriate, at the end of each reporting period. An asset’s carrying amount is written down immediately to its recoverable amount if the asset’s carrying amount is greater than its estimated recoverable amount.
1.6 Intangible assets(a) GoodwillGoodwill represents the excess of the cost of an acquisition over the fair value of the Group’s share of the net identifiable assets of the acquired subsidiary at the date of acquisition. Goodwill on acquisitions of Group companies is included in ‘intangible assets’. Goodwill is carried at cost less accumulated impairment losses. Gains and losses on the disposals of an entity include the carrying amount of goodwill relating to the entity sold.
(b) Customer relationships Contractual customer relationships acquired in a business combination are recog-nized at fair value at the acquisition date. The contractual customer relations have a finite useful life and are carried at cost less accumulated amortization and are assessed for impairment whenever there is an indication that the asset is impaired. Amortization is calculated using the straight-line method over the expected life of the customer relationship which is between 7 to 15 years.
(c) Development costsCosts associated with maintaining computer software programs are recognized as an expense as incurred. Development costs that are directly attributable to the design and testing of identifiable and unique software products controlled by the Group are recognized as intangible assets when the following criteria are met:• it is technically feasible to complete the software product so that it will be available
for use;• management intends to complete the software product and use or sell it;• there is an ability to use or sell the software product;• it can be demonstrated how the software product will generate probable future
economic benefits;• adequate technical, financial and other resources to complete the development and
to use or sell the software product are available; and• the expenditure attributable to the software product during its development can be
reliably measured.
Directly attributable costs that are capitalized as part of the software product, include the software development employee costs and an appropriate portion of relevant overheads.
Other development expenditures that do not meet these criteria are recognized as an expense as incurred. Development costs previously recognized as an expense are not recognized as an asset in a subsequent period.
Computer software development costs recognized as assets are amortized over their estimated useful lives, which is between 3 to 5 years.
1.7 Impairment of non-financial assetsAssets that have an indefinite useful life – for example, goodwill or intangible assets not ready to use – are not subject to amortization and are tested annually for impair-ment, or if events or circumstances change which may Indicate that there may be need for impairment. Assets that are subject to amortization are reviewed for impair-ment whenever events or changes in circumstances indicate that the carrying amount may not be recoverable. The recoverable amount is the higher of an asset’s fair value less costs to sell and value in use.
For the purposes of assessing impairment, assets are grouped at the lowest lev-els for which there are separately identifiable cash flows (cash-generating units). Transcom’s operations in each segmental region are considered the Group’s cash-generating units in this regard. Non- financial assets other than goodwill that suffered an impairment are reviewed for possible reversal of the impairment at each reporting date. An impairment loss is recognized for the amount by which an asset’s or cash-generating unit’s carrying amount exceeds its recoverable amount.
Impairment losses are recognized in the income statement. Impairment losses attributable to a cash-generating unit are mainly allocated to goodwill after which they are divided proportionately among other assets in the unit. The recoverable amount of cash-generating units is the higher of their fair value less costs to sell and value in use. Value in use is measured by discounting future cash flows using a dis-
21
Notes to the Consolidated financial statements
Transcom Annual Report 2016
counting factor that takes into account the risk-free rate of interest and the risk asso-ciated with the specific asset.
Impairment of goodwill is not reversed. Impairment of other assets is reversed if a change has been made in the assumptions that served as the basis for determining the recoverable amount. Impairment is reversed only to the extent the carrying value of the assets following the reversal does not exceed the carrying value that the asset would have had if the impairment had not been recognized.
1.8 Financial assets and liabilitiesA financial instrument is defined as any form of agreement giving rise to a financial asset in a company and a financial liability or equity instrument in a counterparty. Financial instruments recognized in the balance sheet include, on the asset side, cash and bank balances, accounts receivable and other equity instruments, loans receiva-ble. Included among liabilities and equity are accounts payable, debt and equity instruments in issue and loan liabilities.
Financial instruments are recognized at amortized cost including transaction expenses. An exception is made for financial instruments in the category financial assets or liabilities recognized at fair value through profit and loss, that are recognized at fair value excluding transaction costs. Measurement depends on how they are classified, as indicated below.
A financial asset or financial liability is recognized in the balance sheet when the Company becomes party to the instrument’s contractual terms. Receivables are rec-ognized when the Company has performed and there is a contractual obligation on the counterparty to pay. Trade receivable are recognized in the balance sheet when an invoice has been sent. Liabilities are recognized when the counterparty has per-formed and there is a contractual obligation to pay, even if an invoice has not yet been received. Trade payables are recognized when an invoice is received.
A financial asset is removed from the balance sheet when the rights in the agree-ment are realized, expire or the Company loses control over them. A financial liability is removed from the balance sheet when the obligation in the agreement has been discharged or otherwise extinguished.
Financial assets and liabilities are offset and the net amount reported in the state-ment of financial position when there is a legally enforceable right to offset the recog-nized amounts and there is an intention to settle on a net basis.
1.9 Non-current receivables and other receivables These receivables fall into the category Loans and receivables and are assessed at their discounted current value if their expected maturity exceeds 12 months. If their maturities are shorter, they are assessed at accrued cost.
1.10 Trade receivables Trade receivables are classified in the category loans and receivables. Trade receiva-bles are amounts due from customers for services performed in the ordinary course of business. If collection is expected in one year or less (or in the normal operating cycle of the business if longer), they are classified as current assets. If not, they are presented as non-current assets.
Trade receivables are recognized initially at fair value and subsequently measured at amortized cost using the effective interest method, less provision for impairment. The anticipated receivable is short, so they are carried at accrued cost without dis-counting.
Impairment are determined individually. Impairment needs are addressed when receivables have fallen overdue for payment by a certain number of days, or if Transcom becomes aware that the counterparty has become insolvent. Provisions for impaired receivables are recognized as administrative expenses in the Consolidated Income Statement.
1.11 Cash and cash equivalents Cash and cash equivalents includes cash and cash equivalents and immediately available balances with banks and similar institutions as well as other short-term liq-uid investments with original maturities of three months or less. In the consolidated statement of financial position, bank overdrafts are shown within interest-bearing liabilities in current liabilities.
1.12 Interest-bearing liabilities Interest-bearing liabilities are classified as financial liabilities at amortized cost. Amor-tized cost is determined based on the effective interest rate calculated when the liabil-ity was assumed. This means that surplus and deficit values as well as direct costs in conjunction with assuming of loans are distributed over the term of the liability.
Non-current interest-bearing liabilities have an anticipated maturity of more than one year, while current interest-bearing liabilities have a maturity of less than one year.
1.13 Trade PayablesTrade payables are classified in the category financial liabilities at amortized cost.
Trade payables have short expected term and are valued at nominal value.
1.14 Derivatives for cashflow hedgesThe derivative instrument for cashflow is classified in the category derivatives for cashflow hedges. The hedging derivative instrument refers to sale and purchasing of forward contracts for a period of normally 6 to 12 months.
The hedging derivative instrument is measured at fair value each period where the effective portion of the change in fair value is deferred in Other Comprehensive Income and presented within equity. The difference between the effective portion of the change in the fair value of the derivative hedging instrument and the full change in the fair value (the ineffective portion) is recognized in the Income statement. The change in fair value of the hedging instru-ment that is deferred in OCI is reclassified to Income statement in the same period as when the hedged item affects Income statement, and is recorded within Revenue.
1.15 Other payables, other liabilities, accrued expenses and prepaid income
Other payables, other liabilities, accrued expenses and prepaid income are recognized at amortized cost.
1.16 LeasingThe Group leases certain property, plant and equipment. Leasing is classified in the consolidated accounts as either finance or operating leasing.
When the Group, as lessee, essentially enjoys the economic benefits and bears the economic risks attributable to the leased asset, it is classified as a finance lease. The leased asset is recognized in the balance sheet as a fixed asset, while the esti-mated present value of future lease payments is recognized as a liability. The portion of the lease fee that falls due for payment within one year is recognized as a current liability, while the remainder is recognized as a long-term liability. Finance leases are capitalized at the lease’s commencement at the lower of the fair value of the leased property and the present value of the minimum lease payments.
Minimum lease fees for finance leases are divided between interest expense and amortization of the outstanding liability. Interest expense is divided over the lease term so that each reporting period is charged with an amount corresponding to a fixed interest rate for the liability recognized in each period. Variable fees are expensed in the period in which they arise.
Leases in which a significant portion of the risks and rewards of ownership are retained by the lessor are classified as operating leases. Payments made under oper-ating leases (net of any incentives received from the lessor) are charged to the income statement on a straight-line basis over the period of the lease.
1.17 Current and deferred income taxThe tax expense for the period comprises current and deferred tax. Tax is recognized in the income statement, except to the extent that it relates to items recognized in other comprehensive income or directly in equity. In this case, the tax is also recog-nized in other comprehensive income or directly in equity, respectively.
The current income tax charge is calculated on the basis of the tax laws enacted or substantively enacted at the reporting date in the countries where the Company and its Group companies operate and generate taxable income. Management peri-odically evaluates positions taken in tax returns with respect to situations in which applicable tax regulation is subject to interpretation. It establishes provisions where appropriate on the basis of amounts expected to be paid to the tax authorities.
Deferred income tax is recognized, using the liability method, on temporary dif-ferences arising between the tax bases of assets and liabilities and their carrying
Notes to the Consolidated financial statements
22 Transcom Annual Report 2016

amounts in the consolidated financial statements. However, deferred tax liabilities are not recognized if they arise from the initial recognition of goodwill; deferred income tax is not accounted for if it arises from initial recognition of an asset or liability in a transaction other than a business combination that at the time of the transaction affects neither accounting nor taxable profit or loss.
Deferred tax assets and liabilities have been measured at the tax rate that are expected to apply during the period when the asset is realized or the liability is settled, according to the tax rates and tax regulations that have been resolved or enacted at the balance-sheet date.
Deferred income tax assets are recognized only to the extent that it is probable that future taxable profit will be available against which the temporary differences can be utilized.
Deferred income tax is provided on temporary differences arising on investments in Group companies and associates, except for deferred income tax liability where the timing of the reversal of the temporary difference is controlled by the Group and it is probable that the temporary difference will not reverse in the foreseeable future.
Deferred income tax assets and liabilities are offset when there is a legally enforceable right to offset current tax assets against current tax liabilities and when the deferred income taxes assets and liabilities relate to income taxes levied by the same taxation authority on either the same taxable entity or different taxable entities where there is an intention to settle the balances on a net basis.
1.18 Employee benefitsGroup companies operate various pension schemes. The schemes are generally funded through payments to insurance companies or trustee-administered funds, determined by periodic actuarial calculations. The Group has both defined benefit and defined contribution plans.
A defined contribution plan is a pension plan under which the Group pays fixed contributions into a separate entity. The Group has no legal or constructive obliga-tions to pay further contributions if the fund does not hold sufficient assets to pay all employees the benefits relating to employee service in the current and prior periods.
A defined benefit is typically defined by the amount of pension benefit that an employee will receive on retirement, usually dependent on one or more factors such as age, years of service and compensation. The liability recognized in the statement of financial position in respect of defined benefit pension plans is the present value of the defined benefit obligation at the end of the reporting period less the fair value of plan assets, together with adjustments for unrecognized past-service costs. The defined benefit obligation is calculated annually by independent actuaries using the projected unit credit method. The present value of the defined benefit obligation is determined by discounting the estimated future cash outflows using interest rates of high-quality corporate bonds that are denominated in the currency in which the benefits will be paid, and that have terms to maturity approximating to the terms of the related pension obligation.
Actuarial gains and losses arising from experience adjustments and changes in actuarial assumptions are charged or credited to other comprehensive income in the period in which they arise.
Past-service costs are recognized immediately in income, unless the changes to the pension plan are conditional on the employees remaining in service for a specified period of time (the vesting period). In this case, the past-service costs are amortized on a straight-line basis over the vesting period.
The Group’s main defined benefit plans are a termination indemnity plan in Italy and a pension plan in Philippines.
1.19 Share capital and treasury sharesOrdinary shares are classified as equity.
Incremental costs directly attributable to the issue of new ordinary shares or options are shown in equity as a deduction, net of tax, from the proceeds.
Where any Group Company purchases the Company’s equity share capital (treasury shares), the consideration paid, including any directly attributable incremen-tal costs (net of income taxes) is deducted from equity attributable to the Company’s equity holders until the shares are cancelled or reissued. Where such ordinary shares are subsequently reissued, any consideration received, net of any directly attributable incremental transaction costs and the related income tax effects, is included in equity attributable to the Company’s equity holders.
1.20 Share-based paymentsThe Group issues equity-settled share-based payments to certain employees and Senior executives. Equity-settled share-based payments are measured at fair value (excluding the effect of non market-based vesting conditions) at the date of grant. The fair value determined at the grant date of the equity-settled share-based pay-ments is recognized as an expense on a graded vesting basis over the vesting period, based on the Group’s estimate of the shares that will eventually vest and adjusted for the effect of non market vesting conditions. Fair value is measured using the Black-Scholes pricing model or any relevant valuation model. The expected life used in the model is adjusted at the end of each reporting period, based on Group management’s best estimate, for the effect of non-transferability, exercise restrictions and behavioral considerations.
1.21 DividendDividend is recognized as a liability in the Group’s financial statements in the period in which the dividends are approved by the Annual General Meeting.
1.22 ProvisionsProvisions for restructuring costs, legal claims and other obligations are recognized when: the Group has a present legal or constructive obligation as a result of past events; it is probable that an outflow of resources will be required to settle the obliga-tion; and the amount has been reliably estimated. Restructuring provisions comprise lease termination penalties and employee termination payments. Provisions are not recognized for future operating losses.
Provisions are measured at the present value of the expenditures expected to be required to settle the obligation using a pre-tax rate that reflects current market assessments of the time value of money and the risks specific to the obligation.
1.23 Contingent liabilitiesA contingent liability is recognized when there is a possible obligation that arises from past events whose existence will be confirmed only by one or more uncertain future events or when there is an obligation that is not recognized as a liability or provision because it is not probable that an outflow of resources will be required.
1.24 Revenue recognitionRevenue comprises the fair value of the compensation received or receivable for the sale of services in the ordinary course of the Group’s activities. Revenue is shown net of value-added tax, returns, rebates and discounts and after eliminating sales within the Group.
In relation to its CRM business (Customer Relationship Management), revenue mainly arise from call services operations. The Group recognizes revenue when the amount of revenue can be reliably measured, it is probable that future economic benefits will flow to the Group and when specific criteria have been met for each of the Group’s activities as described below. The Group bases its estimates on historical results, taking into consideration the type of customer, the type of transaction and the specifics of each arrangement. • Revenues related to inbound teleservices are recognized at the time services are
provided on a per-call basis.• Revenues on outbound teleservices and debt collection are recognized at the time
services are provided on either a per-call, per-sale or per-collection basis under a fully executed contractual agreement and record reductions to revenues for con-tractual penalties and holdbacks for failure to meet specified minimum service levels and other performance based contingencies.
• Revenues from other CRM services are recognized as services are provided. Gener-ally service revenues are billed in the month following provision of related services. Contracts to provide call center services typically do not involve fees related to cus-tomer set-up, initiation or activation.
CMS revenue mainly arise from fees and commissions generated from the collection of receivables on behalf of customers.
Accrued income on CMS activities is recognized on incomplete activities where a fair assessment of the work achieved to date and the future cash inflows associated with it can be measured with reasonable accuracy. The Company calculates accrued income based on the number of collection cases expected to be solved (“success rates”) in the future multiplied by the estimated cost incurred per case.
23
Notes to the Consolidated financial statements
Transcom Annual Report 2016
1.25 Financial income and expensesFinancial income and expenses consist of interest income on bank balances and receivables and interest-bearing securities, bank fees, interest expenses on loans, dividend income, exchange rate differences, realized and unrealized gains on finan-cial investments, and derivatives used in financial operations.
1.26 Fair value measurement The Group measures financial instruments, such as, derivatives, and non-financial assets, at fair value at each balance sheet date. Also, fair values of financial instru-ments measured at amortized cost are disclosed in note 25.
Fair value is the price that would be received to sell an asset or paid to transfer a liability in an orderly transaction between market participants at the measurement date. The fair value measurement is based on the presumption that the transaction to sell the asset or transfer the liability takes place either: • In the principal market for the asset or liability, • or in the absence of a principal market, in the most advantageous market for the
asset or liability
The principal or the most advantageous market must be accessible to by the Group. The fair value of an asset or a liability is measured using the assumptions that
market participants would use when pricing the asset or liability, assuming that market participants act in their economic best interest.
A fair value measurement of a non-financial asset takes into account a market participant’s ability to generate economic benefits by using the asset in its highest and best use by selling it to another market participant that would use the asset in its highest and best use.
The Group uses valuation techniques that are appropriate in the circumstances and for which sufficient data are available to measure fair value, maximizing the use of relevant observable inputs and minimizing the use of unobservable inputs.
All assets and liabilities for which fair value is measured or disclosed in the finan-cial statements are categorized within the fair value hierarchy, described as follows, based on the lowest level input that is significant to the fair value measurement as a whole:
• Level 1 – Quoted (unadjusted) market prices in active markets for identical assets or liabilities
• Level 2 – Valuation techniques for which the lowest level input that is significant to the fair value measurement is directly or indirectly observable
• Level 3 – Valuation techniques for which the lowest level input that is significant to the fair value measurement is unobservable.
For assets and liabilities that are recognized in the financial statements on a recurring basis, the Group determines whether transfers have occurred between Levels in the hierarchy by re-assessing categorization (based on the lowest level input that is sig-nificant to the fair value measurement as a whole) at the end of each reporting period.
1.27 Cash flow statementThe cash flow statement includes changes in the balance of liquid assets. The Group’s liquid assets consist of cash and bank balances with original maturities of three months or less. Cash flow is presented according to the indirect method, and divided into cash flows from operating activities, investing activities and financing activities.
Cash flow from investing activities includes only actual disbursements for invest-ments during the year.
Foreign Group companies’ transactions are translated in the cash flow statement at the average exchange rate for the period. Acquired and divested Group companies are recognized as cash flow from investing activities, net, after deducting liquid assets in the acquired or divested company.
1.28 Segment reportingOperating segments are reported in a manner consistent with the internal reporting provided to and is evaluated regularly by the chief operating decision maker, i.e. the Group’s CEO. Transcom’s operating segments are North Europe region (Denmark deconsolidated from March 2016, Estonia, Latvia, Lithuania, the Netherlands, Norway and Sweden), Continental Europe region (Italy, Germany, Poland, Portugal, Spain, Tunisia, Hungary, Croatia and Serbia), English-speaking markets & APAC region (the Philippines, UK, USA and Canada), Latin America (Colombia closed in December 2015, Peru and Chile).
Note 2 Critical accounting estimates and judgementsThe preparation of financial statements in conformity with IFRS requires the use of certain critical accounting estimates. It also requires management to exercise its judgment in the process of applying the Group’s accounting policies. The areas involving a higher degree of judgment or complexity, or areas where assumptions and estimates are significant to the consolidated financial statements aredescribed below.
(a) Deferred tax assets Deferred tax assets are recognized for all unused tax losses to the extent that it is probable that taxable profit will be available against which the losses can be utilized. Significant management judgment is required to determine the amount of deferred tax assets that can be recognized, based upon the likely timing and level of future tax-able profits. Recognized value for each balance sheet date for deferred tax assets, see note 10.
(b) Impairment of goodwill and intangible assets The Group annually evaluates the carrying value of goodwill for potential impairment by comparing projected discounted cash flows (using a suitable discount rate) associ-ated with such assets to the related carrying value. An impairment test is also carried out should events or circumstances change which may indicate that there may be need for impairment. An impairment loss would be recognized when the estimated future discounted cash flow generated by the asset is less than the carrying amount of the asset. An impairment loss would be measured as the amount by which the car-rying value of the asset exceeds the recoverable amount. The Group performed its annual impairment test of goodwill during the 4th quarter of 2016. Changes in the assumptions and estimates used may have a significant effect on the income state-
ment and statement of financial position. Please see note 12 for further details includ-ing a sensitivity analysis of some of the assumptions made.
(c) Provisions The Group recognizes a provision where there is a present obligation from a past event, a transfer of economic benefits is probable and the amount of costs of the transfer can be estimated reliably. The Group reviews outstanding legal cases, includ-ing tax audits, following developments in the legal proceedings, in order to assess the need for provisions and disclosures in its financial statements. Among the factors considered in making decisions on provisions are the nature of litigation, claim or assessment, the legal process and potential level of damages in the jurisdiction in which the litigation, claim or assessment has been brought, the progress of the case (including the progress after the date of the financial statements but before those statements are issued), the opinions or views of legal advisers, experience on similar cases and any decision of the Group’s management as to how it will respond to the litigation or claim.
(d) Contingent liabilitiesThe Group has contingent liabilities related to litigations and legal claims arising in the ordinary course of business. The integrated worldwide nature of Transcom’s oper-ations can give rise to complexity and delays in assessing the Group’s tax position and can lead to the Group occasionally facing tax audits which in some cases result in disputes with tax authorities. During these tax audits, local tax authorities may ques-tion or challenge the Group’s tax positions. Disputes with tax authorities can lead to litigations in front of several courts resulting in lengthy legal proceedings.
Notes to the Consolidated financial statements
24 Transcom Annual Report 2016

Note 3 Segmental information
2016
EUR thousand North Europe Continental EuropeEnglish-speaking markets & APAC Latin America Total Group
RevenueTotal segment revenue* 191,804 253,713 138,725 12,371 596,613Inter-segment revenue* -5,210 -4,949 – -335 -10,494Revenue from external customers 186,594 248,764 138,725 12,036 586,119Gross profit 34,972 43,848 35,892 2,936 117,648Operating profit/loss 12,907 6,481 4,489 -498 23,379
2015
EUR thousand North Europe Continental EuropeEnglish-speaking markets & APAC Latin America Total Group
RevenueTotal segment revenue* 207,090 267,541 149,160 14,348 638,139Inter-segment revenue* -5,202 -5,150 – -1,265 -11,617Revenue from external customers 201,889 262,390 149,160 13,083 626,522Gross profit 37,047 45,609 40,323 711 123,689Operating profit/loss 10,046 9,424 6,424 -5,945 19,950
* The revenue is presented for each segment after elimination of the intra-segment transactions. The inter-segment revenue shows the transactions between regions.
In Q1 2016 the regional structure was changed in the Group and comparable figures were restated accordingly. The Continental Europe region combines Transcom's operations in Spain and Portugal with the former Central & South Europe region (excluding the United Kingdom). The English-speaking markets & APAC region integrates the UK organization with Transcom's operations in North America & Asia Pacific. Region North Europe remains unchanged.
The Group reportable segments are composed as follows:• North Europe region: services delivered from Denmark (deconsolidated from
March 2016), Estonia, Latvia, Lithuania, the Netherlands, Norway and Sweden• Continental Europe region: services delivered from Italy, Germany, Poland, Portugal,
Spain, Tunisia, Hungary, Croatia and Serbia. • English-speaking markets & APAC region: services delivered from the Philippines,
UK, USA and Canada. • Latin America region: services delivered from Colombia (closed in December 2015),
Peru and Chile.
Revenues from the largest single client amounted to EUR 77,586 thousand during 2016, referring to North Europe region and Continental Europe region, and revenue from the second largest client amounted to EUR 47,148 thousand 2016 referring to Continental Europe region (2015: EUR 92,287 thousand, North Europe region and Continental Europe region, 2015: EUR 60,568 thousand English-speaking markets & APAC region). External revenue for Sweden amounted to EUR 106,881 thousand 2016 (2015: EUR 124,012 thousand) and total assets in Sweden amounted to EUR 30,867 thousand (2015: EUR 35,799 thousand).
Goodwill per segment is reflected in note 12.
Not 4 Expenses by nature
EUR thousand 2016 2015
Production costs -22,817 -34,290Personnel expenses -476,676 -497,949Other -58,299 -64,263Amortization and depreciation -8,275 -9,135Expenses charged to the income statement -566,067 -605,636
Note 5 Employees
Salaries, other remuneration and social security chargesEUR thousand 2016 2015
Salaries and other remunerations -374,547 -393,927Social security charges -66,057 -67,270Pension expenses -10,406 -10,194Total -451,009 -471,391
Salaries, other remuneration and social security charges are recognized in the following line items in the income statementEUR thousand 2016 2015
Cost of sales -412,651 -434,273Marketing expenses -2,516 -2,684Administrative expenses -35,842 -34,434Total -451,009 -471,391
25
Notes to the Consolidated financial statements
Transcom Annual Report 2016
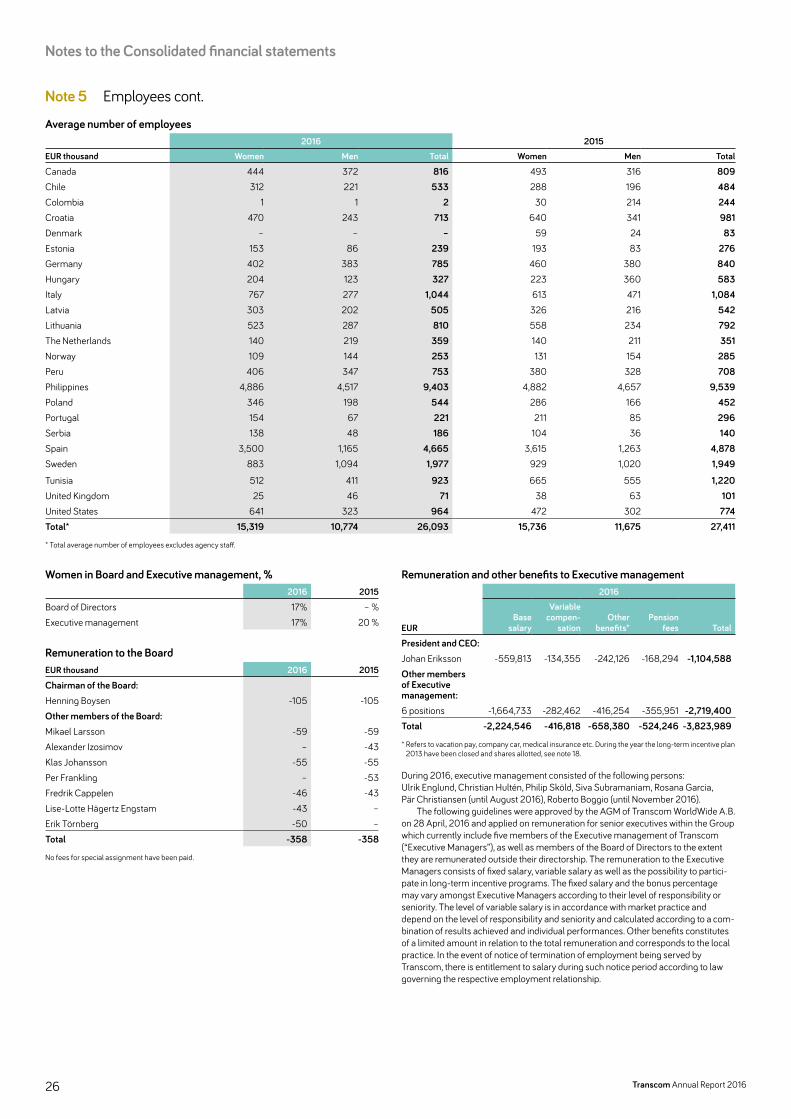
Note 5 Employees cont.
Average number of employees2016 2015
EUR thousand Women Men Total Women Men Total
Canada 444 372 816 493 316 809Chile 312 221 533 288 196 484Colombia 1 1 2 30 214 244Croatia 470 243 713 640 341 981Denmark – – – 59 24 83Estonia 153 86 239 193 83 276Germany 402 383 785 460 380 840Hungary 204 123 327 223 360 583Italy 767 277 1,044 613 471 1,084Latvia 303 202 505 326 216 542Lithuania 523 287 810 558 234 792The Netherlands 140 219 359 140 211 351Norway 109 144 253 131 154 285Peru 406 347 753 380 328 708Philippines 4,886 4,517 9,403 4,882 4,657 9,539Poland 346 198 544 286 166 452Portugal 154 67 221 211 85 296Serbia 138 48 186 104 36 140Spain 3,500 1,165 4,665 3,615 1,263 4,878Sweden 883 1,094 1,977 929 1,020 1,949
Tunisia 512 411 923 665 555 1,220United Kingdom 25 46 71 38 63 101United States 641 323 964 472 302 774Total* 15,319 10,774 26,093 15,736 11,675 27,411
* Total average number of employees excludes agency staff.
Women in Board and Executive management, %2016 2015
Board of Directors 17% – %Executive management 17% 20 %
Remuneration to the BoardEUR thousand 2016 2015
Chairman of the Board:Henning Boysen -105 -105Other members of the Board:Mikael Larsson -59 -59Alexander Izosimov – -43Klas Johansson -55 -55Per Frankling – -53Fredrik Cappelen -46 -43Lise-Lotte Hägertz Engstam -43 –Erik Törnberg -50 –Total -358 -358
No fees for special assignment have been paid.
Remuneration and other benefits to Executive management2016
EURBase
salary
Variablecompen-
sationOther
benefits*Pension
fees Total
President and CEO:Johan Eriksson -559,813 -134,355 -242,126 -168,294 -1,104,588Other members of Executive management:6 positions -1,664,733 -282,462 -416,254 -355,951 -2,719,400Total -2,224,546 -416,818 -658,380 -524,246 -3,823,989
* Refers to vacation pay, company car, medical insurance etc. During the year the long-term incentive plan 2013 have been closed and shares allotted, see note 18.
During 2016, executive management consisted of the following persons: Ulrik Englund, Christian Hultén, Philip Sköld, Siva Subramaniam, Rosana Garcia, Pär Christiansen (until August 2016), Roberto Boggio (until November 2016).
The following guidelines were approved by the AGM of Transcom WorldWide A.B. on 28 April, 2016 and applied on remuneration for senior executives within the Group which currently include five members of the Executive management of Transcom (“Executive Managers”), as well as members of the Board of Directors to the extent they are remunerated outside their directorship. The remuneration to the Executive Managers consists of fixed salary, variable salary as well as the possibility to partici-pate in long-term incentive programs. The fixed salary and the bonus percentage may vary amongst Executive Managers according to their level of responsibility or seniority. The level of variable salary is in accordance with market practice and depend on the level of responsibility and seniority and calculated according to a com-bination of results achieved and individual performances. Other benefits constitutes of a limited amount in relation to the total remuneration and corresponds to the local practice. In the event of notice of termination of employment being served by Transcom, there is entitlement to salary during such notice period according to law governing the respective employment relationship.
Notes to the Consolidated financial statements
26 Transcom Annual Report 2016
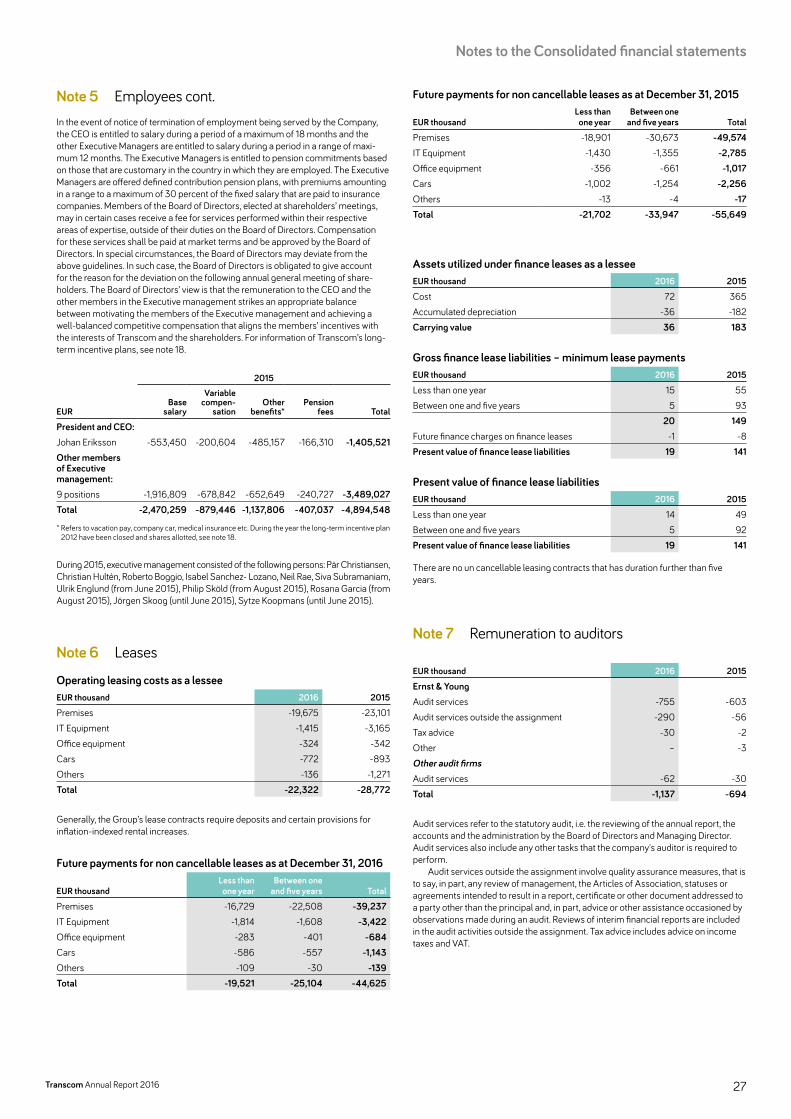
Note 5 Employees cont. In the event of notice of termination of employment being served by the Company, the CEO is entitled to salary during a period of a maximum of 18 months and the other Executive Managers are entitled to salary during a period in a range of maxi-mum 12 months. The Executive Managers is entitled to pension commitments based on those that are customary in the country in which they are employed. The Executive Managers are offered defined contribution pension plans, with premiums amounting in a range to a maximum of 30 percent of the fixed salary that are paid to insurance companies. Members of the Board of Directors, elected at shareholders’ meetings, may in certain cases receive a fee for services performed within their respective areas of expertise, outside of their duties on the Board of Directors. Compensation for these services shall be paid at market terms and be approved by the Board of Directors. In special circumstances, the Board of Directors may deviate from the above guidelines. In such case, the Board of Directors is obligated to give account for the reason for the deviation on the following annual general meeting of share-holders. The Board of Directors’ view is that the remuneration to the CEO and the other members in the Executive management strikes an appropriate balance between motivating the members of the Executive management and achieving a well-balanced competitive compensation that aligns the members’ incentives with the interests of Transcom and the shareholders. For information of Transcom’s long-term incentive plans, see note 18.
2015
EURBase
salary
Variablecompen-
sationOther
benefits*Pension
fees Total
President and CEO:Johan Eriksson -553,450 -200,604 -485,157 -166,310 -1,405,521Other members of Executive management:9 positions -1,916,809 -678,842 -652,649 -240,727 -3,489,027Total -2,470,259 -879,446 -1,137,806 -407,037 -4,894,548
* Refers to vacation pay, company car, medical insurance etc. During the year the long-term incentive plan 2012 have been closed and shares allotted, see note 18.
During 2015, executive management consisted of the following persons: Pär Christiansen, Christian Hultén, Roberto Boggio, Isabel Sanchez- Lozano, Neil Rae, Siva Subramaniam, Ulrik Englund (from June 2015), Philip Sköld (from August 2015), Rosana Garcia (from August 2015), Jörgen Skoog (until June 2015), Sytze Koopmans (until June 2015).
Note 6 Leases
Operating leasing costs as a lesseeEUR thousand 2016 2015
Premises -19,675 -23,101IT Equipment -1,415 -3,165Office equipment -324 -342Cars -772 -893Others -136 -1,271Total -22,322 -28,772
Generally, the Group’s lease contracts require deposits and certain provisions for inflation-indexed rental increases.
Future payments for non cancellable leases as at December 31, 2016
EUR thousandLess than one year
Between one and five years Total
Premises -16,729 -22,508 -39,237IT Equipment -1,814 -1,608 -3,422Office equipment -283 -401 -684Cars -586 -557 -1,143Others -109 -30 -139Total -19,521 -25,104 -44,625
Future payments for non cancellable leases as at December 31, 2015
EUR thousandLess than one year
Between one and five years Total
Premises -18,901 -30,673 -49,574IT Equipment -1,430 -1,355 -2,785Office equipment -356 -661 -1,017Cars -1,002 -1,254 -2,256Others -13 -4 -17Total -21,702 -33,947 -55,649
Assets utilized under finance leases as a lesseeEUR thousand 2016 2015
Cost 72 365Accumulated depreciation -36 -182Carrying value 36 183
Gross finance lease liabilities – minimum lease paymentsEUR thousand 2016 2015
Less than one year 15 55Between one and five years 5 93
20 149Future finance charges on finance leases -1 -8Present value of finance lease liabilities 19 141
Present value of finance lease liabilitiesEUR thousand 2016 2015
Less than one year 14 49Between one and five years 5 92Present value of finance lease liabilities 19 141
There are no un cancellable leasing contracts that has duration further than five years.
Note 7 Remuneration to auditors
EUR thousand 2016 2015
Ernst & YoungAudit services -755 -603Audit services outside the assignment -290 -56Tax advice -30 -2Other – -3Other audit firmsAudit services -62 -30Total -1,137 -694
Audit services refer to the statutory audit, i.e. the reviewing of the annual report, the accounts and the administration by the Board of Directors and Managing Director. Audit services also include any other tasks that the company's auditor is required to perform.
Audit services outside the assignment involve quality assurance measures, that is to say, in part, any review of management, the Articles of Association, statuses or agreements intended to result in a report, certificate or other document addressed to a party other than the principal and, in part, advice or other assistance occasioned by observations made during an audit. Reviews of interim financial reports are included in the audit activities outside the assignment. Tax advice includes advice on income taxes and VAT.
27
Notes to the Consolidated financial statements
Transcom Annual Report 2016
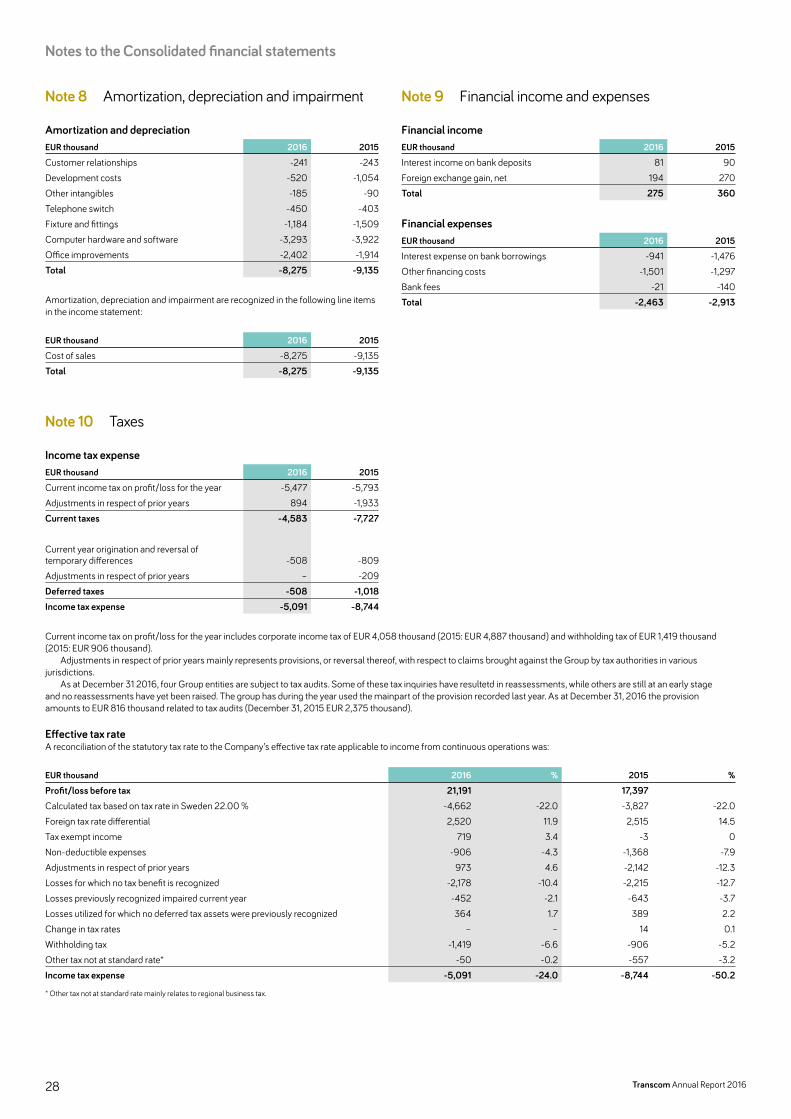
Note 8 Amortization, depreciation and impairment
Amortization and depreciationEUR thousand 2016 2015
Customer relationships -241 -243Development costs -520 -1,054Other intangibles -185 -90Telephone switch -450 -403Fixture and fittings -1,184 -1,509Computer hardware and software -3,293 -3,922Office improvements -2,402 -1,914Total -8,275 -9,135
Amortization, depreciation and impairment are recognized in the following line items in the income statement:
EUR thousand 2016 2015
Cost of sales -8,275 -9,135Total -8,275 -9,135
Note 9 Financial income and expenses
Financial incomeEUR thousand 2016 2015
Interest income on bank deposits 81 90Foreign exchange gain, net 194 270Total 275 360
Financial expensesEUR thousand 2016 2015
Interest expense on bank borrowings -941 -1,476Other financing costs -1,501 -1,297Bank fees -21 -140Total -2,463 -2,913
Note 10 Taxes
Income tax expenseEUR thousand 2016 2015
Current income tax on profit/loss for the year -5,477 -5,793Adjustments in respect of prior years 894 -1,933Current taxes -4,583 -7,727
Current year origination and reversal of temporary differences -508 -809Adjustments in respect of prior years – -209Deferred taxes -508 -1,018Income tax expense -5,091 -8,744
Current income tax on profit/loss for the year includes corporate income tax of EUR 4,058 thousand (2015: EUR 4,887 thousand) and withholding tax of EUR 1,419 thousand (2015: EUR 906 thousand).
Adjustments in respect of prior years mainly represents provisions, or reversal thereof, with respect to claims brought against the Group by tax authorities in various jurisdictions.
As at December 31 2016, four Group entities are subject to tax audits. Some of these tax inquiries have resultetd in reassessments, while others are still at an early stage and no reassessments have yet been raised. The group has during the year used the mainpart of the provision recorded last year. As at December 31, 2016 the provision amounts to EUR 816 thousand related to tax audits (December 31, 2015 EUR 2,375 thousand).
Effective tax rateA reconciliation of the statutory tax rate to the Company’s effective tax rate applicable to income from continuous operations was:
EUR thousand 2016 % 2015 %
Profit/loss before tax 21,191 17,397Calculated tax based on tax rate in Sweden 22.00 % -4,662 -22.0 -3,827 -22.0Foreign tax rate differential 2,520 11.9 2,515 14.5Tax exempt income 719 3.4 -3 0Non-deductible expenses -906 -4.3 -1,368 -7.9Adjustments in respect of prior years 973 4.6 -2,142 -12.3Losses for which no tax benefit is recognized -2,178 -10.4 -2,215 -12.7Losses previously recognized impaired current year -452 -2.1 -643 -3.7Losses utilized for which no deferred tax assets were previously recognized 364 1.7 389 2.2Change in tax rates – – 14 0.1Withholding tax -1,419 -6.6 -906 -5.2Other tax not at standard rate* -50 -0.2 -557 -3.2Income tax expense -5,091 -24.0 -8,744 -50.2
* Other tax not at standard rate mainly relates to regional business tax.
Notes to the Consolidated financial statements
28 Transcom Annual Report 2016
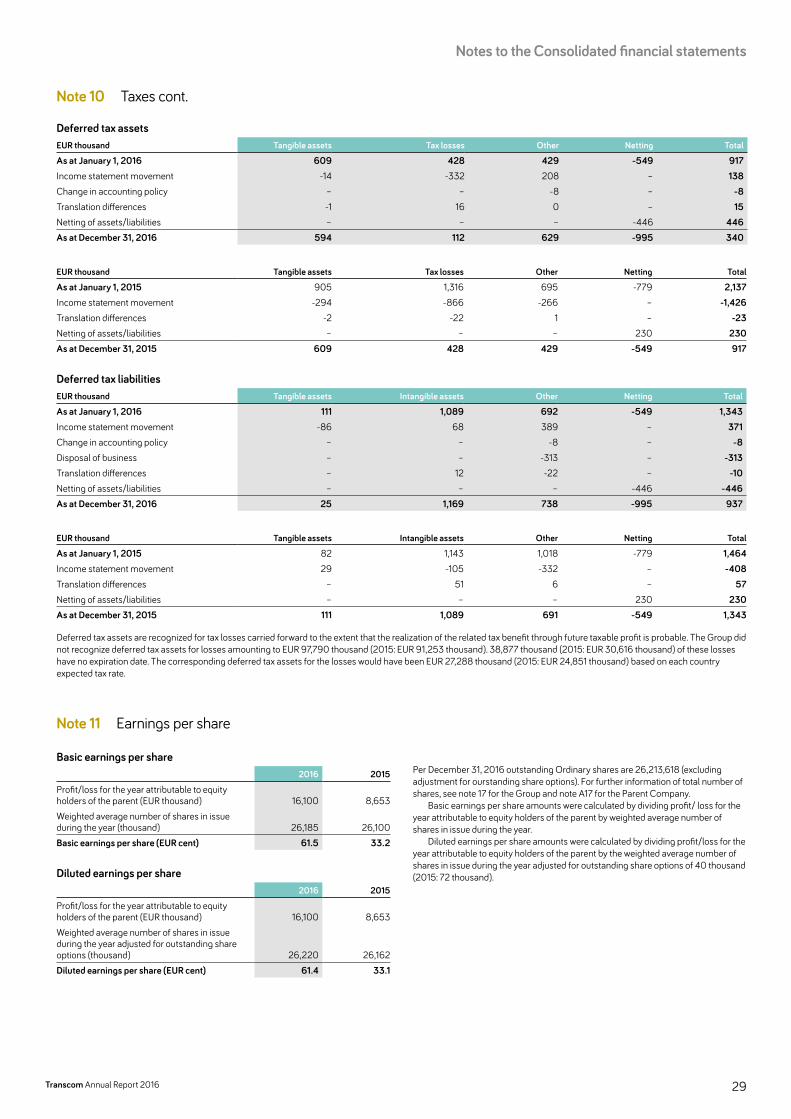
Note 10 Taxes cont.
Deferred tax assetsEUR thousand Tangible assets Tax losses Other Netting Total
As at January 1, 2016 609 428 429 -549 917Income statement movement -14 -332 208 – 138Change in accounting policy – – -8 – -8Translation differences -1 16 0 – 15Netting of assets/liabilities – – – -446 446As at December 31, 2016 594 112 629 -995 340
EUR thousand Tangible assets Tax losses Other Netting Total
As at January 1, 2015 905 1,316 695 -779 2,137Income statement movement -294 -866 -266 – -1,426Translation differences -2 -22 1 – -23Netting of assets/liabilities – – – 230 230As at December 31, 2015 609 428 429 -549 917
Deferred tax liabilitiesEUR thousand Tangible assets Intangible assets Other Netting Total
As at January 1, 2016 111 1,089 692 -549 1,343Income statement movement -86 68 389 – 371Change in accounting policy – – -8 – -8Disposal of business – – -313 – -313Translation differences – 12 -22 – -10Netting of assets/liabilities – – – -446 -446As at December 31, 2016 25 1,169 738 -995 937
EUR thousand Tangible assets Intangible assets Other Netting Total
As at January 1, 2015 82 1,143 1,018 -779 1,464Income statement movement 29 -105 -332 – -408Translation differences – 51 6 – 57Netting of assets/liabilities – – – 230 230As at December 31, 2015 111 1,089 691 -549 1,343
Deferred tax assets are recognized for tax losses carried forward to the extent that the realization of the related tax benefit through future taxable profit is probable. The Group did not recognize deferred tax assets for losses amounting to EUR 97,790 thousand (2015: EUR 91,253 thousand). 38,877 thousand (2015: EUR 30,616 thousand) of these losses have no expiration date. The corresponding deferred tax assets for the losses would have been EUR 27,288 thousand (2015: EUR 24,851 thousand) based on each country expected tax rate.
Note 11 Earnings per share
Basic earnings per share2016 2015
Profit/loss for the year attributable to equity holders of the parent (EUR thousand) 16,100 8,653Weighted average number of shares in issue during the year (thousand) 26,185 26,100Basic earnings per share (EUR cent) 61.5 33.2
Diluted earnings per share2016 2015
Profit/loss for the year attributable to equity holders of the parent (EUR thousand) 16,100 8,653Weighted average number of shares in issue during the year adjusted for outstanding share options (thousand) 26,220 26,162Diluted earnings per share (EUR cent) 61.4 33.1
Per December 31, 2016 outstanding Ordinary shares are 26,213,618 (excluding adjustment for ourstanding share options). For further information of total number of shares, see note 17 for the Group and note A17 for the Parent Company.
Basic earnings per share amounts were calculated by dividing profit/ loss for the year attributable to equity holders of the parent by weighted average number of shares in issue during the year.
Diluted earnings per share amounts were calculated by dividing profit/loss for the year attributable to equity holders of the parent by the weighted average number of shares in issue during the year adjusted for outstanding share options of 40 thousand (2015: 72 thousand).
29
Notes to the Consolidated financial statements
Transcom Annual Report 2016

Note 12 Goodwill and other intangible assets
Cost
EUR thousand GoodwillCustomer
relationshipsDevelopment
cost Others Total
As at January 1, 2016 124,948 13,951 13,319 2,510 154,728Investments – – 1,660 314 1,974Disposal – – – -9 -9Translation differences 244 239 – 3 486As at December 31, 2016 125,192 14,190 14,979 2,818 157,179
Accumulated amortization and impairmentAs at January 1, 2016 -17,457 -12,290 -10,879 -2,436 -43,062Amortization for the year – -241 -520 -185 -946Disposal – – – 9 9Translation differences 1,100 -196 – -5 899As at December 31, 2016 -16,357 -12,727 -11,399 -2,617 -43,100Carrying value as at December 31, 2016 108,835 1,463 3,580 201 114,079
EUR thousand GoodwillCustomer
relationshipsDevelopment
cost Others Total
As at January 1, 2015 118,740 12,517 11,310 3,358 145,925Investments – – 1,202 7 1,209Translation differences 6,208 1,434 807 -855 7,594As at December 31, 2015 124,948 13,951 13,319 2,510 154,728
Accumulated amortization and impairmentAs at January 1, 2015 -16,917 -10,804 -9,829 -2,340 -39,890Amortization for the year – -243 -1,054 -90 -1,387Translation differences -541 -1,243 4 -6 -1,786As at December 31, 2015 -17,457 -12,290 -10,879 -2,436 -43,062Carrying value as at December 31, 2015 107,491 1,661 2,440 74 111,666
Goodwill Impairment testing for cash generating units containing goodwill The impairment test gave no indication of a need for goodwill impairment (2015: nil).
The Group treats the geographical regions as cash-generating units in the sense referred to in IAS 36 Impairment of assets. The carrying amounts of goodwill allo-cated to each region are:
EUR thousand 2016 2015
North Europe 9,178 42,953Continental Europe 44,037 11,451English-speaking markets & APAC 55,620 53,087Latin America – –Total* 108,835 107,491
* As explained in note 3, in 2016, the regional structure was changed in the Group. Consequently, the carrying value of the goodwill has been restated accordingly to reflect the new Group structure.
The calculation of the value in use was based on the following main assumptions: Cash flows were projected based on past experience, actual operating results
and the 3-year financial plans approved by the Board of Directors. Beyond the specifically forecasted period of three years, the Company extrapolates cash flows based on estimated constant growth rates of 2.1 percent (2015: 2.1 percent) depending on executive management’s understanding of the market in the region in which the unit is based. The anticipated annual revenue growth included in the cash-flow projections has been based on historical experience and expectations of future changes in the market conditions. Market conditions take into account the nature of risk within geographical markets and executive management’s estimations of change within these markets. These rates do not exceed the average long-term growth rates for the relevant markets.
Pre-tax discount rates ranging from 9.8 percent to 16.0 percent; North Europe region 9.8%, Continental Europe region 16.0% and English-speaking markets & APAC 13.9% (2015: 7.3 percent to 14.3 percent) were applied in determining the recoverable amounts of the units. The discount rates were estimated based on past experience, industry average weighted cost of capital and Group’s industry related beta adjusted to reflect executive management’s assessment of specific risks related to the unit. Main changes in discount rates 2016 compared to 2015 is explained by lower risk-free rate and due to change in the Company's capital structure since lower net debt ratio.
Reasonably possible changes in key assumptions (such as discount rates, Revenue/Operating margin and terminal growth rate) would not trigger any impair-ment loss to be recognized in neither of the segments.
Customer relationships and development costs Customer relationships mainly consist of intangible assets that were identified during the past acquisitions based on the discounted cash flows expected to be derived from the use and eventual sale of the asset, determined at the date of acquisition. During the fourth quarter 2016 these assets were tested for impairment. The impairment test gave no indication of need of impairment (2015: nil).
Development costs consist of amounts identified by executive management’s where it is considered that technological and economical feasibility exists, usually determined by reference to the achievement of defined milestones according to an established project management model. These costs relate to development of assets for the use in the Group. As at December 31, 2016 these assets were tested for impairment. The impairment test gave no indication of need of impairment (2015: nil).
Notes to the Consolidated financial statements
30 Transcom Annual Report 2016
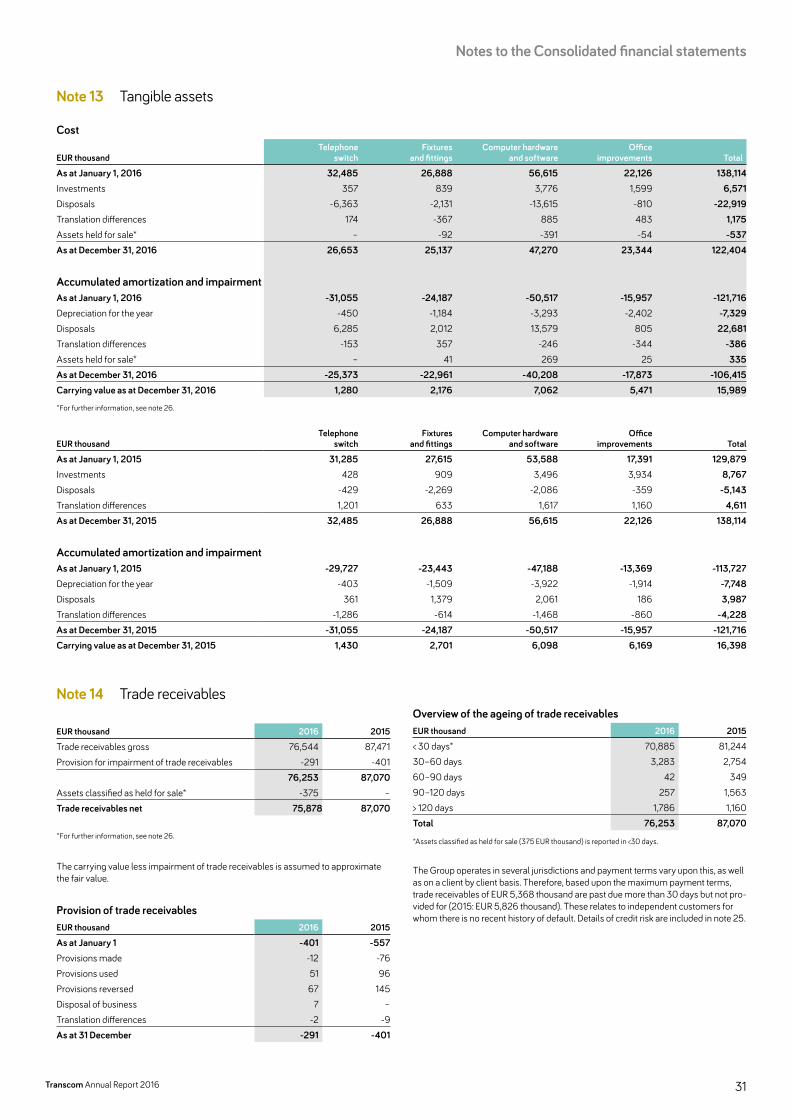
Note 13 Tangible assets
Cost
EUR thousandTelephone
switchFixtures
and fittingsComputer hardware
and softwareOffice
improvements Total
As at January 1, 2016 32,485 26,888 56,615 22,126 138,114Investments 357 839 3,776 1,599 6,571Disposals -6,363 -2,131 -13,615 -810 -22,919Translation differences 174 -367 885 483 1,175Assets held for sale* – -92 -391 -54 -537As at December 31, 2016 26,653 25,137 47,270 23,344 122,404
Accumulated amortization and impairmentAs at January 1, 2016 -31,055 -24,187 -50,517 -15,957 -121,716Depreciation for the year -450 -1,184 -3,293 -2,402 -7,329Disposals 6,285 2,012 13,579 805 22,681Translation differences -153 357 -246 -344 -386Assets held for sale* – 41 269 25 335As at December 31, 2016 -25,373 -22,961 -40,208 -17,873 -106,415Carrying value as at December 31, 2016 1,280 2,176 7,062 5,471 15,989
*For further information, see note 26.
EUR thousandTelephone
switchFixtures
and fittingsComputer hardware
and softwareOffice
improvements Total
As at January 1, 2015 31,285 27,615 53,588 17,391 129,879Investments 428 909 3,496 3,934 8,767Disposals -429 -2,269 -2,086 -359 -5,143Translation differences 1,201 633 1,617 1,160 4,611As at December 31, 2015 32,485 26,888 56,615 22,126 138,114
Accumulated amortization and impairmentAs at January 1, 2015 -29,727 -23,443 -47,188 -13,369 -113,727Depreciation for the year -403 -1,509 -3,922 -1,914 -7,748Disposals 361 1,379 2,061 186 3,987Translation differences -1,286 -614 -1,468 -860 -4,228As at December 31, 2015 -31,055 -24,187 -50,517 -15,957 -121,716Carrying value as at December 31, 2015 1,430 2,701 6,098 6,169 16,398
Note 14 Trade receivables
EUR thousand 2016 2015
Trade receivables gross 76,544 87,471Provision for impairment of trade receivables -291 -401
76,253 87,070Assets classified as held for sale* -375 –Trade receivables net 75,878 87,070
*For further information, see note 26.
The carrying value less impairment of trade receivables is assumed to approximate the fair value.
Provision of trade receivablesEUR thousand 2016 2015
As at January 1 -401 -557Provisions made -12 -76Provisions used 51 96Provisions reversed 67 145Disposal of business 7 –Translation differences -2 -9As at 31 December -291 -401
Overview of the ageing of trade receivablesEUR thousand 2016 2015
< 30 days* 70,885 81,24430–60 days 3,283 2,75460–90 days 42 34990–120 days 257 1,563> 120 days 1,786 1,160Total 76,253 87,070
*Assets classified as held for sale (375 EUR thousand) is reported in <30 days.
The Group operates in several jurisdictions and payment terms vary upon this, as well as on a client by client basis. Therefore, based upon the maximum payment terms, trade receivables of EUR 5,368 thousand are past due more than 30 days but not pro-vided for (2015: EUR 5,826 thousand). These relates to independent customers for whom there is no recent history of default. Details of credit risk are included in note 25.
31
Notes to the Consolidated financial statements
Transcom Annual Report 2016

Note 15 Other receivables
EUR thousand 2016 2015
VAT recoverable 6,412 2,397Amount due from public authorities 1,444 1,332Right to collect portfolio – 7,906Client deposit related assets 980 3,083Other receivables* 4,184 3,799
13,020 18,517Receivables classified as held for sale** -135 –Total 12,885 18,517
* Other receivables mainly relates advances to suppliers and employees. ** For further information, see note 26.
Note 16 Cash and cash equivalents
Cash and cash equivalents does not include any restricted cash.
Note 17 Equity
Share capital As of December 31, 2016 the share capital amounted to EUR 56,084 thousand (2015: 56,084 thousand) and was divided into a total of 26,322,212 ordinary shares with one voting right each and 594,372 class C shares, also with one voting right each. All class C shares are held as treasury shares by the Company. The total number of treasury shares held in own custody amounts to 702,966 (594,372 class C shares and 108,594 ordinary shares). For further information of the Equity, please refer to note A17.
During 2016, Transcom converted 150,000 class C shares to ordinary shares to be used when vesting long-term incentive plans. 75,805 shares held by Transcom were used when the long-term incentive plan 2013 was vested during the second quarter 2016. Transcom also issued and repurchased 210,000 class C shares for potential delivery to long-term incentive plan (LTIP) participants. For information of the long-term incentive plan, please refer to note 18.
During 2015 115,000 class C shares were converted to ordinary shares. 108,272 shares held by Transcom was used when the long-term incentive plan 2012 was vested in 2015.
Note 18 Share-based payments
As at 27 March 2017 Transcom reported that the change in ownership has triggered a change of control clause in the Company’s long-term incentive programs (LTIP 2014, 2015 and 2016), and Transcom’s board of directors has therefore, in accordance with the terms of the programs, resolved to replace the estimated number of shares to be vested by a cash payment to the participants amounting to approximately EUR 1.3 mil-lion in total. In addition, the Swap Agreement connected to LTIP 2015 was terminated.
Long-term incentive plan 2016 (“LTIP 2016”) At the Annual General Meeting held in April 2016, the LTIP 2016 was approved. The plan consists of two elements, a matching share award plan (“loyalty element”) and a performance share plan (“performance element”). The LTIP was granted to Transcom’s Senior Executives following the annual general meeting 2016 in connec-tion with, the agreement made between the Senior Executive and the Company con-cerning participation in the LTIP 2016.
The shares awarded are subject to market conditions based on the “total share-holder return”, the average normalized EBIT margin, the average normalized Earnings Per Share (EPS) during the performance period. The performance element vest over a three year period. The achievement of a certain level of each condition, measured at each vesting date, yields a specific percentage of shares awarded to each employee at the grant date.
The loyalty element requires eligible employees to invest a certain percentage of their salary in shares of the Company on the market in order to receive potential matching shares. In addition the participants need to be employed by Transcom at the time of the vesting date. The shares awarded under this plan vest at the end of a three year period.
The value of the plan is apportioned equally over the total period of the plan and charged through the income statement. The expense recognized in the consolidated income statement with respect to LTIP 2016 amounted to EUR 80 thousand (2015: nil).
Long-term incentive plan 2015 (“LTIP 2015”) At the Annual General Meeting held in May 2015, the LTIP 2015 was approved. The plan consists of two elements, a matching share award plan (“loyalty element”) and a performance share plan (“performance element”). The LTIP was granted to Transcom’s Senior Executives and the grant date was determined to be 12th May, 2015.
The shares awarded are subject to market conditions based on the “total share-holder return”, the average normalized EBIT, the average normalized Earnings Per Share (EPS) and Transcom average TSR vs a peer Group’s average TSR during the performance period. The performance element vest over a three year period. The achievement of a certain level of each condition, measured at each vesting date, yields a specific percentage of shares awarded to each employee at the grant date.
The loyalty element requires eligible employees to invest a certain percentage of their salary in shares of the Company on the market in order to receive potential matching shares. In addition the participants need to be employed by Transcom at the time of the vesting date. The shares awarded under this plan vest at the end of a three year period.
The value of the plan is apportioned equally over the total period of the plan and charged through the income statement. The expense recognized in the consolidated income statement with respect to LTIP 2016 amounted to EUR 239 thousand (2015: EUR 113 thousand).
Long-term incentive plan 2014 (“LTIP 2014”) At the Annual General Meeting held in May 2014, the LTIP 2014 was approved. The plan consists of two elements, a matching share award plan (“loyalty element”) and a perfor-mance share plan (“performance element”). The LTIP was granted to Transcom’s Senior Executives and the grant date was determined to be 28th May, 2014.
The shares awarded are subject to market conditions based on the “total share-holder return”, the accumulated normalized EBIT, the average normalized EBIT and Transcom average TSR vs a peer Group’s average TSR during the performance period. The performance element vest over a three year period, however that entitle-ment to shares based on fulfilment of the EBIT related conditions may also accrue on a year-for-year basis. The achievement of a certain level of each condition, measured at each vesting date, yields a specific percentage of shares awarded to each employee at the grant date.
The loyalty element requires eligible employees to invest a certain percentage of their salary in shares of the Company on the market in order to receive potential matching shares. In addition the participants need to be employed by Transcom at the time of the vesting date. The shares awarded under this plan vest at the end of a three year period.
The value of the plan is apportioned equally over the total period of the plan and charged through the income statement. The expense recognized in the consolidated income statement with respect to LTIP 2014 amounted to EUR 65 thousand (2015: EUR 79 thousand).
Long-term incentive plan 2013 (“LTIP 2013”) The 2013–2016 LTIP was approved at the Annual General Meeting, held on 29 May 2013. This plan consists of two elements, a performance share plan (“performance ele-ment”) and a matching share award plan (“loyalty element”). This LTIP was granted to Transcom’s Senior Executives and the grant date was determined to be May 29, 2013.
The shares awarded are subject to market conditions based on the “total share-holder return”, the accumulated normalized EBIT, the average normalized EBIT and average normalized seat utilization ratio under the performance element vest over a three year period, however that entitlement to shares based on fulfilment of the EBIT related conditions may also accrue on a year-for-year basis. The achievement of a certain level of each condition, measured at each vesting date, yields a specific per-centage of shares awarded to each employee at the grant date.
The loyalty element requires eligible employees to invest a certain percentage of their salary in shares of the Company on the market in order to receive potential match-ing shares. The shares awarded under this plan vest at the end of a three year period.
The value of the plan is apportioned equally over the total period of the plan and charged through the income statement. The expense recognized in the consolidated income statement with respect to LTIP 2013 amounted nil (2015: EUR 182 thousand). During the year 2016 this plan was vested and number of shares allotted amounted to 75,805.
Notes to the Consolidated financial statements
32 Transcom Annual Report 2016
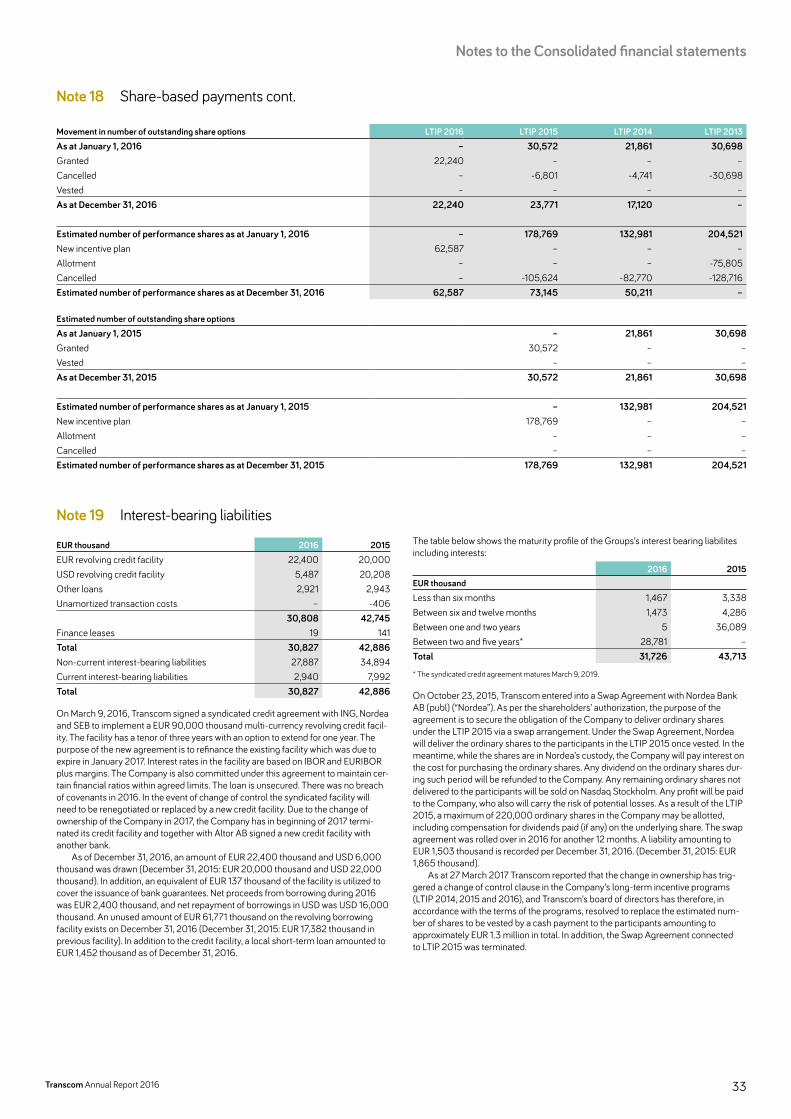
Note 18 Share-based payments cont.
Movement in number of outstanding share options LTIP 2016 LTIP 2015 LTIP 2014 LTIP 2013As at January 1, 2016 – 30,572 21,861 30,698Granted 22,240 – – –Cancelled – -6,801 -4,741 -30,698Vested – – – –As at December 31, 2016 22,240 23,771 17,120 –
Estimated number of performance shares as at January 1, 2016 – 178,769 132,981 204,521New incentive plan 62,587 – – –Allotment – – – -75,805Cancelled – -105,624 -82,770 -128,716Estimated number of performance shares as at December 31, 2016 62,587 73,145 50,211 –
Estimated number of outstanding share optionsAs at January 1, 2015 – 21,861 30,698Granted 30,572 – –Vested – – –As at December 31, 2015 30,572 21,861 30,698
Estimated number of performance shares as at January 1, 2015 – 132,981 204,521New incentive plan 178,769 – –Allotment – – –Cancelled – – –Estimated number of performance shares as at December 31, 2015 178,769 132,981 204,521
Note 19 Interest-bearing liabilities
EUR thousand 2016 2015EUR revolving credit facility 22,400 20,000USD revolving credit facility 5,487 20,208Other loans 2,921 2,943Unamortized transaction costs – -406
30,808 42,745Finance leases 19 141Total 30,827 42,886Non-current interest-bearing liabilities 27,887 34,894Current interest-bearing liabilities 2,940 7,992Total 30,827 42,886
On March 9, 2016, Transcom signed a syndicated credit agreement with ING, Nordea and SEB to implement a EUR 90,000 thousand multi-currency revolving credit facil-ity. The facility has a tenor of three years with an option to extend for one year. The purpose of the new agreement is to refinance the existing facility which was due to expire in January 2017. Interest rates in the facility are based on IBOR and EURIBOR plus margins. The Company is also committed under this agreement to maintain cer-tain financial ratios within agreed limits. The loan is unsecured. There was no breach of covenants in 2016. In the event of change of control the syndicated facility will need to be renegotiated or replaced by a new credit facility. Due to the change of ownership of the Company in 2017, the Company has in beginning of 2017 termi-nated its credit facility and together with Altor AB signed a new credit facility with another bank.
As of December 31, 2016, an amount of EUR 22,400 thousand and USD 6,000 thousand was drawn (December 31, 2015: EUR 20,000 thousand and USD 22,000 thousand). In addition, an equivalent of EUR 137 thousand of the facility is utilized to cover the issuance of bank guarantees. Net proceeds from borrowing during 2016 was EUR 2,400 thousand, and net repayment of borrowings in USD was USD 16,000 thousand. An unused amount of EUR 61,771 thousand on the revolving borrowing facility exists on December 31, 2016 (December 31, 2015: EUR 17,382 thousand in previous facility). In addition to the credit facility, a local short-term loan amounted to EUR 1,452 thousand as of December 31, 2016.
The table below shows the maturity profile of the Groups’s interest bearing liabilites including interests:
2016 2015EUR thousandLess than six months 1,467 3,338Between six and twelve months 1,473 4,286Between one and two years 5 36,089Between two and five years* 28,781 –Total 31,726 43,713
* The syndicated credit agreement matures March 9, 2019.
On October 23, 2015, Transcom entered into a Swap Agreement with Nordea Bank AB (publ) (“Nordea”). As per the shareholders’ authorization, the purpose of the agreement is to secure the obligation of the Company to deliver ordinary shares under the LTIP 2015 via a swap arrangement. Under the Swap Agreement, Nordea will deliver the ordinary shares to the participants in the LTIP 2015 once vested. In the meantime, while the shares are in Nordea’s custody, the Company will pay interest on the cost for purchasing the ordinary shares. Any dividend on the ordinary shares dur-ing such period will be refunded to the Company. Any remaining ordinary shares not delivered to the participants will be sold on Nasdaq Stockholm. Any profit will be paid to the Company, who also will carry the risk of potential losses. As a result of the LTIP 2015, a maximum of 220,000 ordinary shares in the Company may be allotted, including compensation for dividends paid (if any) on the underlying share. The swap agreement was rolled over in 2016 for another 12 months. A liability amounting to EUR 1,503 thousand is recorded per December 31, 2016. (December 31, 2015: EUR 1,865 thousand).
As at 27 March 2017 Transcom reported that the change in ownership has trig-gered a change of control clause in the Company’s long-term incentive programs (LTIP 2014, 2015 and 2016), and Transcom’s board of directors has therefore, in accordance with the terms of the programs, resolved to replace the estimated num-ber of shares to be vested by a cash payment to the participants amounting to approximately EUR 1.3 million in total. In addition, the Swap Agreement connected to LTIP 2015 was terminated.
33
Notes to the Consolidated financial statements
Transcom Annual Report 2016
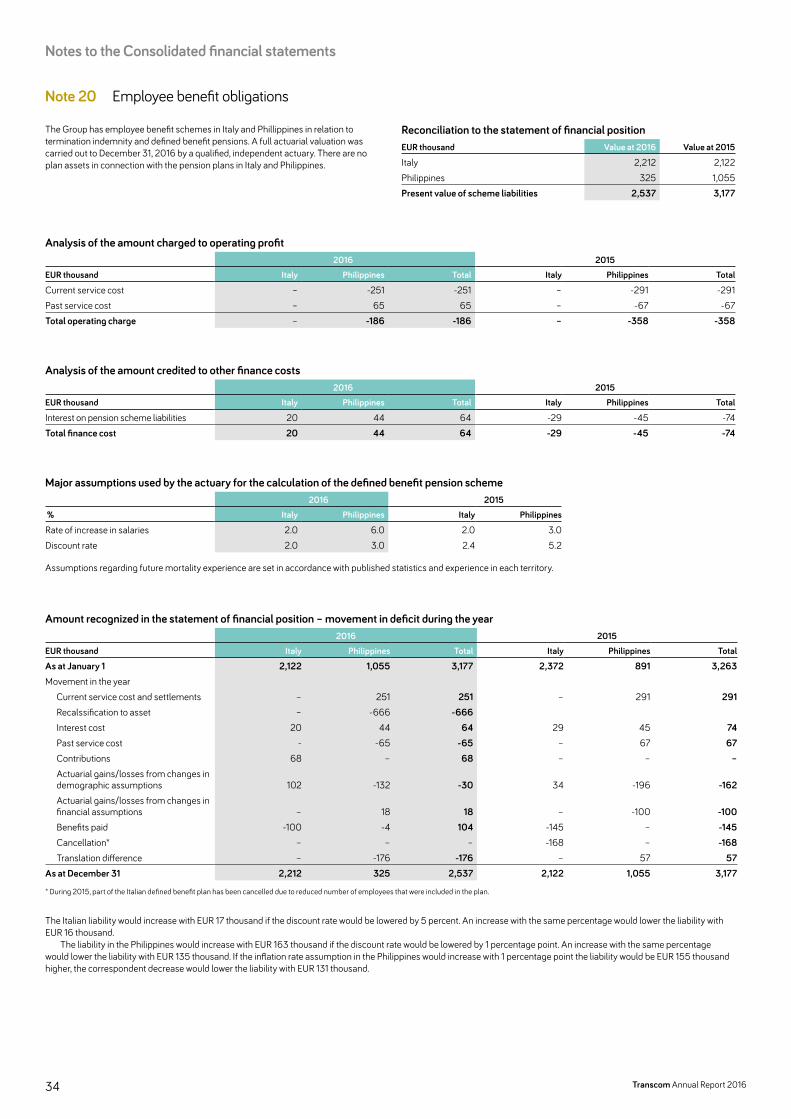
Note 20 Employee benefit obligations
The Group has employee benefit schemes in Italy and Phillippines in relation to termination indemnity and defined benefit pensions. A full actuarial valuation was carried out to December 31, 2016 by a qualified, independent actuary. There are no plan assets in connection with the pension plans in Italy and Philippines.
Reconciliation to the statement of financial positionEUR thousand Value at 2016 Value at 2015
Italy 2,212 2,122Philippines 325 1,055Present value of scheme liabilities 2,537 3,177
Analysis of the amount charged to operating profit2016 2015
EUR thousand Italy Philippines Total Italy Philippines Total
Current service cost – -251 -251 – -291 -291Past service cost – 65 65 – -67 -67Total operating charge – -186 -186 – -358 -358
Analysis of the amount credited to other finance costs2016 2015
EUR thousand Italy Philippines Total Italy Philippines Total
Interest on pension scheme liabilities 20 44 64 -29 -45 -74Total finance cost 20 44 64 -29 -45 -74
Major assumptions used by the actuary for the calculation of the defined benefit pension scheme2016 2015
% Italy Philippines Italy Philippines
Rate of increase in salaries 2.0 6.0 2.0 3.0Discount rate 2.0 3.0 2.4 5.2
Assumptions regarding future mortality experience are set in accordance with published statistics and experience in each territory.
Amount recognized in the statement of financial position – movement in deficit during the year2016 2015
EUR thousand Italy Philippines Total Italy Philippines Total
As at January 1 2,122 1,055 3,177 2,372 891 3,263Movement in the year
Current service cost and settlements – 251 251 – 291 291Recalssification to asset – -666 -666Interest cost 20 44 64 29 45 74Past service cost - -65 -65 – 67 67Contributions 68 – 68 – – –Actuarial gains/losses from changes in demographic assumptions 102 -132 -30 34 -196 -162Actuarial gains/losses from changes in financial assumptions – 18 18 – -100 -100Benefits paid -100 -4 104 -145 – -145Cancellation* – – – -168 – -168Translation difference – -176 -176 – 57 57
As at December 31 2,212 325 2,537 2,122 1,055 3,177
* During 2015, part of the Italian defined benefit plan has been cancelled due to reduced number of employees that were included in the plan.
The Italian liability would increase with EUR 17 thousand if the discount rate would be lowered by 5 percent. An increase with the same percentage would lower the liability with EUR 16 thousand.
The liability in the Philippines would increase with EUR 163 thousand if the discount rate would be lowered by 1 percentage point. An increase with the same percentage would lower the liability with EUR 135 thousand. If the inflation rate assumption in the Philippines would increase with 1 percentage point the liability would be EUR 155 thousand higher, the correspondent decrease would lower the liability with EUR 131 thousand.
Notes to the Consolidated financial statements
34 Transcom Annual Report 2016
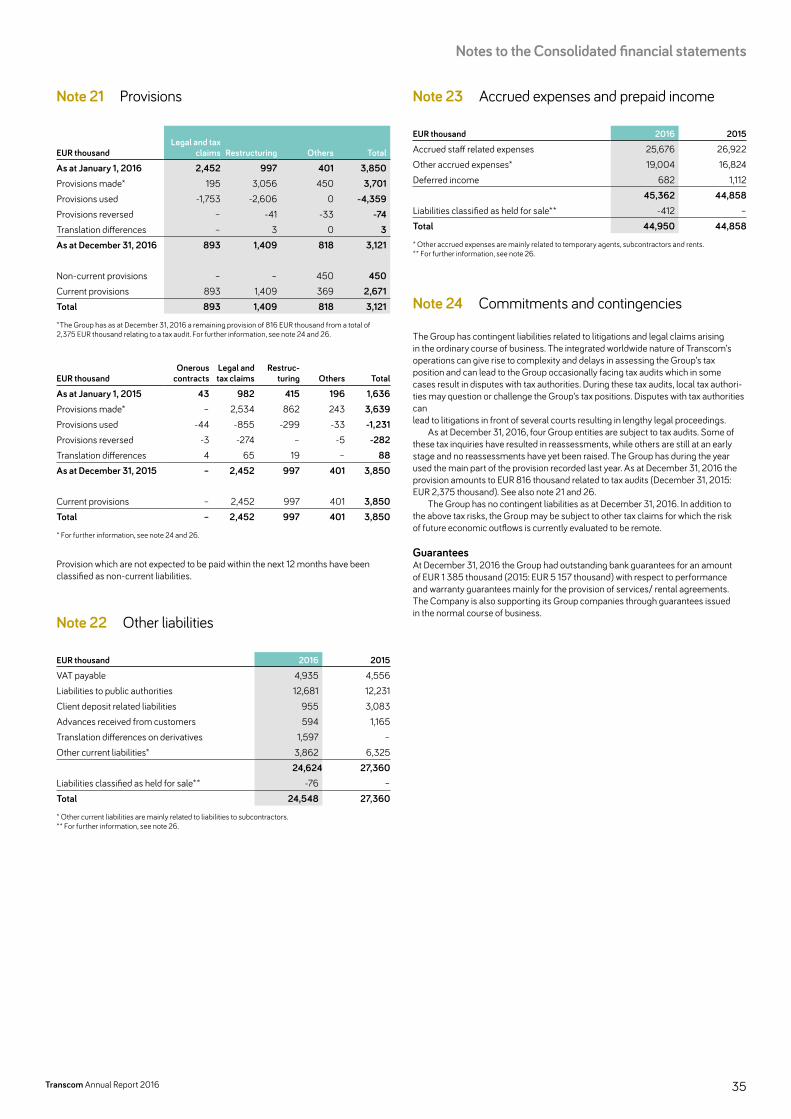
Note 21 Provisions
EUR thousandLegal and tax
claims Restructuring Others Total
As at January 1, 2016 2,452 997 401 3,850Provisions made* 195 3,056 450 3,701Provisions used -1,753 -2,606 0 -4,359Provisions reversed – -41 -33 -74Translation differences – 3 0 3As at December 31, 2016 893 1,409 818 3,121
Non-current provisions – – 450 450Current provisions 893 1,409 369 2,671Total 893 1,409 818 3,121
*The Group has as at December 31, 2016 a remaining provision of 816 EUR thousand from a total of 2,375 EUR thousand relating to a tax audit. For further information, see note 24 and 26.
EUR thousandOnerous
contractsLegal and tax claims
Restruc-turing Others Total
As at January 1, 2015 43 982 415 196 1,636Provisions made* – 2,534 862 243 3,639Provisions used -44 -855 -299 -33 -1,231Provisions reversed -3 -274 – -5 -282Translation differences 4 65 19 – 88As at December 31, 2015 – 2,452 997 401 3,850
Current provisions – 2,452 997 401 3,850Total – 2,452 997 401 3,850
* For further information, see note 24 and 26.
Provision which are not expected to be paid within the next 12 months have been classified as non-current liabilities.
Note 22 Other liabilities
EUR thousand 2016 2015
VAT payable 4,935 4,556Liabilities to public authorities 12,681 12,231Client deposit related liabilities 955 3,083Advances received from customers 594 1,165Translation differences on derivatives 1,597 –Other current liabilities* 3,862 6,325
24,624 27,360Liabilities classified as held for sale** -76 –Total 24,548 27,360
* Other current liabilities are mainly related to liabilities to subcontractors.** For further information, see note 26.
Note 23 Accrued expenses and prepaid income
EUR thousand 2016 2015
Accrued staff related expenses 25,676 26,922Other accrued expenses* 19,004 16,824Deferred income 682 1,112
45,362 44,858Liabilities classified as held for sale** -412 –Total 44,950 44,858
* Other accrued expenses are mainly related to temporary agents, subcontractors and rents.** For further information, see note 26.
Note 24 Commitments and contingencies
The Group has contingent liabilities related to litigations and legal claims arising in the ordinary course of business. The integrated worldwide nature of Transcom’s operations can give rise to complexity and delays in assessing the Group’s tax position and can lead to the Group occasionally facing tax audits which in some cases result in disputes with tax authorities. During these tax audits, local tax authori-ties may question or challenge the Group’s tax positions. Disputes with tax authorities can lead to litigations in front of several courts resulting in lengthy legal proceedings.
As at December 31, 2016, four Group entities are subject to tax audits. Some of these tax inquiries have resulted in reassessments, while others are still at an early stage and no reassessments have yet been raised. The Group has during the year used the main part of the provision recorded last year. As at December 31, 2016 the provision amounts to EUR 816 thousand related to tax audits (December 31, 2015: EUR 2,375 thousand). See also note 21 and 26.
The Group has no contingent liabilities as at December 31, 2016. In addition to the above tax risks, the Group may be subject to other tax claims for which the risk of future economic outflows is currently evaluated to be remote.
Guarantees At December 31, 2016 the Group had outstanding bank guarantees for an amount of EUR 1 385 thousand (2015: EUR 5 157 thousand) with respect to performance and warranty guarantees mainly for the provision of services/ rental agreements. The Company is also supporting its Group companies through guarantees issued in the normal course of business.
35
Notes to the Consolidated financial statements
Transcom Annual Report 2016
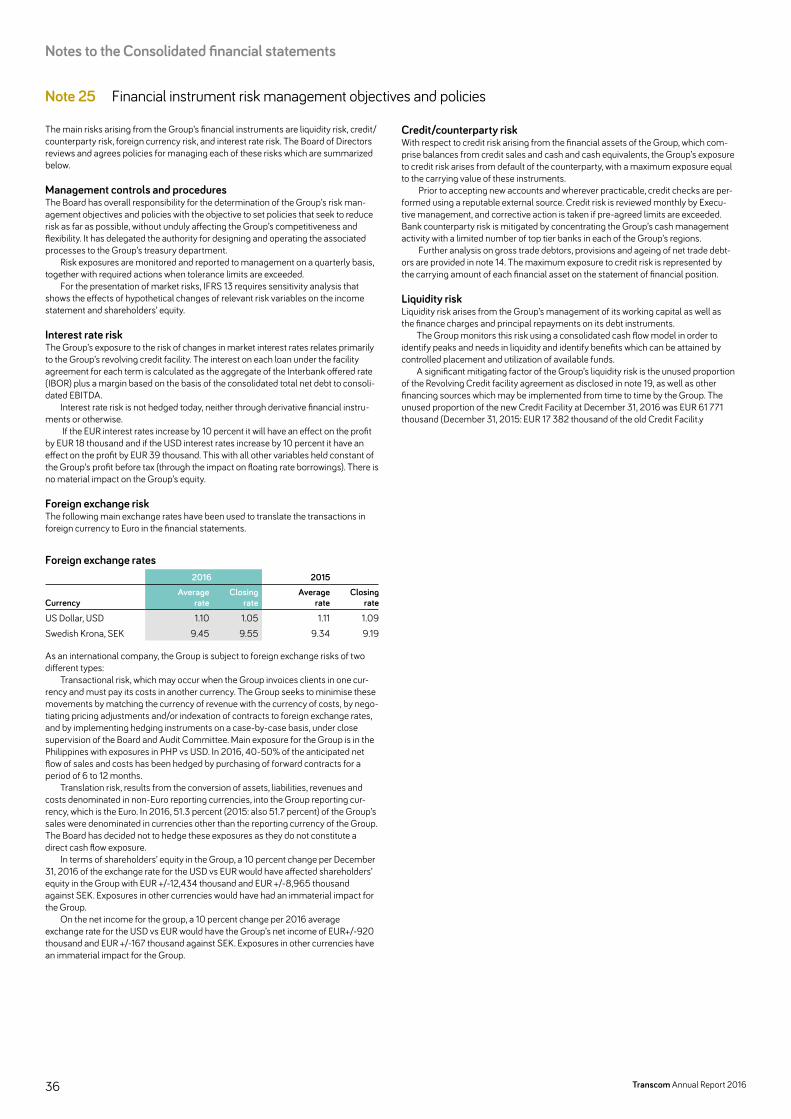
Note 25 Financial instrument risk management objectives and policies
The main risks arising from the Group’s financial instruments are liquidity risk, credit/counterparty risk, foreign currency risk, and interest rate risk. The Board of Directors reviews and agrees policies for managing each of these risks which are summarized below.
Management controls and proceduresThe Board has overall responsibility for the determination of the Group’s risk man-agement objectives and policies with the objective to set policies that seek to reduce risk as far as possible, without unduly affecting the Group’s competitiveness and flexibility. It has delegated the authority for designing and operating the associated processes to the Group’s treasury department.
Risk exposures are monitored and reported to management on a quarterly basis, together with required actions when tolerance limits are exceeded.
For the presentation of market risks, IFRS 13 requires sensitivity analysis that shows the effects of hypothetical changes of relevant risk variables on the income statement and shareholders’ equity.
Interest rate riskThe Group’s exposure to the risk of changes in market interest rates relates primarily to the Group’s revolving credit facility. The interest on each loan under the facility agreement for each term is calculated as the aggregate of the Interbank offered rate (IBOR) plus a margin based on the basis of the consolidated total net debt to consoli-dated EBITDA.
Interest rate risk is not hedged today, neither through derivative financial instru-ments or otherwise.
If the EUR interest rates increase by 10 percent it will have an effect on the profit by EUR 18 thousand and if the USD interest rates increase by 10 percent it have an effect on the profit by EUR 39 thousand. This with all other variables held constant of the Group’s profit before tax (through the impact on floating rate borrowings). There is no material impact on the Group’s equity.
Foreign exchange riskThe following main exchange rates have been used to translate the transactions in foreign currency to Euro in the financial statements.
Foreign exchange rates2016 2015
CurrencyAverage
rateClosing
rateAverage
rateClosing
rate
US Dollar, USD 1.10 1.05 1.11 1.09Swedish Krona, SEK 9.45 9.55 9.34 9.19
As an international company, the Group is subject to foreign exchange risks of two different types:
Transactional risk, which may occur when the Group invoices clients in one cur-rency and must pay its costs in another currency. The Group seeks to minimise these movements by matching the currency of revenue with the currency of costs, by nego-tiating pricing adjustments and/or indexation of contracts to foreign exchange rates, and by implementing hedging instruments on a case-by-case basis, under close supervision of the Board and Audit Committee. Main exposure for the Group is in the Philippines with exposures in PHP vs USD. In 2016, 40-50% of the anticipated net flow of sales and costs has been hedged by purchasing of forward contracts for a period of 6 to 12 months.
Translation risk, results from the conversion of assets, liabilities, revenues and costs denominated in non-Euro reporting currencies, into the Group reporting cur-rency, which is the Euro. In 2016, 51.3 percent (2015: also 51.7 percent) of the Group’s sales were denominated in currencies other than the reporting currency of the Group. The Board has decided not to hedge these exposures as they do not constitute a direct cash flow exposure.
In terms of shareholders’ equity in the Group, a 10 percent change per December 31, 2016 of the exchange rate for the USD vs EUR would have affected shareholders’ equity in the Group with EUR +/-12,434 thousand and EUR +/-8,965 thousand against SEK. Exposures in other currencies would have had an immaterial impact for the Group.
On the net income for the group, a 10 percent change per 2016 average exchange rate for the USD vs EUR would have the Group’s net income of EUR+/-920 thousand and EUR +/-167 thousand against SEK. Exposures in other currencies have an immaterial impact for the Group.
Credit/counterparty risk With respect to credit risk arising from the financial assets of the Group, which com-prise balances from credit sales and cash and cash equivalents, the Group’s exposure to credit risk arises from default of the counterparty, with a maximum exposure equal to the carrying value of these instruments.
Prior to accepting new accounts and wherever practicable, credit checks are per-formed using a reputable external source. Credit risk is reviewed monthly by Execu-tive management, and corrective action is taken if pre-agreed limits are exceeded. Bank counterparty risk is mitigated by concentrating the Group’s cash management activity with a limited number of top tier banks in each of the Group’s regions.
Further analysis on gross trade debtors, provisions and ageing of net trade debt-ors are provided in note 14. The maximum exposure to credit risk is represented by the carrying amount of each financial asset on the statement of financial position.
Liquidity risk Liquidity risk arises from the Group’s management of its working capital as well as the finance charges and principal repayments on its debt instruments.
The Group monitors this risk using a consolidated cash flow model in order to identify peaks and needs in liquidity and identify benefits which can be attained by controlled placement and utilization of available funds.
A significant mitigating factor of the Group’s liquidity risk is the unused proportion of the Revolving Credit facility agreement as disclosed in note 19, as well as other financing sources which may be implemented from time to time by the Group. The unused proportion of the new Credit Facility at December 31, 2016 was EUR 61 771 thousand (December 31, 2015: EUR 17 382 thousand of the old Credit Facilit.y
Notes to the Consolidated financial statements
36 Transcom Annual Report 2016
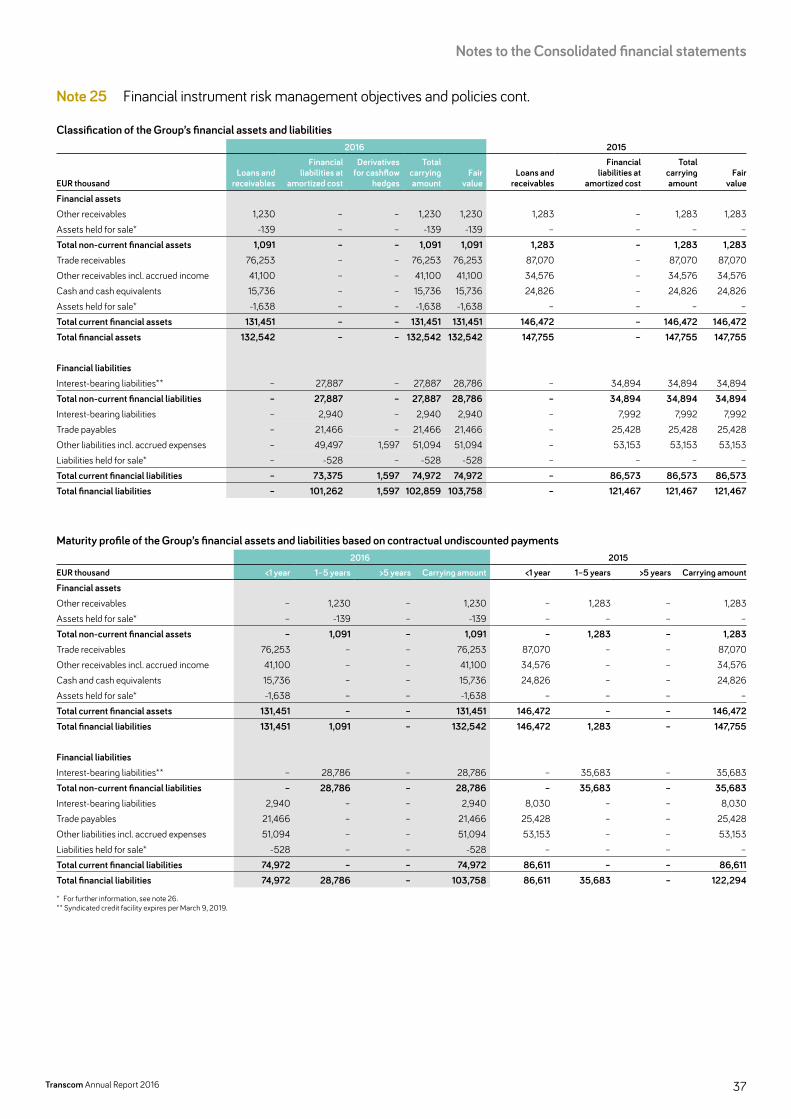
Note 25 Financial instrument risk management objectives and policies cont.
Classification of the Group’s financial assets and liabilities2016 2015
EUR thousandLoans and
receivables
Financial liabilities at
amortized cost
Derivatives for cashflow
hedges
Total carrying amount
Fair value
Loans and receivables
Financial liabilities at
amortized cost
Total carrying amount
Fair value
Financial assetsOther receivables 1,230 – – 1,230 1,230 1,283 – 1,283 1,283Assets held for sale* -139 – – -139 -139 – – – –Total non-current financial assets 1,091 – – 1,091 1,091 1,283 – 1,283 1,283Trade receivables 76,253 – – 76,253 76,253 87,070 – 87,070 87,070Other receivables incl. accrued income 41,100 – – 41,100 41,100 34,576 – 34,576 34,576Cash and cash equivalents 15,736 – – 15,736 15,736 24,826 – 24,826 24,826Assets held for sale* -1,638 – – -1,638 -1,638 – – – –Total current financial assets 131,451 – – 131,451 131,451 146,472 – 146,472 146,472Total financial assets 132,542 – – 132,542 132,542 147,755 – 147,755 147,755
Financial liabilitiesInterest-bearing liabilities** – 27,887 – 27,887 28,786 – 34,894 34,894 34,894Total non-current financial liabilities – 27,887 – 27,887 28,786 – 34,894 34,894 34,894Interest-bearing liabilities – 2,940 – 2,940 2,940 – 7,992 7,992 7,992Trade payables – 21,466 – 21,466 21,466 – 25,428 25,428 25,428Other liabilities incl. accrued expenses – 49,497 1,597 51,094 51,094 – 53,153 53,153 53,153Liabilities held for sale* – -528 – -528 -528 – – – –Total current financial liabilities – 73,375 1,597 74,972 74,972 – 86,573 86,573 86,573Total financial liabilities – 101,262 1,597 102,859 103,758 – 121,467 121,467 121,467
Maturity profile of the Group’s financial assets and liabilities based on contractual undiscounted payments2016 2015
EUR thousand <1 year 1–5 years >5 years Carrying amount <1 year 1–5 years >5 years Carrying amount
Financial assetsOther receivables – 1,230 – 1,230 – 1,283 – 1,283Assets held for sale* – -139 – -139 – – – –Total non-current financial assets – 1,091 – 1,091 – 1,283 – 1,283Trade receivables 76,253 – – 76,253 87,070 – – 87,070Other receivables incl. accrued income 41,100 – – 41,100 34,576 – – 34,576Cash and cash equivalents 15,736 – – 15,736 24,826 – – 24,826Assets held for sale* -1,638 – – -1,638 – – – –Total current financial assets 131,451 – – 131,451 146,472 – – 146,472Total financial liabilities 131,451 1,091 – 132,542 146,472 1,283 – 147,755
Financial liabilitiesInterest-bearing liabilities** – 28,786 – 28,786 – 35,683 – 35,683Total non-current financial liabilities – 28,786 – 28,786 – 35,683 – 35,683Interest-bearing liabilities 2,940 – – 2,940 8,030 – – 8,030Trade payables 21,466 – – 21,466 25,428 – – 25,428Other liabilities incl. accrued expenses 51,094 – – 51,094 53,153 – – 53,153Liabilities held for sale* -528 – – -528 – – – –Total current financial liabilities 74,972 – – 74,972 86,611 – – 86,611Total financial liabilities 74,972 28,786 – 103,758 86,611 35,683 – 122,294
** For further information, see note 26. ** Syndicated credit facility expires per March 9, 2019.
37
Notes to the Consolidated financial statements
Transcom Annual Report 2016

Note 26 Significant disposals and restructuring
2016EUR thousand CMS Denmark
Consideration received 13,000Total non-current assets –Total current assets 11,945Total assets disposed 11,945Total non-current liabilities -313Total current liabilities -2,755Total liabilities disposed -3,068Net carrying value 8,877Currency effects 2Provision -500Transaction costs -95Net capital gain/loss 3,530Consideration received 13,000Cash and cash equivalents disposed -283Transaction costs -95Net cash flow from disposals of subsidiary 12,622
2015EUR thousand Austria Germany Total
Post-settlement adjustments 141 -250 -109 Adjusted net capital gain/loss 141 -250 -109Consideration received/repaid 141 -465 -324Adjusted net cash flow from dis-posals of subsidiary 141 -465 -324
On March 3, 2016 Transcom divested the Danish Credit Management Services operations (CMS Denmark), a part of region North Europe, for an equity value of EUR 13,000 thousand to an investment company, minority-owned by the current man-agement team. Net capital gain recorded in 2016 amounted to EUR 3,530 thousand and a positive net cash flow effect of EUR 12,622 thousand.
In January 2017, Transcom signed an agreement to divest its Peruvian business, a part of region Latin America, to BPO Consulting S.A.C. for, an equity value of EUR 1,000 thousand. The transaction was closed in January 2017. Consequently the assets and liabilities referring to the entity were reported as Assets and Liabilities classified as held for sale as at December 31, 2016.
There were no disposals during 2015. The net capital gain / loss and the net cash flow from disposals of subsidiaries recorded in 2015 related to previous year’s trans-actions. In 2015 Transcom paid a post-settlement adjustment of EUR 0.5 million related to the divestment of CMS Germany in 2013, of which EUR 0.3 million was recorded as a cost in 2015 (EUR 0.2 million was recorded as a cost in 2014). In 2015 Transcom received a final settlement of EUR 0.1 million related to the previously divested operation in Belgium from 2013.
Restructuring costs At the beginning of 2016 Transcom made a number of changes to its regional and management structure. Related restructuring costs amounting to €2,715 thousand were recorded as follows, €1,494 thousand in Cost of sales, €73 thousand in Market-ing expenses and €1,148 thousand in Administrative expenses. In 2016 also an addi-tional restructuring cost of €341 related to Colombia, was recorded in the caption Administrative expenses.
Restructuring cost amounting to EUR 2,281 thousand was recorded in 2015 related to the site closure in Colombia. Per December 31, 2015, the provision amounted to EUR 862 thousand. See also note 21.
EUR thousand 2016 2015
Cost of sales -1,494 -212Marketing expenses -73 -9Administrative expenses -1,489 -689Other operating expenses – -1,371Total -3,056 -2,281
Note 27 Related party transactions
For January to December 2016 no material related party transactions are to be reported.
Previously Investment AB Kinnevik and subsidiaries were defined as related party up until March 20, 2015. Transactions up until this date with Investment AB Kinnevik were as follows: the Group’s sales revenue from the Tele2 companies amounted to EUR 26,748 thousand. Operating expenses, mainly for telephone services and switch, paid to Tele2 group companies amounted to EUR 139 thousand.
Note 28 Events after the reporting period
On January 9, 2017, Transcom announced the successful closing of the divestment of its operations in Peru for an equity value of EUR 1.0 million to BPO Consulting S.A.C.
On 13 March 2017, Altor AB announced that they will complete the public takeo-ver offer to the shareholders of Transcom WorldWide AB (publ). After completion of the offer, Altor holds more than 90 percent of the shares and votes in Transcom and has notified Transcom’s board of directors that Altor has resolved to call for compul-sory redemption of the remaining shares in the Company. In light of the above, Transcom’s board of directors no longer finds it motivated for the Company to remain listed and has therefore applied for delisting of the Company’s shares from Nasdaq Stockholm. Nasdaq Stockholm has approved the application and resolved that the last day of trading in the Transcom share will be Monday 10 April, 2017.
The change in ownership has triggered a change of control clause in the Compa-ny’s long-term incentive programs (LTIP 2014, 2015 and 2016), and Transcom’s board of directors has therefore, in accordance with the terms of the programs, resolved to replace the estimated number of shares to be vested by a cash payment to the participants amounting to approximately EUR 1.3 million in total. In addition, the Swap agreement connected to LTIP 2015 was terminated.
Given the change of ownership of the Company, the Company terminated its credit facility and has together with Altor AB signed a new credit facility with another bank.
Notes to the Consolidated financial statements
38 Transcom Annual Report 2016
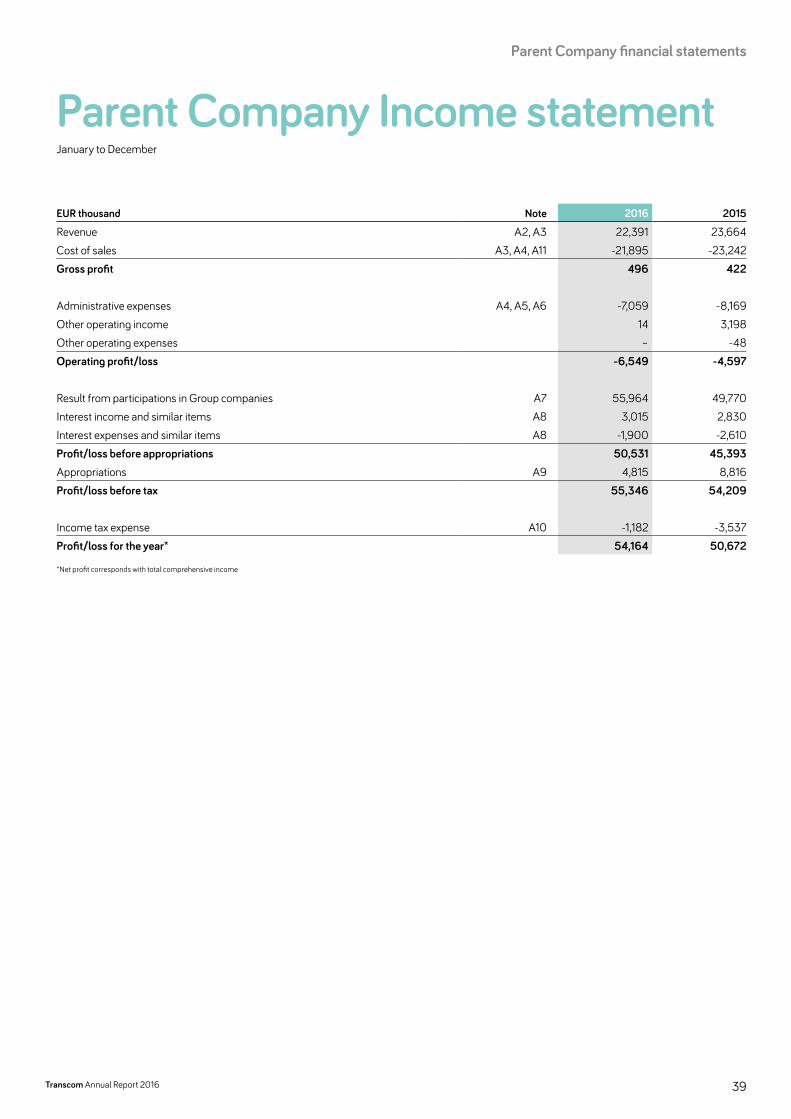
Parent Company Income statementJanuary to December
EUR thousand Note 2016 2015
Revenue A2, A3 22,391 23,664Cost of sales A3, A4, A11 -21,895 -23,242Gross profit 496 422
Administrative expenses A4, A5, A6 -7,059 -8,169Other operating income 14 3,198Other operating expenses – -48Operating profit/loss -6,549 -4,597
Result from participations in Group companies A7 55,964 49,770Interest income and similar items A8 3,015 2,830Interest expenses and similar items A8 -1,900 -2,610Profit/loss before appropriations 50,531 45,393Appropriations A9 4,815 8,816Profit/loss before tax 55,346 54,209
Income tax expense A10 -1,182 -3,537Profit/loss for the year* 54,164 50,672
*Net profit corresponds with total comprehensive income
39
Parent Company financial statements
Transcom Annual Report 2016

Parent Company Balance sheetas at December 31
EUR thousand Note 2016 2015
ASSETSNon-current assetsIntangible assets A12 1,972 1,441Tangible assets A13 227 509Financial assets
Shares in Group companies A14 185,030 94,720Receivables from Group companies 16,189 44,884
Total financial assets A19 201,219 139,604Total non-current assets 203,418 141,554
Current assetsTrade receivables A15 923 889Income tax receivables 52 41Receivables from Group companies 95,146 112,229Other receivables 112 964Prepaid expenses and accrued income A16 555 881Total receivables 96,788 115,004Cash and cash equivalents 2,457 42Total current assets A19 99,245 115,046TOTAL ASSETS 302,663 256,600
Parent Company financial statements
40 Transcom Annual Report 2016
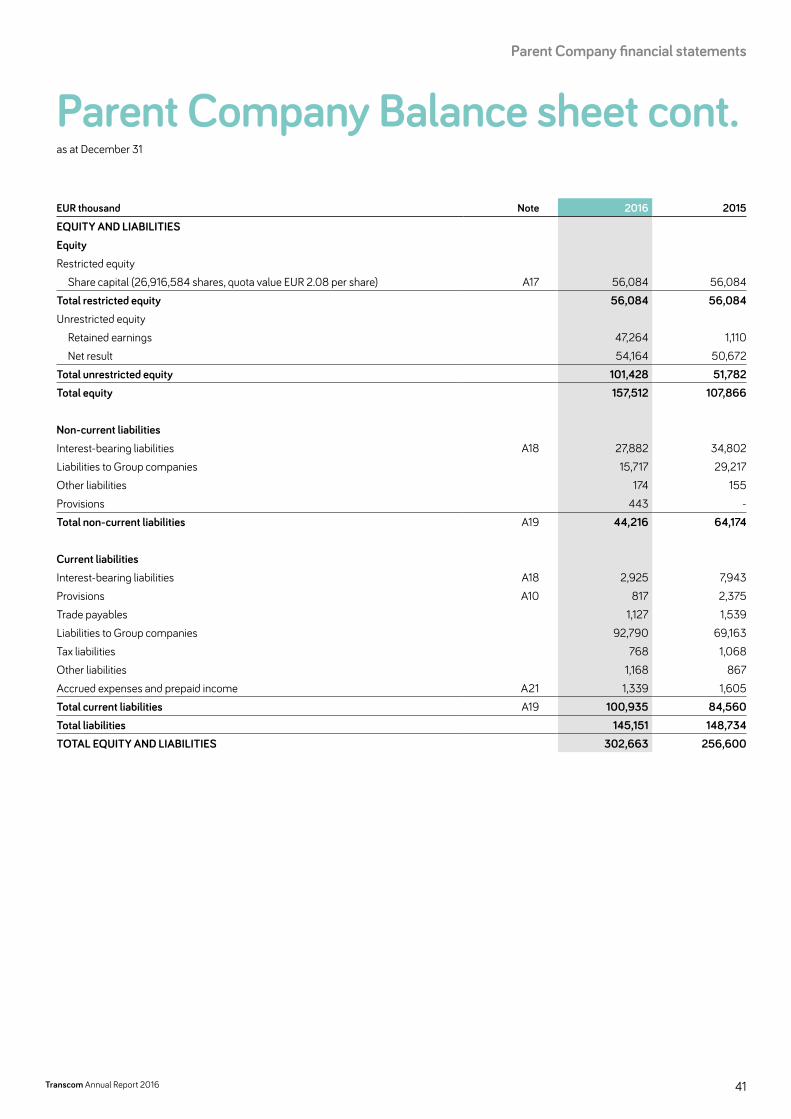
Parent Company Balance sheet cont.as at December 31
EUR thousand Note 2016 2015
EQUITY AND LIABILITIESEquityRestricted equity
Share capital (26,916,584 shares, quota value EUR 2.08 per share) A17 56,084 56,084Total restricted equity 56,084 56,084Unrestricted equity
Retained earnings 47,264 1,110Net result 54,164 50,672
Total unrestricted equity 101,428 51,782Total equity 157,512 107,866
Non-current liabilitiesInterest-bearing liabilities A18 27,882 34,802Liabilities to Group companies 15,717 29,217Other liabilities 174 155Provisions 443 -Total non-current liabilities A19 44,216 64,174
Current liabilitiesInterest-bearing liabilities A18 2,925 7,943Provisions A10 817 2,375Trade payables 1,127 1,539Liabilities to Group companies 92,790 69,163Tax liabilities 768 1,068Other liabilities 1,168 867Accrued expenses and prepaid income A21 1,339 1,605Total current liabilities A19 100,935 84,560Total liabilities 145,151 148,734TOTAL EQUITY AND LIABILITIES 302,663 256,600
41
Parent Company financial statements
Transcom Annual Report 2016

Parent Company Statement of changes in equity
EUR thousand Note
Total numberof shares
(thousand)
Number ofshares held by
the Parent(thousand)
Share capital
Retained earnings
incl. Profit/lossfor the year
Total equity
As at January 1, 2015 26,707 677 56,084 2,691 58,775Profit/loss for the year – – – 50,672 50,672Share swap A18 – – – -1,939 -1,939Allotment of shares (LTIP 2012) A17, 18 – -108 – – –Share-based payments A17, 18 – – – 358 358As at December 31, 2015 26,707 569 56,084 51,782 107,866
As at January 1, 2016 26,707 569 56,084 51,782 107,866Profit/loss for the year – – – 54,164 54,164Allotment of shares (LTIP 2013) A17, 18 – -76 – – –Issue and repurchase of shares A17, 18 210 210 – – –Share-based payments A17, 18 – – – 384 384Dividend A17 – – – -4,902 -4,902As at December 31, 2016 A17, 18 26,917 703 56,084 101,428 157,512
Parent Company financial statements
42 Transcom Annual Report 2016
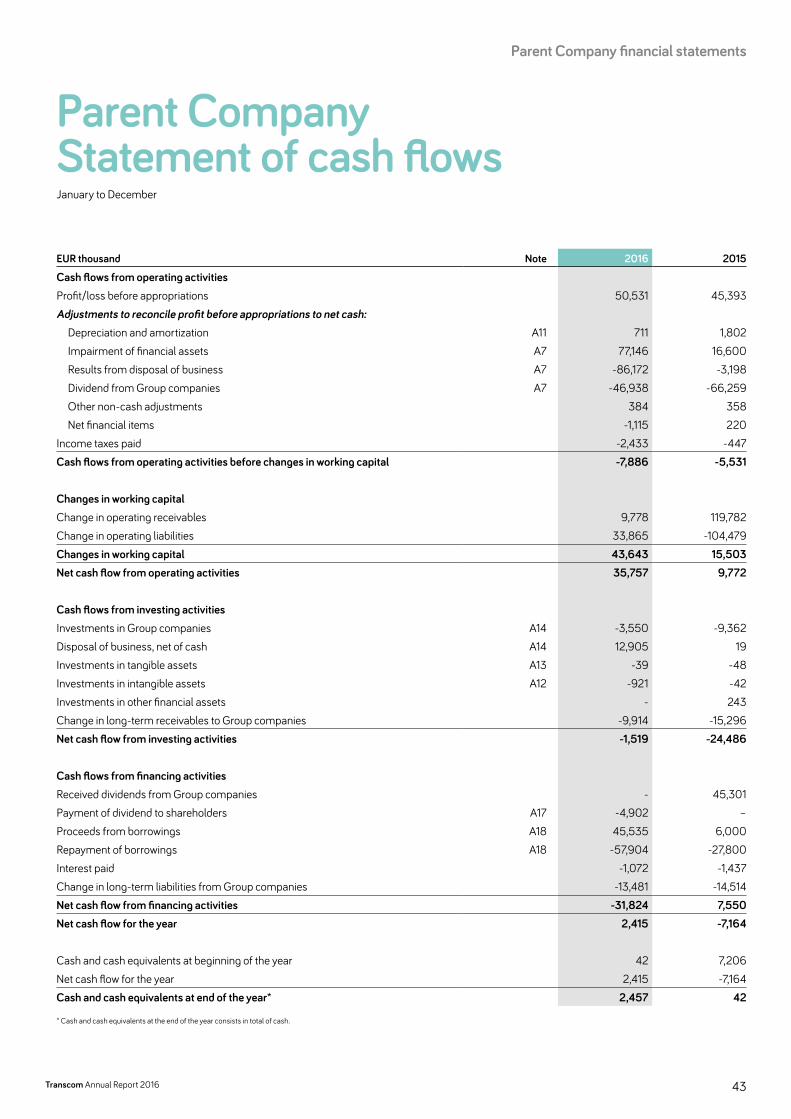
Parent Company Statement of cash flowsJanuary to December
EUR thousand Note 2016 2015
Cash flows from operating activitiesProfit/loss before appropriations 50,531 45,393Adjustments to reconcile profit before appropriations to net cash:
Depreciation and amortization A11 711 1,802Impairment of financial assets A7 77,146 16,600Results from disposal of business A7 -86,172 -3,198Dividend from Group companies A7 -46,938 -66,259Other non-cash adjustments 384 358Net financial items -1,115 220
Income taxes paid -2,433 -447Cash flows from operating activities before changes in working capital -7,886 -5,531
Changes in working capitalChange in operating receivables 9,778 119,782Change in operating liabilities 33,865 -104,479Changes in working capital 43,643 15,503Net cash flow from operating activities 35,757 9,772
Cash flows from investing activitiesInvestments in Group companies A14 -3,550 -9,362Disposal of business, net of cash A14 12,905 19Investments in tangible assets A13 -39 -48Investments in intangible assets A12 -921 -42Investments in other financial assets - 243Change in long-term receivables to Group companies -9,914 -15,296Net cash flow from investing activities -1,519 -24,486
Cash flows from financing activitiesReceived dividends from Group companies - 45,301Payment of dividend to shareholders A17 -4,902 –Proceeds from borrowings A18 45,535 6,000Repayment of borrowings A18 -57,904 -27,800Interest paid -1,072 -1,437Change in long-term liabilities from Group companies -13,481 -14,514Net cash flow from financing activities -31,824 7,550Net cash flow for the year 2,415 -7,164
Cash and cash equivalents at beginning of the year 42 7,206Net cash flow for the year 2,415 -7,164Cash and cash equivalents at end of the year* 2,457 42
* Cash and cash equivalents at the end of the year consists in total of cash.
43
Parent Company financial statements
Transcom Annual Report 2016

Parent Company Notes to the financial statementsNote A1 Parent Company’s accounting
and valuation policiesTranscom WorldWide AB (publ) (“Parent Company”) corporate id number 556880-1277 is a registered company domiciled in Stockholm, Sweden. The address of the Company’s headquarter is Gjörwellsgatan 30, SE-112 59 Stockholm.
The Parent Company has prepared and presented the annual report according to the Annual Accounts Act (1995:1554) and recommendation RFR 2 Accounting for legal entities from the Swedish Financial Reporting Board. RFR 2 means that the Parent Company, in the annual report for the legal entity, must apply all EU-approved IFRS and statements as far as possible within the framework of the Annual Accounts Act and taking into account the connection between reporting and taxation. The recommendation specifies exemptions and additions relative to IFRS.
The financial statements pertain January 1–December 31 for income statement items and December 31 for balance sheet items.
The financial statements are presented in Euros which is the Company’s presentation currency, rounded in thousand of Euro.
The Parent Company applies the same accounting principles as the Group except in the cases stated below.
(a) Group companiesShares in Group companies are recognized by the Parent Company at cost, including transaction costs less any impairment.
(b) Dividend from Group companies and Group contributionsDividend received from Group companies is recognized as Result from participations. Group contributions received and paid are recognized as appropriations.
(c) Development costsCosts associated with maintaining computer software programs are recognized as an expense as incurred. Development costs that are directly attributable to the design and testing of identifiable and unique software products controlled by the Group are recognized as intangible assets when the following criteria are met:• it is technically feasible to complete the software product so that it will be available
for use;• management intends to complete the software product and use or sell it;• there is an ability to use or sell the software product;• it can be demonstrated how the software product will generate probable future
economic benefits;• adequate technical, financial and other resources to complete the development and
to use or sell the software product are available; and• the expenditure attributable to the software product during its development can be
reliably measured.
Directly attributable costs that are capitalized as part of the software product, include the software development employee costs and an appropriate portion of relevant overheads.
Other development expenditures that do not meet these criteria are recognized as an expense as incurred. Development costs previously recognized as an expense are not recognized as an asset in a subsequent period.
Computer software development costs recognized as assets are amortized over their estimated useful lives, which is between 3 to 5 years.
Note A2 Revenues per market
RevenueEUR thousand 2016 2015
Europe 17,424 18,116Asia 2,907 3,900Africa 586 611North America 1,474 860South America – 177Total 22,391 23,664
Note A3 Intra-group revenues and cost of sales
2016 2015
Intra-group revenues out of total 55% 57 %Intra-group cost of sales out of total -51% -72 %
Notes to the Parent Company financial statements
44 Transcom Annual Report 2016
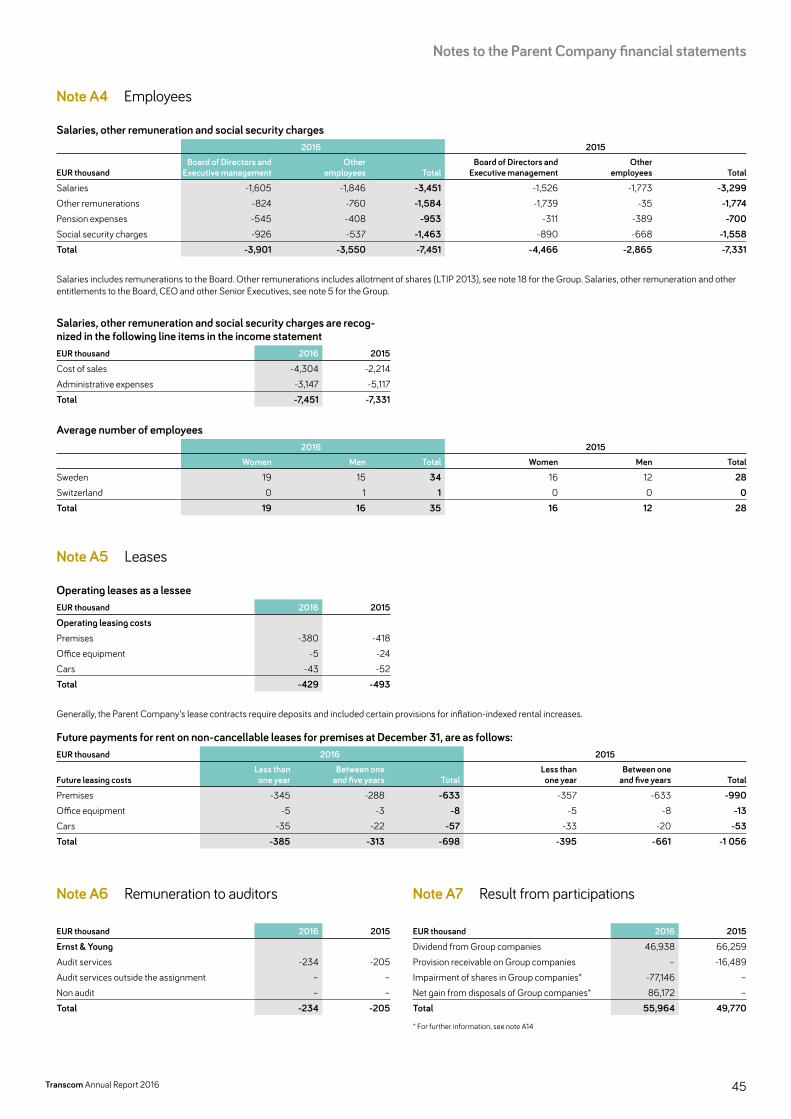
Note A4 Employees
Salaries, other remuneration and social security charges2016 2015
EUR thousandBoard of Directors and
Executive managementOther
employees TotalBoard of Directors and
Executive managementOther
employees Total
Salaries -1,605 -1,846 -3,451 -1,526 -1,773 -3,299Other remunerations -824 -760 -1,584 -1,739 -35 -1,774Pension expenses -545 -408 -953 -311 -389 -700Social security charges -926 -537 -1,463 -890 -668 -1,558Total -3,901 -3,550 -7,451 -4,466 -2,865 -7,331
Salaries includes remunerations to the Board. Other remunerations includes allotment of shares (LTIP 2013), see note 18 for the Group. Salaries, other remuneration and other entitlements to the Board, CEO and other Senior Executives, see note 5 for the Group.
Salaries, other remuneration and social security charges are recog-nized in the following line items in the income statementEUR thousand 2016 2015
Cost of sales -4,304 -2,214Administrative expenses -3,147 -5,117Total -7,451 -7,331
Average number of employees2016 2015
Women Men Total Women Men Total
Sweden 19 15 34 16 12 28Switzerland 0 1 1 0 0 0Total 19 16 35 16 12 28
Note A5 Leases
Operating leases as a lesseeEUR thousand 2016 2015
Operating leasing costsPremises -380 -418Office equipment -5 -24Cars -43 -52Total -429 -493
Generally, the Parent Company’s lease contracts require deposits and included certain provisions for inflation-indexed rental increases. Future payments for rent on non-cancellable leases for premises at December 31, are as follows:EUR thousand 2016 2015
Future leasing costsLess than one year
Between one and five years Total
Less than one year
Between one and five years Total
Premises -345 -288 -633 -357 -633 -990Office equipment -5 -3 -8 -5 -8 -13Cars -35 -22 -57 -33 -20 -53Total -385 -313 -698 -395 -661 -1 056
Note A6 Remuneration to auditors
EUR thousand 2016 2015
Ernst & YoungAudit services -234 -205Audit services outside the assignment – –Non audit – –Total -234 -205
Note A7 Result from participations
EUR thousand 2016 2015
Dividend from Group companies 46,938 66,259Provision receivable on Group companies – -16,489Impairment of shares in Group companies* -77,146 –Net gain from disposals of Group companies* 86,172 –Total 55,964 49,770
* For further information, see note A14
45
Notes to the Parent Company financial statements
Transcom Annual Report 2016

Note A8 Interest income/expense and similar items
Interest income and similar itemsEUR thousand 2016 2015
Interest income on bank deposits - 6Interest income Group companies 1,501 2,824Foreign exchange gain, net 1,514 –Total 3,015 2,830
Interest expense and similar itemsInterest expense on bank borrowings -567 -1,162Impairment financial assets - -111Foreign exchange loss, net - -272Interest expense Group companies -407 -418Other interest expense -49 -87Other financing costs -877 -560Total -1,900 -2,610
Note A9 Appropriations
EUR thousand 2016 2015
Group contribution 4,815 8,816Total 4,815 8,816
Note A10 Taxes
Income tax expenseEUR thousand 2016 2015
Current income tax on profit/loss for the year -1,445 -875Adjustments in respect of prior years 177 -2,662Current taxes -1,268 -3,537 Current year origination and reversal of temporary differences 86 0Deferred taxes 86 0Income tax expense -1,182 -3,537
Effective tax rateA reconciliation of the statutory tax rate to the Company’s effective tax rate applicable to income from continuous operations was:
EUR thousand 2016 % 2015 %
Profit/Loss before tax 55,346 - 54,209 –Weighted tax rate for Sweden and Switzerland 22.06 % -12,192 -22.1 -11,962 -22.1Internal dividend not taxable 10,326 18.7 14,577 26.9Other income non taxable 18,958 34.3 - -Non-deductible expenses -17,135 -31.0 -3,007 -5.5Adjustments in respect of prior years 177 0.3 -2,662 -4.9Witholding tax -1,287 -2.3 -483 -0.9Other -30 -0.1 – –Income tax expense -1,182 -2,1 -3,537 -6.5
The company is subject to one tax audit. The company has during the year used the main part of the provision that was recorded last year relating to this audit. As at December 31, 2016 the provision amounts to EUR 817 thousand (EUR 2,375 thou-sand).
Note A11 Amortization, depreciation
Amortization and depreciationEUR thousand 2016 2015
Development costs -285 -919Other intangibles -105 -1Fixture and fittings -12 -4Computer hardware and software -306 -872Office improvements -3 -6Total -711 -1,802
Amortization and depreciation are recognized in the following line items in the income statementEUR thousand 2016 2015
Cost of sales -711 -1,802Total -711 -1,802
Note A12 Intangible assets
Cost
EUR thousandDevelopment
cost Others Total
As at January 1, 2016 11,521 671 12,192Investments 757 164 921As at December 31, 2016 12,278 836 13,113
Accumulated amortization and impairmentAs at January 1, 2016 -10,742 -9 -10,751Amortization for the year -285 -105 -391As at December 31, 2016 -11,027 -114 -11,142Carrying value as at December 31, 2016 1,251 721 1,972
EUR thousandDevelopment
cost Others Total
As at January 1, 2015 13,911 868 14,780Investments – 42 42Reclassifications -2,391 -239 -2,630As at December 31, 2015 11,521 671 12,192
Accumulated amortization and impairmentAs at January 1, 2015 -10,452 -834 -11,285Amortization for the year -919 -1 -920Reclassifications 630 826 1,456As at December 31, 2015 -10,742 -9 -10,751Carrying value as at December 31, 2015 779 662 1,441
Notes to the Parent Company financial statements
46 Transcom Annual Report 2016
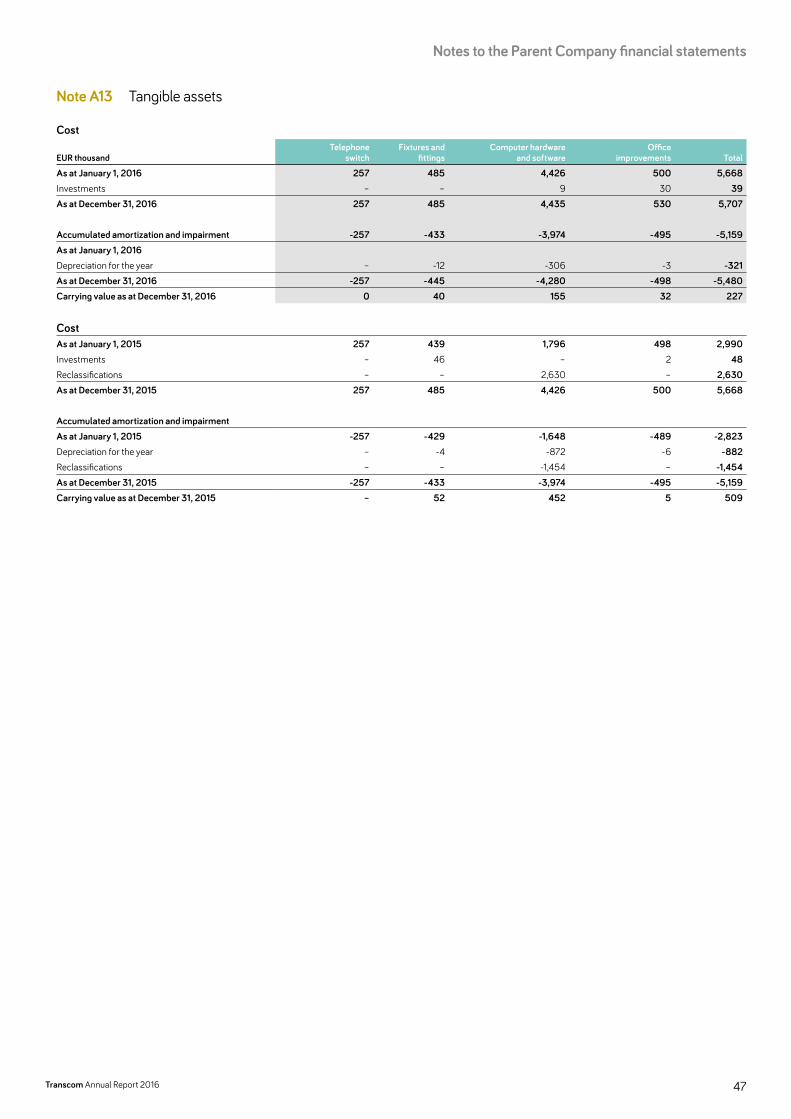
Note A13 Tangible assets
Cost
EUR thousandTelephone
switchFixtures and
fittingsComputer hardware
and softwareOffice
improvements Total
As at January 1, 2016 257 485 4,426 500 5,668Investments – – 9 30 39As at December 31, 2016 257 485 4,435 530 5,707
Accumulated amortization and impairment -257 -433 -3,974 -495 -5,159As at January 1, 2016Depreciation for the year – -12 -306 -3 -321As at December 31, 2016 -257 -445 -4,280 -498 -5,480Carrying value as at December 31, 2016 0 40 155 32 227
CostAs at January 1, 2015 257 439 1,796 498 2,990Investments – 46 – 2 48Reclassifications – – 2,630 – 2,630As at December 31, 2015 257 485 4,426 500 5,668
Accumulated amortization and impairmentAs at January 1, 2015 -257 -429 -1,648 -489 -2,823Depreciation for the year – -4 -872 -6 -882Reclassifications – – -1,454 – -1,454As at December 31, 2015 -257 -433 -3,974 -495 -5,159Carrying value as at December 31, 2015 – 52 452 5 509
47
Notes to the Parent Company financial statements
Transcom Annual Report 2016
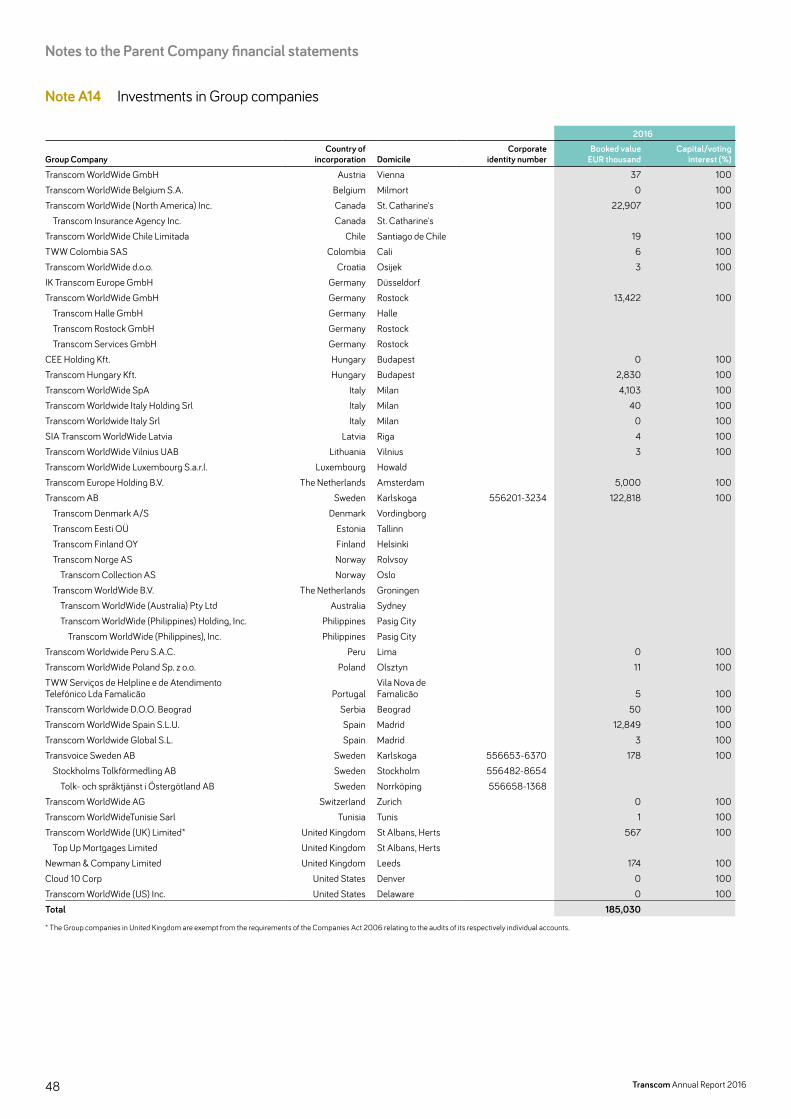
Note A14 Investments in Group companies
2016
Group CompanyCountry of
incorporation DomicileCorporate
identity numberBooked value
EUR thousandCapital/voting
interest (%)
Transcom WorldWide GmbH Austria Vienna 37 100Transcom WorldWide Belgium S.A. Belgium Milmort 0 100Transcom WorldWide (North America) Inc. Canada St. Catharine's 22,907 100
Transcom Insurance Agency Inc. Canada St. Catharine'sTranscom WorldWide Chile Limitada Chile Santiago de Chile 19 100TWW Colombia SAS Colombia Cali 6 100Transcom WorldWide d.o.o. Croatia Osijek 3 100IK Transcom Europe GmbH Germany DüsseldorfTranscom WorldWide GmbH Germany Rostock 13,422 100
Transcom Halle GmbH Germany HalleTranscom Rostock GmbH Germany RostockTranscom Services GmbH Germany Rostock
CEE Holding Kft. Hungary Budapest 0 100Transcom Hungary Kft. Hungary Budapest 2,830 100Transcom WorldWide SpA Italy Milan 4,103 100Transcom Worldwide Italy Holding Srl Italy Milan 40 100Transcom Worldwide Italy Srl Italy Milan 0 100SIA Transcom WorldWide Latvia Latvia Riga 4 100Transcom WorldWide Vilnius UAB Lithuania Vilnius 3 100Transcom WorldWide Luxembourg S.a.r.l. Luxembourg HowaldTranscom Europe Holding B.V. The Netherlands Amsterdam 5,000 100Transcom AB Sweden Karlskoga 556201-3234 122,818 100
Transcom Denmark A/S Denmark VordingborgTranscom Eesti OÜ Estonia TallinnTranscom Finland OY Finland HelsinkiTranscom Norge AS Norway Rolvsoy
Transcom Collection AS Norway OsloTranscom WorldWide B.V. The Netherlands Groningen
Transcom WorldWide (Australia) Pty Ltd Australia SydneyTranscom WorldWide (Philippines) Holding, Inc. Philippines Pasig City
Transcom WorldWide (Philippines), Inc. Philippines Pasig CityTranscom Worldwide Peru S.A.C. Peru Lima 0 100Transcom WorldWide Poland Sp. z o.o. Poland Olsztyn 11 100TWW Serviços de Helpline e de Atendimento Telefónico Lda Famalicão Portugal
Vila Nova deFamalicão 5 100
Transcom Worldwide D.O.O. Beograd Serbia Beograd 50 100Transcom WorldWide Spain S.L.U. Spain Madrid 12,849 100Transcom Worldwide Global S.L. Spain Madrid 3 100Transvoice Sweden AB Sweden Karlskoga 556653-6370 178 100
Stockholms Tolkförmedling AB Sweden Stockholm 556482-8654Tolk- och språktjänst i Östergötland AB Sweden Norrköping 556658-1368
Transcom WorldWide AG Switzerland Zurich 0 100Transcom WorldWideTunisie Sarl Tunisia Tunis 1 100Transcom WorldWide (UK) Limited* United Kingdom St Albans, Herts 567 100
Top Up Mortgages Limited United Kingdom St Albans, HertsNewman & Company Limited United Kingdom Leeds 174 100Cloud 10 Corp United States Denver 0 100Transcom WorldWide (US) Inc. United States Delaware 0 100Total 185,030
* The Group companies in United Kingdom are exempt from the requirements of the Companies Act 2006 relating to the audits of its respectively individual accounts.
Notes to the Parent Company financial statements
48 Transcom Annual Report 2016
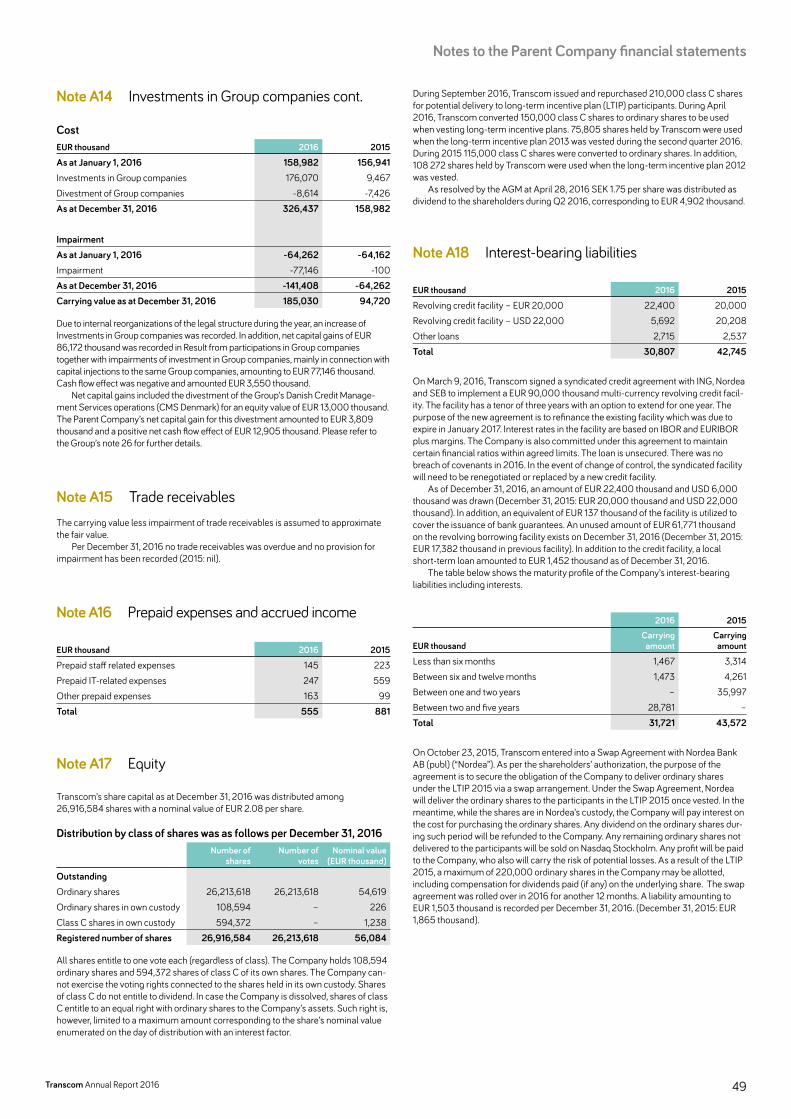
Note A14 Investments in Group companies cont.
CostEUR thousand 2016 2015
As at January 1, 2016 158,982 156,941Investments in Group companies 176,070 9,467Divestment of Group companies -8,614 -7,426As at December 31, 2016 326,437 158,982
ImpairmentAs at January 1, 2016 -64,262 -64,162Impairment -77,146 -100As at December 31, 2016 -141,408 -64,262Carrying value as at December 31, 2016 185,030 94,720
Due to internal reorganizations of the legal structure during the year, an increase of Investments in Group companies was recorded. In addition, net capital gains of EUR 86,172 thousand was recorded in Result from participations in Group companies together with impairments of investment in Group companies, mainly in connection with capital injections to the same Group companies, amounting to EUR 77,146 thousand. Cash flow effect was negative and amounted EUR 3,550 thousand.
Net capital gains included the divestment of the Group’s Danish Credit Manage-ment Services operations (CMS Denmark) for an equity value of EUR 13,000 thousand. The Parent Company’s net capital gain for this divestment amounted to EUR 3,809 thousand and a positive net cash flow effect of EUR 12,905 thousand. Please refer to the Group’s note 26 for further details.
Note A15 Trade receivablesThe carrying value less impairment of trade receivables is assumed to approximate the fair value.
Per December 31, 2016 no trade receivables was overdue and no provision for impairment has been recorded (2015: nil).
Note A16 Prepaid expenses and accrued income
EUR thousand 2016 2015
Prepaid staff related expenses 145 223Prepaid IT-related expenses 247 559Other prepaid expenses 163 99Total 555 881
Note A17 Equity
Transcom’s share capital as at December 31, 2016 was distributed among 26,916,584 shares with a nominal value of EUR 2.08 per share.
Distribution by class of shares was as follows per December 31, 2016Number of
sharesNumber of
votesNominal value
(EUR thousand)
OutstandingOrdinary shares 26,213,618 26,213,618 54,619Ordinary shares in own custody 108,594 – 226Class C shares in own custody 594,372 – 1,238Registered number of shares 26,916,584 26,213,618 56,084
All shares entitle to one vote each (regardless of class). The Company holds 108,594 ordinary shares and 594,372 shares of class C of its own shares. The Company can-not exercise the voting rights connected to the shares held in its own custody. Shares of class C do not entitle to dividend. In case the Company is dissolved, shares of class C entitle to an equal right with ordinary shares to the Company’s assets. Such right is, however, limited to a maximum amount corresponding to the share’s nominal value enumerated on the day of distribution with an interest factor.
During September 2016, Transcom issued and repurchased 210,000 class C shares for potential delivery to long-term incentive plan (LTIP) participants. During April 2016, Transcom converted 150,000 class C shares to ordinary shares to be used when vesting long-term incentive plans. 75,805 shares held by Transcom were used when the long-term incentive plan 2013 was vested during the second quarter 2016. During 2015 115,000 class C shares were converted to ordinary shares. In addition, 108 272 shares held by Transcom were used when the long-term incentive plan 2012 was vested.
As resolved by the AGM at April 28, 2016 SEK 1.75 per share was distributed as dividend to the shareholders during Q2 2016, corresponding to EUR 4,902 thousand.
Note A18 Interest-bearing liabilities
EUR thousand 2016 2015
Revolving credit facility – EUR 20,000 22,400 20,000Revolving credit facility – USD 22,000 5,692 20,208Other loans 2,715 2,537Total 30,807 42,745
On March 9, 2016, Transcom signed a syndicated credit agreement with ING, Nordea and SEB to implement a EUR 90,000 thousand multi-currency revolving credit facil-ity. The facility has a tenor of three years with an option to extend for one year. The purpose of the new agreement is to refinance the existing facility which was due to expire in January 2017. Interest rates in the facility are based on IBOR and EURIBOR plus margins. The Company is also committed under this agreement to maintain certain financial ratios within agreed limits. The loan is unsecured. There was no breach of covenants in 2016. In the event of change of control, the syndicated facility will need to be renegotiated or replaced by a new credit facility.
As of December 31, 2016, an amount of EUR 22,400 thousand and USD 6,000 thousand was drawn (December 31, 2015: EUR 20,000 thousand and USD 22,000 thousand). In addition, an equivalent of EUR 137 thousand of the facility is utilized to cover the issuance of bank guarantees. An unused amount of EUR 61,771 thousand on the revolving borrowing facility exists on December 31, 2016 (December 31, 2015: EUR 17,382 thousand in previous facility). In addition to the credit facility, a local short-term loan amounted to EUR 1,452 thousand as of December 31, 2016.
The table below shows the maturity profile of the Company’s interest-bearing liabilities including interests.
2016 2015
EUR thousandCarrying amount
Carrying amount
Less than six months 1,467 3,314Between six and twelve months 1,473 4,261Between one and two years – 35,997Between two and five years 28,781 –Total 31,721 43,572
On October 23, 2015, Transcom entered into a Swap Agreement with Nordea Bank AB (publ) (“Nordea”). As per the shareholders’ authorization, the purpose of the agreement is to secure the obligation of the Company to deliver ordinary shares under the LTIP 2015 via a swap arrangement. Under the Swap Agreement, Nordea will deliver the ordinary shares to the participants in the LTIP 2015 once vested. In the meantime, while the shares are in Nordea’s custody, the Company will pay interest on the cost for purchasing the ordinary shares. Any dividend on the ordinary shares dur-ing such period will be refunded to the Company. Any remaining ordinary shares not delivered to the participants will be sold on Nasdaq Stockholm. Any profit will be paid to the Company, who also will carry the risk of potential losses. As a result of the LTIP 2015, a maximum of 220,000 ordinary shares in the Company may be allotted, including compensation for dividends paid (if any) on the underlying share. The swap agreement was rolled over in 2016 for another 12 months. A liability amounting to EUR 1,503 thousand is recorded per December 31, 2016. (December 31, 2015: EUR 1,865 thousand).
49
Notes to the Parent Company financial statements
Transcom Annual Report 2016

Note A19 Financial instrument risk management objectives and policies
Financial risks are mainly market risks (incl. currency risk and interest rate risk), credit risk and liquidity risk. The risk management policy, adopted by the Board of Directors, aims to minimize the adverse impact on financial results and positions. Interest rate riskInterest rate risk pertains to changes to the market rate of interest impact the compa-ny’s net interest. The company has mainly financial liabilities that are interest-bearing and very little interest-bearing assets. Calculated on the financial interest-bearing liabilities at December 31, 2016, a 10 percent change in the market interest rate wouldimpact the company’s earnings by EUR 57 thousand . Currency riskSales occur mainly in the accounting currency EUR while the purchases mainly are in SEK and EUR. At the end of the year, the company was exposed to exchange-rate risk
pertaining primarily to receivables and liabilities to Group companies. Should exchange rates for all currencies be 5 percent higher/lower, the impact on earnings would be -/+ EUR 483 thousand based on exposure on the balance-sheet date . Credit riskThe company strives for the best possible credit rating for the company’s counter-parties. The vast proportion of financial receivables were against Group companies. Liquidity riskLiquidity risk entails the risk that there is insufficient cash and cash equivalents and marketable securities or agreed credit opportunities to close the market positions. The liquidity risk is deemed stable and the Board of Directors believes that the capital required to meet the company’s commitments will be available during the 2017 fiscal year.
Maturity profile of the financial assets and liabilities based on contractual undiscounted payments2016 2015
EUR thousand <1 year 1–5 years Carrying amount <1 year 1–5 years Carrying amount
Financial assetsReceivables from Group companies – 16,189 16,189 – 44,884 44,884Other receivables – – – – – –Total non-current financial assets – 16,189 16,189 – 44,884 44,884Trade receivables 923 – 923 889 – 889Receivables from Group companies 95,146 – 95,146 112,229 – 112,229Other receivables incl. accrued income 134 – 134 1,005 – 1,005Cash and cash equivalents 2,457 – 2,457 42 – 42Total current financial assets 98,660 – 98,660 114,165 – 114,165Total financial assets 98,660 16,189 114,849 114,165 44,884 159,049
Financial liabilitiesInterest-bearing liabilities – 28,781 28,781 – 35,997 35,997Liabilities to Group companies – 15,717 15,717 – 29,217 29,217Other liabilities – – – – 155 155Total non-current financial liabilities – 44,498 44,498 – 65,369 65,369Interest-bearing liabilities 2,925 – 2,925 7,575 – 7,575Trade payables 1,127 – 1,127 1,539 – 1,539Liabilities to Group companies 92,790 – 92,790 69,163 – 69,163Other liabilities incl. accrued expenses 1,601 – 1,601 1,935 – 1,935Total current financial liabilities 98,443 – 98,443 80,212 – 80,212Total financial liabilities 98,443 44,498 142,941 80,212 65,369 145,581
Notes to the Parent Company financial statements
50 Transcom Annual Report 2016
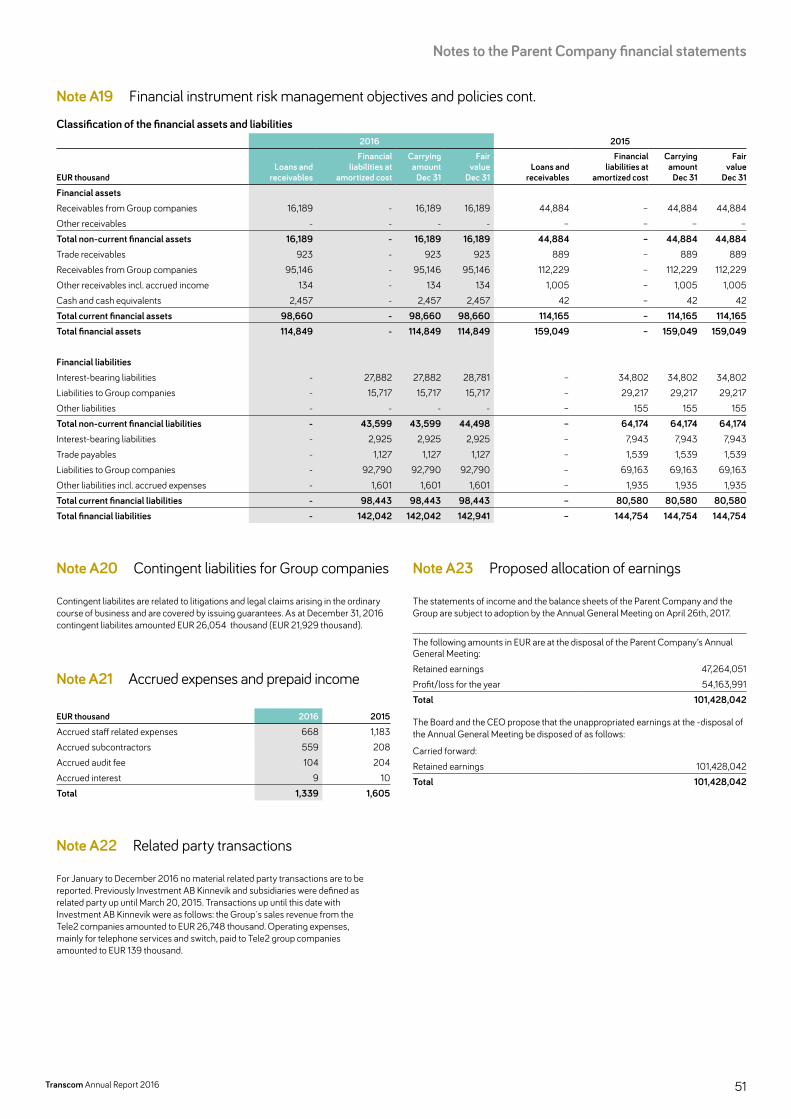
Note A19 Financial instrument risk management objectives and policies cont.
Classification of the financial assets and liabilities2016 2015
EUR thousandLoans and
receivables
Financial liabilities at
amortized cost
Carrying amount
Dec 31
Fair value
Dec 31Loans and
receivables
Financial liabilities at
amortized cost
Carrying amount
Dec 31
Fair value
Dec 31
Financial assetsReceivables from Group companies 16,189 - 16,189 16,189 44,884 – 44,884 44,884Other receivables - - - - – – – –Total non-current financial assets 16,189 - 16,189 16,189 44,884 – 44,884 44,884Trade receivables 923 - 923 923 889 – 889 889Receivables from Group companies 95,146 - 95,146 95,146 112,229 – 112,229 112,229Other receivables incl. accrued income 134 - 134 134 1,005 – 1,005 1,005Cash and cash equivalents 2,457 - 2,457 2,457 42 – 42 42Total current financial assets 98,660 - 98,660 98,660 114,165 – 114,165 114,165Total financial assets 114,849 - 114,849 114,849 159,049 – 159,049 159,049
Financial liabilitiesInterest-bearing liabilities - 27,882 27,882 28,781 – 34,802 34,802 34,802Liabilities to Group companies - 15,717 15,717 15,717 – 29,217 29,217 29,217Other liabilities - - - - – 155 155 155Total non-current financial liabilities - 43,599 43,599 44,498 – 64,174 64,174 64,174Interest-bearing liabilities - 2,925 2,925 2,925 – 7,943 7,943 7,943Trade payables - 1,127 1,127 1,127 – 1,539 1,539 1,539Liabilities to Group companies - 92,790 92,790 92,790 – 69,163 69,163 69,163Other liabilities incl. accrued expenses - 1,601 1,601 1,601 – 1,935 1,935 1,935Total current financial liabilities - 98,443 98,443 98,443 – 80,580 80,580 80,580Total financial liabilities - 142,042 142,042 142,941 – 144,754 144,754 144,754
Note A20 Contingent liabilities for Group companies
Contingent liabilites are related to litigations and legal claims arising in the ordinary course of business and are covered by issuing guarantees. As at December 31, 2016 contingent liabilites amounted EUR 26,054 thousand (EUR 21,929 thousand).
Note A21 Accrued expenses and prepaid income
EUR thousand 2016 2015
Accrued staff related expenses 668 1,183Accrued subcontractors 559 208Accrued audit fee 104 204Accrued interest 9 10Total 1,339 1,605
Note A22 Related party transactions
For January to December 2016 no material related party transactions are to be reported. Previously Investment AB Kinnevik and subsidiaries were defined as related party up until March 20, 2015. Transactions up until this date with Investment AB Kinnevik were as follows: the Group s sales revenue from the Tele2 companies amounted to EUR 26,748 thousand. Operating expenses, mainly for telephone services and switch, paid to Tele2 group companies amounted to EUR 139 thousand.
Note A23 Proposed allocation of earnings
The statements of income and the balance sheets of the Parent Company and the Group are subject to adoption by the Annual General Meeting on April 26th, 2017.
The following amounts in EUR are at the disposal of the Parent Company’s Annual General Meeting:Retained earnings 47,264,051Profit/loss for the year 54,163,991Total 101,428,042
The Board and the CEO propose that the unappropriated earnings at the -disposal of the Annual General Meeting be disposed of as follows:
Carried forward:Retained earnings 101,428,042Total 101,428,042
51
Notes to the Parent Company financial statements
Transcom Annual Report 2016

The undersigned certify that the consolidated accounts and the annual report have been prepared in accordance with Internatio-nal Financial Reporting Standards (“IFRS”), as adopted for use in the European Union, for the Group and the Annual Accounts Act and RFR2 for the Parent Company, and generally accepted ac-counting principles respectively, and give a true and fair view of
the financial positions and results of the Group and the Parent Company, and that the Administration Report gives a fair review of the development of the operations, financial positions and results of the Group and the Parent Company and describes substantial risks and uncertainties that the Group companies face.
Stockholm, April 5, 2017
Henning Boysen Chairman of the Board
Fredrik Cappelen Liselotte Hägertz Engstam Klas Johansson Member of the Board Member of the Board Member of the Board
Mikael Larsson Erik Törnberg Member of the Board Member of the Board
Johan Eriksson President & CEO
Our audit report has been submitted on April 5, 2017
Ernst & Young AB
Erik ÅströmAuthorized Public Accountant
52 Transcom Annual Report 2016
Signatures of the Board of Directors
Auditor’s report
To the general meeting of the shareholders of Transcom Worldwide AB (publ), corporate identity number 556880-1277
REPORT ON THE ANNUAL ACCOUNTS AND CONSOLIDATED ACCOUNTSOpinionsWe have audited the annual accounts and consolidated accounts of Transcom Worldwide AB (publ) för år 2016 except for the corporate governance statement on pages 59–72 for the year 2016. The annual accounts and consolidated accounts of the company are included on pages 6–52 in this document.
In our opinion, the annual accounts have been prepared in accordance with the Annual Accounts Act and present fairly, in all material respects, the financial position of the parent company as of 31 December 2016 and its financial performance and cash flow for the year then ended in accordance with the Annual Accounts Act. The consolidated accounts have been prepared in accordance with the Annual Accounts Act and present fairly, in all material respects, the financial position of the group as of 31 December 2016 and their financial performance and cash flow for the year then ended in accordance with International Financial Reporting Standards (IFRS), as adopted by the EU, and the Annual Accounts Act. Our opinions do not cover the corporate governance state-ment on pages 59–72. The statutory administration report is consistent with the other parts of the annual accounts and consolidated accounts.
We therefore recommend that the general meeting of share-holders adopts the income statement for the parent company and the group and the balance sheet for the parent company and the statement of financial position for the group.
Basis for OpinionsWe conducted our audit in accordance with International Standards on Auditing (ISA) and generally accepted auditing standards in Sweden. Our responsibilities under those standards are further described in the Auditor’s Responsibilities section. We are inde-pendent of the parent company and the group in accordance with professional ethics for accountants in Sweden and have otherwise fulfilled our ethical responsibilities in accordance with these requirements.
We believe that the audit evidence we have obtained is sufficient and appropriate to provide a basis for our opinions.
Key Audit Matters Key audit matters are those matters that, in our professional judg-ment, were of most significance in our audit of the annual accounts and consolidated accounts of the current period. These matters were addressed in the context of our audit of, and in forming our opinion thereon, the annual accounts and consolidated accounts as a whole, but we do not provide a separate opinion on these matters.
Revenue and accounts receivableThe group’s revenue amounts to 586 MEUR for 2016. The revenue mainly relates to services in customer support, sales and technical support. The revenue is recognized when it is probable that the economic benefits will flow to the group and when the revenue can be reliably measured. The number of transactions in the various revenue streams is large which put high demands on the compa-ny’s internal control and administrative processes. We have there-fore deemed revenue as a key audit matter.
The accounting principles for revenue and accounts receivable are described in note 1 and a description of revenue per segment for the group is disclosed in note 3.
We have audited the company’s revenue recognition. We have for example performed analytical review, read agreements and performed verification of payments of revenue in order to confirm the existence. We have also performed a walk-through of the com-pany’s routines for invoicing and how the company handles collec-tion of receivables and assessment of bad debts. In our audit we have also reviewed that the disclosures made are appropriate.
Goodwill and shares in subsidiariesGoodwill amounts to 109 MEUR in the consolidated statement of financial position for the group as of 31 December 2016 equal to 40% of the group’s total assets. Shares in subsidiaries amounts to 185 MEUR in the parents balance sheet equalling 61% of the parent company’s assets. The company performs an impairment test at least annually or if events or circumstances indicate that the carrying value does not exceed the recoverable amount for these assets. The recoverable amounts are determined by a calculation of the value in use for each cash generating unit by discounting future cash flows. The calculation is based on expected outcome of a number of factors which are based on prior experience of the company’s business plans, forecasts and comprises a number of assumptions including earnings trend, growth, investment needs and discount rate.
The impairment test for 2016 did not result in an impairment. Since the assumptions that form the basis for the test includes sig-nificant judgements from the company we have deemed account-ing for goodwill and shares in subsidiaries as key audit matters.
The accounting principles for goodwill are disclosed in note 1, critical accounting estimates and judgements are described in note 2 and a description of the impairment test is disclosed in note 12. Shares in subsidiaries are disclosed in note A14.
In our audit we have evaluated the company’s process for per-forming the impairment test. We have examined how cash gener-ating units have been identified compared to established criteria and compared this to how the company evaluates goodwill inter-
Translation from the Swedish original.
53Transcom Annual Report 2016
Auditor’s report

nally. We have evaluated valuation methods and calculation models, assess the reasonableness in the assumptions made and in the sensitivity analysis made with help from our own valuation special-ists and made comparisons to historical outcome and the precision in priory made forecasts. The reasonableness in the discount rate used and the terminal growth for each unit has been appraised through analysis with other companies in the same industry. We have also reviewed that the disclosures made are appropriate.
ProvisionsThe provisions amounts to 3.1 MEUR in the consolidated statement of financial position for the group as of 31 December 2016. The provisions as of 31 December 2016 relates to ongoing tax litiga-tions, ongoing legal litigations, restructuring reserves and other reserves. A provision is recognised when a present legal or con-structive obligation as a result of past events exists, it is probable that an outflow of resources will be required to settle the obligation and the amount for the transaction can been reliably estimated. Among the factors that are considered when accounting for a pro-vision is the nature of the obligation and the potential damage in the jurisdiction where the legal process, demand or assessment has occurred and how the matter proceeds. Also evaluations and statements from legal advisors and experience from similar cases are taken into consideration. A changed assessment can affect the carrying amount and we have therefore deemed this a key audit matter.
The accounting principles for provisions are disclosed in note 1, critical accounting estimates and judgements are described in note 2 and a description of the provisions is disclosed in note 21 for the group.
In our audit we have examined the company’s process for calculating the provisions. We have obtained statement from the company’s in-house legal officer. We have with help from our tax specialists reviewed the provisions and assessed the reasonable-ness in the assumption that the provisions are based on. We have also evaluated whether the disclosures made are appropriate.
Other Information than the annual accounts and consolidated accountsThis document also contains other information than the annual accounts and consolidated accounts and is found on pages 1–5, 57–74. Other information is also presented at the Company’s webpage in ’Transcom 2016’. The Board of Directors and the Managing Director are responsible for this other information.
Our opinion on the annual accounts and consolidated accounts does not cover this other information and we do not express any form of assurance conclusion regarding this other information.
In connection with our audit of the annual accounts and consol-idated accounts, our responsibility is to read the information identi-
fied above and consider whether the information is materially inconsistent with the annual accounts and consolidated accounts. In this procedure we also take into account our knowledge other-wise obtained in the audit and assess whether the information otherwise appears to be materially misstated.
If we, based on the work performed concerning this informa-tion, conclude that there is a material misstatement of this other information, we are required to report that fact. We have nothing to report in this regard.
Responsibilities of the Board of Directors and the Managing DirectorThe Board of Directors and the Managing Director are responsible for the preparation of the annual accounts and consolidated accounts and that they give a fair presentation in accordance with the Annual Accounts Act and, concerning the consolidated accounts, in accordance with IFRS as adopted by the EU. The Board of Directors and the Managing Director are also responsible for such internal control as they determine is necessary to enable the preparation of annual accounts and consolidated accounts that are free from material misstatement, whether due to fraud or error.
In preparing the annual accounts and consolidated accounts, The Board of Directors and the Managing Director are responsible for the assessment of the company’s and the group’s ability to con-tinue as a going concern. They disclose, as applicable, matters related to going concern and using the going concern basis of accounting. The going concern basis of accounting is however not applied if the Board of Directors and the Managing Director intends to liquidate the company, to cease operations, or has no realistic alternative but to do so.
The Audit Committee shall, without prejudice to the Board of Director’s responsibilities and tasks in general, among other things oversee the company’s financial reporting process.
Auditor’s responsibilityOur objectives are to obtain reasonable assurance about whether the annual accounts and consolidated accounts as a whole are free from material misstatement, whether due to fraud or error, and to issue an auditor’s report that includes our opinions. Reasonable assurance is a high level of assurance, but is not a guarantee that an audit conducted in accordance with ISAs and generally accepted auditing standards in Sweden will always detect a mate-rial misstatement when it exists. Misstatements can arise from fraud or error and are considered material if, individually or in the aggregate, they could reasonably be expected to influence the economic decisions of users taken on the basis of these annual accounts and consolidated accounts.
54 Transcom Annual Report 2016
Auditor’s report

As part of an audit in accordance with ISAs, we exercise profes-sional judgment and maintain professional scepticism throughout the audit. We also: • Identify and assess the risks of material misstatement of the
annual accounts and consolidated accounts, whether due to fraud or error, design and perform audit procedures responsive to those risks, and obtain audit evidence that is sufficient and appropriate to provide a basis for our opinions. The risk of not detecting a material misstatement resulting from fraud is higher than for one resulting from error, as fraud may involve collusion, forgery, intentional omissions, misrepresentations, or the override of internal control.
• Obtain an understanding of the company’s internal control relevant to our audit in order to design audit procedures that are appropriate in the circumstances, but not for the purpose of expressing an opinion on the effectiveness of the company’s internal control.
• Evaluate the appropriateness of accounting policies used and the reasonableness of accounting estimates and related disclosures made by the Board of Directors and the Managing Director.
• Conclude on the appropriateness of the Board of Directors’ and the Managing Director’s use of the going concern basis of accounting in preparing the annual accounts and consolidated accounts. We also draw a conclusion, based on the audit evidence obtained, as to whether any material uncertainty exists related to events or conditions that may cast significant doubt on the com-pany’s and the group’s ability to continue as a going concern. If we conclude that a material uncertainty exists, we are required to draw attention in our auditor’s report to the related disclosures in the annual accounts and consolidated accounts or, if such disclo-sures are inadequate, to modify our opinion about the annual accounts and consolidated accounts. Our conclusions are based on the audit evidence obtained up to the date of our auditor’s report. However, future events or conditions may cause a com-pany and a group to cease to continue as a going concern.
• Evaluate the overall presentation, structure and content of the annual accounts and consolidated accounts, including the disclo-sures, and whether the annual accounts and consolidated accounts represent the underlying transactions and events in a manner that achieves fair presentation.
• Obtain sufficient and appropriate audit evidence regarding the financial information of the entities or business activities within the group to express an opinion on the consolidated accounts. We are responsible for the direction, supervision and performance of the group audit. We remain solely responsible for our opinions.
We must inform the Board of Directors of, among other matters, the planned scope and timing of the audit. We must also inform of
significant audit findings during our audit, including any significant deficiencies in internal control that we identified.
We must also provide the Board of Directors with a statement that we have complied with relevant ethical requirements regard-ing independence, and to communicate with them all relationships and other matters that may reasonably be thought to bear on our independence, and where applicable, related safeguards.
From the matters communicated with the Board of Directors, we determine those matters that were of most significance in the audit of the annual accounts and consolidated accounts, including the most important assessed risks for material misstatement, and are therefore the key audit matters. We describe these matters in the auditor’s report unless law or regulation precludes disclosure about the matter or when, in extremely rare circumstances, we determine that a matter should not be communicated in the auditor’s report because the adverse consequences of doing so would reasonably be expected to outweigh the public interest benefits of such communication.
REPORT ON OTHER LEGAL AND REGULATORY REQUIREMENTSOpinionsIn addition to our audit of the annual accounts and consolidated accounts, we have also audited the administration of the Board of Directors and the Managing Director of Transcom Worldwide AB (publ) for the year 2016 and the proposed appropriations of the company’s profit or loss.
We recommend to the general meeting of shareholders that the profit be appropriated in accordance with the proposal in the statutory administration report and that the members of the Board of Directors and the Managing Director be discharged from liability for the financial year.
Basis for OpinionsWe conducted the audit in accordance with generally accepted auditing standards in Sweden. Our responsibilities under those standards are further described in the Auditor’s Responsibilities section. We are independent of the parent company and the group in accordance with professional ethics for accountants in Sweden and have otherwise fulfilled our ethical responsibilities in accordance with these requirements.
We believe that the audit evidence we have obtained is suffi-cient and appropriate to provide a basis for our opinions.
Responsibilities of the Board of Directors and the Managing DirectorThe Board of Directors is responsible for the proposal for appropri-ations of the company’s profit or loss. At the proposal of a dividend, this includes an assessment of whether the dividend is justifiable
55Transcom Annual Report 2016
Auditor’s report
considering the requirements which the company’s and the group’s type of operations, size and risks place on the size of the parent company’s and the group’s equity, consolidation requirements, liquidity and position in general.
The Board of Directors is responsible for the company’s organization and the administration of the company’s affairs. This includes among other things continuous assessment of the company’s and the group’s financial situation and ensuring that the company’s organization is designed so that the accounting, man-agement of assets and the company’s financial affairs otherwise are controlled in a reassuring manner. The Managing Director shall manage the ongoing administration according to the Board of Directors’ guidelines and instructions and among other matters take measures that are necessary to fulfill the company’s account-ing in accordance with law and handle the management of assets in a reassuring manner.
Auditor’s responsibilityOur objective concerning the audit of the administration, and thereby our opinion about discharge from liability, is to obtain audit evidence to assess with a reasonable degree of assurance whether any member of the Board of Directors or the Managing Director in any material respect:• has undertaken any action or been guilty of any omission which
can give rise to liability to the company, or• in any other way has acted in contravention of the Companies
Act, the Annual Accounts Act or the Articles of Association.
Our objective concerning the audit of the proposed appropriations of the company’s profit or loss, and thereby our opinion about this, is to assess with reasonable assurance whether the proposal is in accordance with the Companies Act.
Reasonable assurance is a high level of assurance, but is not a guarantee that an audit conducted in accordance with generally accepted auditing standards in Sweden will always detect actions or omissions that can give rise to liability to the company, or that the proposed appropriations of the company’s profit or loss are not in accordance with the Companies Act.
As part of an audit in accordance with generally accepted auditing standards in Sweden, we exercise professional judgment and maintain professional scepticism throughout the audit. The examination of the administration and the proposed appropriations of the company’s profit or loss is based primarily on the audit of the accounts. Additional audit procedures performed are based on our professional judgment with starting point in risk and materiality. This means that we focus the examination on such actions, areas and relationships that are material for the operations and where deviations and violations would have particular importance for the company’s situation. We examine and test decisions undertaken, support for decisions, actions taken and other circumstances that are relevant to our opinion concerning discharge from liability. As a basis for our opinion on the Board of Directors’ proposed appro-priations of the company’s profit or loss we examined whether the proposal is in accordance with the Companies Act.
Stockholm, April 5, 2017
Ernst & Young AB
Erik ÅströmAuthorized Public Accountant
56 Transcom Annual Report 2016
Auditor’s report
Alternative performance measures
The purpose of Transcom’s alternative performance measure-ments is to disclose additional information to support a more comprehensive year-on-year comparison and provide an indica-tion of the Group’s performance and financial position. These alternative performance measurements defined below are con-sidered to be widely accepted. The measures and basis for calcu-lation can be found in the historical released financial reports at www.transcom.com.
Organic growth: change in revenue for comparable units, exclud-ing currency effects with purpose to provide a more transparent year-on-year comparison for Transcom’s business.
EBIT: corresponds to the Operating profit/loss presented in the Condensed Consolidated Income Statement.
Non-recurring items: are defined as rare events or activities that are not part of normal business operations, mainly restructuring activities.
EBIT excluding non-recurring items: is calculated by excluding the non-recurring items from Transcom’s Operating profit/loss. The purpose of disclosing Transcom’s EBIT excluding non-recur-ring items is to provide more transparent year-on-year compari-son excluding events that are not considered part of Transcom’s
normal business, such as restructuring cost and net gain or loss from disposed business.
EBITDA: is defined as Operating profit/loss, adding back the recorded depreciation on fixed assets and amortization.
EBITDA excluding non-recurring items: is defined as EBITDA excluding the non-recurring items as defined above.
Net debt: is defined as interest-bearing liabilities and employee benefit obligations less cash and cash equivalents per balance sheet day.
Net debt/EBITDA: is defined as interest-bearing liabilities and pension provisions less cash and cash equivalents divided by roll-ing 12 months EBITDA. The net debt to EBITDA ratio is a financial target for Transcom.
Return on Equity: net income (rolling 12 months) divided by aver-age equity (average calculation based on equity per balance sheet day the last five quarters).
Equity ratio: total shareholders’ equity divided by total assets per balance sheet day.
57Transcom Annual Report 2016
Definitions
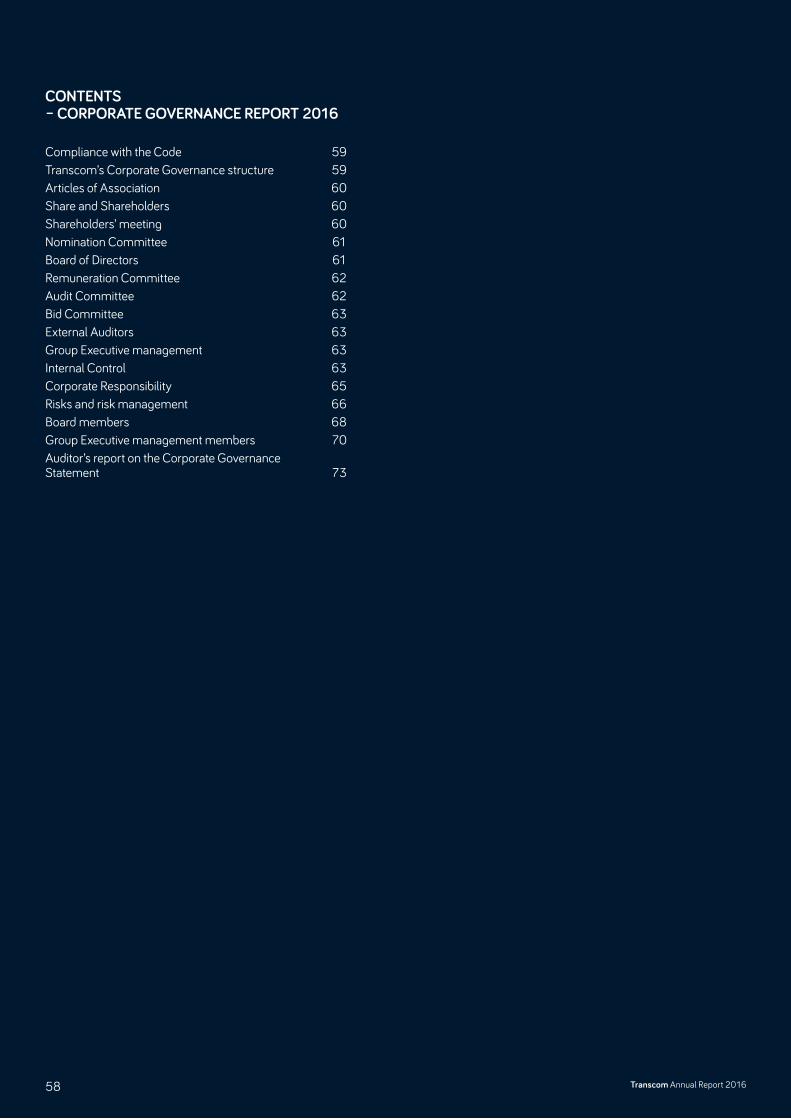
CONTENTS – CORPORATE GOVERNANCE REPORT 2016
Compliance with the Code 59 Transcom’s Corporate Governance structure 59Articles of Association 60Share and Shareholders 60Shareholders’ meeting 60Nomination Committee 61Board of Directors 61Remuneration Committee 62Audit Committee 62Bid Committee 63External Auditors 63Group Executive management 63Internal Control 63Corporate Responsibility 65Risks and risk management 66Board members 68Group Executive management members 70Auditor’s report on the Corporate Governance Statement 73
Transcom Annual Report 201658
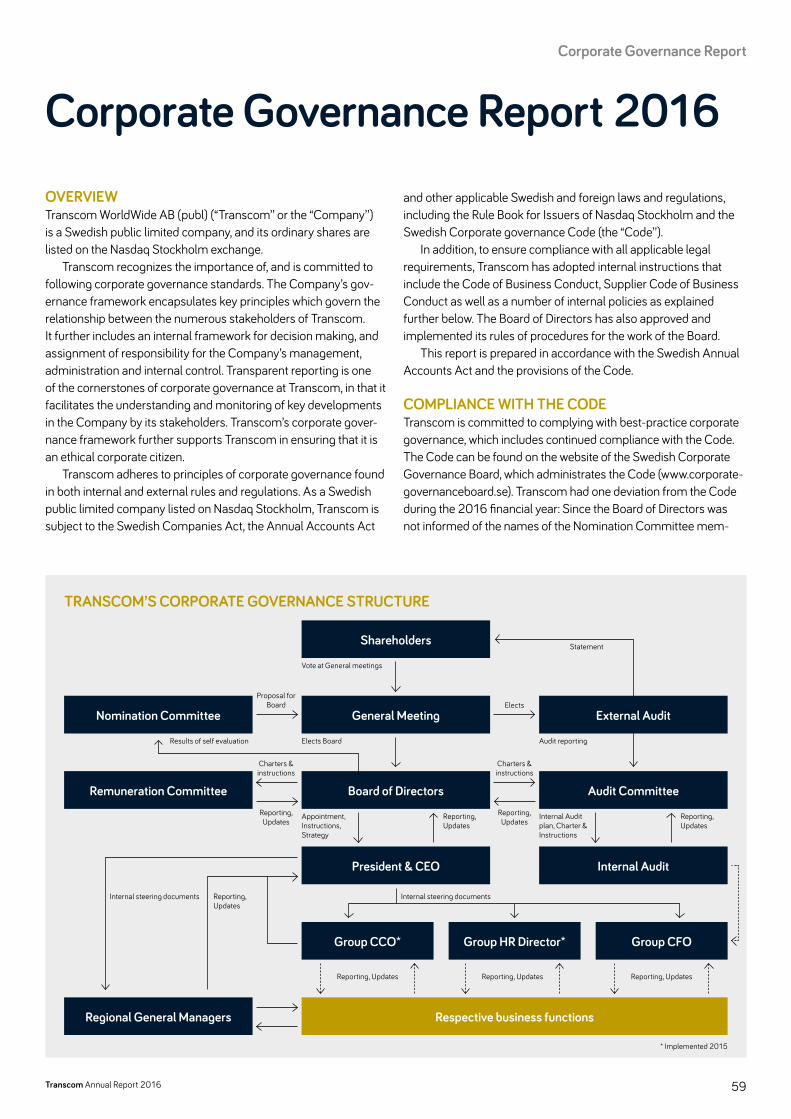
Corporate Governance Report 2016OVERVIEW Transcom WorldWide AB (publ) (“ Transcom’’ or the “Company’’) is a Swedish public limited company, and its ordinary shares are listed on the Nasdaq Stockholm exchange.
Transcom recognizes the importance of, and is committed to following corporate governance standards. The Company’s governance framework encapsulates key principles which govern the relationship between the numerous stakeholders of Transcom. It further includes an internal framework for decision making, and assignment of responsibility for the Company’s management, administration and internal control. Transparent reporting is one of the cornerstones of corporate governance at Transcom, in that it facilitates the understanding and monitoring of key developments in the Company by its stakeholders. Transcom’s corporate governance framework further supports Transcom in ensuring that it is an ethical corporate citizen.
Transcom adheres to principles of corporate governance found in both internal and external rules and regulations. As a Swedish public limited company listed on Nasdaq Stockholm, Transcom is subject to the Swedish Companies Act, the Annual Accounts Act
and other applicable Swedish and foreign laws and regulations, including the Rule Book for Issuers of Nasdaq Stockholm and the Swedish Corporate governance Code (the “Code’’).
In addition, to ensure compliance with all applicable legal requirements, Transcom has adopted internal instructions that include the Code of Business Conduct, Supplier Code of Business Conduct as well as a number of internal policies as explained further below. The Board of Directors has also approved and implemented its rules of procedures for the work of the Board.
This report is prepared in accordance with the Swedish Annual Accounts Act and the provisions of the Code.
COMPLIANCE WITH THE CODE Transcom is committed to complying with bestpractice corporate governance, which includes continued compliance with the Code. The Code can be found on the website of the Swedish Corporate Governance Board, which administrates the Code (www.corporategovernanceboard.se). Transcom had one deviation from the Code during the 2016 financial year: Since the Board of Directors was not informed of the names of the Nomination Committee mem
Shareholders
General Meeting
Audit Committee
Internal Audit
Group CFOGroup CCO*
Respective business functions
Group HR Director*
Nomination Committee
Remuneration Committee
Regional General Managers
Board of Directors
President & CEO
External Audit
Statement
Audit reportingElects Board
Vote at General meetings
Internal Audit plan, Charter & Instructions
Appointment, Instructions, Strategy
Reporting, Updates
Reporting, Updates
Internal steering documentsInternal steering documents
Reporting, Updates
Reporting, Updates
Charters & instructions
Charters & instructions
Results of self evaluation
Proposal for Board Elects
Reporting, Updates Reporting, Updates Reporting, Updates
Reporting, Updates
TRANSCOM’S CORPORATE GOVERNANCE STRUCTURE
* Implemented 2015
59Transcom Annual Report 2016
Corporate Governance Report

bers until 23 November 2016, it was not possible to publish this information within six months before the 2017 AGM, as set out in the Code.
ARTICLES OF ASSOCIATION Transcom’s Articles of Association (as defined below), which form the basis of the governance of the Company’s operations, set forth the Company’s name, the seat of the Board, the object of the business activities, the shares and share capital of the Company and contain rules with respect to the shareholders’ meetings. The Articles of Association do not contain any limitations as to how many votes each shareholder may cast at shareholders’ meetings, nor any provisions regarding the appointment and dismissal of Board members or amendments to the Articles of Association. The Articles of Association can be found at http://www.transcom.com/en/About Transcom/OrganizationandGovernance/Articleof Association/.
SHARE AND SHAREHOLDERSThe share capital of Transcom is composed of ordinary shares and class C shares. Each share regardless of series represents one vote.
As previously disclosed, the annual general meeting of Transcom held on 28 April 2016, resolved to adopt a longterm incentive program (the “LTIP 2016”) and authorized the Board of Directors to secure the Company’s obligations under the LTIP 2016 by a combination of reallocating class C shares held by the Company that are no longer needed in previously resolved incentive programs to the LTIP 2016 and transfer of own ordinary shares to participants in the LTIP 2016 who are entitled to such (the latter option involving the following actions in addition to the reallocation from previous programs: (i) issuing shares of series C with deviation of the shareholders’ preferential right, (ii) reduction of the Company’s share capital, (iii) repurchase of all issued shares of series C, (iv) conversion of shares of series C to ordinary shares and (v) transfer of own ordinary shares to participants in the LTIP 2016). Consequently in September 2016 the Company issued and repurchased 210,000 class C shares for potential delivery to LTIP 2016 participants As a result of the LTIP 2016, following conversion from shares of series C, a maximum of 210,000 ordinary shares in the Company may be allotted, including compensation for dividends paid (if any) on the underlying share.
Transcom’s share ownership is disclosed on page 13. All other significant relationships between Transcom and its major shareholders, in so far as it is aware of them, are described in note 27 “Related Party Transactions” and the Board of Directors has no knowledge of any shareholders’ agreement or any other agreement regarding voting rights or other rights for the shareholders.
On 21 December 2016, Transcom’s largest shareholder, Altor AB, a company jointly owned by Altor Fund IV (No. 1) AB
and Altor Fund IV (No. 2) AB, funds managed by Altor Fund Manager AB, (jointly “Altor”), announced a public cash offer to the shareholders of Transcom to sell all of their shares in Transcom to Altor (the “Offer”). Altor offers SEK 87.50 in cash per share in Transcom, corresponding to a total value for all outstanding shares in Transcom of SEK 2,294 million. As at 31 December 2016, Altor was the largest shareholder in Transcom, holding 6,377,238 shares, corresponding to approximately 24.3 percent of the shares in the Company (excluding the 702,966 shares held by the Company). The value of the Offer, excluding shares held by Altor, amounts to approximately SEK 1,736 million.
SHAREHOLDERS’ MEETINGThe Shareholders’ meeting is the highest decisionmaking body for Transcom and it is at the shareholders’ meeting where all shareholders are entitled to participate and exercise their right to decide on issues affecting Transcom and its operations.
In 2016, one shareholder meeting was held, the annual general meeting of shareholders (“AGM’’) of Transcom (“2016 AGM’’).
The function of the Shareholders’ meeting, the general meeting’s primary authority to adopt resolutions, the shareholders’ rights and how these rights are exercised are all regulated by law or other statutory instrument.
2016 AGMIn 2016, the statutory AGM was held on 28 April 2016. At the meeting, shareholders representing 58.80 percent of the total number of shares were present either personally or by proxy. Shareholders exercised their rights to decide on the key affairs and the following resolutions were adopted by the AGM: • Approval of the income statement and the balance sheet as
well as the consolidated income statement and the consolidated balance sheet for the financial year ended 31 December 2015
• Appropriation of the results as of 31 December 2015 and payment of a dividend amounting to SEK 1.75 per ordinary share, in total SEK 45,741,173
• Discharge of the liability of the members of the Board of Directors of the Company and the managing director of the Company for, and in connection with, the financial year ended 31 December 2015
• Determination of the number of the members of the Board of Directors of the Company
• Reelection of some existing Directors and election of new Directors and the Chairman of the Board of Directors for the period until the close of the next AGM
• Reelect the Company auditor Ernst & Young Aktiebolag, with Erik Åström as the main responsible auditor, for a period of four years in accordance with § 6 in the articles of association
• Determination of Directors’ and the auditors’ fees
Corporate Governance Report
60 Transcom Annual Report 2016

• Adoption of the procedures for establishment of the Nomination Committee
• Adoption of guidelines for remuneration of senior executives • Adoption of LTIP 2016.
The minutes of the 2016 AGM are available on Transcom’s website.
2017 AGMThe AGM shall be held within six months after the end of the financial year. Shareholders wishing to have matters considered at the AGM should submit their proposals in writing at least seven weeks before the AGM in order to guarantee that their proposals may be included in the notice to the AGM. Details on how and when to submit proposals to Transcom can be found on Transcom’s website. Shareholders who wish to participate in the AGM must be duly registered as such with Euroclear Sweden AB on the record date for the AGM. The shareholders may then attend and vote at the meeting in person or by proxy. A shareholder wishing to attend the AGM must notify Transcom of his or her intention to attend. All relevant instructions in relation to the participation at the AGM shall be included in the convening notice to the AGM.
The AGM for the financial year 2016 is scheduled to be held on 26 April 2017 in Stockholm (the “2017 AGM’’).
NOMINATION COMMITTEE According to the instructions adopted by the AGM 2016, the Nomination Committee is to consist of at least three members appointed by the largest shareholders of Transcom (given that they elected to appoint a member). The Nomination Committee is formed each year in October in consultation with the largest shareholders of Transcom as per 30 September each year (the “Nomination Committee’’).
The Nomination Committee is now comprised of Mattias Holmström representing Altor Fund Manager AB, Daniel Nyhrén representing Creades AB, Johan Strandberg representing SEB S.A. and Arne Lööw representing The Fourth Swedish National Pension Fund (Fjärde APfonden). Mattias Holmström has been appointed Committee Chairman. The members of the Nomination Committee do not receive any remuneration for their work. • Three members are independent visàvis the largest share
holder, and • Four members are independent visàvis the management and
the Company.
The Nomination Committee’s tasks include:• Evaluation of the Board of Directors’ work and composition • Submission of the proposals to the AGM regarding the election
of the Board of Directors and the Chairman of the Board
• Preparations of the proposals regarding the election of auditors in cooperation with the Audit Committee (when appropriate)
• Preparations of the proposals regarding the fees to be paid to Board Directors and to the Company’s auditors
• Preparations of the proposals for the Chairman of the AGM, and• Preparations of the proposals for the administration and order of
appointment of the Nomination Committee for the AGM.
The Nomination Committee invites proposals from shareholders wishing to propose candidates for election to the Board of Directors. The Nomination Committee will submit a proposal for the composition of the Board of Directors; remuneration for the Board of Directors and the auditor; and a proposal on the Chairman of the 2017 AGM, which will be presented to the 2017 AGM for approval. The Nomination Committee met four times during 2016:
Meetings attended
Niclas Ekestubbe 3/4
Arne Lööw 4/4
Mattias Holmström 1/4
Daniel Nyhrén 4/4
Johan Strandberg 4/4
BOARD OF DIRECTORSAs per the applicable Swedish laws, the Board of Directors is elected by shareholders’ meetings, and can be removed at any time, with or without cause, by a resolution in shareholders’ meetings. The Board of Directors of the Company (the “Board of Directors’’) is ultimately responsible for the organization of Transcom and the management of its operations.
Composition of the Board of Directors of the CompanyThe Board of Directors as at 31 December 2016 is comprised of six directors whereof: • Three directors are independent visàvis major shareholders and • Six directors are independent visàvis the management and the
Company.
In the 2016 AGM, Liselotte Hägertz Engstam and Erik Törnberg were elected as new directors whereas Alexander Izosimov and Per Frankling declined reelection. Henning Boysen, Mikael Larsson, Klas Johansson and Fredrik Cappelen were reelected as directors. For summary curriculum vitae for each director, the list of material positions held by them in other companies, remuneration, attendance in Board and committee meetings, refer to the table on pages 68–69 of this report.
61Transcom Annual Report 2016
Corporate Governance Report
Remuneration of the Board of DirectorsThe remuneration of the members of the Board of Directors is proposed by the Nomination Committee and approved by the AGM. The Nomination Committee proposal is based on benchmarking of peer group company compensation and company size. The members of the Board of Directors do not participate in the Group’s incentive schemes. Furthermore, Transcom did not grant any loan to any member of its Board of Directors.
The total amount of remuneration and other benefits granted directly or indirectly by the Company to the members of its Board of Directors is provided in note 5.
Responsibilities and duties of the Board of DirectorsThe Board of Directors is in charge of the overall governance and strategic direction of the Company. The Board of Directors provides effective support for, and control of, the activities of the Group Executive Management team. It is responsible for the performance of all acts of administration necessary for accomplishing the Company’s purposes, except for matters reserved by Swedish law to the general meeting of shareholders.
The Board of Directors has adopted rules of procedure for its internal activities which include rules pertaining to the number of Board meetings to be held, the matters to be handled at such regular Board meetings, and the duties of the Chairman (the “Rules of Procedure’’). The work of the Board is also governed by rules and regulations which include the Swedish Companies Act, the Articles of Association, and the Code as well as internal policy documents.
In order to carry out its work more effectively, the Board of Directors has created a Remuneration Committee and an Audit Committee. The Rules of Procedure specify the duties that the board has delegated to Remuneration and Audit Committee and how the committees are to report to the board. These committees handle business within their respective areas and present recommendations and reports on which the Board of Directors may base its decisions and actions. However, all members of the Board of Directors have the same responsibility for decisions made and actions taken, irrespective of whether issues have been reviewed by such committees or not.
In 2016, the Board addressed and discussed the following (apart from regular matters in the annual Board work cycle):• Continuous work relating to strategic plans and direction• Review and approval of new contact centers and other investment proposals• Corporate social responsibility• Compliance• Organizational design and alignment• The Group Executive Management’s updated risk assessment.
The Board held fifteen meetings during 2016. During 2016, the statutory auditor attended one meeting without the presence of management. For details of attendance see pages 68–69.
Evaluation of the Board and its Committees The Board of Directors carries out an annual assessment wherein the Board of Directors evaluates its own performance and the performance of its committees through a systematic and structured process aimed, among other things, at gathering good documentation as a basis for improvements in the Board of Directors work. As part of the evaluation process, the Chairman of the Board of Directors carried out feedback sessions with board members, which also included feedback on performance in committees. This annual assessment process also entails a review of competencies, board process and internal communication within the board. A summary of the evaluation is also presented to the Nomination Committee. Where deemed relevant, actions were taken to further enhance board performance.
REMUNERATION COMMITTEEAt the statutory Board of Directors meeting following the 2016 AGM, the Board of Directors decided that the Remuneration Committee be comprised of Henning Boysen, Klas Johansson and Fredrik Cappelen. Klas Johansson was elected as its Chairman.
The responsibilities of the Remuneration Committee include:• Issues concerning principles for remuneration, remunerations
and other terms of employment for the Executive Management• Monitoring and evaluating programs for variable remuneration
for the Executive Management• Reviewing performance of Group Executive Management and
of the individual executives at least once a year• Ensuring that the Group Executive Management Team has an
updated succession plan with identified emergency cover; and• Ensuring the Company has a Talent Management Program in
place and an individual development plan for key leaders.
No specific decisionmaking authority has been delegated to the Remuneration Committee.
The Remuneration Committee held four meetings during 2016. For details of attendance, refer to the table on pages 68–69.
AUDIT COMMITTEEAt the statutory Board of Directors meeting following the 2016 AGM, the Board of Directors decided that the Audit Committee be comprised of Mikael Larsson, Henning Boysen, Erik Törnberg and Klas Johansson. Mikael Larsson was elected as its Chairman.
The responsibilities of the Audit Committee include:• Ensuring quality and correctness in the Company’s financial
reporting • Reviewing and monitoring the impartiality and independence
of the External auditor
Corporate Governance Report
62 Transcom Annual Report 2016

• Assisting the Nomination Committee to prepare for the election of auditors at the AGM
• Reviewing the process for monitoring compliance with laws and regulations affecting financial reporting and Code of Business Conduct
• Evaluating the overall effectiveness of the internal control and risk management frameworks
• Evaluating the effectiveness of the internal audit function• Monitoring and securing the quality and fairness of transactions
with related parties, when applicable.
No specific decisionmaking authority has been delegated to the Audit Committee.
The Audit Committee held seven meetings during 2016. For details of attendance, refer to the table on pages 68–69. The CEO, CFO, External auditor, Head of Internal Audit, Group Financial Controller, Head of Group Tax, etc. were called to the meeting as required.
BID COMMITTEEOn 21 December , 2016, Altor announced a public cash offer to the shareholders of Transcom to transfer all of their shares in Transcom to Altor. An independent Bid Committee was formed in order to evaluate the offer and issue a recommendation to the shareholders. The committee consisted of the independent Board members Henning Boysen, MIkael Larsson and Liselotte Hägertz Engstam.
EXTERNAL AUDITORSThe registered audit firm Ernst Young AB, with the authorized public accountant Erik Åström as auditorincharge, was elected as auditor in 2016 AGM for the period ending at the close of the annual general meeting held during the fourth financial year after the appointment.
GROUP EXECUTIVE MANAGEMENTThe President and CEO, appointed by the Board of Directors, is responsible for handling the daytoday management of the Company in accordance with instructions from the Board of Directors. The President and CEO is supported by the Group Executive Management team appointed by the Board of Directors. In 2016, the Group Executive Management team included President and CEO, Group CFO, Chief Commercial Officer (CCO), Group HR Director and Regional General Managers (the “RGMs’’). A full list of its members is provided on pages 70–71.
The CEO, along with the rest of the Group Executive Management team, is responsible for the adherence to the Group’s overall strategy, financial and business control, financing, capital structure, risk management and acquisitions. Among other tasks, this includes
preparation of financial reports, capital markets communication and other issues.
Group Executove Management remunerationThe guidelines for remuneration for members of the Group Executive Management team were approved by the 2016 AGM. Refer to the 2016 AGM minutes on Transcom’s website for details. The total amount of remuneration and other benefits granted directly or indirectly by the Company to the members of its Group Executive Management team is provided in note 5.
Transcom did not grant any loan to any member of its Group Executive Management team .
INTERNAL CONTROLThe Board of Directors has overall responsibility for Transcom’s risk and internal control systems and for monitoring their effectiveness. The Board of Directors monitors the ongoing process by which critical risks to the business are identified, evaluated and managed.
Transcom’s internal control systems are designed to manage, rather than eliminate risks that might affect the achievement of its objectives, and can only provide reasonable and not absolute assurance against material misstatement or loss. In assessing what constitutes reasonable assurance, the Board of Directors and the Executive Management considers the materiality of financial and nonfinancial risks and the relationship between the costs of, and benefit from, internal control systems.
The principal features of the Group’s systems of internal control are designed to: • Maintain proper accounting records• Provide reliable financial information• Identify and manage business risks• Maintain compliance with appropriate legislation and regulation; • Identify and adopt best practice; and• Safeguard assets.
Each year the Audit Committee assesses the effectiveness of Transcom’s risk management and internal controls system on the basis of: • Established policies, including those already described, which are
in place to manage perceived risks• The continuous enterprisewide process for identifying, evaluat
ing and managing the significant risks to the achievement of the Group’s objectives
• Reports to the Audit Committee on the results of External auditor’s work and Internal audit reviews, both including action plans from the concerned Management
• Results of control selfassessments over financial reporting, presented by the Management.
63Transcom Annual Report 2016
Corporate Governance Report

The Audit Committee chairman informs the Board of Directors of the results of the above.
Group Internal Audit (GIA) reviews the effectiveness of risk and internal control systems throughout the Group in accordance with the approved internal audit plan and provides the Audit Committee and the Board of Directors with an assessment of the overall effectiveness of the governance, risk management and control processes. The principal features of the control framework are detailed below.
Control environmentThe Board of Directors reviews and approves the annual budget and threeyear plan which includes a quantified assessment of planned operating and financial performance for the next financial year for each business unit, together with a strategic plan for the Group for the following two years.
Transcom has an established governance framework, the key features of which include: • Rules of procedures for the Board of Directors and instruction
for each of its committees• A clear organizational structure, with documented delegation
of authority from the Board to the CEO• Boardapproved key policies including Financial and Treasury
Management policy, Instruction for financial reporting, Insider Trading policy and Communications policy
• Boardapproved Whistleblower policy, Environmental policy, Code of Business Conduct and Supplier Code of Business Conduct to promote ethical, sustainable and transparent business practices within the Group
• A living internal governance manual, which sets out clear guidance on key decisions and risk governance across key processes; and
• Accounting manual and reporting instructions to ensure the completeness and correctness of financial reporting and its compliance with IFRS requirements.
Furthermore, a number of corporate functions are responsible for promoting effective internal controls in separately defined areas. Among these, the central finance organization, including Group Financial Control and Group Business Control, as well as the Group Communications department play important roles in ensuring correct and timely financial reporting. In addition, Group Internal Audit independently evaluates the operations of the Company to identify any shortcomings in internal controls.
Risk assessmentThe Group’s risk management and control framework is designed to support the identification, assessment, monitoring, management and control of risks that are significant to the achievement of the Group’s business objectives and to provide reliable financial information. Transcom’s risk management is based on the following key principles:a. Comprehensive scope: Risks are assessed for a number of
defined categories. The Group Executive Management team is responsible for reviewing and monitoring the financial, strategic, human resources, operational, commercial, technological, compliance and other applicable risks. It monitors the completeness of the Group’s risk profile on a regular basis through a Group risk monitoring framework. This helps the Company to proactively identify the most important risks. The risk assessment process also entails identification of risk owners in the Company
b. Regular reporting: Risks are evaluated in terms of their potential impact and likelihood. The results of the risk assessment along with mitigation plans for key risks are presented to the Audit Committee on a periodic basis for review. Further, results of risk assessment are also reported to the Board
c. Followup: Risk mitigation plans are followed up on a periodic basis and the status of mitigation plans/activities are periodically reported to the Audit Committee
d. Risks and business planning: The business plans are based on key market, client, economic and financial assumptions. The business planning process also includes an assessment of the risk and sensitivities underlying the projections.
The Group Internal Audit function is responsible for coordinating the risk management processes in the Group and consolidating the periodic risk reporting for the Board of Directors and the Audit Committee.
Transcom continuously works to improve the policies which govern the management and control of both financial and non financial risks. The adoption of these policies throughout the Group enables a broadly consistent approach to the management of risk at business unit level.
For a summary of key risks Transcom faces while operating in a highly fragmented and competitive global industry, refer to pages 66–67.
Corporate Governance Report
64 Transcom Annual Report 2016

Information and Communication Policies and guidelines of significance to financial reporting are regularly updated and communicated to the employees concerned. Detailed reporting instructions are provided to Group companies periodically.
Transcom has strengthened information and communication related to policies and governance principles by publishing an internal governance manual, which among other things incorporates a list of key policies and procedures. Key management personnel (everyone who reports into Group Executive Management members) have signed the internal governance manual.
Further, all employees are required to sign the Code of Business Conduct when starting their employment with Transcom and are given suitable training on the key values. Also, Transcom has implemented a Supplier Code of Business Conduct to promote ethical business practices in our supply chain.
Control activitiesThe RGMs, with support from their respective management teams, are responsible for the implementation of control activities in compliance with Transcom’s policies and governance documents (including the Accounting policy) as well as for managing any further risks that they may identify. This includes controls in the financial reporting processes as well as controls in other processes which could be expected to impact financial reporting.
The Audit Committee, in addition to the Board, reviews every interim and Annual Report prior to publication.
Follow-upMonthly performance and financial reports are produced for each business unit, with comparisons to budget. Reports are consolidated for overall review by the corporate team (CEO, CFO, CCO and Group HR Director) together with forecasts for the income statement and cash flow.
The Board of Directors also regularly reviews the actual performance of the business compared with budgets and forecasts, as well as other key performance indicators. The Board of Directors reviews the effectiveness of established internal controls through the Audit Committee, as described above.
Transcom’s Group Internal Audit function is responsible for following up on critical risks and action plans and reporting the status of action plans to the Audit Committee on a periodic basis. Further Transcom’s annual internal audit plan, that is, the scope and the areas of operations to be reviewed during audits, is reviewed and approved each year by the Audit Committee. Riskbased internal audits are carried out independently to evaluate if the key risks are managed appropriately.
CORPORATE RESPONSIBILITYControl against corruption Transcom is a signatory of the UN Global Compact. In order to be successful and create value, Transcom needs to meet the expectations of all its key stakeholders: clients, employees and investors, as well as the communities that the Company is a part of. This is the basis for Transcom’s CSR work, which forms an integral part of the Company’s daytoday business activities. At Transcom, CSR means that we always do our utmost to do the right thing by our clients, our people and our communities. This ambition is encapsulated in Transcom Cares, the Company’s CSR governance framework, launched on a global level in 2013. Transcom’s Code of Business Conduct, available in 17 languages, covers the four areas of The UN Global Compact, environmental care, human rights, labor rights and anticorruption practices, all of which Transcom respects and supports fully. The principles are an integral part of Transcom’s corporate strategy.
Whistleblower processThe Board of Directors has established a whistle blowing process which enables personnel to report violations in accounting, reporting, internal controls, noncompliance with Code of Business Conduct, Group policies, applicable laws, etc. Personnel are requested to report the matters to local Human Resources manager or to Transcom’s internal whistle blower function at whistleblower. [email protected]. The whistleblower reporting mechanism also facilitates anonymous reporting. All allegations are taken seriously and an enquiry is conducted to not only investigate the alleged violations, but also to identify root causes to facilitate further strengthening of internal controls.
65Transcom Annual Report 2016
Corporate Governance Report
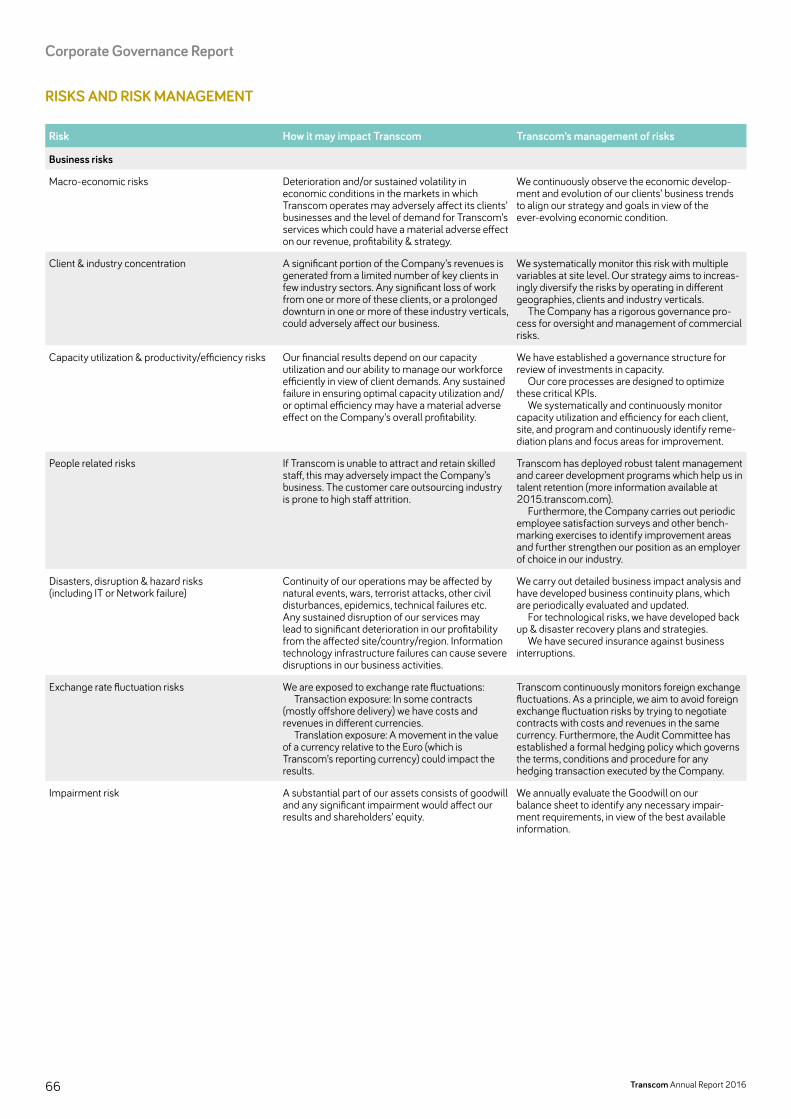
RISKS AND RISK MANAGEMENT
Risk How it may impact Transcom Transcom’s management of risks
Business risks
Macroeconomic risks Deterioration and/or sustained volatility in economic conditions in the markets in which Transcom operates may adversely affect its clients’ businesses and the level of demand for Transcom’s services which could have a material adverse effect on our revenue, profitability & strategy.
We continuously observe the economic development and evolution of our clients’ business trends to align our strategy and goals in view of the everevolving economic condition.
Client & industry concentration A significant portion of the Company’s revenues is generated from a limited number of key clients in few industry sectors. Any significant loss of work from one or more of these clients, or a prolonged downturn in one or more of these industry verticals, could adversely affect our business.
We systematically monitor this risk with multiple variables at site level. Our strategy aims to increasingly diversify the risks by operating in different geographies, clients and industry verticals.
The Company has a rigorous governance process for oversight and management of commercial risks.
Capacity utilization & productivity/efficiency risks Our financial results depend on our capacity utilization and our ability to manage our workforce efficiently in view of client demands. Any sustained failure in ensuring optimal capacity utilization and/or optimal efficiency may have a material adverse effect on the Company’s overall profitability.
We have established a governance structure for review of investments in capacity.
Our core processes are designed to optimize these critical KPIs.
We systematically and continuously monitor capacity utilization and efficiency for each client, site, and program and continuously identify remediation plans and focus areas for improvement.
People related risks If Transcom is unable to attract and retain skilled staff, this may adversely impact the Company’s business. The customer care outsourcing industry is prone to high staff attrition.
Transcom has deployed robust talent management and career development programs which help us in talent retention (more information available at 2015.transcom.com).
Furthermore, the Company carries out periodic employee satisfaction surveys and other benchmarking exercises to identify improvement areas and further strengthen our position as an employer of choice in our industry.
Disasters, disruption & hazard risks (including IT or Network failure)
Continuity of our operations may be affected by natural events, wars, terrorist attacks, other civil disturbances, epidemics, technical failures etc. Any sustained disruption of our services may lead to significant deterioration in our profitability from the affected site/country/region. Information technology infrastructure failures can cause severe disruptions in our business activities.
We carry out detailed business impact analysis and have developed business continuity plans, which are periodically evaluated and updated.
For technological risks, we have developed back up & disaster recovery plans and strategies.
We have secured insurance against business interruptions.
Exchange rate fluctuation risks We are exposed to exchange rate fluctuations: Transaction exposure: In some contracts
(mostly offshore delivery) we have costs and revenues in different currencies.
Translation exposure: A movement in the value of a currency relative to the Euro (which is Transcom’s reporting currency) could impact the results.
Transcom continuously monitors foreign exchange fluctuations. As a principle, we aim to avoid foreign exchange fluctuation risks by trying to negotiate contracts with costs and revenues in the same currency. Furthermore, the Audit Committee has established a formal hedging policy which governs the terms, conditions and procedure for any hedging transaction executed by the Company.
Impairment risk A substantial part of our assets consists of goodwill and any significant impairment would affect our results and shareholders’ equity.
We annually evaluate the Goodwill on our balance sheet to identify any necessary impairment requirements, in view of the best available information.
Corporate Governance Report
66 Transcom Annual Report 2016
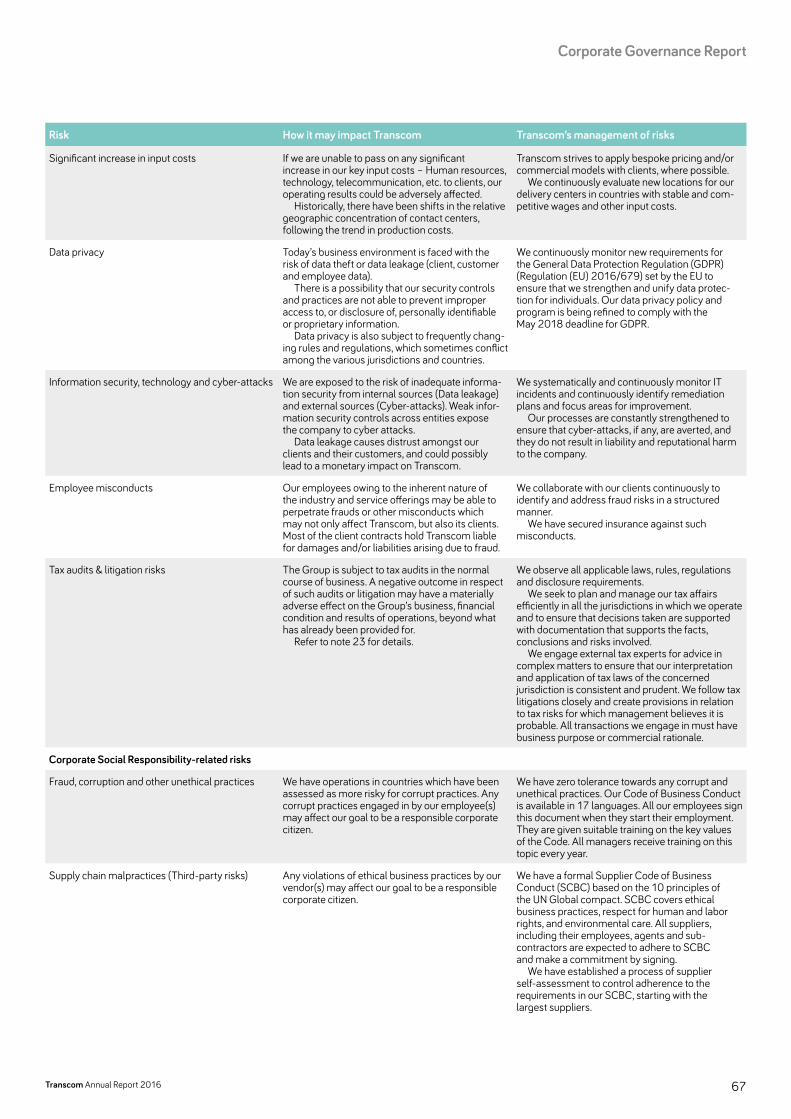
Risk How it may impact Transcom Transcom’s management of risks
Significant increase in input costs If we are unable to pass on any significant increase in our key input costs – Human resources, technology, telecommunication, etc. to clients, our operating results could be adversely affected.
Historically, there have been shifts in the relative geographic concentration of contact centers, following the trend in production costs.
Transcom strives to apply bespoke pricing and/or commercial models with clients, where possible.
We continuously evaluate new locations for our delivery centers in countries with stable and competitive wages and other input costs.
Data privacy Today’s business environment is faced with the risk of data theft or data leakage (client, customer and employee data).
There is a possibility that our security controls and practices are not able to prevent improper access to, or disclosure of, personally identifiable or proprietary information.
Data privacy is also subject to frequently changing rules and regulations, which sometimes conflict among the various jurisdictions and countries.
We continuously monitor new requirements for the General Data Protection Regulation (GDPR) (Regulation (EU) 2016/679) set by the EU to ensure that we strengthen and unify data protection for individuals. Our data privacy policy and program is being refined to comply with the May 2018 deadline for GDPR.
Information security, technology and cyberattacks We are exposed to the risk of inadequate information security from internal sources (Data leakage) and external sources (Cyberattacks). Weak information security controls across entities expose the company to cyber attacks.
Data leakage causes distrust amongst our clients and their customers, and could possibly lead to a monetary impact on Transcom.
We systematically and continuously monitor IT incidents and continuously identify remediation plans and focus areas for improvement.
Our processes are constantly strengthened to ensure that cyberattacks, if any, are averted, and they do not result in liability and reputational harm to the company.
Employee misconducts Our employees owing to the inherent nature of the industry and service offerings may be able to perpetrate frauds or other misconducts which may not only affect Transcom, but also its clients. Most of the client contracts hold Transcom liable for damages and/or liabilities arising due to fraud.
We collaborate with our clients continuously to identify and address fraud risks in a structured manner.
We have secured insurance against such misconducts.
Tax audits & litigation risks The Group is subject to tax audits in the normal course of business. A negative outcome in respect of such audits or litigation may have a materially adverse effect on the Group’s business, financial condition and results of operations, beyond what has already been provided for.
Refer to note 23 for details.
We observe all applicable laws, rules, regulations and disclosure requirements.
We seek to plan and manage our tax affairs efficiently in all the jurisdictions in which we operate and to ensure that decisions taken are supported with documentation that supports the facts, conclusions and risks involved.
We engage external tax experts for advice in complex matters to ensure that our interpretation and application of tax laws of the concerned jurisdiction is consistent and prudent. We follow tax litigations closely and create provisions in relation to tax risks for which management believes it is probable. All transactions we engage in must have business purpose or commercial rationale.
Corporate Social Responsibility-related risks
Fraud, corruption and other unethical practices We have operations in countries which have been assessed as more risky for corrupt practices. Any corrupt practices engaged in by our employee(s) may affect our goal to be a responsible corporate citizen.
We have zero tolerance towards any corrupt and unethical practices. Our Code of Business Conduct is available in 17 languages. All our employees sign this document when they start their employment. They are given suitable training on the key values of the Code. All managers receive training on this topic every year.
Supply chain malpractices (Thirdparty risks) Any violations of ethical business practices by our vendor(s) may affect our goal to be a responsible corporate citizen.
We have a formal Supplier Code of Business Conduct (SCBC) based on the 10 principles of the UN Global compact. SCBC covers ethical business practices, respect for human and labor rights, and environmental care. All suppliers, including their employees, agents and subcontractors are ex pec ted to adhere to SCBC and make a commitment by signing.
We have established a process of supplier selfassessment to control adherence to the requirements in our SCBC, starting with the largest suppliers.
67Transcom Annual Report 2016
Corporate Governance Report

Board of Directors
Name (born) Henning Boysen (1946) Fredrik Cappelen (1957) Liselotte Hägertz Engstam (1960)
Function Chairman of the Board since 2014 (chairman of Transcom WorldWide S.A.’s Board, 2012–2014).Elected to the Board in 2014 (joined Transcom WorldWide S.A.’s Board in 2009).Member of the Remuneration Committee and the Audit Committee.
Elected to the Board in 2015. Elected to the Board in 2016.
Education Mr Boysen holds a Masters in Economics from Aarhus University, Denmark.
Mr. Cappelen holds a MSc in Economics from Uppsala University.
Ms Engstam holds an MSc in Civil Engineering from Chalmers University of Technology and INSEAD International Directors Program Certification (IDPC).
Nationality Danish citizen Swedish citizen Swedish citizen
Other assignments Chairman of Apodan Nordic, Chairman of Nupo AS.
Chairman of the board of directors of Dustin Group AB, Dometic AB and Terveystalo Oy, and board member of Securitas AB.
Chairman of the Board of Digoshen AB, board member of Knowit Group AB (publ), Zalaris A/S (publ), SGroup AB and Itello AB.
Principal work experience Mr Boysen was Chairman of Kuoni, one of Europe’s leading leisure travel companies, 20062014, board member since 2003. Chairman of Global Blue SA 20082012. Mr Boysen was formerly President and CEO of Gate Gourmet from 1996 to 2004. Between 1988 and 1992 he was COO and Deputy President of Saudia Catering in Saudi Arabia. Mr Boysen holds a Masters in Economics from Aarhus University, Denmark.
Previously the chairman of the board of directors of Byggmax Group AB, Svedbergs i Dalstorp AB, Sanitec Oy, Granngården AB, Munksjö AB, Munksjö Holding AB, GG Holding AB, Carnegie Holding AB and Carnegie Investment Bank AB as well as board member in Cramo Oy, Munksjö Oy and WPO Service AB.
Previously Vice President Head Nordic region at HCL Technologies, various international executive positions at IBM, member of the board of Moment Projektkonsult AB and GAIA Leadership AB.
Total fees 2016 (EUR) 105,000 46,000 43,000
Board meeting Attendance1 15 out of 15 (Chair) 15 out of 15 10 out of 10
Remuneration Committee Attendance 4 out of 4 2 out of 3 N.A.
Audit Committee Attendance 6 out of 7 N.A. N.A.
Independence to Transcom and its Management Independent Independent Independent
Independence to major shareholders Independent Not independent Independent
1) Board meeting attendance of former board members during 2016: Per Frankling (5 out of 5), Alexander Isozimov (4 out of 5)
Corporate Governance Report
68 Transcom Annual Report 2016

Klas Johansson (1976) Mikael Larsson (1968) Erik Törnberg (1970)
Elected to the Board in 2015.
Member of the Audit Committee and chairman of the Remuneration Committee.
Elected to the Board in 2014 ( member of the Board of Transcom WorldWide S.A., 2012–2014).
Chairman of the Audit Committee.
Elected to the Board in 2016.
Member of the Audit Committee.
Mr. Johansson holds a MSc from the Stockholm School of Economics.
Mr. Larsson is a graduate in Business Administration from Uppsala University.
Erik Törnberg holds a MSc from the Stockholm School of Economics.
Swedish citizen Swedish citizen Swedish citizen
Board member of Carnegie, CTEK, Gelato Group and Nova Austral.
Member of the boards of a number of subsidiaries within the Com Hem Holding AB Group.
Member of the Board of Röhnisch Sportswear, Tink AB and Kaching AB.
Klas Johansson is a Partner at Altor. Previously, Klas was an employee of McKinsey & Company and has served as board member of Ewos and as deputy board member of Lindorff.
Mr Larsson is Chief Financial Officer of Com Hem since May 2015. He served as Chief Financial Officer of Investment AB Kinnevik between 2001 and February 2015. Prior to joining Kinnevik, Mr. Larsson worked six years with audit and transaction advisory services at Arthur Andersen in Stockholm and held a position as Group Controller at Thomas Cook Northern Europe.
Erik Törnberg is Head of Investments at Creades AB.
Previously Head of Investments at Investment AB Öresund, Investment Director at AB Custos and TMT One AB and Investment Manager at AB Custos. Previously board member of e.g. Carnegie Holding AB, Carnegie Investment Bank AB, eWork Scandinavia AB (publ), Creades AB, Klarna Holding AB, Klarna AB, HQ Fonder Sverige AB, Catena AB (publ) and C. TybringGjedde ASA.
55,000 59,000 50,000
14 out of 15 15 out of 15 9 out of 10
4 out of 4 N.A. N.A.
7 out of 7 7 out of 7 5 out of 5
Independent Independent Independent
Not independent Independent Not independent.
69Transcom Annual Report 2016
Corporate Governance Report
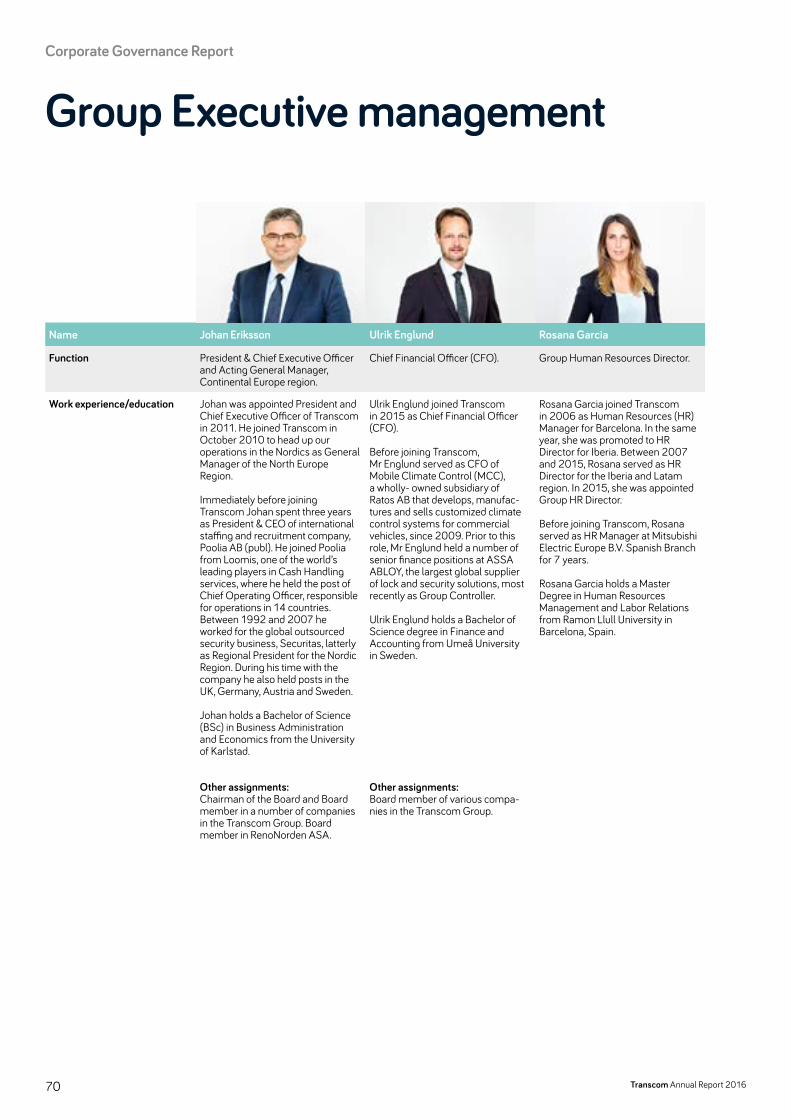
Group Executive management
Name Johan Eriksson Ulrik Englund Rosana Garcia
Function President & Chief Executive Officer and Acting General Manager, Continental Europe region.
Chief Financial Officer (CFO). Group Human Resources Director.
Work experience/education Johan was appointed President and Chief Executive Officer of Transcom in 2011. He joined Transcom in October 2010 to head up our operations in the Nordics as General Manager of the North Europe Region.
Immediately before joining Transcom Johan spent three years as President & CEO of international staffing and recruitment company, Poolia AB (publ). He joined Poolia from Loomis, one of the world’s leading players in Cash Handling services, where he held the post of Chief Operating Officer, responsible for operations in 14 countries. Between 1992 and 2007 he worked for the global outsourced security business, Securitas, latterly as Regional President for the Nordic Region. During his time with the company he also held posts in the UK, Germany, Austria and Sweden.
Johan holds a Bachelor of Science (BSc) in Business Administration and Economics from the University of Karlstad.
Other assignments: Chairman of the Board and Board member in a number of companies in the Transcom Group. Board member in RenoNorden ASA.
Ulrik Englund joined Transcom in 2015 as Chief Financial Officer (CFO).
Before joining Transcom, Mr Englund served as CFO of Mobile Climate Control (MCC), a wholly owned subsidiary of Ratos AB that develops, manufactures and sells customized climate control systems for commercial vehicles, since 2009. Prior to this role, Mr Englund held a number of senior finance positions at ASSA ABLOY, the largest global supplier of lock and security solutions, most recently as Group Controller.
Ulrik Englund holds a Bachelor of Science degree in Finance and Accounting from Umeå University in Sweden.
Other assignments: Board member of various companies in the Transcom Group.
Rosana Garcia joined Transcom in 2006 as Human Resources (HR) Manager for Barcelona. In the same year, she was promoted to HR Director for Iberia. Between 2007 and 2015, Rosana served as HR Director for the Iberia and Latam region. In 2015, she was appointed Group HR Director.
Before joining Transcom, Rosana served as HR Manager at Mitsubishi Electric Europe B.V. Spanish Branch for 7 years.
Rosana Garcia holds a Master Degree in Human Resources Management and Labor Relations from Ramon Llull University in Barcelona, Spain.
Corporate Governance Report
70 Transcom Annual Report 2016
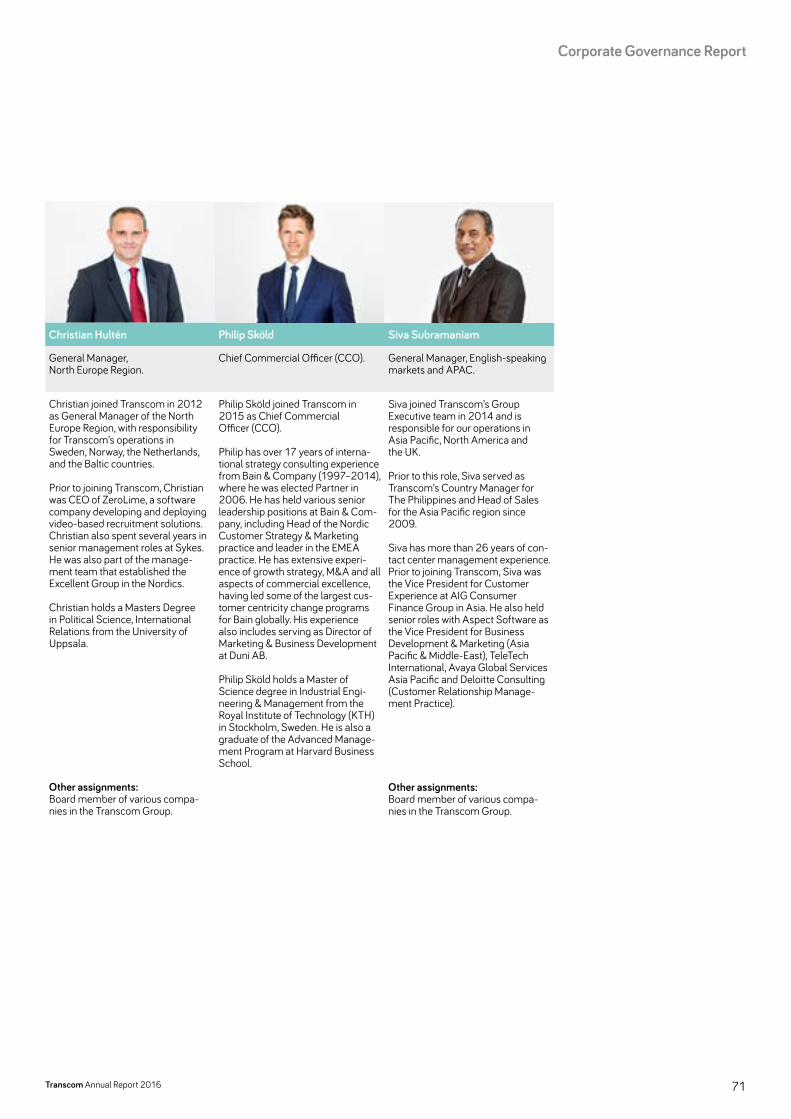
Christian Hultén Philip Sköld Siva Subramaniam
General Manager, North Europe Region.
Chief Commercial Officer (CCO). General Manager, Englishspeaking markets and APAC.
Christian joined Transcom in 2012 as General Manager of the North Europe Region, with responsibility for Transcom’s operations in Sweden, Norway, the Netherlands, and the Baltic countries.
Prior to joining Transcom, Christian was CEO of ZeroLime, a software company developing and deploying videobased recruitment solutions. Christian also spent several years in senior management roles at Sykes. He was also part of the management team that established the Excellent Group in the Nordics.
Christian holds a Masters Degree in Political Science, International Relations from the University of Uppsala.
Other assignments: Board member of various companies in the Transcom Group.
Philip Sköld joined Transcom in 2015 as Chief Commercial Officer (CCO).
Philip has over 17 years of international strategy consulting experience from Bain & Company (1997–2014), where he was elected Partner in 2006. He has held various senior leadership positions at Bain & Company, including Head of the Nordic Customer Strategy & Marketing practice and leader in the EMEA practice. He has extensive experience of growth strategy, M&A and all aspects of commercial excellence, having led some of the largest customer centricity change programs for Bain globally. His experience also includes serving as Director of Marketing & Business Development at Duni AB.
Philip Sköld holds a Master of Science degree in Industrial Engineering & Management from the Royal Institute of Technology (KTH) in Stockholm, Sweden. He is also a graduate of the Advanced Management Program at Harvard Business School.
Siva joined Transcom’s Group Executive team in 2014 and is responsible for our operations in Asia Pacific, North America and the UK.
Prior to this role, Siva served as Transcom’s Country Manager for The Philippines and Head of Sales for the Asia Pacific region since 2009.
Siva has more than 26 years of contact center management experience. Prior to joining Transcom, Siva was the Vice President for Customer Experience at AIG Consumer Finance Group in Asia. He also held senior roles with Aspect Software as the Vice President for Business Development & Marketing (Asia Pacific & MiddleEast), TeleTech International, Avaya Global Services Asia Pacific and Deloitte Consulting (Customer Relationship Management Practice).
Other assignments: Board member of various companies in the Transcom Group.
71Transcom Annual Report 2016
Corporate Governance Report
Stockholm, April 5, 2017
The Board of Directors in Transcom WorldWide AB (publ)
Henning Boysen Chairman of the Board
Fredrik Cappelen Liselotte Hägertz Engstam Klas Johansson Member of the Board Member of the Board Member of the Board
Mikael Larsson Erik Törnberg Member of the Board Member of the Board
Johan Eriksson President & CEO
72 Transcom Annual Report 2016
Corporate Governance Report
Auditor’s report on the Corporate Governance StatementTo the annual meeting of the shareholders of Transcom WorldWide AB, corporate identity number 556880-1277
The board of directors is responsible for the corporate governance report on pages 59–72 and that it has been prepared in accordance with the Annual Accounts Act.
We have performed our review in accordance with FAR’s statement RevU 16 The auditor’s review of the corporate governance report. This means that our review of the corporate governance report is limited compared to an audit in accordance with ISA and generally accepted auditing standards in Sweden. We believe that our review is sufficient and provides a basis for our opinions.
A corporate governance report has been prepared. Disclosures in accordance with chapter 6, 6 § second section, item 2–6 in the Swedish Annual Accounts Act and chapter 7, 31 § second section of the same law are consistent with other parts of the annual accounts and consolidated accounts and in accordance with the Swedish Annual Accounts Act.
Stockholm, April 5, 2017Ernst & Young AB
Erik ÅströmAuthorized Public Accountant
Translation from the Swedish original
73Transcom Annual Report 2016
Auditor’s report

ContactCorporate and registered office Transcom WorldWide AB (publ)Gjörwellsgatan 30SE112 60 StockholmSwedenCompany registration number: 5568801277www.transcom.com
Investor relationsGjörwellsgatan 302nd FloorSE112 60 StockholmSweden
Tel: +46 70 776 80 88Email: [email protected]
74 Transcom Annual Report 2016

Print: Bording AB, Sweden, 2017. Photo: Shutterstock (cover), Mats Lundqvist (page 3), and Transcom (pages 68–71).

Transcom WorldWide AB (publ)Gjörwellsgatan 30SE112 60 StockholmSwedenCompany registration number: 5568801277www.transcom.com