ANNUAL REPORT 2016 - TCU Financial Group › SharedContent › ...Advisors offer investors access to...
57
CREDIT UNION ANNUAL REPORT 2016 CREDIT UNION
Transcript of ANNUAL REPORT 2016 - TCU Financial Group › SharedContent › ...Advisors offer investors access to...

C R E D I T U N I O N
ANNUAL REPORT
2016
C R E D I T U N I O N
TABLE OF CONTENTS
Message from Board of Directors’ Chair and Chief Executive Officer ............................................................................. 2
Board of Directors ........................................................................................................................................................... 4
Management Discussion and Analysis ............................................................................................................................ 5
Management of Risk ......................................................................................................................................................13
Management’s Responsibility .........................................................................................................................................17
Independent Auditors’ Report .........................................................................................................................................18
Consolidated Financial Statements ................................................................................................................................19
Notes to the Consolidated Financial Statements ............................................................................................................24
Credit Union Deposit Guarantee Corporation .................................................................................................................54
Officers & Vice Presidents ..............................................................................................................................................55
1

MESSAGE FROM BOARD OF DIRECTORS’ CHAIR AND CHIEF EXECUTIVE OFFICER
On behalf of the Board of Directors and staff, it is our privilege to present an overview of the exciting things that have been taking place within TCU Financial Group (TCU) and in the financial services sector through the information provided in this 2016 Annual Report.
Employees are a company’s greatest asset – they’re your competitive advantage. You want to attract and retain the best; provide them with encouragement, stimulus, and make them feel that they are an integral part of the company’s mission.
Anne M. Mulcahy
Over the past year, TCU has continued its focus of investing in our greatest assets, our people. The world of financial services continues to evolve rapidly, and from one year to the next there is always something new and revolutionary that is disrupting our industry. Without the proper investment in our people, we will not be able to grow and develop the skills necessary to continue doing business and serving our members.
In 2016, the concept of Fintechs and Robo Advisors were the newest disruptors being discussed in financial services. These disruptors are changing the way people receive financial services. Gone are the days of making an appointment to meet someone face to face to discuss your lending or investing needs. Fintechs allow people to apply for loans and have them approved and funded without ever setting foot in a financial institution. Robo Advisors offer investors access to a low cost pool of investments. Both Robo Advisors and Fintech firms address the needs of a certain segment of the population but the jury is still out whether or not there will be mass adoption.
Technology firms are targeting and focusing on the most profitable business lines from traditional financial services firms. By focusing on one specific product or service and delivering it over digital channels, they don’t have the overhead that traditional financial institutions have and therefore can do things at a much lower cost. You won’t find these providers in your community operating from the traditional bricks and mortar buildings that we operate in. The personal touch that you’ve grown accustomed to is at risk of becoming obsolete as these new entrants pop up and enter our marketplace. For the most part, this segment of the marketplace is unregulated which makes it much more difficult for those offering products and services in the traditional sense to compete as effectively.
The pace of change within our industry will not be slowing down anytime soon so we need to do our part to stay up to speed and be able to react quickly as fast followers. The new disruptors that we are hearing about now are Block Chain, Crypto Currencies, and Artificial Intelligence to name a few. Hold on because things are going to start moving even faster as technologies improve.
Financial Strength TCU financial results in 2016 were better than anticipated but most importantly, we managed to grow and remain profitable. The continued uncertainty in the economy did not show any signs of reversing as commodity prices remained low. We maintained our position as the 6th largest credit union in Saskatchewan with assets of $721 million on the credit union side and another $195 million of assets under administration on the wealth management side.
2

As it stands, we do not anticipate 2017 to look all that much different from 2016 in terms of performance and growth. Continued downward pressure on commodity prices and uncertainty in the economy will all contribute to muted growth in 2017. During this slowdown in the economy, we will make the necessary investments in our people and service delivery model to address the ever changing financial services landscape.
Our People TCU invested close to $300,000 back into the community by way of sponsorship, donation and staff involvement. Major partnerships in 2016 included TCU Place, Saskatoon Minor Football (SMF) Field, Children’s Hospital Foundation (CHF), Family Service Regina, Action on Child Hunger (REACH) and Saskatoon Food Bank and Learning Centre.
TCU staff members volunteered more than 300 hours to community initiatives, such as the CHF Radiothon, Saskatoon Food Bank Garden Patch and Earth Day clean up. TCU encourages and supports our employee volunteer efforts. We provide every employee with the opportunity to take one day off with pay, which they can use to volunteer and give back.
TCU is focused on empowering and developing our employee skills and knowledge. The result of this focus means better advice and service to our members. As our members’ needs evolve, so too must our ability to serve and meet the changing needs of the people we do business with. We will continue investing in our people so they can provide you with the expert advice you need to meet your financial goals.
Our Board of Directors believes and is committed to enhancing and developing their skills and knowledge to be better directors. The expectations and demands faced by our board are increasing every year. Your board is committed to continuous learning and development to stay on top of the changes taking place in our industry.
Our Future The future of banking is here, and will continue to evolve. Year after year we see reductions in the number of in branch and face to face interactions we have with members. As mobile technology continues to improve and expand, we expect the number of face to face transactions to decline. As a result, we need to position ourselves to be able to respond when members are using technology to conduct business with us. Greater investments in our contact centre will ensure you can reach us when you need us.
We look forward to serving you in 2017 and beyond.
Respectfully,
Earl Warwick George Greenwood Chair – Board of Directors Chief Executive Officer
3

Earl Warwick Chair
SaskatoonTerm Expires: 2018
Tony LinnerVice ChairSaskatoon
Term Expires: 2018
Ginger AppelSaskatoon
Term Expires: 2019
Brendan BitzSaskatoon
Term Expires: 2017
Stephanie MansfieldRegina
Term Expires: 2019
Derwyn Crozier-SmithSaskatoon
Term Expires: 2019
Darcy McLeanSaskatoon
Term Expires: 2017
Graham MickleboroughRegina
Term Expires: 2017
Joanne WeningerSaskatoon
Term Expires: 2018
Steve TunisonRegina
Term Expires: 2019
2016 BOARD OF DIRECTORS
BOARD OF DIRECTORS
4

MANAGEMENT DISCUSSION & ANALYSIS
The Management Discussion & Analysis (MD & A) is presented to enable readers to assess material changes in the financial conditions and operating results of TCU Financial Group Credit Union for the year ended December 31, 2016, compared with prior years. This MD & A is prepared in conjunction with the Consolidated Financial Statements and related Notes for the year ended December 31, 2016, and should be read together. Unless otherwise indicated, all amounts are expressed in Canadian dollars and have been primarily derived from the Credit Union’s annual Consolidated Financial Statements prepared in accordance with the International Financial Reporting Standards (IFRS).
CORPORATE PROFILE TCU Financial Group Credit Union (TCU) is a Saskatchewan Credit Union regulated by The Credit Union Act (1998) and The Credit Union Regulations (1999). TCU must also comply with the Credit Union Deposit Guarantee Corporation’s (CUDGC) Standards of Sound Business Practice, and with our own articles, bylaws and policies. The Board of Directors is ultimately responsible for ensuring that TCU is managed and operated in a sound and prudent manner. TCU’s management is responsible for managing, monitoring and controlling credit union operations in accordance with the legislation, the standards and Board policy.
TCU’s mandate is to provide our members with a full range of financial products and services, which includes banking and wealth management services. These products and services will be delivered through one of the following business units of the Credit Union:
• The Credit Union provides the traditional retail banking services and products such as consumer and business loans, consumer and business deposit account products, ATM, internet banking facilities and Wealth Management.
• TCU Holdings Inc. is a wholly-owned subsidiary of TCU, and holds and manages all the TCU buildings and land.
TCU is the sixth largest credit union in Saskatchewan with assets of $721,073,000. In addition, TCU has assets under administration of $4,556,000 in syndicated loans. Wealth Management has assets under administration of $194,899,000.
TCU serves 19,500 members through five retail branch locations in Regina and Saskatoon. Head Office is located in Saskatoon.
GOVERNANCE As a financial co-operative, TCU Financial Group Credit Union is governed by a Board of Directors which is comprised of ten Directors, all of whom are independent. The functions of the Board include the sanctioning of strategic business plans, corporate mission, vision, values and guiding principles; monitoring corporate performance against strategic business plans; overseeing the operations; ensuring compliance with laws and regulations; keeping members informed regarding plans, strategies and performance of the Credit Union; performance management and compensation of the CEO; and other related matters as they may arise. During 2016, the Board of Directors held six regular meetings, one special board meeting and one strategic planning meeting.
The Board of Directors has also formed five committees to assist with the governance process.
5

Audit & Risk Management Committee – The purpose of this committee is to provide independent oversight of the credit union’s operations and to ensure the accuracy, integrity, security, prudence and legality of its financial transactions and records. Additionally, this committee works closely with the Internal Audit & Risk Management Department to oversee the Enterprise Risk Management process and to ensure the adequacy of internal controls and compliance to the various regulatory requirements. During 2016, the Audit & Risk Management Committee was comprised of five Directors and met five times.
Governance & Policy Committee – The purpose of this committee is to ensure an appropriate governance structure is in place, to oversee the election process of the Board of Directors and the Board evaluation and development process. Additionally, this committee works closely with Executive Management to formulate policies and practices to meet the needs of our members, staff and the corporate entity. During 2016, the Governance & Policy Committee was comprised of five Directors and met five times.
Conduct Review Committee – The purpose of this committee is to ensure the integrity and objectivity of its directors, officers and employees. This committee monitors and reviews related party transactions with the Credit Union to ensure they are fair to the Credit Union and that best judgment is exercised in all matters or related party relationships as a result of real or perceived conflict of interest. This committee is comprised of the entire Board of Directors of TCU Financial Group Credit Union. The Board reviews the conduct review report during the course of a regular Board meeting.
Executive Committee – The purpose of this committee is to act in the capacity of, and on behalf of, the Board of Directors between regular or special Board meetings on all Board matters except those which the Board may not, in compliance with legislative requirements, delegate. Additionally, this committee sets the Board of Director’s regular meeting and planning meeting agendas.
The Executive Committee consists of the Chair and Vice-Chair of the Board of Directors and the Chief Executive Officer. During 2016, this committee met five times.
CEO Compensation & Performance Evaluation Committee – The purpose of this committee is to ensure that a fair, equitable and competitive compensation program is provided for the CEO. Additionally, this committee conducts the CEO performance evaluation process and sets the performance plan for the following year. The CEO Compensation & Performance Evaluation Committee consists of four members of the Board of Directors which are the Chair, Vice-Chair, Chair of the Audit & Risk Management Committee and Chair of the Governance & Policy Committee. During 2016, this committee met once.
MANAGEMENT STRUCTURE In addition to the Board of Directors Committees, the management structure consists of the following:
George Greenwood – Chief Executive Officer
Greg Peacock – Chief Financial Officer
Kathy Styranko – Chief Risk Officer
Executive Management – Executive Management is responsible to oversee the operation of the Credit Union and its subsidiary as directed through the strategic plan and policies approved by the Board of Directors. Additionally, the Executive Management is responsible for developing processes that identify measures, and
6
monitor and control risks. TCU has an extensive Enterprise Risk Management process and reports risk management performance to the Board through the Audit & Risk Management Committee.
Asset Liability Management Committee (ALCO) – The ALCO committee is responsible for understanding, monitoring and managing interest rate risk, liquidity risk, capital adequacy risk and management of strategies in terms of the overall balance sheet structure focusing on achieving financial targets and capital optimization. The ALCO Committee, which consists of the Executive Management, reports to the Audit & Risk Management Committee. This committee meets quarterly.
Subsidiary Company – TCU Financial Group Credit Union has one wholly owned subsidiary company – TCU Holdings Inc.
BUSINESS ENVIRONMENT The Canadian economy looks to have exited 2016 on stronger footing, as an uptick in exports, improving business confidence, and employment gains are likely to have bolstered GDP growth and supported spending patterns in the fourth quarter. Of course, the degree to which the new U.S. administration will deliver on its election promises remains decidedly unclear. For the moment, markets have priced in a rosy growth outcome, although the tightening of financial conditions from higher bond yields and a stronger U.S. dollar has yet to be felt fully. We do not see the Bank of Canada altering its accommodative monetary stance any time soon.
An area of interest for TCU in 2017 will again be residential mortgages. The tighter mortgage regulations introduced in 2016 are expected to reduce the number of first-time buyers who qualify for mortgage financing, particularly in pricier markets where there is a severe shortage of lower-priced listings. Tightened mortgage regulations and lending guidelines are also expected to increase capital costs for lenders, resulting in modest increases in mortgage interest rates in 2017. The latest forecast from the Canadian Real Estate Association (CREA), is that average home prices in Saskatchewan are expected to decline by 1.2 per cent in 2017.
TCU remains optimistic though and is prepared to face these challenges. We feel that we are well positioned in 2017 to adapt to these challenges that the housing market in Saskatchewan will face.
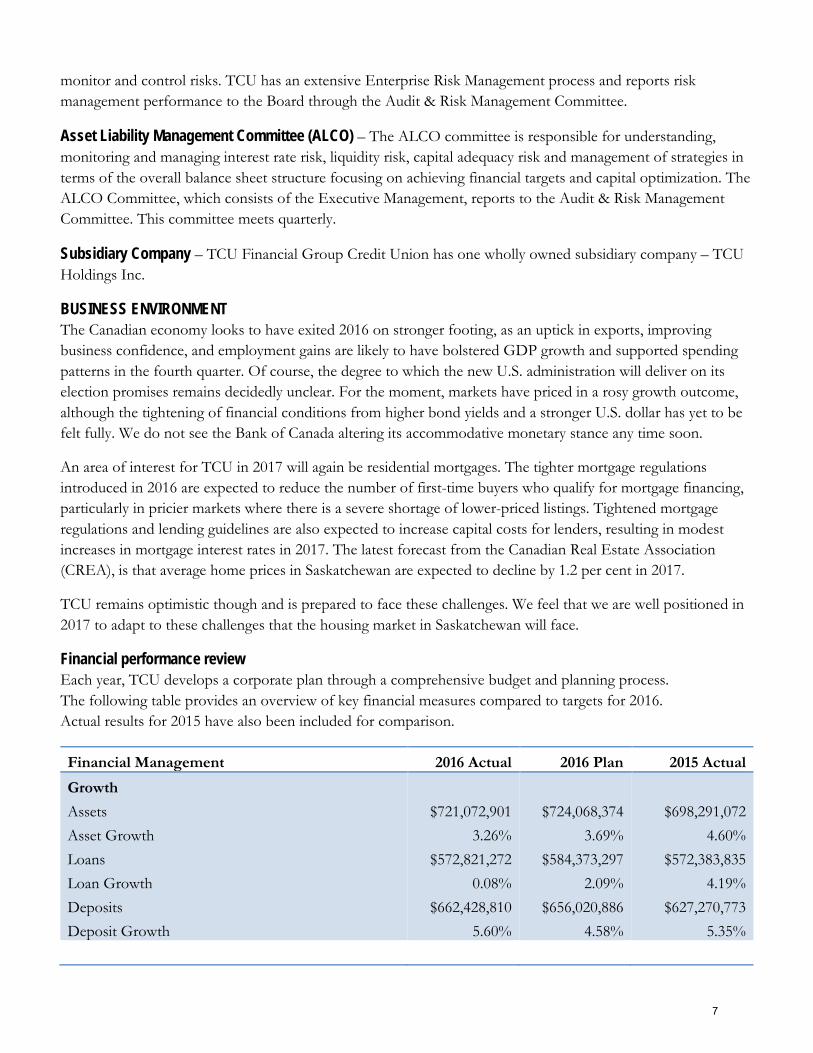
Financial performance review Each year, TCU develops a corporate plan through a comprehensive budget and planning process. The following table provides an overview of key financial measures compared to targets for 2016. Actual results for 2015 have also been included for comparison.
Financial Management 2016 Actual 2016 Plan 2015 Actual Growth Assets Asset Growth Loans Loan Growth Deposits Deposit Growth
$721,072,901
3.26% $572,821,272
0.08% $662,428,810
5.60%
$724,068,374
3.69% $584,373,297
2.09% $656,020,886
4.58%
$698,291,072
4.60% $572,383,835
4.19% $627,270,773
5.35%
7
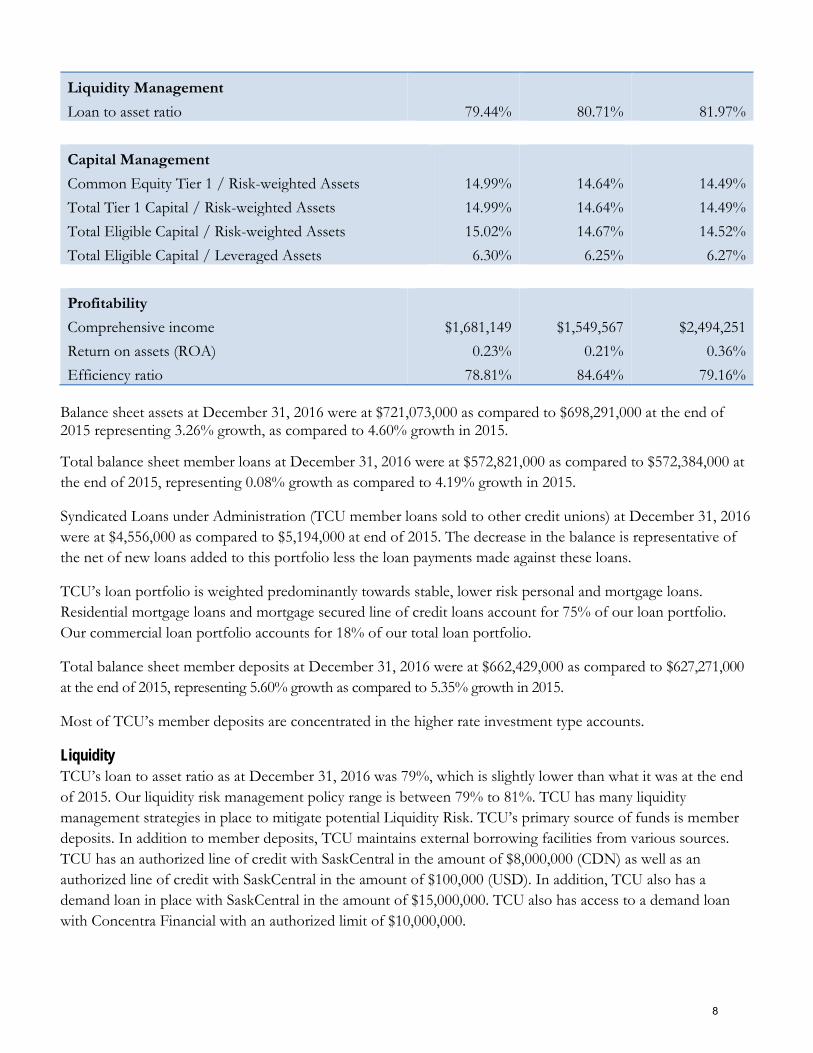
Liquidity Management Loan to asset ratio
79.44%
80.71%
81.97%
Capital Management Common Equity Tier 1 / Risk-weighted Assets Total Tier 1 Capital / Risk-weighted Assets Total Eligible Capital / Risk-weighted Assets Total Eligible Capital / Leveraged Assets
14.99% 14.99% 15.02% 6.30%
14.64%
14.64% 14.67% 6.25%
14.49% 14.49% 14.52% 6.27%
Profitability Comprehensive income Return on assets (ROA) Efficiency ratio
$1,681,149
0.23% 78.81%
$1,549,567
0.21% 84.64%
$2,494,251
0.36% 79.16%
Balance sheet assets at December 31, 2016 were at $721,073,000 as compared to $698,291,000 at the end of 2015 representing 3.26% growth, as compared to 4.60% growth in 2015.
Total balance sheet member loans at December 31, 2016 were at $572,821,000 as compared to $572,384,000 at the end of 2015, representing 0.08% growth as compared to 4.19% growth in 2015.
Syndicated Loans under Administration (TCU member loans sold to other credit unions) at December 31, 2016 were at $4,556,000 as compared to $5,194,000 at end of 2015. The decrease in the balance is representative of the net of new loans added to this portfolio less the loan payments made against these loans.
TCU’s loan portfolio is weighted predominantly towards stable, lower risk personal and mortgage loans. Residential mortgage loans and mortgage secured line of credit loans account for 75% of our loan portfolio. Our commercial loan portfolio accounts for 18% of our total loan portfolio.
Total balance sheet member deposits at December 31, 2016 were at $662,429,000 as compared to $627,271,000 at the end of 2015, representing 5.60% growth as compared to 5.35% growth in 2015.
Most of TCU’s member deposits are concentrated in the higher rate investment type accounts.
Liquidity TCU’s loan to asset ratio as at December 31, 2016 was 79%, which is slightly lower than what it was at the end of 2015. Our liquidity risk management policy range is between 79% to 81%. TCU has many liquidity management strategies in place to mitigate potential Liquidity Risk. TCU’s primary source of funds is member deposits. In addition to member deposits, TCU maintains external borrowing facilities from various sources. TCU has an authorized line of credit with SaskCentral in the amount of $8,000,000 (CDN) as well as an authorized line of credit with SaskCentral in the amount of $100,000 (USD). In addition, TCU also has a demand loan in place with SaskCentral in the amount of $15,000,000. TCU also has access to a demand loan with Concentra Financial with an authorized limit of $10,000,000.
8

In 2015 through an application process, TCU became an authorized NHA MBS (Mortgage Backed Securities) Issuer and a CMB (Canada Mortgage Bond) Seller. Having these facilities will help TCU mitigate any additional liquidity risk in future years.
TCU, along with all other Saskatchewan Credit Unions, is required to maintain 10% of their liabilities on deposit with SaskCentral, as the manager of the provincial liquidity program. These liquidity investments provide a safety net of liquid funds to satisfy payment obligations and to also protect against unforeseen liquidity events. In addition to these statutory liquidity investments, TCU also maintains an investment portfolio of other liquid investments to meet daily liquidity requirements.
Profitability Comprehensive Income in 2016 was just over $1,681,000, as compared to just over $2,494,000 in 2015. The net operating income in 2016 was just under $2,016,000 as compared to $2,286,000 in 2015. Financial statement reporting standards require us to report “comprehensive income” which includes unrealized gains/losses on investments and derivatives. In 2016, the unrealized gains/losses on investments and derivatives calculated to be an unrealized loss of just under $598,000 as compared to an unrealized gain of just over $111,000 in 2015.
TCU’s total annualized return on assets (ROA) for 2016 was 0.23% on comprehensive income, and 0.36% on net operating income, as compared to 0.36% on comprehensive income and 0.31% on net operating income in 2015.
Net interest margin is the total revenue received from loan and investment interest less total interest expense paid on member deposits and provision for credit and investment losses. TCU’s net interest margin was at 2.058% at December 31, 2016, which was slightly lower than the net interest margin of 2.145% at the end of 2015.
We are projecting the net interest rate margin to be slightly higher at the end of 2017 at 2.11%. With the slowdown in the residential mortgage market coupled with new federal mortgage rules, TCU will be looking at purchasing syndicated loans from our partners which will in turn have a direct positive impact on our margin.
Non-interest revenue includes revenue from sources like commissions and charges, service fees, administration fees on syndicated loans and fixed asset income. TCU’s non-interest revenue for 2016 was at $3,508,000 as compared to $3,781,000 in 2015. The unrealized gains and losses on investments and derivatives as indicated above accounted for the difference between 2016 and 2015.
Interest expense includes the interest paid to our member deposits, and interest paid on borrowed money. The total interest expense for 2016 was just over $8,598,000 as compared to just under $9,381,000 in 2015. The decrease in deposit rates, and the lack of deposit promotions in 2016 accounted for the difference.
Provision for loan losses for 2016 was at $1,194,000 as compared to $1,034,000 in 2015. Overall, while we are experiencing an increase in delinquency in 2016, TCU’s delinquency and loan loss provisions are low and well below industry ratios for an organization with almost a $573 million loan portfolio. The forecast for 2017 also projects a higher delinquency due to the economic conditions that exist today in Saskatchewan and most of Canada.
Non-interest expenses include operating expenses such as personnel, occupancy, member security, general business and governance costs. Non-interest expenses for 2016 were at $15,490,000, as compared to
9

$14,959,000 in 2015, or an increase of 3.55%. One of our primary focuses is to grow assets without a corresponding increase in operating expenses. TCU still maintains one of the lowest operating expense ratios for a multi-branch credit union in Saskatchewan.
TCU’s largest cost relates to Personnel Costs which represent 56% of our total operating expenses.
Efficiency Ratio is a calculation that determines the cost of raising $1.00 of revenue. In 2016, TCU’s Efficiency Ratio was at 78.81%, as compared to 79.16% in 2015. In other words, it costs TCU $0.7881 to raise $1.00 of revenue in 2016. Our primary focus is to continue to improve on our Efficiency Ratio to where it is below 70%.
Member equity and capital Member equity and capital are the primary measurements of a credit union’s financial strength. TCU’s capital management policy is that we will at all times remain adequately capitalized, maintaining a prudent cushion of retained earnings and equity to protect our economic survival and to finance new opportunities.
TCU’s eligible capital ratio at the end of 2016 stood at 15.02%, as compared to 14.52% in 2015. The standard as set by our regulator is that a credit union must maintain a minimum of 10.50% of total eligible capital as a percentage of risk-weighted assets. TCU’s internal capital management policy is for the risk-weighted capital ratio to be within the range of 11% to 13%. We are well above both the regulatory requirement and our own standards. Our regulator imposed new capital standards in 2016 as a result of the implementation of BASEL III regulatory standards. TCU’s risk-weighted ratio is within the new BASEL III standard.
TCU’s Member Equity position as at December 31, 2016 was at $51,654,000 as compared to $49,973,000 at the end of 2015.
TCU Wealth Management TCU Wealth Management provides wealth management services such as mutual funds, securities brokerage, estate and financial planning.
Effective January 1, 2016, TCU Wealth Management Inc. was eliminated as a separate and distinct governance structure. The new structure allows for greater efficiencies and reduces the need for duplication of responsibilities and reporting. While no longer a distinct and separate subsidiary, TCU Wealth Management functions as a department within TCU Financial Group similar to our retail and business services departments. The Board of Directors is responsible for the oversight and governance of this department as it does for the rest of TCU Financial Group.
TCU Wealth Management’s assets under administration are broken down into two platforms – mutual funds administered through Qtrade Asset Management Inc. and securities investments administered through Qtrade Securities Inc.
Message from our Vice President of Wealth Management, Jill Norrish
2016 was definitely a remarkable year from a geopolitical perspective. Two key unexpected events – the “Brexit” vote which paved the way for Britain’s eventual secession from the European Union, and the election of Donald Trump as the 45th President of the United States – caught market participants off guard. Although these events, among others, created volatility and uncertainty, capital markets once again demonstrated their resiliency and 2016 was a very rewarding year for investors.
10

Canada’s equity market completed a strong turnaround from 2015’s weak results, finishing 2016 as one of the world’s best-performing markets. The benchmark S&P/TSX Composite Index gained an impressive 21.1% for the year. The S&P 500 Index, a broad measure of the U.S. equity market, finished 2016 with an increase of 12.0% (8.6% in Canadian dollars) and the MSCI World Index gained 8.2% (4.9% in Canadian dollars) for the year. TCU Wealth Management showed strong results as well with Assets Under Administration growing by 14.67% to finish 2016 at $194,899,728. Our gross revenue increased year over year by 9.63%.
The Canadian Securities Administrators (CSA) continued its efforts to increase investor awareness and transparency by implementing phase 2 of the Client Relationship Model (CRM2). As part of this second round of changes, registered firms are now required to provide an annual report on charges and other compensation that show, in dollars rather than percentages, what the dealer or adviser was paid for the products and services it provided. A further requirement is to provide an annual investment performance report that covers deposits into, and withdrawals from, the client’s account; the change in value of the account; and the percentage returns for the previous year; and the previous three, five and ten years. All investors, including TCU Wealth Management clients, begin receiving these new reports as of December 31, 2016.
Message from our Vice President of People and Culture, Ronél Eglington
It is relatively easy for stakeholders to say that payroll is the largest single item on an organization’s budget; however when it comes time to prove how this investment is ‘managed’ and how organizations grow this investment, there usually is not that much clear proof. In TCU however, we focus on our people and have their growth and success prove TCU’s success.
With this in mind we embarked on an organizational culture review which has formed the basis of most of our 2016 initiatives and which will continue during 2017 and beyond. Our vision is to constructively re-direct the TCU culture to embrace those values that most closely align to what we have identified as the ideal that will ensure our success well into the future.
The area that we have identified as allowing the greatest leverage in achieving this ideal is:
Empowering employees to create their own success and through their efforts, TCU success. We have started and will continue creating this empowerment, through clearly defined roles, open communication and recruitment and development practices that are innovative and allow new and current employees to grow to their potential.
In this regard employee development is a key focus area. To support our commitment we have hired a full time Learning & Development Coordinator, who is tasked with establishing the foundation to a continuous learning culture. To raise awareness and gain commitment to training and development she has arranged information sessions, established a Newsletter and presented a Learn at Work Week during September; offered a Lunch & Learn Seminar and created a TCU Learning Library. We have renewed the focus on owning personal development and have incorporated development actions as part of our performance review process. Already we are seeing positive results, with a 27% increase in employee utilization of our annual training and education budget.
11

ECONOMIC REVIEW AND OUTLOOK
2016 LABOUR MARKET REVIEW In December 2016, on a seasonally adjusted basis, Saskatchewan's employment decreased by 1,100 (-0.2%), compared to November 2016.
Saskatchewan's seasonally adjusted unemployment rate stood at 6.5% in December 2016, down from 6.8% in November 2016. The province had the fourth lowest seasonally adjusted unemployment rate in the country and was below the national rate of 6.9%.
The outlook for 2017 is for a similar low growth rate.
Housing For the whole year of 2016, urban housing starts in Saskatchewan decreased by 10.5% to 3,877 units, compared to 2015 (4,334 units). The national average was down by 0.5%. For the whole year of 2016, housing starts were down by 2.1% in the Regina Comparative Market Analysis (CMA) and 16.7% in the Saskatoon CMA.
Consumer Price Index For the whole year of 2016, Saskatchewan's CPI increased by 1.1%, on average, compared to the same period in 2015. For other western provinces, CPI increased in Alberta (+1.1%), Manitoba (+1.3%), and B.C. (+1.9%). The national average increased by 1.4%, during the same period. CPI increased in Regina CMA by 1.0% and Saskatoon CMA by 1.2%, during this period.
Motor Vehicle Sales New motor vehicle sales in Saskatchewan decreased by 5.5% to 48,512 units in the first eleven months of 2016, compared to the same period in 2015. In this period, Saskatchewan was ninth among the provinces in terms of percentage change. During the same period, new motor vehicle sales were up by 5.3% in B.C., and down by 0.7% in Manitoba and 8.3% in Alberta. The national average was up by 2.7%.
Retail Sales In the first eleven months of 2016, retail sales in Saskatchewan were up by 0.9% to $17.0B, compared to the same period in 2015. In percentage terms, Saskatchewan ranked eighth among the provinces. During the same period, retail sales were down by 2.0% in Alberta, up by 6.4% in B.C., and up by 4.6% in Manitoba, with an increase of 3.6% nationally.
Outlook According to Royal Bank Economists, they expect some recovery in the mining sector to send Saskatchewan growth back into the positive column in 2017, rising 1.7% after two years of contraction, including a downwardly revised 1.2% decline in 2016. We see further modest gains in mining along with an anticipated pick-up in construction spending putting growth on a faster track in 2018 at 2.2%. Bank of Montreal Economists echo the sentiments of Royal Bank: As the economy begins to stabilize, a pick-up in the service sector should spur modest job creation and improve domestic demand conditions over the next few years. Saskatchewan workers can expect gains in employment in 2017, but wage gains will be marginal, reflecting the considerable slack in labour markets. Household consumption is expected to increase modestly over the forecast period and consumer spending on services will reap most of the benefits from the small gains that do occur. Financial and commercial services are forecast to begin to rebound in 2017.
12

MANAGEMENT OF RISK
Overview TCU Financial Group Credit Union (TCU) is committed to prudently employ a range of risk management strategies to mitigate the various risks that it is exposed to within the financial industry. TCU employs an Enterprise Risk Management framework (ERM) in order to enhance the management of these risks. Based on this framework, TCU uses six categories to help define the risk exposure. These categories are:
• Credit Risk • Liquidity Risk • Market (Interest rate) Risk • Strategic Risk • Operational Risk • Legal and Regulatory Risk TCU’s risk management framework includes:
• Risk identification and classification • Risk mitigation review and assessment • Policy and procedure reviews and amendments • Compliance and audit reviews • Reporting Senior Management is responsible for establishing the framework which will identify and classify the risks, as well as establishing effective policies and processes to manage the risks. The Board of Directors, both directly or through Board committees, reviews and approves key policies and reporting to ensure proper oversight to the risk management process.
The Board of Directors is responsible to approve the overall business plan including any recommendations from various committees. The Board also receives reporting from the various committees as it relates to approvals made by those committees.
The Audit & Risk Management Committee receives direct reporting from Senior Management and is responsible for monitoring the risk management framework and making recommendations to the Board regarding acceptable levels of risk. The committee is also responsible to provide oversight of the external and internal audit process and the adequacy of internal controls.
Executive and Senior Management are responsible for the implementation of strategies and policies approved by the Board as well as reporting to the Board or specific committees to ensure proper oversight is maintained.
The ALCO (Asset and Liability Management) committee consists of the Executive Management team. The committee is responsible for the monitoring of liquidity and interest rate risk as well as overall credit exposure. This committee provides regular reporting to the Board related to liquidity, market risk and capital management activities undertaken by Management.
Enhanced risk management activities continue to evolve in support of regulatory requirements and risk management best practices with respect to capital adequacy and capital and liquidity stress testing.
13

TCU has also established an independent internal audit/quality assurance framework. Reporting from this framework is delivered to Management with a summary provided to the Audit & Risk Management Committee on a quarterly basis to assist in the oversight of TCU internal controls.
Credit Risk Credit Risk analysis includes a review of TCU loan portfolio diversity, loan policy and the ability to recover our loans by way of member payments or the realization of security. TCU employs loan underwriting policies and procedures based on recommended industry requirements and standards. Loan delinquency and “loan loss write-offs” have increased given the changes in the economic conditions in the province and the larger commercial component, but continue to be maintained below industry standards and are monitored and reported to the Board on a regular basis. Additional processes have been implemented to assist in the monitoring and management of the loan portfolio and the detection of negative trends. Stress testing of the credit book now forms part of the ongoing risk management and capital management processes. Loan portfolio concentrations are also reported to the Board of Directors and specific strategies have been identified to manage concentrations in a proactive manner. The largest percentage of our loan book remains with the consumer loans and residential mortgage products, including our commercial book which is primarily real estate development at this time. A more focused approach to diversification will form part of the 2017 and 2018 strategic plans.
Liquidity Risk Liquidity Risk analysis includes a review of strategies around member deposit acquisition and other loan funding sources. TCU has established liquidity, capital management and asset/liability management (ALM) policies, approved by the Board of Directors, which provide direction in managing the associated risks. Loan syndication continues to be one strategy employed to mitigate liquidity pressures. Existing borrowing facilities with SaskCentral & Concentra also form part of the management strategy. Management develops strategies designed to attract deposits and non-interest revenue streams. The ALCO committee is responsible to manage liquidity risk based on the approved policy and to provide reporting to the board.
Market (Interest Rate) Risk Market Risk analysis includes a review of market conditions, asset/liability matching and interest margins. Pressure on interest margin remains a key area of risk for TCU. In addition to the ALCO committee, TCU has employed the services of an outside consultant to assist with our balance sheet management including scenario simulation, stress testing based on changes in interest rates, and review possible scenarios for long term planning. There is an increased focus on stress testing and portfolio analysis to assist in developing proactive management strategies. Interest rate swaps are employed as one strategy to manage interest rate risk. Senior Management conducts ongoing reviews of product offerings, product delivery and product pricing to help ensure profitability. Reporting is provided to the Board regularly.
Strategic Risk Strategic Risk analysis includes a review of TCU’s brand, strategic direction, competition for members and employees as well as TCU’s role in the communities in which we serve. In 2015, TCU developed a 3 to 5 year plan that has continued into 2016. The initiatives that flow to the annual operational plans all tie to this strategic focus. TCU has a formal planning process and operates from a Balanced Scorecard approach reflecting key strategic focus areas. Management reports to the Board on the progress to plan for initiatives designed around our members, corporate culture, financial performance metrics and growth. Our strategic
14

direction is set by the Board and Management is responsible to develop initiatives to support key areas of the plan. Annual planning meetings with Executive Management and Board of Directors set the direction for the Credit Union. Executive and Senior Management are responsible to develop objectives and action plans. The Board is responsible to review and approve the Balanced Scorecard annually. TCU actively participates in the community both from a corporate perspective and by individual employees.
Operational Risk Operational Risk analysis includes a review primarily of human resources and information systems as well as internal controls and business continuity planning. Operational risk occurs when TCU is not able to develop or deliver products and services to its members due to human error, inadequate or failed technical issues, inadequate internal controls, lack of trained or qualified staff or other resources, etc. Competition remains a key risk area and TCU’s ability to respond to operational risk issues is paramount to our success. TCU has established policies and procedures, internal controls and compliance activities and conducts regular reviews of these controls. Among other initiatives, attracting and retaining highly skilled and competent staff remains a priority. A cultural assessment was conducted from which four key themes emerged that formed a focus in 2016. Work has begun in the review of our organizational structure, leadership training and development, communication and business and decision making processes. The purpose is to ensure these key areas align to support the strategic objectives of TCU. Where needed, TCU engages third party experts to ensure a high level of knowledge and support for key initiatives. TCU has adopted a Code of Conduct for employees and directors. TCU also requests and receives audit reports from key suppliers to ensure that these organizations are able to remain viable partners for our organization.
Legal and Regulatory Risk Legal and Regulatory Risk analysis includes a review of fraud and fiduciary risk exposure as well as the cost to implement regulatory or compliance regimes and the possible effect of non-compliance with laws, rules, regulations or ethical standards. TCU has policies, procedures and internal controls in place to mitigate our exposure to these risks as well as assist TCU in complying with laws and regulations. TCU has a designated Compliance Officer to oversee the compliance regime. Work has started to establish an organizational wide compliance framework to ensure the independence of the Compliance Officer role and move TCU to a risk based format that incorporates all staff. In addition, the internal audit/quality assurance framework provides an independent assessment of the compliance regime on an annual basis. Internal audit/quality assurance also provides ongoing assessment of internal controls. Reporting is provided to Senior Management ongoing and to the Audit & Risk Management Committee on quarterly basis to ensure the Board’s oversight of the compliance and control processes.
Current Risk Assessment Based on the risks identified in our ERM process and reflected in the key focus areas of our strategic plan and annual operational plans, TCU has identified the following primary risk areas:
1. Concentration risk of our credit portfolio. TCU’s credit exposure has a high concentration in residential mortgages in Regina and Saskatoon. While mortgages are considered low risk products, our concentration means TCU is exposed to downturns in this market more than organizations with a more diversified portfolio. Most importantly, this also is a low interest rate product which means a large portion of our portfolio generates a lower profitability. In today’s very low interest rate world, this has
15

added pressure to our interest rate margin and makes it necessary for us to seek other ways to generate income while we look at ways to increase our diversification.
2. People Development. Our people are our key to driving our member experience. A knowledgeable and empowered work force will help build a stronger foundation and create a succession planning process key to future success.
3. Internal Capital Adequacy Assessment Process (ICAAP) and Enterprise Risk Management (ERM) processes. ICAAP and ERM must be proactive and forward looking to ensure a solid understanding of our business in order to manage weaknesses or risk exposures and capitalize on strengths and opportunities. This is necessary in order to effectively deploy our capital in an ever-changing marketplace.
4. Profitable growth. While it is necessary to grow our business and continue to attract new members while retaining our existing member base, growth for the sake of growth will not be sustainable. Understanding our revenue and expense streams to ensure the growth also adds profitability must be a focus as traditional revenue streams from interest margins continue to be challenged.
5. Information systems and technology risks. Our dependence on technology grows at a pace never before experienced. With this new technology comes added risks and added demands to manage those risks. Practices around cyber security, business continuity and disaster recovery must be more detailed and the level of knowledge required to manage these important aspects of our business continues to increase.
16

MANAGEMENT’S RESPONSIBILITY To the Members of
TCU Financial Group
Management has responsibility for preparing the accompanying consolidated financial statements and ensuring that all information in the annual report is consistent with the statements. This responsibility includes selecting appropriate accounting principles and making objective judgments and estimates in accordance with International Financial Reporting Standards.
In discharging its responsibilities for the integrity and fairness of the consolidated financial statements and for the accounting systems from which they are derived, management maintains the necessary system of internal controls designed to provide assurance that transactions are authorized, assets are safeguarded and proper records are maintained.
Ultimate responsibility for consolidated financial statements to members lies with the Board of Directors. An Audit & Risk Management Committee of Directors is appointed by the Board to review financial statements in detail with management and to report to the Board of Directors prior to their approval of the consolidated financial statements for publication.
Independent auditors appointed by the members audit the consolidated financial statements and meet separately with both the Audit & Risk Management Committee and management to review their findings. The independent auditors report directly to the members and their report follows. The independent auditors have full and free access to the Audit & Risk Management Committee to discuss their audit and their findings as to the integrity of the Credit Union's financial reporting and the adequacy of the system of internal controls.
George Greenwood Greg Peacock Chief Executive Officer Chief Financial Officer
17

INDEPENDENT AUDITORS’ REPORT To the Members,
TCU Financial Group
We have audited the accompanying consolidated financial statements of TCU Financial Group which comprise the consolidated statement of financial position as at December 31, 2016 and the consolidated statements of income, comprehensive income, changes in members' equity and cash flows for the year then ended, and a summary of significant accounting policies and other explanatory information.
Management's Responsibility for the Financial Statements Management is responsible for the preparation and fair presentation of these financial statements in accordance with International Financial Reporting Standards and for such internal control as management determines is necessary to enable the preparation of financial statements that are free from material misstatement, whether due to fraud or error.
Auditors' Responsibility Our responsibility is to express an opinion on these financial statements based on our audit. We conducted our audit in accordance with Canadian generally accepted auditing standards. Those standards require that we comply with ethical requirements and plan and perform the audit to obtain reasonable assurance about whether the financial statements are free of material misstatement.
An audit involves performing procedures to obtain audit evidence about the amounts and disclosures in the financial statements. The procedures selected depend on the auditor's judgment, including the assessment of the risks of material misstatement of the financial statements, whether due to fraud or error. In making those assessments, the auditor considers internal control relevant to the Credit Union's preparation and fair presentation of the financial statements in order to design audit procedures that are appropriate in the circumstances, but not for the purpose of expressing an opinion on the effectiveness of the Credit Union’s internal control. An audit also includes evaluating the appropriateness of accounting policies used and the reasonableness of accounting estimates made by management, as well as evaluating the overall presentation of the financial statements.
We believe that the audit evidence we have obtained is sufficient and appropriate to provide a basis for our audit opinion.
Opinion In our opinion, these financial statements present fairly, in all material respects, the financial position of the Credit Union as at December 31, 2016 and its financial performance and its cash flows for the year then ended in accordance with International Financial Reporting Standards.
March 14, 2017 Saskatoon, Saskatchewan Chartered Professional Accountants
18

CONSOLIDATED FINANCIAL STATEMENTS
TCU FINANCIAL GROUP CONSOLIDATED STATEMENT OF FINANCIAL POSITION
AS AT DECEMBER 31, 2016 (with comparative figures for 2015)
Note 2016 2015
Assets Cash and cash equivalents 4 $7,759,993 $7,858,489 Investments 5 122,095,800 98,086,665 Loans 6 572,821,272 572,383,835 Accounts receivable 358,383 579,255 Prepaid expenses 2,008,675 2,098,380 Derivatives 21 544,732 1,074,889 Property, plant and equipment 7 12,201,225 14,878,033 Investment property 8 1,839,995 0 Other assets 9 1,442,826 1,331,526 $721,072,901 $698,291,072
Liabilities
Deposits 10 $662,428,810 $627,270,773 Loans payable 11 0 14,972,553 Lease payable 2,277,463 2,400,213 Accounts payable 4,551,237 3,521,036 Other liabilities (Assets) 12 53,110 42,440 Membership shares 13 108,320 111,245 $669,418,940 $648,318,260 Equity
Retained earnings $51,222,570 $49,206,962 Accumulated other comprehensive income 431,391 765,850 $51,653,961 $49,972,812 $721,072,901 $698,291,072
APPROVED BY THE BOARD:
Earl Warwick Darcy McLean Chair – Board of Directors Chair – Audit & Risk Management Committee
19

TCU FINANCIAL GROUP CONSOLIDATED STATEMENT OF INCOME FOR THE YEAR ENDED DECEMBER 31, 2016
(with comparative figures for the year ended December 31, 2015)
Note 2016 2015
Interest income Loan interest $21,255,917 $21,851,166 Investments 2,935,442 2,814,968 $24,191,359 $24,666,134 Interest expense
Deposits $8,446,126 $9,038,719 Borrowed money 152,276 341,877 $8,598,402 $9,380,596 Net interest income
$15,592,957
$15,285,538
Provision for (recovery of) credit losses 6 1,193,524 1,034,097 $14,399,433 $14,251,441 Non-interest income
Gains (losses) - held for trading instruments ($597,887) $111,492 Other revenue 4,106,346 3,669,384 $3,508,459 $3,780,876 Operating expenses
Personnel $8,690,621 $7,925,431 Security 621,899 581,886 Organizational 312,313 345,759 Occupancy 1,067,530 1,075,728 Depreciation and amortization 870,629 1,101,765 General business 3,926,752 3,928,196 $15,489,744 $14,958,765 Income before income tax
$2,418,148
$3,073,552
Income tax expense (recovery) 19 402,540 787,376 Net income $2,015,608 $2,286,176
20
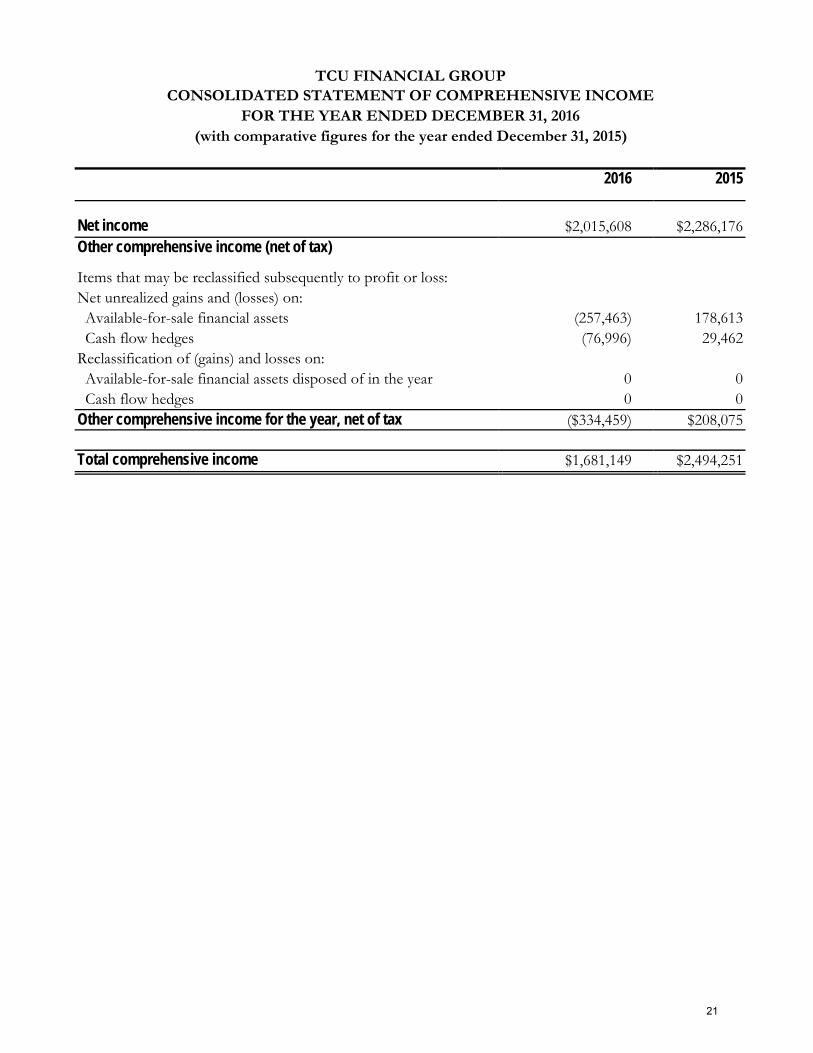
TCU FINANCIAL GROUP
CONSOLIDATED STATEMENT OF COMPREHENSIVE INCOME FOR THE YEAR ENDED DECEMBER 31, 2016
(with comparative figures for the year ended December 31, 2015)
2016 2015
Net income
$2,015,608
$2,286,176 Other comprehensive income (net of tax)
Items that may be reclassified subsequently to profit or loss:
Net unrealized gains and (losses) on: Available-for-sale financial assets (257,463) 178,613 Cash flow hedges (76,996) 29,462
Reclassification of (gains) and losses on: Available-for-sale financial assets disposed of in the year 0 0 Cash flow hedges 0 0
Other comprehensive income for the year, net of tax ($334,459) $208,075 Total comprehensive income $1,681,149 $2,494,251
21

TCU FINANCIAL GROUP
CONSOLIDATED STATEMENT OF CHANGES IN EQUITY FOR THE YEAR ENDED DECEMBER 31, 2016
(with comparative figures for the year ended December 31, 2015)
Retained earnings
Unrealized
gain/losses - AFS financial assets
Total equity Balance at January 1, 2015 $46,920,786 $557,775 $47,478,561 Total comprehensive income for the period:
Net income $2,286,176 $0 $2,286,176 Other comprehensive income:
Net change in fair value of available for sale financial assets, net of tax
0
178,613
178,613
Net change in fair value of cash flow hedges, net of tax
0
29,462
29,462
Net amount reclassified to profit and loss for available for sale financial assets, net of tax
0
0
0
Net amount reclassified to profit and loss for cash flow hedges, net of tax
0
0
0
Total other comprehensive income $0 $208,075 $208,075 Total comprehensive income for the period: $2,286,176 $208,075 $208,075 Balance at December 31, 2015 $49,206,962 $765,850 $49,972,812 Balance at January 1, 2016 $49,206,962 $765,850 $49,972,812 Total comprehensive income for the period:
Net income $2,015,608 $0 $2,015,608 Other comprehensive income:
Net change in fair value of available for sale financial assets, net of tax
0
(257,463)
(257,463)
Net change in fair value of cash flow hedges, net of tax
0
(76,996)
(76,996)
Net amount reclassified to profit and loss for available for sale financial assets, net of tax
0
0
0
Net amount reclassified to profit and loss for cash flow hedges, net of tax
0
0
0
Total other comprehensive income $0 ($334,459) ($334,459) Total comprehensive income for the period: $2,015,608 ($334,459) ($334,459) Balance at December 31, 2016 $51,222,570 $431,391 $51,653,961
22

TCU FINANCIAL GROUP CONSOLIDATED STATEMENT OF CASH FLOWS
FOR THE YEAR ENDED DECEMBER 31, 2016 (with comparative figures for the year ended December 31, 2015)
2016 2015
Cash flows from (used in) operating activities: Comprehensive income $1,681,149 $2,494,251 Items not involving cash: Amortization 1,050,627 1,284,524 Charge for credit impairment 1,193,524 1,034,098 Changes in other assets and other liabilities 1,240,148 (1,626,043) $5,165,448 $3,186,830 Cash flows from (used in) financing activities:
Deposits, shares $35,155,113 $31,862,883 Lease payable (122,750) (118,534) Loans payable (14,972,553) (2,018,320) $20,059,810 $29,726,029 Cash flows from (used in) investing activities:
Investments ($23,478,978) ($7,447,684) Loans (1,630,961) (24,066,177) Property and equipment and investment property (213,815) (1,104,880) ($25,323,754) ($32,618,741) Net increase (decrease) in cash resources
($98,496)
$294,118
Cash and cash equivalents - beginning of year 7,858,489 7,564,371 Cash and cash equivalents - end of year $7,759,993 $7,858,489
23

NOTES TO THE CONSOLIDATED FINANCIAL STATEMENTS
1. INCORPORATION AND GOVERNING LEGISLATION TCU Financial Group Credit Union is a for profit corporation governed by The Credit Union Act, 1998 in the Province of Saskatchewan, Canada. The Credit Union's registered office is located in Saskatoon, Saskatchewan. The Credit Union provides financial services to customers through branches in Saskatoon, Regina and surrounding areas. In accordance with The Credit Union Act, 1998, Credit Union Deposit Guarantee Corporation (CUDGC), a provincial corporation, guarantees the repayment of all deposits held in Saskatchewan credit unions, including accrued interest. 2. BASIS OF PREPARATION AND STATEMENT OF COMPLIANCE
The consolidated financial statements have been prepared in accordance with Part I of the Chartered Professional Accountants of Canada (CPA) Handbook - International Financial Reporting Standards (IFRS). The financial statements comply with IFRS adopted by the International Accounting Standards Board (IASB). The consolidated financial statements were approved by the Board of Directors on March 14, 2017. The consolidated financial statements have been prepared on the historical cost basis, except for the following financial instruments which are measured at fair value: Central 1 bid deposits, Concentra bid deposits, SaskCentral demand deposit, provincial and corporate bonds, and derivative assets. The consolidated financial statements are presented in Canadian dollars, which is the Credit Union’s functional currency. 3. SIGNIFICANT ACCOUNTING POLICIES The significant accounting policies used in the preparation of these consolidated financial statements are summarized below. These accounting policies have been applied consistently to all periods presented in these financial statements. Use of Estimates and Key Judgments The preparation of the financial statements required management to make judgments, estimates and assumptions that affect the application of accounting policies and the reported amounts of assets and liabilities at the date of the financial statements, as well as, the reported amounts of revenues and expenses during the reporting period. Accordingly, actual results could differ from those estimates. Estimates and assumptions are reviewed on an ongoing basis. Revisions to accounting estimates are recognized in the period in which the estimate is revised and in any future periods affected. The most significant uses of judgments and estimates are as follows: (i) Valuation of Financial Instruments
The Credit Union determines the fair value of financial instruments for which there is no observable market price using a variety of valuation techniques as described further in Note 3. The inputs to these models are derived from observable market data where possible, but where observable market data is not available, judgment is required to establish fair values. The judgments include consideration of liquidity and other risks affecting the specific instrument.
24

(ii) Allowances for Credit Losses The individual allowance component of the total allowance for impairment applies to financial assets evaluated individually for impairment. In particular, management judgment is required to estimate the amount and timing of cash flows the Credit Union expects to receive. These estimates are based on a number of factors, including the net realizable value of any underlying collateral. The collective allowance component covers credit losses in portfolios of loans with similar credit risk characteristics when there is objective evidence to suggest that a loss has been incurred but the individual impaired items cannot yet be identified. In assessing the collective allowance, management considers factors such as credit quality, historical loss experience and current economic conditions.
Basis of Consolidation The consolidated financial statements include the financial statements of the Credit Union and its subsidiary. Assets, liabilities, income and expenses are included in the consolidated financial statements after eliminating intercompany transactions and balances. Subsidiaries are entities controlled by the Credit Union. Control is achieved where the Credit Union has power over the investee, exposure or rights to variable returns from its involvement with the investee, and the ability to use its power over the investee to affect the amount of its returns. Control is reassessed if facts and circumstances indicate that there are changes to one or more of these criteria. When the Credit Union has less than a majority of voting rights of an investee, the Credit Union assesses whether it has power over the investee by determining if it has the practical ability to unilaterally direct relevant activities. The financial statements of subsidiaries are included in the financial statements from the date control commences until the date that control ceases. The consolidated financial statements have been prepared using uniform accounting policies for like transactions and other events in similar circumstances. Included in the consolidated financial statements are the following entities:
Entity Percentage Ownership TCU Holdings Inc. 100%
Financial Instruments All financial instruments are initially recognized at fair value, plus transaction costs, except in the case of financial assets and liabilities classified as fair value through profit or loss. The classification of financial instruments at initial recognition depends on the purpose and management’s intention for which the instruments were acquired and the item’s characteristics. The Credit Union uses settlement date accounting for regular way contracts when recording financial asset transactions. All financial instruments are classified as fair value through profit or loss, loans and receivables, held to maturity, available for sale or other financial liabilities.
Fair value through profit or loss Financial assets and financial liabilities are classified as fair value through profit or loss (FVTPL) when the instrument is held for trading or is designated as FVTPL by management. A financial asset or financial liability is held for trading if:
• It has been acquired principally for the purpose of selling it in the near term, or • On initial recognition, it is part of a portfolio of identified financial instruments that the Credit Union
manages together and has a recent actual pattern of short term profit taking, or • It is a derivative that is not designated (or designated but not effective) as a hedging instrument.
25
A financial asset or financial liability other than a financial asset or financial liability held for trading may be designated as FVTPL upon initial recognition if:
• Such designation eliminates or significantly reduces a measurement or recognition inconsistency that would otherwise arise, or
• The financial asset or financial liability forms part of a group of financial assets or financial liabilities or both, which is managed and its performance is evaluated on a fair value basis, in accordance with the Credit Union’s documented risk management or investment strategy, and information about the grouping is provided internally on that basis, or
• It forms part of a contract containing one or more embedded derivatives. Financial assets and financial liabilities at FVTPL are stated at fair value, with any gains or losses arising on re-measurement recognized immediately in profit or loss. The Credit Union has classified the following financial assets and liabilities as FVTPL:
• Cash and cash equivalents • Central 1 bid deposit • Concentra bid deposit • SaskCentral demand deposit • Provincial and corporate bonds • Derivatives
Loans and receivables Loans and receivables include non-derivative financial assets with fixed or determinable payments that are not quoted in an active market and that the Credit Union does not intend to sell immediately or in the near term. Loans and receivables are subsequently measured at amortized cost using the effective interest method, less any impairment. Interest income, calculated using the effective interest rate method, is recognized in profit or loss. The Credit Union has classified the following financial assets as loans and receivables:
• Loans • Accrued interest on loans • Accounts receivables
Held to maturity Held to maturity financial assets are non-derivative assets with fixed or determinable payments and fixed maturity dates that the Credit Union has the positive intention and ability to hold until the maturity date, and which are not designated as another category. Held to maturity financial assets are subsequently measured at amortized cost using the effective interest method less any impairment, with interest revenue recognized in profit or loss. The Credit Union has classified the following financial asset as held to maturity:
• SaskCentral liquidity deposits
Available for sale Available for sale financial assets are non-derivative financial assets that are designated as available for sale and are not classified in any of the previous categories. Unquoted equity securities whose fair value cannot be reliably measured are carried at cost. All other available for sale financial assets are subsequently measured at fair value.
26

Interest income is recognized in profit or loss using the effective interest method. Dividend income is recognized in profit or loss when the Credit Union becomes entitled to the dividend. Fair value changes are recognized in other comprehensive income until the investment is sold or impaired. Once sold or impaired, the cumulative gains and losses previously recognized in other comprehensive income are reclassified to profit or loss as a reclassification adjustment. The Credit Union has classified the following financial assets as available for sale:
• SaskCentral shares • Concentra Financial shares • APEX Investment Limited Partnership • Westcap MBO Investment Limited Partnership
Other financial liabilities Other financial liabilities are those liabilities which have not been classified as FVTPL. Other financial liabilities are subsequently measured at amortized cost using the effective interest method. Interest expense, calculated using the effective interest rate method, is recognized in profit or loss. The Credit Union has classified the following financial liabilities as other financial liabilities:
• Deposits • Loans payable • Accounts payables • Membership shares
Derivative Financial Instruments Derivative financial instruments are financial contracts whose value is derived from an underlying interest rate, foreign exchange rate, equity, commodity instrument or index. In the ordinary course of business, the Credit Union enters into derivative contracts for asset/liability management. The Credit Union enters into derivative financial instruments to manage its exposure to interest rate risk, including interest rate swaps. Derivatives are initially recognized at fair value at the date that the derivative contract is entered into. It is subsequently measured at fair value with changes in fair value recognized in profit or loss, unless it is designated in a qualifying hedging relationship. Derivatives may include contracts which are designated as and effective as hedges, and/or contracts which reposition the Credit Union's overall interest rate risk, credit risk and foreign exchange risk profile.
There are three types of hedges: fair value, cash flow and hedges of net investments in foreign operations. The Credit Union currently only uses cash flow hedges.
Cash flow hedges The Credit Union uses hedge accounting for derivatives designated as cash flow hedges provided that certain criteria are met. The Credit Union documents, at the inception of the relationship, the relationship between hedged items and hedging instruments, as well as identifying the risk being hedged and its risk management objective and strategy for undertaking various hedge transactions. The Credit Union also documents its assessment, both at hedge inception and on an ongoing basis, of whether the derivatives that are used in hedging transactions are highly effective. This analysis examines the effectiveness in offsetting changes in fair values of the cash flows of the hedged items that are attributable to the risk being hedged.
The effective portion of changes in the fair value of a derivative that is designated and qualifies as a cash flow hedge is recognized in other comprehensive income. The gain or loss relating to the ineffective portion is recognized immediately in profit or loss. Amounts accumulated in other comprehensive income are
27

reclassified to profit or loss in the periods in which the hedged item affects profit or loss. When a hedging instrument expires or is sold, or when a hedge no longer meets the criteria for hedge accounting, hedge accounting ceases and any cumulative gain or loss existing in other comprehensive income at that time remains in other comprehensive income and is recognized when the hedged forecast transaction is ultimately recognized in profit or loss. However, when a forecast transaction is no longer expected to occur, or when the hedged item expires or is sold, the cumulative gain or loss that was deferred in other comprehensive income is immediately reclassified to profit or loss in the period.
Embedded Derivatives Derivatives embedded in other non-derivative financial instruments or other host contracts are separated from their host contracts and accounted for as separate derivatives when certain conditions are met. These conditions include: the economic characteristics and risks are not closely related to those of the host contract, a separate instrument with the same terms would meet the definition of a derivative and the combined instrument or contract is not measured at FVTPL. Embedded derivatives that are accounted for as separate derivatives are measured at fair value with changes in fair value recognized in profit or loss immediately. The Credit Union does not have any outstanding contracts or financial instruments with embedded derivatives that require separate recognition. Effective Interest Method The effective interest method is a method of calculating the amortized cost of a financial asset or financial liability and allocating interest income or interest expense over the relevant period. The effective interest rate is the rate that exactly discounts estimated future cash receipts or payments through the expected life of the financial instrument, or when appropriate, a shorter period to the net carrying amount of the financial asset or financial liability. Transaction Costs Transaction costs are incremental costs that are directly attributable to the acquisition, issue or disposal of a financial asset or financial liability. Transaction costs include fees and commissions paid to agents, advisors, brokers and dealers, levies by regulatory agencies and securities exchanges, transfer taxes and duties. Transaction costs do not include debt premiums or discounts, financing costs or internal administrative or holding costs. The Credit Union recognizes transaction costs as part of the carrying amount of all financial instruments except those classified as at FVTPL.
Fair Value of Financial Instruments The fair value of a financial instrument is the amount for which an asset could be exchanged, or a liability settled, between knowledgeable, willing parties in an arm's length transaction on the measurement date.
Fair values are determined by reference to quoted bid or asking prices in an active market. In the absence of an active market, the Credit Union determines fair value based on internal or external valuation models, such as discounted cash flow analysis or using observable market based inputs (bid and ask price) for instruments with similar characteristics and risk profiles.
The Credit Union classifies fair value measurement recognized in the statement of financial position using a three tier fair value hierarchy, which reflects the significance of inputs used in measuring fair value as follows:
• Level 1: Quoted prices (unadjusted) are available in active markets for identical assets or liabilities. • Level 2: Inputs other than quoted prices in active markets (from Level 1) that are observable for the
asset or liability, either directly or indirectly; and • Level 3: Valuation techniques that include significant unobservable inputs.
Fair value measurements are classified in the fair value hierarchy based on the lowest level input that is
28

significant to that fair value measurement. This assessment requires judgment, considering factors specific to an asset or a liability and may affect placement within the fair value hierarchy. Financial Asset Impairment The Credit Union assesses financial assets, other than those recorded at FVTPL, for indicators of impairment at each reporting period. Financial assets are considered to be impaired when there is objective evidence that, as a result of one or more events that occurred after initial recognition, the estimated future cash flows of the asset have been negatively affected. Objective evidence of impairment could include significant financial difficulty of the issuer or counterparty, default or delinquency by the borrower, indications that the borrower will enter bankruptcy, disappearance of an active market for the security, prolonged decline in fair value of a security, or other observable data relating to a portfolio of assets such as adverse changes in the payment status of borrowers in the portfolio, or national or local economic conditions that correlate with defaults on the assets in the portfolio. For certain categories of financial assets, such as loans, assets that are assessed not to be impaired individually are, in addition, assessed for impairment on a collective basis. In assessing collective impairment, the Credit Union considers historical experience on similar assets in similar economic conditions. Impairment losses on financial assets carried at amortized cost is measured as the difference between the financial asset’s carrying amount and the present value of estimated future cash flows, discounted at the financial asset’s original effective interest rate. The carrying amount of the financial asset is reduced by the impairment loss directly for all financial assets with the exception of loans, which is reduced through the use of allowance accounts. Impairment losses are recognized in profit or loss. When available for sale financial assets are considered impaired, cumulative gains or losses previously recognized in other comprehensive income are reclassified to profit or loss in the period. With the exception of available for sale equity instruments, if, in a subsequent period, the amount of the impairment loss decreases and the decrease can be objectively related to an event occurring after the impairment loss was recognized, the previously recognized impairment loss is reversed through profit or loss to the extent that the carrying amount of the investment at the date the impairment is reversed does not exceed what the amortized cost would have been had the impairment not been recognized. Any subsequent recovery in the fair value of an impaired available for sale equity instrument is recognized in other comprehensive income. Cash and Cash Equivalents Cash and cash equivalents consist of cash and highly liquid securities with a maturity date within 90 days of the year end date. They are subject to insignificant risk of changes in fair value and are used to manage short term cash commitments. Investments Investments are initially measured at fair value. For investments not classified as FVTPL, incremental transaction costs are added to the initial measurement. Subsequent measurement is determined based on the classification of the instrument. Loans Receivable Loans are initially measured at fair value plus transaction costs and subsequently at amortized cost using the effective interest method, less any impairment. A loan is classified as impaired (doubtful) when there is no longer reasonable assurance that the principal and interest will be collected in full. The allowance is comprised of two components – individual allowances and collective allowances, calculated as follows:
29

(i) The Credit Union records specific individual allowances based on management's regular review and
evaluation of individual loans. The estimated realizable amount represents management's best estimate of the present value of future cash flows expected to be received, discounted at the loan's effective contractual interest rate. As a practical expedient, impairment may be measured on the basis of the instrument’s fair value using an observable market price. The calculation of the present value of the estimated future cash flows of a collateralized financial asset reflects the cash flows that may result from foreclosure less costs for obtaining and selling the collateral, whether or not foreclosure is probable.
(ii) The Credit Union records collective allowances for loans with similar credit risk characteristics, that have not been individually assessed as impaired when objective evidence of impairment within the groups of loans exists, but the individually impaired loans cannot be identified. In assessing the need for collective allowances, management considers factors such as credit quality, portfolio size and economic factors. The Credit Union estimates the collective allowance for impairment using a formula based on its historical loss experience for similar groups of loans in similar economic circumstances and current economic conditions. As management identifies individually impaired loans, it assigns an individual allowance for impairment to that loan and adjusts the collective allowance accordingly.
Assets Held for Sale Assets are considered held for sale if their carrying amount will be recovered principally through a sale transaction rather than through continuing use. This condition is met only when the sale is highly probable and the asset is available for immediate sale in its present condition. Management must be committed to the sale, which should be expected to be completed within one year from the date of classification.
Property, Plant and Equipment Property, plant and equipment are reported at cost less accumulated depreciation and any accumulated impairment losses. Depreciation is calculated using the straight line method over the estimated useful life of the related asset as follows, with the exception of land which is not depreciated: Facilities 40 years Furniture and equipment 10 years Computer hardware 4-8 years Leasehold improvements 15 years Assets held under finance leases 15 years The estimated useful lives, residual values and depreciation methods are reviewed at each year end and adjusted if appropriate. Gains and losses on the disposal or retirement of property, plant and equipment is determined as the difference between the sales proceeds and the carrying amount of the asset and are recorded in profit or loss in the year of disposal. Investment Property Investment property is land and buildings held to earn rentals, for capital appreciation or both rather than for use in the ordinary course of business or held for sale. Investment property is reported at cost less accumulated depreciation and any accumulated impairment losses. Depreciation is calculated using the straight line method over the estimated useful life of the related asset, with the exception of land which is not depreciated. The estimated useful lives, residual values and depreciation methods are reviewed at each year end and adjusted if appropriate.
30

Gains and losses on the disposal or retirement of property, plant and equipment is determined as the difference between the sales proceeds and the carrying amount of the asset and are recorded in profit or loss in the year of disposal. Membership Shares Shares are classified as financial liabilities in accordance with their terms. Shares are redeemable at the option of the member, either on demand or upon withdrawal from membership.
Loan Interest Revenue Loan and lease interest revenue is recognized on the accrual basis using the effective interest rate method for all loans not classified as impaired. When a loan becomes impaired, recognition of interest income ceases when the carrying amount of the loan (including accrued interest) exceeds the estimated realizable amount of the underlying security. The amount of initial impairment and any subsequent changes are recorded through the provision for credit losses as an adjustment of the specific allowance. Fees that are an integral part of the effective interest rate of the financial instrument, including loan origination, commitment, restructuring and renegotiation fees, are capitalized as part of the related asset and amortized to interest income over the term of the loan using the effective interest method. Investment Interest Revenue Investment interest income is recognized on the accrual basis using the effective interest method. Purchase premiums and discounts are amortized using the effective interest method over the term to maturity of the applicable investment. Swap Interest Revenue and Expenses Swap interest revenue and expenses are calculated on an accrual basis on fair value and the result netted for reporting purposes. Other Income Other revenue is recognized in the fiscal period in which the related service is provided. Foreign Currency Translation Transaction amounts denominated in foreign currencies are translated into Canadian dollar equivalents at exchange rates prevailing at the transaction dates. Carrying values of monetary assets and liabilities reflect the exchange rates at the reporting date. Carrying values of non-monetary assets and liabilities measured at historical cost reflect the exchange rates at the date of the transaction. Non-monetary assets and liabilities that are measured at fair value are translated to Canadian dollars at the exchange rate at the date the fair value was determined. Translation gains and losses are included in profit or loss, except for available for sale equity instruments which are recognized in other comprehensive income. Income Taxes Income tax expense is comprised of current and deferred taxes which are recognized in profit or loss except to the extent that it relates to items recognized directly in equity or in other comprehensive income. Current income tax is the expected tax payable or receivable on the taxable income or loss for the year, using tax rates enacted or substantially enacted at the reporting date, and any adjustments to tax payable in respect of previous years. Deferred income tax assets and liabilities are recognized for the future tax consequences attributable to temporary differences between financial statement carrying amounts and amounts used for tax purposes.
31

These amounts are measured using enacted or substantially enacted tax rates at the reporting date and re-measured annually for rate changes. Deferred income tax assets are recognized for the benefit of deductions available to be carried forward to future periods for tax purposes to the extent that it is probable that taxable profit will be available against which the deductible temporary differences can be utilized. Deferred income tax assets are reviewed at each reporting date and are reduced to the extent that is no longer probable that the related tax benefit will be realized. Any effect of the re-measurement or re-assessment is recognized in the period of change, except when they relate to items recognized directly in other comprehensive income. The Credit Union is taxed at an effective rate of 16.10% on taxable earnings eligible for that rate and at 27% on the excess balance. Deferred taxes are offset when there is a legally enforceable right to set off current tax assets against current tax liabilities and when they relate to income taxes levied by the same taxation authority on the same taxable entity, or for different tax entities where the Credit Union intends to settle its current tax assets and liabilities on a net basis or simultaneously. Leases A lease that transfers substantially all of the benefits and risks of ownership is classified as a finance lease. At the inception of a finance lease, an asset and a payment obligation are recorded at an amount equal to the lesser of the present value of the minimum lease payments and the asset’s fair market value at inception of the lease. Assets under finance leases are amortized on the straight-line basis, over their estimated useful lives. Lease payments are allocated between the lease payment obligation and finance expenses so as to achieve a constant interest rate on the outstanding balance of the obligation. All other leases are accounted for as operating leases and rental payments are expensed, as incurred, on a straight-line basis over the lease term. Future Accounting and Reporting Changes The Canadian Accounting Standards Board (AcSB) has issued new and amended IFRS standards under Part I of the CPA Handbook which are not yet effective for the Credit Union. None of the new or amended standards have been implemented in these consolidated financial statements. The significant changes to the standards are as follows:
• IFRS 9 Financial Instruments: The amended standard provides revised guidance on classification and measurement of financial assets, reducing the classification categories from four to three. The standard also provides a new requirement to calculate the impairment of financial assets using the expected loss model, and changes to simplify hedge accounting. The effective adoption date is January 1, 2018.
• IFRS 15 Revenue from Contracts with Customers: The new standard requires that revenue be
recognized as goods and services are transferred to customers, in amounts that reflect the consideration the credit union is expected to be entitled. This standard replaces current guidance on revenue recognition. The effective adoption date is January 1, 2018.
• IFRS 16 Leases: The new standard replaces previous guidance on leases. The most significant change
is that a “right of use” asset and lease liability will be recognized on the statement of financial position for lessees with operating leases. The guidance for lessors, and lessees with capital leases, has not been changed. The effective adoption date is January 1, 2019.
The Credit Union has not determined the effect, if any, of the above standards on the financial statements.
32

4. CASH AND CASH EQUIVALENTS
2016 2015
Cash and balances with the Credit Union $7,759,993 $7,858,489 $7,759,993 $7,858,489
5. INVESTMENTS
2016 2015
Loans and receivables Accrued interest $775,372 $688,829 $775,372 $688,829 Held for trading Central 1 bid deposit $2,369,204 $1,928,700 SaskCentral demand deposit 8,200,000 0 Provincial and corporate bonds 31,935,298 20,745,796 $42,504,502 $22,674,496 Available for sale SaskCentral debenture $0 $1,000,000 SaskCentral shares 7,240,059 3,919,710 Concentra financial shares 2,000,000 2,000,000 Other investments 3,102,367 3,450,130 $12,342,426 $10,369,840 Held to maturity SaskCentral liquidity deposits $66,473,500 $64,353,500 $66,473,500 $64,353,500 $122,095,800 $98,086,665 At December 31, 2016, the market value of investments classified as held to maturity is $66,939,972 (2015 - $65,306,326). Pursuant to Regulation 18(1) (a), Credit Union Central of Saskatchewan (SaskCentral) requires that the Credit Union maintain 10% of its liabilities using a prescribed formula in specified liquidity deposits in SaskCentral. The regulator of Saskatchewan Credit Unions, CUDGC requires that the Credit Union adhere to these prescribed limits and restrictions. As of December 31, 2016 the Credit Union met the requirement. At December 31, 2016, $74,922,237 (2015 - $70,158,802) of investments are expected to be recovered more than 12 months after the reporting date.
33

6. LOANS
2016
Allowances Current loans Impaired loans Specific Collective Net
Guaranteed * $142,372,005 $1,997,255 $0 $0 $144,369,260 Conventional mortgages:
-Residential & farm 281,743,863 1,502,224 0 0 283,246,087 Personal loans 40,833,268 946,546 694,762 0 41,085,052 Non-personal loans 98,938,489 3,861,233 313,242 0 102,486,480 Line of credit, overdrafts 168,817 17,246 17,494 0 168,569 Accrued interest 1,212,904 252,920 0 0 1,465,824 $565,269,346 $8,577,424 $1,025,498 $0 $572,821,272
2015
Allowances Current loans Impaired loans Specific Collective Net
Guaranteed * $138,075,607 $824,762 $0 $0 $138,900,369 Conventional mortgages:
-Residential & farm 279,411,834 2,354,895 0 0 281,766,729 Personal loans 42,025,514 734,141 528,091 0 42,231,564 Non-personal loans 102,991,034 5,398,081 469,656 0 107,919,459 Line of credit, overdrafts 164,757 13,829 14,244 0 164,342 Accrued interest 1,283,800 117,572 0 0 1,401,372 $563,952,546 $9,443,280 $1,011,991 $0 $572,383,835 *Guaranteed loans include loans which are guaranteed or insured under programs administered by federal and provincial governments, their agents or private loan insurance companies. At December 31, 2016, $300,981,370 (2015 - $284,558,055) of loans are expected to be recovered more than 12 months after the reporting date.
34

Allowance for impaired loans
2016
2015
Individual
Collective
Individual
Collective
Balance, beginning of year $1,011,991 $0 $592,332 $0 Impairment losses recognized 1,193,524 0 1,034,098 0 Amounts written-off (1,180,017) 0 (614,439) 0 Balance, end of year $1,025,498 $0 $1,011,991 $0 The aging of loans, including those past due but not impaired and those that were individually impaired, as at December 31, 2016 was:
2016
2015
Performing
Impaired
Performing
Impaired
Current $5,163,725 $1,989,468 $3,262,761 $1,162,404 31 - 60 days 5,408,340 33,952 1,388,313 594,018 61 - 90 days 1,163,906 153,346 311,209 1,280,315 91 - 120 days 358,761 95,693 542,020 3,834,942 121 + days 225,858 6,304,965 0 2,571,601 $12,320,590 $8,577,424 $5,504,303 $9,443,280
The Credit Union holds collateral against loans to customers in the form of interests in real property, chattel property, securities and guarantees.
35

7. PROPERTY, PLANT AND EQUIPMENT
Cost
Land
Facilities
Computer hardware
Furniture and equipment
Leasehold improvements
Leased facilities
Total cost
Balance at January 1, 2015 $2,479,018 $10,520,864 $3,614,186 $4,027,377 $1,070,932 $2,538,103 $24,250,480 Additions 0 696,814 106,820 220,024 81,222 0 1,104,880 Disposals 0 0 (92,727) (91,519) 0 0 (184,246) Transfer to investment property 0 0 0 0 0 0 0
Balance at December 31, 2015 $2,479,018 $11,217,678 $3,628,279 $4,155,882 $1,152,154 $2,538,103 $25,171,114
Balance at January 1, 2016 $2,479,018 $11,217,678 $3,628,279 $4,155,882 $1,152,154 $2,538,103 $25,171,114 Additions 0 31,864 125,143 56,808 0 0 213,815 Disposals 0 0 (4,589) (33,869) 0 0 (38,458) Transfer to investment property (591,983) (1,664,592) 0 0 0 0 (2,256,575)
Balance at December 31, 2016 $1,887,035 $9,584,950 $3,748,833 $4,178,821 $1,152,154 $2,538,103 $23,089,896
Depreciation and impairment losses Balance at January 1, 2015 $0 $3,199,386 $2,841,133 $3,124,082 $0 $28,201 $9,192,802 Depreciation expense 0 334,454 411,222 250,071 106,018 169,207 1,270,972 Disposals 0 0 (92,727) (77,966) 0 0 (170,693) Transfer to investment property 0 0 0 0 0 0 0
Balance at December 31, 2015 $0 $3,533,840 $3,159,628 $3,296,187 $106,018 $197,408 $10,293,081
Balance at January 1, 2016 $0 $3,533,840 $3,159,628 $3,296,187 $106,018 $197,408 $10,293,081 Depreciation expense 0 294,991 191,007 236,804 106,018 169,207 998,027 Disposals 0 0 (4,589) (23,077) 0 0 (27,666) Transfer to investment property 0 (374,771) 0 0 0 0 (374,771)
Balance at December 31, 2016 $0 $3,454,060 $3,346,046 $3,509,914 $212,036 $366,615 $10,888,671
Net book value
Balance at December 31, 2015 $2,479,018 $7,683,838 $468,651 $859,695 $1,046,136 $2,340,695 $14,878,033
Balance at December 31, 2016 $1,887,035 $6,130,890 $402,787 $668,907 $940,118 $2,171,488 $12,201,225
36

8. INVESTMENT PROPERTY
Cost
Land
Facilities
Total cost
Balance at January 1, 2015 $0 $0 $0 Additions 0 0 0 Transfer from property and equipment 0 0 0 Transfer to assets held for sale 0 0 0
Balance at December 31, 2015 $0 $0 $0
Balance at January 1, 2016
$0
$0
$0
Additions 0 0 0 Transfer from property and equipment 591,983 1,664,592 2,256,575 Transfer to assets held for sale 0 0 0
Balance at December 31, 2016 $591,983 $1,664,592 $2,256,575 Depreciation and impairment losses
Balance at January 1, 2015 $0 $0 $0 Depreciation expense 0 0 0 Transfer from property and equipment 0 0 0 Transfer to assets held for sale 0 0 0
Balance at December 31, 2015 $0 $0 $0
Balance at January 1, 2016
$0
$0
$0
Depreciation expense 0 41,809 41,809 Transfer from property and equipment 0 374,771 374,771 Transfer to assets held for sale 0 0 0
Balance at December 31, 2016 $0 $416,580 $416,580 Net book value
Balance at December 31, 2015 $0 $0 $0
Balance at December 31, 2016 $591,983 $1,248,012 $1,839,995
37

Income related to investment property: 2016 2015 Rental income $0 $0 Direct operating expense from property generating rental income 0 0 $0 $0
Future rental payments receivable:
2016
2015 Not later than one year $73,208 $0 Later than one year and not later than five years 585,665 0 Later than five years 857,580 0 $1,516,453 $0
9. OTHER ASSETS
2016 2015
Items in transit $149,541 $38,241 Deferred income tax asset (liability) 671,500 671,500 Foreclosed property 621,785 621,785 $1,442,826 $1,331,526
At year end, the Credit Union held title to properties with a carrying value of $621,785 (2015 - $621,785) by taking possession of collateral held as security. Repossessed property is sold as soon as practicable, with the proceeds used to reduce the outstanding indebtednesses. Repossessed property is classified as assets held for sale and included within other assets.
10. DEPOSITS
2016 2015
Demand deposits $195,814,674 $192,300,945 Term deposits 332,286,320 304,908,381 RRSP deposits 53,937,006 55,449,730 RRIF deposits 29,285,125 28,526,278 RESP deposits 4,991,726 4,879,197 TFSA deposits 46,113,959 41,206,242 $662,428,810 $627,270,773
At December 31, 2016, $157,128,851 (2015 - $157,980,449) of deposits are other than demand and expected to mature in more than 12 months after the reporting date. 11. LOANS PAYABLE
The Credit Union has an authorized line of credit with SaskCentral in the amount of $8,000,000 Canadian and $100,000 US. The line of credit is secured by an assignment of book debts and funds on deposit with an interest rate structure based on the SaskCentral prime rate. At year end, the amount outstanding was $0 (2015 - $0) on the Canadian line of credit and $0 US (2015 - $0) on the US line of credit.
38

The Credit Union through a commercial paper funding agreement with SaskCentral can borrow up to $15,000,000. The loan bears interest at a rate equal to the RIL Commercial Paper Market Term Rate as established from time to time plus 37.5 basis points per annum. At the end of the year, the amount outstanding was $0 (2015 - $14,972,553).
The Credit Union has an authorized line of credit with Concentra Financial in the amount of $10,000,000. The line of credit bears interest at a rate equal to the 1 month CDOR rate as established from time to time plus 250 basis points per annum. At the end of the year, the amount outstanding was $0 (2015 - $0).
12. OTHER LIABILITIES
2016 2015
Deferred income $0 $0 Unclaimed balances 53,110 42,440 $53,110 $42,440 13. MEMBERSHIP SHARES
Membership shares are as provided for by The Credit Union Act, 1998, and administered according to the terms of the Credit Union bylaws which set out the rights, privileges, restrictions and conditions.
The authorized share capital is unlimited in amount and consists of fully paid shares with a par value of $5 per share. These accounts are not guaranteed by CUDGC. Characteristics include permanence, freedom from mandatory charge and subordination to the rights of creditors and depositors.
14. CAPITAL MANAGEMENT
CUDGC prescribes capital adequacy measures and minimum capital requirements. The capital adequacy rules issued by CUDGC have been based on the Basel III framework, consistent with the financial industry in general. CUDGC’s Standards of Sound Business Practice (SSBP) that incorporate the Basel III framework took effect on July 1, 2013.
The Credit Union follows a risk-weighted asset calculation for credit and operational risk. Under this approach, Credit Unions are required to measure capital adequacy in accordance with instructions for determining risk-adjusted capital and risk-weighted assets, including off-balance sheet commitments. Based on the prescribed risk of each type of asset, a weighting of 0% to 150% is assigned. The ratio of regulatory capital to risk-weighted assets is calculated and compared to the standard outlined by CUDGC. Regulatory standards require Credit Unions to maintain a minimum total eligible capital to risk-weighted assets of 8%, a minimum total tier 1 capital to risk-weighted assets of 6% and a minimum common equity tier 1 capital to risk-weighted assets of 4.5%. Eligible capital consists of total tier 1 and tier 2 capital. In addition to the minimum capital ratios, the Credit Union is required to hold a capital conservation buffer of 2.5% effective January 1, 2016. The capital conservation buffer is designed to avoid breaches of the minimum capital requirement. Tier 1 capital is defined as a Credit Union’s primary capital and comprises the highest quality of capital elements while tier 2 is secondary capital and falls short of meeting tier 1 requirements for permanence or freedom from mandatory charges. Tier 1 capital consists of two components: common equity tier 1 capital and additional tier 1 capital. Common equity tier 1 capital includes retained earnings, contributed surplus and accumulated other comprehensive income (AOCI). Deductions from common equity tier 1 capital include goodwill, intangible assets, deferred tax assets (except those arising from temporary differences),
39

increases in equity capital resulting from securitization transactions, unconsolidated substantial investments and fair value gains/losses on own-use property. Additional tier 1 capital consists of qualifying membership shares and other investment shares issued by the Credit Union that meet the criteria for inclusion in additional tier 1 capital. Tier 2 capital includes a collective allowance for credit losses to a maximum of 1.25% of risk-weighted assets, subordinated indebtedness, and qualifying membership shares or other investment shares issued by the Credit Union that meet the criteria for inclusion in tier 2 capital and are not included in tier 1 capital. Regulatory standards also require the Credit Union to maintain a minimum leverage ratio of 5%. This ratio is calculated by dividing eligible capital by total assets less deductions from capital plus specified off-balance sheet exposures. Based on the type of off-balance sheet exposure, a conversion factor is applied to the leverage ratio. All items deducted from capital are excluded from total assets. The Credit Union may also exclude from total assets mortgages securitized through Canada Mortgage and Housing Corporate (CMHC) programs up to and including March 31, 2010 and all existing and future reinvestments related to Canada Mortgage Bonds (CMB) Insured Mortgage Purchase Program transactions completed up to and including March 31, 2010. The Credit Union has adopted a capital plan that conforms to the capital framework and is regularly reviewed and approved by the Board of Directors. The following table compares CUDGC regulatory standards to the Credit Union’s Board policy for 2016:
Regulatory standards Board limits
Total eligible capital to risk-weighted assets 10.5% 11-13% Tier 1 capital to risk-weighted assets 8.5% 11-13% Common equity tier 1 capital to risk-weighted assets 7.0% 11-13% Minimum leverage ratio 5% 5.5% During the year, the Credit Union complied with all internal and external capital requirements. The following table summarizes key capital information:
Capital summary 2016 2015 Eligible capital Total tier 1 capital $51,018,896 $49,337,747 Total tier 2 capital 108,320 111,245 Total eligible capital $51,127,216 $49,448,992
Risk-weighted assets $340,299,425 $340,583,195 Total eligible capital to risk-weighted assets 15.02% 14.52% Total tier 1 capital to risk-weighted assets 14.99% 14.49% Common equity tier 1 capital to risk-weighted assets 14.99% 14.49% Minimum leverage ratio 6.30% 6.27%
40

15. RELATED PARTY TRANSACTIONS
Related parties exist when one party has the ability to directly or indirectly exercise control, joint control or significant influence over the other or is a member, or close family member of a member, of the key management personnel of the Credit Union. Related party transactions are in the normal course of operations and are measured at the consideration established and agreed to by the parties. Loans receivable: At December 31, 2016, certain members of the board of directors and key management personnel were indebted to the Credit Union for amounts totaling $3,471,038 (2015 -$3,640,970). These loans were granted under the same lending policies applicable to other members, and are included in loans receivable on the statement of financial position. Deposit accounts: Directors and key management personnel may hold deposit accounts. These accounts are maintained under the same terms and conditions applicable to other members, and are included in member deposits on the consolidated statement of financial position. Remuneration: Compensation provided to directors and key management personnel, consisting of salaries, honoraria and benefits, totaled $1,035,742 (2015 - $1,212,492).
41

16. CLASSIFICATION AND FAIR VALUE OF FINANCIAL INSTRUMENTS
The following table summarizes the classification of the Credit Union's financial instruments.
2016
Designated as FVTPL
Held for trading
Held to
maturity
Loans and
receivables
Available for
sale
Other
amortized cost
Total carrying
amount Financial assets Cash and cash equivalents $7,759,993 $7,759,993 Investments 42,504,502 $66,473,500 $775,372 $12,342,426 122,095,800 Loans 572,821,272 572,821,272 Accounts receivable 358,383 358,383 Derivatives 544,732 544,732
$0 $50,809,227 $66,473,500 $573,955,027 $12,342,426 $0 $703,580,180 Financial liabilities Deposits $662,428,810 $662,428,810 Loans payable 0 0 Accounts payable 4,226,317 4,226,317 Membership shares 108,320 108,320
$0 $0 $0 $0 $0 $666,763,447 $666,763,447
42

2015
Designated as FVTPL
Held for trading
Held to
maturity
Loans and
receivables
Available for
sale
Other
amortized cost
Total carrying
amount Financial assets Cash and cash equivalents $7,858,489 $7,858,489 Investments 22,674,496 $64,353,500 $688,829 $10,369,840 98,086,665 Loans 572,383,835 572,383,835 Accounts receivable 579,255 579,255 Derivatives 1,074,889 1,074,889
$0 $31,607,874 $64,353,500 $573,651,919 $10,369,840 $0 $679,983,133 Financial liabilities Deposits $627,270,773 $627,270,773 Loans payable 14,972,553 14,972,553 Accounts payable 3,204,127 3,204,127 Membership shares 111,245 111,245
$0 $0 $0 $0 $0 $645,558,698 $645,558,698
43

The following table summarizes the carrying amount and fair values of the Credit Union’s financial instruments:
2016 2015
Carrying value
Fair value
Carrying value
Fair value Financial assets Cash and cash equivalents $7,759,993 $7,759,993 $7,858,489 $7,858,489 Investments 122,095,800 122,377,456 98,086,665 98,086,665 Loans 572,821,272 577,591,508 572,383,835 578,793,984 Accounts receivable 358,383 358,383 579,255 579,255 Derivatives 544,732 544,732 1,074,889 1,074,889 $703,580,180 $708,632,072 $679,983,133 $686,393,282
Financial liabilities Deposits $662,428,810 $663,958,959 $627,270,773 $629,302,307 Loans payable 0 0 14,972,553 14,972,553 Accounts payable 4,226,317 4,226,317 3,204,127 3,204,127 Membership shares 108,320 108,320 111,245 111,245 $666,763,447 $668,293,596 $645,558,698 $647,590,232
The following methods and assumptions were used to estimate fair values of financial instruments: The fair values of short term financial instruments including cash, accounts receivable, accounts payable, accrued income and expenses are approximately equal to their book values due to their short term nature. Fair values of investments are based on quoted market prices, when available, or quoted market prices of similar investments. For variable interest rate loans that re-price frequently, fair values approximate book values. Fair values of other loans are estimated using discounted cash flow calculations with market interest rates for similar groups of loans. The fair values of deposits with unspecified maturity terms are approximately equal to their carrying values. Fair values for other deposits and loans payable with specified maturity terms is estimated using discounted cash flow calculations at market interest rates for similar groups of deposits.
The fair values of derivative financial instruments are estimated by reference to the appropriate current market yields with matching terms of maturity. The fair values reflect the estimated amount that the Credit Union would receive or pay to terminate the contracts at the reporting date.
44

The following table provides an analysis of financial instruments measured at fair value at the end of the reporting period, by the fair value hierarchy into which the fair value measurement is categorized: 2016 Level 1 Level 2 Level 3 Total Financial assets Investments $42,994,857 $0 $3,139,543 $46,134,400 Derivative assets 544,732 0 0 544,732 $43,539,589 $0 $3,139,543 $46,679,132
Financial liabilities
Derivative liabilities 0 0 0 0 $0 $0 $0 $0
2015 Level 1 Level 2 Level 3 Total Financial assets Investments $22,674,496 $0 $3,450,130 $26,124,626 Derivative assets 1,074,889 0 0 1,074,889 $23,749,385 $0 $3,450,130 $27,199,515 Financial liabilities
Derivative liabilities 0 0 0 0 $0 $0 $0 $0
There were no transfers between Level 1 and Level 2 in the period.
The following were the net gains (losses) recognized on the various classes of financial instruments: 2016 2015 Held for trading financial assets ($173,250) $702,252
45

17. FINANCIAL INSTRUMENT RISK MANAGEMENT
Credit risk Credit risk is the risk of financial loss to the Credit Union if a customer or counterparty defaults on its contractual payment obligations. Credit risk may arise from loans and receivables and principal and interest amounts due on investments. Credit risk is managed in accordance with policies and procedures established by the Board of Directors. In addition, CUDGC establishes standards with which the Credit Union must comply. The Credit Union's Board has established lending policies and procedures which outline the minimum standards and criteria for granting credit to borrowers. Certain types of lending are subject to an annual review process to ensure that standards continue to be met. Accounts which are deemed to be of higher than average risk are monitored more frequently. Policy and procedures also specify the type of assets which may be taken as collateral and the techniques for valuation.
The Credit Union has established credit limits for individual borrowers to manage overall credit risk of the portfolio and establish parameters for credit diversification. The maximum aggregate credit per member is limited to 25% of capital and the maximum unsecured lending limit is $50,000. The established portfolio mix limits for 2016 are:
Board objectives
Actual
Consumer 82% 82% Agriculture 0% 0% Commercial 18% 18%
Except as otherwise noted below, the carrying amount of the financial assets recognized in the financial statements, which is net of impairment losses, represents the Credit Union’s maximum exposure to credit risk, without taking into account collateral or other credit enhancements held. In addition, in the normal course of business, the Credit Union has entered into various commitments to extend credit that are not reported on the statement of financial position, including guarantees and letters of credit. The primary purpose of these contracts is to make funds available for the financing needs of customers. These are subject to normal credit standards, financial controls, risk management and monitoring procedures. Guarantees and standby letters of credit represent irrevocable commitments that the Credit Union will make payments in the event that a customer cannot meet its obligations to third parties, and they carry the same risk, recourse and collateral security requirements as loans extended to customers. Commercial letters of credit are instruments issued on behalf of a customer authorizing a third party to draw drafts on the Credit Union up to a stipulated amount subject to specific terms and conditions. The Credit Union is at risk for any drafts drawn that are not ultimately settled by the customer, but the amounts are collateralized by the goods to which they relate. Commitments to extend credit represent unutilized portions of authorizations to extend credit in the form of loans, bankers’ acceptances or letters of credit. The amounts reported below represent the maximum credit exposure for commitments to extend credit to the Credit Union. Many of these contracts expire without being drawn upon, thereby reducing the Credit Union’s credit risk from the maximum commitment. As many commitments will expire or terminate without being funded, the amounts shown on the table below do not necessarily represent future cash requirements.
46

2016 2015 Undrawn lines of credit $104,921,397 $102,706,448 Letters of credit 496,180 305,500 Commitments to extend credit 19,092,608 21,933,680 $124,510,185 $124,945,628
Liquidity risk Liquidity risk is the risk of financial loss to the Credit Union in the event that the Credit Union is unable to generate or obtain the necessary cash or cash equivalents in a timely manner, at a reasonable price, to meet its financial commitments as they come due. Liquidity risk is managed in accordance with policies and procedures established by the Board of Directors. In addition, CUDGC establishes standards to which the Credit Union must comply. The Credit Union’s primary liquidity risk policies and procedures include liquidity, capital management and asset/liability management (ALM) policies. The Credit Union enters into transactions to purchase goods and services on credit and/or borrow funds for which repayment is required at various maturity dates, including processing the financial transactions of borrowers and depositors. Liquidity risk is measured by reviewing the Credit Union's future cash flows for the possibility of a negative net cash flow. The contractual maturities of financial liabilities can be found within the table under interest rate risk below. Market risk Market risk is the risk of loss in value of financial instruments that may arise from changes in market factors such as interest rates, equity prices and credit spreads. The Credit Union's exposure changes depending on market conditions. Market risk is managed in accordance with policies and procedures established by the Board of Directors. In addition, CUDGC establishes standards to which the Credit Union must comply. The Credit Union’s primary market risk policies and procedures include the asset/liability management (ALM) policy. The primary market risk that the Credit Union is exposed to is interest rate risk. Interest rate risk is the potential adverse impact on the earnings due to changes in interest rates. The Credit Union’s exposure to interest rate risk arises primarily from timing differences in the re-pricing of assets and liabilities, including financial assets and liabilities with fixed and floating rates. The Credit Union's exposure to interest rate risk can be measured by the mismatch or gap, between the assets, liabilities and off balance sheet instruments scheduled to mature or re-price on particular dates. Gap analysis measures the difference between the amount of assets and liabilities that re-price in specific time periods. To manage exposure to interest rate fluctuations and to manage asset and liability mismatch, the Credit Union may enter into interest rate swaps. These minimize the interest rate risk and cash required to liquidate the contracts by entering into counter balancing positions. The Credit Union used interest rate swaps in the current year.
47

The table below summarizes the carrying amounts of financial instruments exposed to interest rate risk by the earlier of the contractual re-pricing/maturity dates. Re-pricing dates are based on the earlier of maturity or the contractual re-pricing date and effective interest rates, where applicable, represent the weighted average effective yield.
2016
On demand Within 3 months
Over 3 months to 1 year
Over 1 year to 5 years
Over 5 years
Non-Interest sensitive
Total
Assets Cash $7,759,993 $0 $0 $0 $0 $0 $7,759,993 Investments 18,719,325 10,585,012 17,463,000 70,547,396 4,374,842 2,324,846 124,014,421 Loans 188,141,716 13,742,188 69,955,998 299,269,557 1,711,813 0 572,821,272 Other assets 0 0 0 78,626 0 16,398,589 16,477,215 $214,621,034 $24,327,200 $87,418,998 $369,895,579 $6,086,655 $18,723,435 $721,072,901 Liabilities
Deposits $135,266,638 $77,952,821 $216,329,144 $157,128,851 $30,000,000 $45,751,356 $662,428,810 Other liabilities 58,644,091 0 0 0 0 0 58,644,091 $193,910,729 $77,952,821 $216,329,144 $157,128,851 $30,000,000 $45,751,356 $721,072,901 On balance sheet gap $20,710,305 ($53,625,621) ($128,910,146) $212,766,728 ($23,913,345) ($27,027,921) $0
2015
On demand Within 3 months
Over 3 months to 1 year
Over 1 year to 5 years
Over 5 years
Non-Interest sensitive
Total
On balance sheet gap $31,423,309 ($53,195,958) ($117,580,201) $190,770,404 ($23,954,118) ($27,463,436) $0 The above tables do not identify management’s expectations of future events where re-pricing and maturity dates differ from contractual dates. A 1% decline in interest rates with all other variables held constant would result in an increase in the Credit Union’s profit for the year ended December 31, 2016 of $212,000 (2015 – a decrease of $288,000), primarily due to the Credit Union’s exposure to interest rates on its floating rate assets. A 1% increase in interest rates with all other variables held constant would result in an increase in the Credit Union’s profit for the year ended December 31, 2016 of $441,000 (2015 - $799,000). The Credit Union uses simulation modeling to simulate the effect of a change in the market rate of interest.
48

The following table details the derivatives used for risk management purposes that were outstanding at the end of the reporting period. 2016 2015
Currency Notional Fair value Currency Notional Fair value Derivatives not qualifying for hedge accounting Interest rate swaps Canadian $50,000,000 $590,917 Canadian $50,000,000 $1,036,690 Forward rate agreements Canadian 0 0 Canadian 0 0 $590,917 $1,036,690
49

18. COMMITMENTS
The Credit Union has entered into agreements expiring on various dates to the year of 2026. These agreements are for clearing services, data processing services, and sponsorship. Management believes that these obligations are part of ongoing operations and are not unduly significant to the financial results of the credit union.
Lease Commitments
The land and building for the Stonebridge branch was obtained under a finance lease arrangement. The future minimum lease payments under the finance lease is as follow:
2016 Total future
minimum lease payments
Future interest
charges
Present value of finance lease commitments
Future minimum lease payments Not later than one year $204,800 ($77,685) $127,115 Later than one year and not later than five years 850,897 (262,709) 588,188 Later than five years 1,792,004 (229,844) 1,562,160 $2,847,701 ($570,238) $2,277,463
2015 Total future
minimum lease payments
Future interest
charges
Present value of finance lease commitments
Future minimum lease payments Not later than one year $204,801 ($82,051) $122,750 Later than one year and not later than five years 836,268 (282,637) 553,631 Later than five years 2,011,433 (287,601) 1,723,832 $3,052,502 ($652,289) $2,400,213
The net carrying amount of land and buildings held under finance lease as at December 31, 2016 was $2,171,488 (2015 - $2,340,695).
Other Commitments The Credit Union is committed to additional investments in two (2) investment funds totaling $1,567,006.
50

19. INCOME TAXES
The federal portion of the preferred rate additional deduction for credit unions will be phased out over five years. For the portion of 2013 subsequent to budget date, the federal deduction was reduced to 80% of what the Credit Union would otherwise be entitled to under the old rules, 60% in 2014, 40% in 2015, and then 20% in 2016. It will be reduced to 0% in 2017 and subsequent years. The provincial deduction has been preserved.
Income taxes
Income tax expense is comprised of:
2016 2015 Current tax expense Current period $402,540 $787,376 402,540 787,376 Deferred tax expense Origination and reversal of temporary differences 76,800 33,600 Changes in tax rates and tax laws (76,800) (33,600) Other differences 0 0 0 0 Total income tax expense (recovery) $402,540 $787,376 The income tax expense (recovery) for the year can be reconciled to the accounting profit as follows:
2016
2015
Income before provision for income taxes $2,418,148 $3,451,467 Combined federal and provincial tax rate 16.10% 15.40% Income tax expense at statutory rate 389,322 531,526 Adjusted for the effect of:
Non-deductible expenses 1,773 1,530 Deferred tax expense due to change in income tax rate (76,800) (33,600) Difference due to change in accounting policy 0 0 Estimate revisions and other differences 88,245 287,920
$402,540 $787,376 Deferred income tax assets and liabilities recognized are attributable to the following:
2016 2015 Deferred income tax assets Other $22,964 $11,763 Loans 23,505 13,894 Non-capital loss carryforward 699,597 736,621 $746,066 $762,278
51

Deferred income tax liabilities Property and equipment $12,968 $39,465 Other 61,598 51,313 74,566 90,778 Net deferred income taxes $671,500 $671,500
2016
2015 Deferred tax assets -To be recovered within 12 months $746,066 $762,278 Deferred income tax liabilities -To be recovered after more than 12 months 74,566 90,778 -To be recovered within 12 months $0 $0
20. EMPLOYEE FUTURE BENEFITS The Credit Union's employee future benefit program consists of a defined contribution pension plan. Credit Union contributions to the defined contribution plan are expensed as incurred. Pension benefits of $440,422 (2015 - $455,498) were paid to defined contribution retirement plans during the year. The Credit Union has no legal or constructive obligation to pay further contributions if the plan does not hold sufficient assets to pay all the employees benefits relating to employee service in the current and prior periods.
21. DERIVATIVES
2016 Notional amounts Fair values Within 1 year 1 to 5 years Total Asset Liability Interest rate derivatives Swap contracts $25,000,000 $35,000,000 $60,000,000 $544,732 $0
$25,000,000 $35,000,000 $60,000,000 $544,732 $0
2015 Notional amounts Fair values Within 1 year 1 to 5 years Total Asset Liability Interest rate derivatives Swap contracts $0 $60,000,000 $60,000,000 $1,074,889 $0
$0 $60,000,000 $60,000,000 $1,074,889 $0 The above values include accrued interest. Notional amounts are the contract amounts used to calculate the cash flows to be exchanged. They do not represent credit or market risk exposure. Notional amounts are not exchanged. The Credit Union has entered into a cash flow hedge to manage a portion of the interest rate risk that arises from the variable interest cash flows associated with its prime based loans. The net interest income and expense for the hedged and hedging items are recognized in interest income as it is realized. When the hedge results are effective, all gains and losses of the derivative are initially posted to other comprehensive income
52

and posted to income to match the period in which the cash flows from the hedged risk are recorded. Any ineffectiveness is immediately recognized in profit or loss.
The following table summarizes the hedge ineffectiveness gains (losses) recognized in profit or loss.
2016 2015 Cash flow hedges ($6,672) ($1,002)
($6,672) ($1,002)
The following table summarizes the notional amounts and carrying value of our hedging derivative financial instruments.
2016 Notional amounts Carrying value
Positive Negative Cash flow hedges $10,000,000 $0 ($49,845)
$10,000,000 $0 ($49,845)
2015 Notional amounts Carrying value
Positive Negative Cash flow hedges $10,000,000 $33,823 $0
$10,000,000 $33,823 $0
53

CREDIT UNION DEPOSIT GUARANTEE CORPORATION
Deposits Fully Guaranteed
Credit Union Deposit Guarantee Corporation (the Corporation) is the primary regulator and deposit guarantor for Saskatchewan credit unions. The Corporation is charged through provincial legislation, The Credit Union Act, 1998, with the main purpose of guaranteeing the full repayment of deposits held in Saskatchewan credit unions. The Corporation has successfully guaranteed the repayment of deposits held in Saskatchewan credit unions for over 60 years. By guaranteeing deposits and promoting responsible governance, the Corporation contributes to confidence in Saskatchewan credit unions.
Responding to regulatory changes at the international and national levels continued to be a key focus for the Corporation in 2016. Federally, a shift in policy direction assigned regulation of the credit union centrals to the provinces. This resulted in the government of Saskatchewan creating and passing the Credit Union Central of Saskatchewan Act, 2016 assigning regulatory responsibilities for SaskCentral to the Corporation. In preparation for assuming these responsibilities in 2017, the Corporation developed regulatory policy and supervisory practices.
At the provincial level, work was finalized on the development of liquidity standards and guidance that align with current international standards. As part of this development, the Standards of Sound Business Practice and Capital Standards of Sound Business Practice were reviewed and updated. These documents were provided to credit unions well in advance of coming into effect on January 1, 2017. These efforts will ensure that the Corporation is in a position to continue to protect credit union depositors which, in turn, contributes to the strength and stability of the Saskatchewan credit union system.
In 2017 the Corporation will continue to monitor the potential implications of the changing regulatory environment in addition to carrying forward its preventive efforts to support credit unions as an effective first level of deposit protection. Maintaining constructive relationships with credit unions and investing in programs that reduce risk to the Deposit Guarantee Fund will continue to be a key priority.
For more information about deposit protection, the Corporation’s regulatory responsibilities and its role in promoting the strength and stability of Saskatchewan credit unions, talk to a representative at the credit union or visit the Corporation’s web site at www.cudgc.sk.ca.
54

George Greenwood - Chief Executive Officer
OFFICERS AND VICE PRESIDENTS
Jill Norrish -Vice President, TCU Wealth Management
Ronél came to TCU in 2008 after a successful career in South Africa. Ronél’s honors degree in Organizational Psychology with a double major in marketing/public relations, has allowed her to have a broad understanding of the business world. Her retail focus made it easy to transition to the world of finance. During her career at TCU, she has focused on aligning HR practices with TCU’s progressive strategic focus. In this regard, activities to refocus organizational culture linked to pro-active employee development initiatives have helped strengthen the organization.
Ronél Eglington - Vice President, People and Culture
George came to TCU as the CEO in 2015. He began his career in financial services in Vancouver with Vancity Savings Credit Union. He progressed through various positions in member services, product services and organizational development and training. He has gone on to act as the CEO for both Beaubear Credit Union and Advance Savings Credit Union, both located in New Brunswick. In his role as CEO at TCU, George is responsible to provide vision, strategic direction and leadership to TCU. George completed his MBA at Dalhousie University. He is a Chartered Professional Accountant (CPA, CMA) and a certified Financial Planner (CFP).
Greg Peacock - Chief Financial OfficerGreg has over 22 years experience within the financial services industry, over 21 years experience of which has been within the credit union system, all with TCU Financial Group. Throughout these years, Greg has been involved in many aspects of the Credit Union including Loans Officer, Accountant and Branch Manager. Greg has been in his current role since 2006. He provides the strategic direction and leadership for the financial operations of TCU Financial Group and its subsidiary company.Greg graduated with a Bachelor of Commerce from the University of Saskatchewan in 1993. Greg volunteers his time as a Director and Treasurer for the Saskatoon Hilltop Football Club.
Kathy Styranko - Chief Risk OfficerKathy’s 38+ years in the financial services industry has afforded her experience in all facets of the business including leadership roles at various levels. Kathy joined TCU in 2003 and moved into her current role in 2007. In this role she has focused on enhancing the compliance, audit and risk management functions within TCU providing direction to her team and support to all business lines.
Jill has been in the Credit Union system for 28 years, working at 2 other credit unions before coming to TCU Financial Group in 1998. She has held various positions throughout her career and has been the VP of TCU Wealth Management for 13 years. Jill holds her Certified Financial Planner® designation and in recent years has focused her education on Leadership Development. Jill and the Wealth Management Team take pride in truly getting to know their clients to deliver personalized and trustworthy advice.
Lee-Ann Page - Vice President, Sales and ServiceLee-Ann joined TCU as the VP, Sales and Service after relocating to Saskatoon from British Columbia in June 2016. She brings over 19 years’ experience in the Credit Union system where she progressed through virtually all retail branch positions. Previous to joining the TCU team Lee-Ann was a Senior Manager, Sales and Service at Prospera Credit Union with a focus on coaching leaders within the organization and developing and delivering sales tools to enable staff to have meaningful conversations with members. Lee-Ann is passionate about employee development, leadership development, strategic planning and change management. She is a Certified Financial Planner, Registered Retirement Consultant and is currently completing a Graduate Certificate at Royal Roads University in Executive Coaching.
55

C R E D I T U N I O N
Regina Quance Branch2615 E Quance StreetRegina, SK S4V 3B7 Regina Rochdale Branch4500 Rochdale BoulevardRegina, SK S4X 4N9 Saskatoon Arlington Branch2311 Arlington AvenueSaskatoon, SK S7J 2H8 Saskatoon Ludlow Branch307 Ludlow StreetSaskatoon, SK S7S 1N6 Saskatoon Stonebridge Branch3130 Preston Avenue SouthSaskatoon, SK S7T 0V1 MemberLine (Contact Centre)Regina 306-546-7800Saskatoon 306-651-6500
Mailing AddressPO Box 5050Saskatoon, SK S7K 4E3