annual report 2014 15 - SANBI
156
ANNUAL REPORT 2014•15 South African National Biodiversity Institute Biodiversity for Life
Transcript of annual report 2014 15 - SANBI

annual report2014•15
South African National Biodiversity InstituteBiodiversity for Life


Minister’s Foreword 2
general information 4
Public entity‘s general information 5
List of Abbreviations /Acronyms 6
Chairperson’s Statement 8
Board of Directors 10
Chief Executive Officer’s Report 12
Executive Management 15
Strategic Overview 16
Legislative and Other Mandates 17
Organisational Structure 20
Performance information 21
PROgRAMME 1 Render effective and efficient corporate services 22
PROgRAMME 2 Manage and unlock benefits of the network of National Botanical gardens 26
PROgRAMME 3 Provide scientific evidence to support policy and decision making relating to biodiversity, including the impacts of climate change 30
PROgRAMME 4 Co-ordinate and provide access to biodiversity information and knowledge 34
PROgRAMME 5 Provide biodiversity and climate change adaptation policy tools and advice in support of South Africa’s development 38
PROgRAMME 6 Human capital development (HCD): Drive human capital development, education and awareness in response to Sanbi’s mandate 45
Pre-determined objectives 50
governance rePorts 65
Statement of responsibility of the Board 66
Report by the accounting authority 67
Corporate governance statement 71
Report of the audit and risk committee 79
Annual financial statements 81
Report of the Auditor-general of South Africa 84
Accounting policies 94-113
Notes to the annual financial statements 114-146
Annexure A 147-148
list of accolades 2014/15 Kirstenbosch national botanical garden
canopy walkway (the boomslang) voted most beautiful object in south africa
Kirstenbosch national botanical garden itself received garden of the Year’ award in the international garden tourism awards
our citizen scientists in creW discovering two new plant species and other taxonomic achievements
visitors galore to our lovely network of botanical gardens
surge in activity in ‘growing our own timber’ and recognising achievers
auditor general’s clean audit award (for the first time in our history!)
silver gilt award at chelsea flower show 2014
table of contents

ANNUAL REPORT2 20142015
We present to you the 2014/15 Annual Report for the South African National
Biodiversity Institute (SANBI).
The year under review marks a decade since the founding of SANBI, a public
entity under the Department of Environmental Affairs (DEA), which manages the country’s
national network of biodiversity centres. The Institution provides invaluable science-based
support for the DEA, which enables the Department to make policy decisions in order to
protect and conserve our country’s natural assets.
SANBI’s role is to monitor the state of our biodiversity; give access to biodiversity knowledge
and information; provide policy advice based on good science and best practice; lead
biodiversity human capital development; and run the network of the National Botanical
gardens (NBgs).
Our livelihood and economy depend entirely on sustainable biodiversity. Without the
natural resources and species that our country is richly endowed with, there would be
no jobs, food, shelter, fuel, medicine and vital economic sectors such as tourism. Without
biodiversity that is well-conserved, the impacts of climate change would be far more
evident. The work done by SANBI is therefore central to our ability to assist humanity
change its attitude in taking protection of biodiversity for granted.
I am proud of the work done by this Institute, including the successful publication of the
Biodiversity Series 25. This publication celebrates the achievements of the past ten years
of SANBI’s existence. It seeks to promote SANBI collections as irreplaceable and valuable
research infrastructure, and to provide a glimpse into the future of collections.
During this reporting period, I also had the pleasure of submitting South Africa’s 5th
National Report to the Convention on Biological Diversity (CBD).
This Report highlights South Africa’s achievements in implementing its commitments
to the CBD over the last 5 years. South Africa was the first country to submit its Report
ahead of schedule and I received commendation from the CBD’s Executive Secretary on
the excellent progress being made towards the achievement of the Aichi Targets (global
targets to protect biodiversity), especially around the advances we have made in integrating
biodiversity in to our national development planning and sector policies.
Our NBgs received their highest number of visitors and own income generated since the
establishment of the network more than 100 years ago. The gardens hosted in excess of 1.8
million visitors, which is 26.7 percent higher than the previous financial year.
In order to enhance the growth in the biodiversity sector, work is commencing to upgrade
and develop new revenue generating tourism facilities.
Ms B E E Molewa, MPMinister of Environmental Affairs
FOREWORD Minister’s Foreword

3ANNUAL REPORT20142015
The launch of the South Africa’s 10th NBg, the Kwelera Botanical garden was historic as it is the first ever NBg in the Eastern Cape.
I am hoping that this garden will play a significant role in promoting biodiversity education to surrounding communities and also
provide a tourism attraction for the Buffalo City Metropolitan Municipality and the greater East London area. Through this garden
we are laying the groundwork for the socio-economic upliftment of communities and their advancement into the mainstream
economy.
The issue of skilled professionals in the field of biodiversity remains a challenge which we must all respond to with enthusiasm. As
thought leaders in the environment sector, SANBI continues to push the frontiers of poverty with biodiversity and conservation
central to its programme.
During the reporting period, over 800 unemployed young graduates and matriculants completed an 18 month incubation
programme, known as groen Sebenza. The youngsters were skilled through being placed in jobs in the biodiversity sector, across
over 40 host partner organisations, led by SANBI. I welcome this pioneering initiative which is committed to the eradication of
poverty and inclusive growth that creates jobs while also preserving the environment.
The SANBI 2014/15 annual report complies with all statutory reporting requirements, particularly section 40(1) of the Public
Finance Management Act (PFMA), 1999, and paragraph 18 of the National Treasury Regulations..
Ms B E E Molewa, MPMinister of Environmental Affairs
Minister Molewa at the Kwelera NBG

general inForMation
cascades

5ANNUAL REPORT20142015
INFORMATION Registered name of the public entity: South African National Biodiversity Institute
Registration Numbers and/or other relevant numbers (e.g.: FSP)
SANBI is a Public Entity established in terms of the National
Environmental Management: Biodiversity Act of 2004 (No. 10 of
2004)
Registered Office address: 2 Cussonia Avenue, Brummeria, Pretoria, 0002
Postal Address: Private Bag X101, Silverton, 0184
Contact telephone numbers: 012 843 5200
Email address: [email protected]
Website address: www.sanbi.org
External Auditor: Auditor-general South Africa
Internal Auditor: grant Thornton
Name of Bank: Nedbank and ABSA Limited
Board Secretariat: Ms Lebogang Ralepeli
public entity’s general inForMation
ANNUAL REPORT6 20142015
ABBREvIATIONS bgci Mec
Botanic gardens Conservation International Member of the Executive Councilbgis Moa
Biodiversity geographical Information System Memorandum of AgreementbHcd Mop
Biodiversity Human Capital Development Member of the PartiesbMp Mou
Biodiversity Management Plan Memorandum of Understandingbotsoc Msb
Botanical Society of South Africa Millennium Seed Bank (UK)c.a.p.e. Mstp
Cape Action for People and the Environment Master Systems Technology Plancaps Mta
Curriculum Assessment Policy Statements Message Transfer Agent catHsseta MteF
Culture Arts, Tourism, Hospitality & Sport Sector Education & Training Authority Medium-Term Expenditure Framework
cbd Mti
Convention on Biological Diversity Marine Trophic Indexccba nba
Climate Change and Bio adaptation Division National Biodiversity AssessmentcepF nbF
Critical Ecosystem Partnership Fund New Business Financecop nbg
Conference of the Parties National Botanical gardencrew ndF
Custodians for Rare and Endangered Wildflowers Non Detriment Findingscsir ndp
Council for Scientific and Industrial Research National Development PlandaFF neHawu
Department of Agriculture, Forestry and Fisheries National Education, Health and Allied Workers’ Union (South Africa)
dbe neMba
Department of Basic Education National Environmental Management Biodiversity Actdbsa nFepa
The Development Bank of Southern Africa National Freshwater Ecosystem Priority Areasdea ngo
Department of Environmental Affairs Non-governmental Organisationdedeat ngp
The Department of Economic Development, Environmental Affairs & Tourism New growth Path
deFra nie
Department of Environment, Food and Rural Affairs National Implementing Entitydg nrF
Director general National Research Foundation
list oF abbreviations/acronyMs

7ANNUAL REPORT20142015
dst od
Department: Science and Technology Organisation Developmentdwa oHs
Department of Water Affairs Occupational Health and Safetyeap pes
Employee Assistance Programme Payment for Ecosystem Serviceseba pgwc
Ecosystem-Based Approaches Provincial government of the Western Capeecic proecoserve
Export Credit Insurance Corporation Project for Ecosystem Servicesecpta sabap2
Eastern Cape Parks & Tourism Agency Southern African Bird Atlas Project 2eia sabiF
Environmental Impact Assessment South African Biodiversity Information Facilityepwp saiab
Expanded Public Works Programme South African Institute for Aquatic Biodiversityewt sanbi
Endangered Wildlife Trust South African National Biodiversity InstituteFp6 sanparks
Framework Programme 6 South African National ParksgbiF sip
global Biodiversity Information Facility Strategic Integrated ProjectgeF sarchi
global Environment Facility The South African Research Chairs InitiativegiZ sars
Deutsche gesellschaft für Internationale Zusammenarbeit South African Revenue ServicesgM sis
genetically Modified Skills Intelligence SystemgMo tau
genetically Modified Organisms Technical Assistance Unit of Nationalgspc tops
global Strategy for Plant Conservation Threatened or Protected SpeciesHawK uKZn
Hangklip Art Week University of KwaZulu-NatalHcd undp
Human Capital Development United Nations Development ProgrammeHrd unep
Human Resources Development United Nations Environment Programmeipbes unFccc
International Panel on Biodiversity and Ecosystem Services United Nations Framework Convention on Climate Changeipcc unops
AR5 Intergovernmental Panel on Climate Change - The Fifth Assessment Report The United Nations Office for Project Services
iucn uwc
International Union for Conservation of Nature University of the Western CapeKra wessa
Key Result Areas Wildlife and Environment Society of Southern AfricaltsM wsp
Learner Teacher Support Material Workplace Skills PlannrM wwF-sa
Natural Resource Management World Wildlife Fund-South Africa

ANNUAL REPORT8 20142015
STATEMENTcHairperson’s stateMent
introduction
The South African National Biodiversity Institute (SANBI) leads and coordinates research,
monitors and reports on the state of biodiversity in South Africa. The institute provides
knowledge, information, gives planning and policy advice and pilots best-practice
management models in partnership with stakeholders. SANBI engages in ecosystem
restoration and rehabilitation, leads the human capital development strategy of the sector
and manages the National Botanical gardens as ‘windows’ to South Africa’s biodiversity for
enjoyment and education.
Against this background we managed to deliver on our wide mandate, all in support of
our country’s growth and development. We have successfully achieved our objectives and
targets during the year under review.
SANBI is positioned to lead the biodiversity sector of South Africa and is recognised as the
first port of call for knowledge, information and policy advice on biodiversity.
SANBI makes an important contribution to national development through ensuring that
it is aligned with government priorities. We subscribe and contribute to the National
Development Plan 2030, to eliminate poverty and reduce inequality. This we achieve this
by making a direct link between biodiversity and development. While SANBI contributes
to a number of the critical actions outlined in the plan, it makes a specific contribution
to Critical Action 7 regarding interventions to ensure environmental sustainability and
resilience to future shocks.
Financial sustainability and good corporate governance remain crucial factors that ensure
that the organisation’s mandate is executed successfully. This is evidenced by the institute
continuously receiving an unqualified audit from the Auditor-general, culminating with
this year’s Auditor general’s Clean Audit Award (for the first time in our history).
We acknowledge that SANBI cannot achieve all its objectives alone, teamwork involving
our key stakeholder active in the sector, ensures our success and viability. We have therefore
adopted a ‘managed network’ institutional model, which consists of partner organisations
with whom SANBI has formal and informal agreements that contribute towards delivering
on SANBI’s mandate. These managed network assist us to achieve the entities’ strategic
goals and objectives not through performing functions in-house, but rather through
developing a set of structured relationships with a range of strategic partners in the public
and non-governmental organisation sectors.
These partnerships allow SANBI to harness and engage with the extensive range of
biodiversity expertise in South Africa, as well as to draw on organisations who may not
currently see themselves as directly involved in the biodiversity sector, but have relevant
knowledge, skills and experience to contribute to achieving biodiversity goals.
Ms ME MagomolaChairperson

9ANNUAL REPORT20142015
I want to start by extending my greatful thanks and appreciation
to Ms Edna Molewa, Minister for Environmental Affairs for her
confidence in our abilities, her clear vision and ongoing belief
and assistance for our initiatives.
I would be failing in my duties if I did not use the opportunity
to thank outgoing Board members for their commitment and
dedication; the leadership they brought to the organisation,
while making it possible for our management and staff to focus
keenly on the core issues. Equally I thank the current Board
colleagues for the skill they have displayed in rapidly coming
together to form a close-knit team devoted to ensuring
continued encouragement and support.
Lastly I greatly acknowledge the role played by Dr Tanya
Abrahamse, her Executive Management team and members
of our staff for their endeavours during the 2014/15 period.
Their hard work and achievements make us all proud to be
associated with SANBI. The outstanding results presented in
this annual report bear testimony to your commitment to the
success and sustainability of SANBI.
In conclusion, I take this opportunity to thank all those with
whom SANBI interacts with and for the generous support and
reassurance.
Ms ME MagomolaBoard ChairpersonSouth African National Biodiversity Institute
SANBI is positioned to lead the biodiversity sector of South Africa and is recognised as the first port of call for knowledge, information and policy advice on biodiversity

ANNUAL REPORT10 20142015
Mr S Gounden
Ms ME MagomolaChairperson
Mr G Mashamba
Ms NN Mnqeta
Dr T Abrahamse
Dr J Matjila
Mr F Mketeni
Ms BD Ngidi
Mr AJ Frost
Dr ST Cornelius
DIRECTORSboard oF directors
11ANNUAL REPORT20142015
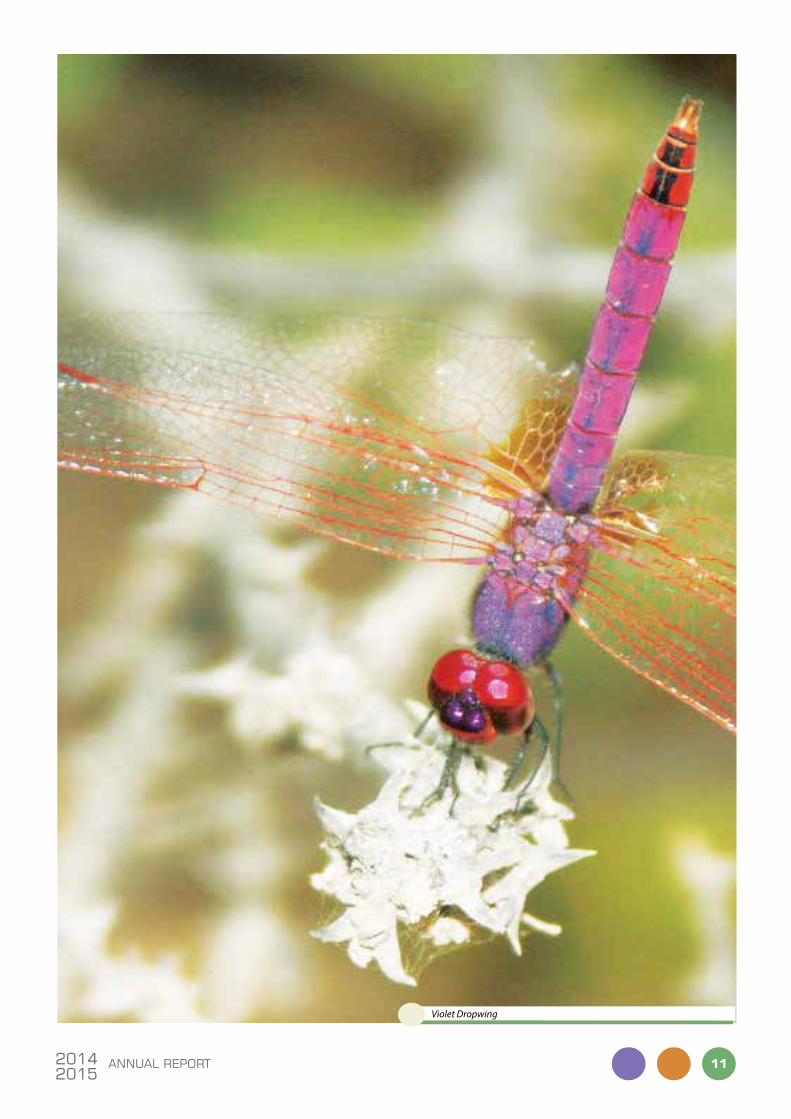
Violet Dropwing
ANNUAL REPORT12 20142015
South African National Biodiversity Institute through the guidance of the SANBI
Board, with support of the Minister of Environmental Affairs, and the dedication of
management and staff has performed well in the 2014/15 financial year with sound
management, proper execution of fiduciary duties, and high performance against targets
as set out in our approved Corporate Strategic Plan and Annual Performance Plan. It is my
privilege to lead such a high performing public entity that contributes to the Department
of Environmental Affairs (DEA) outcomes and delivery agreements, and with values and
objectives aligned to the goals of our National Development Plan 2030.
SANBI reported a surplus in the year under review. One of the main reasons for the surplus
was from exceeding our revenue collection target due to a leap in numbers of visitors to
our National Botanical gardens network. This is an indication that increasing numbers of
our citizens are seeing the value of the gardens as ‘windows’ into the rich biodiversity of
our country and are increasingly enjoying the leisure, educational and tourism experiences
that our gardens offer.
The key constraint for SANBI is inadequate funding whilst the responsibilities continue
to expand. For example, SANBI’s obligations in the implementation of the new Invasive
Species Regulations have financial and human resource implications which funding
support is needed. Also the establishment of two new gardens requires careful planning
and allocation of human and financial resources in the face of general cost containment
and fiscal constraints and is being addressed through our planning, recruitment and
budgeting plan.
However, SANBI management recognize the global and national financial constraints
and have found innovative means to overcome this challenge. A good example is an
agreement with DEA to provide, at cost, evidence based biodiversity information for the
environmental management of the Strategic Infrastructure Projects (SIPs) harnessing
our existing information management and research capabilities. In addition, through
new sources of funding, SANBI intends to initiate enhanced activities in some key areas
to further cement the fact that biodiversity contributes to our development goals. For
example our past Biodiversity mainstreaming efforts have demonstrated that integrating
biodiversity and ecological infrastructure into municipal planning and decision-making
can yield significant savings on municipal costs, boost local economies, support livelihoods
and enhance quality of life of citizens. It is against this backdrop that the SANBI Municipal
Support programme will be supporting municipalities by strengthening the capacity
of municipal officials and demonstrating the value of biodiversity assets and ecological
infrastructure. Further SANBI will continue to provide some of the critical evidence
and analysis to develop a sustainable wildlife economy in contribution to the National
Biodiversity Economy Development Strategy (NBEDS).
Dr T Abrahamse Chief Executive Officer
REPORT cHieF executive oFFicer’s report

13ANNUAL REPORT20142015
In the year under review SANBI’s has been highly successful as
South Africa’s National Implementing Entity (NIE) of the global
Adaptation Fund, initiating pilots that demonstrate how we
can ‘climate-proof’ our communities in the face of potential
negative impacts of climate change. At the Minister’s request
we have submitted an application for accreditation to be one
of South Africa’s NIEs of the green Climate Fund (gCF) with one
aim to take these pilots to scale.
SANBI will continue to contribute to a number of key
government initiatives such as the Operation Phakisa Ocean
Economy Initiative, launched in 2014 by President Zuma. This
initiative provides an ideal opportunity for SANBI to display its
wealth of relevant biodiversity data, to illustrate its partnership
with key stakeholders in the sector and to ensure that marine
biodiversity issues are mainstreamed into the economy
and marine spatial planning. Our marine programme has
secured R2 million through the African Coelacanth Ecosystem
Programme to develop multi-disciplinary offshore research
capacity and build the knowledge base to support improved
understanding and management of the poorly studied outer
shelf and shelf edge ecosystems of the Eastern Cape. This
project will fall within a proposed Phakisa Marine Protected
Area (MPA’s) and will contribute to the spatial analysis of the
areas.
SANBI continues to mobilize new and alternative sources of
funding for its role in biodiversity science and policy advice.
It has successfully mobilised US$8.2 million for the next five
years from the global Environmental Facility (gEF) 5 for its
Mainstreaming Biodiversity into Land Use Regulation and
Management at the Municipal Scale Project. going forward the
Institute will make a further submission for gEF 6 funding for
its work on biodiversity and land degradation and the wildlife
economy.
Skills and competencies in the biodiversity sector remains
the biggest challenge to achieving our vision of biodiversity
richness for all. In the year under review SANBI continued to
prioritize human capital development both internally and
externally.
Rotation
ANNUAL REPORT14 20142015
To this end our innovative and high energy project, groen Sebenza has shown remarkable success in nurturing our unemployed
young people to have careers in, contribute to and transform our sector. We were very pleased to work with over 44 institutions
and organisations to achieve this success. Our thanks go to the National Treasury’s gTAC for assistance and financial support. In
my view, this project will have an indelible mark on our sector and our country into the future.
SANBI has enjoyed pleasing results in the 2014/15 financial year due largely to the dedication of all those with a passion for
biodiversity and a desire to realise the growth of this vital sector in the economy of South Africa. In this regard I want to give
heartfelt thanks to our Minister of Environmental Affairs, Ms Edna Molewa, together with her executive team for their confidence
in our organisation and the support they have afforded us. I am grateful to the SANBI Board Chairperson, Ms Magomola and the
entire Board, past and present for the vision and strategic direction they have brought to SANBI and for their uncompromising
stance with regard to maintaining the highest standards of corporate governance, compliance and transparency.
To my Executive Management team and staff colleagues I extend a note of gratitude and appreciation for their unstinting support
and team work, and for their drive and commitment to the achievement of our mandate and in overcoming barriers to success.
Last but not least a heartfelt thanks to our partners in the biodiversity sector. Working together has ensured that biodiversity value
is enjoyed by all and will be conserved for the future.
Dr. T AbrahamseChief Executive Officer: SANBI

15ANNUAL REPORT20142015
L Sithole
T Abrahamse
MJ Netshiombo
CK Willis
ME Khoahli
L Dlamini
GF Smith
CH Mbizvo
AT Smith
KE Maze
JS Donaldson
LV Ralepeli
EXECUTIvE executive ManageMent

ANNUAL REPORT16 20142015
visionBiodiversity richness for all South Africans.
MissionTo champion the exploration, conservation, sustainable use, appreciation and enjoyment of South Africa’s exceptionally rich biodiversity for all people.
valuesSANBI is guided by the following organisational values which spell out “uGreat”
ubuntuharnessing, caring, sharing and being in harmony with all of creation
growthnurturing and empowering teams and individuals to grow and reach their true potential
respect and tolerancecreating open, honest relationships built on trust, mutual respect, dignity and fairness and valuing and accepting individuals and diversity
excellenceproviding service excellence through passion and professionalism
accountabilitytaking pride and responsibility in our work and caring for our environment and communities
togethernessthrough collaboration we change the world
17ANNUAL REPORT20142015
The South African National Biodiversity Institute was established in terms of section 10(1) of the National Biodiversity Management:
Biodiversity Act, 2004 (Act No. 10 of 2004). SANBI is a public entity in terms of section 38(1) (m) of the Public Finance Management
Act, 1999 (Act No. 1 of 1999). It is classified as a schedule 3A entity, i.e. one that will receive substantial support from the National
Revenue Fund.
Section 2 of National Environmental Management Biodiversity Act (NEMBA) stipulates that SANBI’s purpose is to assist in achieving
the objectives of the Biodiversity Act. Section 2 sets the further objectives of the Act, i.e.:
(a) within the framework of the National Environmental Management Act, to provide for:
(i) the management and conservation of biological diversity within the Republic and of the components of such biological diversity;
(ii) the use of indigenous biological resources in a sustainable manner; and
(iii) the fair and equitable sharing among stakeholders of benefits arising from bio-prospecting involving indigenous biological resources;
(b) to give effect to ratified international agreements relating to biodiversity, which are binding on the Republic;
(c) to provide for co-operative governance in biodiversity management and conservation; and
(d) to provide for a South African National Biodiversity Institute.
SANBI’s mandate comes from the National Biodiversity Management: Biodiversity Act, 2004 (Act No. 10 of 2004: Section 11).
Functions
(1) The Institute:
(a) must monitor and report regularly to the Minister on:
1. the status of the Republic’s biodiversity;
2. the conservation status of all listed threatened or protected species and listed ecosystems; and
3. the status of all listed invasive species;
(b) must monitor and report regularly to the Minister on the impact of any genetically modified organism that has been released into the environment including the impact on non-target organisms and ecological processes, indigenous biological resources and the biological diversity of species used for agriculture;
(c) must act as an advisory and consultative body on matters relating to biodiversity to organs of state and other biodiversity stakeholders;
(d) must co-ordinate and promote the taxonomy of South Africa’s biodiversity;
(e) must manage, control and maintain all national botanical gardens;
(f ) must manage, control and maintain:
1. herbaria; and
2. collections of dead animals that may exist;
LEgISLATIvE legislative and otHer Mandates

ANNUAL REPORT18 20142015
(g) must establish facilities for horticulture display, environmental education, visitor amenities and research;
(h) must establish, maintain, protect and preserve collections of plants in national botanical gardens and in herbaria;
(i) may establish, maintain, protect and preserve collections of animals and micro-organisms in appropriate enclosures;
(j) must collect, generate, process, co-ordinate and disseminate information about biodiversity and the sustainable use of indigenous biological resources and establish and maintain databases in this regard;
(k) must allow, regulate or prohibit access by the public to national botanical gardens, herbaria and other places under the control of the Institute and supply plants, information, meals or refreshments or render other services to visitors;
(l) must undertake and promote research on indigenous biodiversity and the sustainable use of indigenous biological resources;
(m) must coordinate and implement programmes for:
1. the rehabilitation of ecosystems; and
2. the prevention, control or eradication of listed invasive species;
(n) must coordinate programmes to involve civil society in:
1. the conservation and sustainable use of indigenous biological resources; and
2. the rehabilitation of ecosystems;
(o) on the Minister’s request, must assist him or her in the performance of duties and the exercise of powers assigned to the Minister in terms of this Act;
(p) on the Minister’s request, must advise him or her on any matter regulated in terms of this Act, including:
1. the implementation of this Act and any international agreements affecting biodiversity which are binding on the Republic;
2. the identification of bioregions and the contents of any bioregional plans;
3. other aspects of biodiversity planning;
4. the management and conservation of biological diversity; and
5. the sustainable use of indigenous biological resources;
(q) on the Minister’s request, must advise him or her on the declaration and the management of, and development in, national protected areas;
(r) must perform any other duties:
1. assignment to it in terms of this Act; or
2. as may be prescribed.
(2) When the Institute in terms of subsection (1) gives advice on a scientific matter, it may consult any appropriate organ of state or other institution, which has expertise in that matter.
48. (3) The Institute must:
(a) assist the Minister and others involved in the preparation of the National Biodiversity Framework, a bioregional plan or a biodiversity management plan to comply with subsection (1); and
(b) make recommendations to organs of state or municipalities referred to in subsection (2); align their plans referred to in that subsection with the National Biodiversity Framework and any applicable bioregional plan.
60.(2) The Institute must provide logistical, administrative and financial support for the proper functioning of the Scientific Authority.
19ANNUAL REPORT20142015
SANBI is also responsible for the following regulations in terms of NEMBA:
• Threatened or Protected Species Regulations;
• Convention on International Trade in Endangered Species of Wild Fauna and Flora Regulations;
• Draft Alien and Invasive Species Regulations.
Underpinning the successful implementation of provisions of NEMBA is the submission of scientific evidence to support policy
and decision making relating to the conservation and management of biodiversity and the impacts of and adaptation to climate
change.
Key priorities are also derived from official sources that identify issues with a high relevance to policy, such as, the National
Biodiversity Strategy and Action Plan (NBSAP), the National Biodiversity Framework (NBF), government delivery agreements
(Outcome 10), and other national priorities (e.g., wildlife trade, the green economy), and specific mandates such as provided by
the White Paper on the National Climate Change Response Policy (NCCRP).
SANBI manages its human resources through the following legislation:
• National Environmental Management: Biodiversity Act, 2004 (Act No. 10 of 2004)
• Labour Relations Act, 1995 (Act No. 66 of 1995)
• Basic Conditions of Employment Act, 1997 (Act No. 75 of 1997)
• Employment Equity Act, 1998 (Act No. 55 of 1998)
• Skills Development Act, 1998 (Act No. 97 of 1998)
• Skills Development Levies Act, 1999 (Act No. 9 of 1999)
The Institute also complies with the Public Finance Management Act and relevant Treasury regulations.
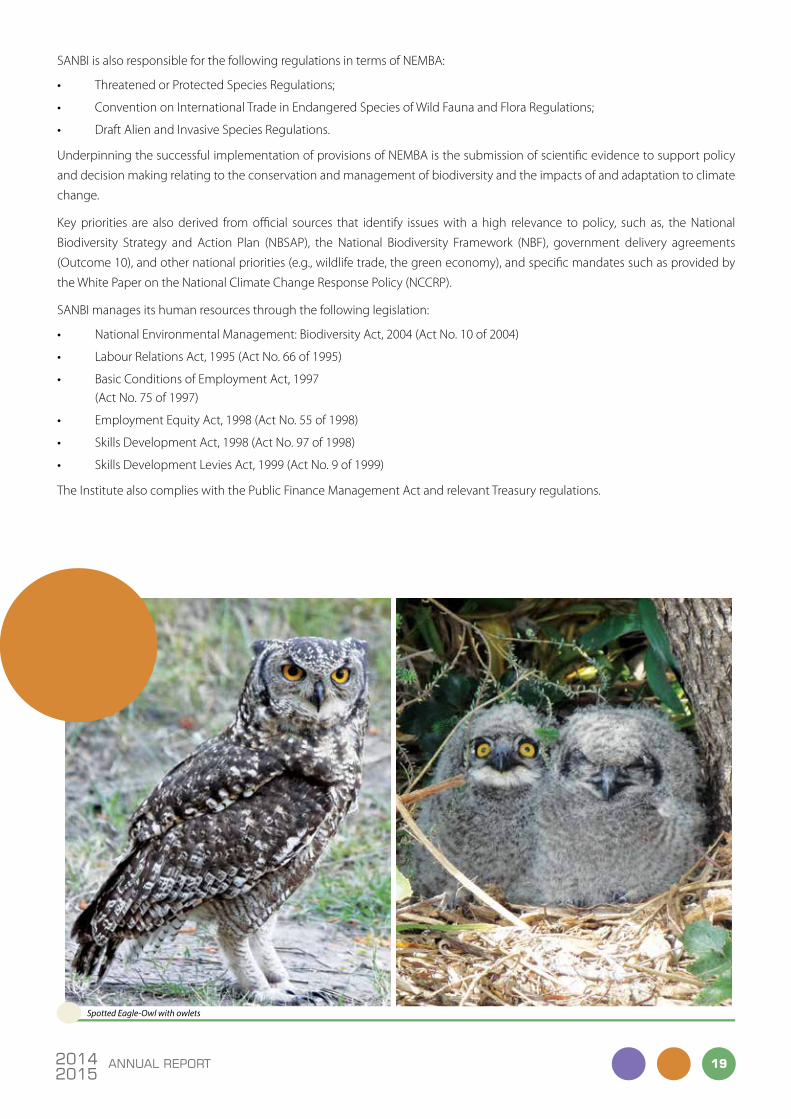
Spotted Eagle-Owl with owlets

ANNUAL REPORT20 20142015
STRUCTURE organisational structure
sou
th a
fric
an n
atio
nal b
iodi
vers
ity
inst
itute
min
iste
r of
env
iron
men
tal a
ffai
rs
sa
nb
i boa
rd
chi
ef e
xecu
tive
off
icer
chi
ef f
inan
cial
o
ffic
er:
fina
nce
Hea
d: b
iodi
vers
ity
sci
ence
and
Pol
icy
adv
ice
director:financial management
director:scm & assets management
director:ceo office and board secretary
director:marketing & communication
director:Human resources management
director:biosystematics & collections initiatives
director:information technology
curator:Kirstenbosch national botanical garden
director:biodiversity information management & Planning
director:strategic biodiversity research
director:conservation gardens & tourism
director:municipal support
director:biodiversity assessment & monitoring
director:climate change adaptation
director:biodiversity education & empowerment
director:ecological infrastructure
director:monitoring & reporting
chi
ef d
irec
tor:
H
uman
r
esou
rces
chi
ef d
irec
tor:
b
iosy
stem
atic
s &
col
lect
ions
chi
ef c
orpo
rate
o
ffic
er:
cor
pora
te
ser
vice
s
chi
ef d
irec
tor:
c
onse
rvat
ion
gar
dens
&
tour
ism
chi
ef d
irec
tor:
b
iodi
vers
ity
info
rmat
ion
&
Pol
icy
adv
ice
chi
ef d
irec
tor:
b
iodi
vers
ity
res
earc
h,
ass
essm
ent
&
mon
itor
ing

clean audit
perForMance inForMation
auditor general’s clean audit award

ANNUAL REPORT22 20142015
PROgRAMME 1 prograMMe 1render effective and efficient corporate services
purposeThis Programme is designed to ensure that SANBI is effective, efficient, and accountable and responds successfully to changing conditions.
objective statement
• SANBI is positioned as an employer of choice in the biodiversity sector
• Implement effective, efficient and transparent supply chain and financial management system as required by PFMA
• Effective corporate services rendered to achieve the mandate of SANBI
• Effective communication and technology support services through enhanced communication and technology infrastructure
• Effective marketing and communication services delivered to internal and external stakeholders.
Key performance areas
Human Resources
Information Technologies
Marketing and Communication
Governance, Risk and Compliance
Finance
programme performance
The continued effort in growing the SANBI brand and in building media and stakeholder relations by the Marketing and
Communication’s division saw a continued rise in media coverage, which resulted in SANBI receiving coverage totaling R199,084,968
globally and R2,275,684 nationally. The interventions have proven to be a great success. SANBI optimally utilised various media
platforms to build and maintain a positive image of the Institute. This was achieved through leveraging opportunities, brand
associations, partnerships and support from media personalities to increase awareness of SANBI, its services and its offerings.
During the year under review, a number of events were hosted in almost all the gardens, resulting in an increase in footprint. The
Institute set out to create synergistic relationships with various well known and successful brands in order to leverage expanded
awareness of the Institute brand by association. One such linkage that proved to be a success during this period was that with Old
Mutual whose service level agreement was extended from Kirstenbosch to include Walter Sisulu and Pretoria National Botanical
gardens in relation to the concerts they sponsor throughout the year. The aim of this association was to increase awareness of the
brand through publicity gained by way of exposure through print, radio and television channels.
Sustainable communication channels is an integral and fundamental aspect of the organisation’s brand awareness activities. This
was achieved through the use of a number of traditional print advertising channels to communicate effectively with external

23ANNUAL REPORT20142015
stakeholders, and target market of our national botanical gardens as tourism products and, from an internal perspective, members
of staff. Such communication channels enable the organisation to manage and control the consistency of messaging.
In addition, the Institute successfully participated in a number of marketing platforms nationally, including the Tourism Indaba
and the Chelsea Flower Show in London, World Travel Market (WTM) in London and a lot more all geared to boost and grow
SANBI’s presence in the world arena.
Highlights
• SANBI received second place at the SASOL TECHNO X 2014
• SANBI scooped two awards at the Sunday Tribune garden and Leisure show at the Royal Agriculture garden Show in Pietermaritzburg
• SANBI launched the Kwelera National Botanical garden in the Eastern Cape
• SANBI received a Silver-gilt Award at the 2014 Chelsea Flower Show
• Increased footprint in all the gardens
• SANBI coordinated, with the Standard Bank gallery, the exhibition Exact Imagination: 300 Years of Botanically Inspired Art is South Africa which ran from 7 October to 6 December 2014. This is the third in a series of four Standard Bank gallery exhibitions focussing on the elements: water, fire, earth and air.
• SANBI supported and assisted in the planning of the 21st World Orchid Conference at the Sandton Conference Centre and organised the associated international botanical art competition.
ict Highlights
The 2014/15 financial year was a productive period for the Information and Communications Technology (ICT) Division. A key
priority and accomplishment is the continued success in providing reliable ICT services and support to all SANBI stakeholders. This
has been achieved through:
• The continuation of the project that commenced in the previous years and aimed at replacing all ageing computer desktops and laptops for improved organisational productivity
• The installation of new servers for increased network needs and backup requirements
• The installation of SMART televisions across the SANBI Boardrooms and meeting rooms to improve internal and external electronic organisational collaboration. The use of online devises provided communication efficiency and reduction in travel
• The rollout of the fibre optic cable in Pretoria campus for bolstering ICT capacity, bandwidth and Wi-Fi connectivity for our clients. As a result, SANBI has experienced a marked increase in demand for the use of its conference and meetings facilities
• The implementation of the Risk and Compliance Systems projects which is expected to go live in the new financial year.
Human resources
During the year under review, the Human Resources Division implemented the Institute’s Human Resources and Transformation
Strategy. One of the main aims of the strategy is to ensure that SANBI is positioned as an employer of choice in the biodiversity
sector.
SANBI has 44 scientists on the scientists’ career ladder, 12 scientists were promoted in the year under review. In order to create
an enabling environment for the implementation of the Institute’s career ladder for horticulturists, a work study was conducted
aimed at assessing the horticulturists’ work load to allow for more focus on core horticultural matters. The task team worked
tirelessly testing the model and putting mechanisms in place in order to ensure a smooth implementation process.
SANBI’s allocation and expenditure on staff development far exceeded the legislated 1% of payroll towards training and
development of its employees.

ANNUAL REPORT24 20142015
Finally, the approved Employment Equity Plan was implemented. This plan is aimed at ensuring that SANBI eliminates employment
equity barriers that have a negative impact on the attraction, development and retention of employees, particularly from
designated groups.
professional development for 2014/2015
25 Work-integrated learning
47 Employee bursaries - 25 undergraduates and 22 post-graduates
studenships
7 Honours
30 Masters
8 PhD
13 Post-doctoral fellows
40 Interns
employee profile (as at 31 March 2015) – Permanent and Contract
new appointments (01 April 2014–31 March 2015)
31 March 2014
38% AM43% AM
21% AF
13% CM38% AF
11%CF
6% CM
1% IM
2% CF
5% WM5% WM
1% IF
3% IF10% WF 3% WF
31 March 2014
38% AM43% AM
21% AF
13% CM38% AF
11%CF
6% CM
1% IM
2% CF
5% WM5% WM
1% IF
3% IF10% WF 3% WF
legend
aM aF cM cF iM iF wM wF
African males
African females
Coloured males
Coloured females
Indian malesIndian
femalesWhite males
White females
25ANNUAL REPORT20142015
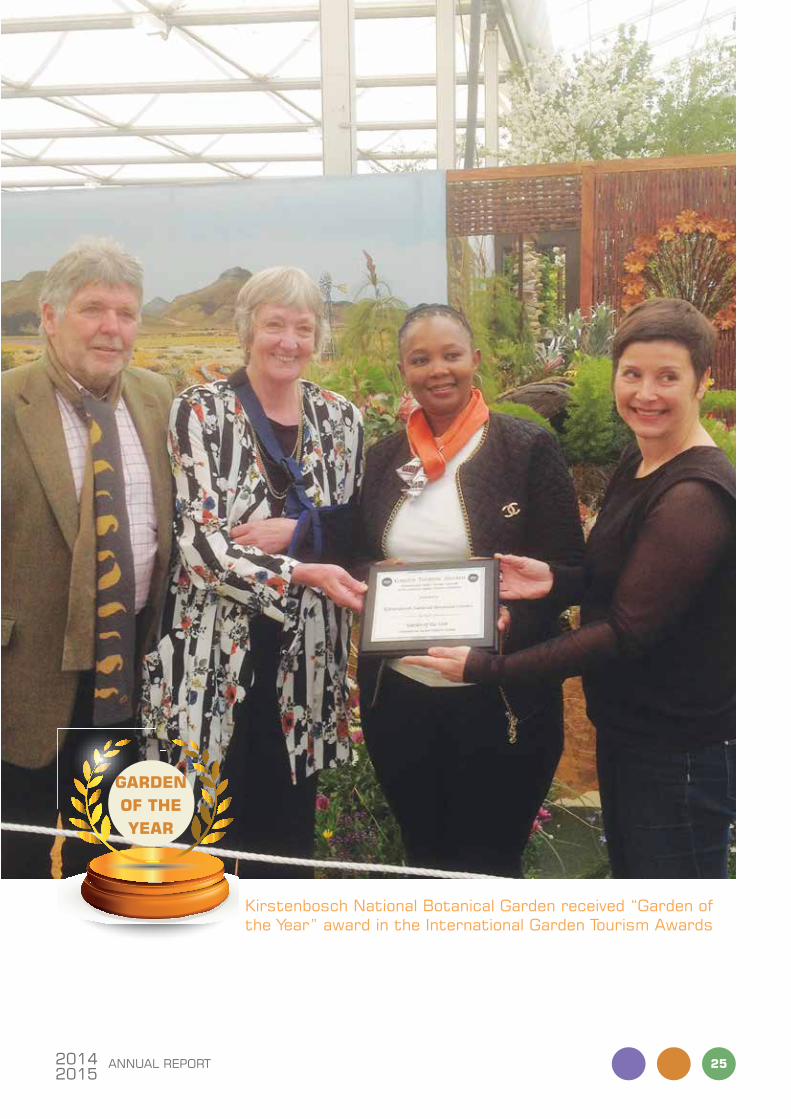
Kirstenbosch national botanical garden received “garden of the Year” award in the international garden tourism awards
garden oF tHe year

ANNUAL REPORT26 20142015
purposeThis programme is designed to ensure the effective management, maintenance and development of South Africa’s network of National Botanical Gardens.
objective statement
• A world-class network of National Botanical gardens are managed
• Revenue generating activities are strengthened in all National Botanical gardens
Key performance areas
Number of best-practice maintenance or development projects completed across South Africa’s National Botanical Gardens
Number of new National Botanical Gardens established and operational
Increased representation of indigenous plants in the living collections of South Africa’s National Botanical Gardens or Millennium Seed Bank, Kew, UK
Percentage own income and visitor numbers increased through expanded and more effective revenue generating activities in the National Botanical Gardens
programme performance
South Africa’s network of National Botanical gardens was expanded through the formal declaration by the DEA Minister of the new
Kwelera National Botanical garden near East London in the Eastern Cape. SANBI now manages ten National Botanical gardens
spread across seven provinces in South Africa. Staff will be appointed by SANBI in the new financial year to manage, maintain and
develop the new garden, in partnership with the Eastern Cape Parks and Tourism Agency (ECPTA). Steady progress was made
with sourcing necessary approvals required for the establishment of the new National Botanical garden in the Limpopo Province.
Led by Kirstenbosch, South Africa’s National Botanical gardens overall received their highest ever number of visitors and own
income generated since the establishment of the network more than 100 years ago. The new Tree Canopy Walkway, commonly
known as the ‘Boomslang’, a Kirstenbosch Centenary (2013) Legacy Project, was completed and officially opened to the public in
Kirstenbosch in May 2014. The new canopy walkway proved extremely popular amongst both local and international visitors and
tourists, and resulted in it being voted the Most Beautiful Object in South Africa at the Design Indaba 2015. Kirstenbosch received
the International garden of the Year Award for 2015 by the International garden Tourism Network. For the first time in its 102-year
history, Kirstenbosch received more than a million visitors during the financial year, with every month throughout the year being
a best ever month in terms of visitor numbers. For the first time in its history, Kirstenbosch received more than 100,000 visitors in
a single month, during December 2014 (116,000). Kirstenbosch’s popularity as a nature-based attraction with tourists was also
reflected in it being ranked number one of 186 things to do in Cape Town Central on www.tripadvisor.co.uk, up from number four
in the previous year.
PROgRAMME 2 prograMMe 2manage and unlock benefits of the network of
national botanical gardens
27ANNUAL REPORT20142015
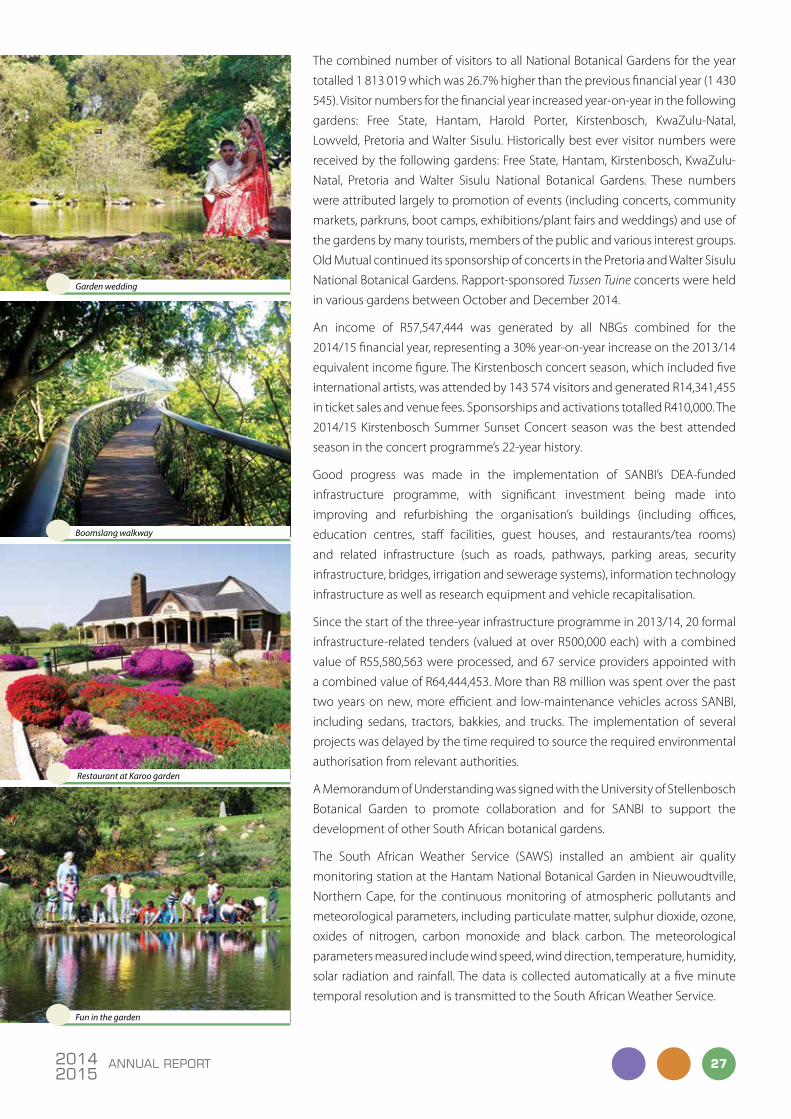
The combined number of visitors to all National Botanical gardens for the year
totalled 1 813 019 which was 26.7% higher than the previous financial year (1 430
545). visitor numbers for the financial year increased year-on-year in the following
gardens: Free State, Hantam, Harold Porter, Kirstenbosch, KwaZulu-Natal,
Lowveld, Pretoria and Walter Sisulu. Historically best ever visitor numbers were
received by the following gardens: Free State, Hantam, Kirstenbosch, KwaZulu-
Natal, Pretoria and Walter Sisulu National Botanical gardens. These numbers
were attributed largely to promotion of events (including concerts, community
markets, parkruns, boot camps, exhibitions/plant fairs and weddings) and use of
the gardens by many tourists, members of the public and various interest groups.
Old Mutual continued its sponsorship of concerts in the Pretoria and Walter Sisulu
National Botanical gardens. Rapport-sponsored Tussen Tuine concerts were held
in various gardens between October and December 2014.
An income of R57,547,444 was generated by all NBgs combined for the
2014/15 financial year, representing a 30% year-on-year increase on the 2013/14
equivalent income figure. The Kirstenbosch concert season, which included five
international artists, was attended by 143 574 visitors and generated R14,341,455
in ticket sales and venue fees. Sponsorships and activations totalled R410,000. The
2014/15 Kirstenbosch Summer Sunset Concert season was the best attended
season in the concert programme’s 22-year history.
good progress was made in the implementation of SANBI’s DEA-funded
infrastructure programme, with significant investment being made into
improving and refurbishing the organisation’s buildings (including offices,
education centres, staff facilities, guest houses, and restaurants/tea rooms)
and related infrastructure (such as roads, pathways, parking areas, security
infrastructure, bridges, irrigation and sewerage systems), information technology
infrastructure as well as research equipment and vehicle recapitalisation.
Since the start of the three-year infrastructure programme in 2013/14, 20 formal
infrastructure-related tenders (valued at over R500,000 each) with a combined
value of R55,580,563 were processed, and 67 service providers appointed with
a combined value of R64,444,453. More than R8 million was spent over the past
two years on new, more efficient and low-maintenance vehicles across SANBI,
including sedans, tractors, bakkies, and trucks. The implementation of several
projects was delayed by the time required to source the required environmental
authorisation from relevant authorities.
A Memorandum of Understanding was signed with the University of Stellenbosch
Botanical garden to promote collaboration and for SANBI to support the
development of other South African botanical gardens.
The South African Weather Service (SAWS) installed an ambient air quality
monitoring station at the Hantam National Botanical garden in Nieuwoudtville,
Northern Cape, for the continuous monitoring of atmospheric pollutants and
meteorological parameters, including particulate matter, sulphur dioxide, ozone,
oxides of nitrogen, carbon monoxide and black carbon. The meteorological
parameters measured include wind speed, wind direction, temperature, humidity,
solar radiation and rainfall. The data is collected automatically at a five minute
temporal resolution and is transmitted to the South African Weather Service.
Garden wedding
Boomslang walkway
Restaurant at Karoo garden
Fun in the garden

ANNUAL REPORT28 20142015
SANBI continued to host DEA-funded Expanded Public Works Programme projects in the Free State, KwaZulu-Natal, Pretoria and
Walter Sisulu National Botanical gardens, providing temporary employment and opportunities for skills development to over
100 previously unemployed workers, and with the projects providing improvement to the gardens boundary fencing, pathways,
irrigation systems, tourism products and removal of alien invasive plants from the natural estates. The gardens hosted more than
80 groen Sebenza pioneers, with several pioneers taking up permanent posts within SANBI’s gardens during the year.
Work continued with the development of a new Career Ladder for Horticulturists, including a review of all gardens organograms
and critical skills and posts required. The new Career Ladder is expected to be implemented in the new financial year. The 28th
Annual garden Curators Week was held in the KwaZulu-Natal National Botanical garden in November 2014. various garden
staff participated in work-related training courses, workshops and structured horticultural-related staff exchange programmes
between various gardens through the year.
For the first time, a new position of Director: Conservation gardens and Tourism within SANBI was created, with Thompson
Mutshinyalo, an internal candidate, taking up the position in December 2014. A new ‘State of the gardens’ quarterly reporting
system was developed and implemented during the financial year.
Four SANBI staff (all Kirstenbosch-based) were appointed as Environmental Management Inspectors (EMIs). The appointment of
EMIs within SANBI is expected to expand in the coming few years.
A fire occurred in the Dawidskraal wetland area below Clarence Drive, which includes a natural section of the Harold Porter NBg,
in February/March 2015. The area was burnt in 1999, and despite an extensive area of natural fynbos being burnt, there was no
loss of property or life largely due to the rapid response from fire-fighting units deployed in the area.
programme Highlights
25 July 2014The new Kwelera National Botanical garden was formally declared by the Minister of the National Department of Environmental Affairs on 25 July 2014. This is the tenth National Botanical garden to be established in South Africa, and the first to be established in the Eastern Cape Province.
garden of the year awardKirstenbosch National Botanical garden received the 2015 International garden of the Year Award from the International garden Tourism Network. Kirstenbosch was also ranked number one of 186 things to do in Cape Town Central on www.tripadvisor.co.uk
boomslangThe Tree Canopy Walkway or ‘Boomslang’ that opened to the public in Kirstenbosch for the first time in May 2014, was voted the Most Beautiful Object in South Africa (MBOISA) at the Design Indaba in 2015.
1 000 000For the first time in its 102-year history, Kirstenbosch received more than a million visitors during the financial year, with every month throughout the year being a best ever month in terms of visitor numbers. For the first time in its history, Kirstenbosch received more than 100 000 visitors in a single month, during December 2014 (116 000).
1 813 019The combined number of visitors to all national botanical gardens for the year totalled 1 813 019 which was 26.7% higher than the previous financial year (1 430 545).
concert season - 5 international artistsThe Kirstenbosch concert season, which included five international artists, was attended by 143 574 visitors and generated R14, 341,455 in ticket sales and venue fees. The 2014/15 Kirstenbosch Summer Sunset Concert season was the best attended season in the concert programme’s 22-year history.
silver-gilt MedalSANBI received its fifth Silver-gilt Medal at the 2014 Chelsea Flower Show, UK, with sponsorship received from the SA gold Coin Exchange.
HorticulturistsA Career Ladder for Horticulturists was developed and approved, aimed at recognising, attracting and retaining horticulturists to fulfil SANBI’s mandate.
water wiseA Rand Water-sponsored Water-Wise Demonstration garden was completed and opened to the public in the Pretoria National Botanical garden.
29ANNUAL REPORT20142015
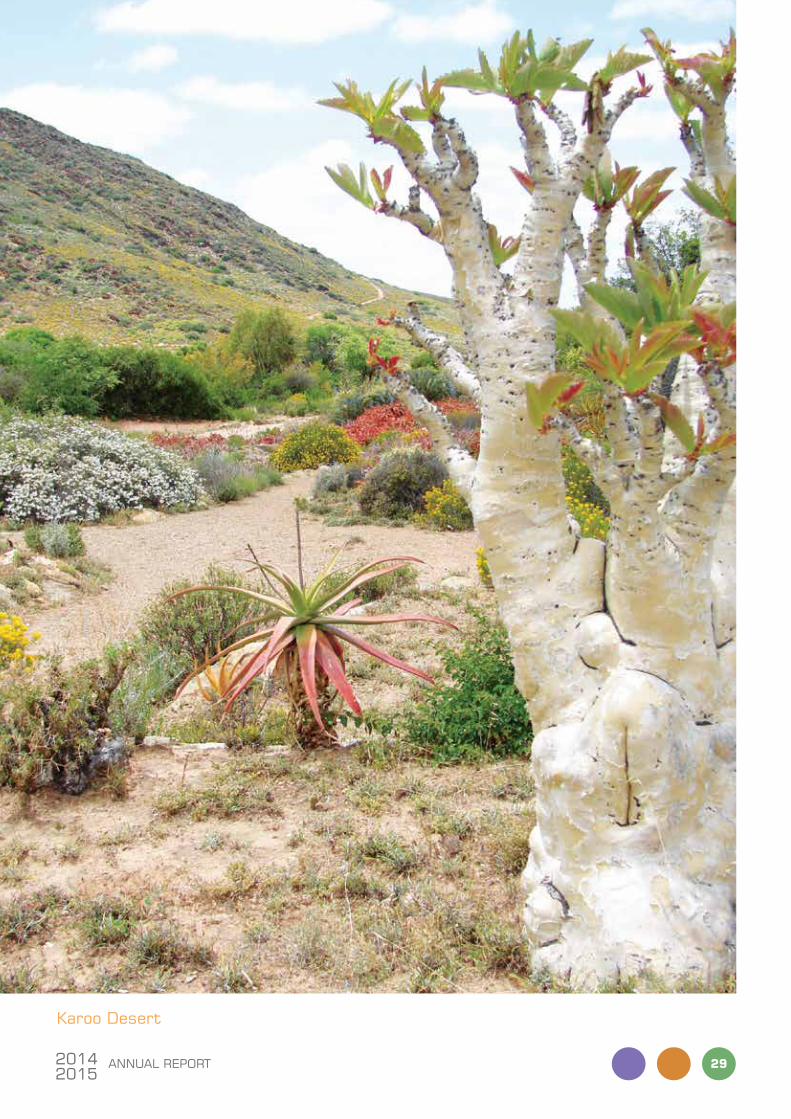
Karoo desert
ANNUAL REPORT30 20142015
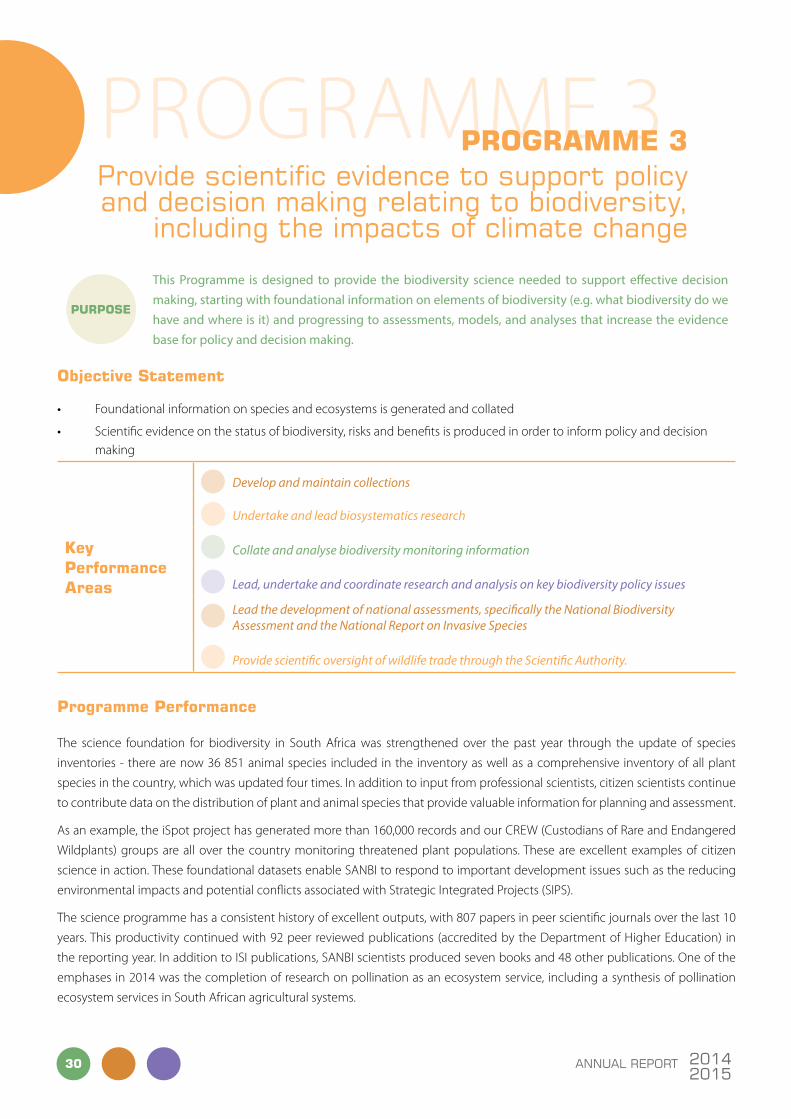
purpose
This Programme is designed to provide the biodiversity science needed to support effective decision making, starting with foundational information on elements of biodiversity (e.g. what biodiversity do we have and where is it) and progressing to assessments, models, and analyses that increase the evidence base for policy and decision making.
objective statement
• Foundational information on species and ecosystems is generated and collated
• Scientific evidence on the status of biodiversity, risks and benefits is produced in order to inform policy and decision making
Key performance areas
Develop and maintain collections
Undertake and lead biosystematics research
Collate and analyse biodiversity monitoring information
Lead, undertake and coordinate research and analysis on key biodiversity policy issues
Lead the development of national assessments, specifically the National Biodiversity Assessment and the National Report on Invasive Species
Provide scientific oversight of wildlife trade through the Scientific Authority.
programme performance
The science foundation for biodiversity in South Africa was strengthened over the past year through the update of species
inventories - there are now 36 851 animal species included in the inventory as well as a comprehensive inventory of all plant
species in the country, which was updated four times. In addition to input from professional scientists, citizen scientists continue
to contribute data on the distribution of plant and animal species that provide valuable information for planning and assessment.
As an example, the iSpot project has generated more than 160,000 records and our CREW (Custodians of Rare and Endangered
Wildplants) groups are all over the country monitoring threatened plant populations. These are excellent examples of citizen
science in action. These foundational datasets enable SANBI to respond to important development issues such as the reducing
environmental impacts and potential conflicts associated with Strategic Integrated Projects (SIPS).
The science programme has a consistent history of excellent outputs, with 807 papers in peer scientific journals over the last 10
years. This productivity continued with 92 peer reviewed publications (accredited by the Department of Higher Education) in
the reporting year. In addition to ISI publications, SANBI scientists produced seven books and 48 other publications. One of the
emphases in 2014 was the completion of research on pollination as an ecosystem service, including a synthesis of pollination
ecosystem services in South African agricultural systems.
PROgRAMME 3 prograMMe 3Provide scientific evidence to support policy and decision making relating to biodiversity,
including the impacts of climate change

31ANNUAL REPORT20142015
One of SANBI’s main science outputs is the National Biodiversity
Assessment (NBA), last published in 2012, and the process to develop the
next NBA was started in 2014 and strengthened by the appointment of a
science leader in early 2015. The intention with the next NBA, scheduled
for 2018, is to strengthen the scientific evidence for assessments but
also to link the production of the NBA to the development of young
scientists in South and Southern Africa and to enhance human capital
development in assessment of biodiversity. This is also a key objective of
the International Platform for Biodiversity and Ecosystem Services (IPBES),
which several of SANBI scientists are involved in.
SANBI science contributed to several important government initiatives
such as the Operation Phakisa Ocean Economy initiative, launched in 2014
by President Zuma (see highlights). A further example of the contribution
of this programme was the support provided for the completion and
implementation of the Alien and Invasive Species regulations, especially
the final lists of invasive species. SANBI has been working with the DST/
NRF Centre of Excellence for Invasions Biology to develop the scientific
basis for risk assessment for invasive species and collaborated with several
other science partners to assess the risks associated with particular species
(see highlights). In addition, SANBI led engagements with stakeholders to
deal with the controversial issue of mapping trout waters as part of an
important component of the regulations that aims to support industries
that are based on the use of alien species while mitigating negative
impacts where these species are invasive.
The National Biodiversity Economy Strategy (NBES) recognises the
importance of a sustainable wildlife economy and SANBI provides some
of the critical evidence and analysis to achieve this objective. SANBI
assisted the Scientific Authority with the completion of non-detriment
findings (NDF’s) for priority species in trade. These assessments resulted
in negative findings for trade in species such as cheetah and sungazer
lizards. They also provided evidence to support recommendations to
reform hunting norms and standards for leopard and the offtake limits
for elephant in specific areas in order to stay within sustainable limits.
In addition, SANBI led the development of Biodiversity Management
Plans for 15 Critically Endangered and Endangered cycads, which had
previously been identified as species where trade was threatening their
survival in the wild.
As part of ongoing alignment with government priorities, the science
programme is working on a suite of projects that address key issues
relating to South Africa’s development agenda, such as understanding
the role of ecological infrastructure, supporting a sustainable wildlife
economy, reducing the impacts of invasive species, adaptation to climate
change, and promoting sustainable development.
Science in action
Research and analysis
Science education
Science publications
ANNUAL REPORT32 20142015
programme Highlights
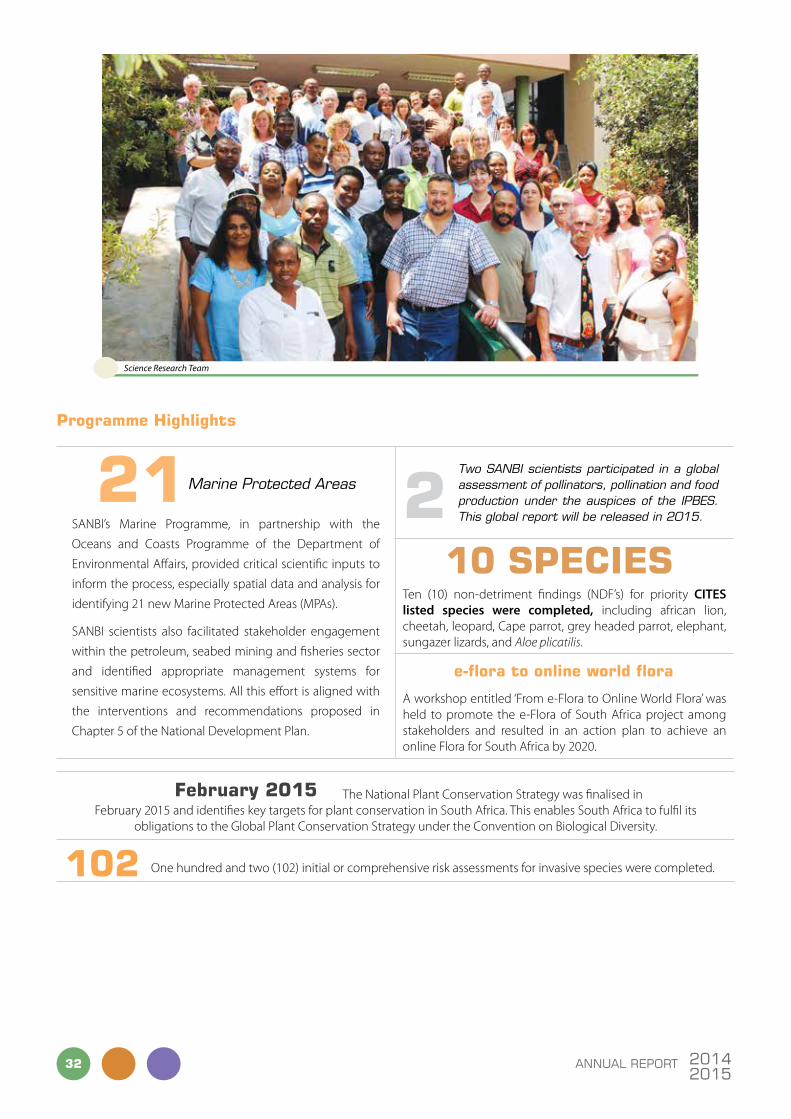
21 Marine Protected Areas
SANBI’s Marine Programme, in partnership with the
Oceans and Coasts Programme of the Department of
Environmental Affairs, provided critical scientific inputs to
inform the process, especially spatial data and analysis for
identifying 21 new Marine Protected Areas (MPAs).
SANBI scientists also facilitated stakeholder engagement
within the petroleum, seabed mining and fisheries sector
and identified appropriate management systems for
sensitive marine ecosystems. All this effort is aligned with
the interventions and recommendations proposed in
Chapter 5 of the National Development Plan.
2Two SANBI scientists participated in a global assessment of pollinators, pollination and food production under the auspices of the IPBES. This global report will be released in 2015.
10 speciesTen (10) non-detriment findings (NDF’s) for priority CITES listed species were completed, including african lion, cheetah, leopard, Cape parrot, grey headed parrot, elephant, sungazer lizards, and Aloe plicatilis.
e-flora to online world flora
A workshop entitled ‘From e-Flora to Online World Flora’ was held to promote the e-Flora of South Africa project among stakeholders and resulted in an action plan to achieve an online Flora for South Africa by 2020.
February 2015 The National Plant Conservation Strategy was finalised in February 2015 and identifies key targets for plant conservation in South Africa. This enables South Africa to fulfil its
obligations to the global Plant Conservation Strategy under the Convention on Biological Diversity.
102 One hundred and two (102) initial or comprehensive risk assessments for invasive species were completed.
Science Research Team

33ANNUAL REPORT20142015
ndebele huts

ANNUAL REPORT34 20142015
purpose
This Programme coordinates and provides access to biodiversity information and scientific knowledge through ensuring all available scientific information is made freely and openly available to a wide audience in order to support research and innovation, and to inform planning and decision making, policy development and advice and biodiversity monitoring.
objective statement
SANBI has become the authoritative source for data, knowledge and information on South Africa’s biodiversity through promoting
shared value nationally and internationally.
Key performance area Access to provide biodiversity data, information and knowledge
programme performance
During the year under review, SANBI made significant strides in ensuring that the biodiversity information is not only available
to the scientific community, but also to all tiers of government, the private sector, NgOs and the broader public. This has been
done through the Biodiversity Advisor which enables easy access from a single access point to all biodiversity information. The
approach to free and open access to information has resulted in a cultural change in government agencies and departments
as well as within the private sector where information is now freely exchanged. The benefits of this open access policy is that
decisions are transparent, transactional costs are lowered and the timeframes for decisions are much shorter, as in the case of land-
use planning decisions. Above all, the open and free access results in a peer review of available information that in turns ensures
that more accurate, defensible and environmentally sustainable decisions are made.
SANBI’s success in managing biodiversity information is reflected in the role that we play on the African continent. SANBI has been
instrumental in coordinating all African membership countries of the global Biodiversity Information Facility (gBIF) to ensure that
a strategic approach is taken on how to utilise scarce resources and to have a coordinated voice. SANBI also holds the Africa Chair
for the Biodiversity Heritage Library (BHL) which aims to ensure all literature is accessible via the internet. Information generated
by scientific research within SANBI is published through various vehicles including online and in hardcopy.
A number of achievements were made over the reporting period in order to support the free and open access of these records
and attract new, unique users to the Biodiversity Advisor website. These include the following:
• SANBI continued to customise the Botanical Research and Herbarium Management System (BRAHMS) according to user needs. BRAHMS was launched during the 2013-14 financial year to replace the previous system (PRECIS) that had been in place for three decades.
PROgRAMME 4 prograMMe 4co-ordinate and provide access
to biodiversity information and knowledge

35ANNUAL REPORT20142015
• SANBI finalised the Species Identification Tool developed in collaboration with TRAFFIC, the wildlife trade monitoring network, which resulted in SANBI’s first two mobile applications being developed.
• SANBI provided strategic input into the development of a reviewed funding model for the global Biodiversity Information Facility (gBIF).
• SANBI participated in the gBIF-Africa regional meeting in Benin and hosted a JRS Biodiversity Foundation meeting as part of the Mobilising Policy Relevant Data for Africa project.
• SANBI secured a $150 000 grant for BHL Africa from the JRS Biodiversity Foundation to assist in making biodiversity information more accessible in Sub-Saharan Africa. This project will grow the BHL Africa through the collaboration, assessment, and digitisation of African collections and by creating a sustainable network of institutions and countries to increase access to biodiversity materials held in Sub-Saharan African institutions.
• SANBI participated in a Data and Information Management Workshop to underpin natural capital assessments and ecosystem resilience hosted by UNEP-WCMC in May 2014.
• SANBI attended CBD COP 12 and participated in a number of meetings to strengthen networks and relationships with UNEP-WCMC and gBIF, through partnerships SANBI initiated a conference entitled Africa Rising: Mobilising Biodiversity Data for Sustainable Development to be hosted in 2015. The conference supports the gBIF-Africa work and the project on Mobilising Africa’s Policy Relevant Data. SANBI also lobbied support from the Africa wide CBD focal points at COP 12 for the above mentioned conference.
• SANBI, together with the South African Biodiversity Information Facility (SABIF) Node Manager and a DST representative, attended the gBIF governing Board Meeting, in New Delhi, India from the 15-18 September 2015. The SANBI CEO gave a presentation entitled Drivers for Participating in gBIF.
• SANBI was invited to present at the Taxonomic Data Working group Conference in Sweden on Biodiversity Information Management at SANBI: Mobilising Biodiversity Information in Support of Science and Policy.
• SANBI was invited to attend the UNA Africa Capacity Building workshop in Lilongwe, Malawi, with the intention of identifying needs in terms of biodiversity information tools and resources. This work aligns with the gBIF-Africa strategy to grow the network of nodes and Malawi has signed up to become a gBIF participant.
Strategic Integrated Projects Group

ANNUAL REPORT36 20142015
• SABIF was invited to support the evaluation of the gBIF 2014 Call for the Capacity Enhancement Support Programme. A number of proposals were reviewed with a funding allocation of €40 000. Five projects were approved for funding. These projects will engage 31 partners in 29 countries and two international organisations from across five of gBIF’s six regions in key areas of interest and investigation, including data digitisation, data quality, data standards, technology development and invasive alien species.
• SANBI finalised a MoU with the Animal Demographic Unit at University of Cape Town to provide data management support services and mentoring to a groen Sebenza pioneer.
SANBI published the following:
1. Strelitzia No. 32, Systematics and Biology of the Cape genus Sparaxis
(Iridaceae)
2. Strelitzia No. 33, vegetation Field Atlas of Continental South Africa,
Lesotho and Swaziland
3. Strelitzia No. 34, The Apocynaceae of Namibia
4. Strelitzia No. 35, Systematics and biology of Lapeirousia, Codonorhiza,
Psilosiphon and Schizorhiza in southern Africa.
5. SANBI Biodiversity Series No. 24, Wasps and bees in southern Africa.
6. Suricata 1, Atlas and Red List of the Reptiles of South
Africa, Lesotho and Swaziland.
This was the first publication in the new monograph
series focussing on SANBI zoological information
distribution.
performance Highlights
165 496during the period under review, 165 496 records were
accessed through the sanbi biodiversity advisor website
1 660A total of 1 660 unique users registered on the SANBI Biodiversity
website during the period under review
Strelitzia
Marine life
The African Bullfrog (Pyxicephalus edulis)

37ANNUAL REPORT20142015
Cape Partners Forum October 2014
NIE Launch with Minister

ANNUAL REPORT38 20142015
PROgRAMME 5 prograMMe 5Provide biodiversity and climate change
adaptation policy tools and advice in support of south africa’s development
purpose
The primary focus of this Programme is to facilitate the translation of South Africa’s biodiversity science into policy and decision-making tools and advice. This programme brings together knowledge and expertise from across the different programmes and divisions in SANBI in supporting the development of biodiversity policy and management advice. We do this in the context of South Africa’s urgent development imperatives, using biodiversity science to understand how the management and sustainable use of healthy intact ecosystems can maintain, enhance and deliver services to society, and can help to secure future development by reducing biodiversity loss.
objective statement
• Tools to reduce loss, protect, restore and unlock benefits from biodiversity assets and ecological infrastructure developed and their uptake supported
• Projects to restore high value ecosystems implemented in support of the national development agenda
• Policy advice provided to DEA and other organs of state to ensure that best available biodiversity science informs national and international policy processes
• vulnerable communities have increased resilience to climate change as a result of direct access climate change adaptation investments
Key performance areas
Ecosystem management tools developed and applied
Projects for ecosystem restoration developed and implemented
Scientific advice to support national and international policy processes provided
Direct access climate finance modality proved to be effective in building resilience in communities vulnerable to adverse climate impacts
programme performance
During the year under review, Programme 5 demonstrated the value of biodiversity assets and ecological infrastructure for
unlocking development opportunities and delivering social-economic benefits; provided science-based tools and policy
advice to promote the integration of biodiversity opportunities and constraints into other sectors, especially those that impact
on biodiversity; provided support to DEA and provincial conservation authorities in their development and implementation
of biodiversity-related policy and legislation to ensure that the best available science informs policy and its implementation;
supported municipalities in integrating biodiversity assets and ecological infrastructure into their planning and decision-making;
hosted the Scientific Authority which assists in regulating the sustainable use of threatened or protected species or species
listed in CITES appendices, and thus plays a crucial role in ensuring continued benefits from the wildlife economy; influenced
international agendas for policy, research and monitoring, for example by participating in CITES, UNEP/CDB/SBSTTA and IUCN; and

39ANNUAL REPORT20142015
hosted the National Implementing Entity (NIE) to the global Adaptation Fund which
is a vehicle for providing direct access climate finance to communities vulnerable to
adverse climate impacts.
Through the work of this programme, a number of new initiatives, opportunities and
programmes of work were identified and initiated during the year which will allow
SANBI to continue to provide biodiversity policy advice and access to biodiversity
information, and to support climate change adaptation in order to strengthen the
management of South Africa’s biodiversity assets and ecological infrastructure.
programme Highlights
land user incentiveUsing co-funding secured through the Critical Ecosystems Partnership Fund (CEPF),
SANBI assisted the Department of Environmental Affairs (DEA) Natural Resource Management (NRM) to develop a framework for evaluating proposals received under the Land User Incentive programme. This framework allows NRM to assess whether the activities being proposed fall within areas that are high priority in terms of a range of criteria, including biodiversity, ecological infrastructure/ecosystem services, poverty and resource management. This approach will allow NRM to allocate resources to projects with the highest potential impact on the problem being addressed, thereby contributing to optimising social, ecological and economic outcomes.
WETLAND INvENTORYMANUALSANBI, through a project funded by the Water Research Commission, developed a tool which provides a standardised set of guidance to those interested in mapping wetlands at a systematic, landscape scale or to those involved in improving the National Wetland Map. The use of these methods in other mapping projects should result in the generation of data that is compatible with the National Wetland Inventory, making it easier to incorporate the resulting data into the National Wetland Map maintained by SANBI.
4% oF geF proJectsSANBI hosted the Grasslands Programme Close-Out Celebration on the 29 May 2014 at the Pretoria National Botanical gardens. The celebration looked back on the milestones and successes achieved by the grasslands Programme over the past 6 years and paid special tribute to its partners, without whom it could not have claimed the achievements. Funded by the global Environmental Facility (gEF) through the United Nations Development Programme (UNDP) and coordinated by SANBI, the grasslands Programme achieved a “Highly Satisfactory” rating in its terminal evaluation. This rating has been achieved by less than 4% of GEF projects from around the globe.
115 Through the Working for Wetlands Programme, 115 wetlands were under rehabilitation during the 2014-15 financial year.
sanbi published the following knowledge resources through programme 5:
Biodiversity Mainstreaming Toolbox for Land Use Planning and Development in gauteng, produced in partnership with ICLEI-Africa and the gauteng Department of Agriculture and Rural Development (gDARD), which provides a valuable resource for mainstreaming biodiversity into local government.
Five case studies on Making the Case for Biodiversity
Buffelspoort dam amongst hills
Mpekweni Beach Resort River Lagoon

ANNUAL REPORT40 20142015
sanbi hosted the 11th biodiversity planning Forum from 13-16 May 2014 in the Eastern Cape where themes such as mapping ecological infrastructure to inform policy and decision-making, the new regulations for invasive species, and the strategic environmental assessments for the Strategic Integrated Projects (SIPs) were discussed. The Forum was attended by 200 participants from national government, provincial environmental departments and conservation authorities, municipalities, NgOs, universities and research institutes. More than 50 interns, many of them groen Sebenza pioneers, attended and participated in a discussion led by the SANBI CEO, on their internship experiences.
awards
SANBI hosted the Fynbos Conservation Awards
on 21 October 2014 recognising individuals for their
contribution to conservation in the Cape Floristic Region. Two books,
one on fynbos ecology and evolution and the second on fynbos ecology and management were launched at the event by Chairperson of the Board subcommittee on Research,
Development and Innovation.
This was followed by the CAPE Partners Conference
on 22 October 2014 where the focus was on the
transdisciplinary approach to conservation of the fynbos.
BIODIvERSITY
170SANBI hosted the Land Reform Biodiversity
Stewardship Initiative Learning Exchange in partnership with the Department of Environmental Affairs (DEA), the Department of Rural Development and Land Reform (DRDLR) and Ezemvelo KwaZulu-Natal Wildlife from the 10–12 February 2015.
The event attracted nearly 170 participants from across the country to share lessons and experiences on land reform and biodiversity stewardship projects in order to build capacity to catalyse a biodiversity based economy in land reform.
120 SANBI in partnership with Department of
Agriculture, Forestry and Fisheries (DAFF) held a series of training workshops targeted at building the capacity of resource auditors. The training was aimed at introducing resource auditors in DAFF to the regulatory context governing applications, thus building capacity on integrating biodiversity considerations into agricultural planning and decision-making.
Over 120 government officials attended the training held in five different regions, namely, Nelspruit, Pretoria, Bloemfontein, East London and Elsenburg.
NIE Launch
SANBI provided inputs to the review of the National Environmental Management Act: Biodiversity Act (Act 10 of 2004) and the National Strategy for Sustainable
Development 1 Monitoring and Evaluation Report, both being led by DEA.
BIODIvERSITYMAINSTREAMINGTOOLBOX SANBI held capacity building sessions with municipalities across gauteng to rollout the Biodiversity Mainstreaming Toolbox for Land Use Planning and Development in gauteng and familiarise officials with how to engage and use the product. More than 135 officials from the City of Tshwane, Ekurhuleni Metro, City of Johannesburg, Emfuleni Local Municipality, Sedibeng District Municipality, West Rand District Municipality, Randfontein Local Municipality, Mogale City Local Municipality and the gauteng Department of Agriculture and Rural Development attended these sessions.

41ANNUAL REPORT20142015
Mining worKsHop
SANBI, in partnership with DEA and the South African Mining and Biodiversity Forum, convened a mining and biodiversity training workshop on 30 July 2014 to raise awareness amongst government practitioners about biodiversity importance in mining developments, and to roll out the Mining and Biodiversity guideline: Mainstreaming Biodiversity into the Mining Sector and provide direction on how to avoid, minimise and remedy mining impacts as part of an environmental impact assessment. pr
ovin
ces electricity grid In terms of
the ongoing Strategic Environmental Assessment (SEA) for Strategic Integrated Project (SIP) 10 on the Electricity grid Infrastructure, SANBI and CSIR completed the provincial consultation process with all nine provinces, meeting with all three levels of government with an interest in electricity transfer and use. SANBI is leading the biodiversity component and all provinces were consulted on the concept and the methodology for the SEA.
LRBSI fieldtrip group
Spatial Planning and Land Use Management Act SANBI provided comments on the draft Regulations on the Spatial Planning and Land Use Management Act (Ac 16 of 2003) (SPLUMA) developed by the Department of Rural Development and Land Reform (DRDLR) which seeks to put in place the regulatory framework for the implementation of SPLUMA.
climate change projects
The Minister of Environmental Affairs, Honourable Edna Molewa, officially launched South Africa’s two NIE Climate Change Adaptation projects at a Ministerial Breakfast function at SANBI in Pretoria on 20 February 2015.
inte
rnat
iona
l sanbi has responded to the following international policy support requests:
Participated in the Convention on International Trade in Endangered Species of Wild Fauna and Flora (CITES) 27th Meeting of the Animal Committee and 21st Meeting of the Plant Committee held in Mexico
Participated in the UNEP/CDB/SBSTTA 18 held in Montreal from 23–26 June 2014
Prepared IUCN Report on Red List Index Summary for Millennium Development Goals (Cycadopsida)
Contracted by IUCN as an international expert to participate in the IUCN Biodiversity Offsets Policy Working Group to deliver an IUCN Council Resolution and Policy on biodiversity offsets for consideration at the 2016 IUCN World Conservation Congress.
SANBI presented and participated in panel discussion at the Biodiversity Offsets Conference in London to share the South African experience of policy development and implementation in growing field of biodiversity offsets. Over 300 delegates participated in this international conference.
NATIONAL IMPLEMENTINg ENTITY
SANBI is South Africa’s National Implementing Entity (NIE) of the global Adaptation Fund. The Adaptation Fund Board approved and submitted
South African projects at the 24th Board Meeting in October 2014. The projects on “Building resilience in the greater uMngeni catchment, South Africa” and “Taking adaptation to the ground: a small grants facility for enabling local level responses to climate change in South Africa” have a total value of USD 10 million.
These projects aim to create awareness, and to strengthen and assist rural communities to cope with extreme weather events occurring more often and severely due to climate change. The establishment of the NIE and the project development process has brought together a collaboration of various government, academic and civil society stakeholders.

ANNUAL REPORT42 20142015
initiation of new opportunities/programmes of work
• SANBI received approval from the CEO of the global Environmental Facility (gEF) for the project on Mainstreaming Biodiversity into Land Use Regulation and Management at the Municipal Scale. This project is funded by gEF to the value of US$8.2 million over the next five years. The project seeks to improve biodiversity management by (a) strengthening cooperation, coordination and capacity of municipal and other regulatory authorities that regulate land use decisions to incorporate criteria to avoid/prevent, minimise and/or offset impacts on biodiversity, and improve compliance monitoring and enforcement; and (b) introducing mechanisms in collaboration with private and communal land owners to better protect critical biodiversity areas and manage land, while demonstrating the potential of biodiversity to create jobs and contribute to economic growth. The project will work in four district municipalities in global biodiversity hotspots and national biodiversity priority areas, with very high rates of habitat degradation and conversion, high levels of poverty, and other pressing needs for action including Amathole, uMgungundlovu, Ehlanzeni and the Cape Winelands District Municipalities.
• The uMngeni Ecological Infrastructure Partnership (UEIP) established its Coordination Committee comprising of representatives from all 19 MoU signatories. The Committee will oversee the co-ordination of the long-term implementation of the UEIP Strategy; a Research Steering Committee was established for the uMngeni green Fund projects to oversee and provide a scientific advisory role towards implementation of the UEIP strategy.
• SANBI signed a three-year agreement with DEA, to the value of approximately R6.9 million, for specific scientific-policy support to be provided by SANBI to the Natural Resource Management programmes.
• SANBI was contracted by the OECD to write a paper on Biodiversity Mainstreaming and to participate in a joint sitting of the OECD Working Parties on Biodiversity, Water and Ecosystems, ENvIRONET, the Development Assistance Committee and Environment Policy Committee. This is a significant cross-cutting initiative for the OECD and SANBI has been requested to guide the initiative.
• SANBI finalised a review report on public-private cooperation for biodiversity and ecosystem management in South Africa which includes five case studies highlighting this cooperation.
• South Africa was selected as one of seven pilot countries for work on ecosystem accounting and a SANBI representative was nominated to be part of the technical expert committee to guide this work internationally. This is a global project led by the UN Statistics Division and funded by the government of Norway. Other key South African partners include the CSIR, DWS and DEA. Ecosystem accounting refers to physical rather than monetary accounting of ecosystem assets and services and there is great interest in South Africa’s approach of taking ecosystem accounting to the national scale.
• SANBI convened the first national workshop on Advancing Ecosystem Accounting in South Africa from 13-14 November 2014, in partnership with StatsSA.
Biodiversity Planning Forum May 2014

43ANNUAL REPORT20142015
• SANBI was invited to present South Africa’s work on ecosystem accounting at the 20th meeting of the London group on Environmental Accounting in Delhi, India. This meeting is a global community of practice on environmental accounting, established in 1993. SANBI represented South Africa at the UN Statistics Divisions Advancing Experimental Ecosystem Accounting pilot project meeting, as one of the seven pilot counties participating, held in Delhi, India.
• SANBI co-hosted the signing ceremony for Mpumalanga’s first land reform biodiversity agreements in biodiversity stewardship by the Bambanani and Ukuthanda ukukhanya Community Property Associations near Wakkerstroom.
Impact of climate change
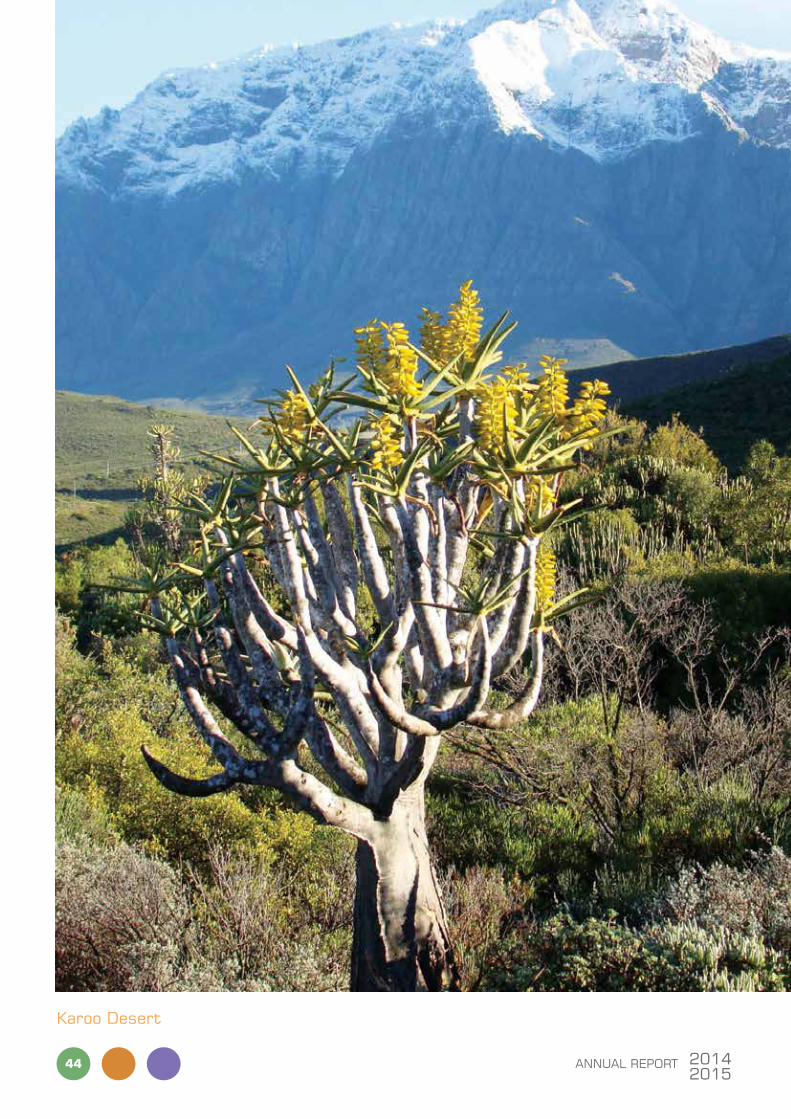
ANNUAL REPORT44 20142015
Karoo desert
PROgRAMME 6

45ANNUAL REPORT20142015
purposeThis programme is designed to ensure that SANBI is effective, efficient and accountable, and responds successfully to changing conditions.
objective statement
• Human Capital Development and job creation have contributed to the achievement of a socially equitable and suitably skilled biodiversity workforce.
• National botanical gardens used for biodiversity education, training, awareness and recreation to achieve sustainable management practices amongst diverse users.
• Civil society is engaged through various initiatives in order to contribute to biodiversity science and monitoring
Key performance areas
A socially equitable and suitably skilled workforce is developed
All National Botanical Gardens are promoted and used as platforms for biodiversity awareness, education and recreation
Civil society is engaged to contribute to science and monitoring
programme performance
The biodiversity sector’s Human Capital Development Strategy led by SANBI is mainly delivered through Programme 6. The
strategy was dubbed greenMatter The groen Sebenza Programme is one of the tools through which the sector’s strategy is
delivered.
groen Sebenza was launched in June 2013 and has to date recruited 946 unemployed youth (graduates and matriculants),
mainly from rural areas who were placed in 44 host institutions nationally across the sector. Through the ‘incubator’ model, the
programme sought to bridge the gap between the study and work experience of the 946 pioneers in order to make them more
employable in the sector and beyond. The invaluable workplace experience and skills development of the pioneers was largely
due to the support of assigned mentors at the 44 host institutions across the country. At host organisations, pioneers are also
further supported through technical and some generic training related to their occupations that are provided by project funds
and also drawing on their own organisational resources. SANBI provided pioneers with life skills and some generic training which
included courses such as Computer Literacy, Project Management, Communication and Networking, and Career Development/
guidance.
PROgRAMME 6 prograMMe 6Human capital development (Hcd): drive
Human capital development, education and awareness in response to sanbi’s mandate

ANNUAL REPORT46 20142015
Over and above the 946 job opportunities created through groen Sebenza, 185 permanent jobs were created to date with more
expected as the programme draws to a close. The programme has trained 101 mentors with a database created for the sector
to access their areas of expertise and draw on them for future skills development programmes. The programme has contributed
positively to addressing the sector’s priority skills list by including in the 946 recruited, the training of atmospheric modellers,
resource economists, ecologists, rangers, marine biologists, taxonomists, law admin officers, engineers, waste management
specialists, restoration specialists, etc. Through the monitoring and evaluation (M&E) processes conducted, it is evident that the
sector’ capacity to deliver on its mandate was greatly enhanced, including even in small district municipalities such as Nketoane,
Setsoso and Dihlabengd in Free State province.
The programme has also played an important part in the transformation of the sector from a gender, age and race perspective.
One hundred percent of the 946 pioneers fall within the youth category, therefore, ensuring the supply of skills into the sector
pushing back the ‘aging sector’ risk identified earlier in different research findings. The recruitment of mainly graduates (%) with
53% of the 946 being females will also change the face of the sector’s gender in the long run, addressing the research finding
that the sector is predominantly male. The demographics of the sector, like age and gender profile, will in the long run also be
positively impacted by the 90% African, 9% Coloureds and 0.4% Indian pioneers recruited in the programme.
The programme has enabled the sector to collaborate through the rotation policy where pioneers were ‘exchanged’ between
host organisations to advance their skills and professional development. A joint training session by organisation involved in para-
ecology organised training for all matriculants thus setting a positive trend for sector collaboration on skills development matters
beyond the groen Sebenza project life.
groen Sebenza has enjoyed media coverage, featured in publications such as Debate Journal, CSI National Development Plan
magazines.
Through the Biodiversity Education Programme conducted at biodiversity education centres in the National Botanical gardens,
52 897 beneficiaries were reached, exceeding the set target for 2014/15 financial year by 25%. This stretched target was achieved
through capacity injection provided by the groen Sebenza Programme. Of the 52 486 beneficiaries, 11 538 learners were from 145
‘new’ schools with the learners attending the garden based programmes for the first time.
A total of 6 930 beneficiaries were reached through awareness-raising events such as the celebration of environmental days like
Biodiversity, Environmental, Arbor, Climate Change, Marine, Weedbuster, Wetlands and Water Weeks and celebration of Mandela
Day. While some of these programmes were facilitated within the
National Botanical gardens, most were celebrated within communities
so as to increase SANBI’s visibility in communities.
A total of 659 beneficiaries from diverse backgrounds attended fun-
filled holiday programmes in the National Botanical gardens and 3 337
beneficiaries participated in both the primary and high school career
programmes offered through the biodiversity education centres.

47ANNUAL REPORT20142015
greenMatter’s contribution
greenMatter, a programme of SANBI, is the association of partners that implements the National Biodiversity Human Capital
Development Strategy (BHCDS). The programme was launched five years ago and has made significant strides in mobilising
action for higher level skills development for biodiversity.
The greenMatter Fellowship, established in 2012, has grown in its support of outstanding biodiversity champions and leaders
in South Africa. To date, the programme has supported over 60 Masters, PhD, Professional Development and Senior Fellowship.
programme Highlights
felloWsHiPNokuthula Dubazane, Linda Luvuno and Hayley Clements, greenMatter Fellows 2014, represented South Africa at the Resilience Conference in France.
nrf-bHP billiton awardsFellowship alumnus, Albert Modi was nominated as a finalist in the prestigious NRF-BHP Billiton Awards for his research and community development innovations related to food security. He was also appointed as the inaugural Chairperson of the South African Agriculture and Life Sciences Deans Association (SAALSDA)
Senior Fellow Yolan Friedmann (CEO, EWT) and Albert Modi (Dean, UKZN) were profiled in the Sunday Times, Business Times, Cape Times and The Witness.
Fellow Nokuthula Dubazane was featured in a SABC Education programme targeting unemployed graduates (iSpani). This was flighted in August.
greenmatter greenMatter Fellows Hayley Clements, John Wilson and Nandi gumede designed and executed a Careers Day programme for 20 learners and teachers from Beacon Hill
Secondary School during the December launch of the Cape Whale Coast Hope Spots with CapeNature.
primatologist greenMatter started supporting South Africa’s first black primatologist, Ntuthuzelo Makhasi
The Fellowship has been phenomenal. The professionalism and accessibility
of the GreenMatter team, the very high quality of the workshops, and the general equipping and empowering for biodiversity ambassadorial work in South Africa has been exceptional. This is the best initiative South Africa could ask for. I found the skills workshops very helpful for academic interactions, conference networking and general public relations with people in a broader context - 2014 Fellow, Ralph Clark
The greenMatter supported Fundisa for Change (teach for change) initiative,
comprising over 21 partners, has trained 206 teachers, 41 subject advisors and 160
Fundisa partners to date. Three generic modules and 32 subject specific units were
developed since the network was established. As a significant partner in the Fundisa
for Change Programme, SANBI BEE co-facilitated five accredited courses for 105 Life
Sciences and Social Sciences teachers in four provinces (Limpopo, Mpumalanga,
gauteng and the Western Cape). In addition, 17 workshops on biodiversity, climate
change, sustainable development and biodiversity careers were facilitated to 359
beneficiaries.
The National Conference was sponsored by DEA in February 2014. The community of
practice will be working with the South African Council of Educators (SACE) during
2015, towards the endorsement of the programme and its materials.
The greenMatter Bridging into Work project, led by WWF-SA on behalf of the
sector, dedicated a significant amount of time over the past year towards developing
a toolkit that included a mentoring framework and training approach to assist
organisations to increase the skills level and confidence of existing and potential
mentors, thereby, improving the development of young professionals in the workplace.
The pilot workshop proved to be a successful initiative.

ANNUAL REPORT48 20142015
In addition to the various higher education initiatives, the NSTF- GreenMatter award has been established as part of the prestigious
National Science and Technology Foundation’s annual initiative.
This award category will address the gap towards acknowledging
innovations in environmental, natural and social sciences and related human capital development.
Advocacy and communication campaigns, engaging youth in
key areas of biodiversity management were also undertaken
during 2014. PengWin Trax, an innovative concept utilising online
platforms, social media and game mechanics to engage youth in
a fun initiative, provided youth with an educational opportunity
to learn more about our unique southern oceans, careers and
important aspects for work readiness. The competition was run live
over five days with 25 high schools and universities such as UCT,
WSU, Fort Hare, UKZN, UWC and CPUT participating, alongside the
groen Sebenza national team.
We are very proud to announce that groen Sebenza pioneer -
Phindile Langazane was the top scoring participant overall. She won
a trip to Dassen Island, off the Western Cape coast compliments
of CapeNature and greenMatter. In addition, she
earned herself a R1000 gift voucher from Woolworths,
compliments of the Lewis Foundation, and a set of books
from Penguin Books.
…it opened up a whole lot of
different avenues of mentoring…..by the knowledge gained I am more confident in the mentoring field than I was before the course….mentoring has become easier to deal with and to handle after the course.” – Mentoring workshop participant, 2014
Education outing
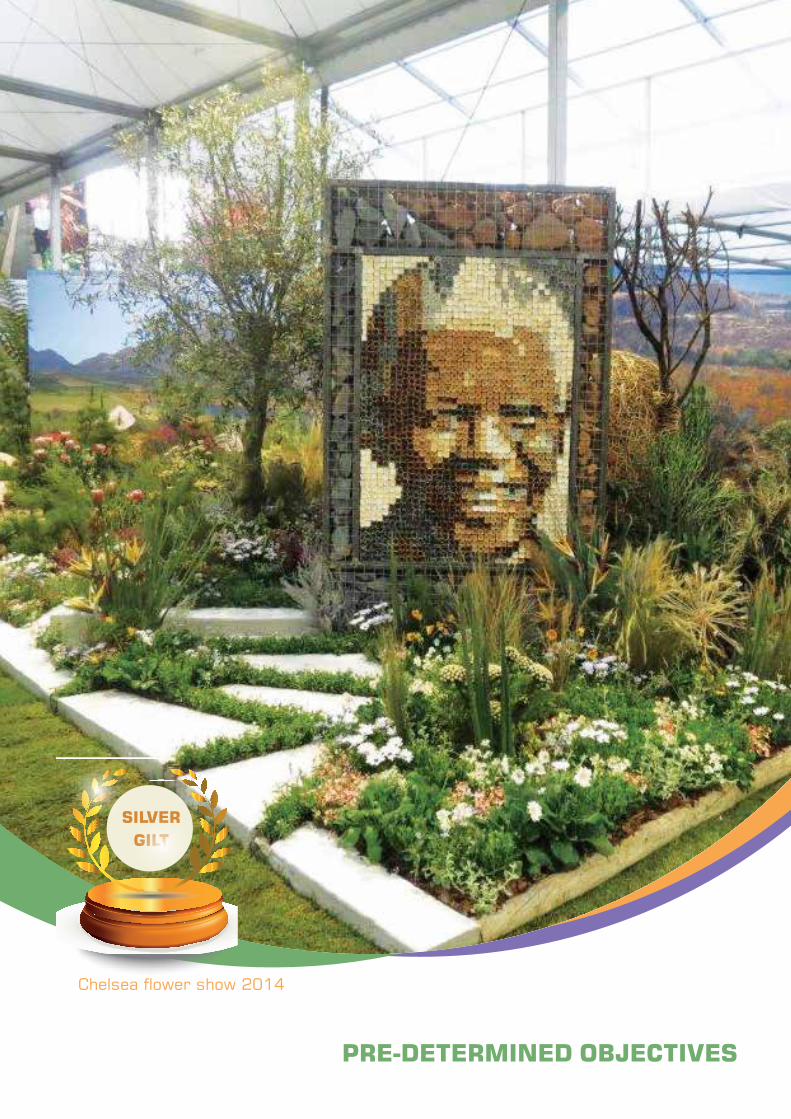
pre-deterMined obJectives
silver gilt
chelsea flower show 2014

ANNUAL REPORT50 20142015
strategic objective (s) Key performance indicators planned target 2014/15
actual achievement 2014/15 (achieved,
partially achieved, not achieved, exceeded target
and Modification)
deviation from planned target to actual
achievement
prograMMe 1: render eFFective and eFFicient corporate services (previously programme 6)1.1: SANBI is positioned as an
employer of choice in the biodiversity sector
Percentage of qualifying staff on the scientist and horticulturalist career path.
70% of qualifying staff placed on scientist career path
Achieved. 70% of qualifying staff were placed on scientist career path.
60% of qualifying staff placed on horticulturist career path
Partially Achieved. 29 hoticulturists identified and placed on career ladder.
Career ladder for horticulturists was developed and approved by SANBI Board. A work study approved by EXCO was conducted aimed at assessing the work load amongst horticulturists in order to create an enabling environment for the implementation of the horticulturists career ladder. A total of 29 horticulturists have been identified and will be placed on the career ladder accordingly
Percentage of payroll allocated and spent on staff development
1% of payroll allocated and spent on staff development
100% Achieved. The 1% of payroll allocated was spent on staff development.
Percentage of Employment Equity targets achieved
60% of EE targets achieved (numerical)
Partially Achieved. Out of 60% EE targets (numerical), only 45% was achieved.
45% of the EE targets (numerical) were achieved. The variation was caused by the fact that EXCO approved specific posts to be filled. Not all vacant posts were filled. EE targets will be applied as and when EXCO approves the vacant posts to be filled.
1.2: Compliant financial management systems and policies are provided
Annual financial statements produced to comply with PFMA and gRAP requirements.
Unqualified AFS produced to comply with PFMA and gRAP requirements. (Ag’s report)
100% Achieved. Unqualified, PFMA and gRAP compliant AFS produced.
1.3: Effective corporate services rendered to achieve the mandate of SANBI
All identified risks managed through an annual risk assessment and implementation of the risk management plan.
Annual risk assessment completed (Risk Register)
100% Achieved. Annual Risk assessment has been completed.
SANBI complies with all relevant Acts and SANBI/DEA protocol through implementation of the Compliance Framework
Reporting monitored according to specified time frames. (Compliance Reports)
100% Achieved. The reporting was monitored according to specified time-frames, on a quarterly basis.
1.4: Effective communication and technology support services through enhanced communication and technology infrastructure
Percentage availability of SANBI network and business applications
90% of ICT Services are available Achieved. 90% of ICT Services were made available.
1.5: Effective marketing and communication services delivered to internal and external stakeholders.
Number of communication platforms and methods utilised to keep internal and external stakeholders informed of SANBI activities and its NBgs
Quarterly newsflash, information brochures, intranet, website and CEOs letter.
100% Achieved. The quarterly newsflash, information brouchers, intranet, website and CEO’s letters were published.
Number of marketing initiatives and platforms identified and effectively utilised for brand SANBI and NBgs profiling
Produced newspaper articles, adverts and recorded interviews
100% Achieved. The newspaper articles, adverts and recorded interviews were produced.
Increased media coverage received. (Clippings of coverage)
100% Achieved. Received increased media coverage.
Number of media platforms utilised to educate and inform the public about SANBI, its products and services
Attended exhibitions, activations, shows and campaigns. gardens implemented initiatives and activities to attract increased number of visitors.
100% Achieved. Exhibitions, activations, shows and campaigns were attended and gardens implemented initiatives and activities to attract increased number of visitors.
OBJECTIvES pre-deterMined obJectives report 2014/15
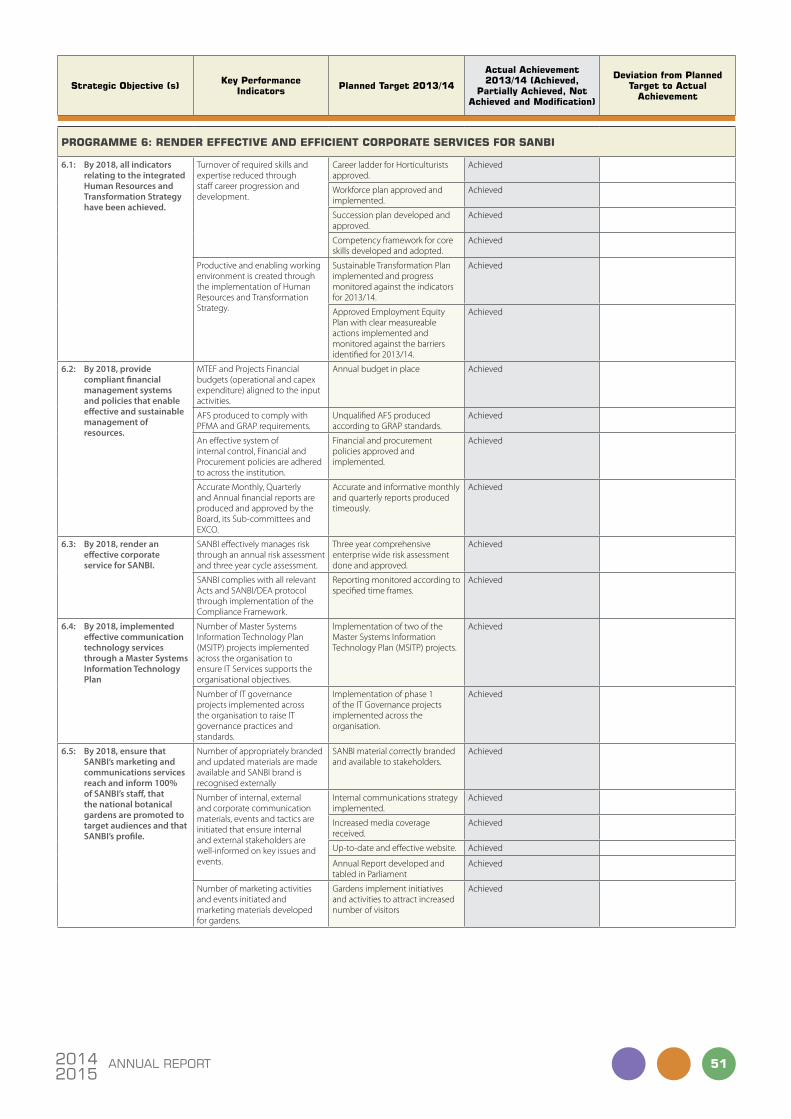
51ANNUAL REPORT20142015
strategic objective (s) Key performance indicators planned target 2013/14
actual achievement 2013/14 (achieved,
partially achieved, not achieved and Modification)
deviation from planned target to actual
achievement
prograMMe 6: render eFFective and eFFicient corporate services For sanbi
6.1: By 2018, all indicators relating to the integrated Human Resources and Transformation Strategy have been achieved.
Turnover of required skills and expertise reduced through staff career progression and development.
Career ladder for Horticulturists approved.
Achieved
Workforce plan approved and implemented.
Achieved
Succession plan developed and approved.
Achieved
Competency framework for core skills developed and adopted.
Achieved
Productive and enabling working environment is created through the implementation of Human Resources and Transformation Strategy.
Sustainable Transformation Plan implemented and progress monitored against the indicators for 2013/14.
Achieved
Approved Employment Equity Plan with clear measureable actions implemented and monitored against the barriers identified for 2013/14.
Achieved
6.2: By 2018, provide compliant financial management systems and policies that enable effective and sustainable management of resources.
MTEF and Projects Financial budgets (operational and capex expenditure) aligned to the input activities.
Annual budget in place Achieved
AFS produced to comply with PFMA and gRAP requirements.
Unqualified AFS produced according to gRAP standards.
Achieved
An effective system of internal control, Financial and Procurement policies are adhered to across the institution.
Financial and procurement policies approved and implemented.
Achieved
Accurate Monthly, Quarterly and Annual financial reports are produced and approved by the Board, its Sub-committees and EXCO.
Accurate and informative monthly and quarterly reports produced timeously.
Achieved
6.3: By 2018, render an effective corporate service for SANBI.
SANBI effectively manages risk through an annual risk assessment and three year cycle assessment.
Three year comprehensive enterprise wide risk assessment done and approved.
Achieved
SANBI complies with all relevant Acts and SANBI/DEA protocol through implementation of the Compliance Framework.
Reporting monitored according to specified time frames.
Achieved
6.4: By 2018, implemented effective communication technology services through a Master Systems Information Technology Plan
Number of Master Systems Information Technology Plan (MSITP) projects implemented across the organisation to ensure IT Services supports the organisational objectives.
Implementation of two of the Master Systems Information Technology Plan (MSITP) projects.
Achieved
Number of IT governance projects implemented across the organisation to raise IT governance practices and standards.
Implementation of phase 1 of the IT governance projects implemented across the organisation.
Achieved
6.5: By 2018, ensure that SANBI’s marketing and communications services reach and inform 100% of SANBI’s staff, that the national botanical gardens are promoted to target audiences and that SANBI’s profile.
Number of appropriately branded and updated materials are made available and SANBI brand is recognised externally
SANBI material correctly branded and available to stakeholders.
Achieved
Number of internal, external and corporate communication materials, events and tactics are initiated that ensure internal and external stakeholders are well-informed on key issues and events.
Internal communications strategy implemented.
Achieved
Increased media coverage received.
Achieved
Up-to-date and effective website. Achieved
Annual Report developed and tabled in Parliament
Achieved
Number of marketing activities and events initiated and marketing materials developed for gardens.
gardens implement initiatives and activities to attract increased number of visitors
Achieved
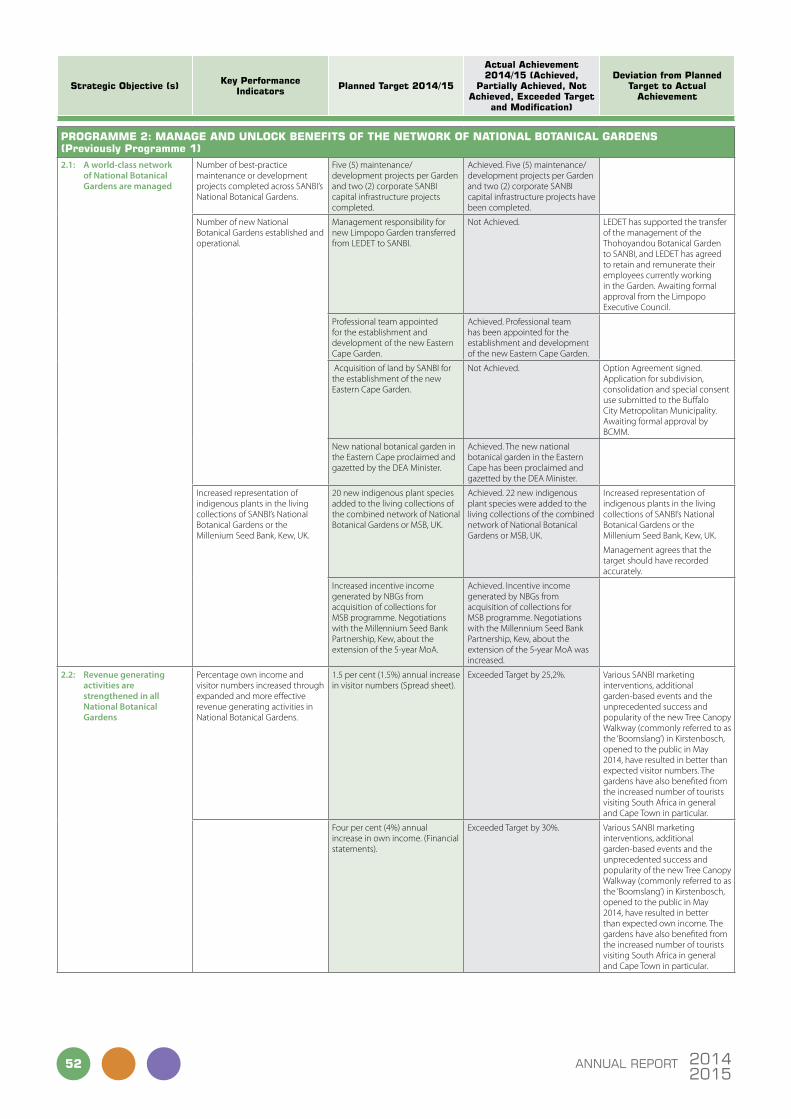
ANNUAL REPORT52 20142015
strategic objective (s) Key performance indicators planned target 2014/15
actual achievement 2014/15 (achieved,
partially achieved, not achieved, exceeded target
and Modification)
deviation from planned target to actual
achievement
prograMMe 2: Manage and unlocK beneFits oF tHe networK oF national botanical gardens (previously programme 1)2.1: A world-class network
of National Botanical Gardens are managed
Number of best-practice maintenance or development projects completed across SANBI’s National Botanical gardens.
Five (5) maintenance/development projects per garden and two (2) corporate SANBI capital infrastructure projects completed.
Achieved. Five (5) maintenance/development projects per garden and two (2) corporate SANBI capital infrastructure projects have been completed.
Number of new National Botanical gardens established and operational.
Management responsibility for new Limpopo garden transferred from LEDET to SANBI.
Not Achieved. LEDET has supported the transfer of the management of the Thohoyandou Botanical garden to SANBI, and LEDET has agreed to retain and remunerate their employees currently working in the garden. Awaiting formal approval from the Limpopo Executive Council.
Professional team appointed for the establishment and development of the new Eastern Cape garden.
Achieved. Professional team has been appointed for the establishment and development of the new Eastern Cape garden.
Acquisition of land by SANBI for the establishment of the new Eastern Cape garden.
Not Achieved. Option Agreement signed. Application for subdivision, consolidation and special consent use submitted to the Buffalo City Metropolitan Municipality. Awaiting formal approval by BCMM.
New national botanical garden in the Eastern Cape proclaimed and gazetted by the DEA Minister.
Achieved. The new national botanical garden in the Eastern Cape has been proclaimed and gazetted by the DEA Minister.
Increased representation of indigenous plants in the living collections of SANBI’s National Botanical gardens or the Millenium Seed Bank, Kew, UK.
20 new indigenous plant species added to the living collections of the combined network of National Botanical gardens or MSB, UK.
Achieved. 22 new indigenous plant species were added to the living collections of the combined network of National Botanical gardens or MSB, UK.
Increased representation of indigenous plants in the living collections of SANBI’s National Botanical gardens or the Millenium Seed Bank, Kew, UK.
Management agrees that the target should have recorded accurately.
Increased incentive income generated by NBgs from acquisition of collections for MSB programme. Negotiations with the Millennium Seed Bank Partnership, Kew, about the extension of the 5-year MoA.
Achieved. Incentive income generated by NBgs from acquisition of collections for MSB programme. Negotiations with the Millennium Seed Bank Partnership, Kew, about the extension of the 5-year MoA was increased.
2.2: Revenue generating activities are strengthened in all National Botanical Gardens
Percentage own income and visitor numbers increased through expanded and more effective revenue generating activities in National Botanical gardens.
1.5 per cent (1.5%) annual increase in visitor numbers (Spread sheet).
Exceeded Target by 25,2%. various SANBI marketing interventions, additional garden-based events and the unprecedented success and popularity of the new Tree Canopy Walkway (commonly referred to as the ‘Boomslang’) in Kirstenbosch, opened to the public in May 2014, have resulted in better than expected visitor numbers. The gardens have also benefited from the increased number of tourists visiting South Africa in general and Cape Town in particular.
Four per cent (4%) annual increase in own income. (Financial statements).
Exceeded Target by 30%. various SANBI marketing interventions, additional garden-based events and the unprecedented success and popularity of the new Tree Canopy Walkway (commonly referred to as the ‘Boomslang’) in Kirstenbosch, opened to the public in May 2014, have resulted in better than expected own income. The gardens have also benefited from the increased number of tourists visiting South Africa in general and Cape Town in particular.

53ANNUAL REPORT20142015
strategic objective (s) Key performance indicators planned target 2013/14
actual achievement 2013/14 (achieved,
partially achieved, not achieved and Modification)
deviation from planned target to actual
achievement
prograMMe 1: Manage and unlocK beneFits oF tHe networK oF national botanical gardens
1.1: By 2018, SANBI’s National Botanical Gardens, estates and associated infrastructure are managed, expanded, developed and maintained through strategic partnerships to realize benefits to SANBI, civil society and other relevant stakeholders (Outcome 10, Sub-output 4.1).
Best-practice maintenance and development projects across all SANBI campuses implemented.
Five (5) maintenance projects per garden and two (2) corporate SANBI capital infrastructure projects completed.
Achieved
Declaration and proclamation of two (2) new national botanical gardens in the Eastern Cape and Limpopo Provinces with required resources (capital infrastructure, personnel and operations) sourced.
Acquisition (SANBI) and proclamation (by DEA) of the Kwelera National Botanical garden in the Eastern Cape Province.
Partially Achieved Deed of Sale for land acquisition signed. DEA Minister published an Intention to Declare notice for establishing the Kwelera NR as the Kwelera National Botanical garden. Awaiting formal Declaration Notice to be published by the DEA Minister.
gardens expansion and infrastructure budgets allocated to the establishment of the Kwelera National Botanical garden in the Eastern Cape.
Achieved
Required support and approvals received for the establishment of a new national botanical garden in the Limpopo Province.
Achieved
gardens Conservation Programme is developed and resourced to provide co-ordination and leadership in promoting plant conservation amongst SANBI gardens through support of the Millennium Seed Bank Partnership with RBg, Kew.
gardens Conservation Programme implemented and strengthened.
Achieved
Integrated plant conservation skills audit conducted amongst garden staff.
Achieved
Incentive income generated by NBgs from acquisition of targeted collections for MSB programme.
Achieved
1.2: By 2018, strengthen revenue generating activities in all National Botanical Gardens to contribute to SANBI’s sustainability (Sub-output 3.5).
Increased income and visitor numbers received through expanded and/or more effective garden-based revenue generating activities.
Two percent (2%) annual increase in visitor numbers.
Achieved
Four percent (4%) annual increase in own income.
Achieved

ANNUAL REPORT54 20142015
strategic objective (s) Key performance indicators planned target 2014/15
actual achievement 2014/15 (achieved,
partially achieved, not achieved, exceeded target
and Modification)
deviation from planned target to actual
achievement
prograMMe 3: provide scientiFic evidence to support policy and decision MaKing relating to biodiversity, including tHe iMpacts oF cliMate cHange (previously programme 2)3.1: Foundational information
on species and ecosystems is generated and collated.
Number of data sets compiled or updated providing national inventories for plant and animal taxa, spatial datasets for conservation planning, monitoring data, and national classification systems
Two inventories, comprising (i) an inventory of animal species with 33 000 species and (ii) an inventory of all South African plants updated four times per annum
100% Achieved. The two inventories, comprising (i) an inventory of animal species with 33 000 species and (ii) an inventory of all South African plants were updated four times per annum
One inventory of SANBI gardens Biodiversity updated with new records and information. (Database).
100% Achieved. One inventory of SANBI gardens Biodiversity was updated with new records and information
Two complete and updated classification systems. (gIS shape files and metadata)
100% Achieved. The two classification systems were completed and updated.
Two spatial datasets compiled to provide information for conservation planning (datasets available)
100% Achieved. The two spatial datasets to provide information for conservation planning were compiled.
One monitoring database being updated (SABAP2) with at least 65% coverage of South African surface area, monitoring underway for one further taxon (database).
100% Achieved. One monitoring database was updated (SABAP2) with at least 65% coverage of South African surface area, monitoring underway for one further taxon.
3.2: Scientific evidence on the status of biodiversity, risks and benefits is produced in order to inform policy and decision making
Number of research papers published in scientific literature
90 publications (publications). 100% Achieved. 90 publications were produced.
Number of synthesis reports produced that deal with national assessments of biodiversity, impacts of genetically modified organisms, sustainable trade and support for the wildlife economy.
Two preliminary reports on assessment of biodiversity based ecosystem services; coral bleaching as an indicator of climate change. Timetable for delivery of NBA (2018) (NBA 2018 project timetable)
100% Achieved. The two preliminary reports on assessment of biodiversity based ecosystem services; coral bleaching as an indicator of climate change were done.
Percentage of assessments completed dealing with priority species for the Scientific Authority and invasive species
60% of priority species identified by the Scientific authority assessed
100% Achieved. The 60% of priority species identified by the Scientific authority were assessed.
50% of species assessed for AIS regulations
100% Achieved. The 50% of species were assessed for AIS regulations.
strategic objective (s) Key performance indicators planned target 2013/14
actual achievement 2013/14 (achieved,
partially achieved, not achieved and Modification)
deviation from planned target to actual
achievement
prograMMe 2: provide scientiFic evidence to support policy and decision-MaKing relating to tHe ManageMent oF terrestrial and aQuatic biodiversity and tHe iMpacts oF cliMate cHange
2.1: By 2018, primary data sets for key taxa are available to support decision-making, analysis and assessment; including an animal checklist for 50 000 species, updates to plant inventories, databases for animals to support Red Listing, population monitoring data to support Non-Detriment Findings and to monitor climate change impacts for at least three indicator taxa, (Outcome 10, sub-output 4.3).
Number of updates to inventories of species and ecosystems (number of species added; classifications completed and updated).
Animal inventory: 35 000 species included
Achieved
Plant inventory: updated four times per annum
Achieved
Fine-scale spatial wetland datasets incorporated into wetland inventory.
Achieved
Number of animal data sets compiled.
Animal data for Red Listing: two additional animal groups
Partly Achieved The intention was to complete data collection for bats and sparid fish, the bat data is complete but data on sparid fish are behind due to shortage of capacity. Steps have been put in place to get additional capacity to complete these datasets

55ANNUAL REPORT20142015
strategic objective (s) Key performance indicators planned target 2013/14
actual achievement 2013/14 (achieved,
partially achieved, not achieved and Modification)
deviation from planned target to actual
achievement
prograMMe 2: provide scientiFic evidence to support policy and decision-MaKing relating to tHe ManageMent oF terrestrial and aQuatic biodiversity and tHe iMpacts oF cliMate cHange
Number of herbarium records and specimens verified and prepared for databasing.
10 000 records verified in plant database.
Achieved
12 500 plant specimens prepared for databasing
Achieved
Number of taxon-based climate change monitoring databases active and providing trends information.
SABAP2 Programme provides bird species data on at least 65% cumulative of South African surface area, monitoring underway for one further taxon
Achieved
Number of databases and inventories of biodiversity in SANBI conservation gardens.
One publication of Sappi-sponsored biodiversity information for SANBI’s NBgs, in collaboration with a range of relevant experts
Achieved
SANBI gardens Biodiversity database updated with new records and information gathered from biodiversity surveys conducted in the gardens.
Achieved
2.2: By 2018, SANBI is providing scientific evidence through (i) an updated comprehensive state of biodiversity report; (ii) interim reports based on research, monitoring and assessment of species, ecosystems, invasive species, the impacts of genetically modified organisms and impacts of and adaptation to climate change; (iii) the publication of at least 375 scientific papers to support assessments, policy and decision–making; and (iv) representation on key committees influencing the generation of scientific evidence within the managed network. (Outcome 10, sub-outputs 2.4, 4.2 4.3).
Number of SANBI-relevant research papers published in scientific literature (threatened species and ecosystems, invasive alien species, climate change impacts and adaptation, sustainable use, taxonomy, gMOs).
75 publications Achieved
Number of ongoing assessments of TOPS, CITES and Alien and Invasive Species (AIS) species required to support regulations and implementation of management plans.
Five NDFs completed Achieved
At least five risk assessments on invasives
Achieved
Number of reports on status and trends in biodiversity based on research, monitoring and assessment of ecosystems and species (NBA), ecosystem services and ecological infrastructure, threatened species, invasive species, the impacts of genetically modified organisms, and the impacts of and adaptation to climate change.
Programme for National Biodiversity Assessment (NBA) 2018 conceptualised.
Achieved
Develop foundation science to support further listing of threatened ecosystems.
Achieved
Workshop on biodiversity based ecosystem services.
Achieved
One updated plant assessment. Red list assessments: two animal groups assessed. Red list index initiated.
Achieved
Draft report on coral bleaching as an indicator of climate change.
Achieved
Appointment of co-ordinator for gMO assessment work in SANBI.
Achieved
Workshop to develop implementation plan for monitoring status & trends of listed invasive species.
Achieved
Number of climate change adaptation frameworks developed.
Climate change adaptation planning frameworks for nine terrestrial biomes completed, response measures for marine biome identified.
Partially Achieved SANBI has completed a component of the work assigned to them, and subsequently DEA has appointed consultants to undertake the remaining component of the work
Number of committees where SANBI is represented to influence the direction and resourcing of research relevant to SANBI’s mandate.
SANBI chairing the Research Advisory Panel for DEA-NRM; represented on the steering committees for the DST-NRF centres on invasions biology and birds; leading the ACCESS project.
Achieved

ANNUAL REPORT56 20142015
strategic objective (s) Key performance indicators planned target 2014/15
actual achievement 2014/15 (achieved,
partially achieved, not achieved, exceeded target
and Modification)
deviation from planned target to actual
achievement
prograMMe 4: co-ordinate and provide access to biodiversity inForMation and Knowledge (previously programme 3)4.1: Access is provided
to biodiversity data, information and knowledge.
Percentage of records accessed from the Biodiversity Advisor website.
5% cumulative increase in records accessed.
100% Achieved. The 5% cumulative increase in records was accessed.
Percentage of registered users on the Biodiversity Advisor website
5% cumulative increase in registered users.
100% Achieved. The 5% cumulative increase in registered users.
Steenbok

57ANNUAL REPORT20142015
strategic objective (s) Key performance indicators planned target 2013/14
actual achievement 2013/14 (achieved,
partially achieved, not achieved and Modification)
deviation from planned target to actual
achievement
prograMMe 3: co-ordinate and provide access to biodiversity inForMation and scientiFic Knowledge
3.1: By 2018, seven modules comprising of online tools and services are available to support research, planning, policy support land-use decision-making and monitoring. The tools and services will be tailored to the end-users’ needs and will reduce the overall management cost to SANBI.
Number of modules of the integrated biodiversity information portal developed and available for use by researchers, decision-makers and policy developers.
Herbarium information system implemented. Online plant & animal checklist tool implemented.
Achieved
3.2: By 2018, 500 000 primary biodiversity data sets, 20 maps, and 33 publications are accessible as part of a comprehensive biodiversity information system.
Number of primary biodiversity data accessible to support research, planning, decision-making, policy advice and monitoring at local, provincial and national level.
100 000 records Justified modification approved by Minister: 50 000 available
Justified modification approved by Minister: 50 000 available
Number of spatial plans and maps accessible to support research, planning, decision-making, policy advice and monitoring at local, provincial and national level.
Five plans and maps Achieved
Number of volumes (issues) of SANBI publications produced and available on http://biodiversityadvisor.org.za to grow the body of biodiversity knowledge.
Five volumes of Strelitzia and 1 volume (2 issues) of Bothalia journal published.
Achieved
Number of library collections are increased by 300 additional items a year for use by researchers, planners and policy makers.
300 additional items added to the library collection for use by researchers, planners and policy makers.
Achieved
The Biodiversity Heritage Library South African chapter MoU signed.
Achieved
Number of learning exchanges events hosted for SANBI and partner organisations on Biodiversity Information Management to foster cross-learning and skills exchange.
The Biodiversity Information Management forum held, African gBIF group meeting, four training events on the use of biodiversity information in decision-making and research.
Achieved

ANNUAL REPORT58 20142015
strategic objective (s) Key performance indicators planned target 2014/15
actual achievement 2014/15 (achieved,
partially achieved, not achieved, exceeded target
and Modification)
deviation from planned target to actual
achievement
prograMMe 5: provide biodiversity and cliMate cHange adaptation policy tools and advice in support oF soutH aFrica’s developMent (previously programme 4)5.1: Ecosystem management
tools developed and applied
Number of tools developed to support mainstreaming of biodiversity and ecological infrastructure in production sectors and resource management
Two tools produced. (Reports) Biodiversity and climate change adaptation implementation plan scoping workshop session held
100% Achieved. The two tools produced. Biodiversity and climate change adaptation implementation plan scoping workshop session was held.
Six knowledge resources demonstrating the value of biodiversity developed and disseminated. (Documents/films and/or infographics/factsheets)
100% Achieved. The six knowledge resources demonstrating the value of biodiversity were developed and disseminated.
Number of coordination or learning mechanisms convened to share lessons and build capacity
Four learning or coordination events convened. (Attendance registers, meeting minutes, programmes).
100% Achieved. The four learning or coordination events were convened.
Three training sessions held for provincial, municipal or other relevant decision makers for uptake of tools. (Attendance registers, programmes).
100% Achieved. The three training sessions were held for provincial, municipal or other relevant decision makers for uptake of tools.
5.2: Projects for ecosystem restoration developed and implemented
Number of wetlands under rehabilitation to restore high value ecosystems
110 wetlands under rehabilitation. Exceeded Target. A total of 115 wetlands were under rehabilitation.
Unforeseen maintenance was done on five wetlands (three in Mpumalanga and two in Eastern Cape) during the course of the year. This maintenance was not planned for, and hence not included in the targets, but needed to be done promptly once the need for it was detected, in order to avoid further degradation of the structures that required maintenance.
5.3: Scientific advice to support national and international policy processes provided
Number of national policy requests responded to within timeframe stipulated in the request
Two written requests for support from DEA responded to within timeframe stipulated. (Documents, reports, minutes of meeting depending on request)
100% Achieved. The two written requests for support from DEA were responded to within timeframe stipulated.
One report on the Scientific Authority submitted to the Minister. (Report)
100% Achieved. One report on the Scientific Authority was submitted to the Minister.
Two biodiversity planning processes supported. (Minutes of meetings, reports, documents depending on request)
100% Achieved. The two biodiversity planning processes were supported
Number of national policy processes for which support is provided to other relevant organs of state
Submissions provided into two national policy process. (Participation in relevant meetings; comments and input provided by SANBI where applicable).
100% Achieved. Submissions were provided into two national policy process. (Participation in relevant meetings; comments and input provided by SANBI where applicable).
Number of international policy support requests responded to within timeframe stipulated
Four written requests relating to core multi-lateral environmental agreements responded to within timeframe stipulated. (Reports, documents depending on request)
100% Achieved. Four written requests relating to core multi -lateral environmental agreements were responded to within timeframe stipulated.
5.4: The direct access climate finance modality is proved to be effective in building resilience in communities vulnerable to adverse climate impacts
Number of climate change adaptation pilot projects developed and implemented via the direct access modality
Detailed project concepts approved for two climate change adaptation fund direct access modalities. (Project documents)
100% Achieved. The detailed project concepts were approved for two climate change adaptation fund direct access modalities
Number of cases where South Africa’s experience with direct access is documented and shared
NIE lessons and experiences shared at at least four international, regional and national meetings per annum. (Powerpoint presentations and associated feedback)
100% Achieved. NIE lessons and experiences were shared at at least four international, regional and national meetings per annum.

59ANNUAL REPORT20142015
strategic objective (s) Key performance indicators planned target 2013/14
actual achievement 2013/14 (achieved,
partially achieved, not achieved and Modification)
deviation from planned target to actual
achievement
prograMMe 4: provide science-based policy tools and advice For tHe eFFective ManageMent oF biodiversity assets and ecological inFrastructure in support oF soutH aFrica’s developMent4.1: By 2018, biodiversity
science is translated into tools that are relevant for policy and decision-making in support of South Africa’s development agenda and socio-economic priorities as well as regional and international obligations and opportunities. (Outcome 10, sub-output 4.1,4.3,4.4).
Number of science-based resources capturing/ communicating the value of biodiversity assets and ecological infrastructure for the national development agenda.
Branding biodiversity toolkit developed.
Achieved
Set of eight knowledge resources for demonstrating the value of biodiversity developed and disseminated.
Achieved
Number of science-based policy tools and pilot projects developed and implemented in production sectors and resource management.
Framework for investments in ecosystem services developed.
Achieved
Applications submitted for an additional 10 000 ha protected under stewardship agreements.
Achieved
grazing guidelines for grasslands biodiversity completed.
Achieved
guidelines for grassland management in the forestry sector finalised.
Achieved
Final gauteng Biodiversity Toolkit produced.
Achieved
Users’ version of mining and biodiversity guideline produced and training provided.
Achieved
Wetland offsite mitigation guidelines published.
Achieved
Wetland offsite mitigation banking institutional framework developed and piloted with mining companies and regulators.
Achieved
112 wetlands under rehabilitation. Achieved
Provision of 1 460 EPWP job opportunities for 214 352 person days, including 22 505 training days.
Justified modification approved by Minister for 5 982 training days
Justified modification approved by Minister for 5 982 training days
Publication on lessons and experiences from partnerships with the private sector produced.
Achieved
Contribute to the development or refinement of at least one science-based tool to support offshore protection (such as proposed spatial management measures, updated priority area maps or contributions to sector plans and guidelines) as required.
Achieved
Number of provinces, district- and local municipalities receiving science-based policy advice for the development and implementation of biodiversity plans.
Support provided to provinces for development and revision of spatial biodiversity plans as required.
Achieved
Review 100% of bioregional plans and BMP-Es submitted to SANBI for review.
Achieved
Number of functional mechanisms to enable cross-organisational science-based policy sharing of lessons on management of biodiversity assets and ecological infrastructure.
At least two national events convened e.g. 10th National Biodiversity Planning Forum, grasslands Partners Forum.
Achieved
At least three communities of practice convened e.g. Freshwater ecosystem network, CAPE Implementation Committee, Biodiversity Stewardship Technical Working group.
Achieved
Four training sessions held for provincial and municipal officials and/or other relevant stakeholders for uptake of science-based tools.
Achieved
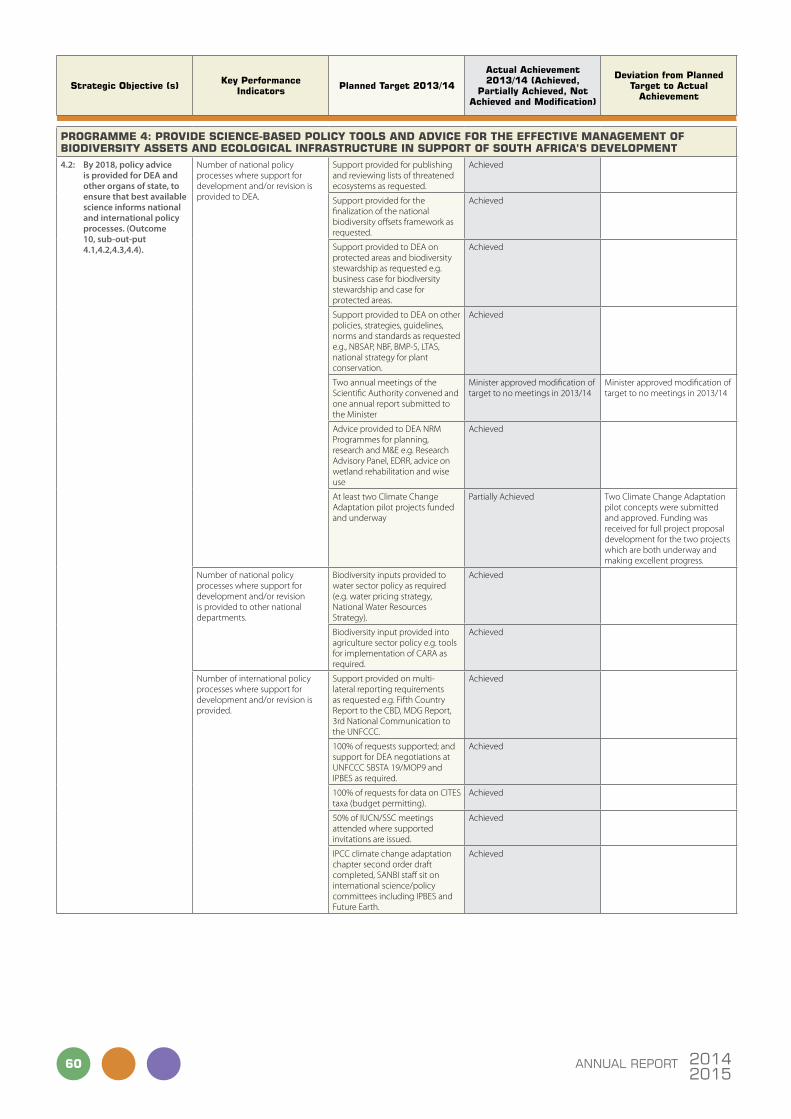
ANNUAL REPORT60 20142015
strategic objective (s) Key performance indicators planned target 2013/14
actual achievement 2013/14 (achieved,
partially achieved, not achieved and Modification)
deviation from planned target to actual
achievement
prograMMe 4: provide science-based policy tools and advice For tHe eFFective ManageMent oF biodiversity assets and ecological inFrastructure in support oF soutH aFrica’s developMent4.2: By 2018, policy advice
is provided for DEA and other organs of state, to ensure that best available science informs national and international policy processes. (Outcome 10, sub-out-put 4.1,4.2,4.3,4.4).
Number of national policy processes where support for development and/or revision is provided to DEA.
Support provided for publishing and reviewing lists of threatened ecosystems as requested.
Achieved
Support provided for the finalization of the national biodiversity offsets framework as requested.
Achieved
Support provided to DEA on protected areas and biodiversity stewardship as requested e.g. business case for biodiversity stewardship and case for protected areas.
Achieved
Support provided to DEA on other policies, strategies, guidelines, norms and standards as requested e.g., NBSAP, NBF, BMP-S, LTAS, national strategy for plant conservation.
Achieved
Two annual meetings of the Scientific Authority convened and one annual report submitted to the Minister
Minister approved modification of target to no meetings in 2013/14
Minister approved modification of target to no meetings in 2013/14
Advice provided to DEA NRM Programmes for planning, research and M&E e.g. Research Advisory Panel, EDRR, advice on wetland rehabilitation and wise use
Achieved
At least two Climate Change Adaptation pilot projects funded and underway
Partially Achieved Two Climate Change Adaptation pilot concepts were submitted and approved. Funding was received for full project proposal development for the two projects which are both underway and making excellent progress.
Number of national policy processes where support for development and/or revision is provided to other national departments.
Biodiversity inputs provided to water sector policy as required (e.g. water pricing strategy, National Water Resources Strategy).
Achieved
Biodiversity input provided into agriculture sector policy e.g. tools for implementation of CARA as required.
Achieved
Number of international policy processes where support for development and/or revision is provided.
Support provided on multi-lateral reporting requirements as requested e.g. Fifth Country Report to the CBD, MDg Report, 3rd National Communication to the UNFCCC.
Achieved
100% of requests supported; and support for DEA negotiations at UNFCCC SBSTA 19/MOP9 and IPBES as required.
Achieved
100% of requests for data on CITES taxa (budget permitting).
Achieved
50% of IUCN/SSC meetings attended where supported invitations are issued.
Achieved
IPCC climate change adaptation chapter second order draft completed, SANBI staff sit on international science/policy committees including IPBES and Future Earth.
Achieved
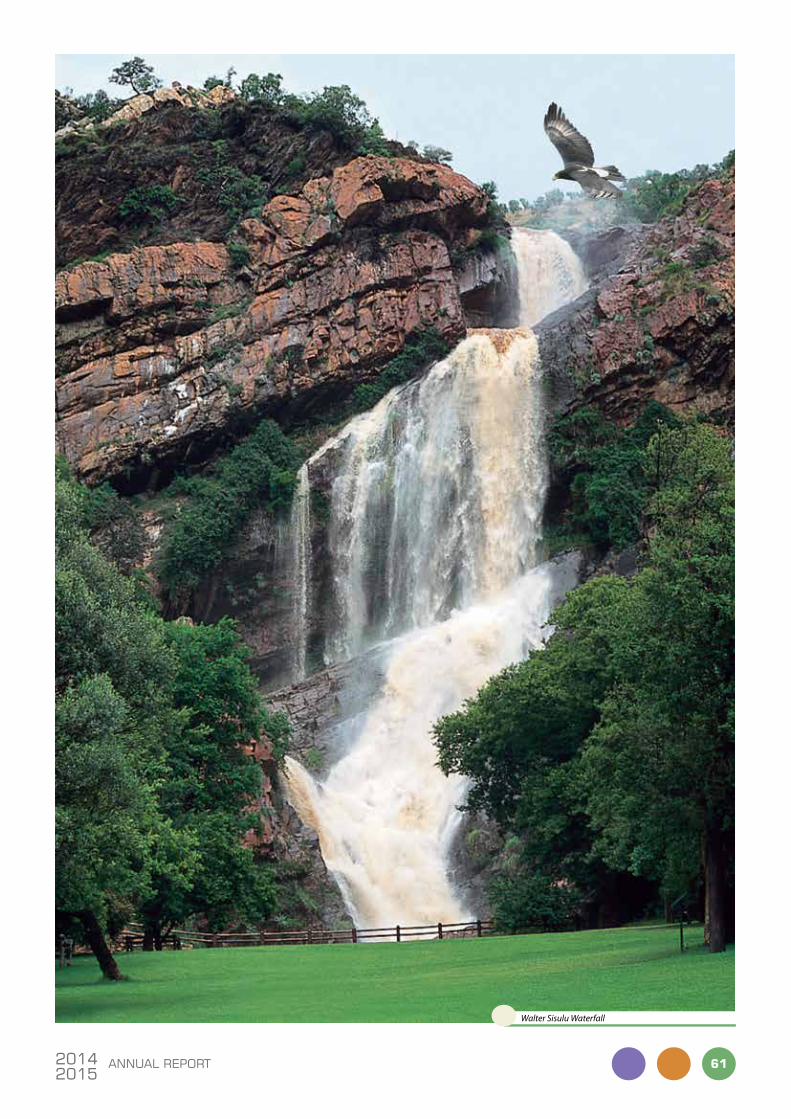
61ANNUAL REPORT20142015
Walter Sisulu Waterfall

ANNUAL REPORT62 20142015
strategic objective (s) Key performance indicators planned target 2014/15
actual achievement 2014/15 (achieved,
partially achieved, not achieved, exceeded target
and Modification)
deviation from planned target to actual
achievement
prograMMe 6: HuMan capital developMent (Hcd): drive HuMan capital developMent, education and awareness in response to sanbi’s Mandate (previously programme 5)6.1: A socially equitable and
suitably skilled workforce is developed
Number of individuals participating in groen Sebenza, greenMatter beneficiaries, internship and studenship capacity development and job creation initiatives with a percentage coming from designated groups.
1000 unemployed youth skilled and hosted in the biodiversity sector. (Contracts, payroll).
Exceeded Target 195 and the total achieved is 1197.
The groen Sebenza Project Steering Committee took a resolution to replace transitioned pioneers (pioneers who left due to attrition, job placements and further study) . This created opportunities to host more unemployed youth thereby increasing the numbers.
75% representation of designated groups in HCD programmes. (Reports)
Exceeded Target. The 84.38% representation of designated groups in HCD programmes was exceeded by 9.38%.
The groen Sebenza Project Steering Committee took a resolution to replace transitioned pioneers (pioneers who left due to attrition, job placements and further study) . This created opportunities to host more unemployed youth thereby increasing the numbers.
6.2: All national botanical gardens are promoted and used as platforms for biodiversity awareness, education and recreation.
Number of users and beneficiaries of botanical gardens and school-based programmes for education, awareness, training and recreation have been increased.
46 000 (Statistics Table). Exceeded Target. The target was exceeded by reaching 52 897 as opposed to 46 000 planned beneficiaries.
Due to the increased capacity from the groen Sebenza Programme SANBI was able to host more school based programmes and thereby increase the number of users and beneficiaries.
6.3: Civil society is engaged to contribute to science and monitoring
Number of platforms facilitated for civil society engagement that contribute to biodiversity monitoring
One platform facilitated. (Meeting minutes/notes, attendance register).
100% Achieved. One platform facilitated.

63ANNUAL REPORT20142015
strategic objective (s) Key performance indicators planned target 2013/14
actual achievement 2013/14 (achieved,
partially achieved, not achieved and Modification)
deviation from planned target to actual
achievement
prograMMe 5: HuMan capital developMent (Hcd): drive HuMan capital developMent, education and awareness in response to sanbi’s Mandate5.1: By 2018, South Africa
has a socially equitable and suitably skilled workforce of biodiversity leaders, professionals and technicians to optimally implement the sector’s dynamic, expanding and increasingly complex mandate. (Outcome 10, Cross-cutting X.2),
Co-ordinate and manage the implementation of biodiversity skills development and job creation programme.
800 unemployed youth skilled and employed in the biodiversity sector.
Achieved
Teachers and student teachers are being supported to provide relevant, quality biodiversity education to school learners.
Teacher Developers Network consists of at least 12 partners. At least two biodiversity conservation exemplars have been produced.
Achieved
Provide resources and initiatives to attract school-going youth to the biodiversity sector (greening the Youth).
One co-ordinated programme on biodiversity and careers for school-going youth has been initiated.
Achieved
Drive innovation within and collaboration between universities towards producing stronger skills for biodiversity (Higher Education Innovation).
At least one suitable mechanism is in place to drive innovation within and collaboration between South African universities towards producing stronger biodiversity related concepts and skills.
Achieved
Sector organisations share best practice to effectively identify and address their skills needs, train and retain talented professionals in the sector (Institutional Strengthening).
10 sector organisations share best practice to identify and address their skills needs, train and retain talented professionals.
Not Achieved Programme focus and lead organisation was changed.
Provide a platform and activities for interaction, coordination to enable the sector to speak and act with ‘one voice’ on HCD matters. ( National Co-ordination and Advocacy)
One national platform established or strengthened and used to address cross-sectoral HCD concerns.
Achieved
5.2: By 2018, national botanical gardens used for biodiversity education, training, awareness and recreation to achieve sustainable management practices amongst diverse users. ‘(Outcome Cross-cutting X.2)
Users and beneficiaries of garden and school-based programmes have been diversified and increased.
42 000 (12 X Youth groups, 3 000 children from Places/Homes of Safety, 100 new schools).
Achieved
Interpretive material developed for promoting biodiversity issues and SANBI’s programmes in all gardens.
Interpretive material developed and made available through garden programmes.
Achieved
5.3: By 2018,awareness on biodiversity raised through engaging civil society by implementing various initiatives/activities (ISPOT, CREW, Virtual Museums, greening, biodiversity monitoring) ‘(Outcome Cross-cutting X.2)
Case studies showcasing SANBI’s engagement with civil society to conserve biodiversity produced.
One Case study produced. Achieved
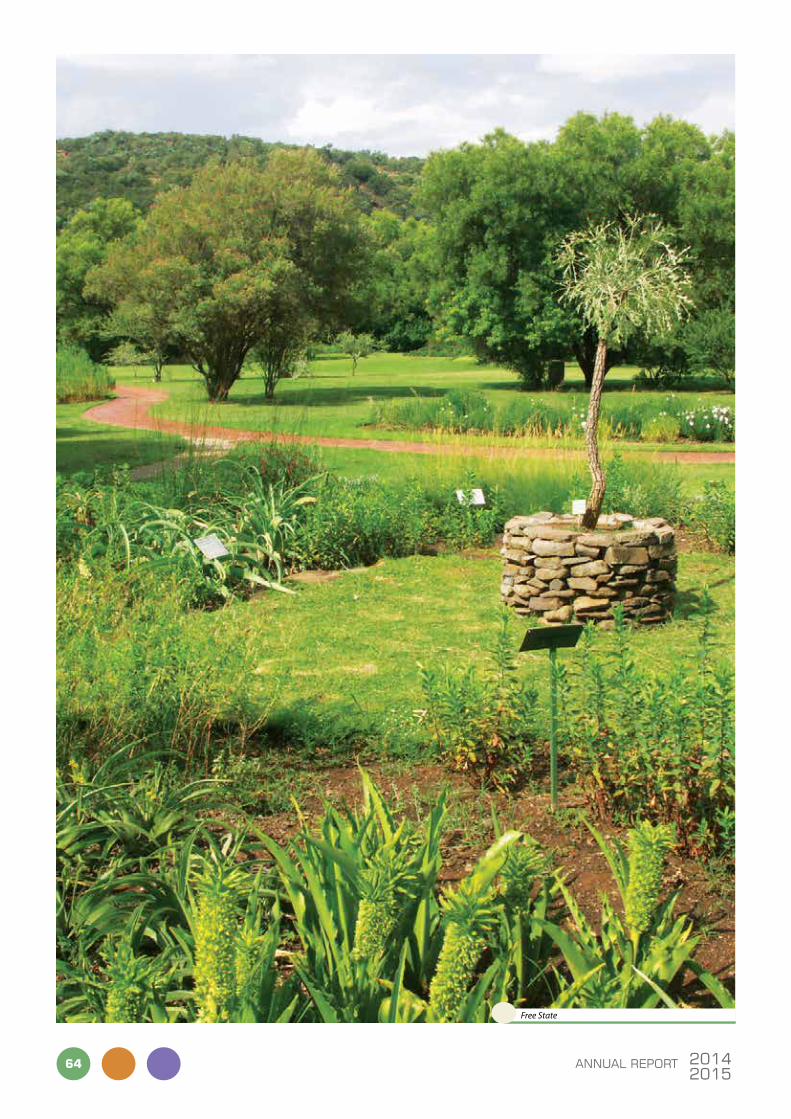
ANNUAL REPORT64 20142015
Free State

governance reports
Halfmens in Karoo desert

ANNUAL REPORT66 20142015
SOUTH AFRICAN NATIONAL BIODIVERSITY INSTITUTEANNUAL FINANCIAL STATEMENTS for the year ended 31 March 2015
The South African National Biodiversity Institute (SANBI) was established in terms of the National Environmental Management:
Biodiversity Act of 2004 (No. 10 of 2004) and is subject to the provisions of the PFMA 1999.
The PFMA requires the Accounting Authority (The Board) to ensure that the SANBI keeps full and proper records of its financial
affairs. The financial statements should fairly present the state of affairs of the SANBI, its financial results, its performance against
predetermined objectives and its financial position at the end of the year in terms of the effective South African Standards of gRAP,
including any interpretations, guidelines and directives issued by the ASB.
The financial statements are the responsibility of the Board. The External Auditors are responsible for independently auditing and
reporting on the Financial Statements.
These financial statements are based on appropriate accounting policies, supported by reasonable and prudent judgements
and estimates, and have been prepared on the going-concern basis. The Board has reviewed the SANBI’s cash flow forecast for
the year ending 31 March 2015 and considered the risks and challenges for the future. In light of this review and the current
financial position, the Board is satisfied that the SANBI has adequate resources or has access to adequate resources to continue in
operational existence in the short-term.
To enable the Board to meet the above-mentioned responsibilities, it sets standards and implements systems of internal control.
The controls are designed to provide cost-effective assurance that assets are safeguarded, and that liabilities and working capital
are efficiently managed.
Policies, procedures, structures and approval frameworks provide direction, accountability and division of responsibilities, and
contain self-monitoring mechanisms. The controls throughout SANBI focus on the critical risk areas identified by operational
risk management and confirmed by Executive Management. Both Management and the Internal Auditors closely monitor the
controls and actions taken to correct deficiencies as they are identified.
Based on the information and explanations given by Management and the Internal Auditors and discussions held with the
Auditor-general of South Africa on the result of their audits, the Board is of the opinion that the internal accounting controls are
adequate to ensure that the financial records may be relied on for preparing the financial statements, and accountability for the
assets and liabilities is maintained.
Nothing significant has come to the attention of the Board to indicate that any material breakdown has occurred in the functioning
of these controls, procedures and systems during the year under review.
In the opinion of the Board, based on the information available to date, the financial statements fairly present the financial position
of the SANBI as at 31 March 2015 and the results of its operations and cash flow information for the year.
The financial statements of the SANBI for the year ended 31 March 2015, which have been prepared on the going-concern basis,
have been approved by the Board and signed on its behalf by:
Ms ME Magomola Chairperson of the Board: SANBI
Dr. T AbrahamseChief Executive Officer: SANBI
stateMent oF responsibility oF tHe board
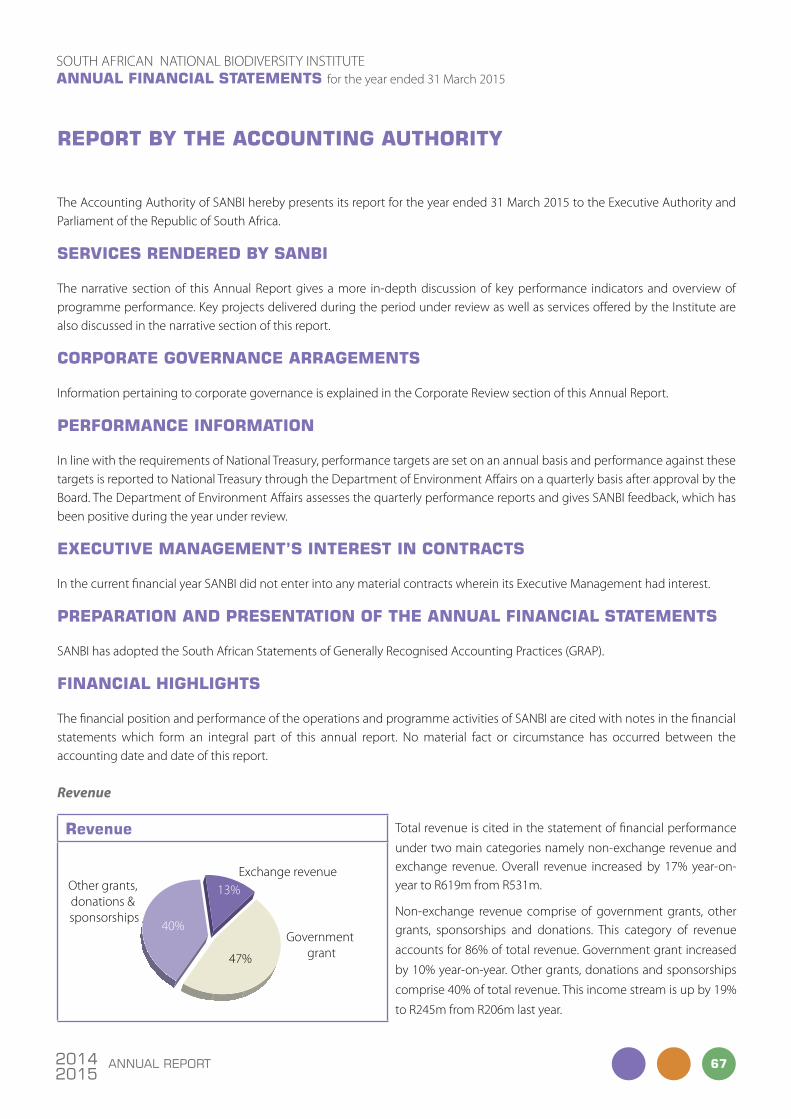
67ANNUAL REPORT20142015
SOUTH AFRICAN NATIONAL BIODIVERSITY INSTITUTEANNUAL FINANCIAL STATEMENTS for the year ended 31 March 2015
The Accounting Authority of SANBI hereby presents its report for the year ended 31 March 2015 to the Executive Authority and Parliament of the Republic of South Africa.
services rendered by sanbi
The narrative section of this Annual Report gives a more in-depth discussion of key performance indicators and overview of programme performance. Key projects delivered during the period under review as well as services offered by the Institute are also discussed in the narrative section of this report.
corporate governance arrageMents
Information pertaining to corporate governance is explained in the Corporate Review section of this Annual Report.
perForMance inForMation
In line with the requirements of National Treasury, performance targets are set on an annual basis and performance against these targets is reported to National Treasury through the Department of Environment Affairs on a quarterly basis after approval by the Board. The Department of Environment Affairs assesses the quarterly performance reports and gives SANBI feedback, which has been positive during the year under review.
executive ManageMent’s interest in contracts
In the current financial year SANBI did not enter into any material contracts wherein its Executive Management had interest.
preparation and presentation oF tHe annual Financial stateMents
SANBI has adopted the South African Statements of generally Recognised Accounting Practices (gRAP).
Financial HigHligHts
The financial position and performance of the operations and programme activities of SANBI are cited with notes in the financial statements which form an integral part of this annual report. No material fact or circumstance has occurred between the accounting date and date of this report.
Revenue
revenue Total revenue is cited in the statement of financial performance
under two main categories namely non-exchange revenue and exchange revenue. Overall revenue increased by 17% year-on-year to R619m from R531m.
Non-exchange revenue comprise of government grants, other grants, sponsorships and donations. This category of revenue
accounts for 86% of total revenue. government grant increased
by 10% year-on-year. Other grants, donations and sponsorships
comprise 40% of total revenue. This income stream is up by 19%
to R245m from R206m last year.
31 March 2014 Exchange revenue
Government grant
Other grants, donations & sponsorships
13%
47%
40%
report by tHe accounting autHority

ANNUAL REPORT68 20142015
SOUTH AFRICAN NATIONAL BIODIVERSITY INSTITUTEANNUAL FINANCIAL STATEMENTS for the year ended 31 March 2015
report by tHe accounting autHority (continued)
Exchange revenue comprise 14% of total revenue. It consists
of the Institute’s revenue generation activities. The main
contributor is admission fees through the gates. Overall, there is
a year-on-year increase of 40%.
Expenses
Overall expenditure has grown by 21% year-on-year. The
MTEF and projects personnel expenses combined constitute
47% (2014: 46%) of the total expenditure. This category of
expenditure has increased annually by 25%
Note 18 in the statement of financial performance details the
nature of expenses included in Operating Expenses.
exchange revenue
31 March 2014 59%
16%
13%
2%Sales Other income
Fair value gain
Interest
Rent
3%7%
Admission fees
This category of expenses is the second highest cost driver after personnel expenses contributing 50% to total expenses. Year
on year there is a 19% increase which is indicative of more operational activities being implemented compared to the previous
comparative year.
The surplus of R26,9m for the financial year is mainly attributed to revenue collection exceeding expectations and accounting
adjustments in respect of non-current assets and actuarial valuations.
Financial Position
Overall, the cash reserves are sufficient to meet the short-term needs as well as obligations arising from project funds received.
The Institute is solvent with total assets exceeding total liabilities by an adequate margin.
Financial position
31 March 2014
Current assets Non-current assets Current liabilities Non-current liabilities
0
50 000 000
100 000 000
150 000 000
200 000 000
250 000 000
300 000 000

69ANNUAL REPORT20142015
SOUTH AFRICAN NATIONAL BIODIVERSITY INSTITUTEANNUAL FINANCIAL STATEMENTS for the year ended 31 March 2015
report by tHe accounting autHority (continued)
current assetsCurrent Assets
Current assets at R283m exceed current liabilities of R243m by
a good margin which reflects a healthy liquidity position of the
Institute. The liquidity position is in an acceptable current ratio
band of 1; 1.16:1 and 1.2:1 of the previous financial year. The
cash and cash equivalent of current assets increased by 40% to
R277m from R197m.
This cash comprising 98% of total current assets, is fully
committed in terms of agreements with service providers,
project donors and sponsors.
Receivables from exchange transactions
1%
Biological assets1%
Cash and cash equivalents98%
Non-Current Assets
The Non-Current Assets of the Institute are managed and protected by management with due diligence. Appropriate insurance
cover is in place and any loss or damage to property is systematically investigated and remedial measures are promptly
implemented. The oversight of these measures is under the auspices of the Audit and Risk Committee, and the governance and
Strategy Committee. During the year under review, these assets have grown by 8%.
The following graph depicts the proportion of these assets in the current financial year.
non-current assets
0
20000000
40000000
60000000
80000000
100000000
120000000
140000000
160000000
Investment property
Property plant & equipment
Intangible assets
Heritage assets

ANNUAL REPORT70 20142015
SOUTH AFRICAN NATIONAL BIODIVERSITY INSTITUTEANNUAL FINANCIAL STATEMENTS for the year ended 31 March 2015
report by tHe accounting autHority (continued)
Current Liabilities
The current liabilities have increased by 45% from the previous financial year due to an increase in payables and unspent committed
funds. The proportionate comparison of current liabilities is graphically depicted below.
current liabilities
0 20000000 40000000 60000000 80000000
100000000 120000000 140000000 160000000 180000000
Payables from exchange transactions
Unspent committed project funds
Provisions
Non-Current Liabilities
The financial position of the Institute remains healthy with total assets exceeding total liabilities by a large margin. Non-current
liabilities have decreased by 13% from the previous financial year due to the decrease in the defined benefit liability as a result of
the annual actuarial valuation. The Board will do its utmost best effort to maintain this positive solvency position.

71ANNUAL REPORT20142015
SOUTH AFRICAN NATIONAL BIODIVERSITY INSTITUTEANNUAL FINANCIAL STATEMENTS for the year ended 31 March 2015
corporate governance stateMent
Corporate governance is a system by which organisations are directed and controlled. Basically it is a set of checks and balances
that gives assurance to stakeholders that the Institute is run according to sound corporate governance standards and principles.
These standards and principles are based on international best practice.
The South African National Biodiversity Institute subscribes to and is committed to complying with the principles and standards of
integrity and accountability expressed in the Public Finance Management Act, relevant National Treasury Regulations and where
applicable and practical the King III Report principles and recommendations on Corporate governance
The Institute’s Board, it’s Sub-committees and the Management Executive Committee ensure that the Institute complies with
these principles.
tHe presidential review coMMittee (prc) on state owned entities (soes)
The Presidential Review Committee (PRC) on State Owned Entities (SOEs) was appointed to review all SOEs and make
recommendations on aligning these entities in all spheres of government in order to achieve the development objectives and
aspirations of South Africa.
The SANBI governance review was performed by independent service providers against the requirements of the King Report on
governance for South Africa 2009 (King III) and relevant legislative requirements. The Code identifies the following nine chapters
containing broad elements of effective governance. Each principle is of equal importance and together forms a holistic approach
to governance.
Chapter 1: Ethical leadership and corporate citizenship
Chapter 2: Boards and directors
Chapter 3: Audit and Risk Committees
Chapter 4: The governance of risk
Chapter 5: The governance of information technology
Chapter 6: Compliance with laws, rules, codes and standards
Chapter 7: Internal audit
Chapter 8: governing stakeholder relationships
Chapter 9: Integrated reporting and disclosure
Legislation that was considered during the review includes:
• National Environmental Management: Biodiversity Act, 2004 (Act No. 10 of 2004);
• The Public Finance Management Act (PFMA), 1999 (Act No. 1 of 1999) (PFMA)
• The Treasury Regulations
We are pleased to report that the outcome of the governance review is that no significant gaps were identified that require
immediate management attention. This assessment was based on the methodology of comparing the governance of SANBI
against best practice and legislative requirements.
ANNUAL REPORT72 20142015
SOUTH AFRICAN NATIONAL BIODIVERSITY INSTITUTEANNUAL FINANCIAL STATEMENTS for the year ended 31 March 2015
corporate governance stateMent (continued)
Governance Structure
The South African National Biodiversity Institute subscribes to and is committed to complying with theprinciples and standards
of integrity and accountability expressed in the Public Finance Management Act, relevant National Treasury Regulations and
where applicable and practical the King III Report on Corporate governance. The Board also furnishes timeous and meaningful
information on all of its activities to all relevant stakeholders in line with the Promotion of Access to Information Act.
Appointment and Composition of the Board
Members of the SANBI Board are appointed by the Executive Authority in terms of Section 15 of the National Environmental
Management Biodiversity Act, 10 of 2004. Board members are appointed for a term of three years. As required by Public Finance
Management Act (PFMA) the Board is the Accounting Authority of the Institution. Members of the Executive Management
Committee attend Board meetings by invitation. The Board meets quarterly and functions in line with the approved Board Manual.
The Board induction was held immediately after the new Board was appointed. The agenda and content of the Induction session
included: Introduction to SANBI, Finances, Risks and Sustainability, Human Resources Programme, SANBI’s Key initiatives present
and future, Marketing and Communication initiatives and activities, Strategic Plan 2014 – 2019, Annual Performance Plan 2014/15,
High-level Budget 2014/15.
The Board consists of not fewer than seven and not more than nine members who are appointed by the Minister of Environmental
Affairs. The Board further includes the Director-general, or an official of the Department Environmental Affairs designated by the
Director-general, and the Chief Executive Officer of the Institute.
The SANBI Board members for the period 1 April 2014 – 31 March 2015
Ms ME Magomola (Chairperson)
Mr. AJ Frost
Mr. F Mketeni
Mr g Mashamba
Dr ST Cornelius
Dr J Matjila
Ms NN Mnqeta
Mr S gounden
Ms BD Ngidi
Dr T Abrahamse (Chief Executive Officer)
Fiduciary Duties
With regard to fiduciary duties, the Accounting Authority for the SANBI exercises the duty of utmost care and to ensure reasonable
protection of the assets and records of the entity. The roles of the Chairperson and Chief Executive Officer do not vest in the
same person and the Chairperson is a non-executive member of the organisation. The Chairperson and Chief Executive Officer
ensure that the mandate of the Institute is achieved. On an annual basis the Board submits the Annual Report and the Financial
Statements to the Minister for approval and tabling in Parliament.

73ANNUAL REPORT20142015
SOUTH AFRICAN NATIONAL BIODIVERSITY INSTITUTEANNUAL FINANCIAL STATEMENTS for the year ended 31 March 2015
corporate governance stateMent (continued)
Board Assessment
The evaluation of the board, its committees and the individual directors should be performed every year. The hand-over report
to the Minister of Environmental Affairs reflects many of the successes that SANBI has achieved under the Direction of this Board.
Board members were asked to complete a Self-Assessment Questionnaire to determine their perceptions of the strengths and
weaknesses of the Board in the context of their fiduciary accountability to provide direction, guidance and rigorous governance
to the Institute.
The questionnaire reflects the individual perceptions of Board Members. They were also asked to provide any additional comments
they wished.
The outcome of the assessment is summarised as follows:
• In general members feel that the Board functioned well. A high level of respect, in general, was displayed by members to each other and to the management.
• The Board’s current operational model works very well and should be shared with other State-Owned Entities (SOEs).
• The current system of induction was not as good as it could be and did not equip Board members as well as could have been done for their fiduciary and other responsibilities
Board Sub-Committees
For operational effectiveness, the Board has instituted Sub-Committees for key functional areas of the Institute. These Sub-
Committees comprise two or three members of the Board and independent members who are experts in their functional areas.
Members are appointed for a term concurrent with that of the Board. All Sub-Committees of the Board are chaired by members
of the Board. Any Board member may request or be requested to attend a Board Sub-Committee meeting.
The role of the Sub-Committees is to advise the Board on:
1. The mandate given to the Institute by Parliament.
2. The strategic direction of the Institute.
3. The implementation of the Corporate Strategic Plan.
4. The performance of key performance areas, budgeting requirements and the initiation of new activities or the termination
of existing activities.

ANNUAL REPORT74 20142015
SOUTH AFRICAN NATIONAL BIODIVERSITY INSTITUTEANNUAL FINANCIAL STATEMENTS for the year ended 31 March 2015
corporate governance stateMent (continued)
Committees: 1 April 2014 to 31 March 2015
Audit and Risk Committee:
Dr. S.T Cornelius (Chairperson)
Mr. g. Mashamba Board Member
Mr S. gounden Board Member
Mr. A.J Frost Board Member
Mr. g.J Dladla Independent member
Mr. v.K Naicker Independent Member
Dr. T. Abrahamse (Chief Executive Officer) ex officio
Ms. E. Makau (DEA: Chief Financial Officer) ex officio
Ms L. Sithole (Chief Financial Officer)
Governance and Strategy Committee
Mr. A.J Frost (Chairperson)
Ms N.N Mnqeta
Ms B.D Ngidi
Dr. T. Abrahamse (CEO) (ex officio)
Mr M Khoahli (in attendance)
Remuneration & Human Resources Committee
Dr J.M Matjila (Chairperson)
Mr g Mashamba
Mr. A.J Frost
Dr. T. Abrahamse (CEO) (ex officio)
Mr. M. Netshiombo (in attendance)
Research, Development and Innovation Committee
Ms D. Ngidi (Chairperson)
Mr. F. Mketeni
Prof. C. Chimimba (Independent member)
Dr. S Liphadzi (Independent member)
Dr. T. Abrahamse (ex officio)
Ms. C Mbizvo (in attendance)
75ANNUAL REPORT20142015
SOUTH AFRICAN NATIONAL BIODIVERSITY INSTITUTEANNUAL FINANCIAL STATEMENTS for the year ended 31 March 2015
corporate governance stateMent (continued)
As required by Treasury Regulation 27 of the PFMA, the Board appointed an Audit and Risk Committee to assist with the discharge
of its duties. The terms of reference of this Committee have been approved by the Board. The Committee meets four times per
year and one extra-ordinary meeting is held during the end of May annually, to consider the draft Annual Financial Statements.
Management Structure
The Executive Management Committee comprises the Chief Executive Officer (as Chairperson), Head of Biodiversity Science and
Policy Advice, Chief Financial Officer, Chief Corporate Officer, as well as all Chief Directors. This Committee meets monthly and
additionally meets on ad-hoc basis as deemed necessary. The role of the Committee is to ensure the co-ordinated and efficient
execution of all functions delegated to it by the Board
The management structure of the Institute is geographically decentralised because of the wide geographical spread and activities
of its various units. The head of each unit is called a ‘Head of Cost Centre’.
Implicit in the concept is a substantial measure of delegation of both responsibility and authority, which in turn requires effective
control and evaluation systems. Both financial and management responsibilities are delegated and clearly communicated to such
Head of Cost Centre. These officers are actively involved in the budget development cycle and must assume responsibility for the
disciplined management of their cost centre budgets within clearly defined policies, procedures and Delegations of Authority
approved by the Board.
otHer governance principles
Audit
The Auditor-general of South Africa (AgSA) is appointed as the external auditor of SANBI in terms of the Public Audit Act, No.25
of 2004. The Institution also has an internal audit function that is outsourced to a private audit firm for a period of three years. The
Board, through the Audit and Risk Committee, exercises oversight on financial reporting and internal control systems
Risk Management
A culture of risk management is inculcated in the Institute. Management is continuously developing and enhancing its risk and
control procedures to improve the mechanisms for identifying and monitoring risks. An in-depth Enterprise Wide Risk assessment,
facilitated by Internal Audit, was conducted during the year under review. The results of the assessment were reviewed by the
Audit and Risk Committee and subsequently approved by the SANBI Board. The identified risks were assigned to risk owners who
report progress on risk control action plans and mitigation measures.
The Risk Management and Fraud Prevention Committee (RMFPCom) which is under the auspices of the Audit and Risk Committee
and chaired by the Chief Corporate Officer, adjudicates on alleged fraud cases reported through the whistle blowing system
or other approved means. A Fraud Prevention Plan is in place. This plan sets out the specific objectives of the Supply Chain
Management procedures, standards and who the responsible party is.
A Whistle Blowing Hotline is fully functional and is administered by the South African Corporate Fraud Management Institute. An
organisation named vuvuzela Hotline (Pty) Ltd has been appointed to manage the hotline for a 3 year term. This service provider
informs SANBI Management and Internal Auditors of any reports of fraud or misconduct received. The procedure to be followed
when reporting an incident is documented for all employees.

ANNUAL REPORT76 20142015
SOUTH AFRICAN NATIONAL BIODIVERSITY INSTITUTEANNUAL FINANCIAL STATEMENTS for the year ended 31 March 2015
corporate governance stateMent (continued)
Cases of loss and/or damages to assets are recorded into a Loss Control Register and dealt with by the management Liability
Assessment Sub-Committee. Firm action is always taken for losses and damages ascribed to negligent accidents, recklessness and
carelessness.
The insurance policies are in place to provide cover over the Institute’s insurable assets, and possible litigation. Public Insurance
that covers senior Management has been arranged.
Internal Control Systems
Financial and operational systems of internal control are adhered to as required by applicable Regulations and Laws. These controls
are designed to provide reasonable assurance that transactions are concluded in accordance with management authority, assets
are protected and the financial transactions are properly recorded.
Cost centres and projects compliance officers located at all levels of the organisation submit quarterly reports on the status of
compliance in line with recommendations made by the internal auditors.
Internal Audit (IA)
SANBI has the internal audit function which is outsourced to an external service provider. The internal auditors report to the Audit
and Risk Committee according to the approved internal audit charter.
Further it is the requirement of Treasury Regulation 27.2.7 that IA must prepare in consultation with and for approval by the Audit
and Risk Committee, a three year rolling strategic IA plan based on the assessment of key areas of risk for the institution.
The approved Internal Audit Charter is in place. Included in the internal audit charter is a structured internal audit approach,
premised on the International Standards for the Professional Practice of Internal Auditors (ISPPIA) as prescribed by the Institute of
Internal Auditors (IIA).
Ethics
King III suggest internal assessment of the company’s ethics performance as well as internal reporting on its ethics performance
are necessary to provide the Board and Management with relevant and reliable information about the achievement of ethics
objectives, the outcomes of ethics initiatives and the quality of the company’s ethics performance.
Although SANBI has not conducted a comprehensive ethics assessment thus far the HR & Remco Committee considers the Social
& Ethics Annual Report, Social & Ethics Committee Charter. Social & Ethics Committee Work plan, Code of Conduct and Ethics as
well as the Social & Ethics Committee Strategic Pillars in its deliberations. Once the assessment is done, the outcome thereof will
be disclosed in the next financial year’s Annual Report. These issues are reported to the Board by the Chairperson of HR & Remco.
Management of ICT
The Board should be responsible for information technology (IT) governance. There is an approved SANBI Information Technology
Policy Framework (Principles & guidelines) based on the notion that IT governance exists to inform and align decision making for
Information technology planning , policy and operations in order to meet business objectives, ascertain that risk are managed
appropriately and verify that resources are being used responsibility and strategically.
ICT governance continues to feature highly on the agenda within many organisations as Corporate governance increasingly

77ANNUAL REPORT20142015
SOUTH AFRICAN NATIONAL BIODIVERSITY INSTITUTEANNUAL FINANCIAL STATEMENTS for the year ended 31 March 2015
corporate governance stateMent (continued)
realises that IT touches every area of the organisation and contributes as an essential enabler of future business opportunities. ICT
governance is part of a wider corporate governance activity with its own specific focus. The benefits of good ICT risk management,
oversight and clear communication not only reduces the cost and damage caused by ICT failures but also engenders greater trust,
team and confidence in the use of ICT itself and those entrusted with ICT services.
An ICT Steering Committee is established at a management level to deal with ICT governance and other related issues.
The Board delegated aspects of oversight of ICT governance to the Audit and Risk Committee, and the governance and Strategy
Committee. Both of these committees provide written and formal feedback to the Board.
Employment Equity
The Employment Equity programme in SANBI is monitored by the Employment Equity and Training Committee. The primary aim
of the Employment Equity Policy is to achieve the following:
• Compliance with the provisions and legal requirements of the Employment Equity Act.
• Promotion of diversity;
• Accommodation of special needs people through modification and adjustment of the physical working environments ;
• Attraction, development and retention of staff members with emphasis on those from designated groups.
• SANBI strives to achieve its Employment Equity vision through the following initiatives:
• Implementation of all the critical success factors for effective Employment Equity transformation;
• Provision of all necessary personnel and financial resources;
• Utilising the SANBI structures to, consult and communicate with all employees, either directly or indirectly. ,
• Putting in place the enabling systems and working environment geared towards the maximisation of advancement of persons from designate groups.
Employee Participation
Employee participation is encouraged by putting best practices in place to foster good and co-operative relationships and
employee participation at all levels of the organisation. Union representation, staff meetings, focus groups and task teams are all
instrumental in facilitating participation.
Code of Conduct
A Code of Conduct that applies to all staff members has been implemented. . The Code of Conduct facilitates sound business
ethics in the Institute and plays an important role in defining the organisational culture and in governing effective discipline
within the Institute. It is a standard annexure to all letters of appointment to ensure that new staff members are informed.
A Code of Conduct for Board members has also been developed, approved and implemented and all Board members are subject
to the Code.
Delegation of Authority
The Board approved the Delegations of Authority Framework for effective operational purposes.

ANNUAL REPORT78 20142015
SOUTH AFRICAN NATIONAL BIODIVERSITY INSTITUTEANNUAL FINANCIAL STATEMENTS for the year ended 31 March 2015
corporate governance stateMent (continued)
Supply Chain Management
During this financial year, the Institute updated and aligned all procurement systems, policies, processes and practices with PFMA
and Treasury prescripts on Supply Chain Management. SANBI complied with the reporting requirements of the Department of
Environmental Affairs and National Treasury by regularly reporting on the supply chain management system, processes, and
procedures.
Conflict of Interest
As part of the appointment protocol, all new staff members of the Institute are obliged to complete a “Declaration on Conflict of
Interest” when they are appointed. Management sign this declaration in all meetings. The Bid Committee members also sign the
declaration in every procurement adjudication meeting.
All Board members are, in keeping with the PFMA, required to complete a “Disclosure of Interest” declaration, annually and at every
Board and Sub-Committee meetings.
Legislative Framework
The Institute, being a Section 3A Public Entity, has to comply with a number of laws, including:
• National Environmental Management: Biodiversity Act No. 10 of 2004
• Labour Relations Act No. 66 of 1995
• Basic Conditions of Employment Act No. 75 of 1997
• Employment Equity Act No. 55 of 1998
• Skills Development Act No.97 of 1998
• Skills Development Levies Act No No.9 of 1999
• Public Finance Management Act No. 1 of 1999 (PMFA)
• Occupational Health and Safety Act No. 85 of 1993
• generally Recognised Accounting Practice (gRAP)
• Compensation for Occupational Injuries and Diseases Act No. 130 of 1993
• Promotion of Access to Information Act No. 2 of 2000.
Dr. Tanya AbrahamseChief Executive Officer: SANBI
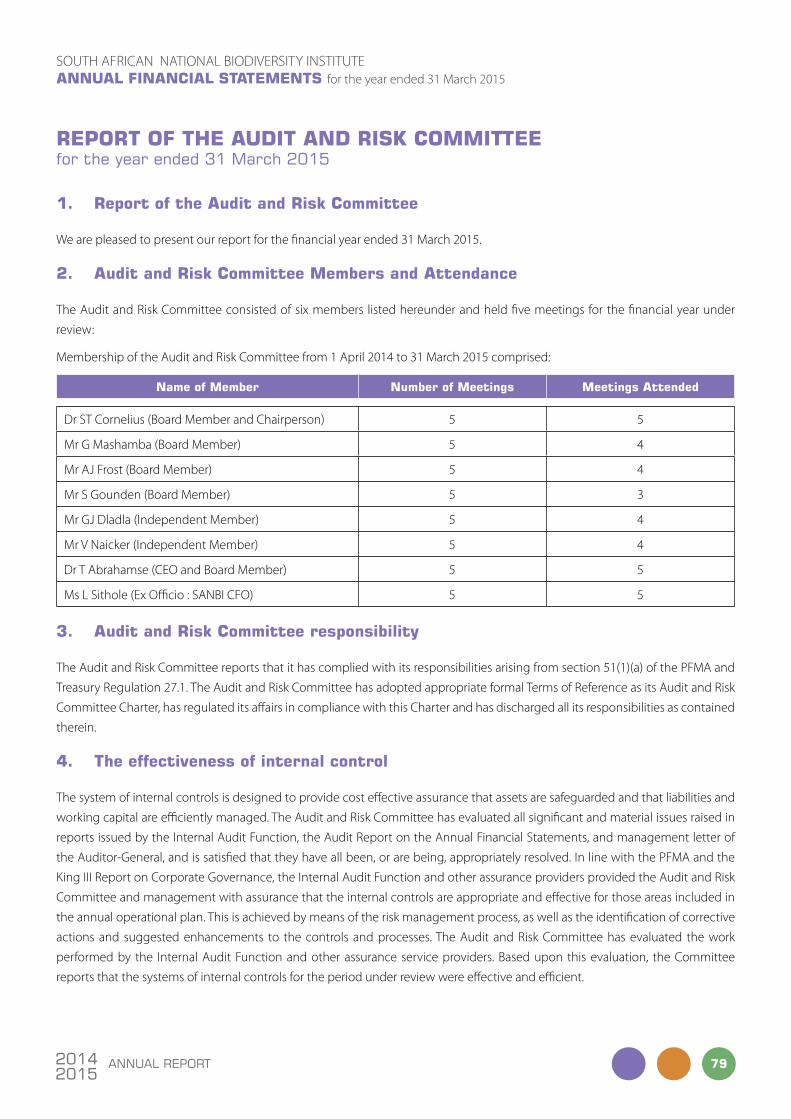
79ANNUAL REPORT20142015
SOUTH AFRICAN NATIONAL BIODIVERSITY INSTITUTEANNUAL FINANCIAL STATEMENTS for the year ended 31 March 2015
report oF tHe audit and risK coMMittee for the year ended 31 march 2015
1. report of the audit and risk committee
We are pleased to present our report for the financial year ended 31 March 2015.
2. audit and risk committee Members and attendance
The Audit and Risk Committee consisted of six members listed hereunder and held five meetings for the financial year under
review:
Membership of the Audit and Risk Committee from 1 April 2014 to 31 March 2015 comprised:
name of Member number of Meetings Meetings attended
Dr ST Cornelius (Board Member and Chairperson) 5 5
Mr g Mashamba (Board Member) 5 4
Mr AJ Frost (Board Member) 5 4
Mr S gounden (Board Member) 5 3
Mr gJ Dladla (Independent Member) 5 4
Mr v Naicker (Independent Member) 5 4
Dr T Abrahamse (CEO and Board Member) 5 5
Ms L Sithole (Ex Officio : SANBI CFO) 5 5
3. audit and risk committee responsibility
The Audit and Risk Committee reports that it has complied with its responsibilities arising from section 51(1)(a) of the PFMA and
Treasury Regulation 27.1. The Audit and Risk Committee has adopted appropriate formal Terms of Reference as its Audit and Risk
Committee Charter, has regulated its affairs in compliance with this Charter and has discharged all its responsibilities as contained
therein.
4. the effectiveness of internal control
The system of internal controls is designed to provide cost effective assurance that assets are safeguarded and that liabilities and
working capital are efficiently managed. The Audit and Risk Committee has evaluated all significant and material issues raised in
reports issued by the Internal Audit Function, the Audit Report on the Annual Financial Statements, and management letter of
the Auditor-general, and is satisfied that they have all been, or are being, appropriately resolved. In line with the PFMA and the
King III Report on Corporate governance, the Internal Audit Function and other assurance providers provided the Audit and Risk
Committee and management with assurance that the internal controls are appropriate and effective for those areas included in
the annual operational plan. This is achieved by means of the risk management process, as well as the identification of corrective
actions and suggested enhancements to the controls and processes. The Audit and Risk Committee has evaluated the work
performed by the Internal Audit Function and other assurance service providers. Based upon this evaluation, the Committee
reports that the systems of internal controls for the period under review were effective and efficient.
ANNUAL REPORT80 20142015
SOUTH AFRICAN NATIONAL BIODIVERSITY INSTITUTEANNUAL FINANCIAL STATEMENTS for the year ended 31 March 2015
report oF tHe audit and risK coMMittee for the year ended 31 march 2015 (continued)
The work performed by the outsourced internal audit was based on an approved risk-based internal audit plan for the year under
review. The internal audit function conducted the following reviews during the 2014/2015 financial year:
• Human Capital Management Review;
• Funding sustainability (going Concern Review);
• Supply Chain Management;
• IT general Controls Review;
• Financial Disciplinary Review;
• Performance against objectives; and
• Enterprise Risk Management Review.
With the exception of the matter reported below, we are satisfied with the evaluation of the internal control environment as
communicated to us, and having consideration for the entity’s action plans to remedy the reported weaknesses..
The audit conducted within the Information Technology area highlighted a number of weaknesses which were addressed by
31 March 2015. Overall, the IT controls had significantly improved in terms of design from a rating of “significant improvement
needed” to “limited improvement needed”. We are confident management’s action plan to improve the control environment will
address the remaining reported findings.
5. evaluation of Financial statements
The Audit and Risk Committee is satisfied with the content and quality of monthly and quarterly reports prepared and issued by
the Accounting Officer and entity during the year under review.
The Audit and Risk Committee has:
a. Reviewed and discussed the audited annual financial statements to be included in the annual report with the Office of the
Auditor-general and the Accounting Officer;
b. Reviewed the Auditor-general’s management letter and management’s response thereto;
c. Reviewed accounting policies; and
d. Reviewed significant adjustments resulting from the audit.
The Audit and Risk Committee concurs and accepts the Auditor-general’s conclusions on the annual financial statements and is of
the opinion that the audited annual financial statements be accepted and read together with the report of the Auditor-general.
Dr. S.T. CorneliusChairperson: Audit and Risk Committee

81ANNUAL REPORT20142015
soutH aFrican national biodiversity instituteannual financial statements for the year ended 31 march 2015
London plane avenue
ANNUAL REPORT82 20142015
SOUTH AFRICAN NATIONAL BIODIVERSITY INSTITUTEANNUAL FINANCIAL STATEMENTS for the year ended 31 March 2015
general inForMation
Country of incorporation and domicile South Africa
Controlling entity Department of Environmental Affairs
Auditors Auditor-general South Africa
Nature of business and principal activities Biodiversity richness - to champion the exploration, conversation, sustainable use, appreciation and enjoyment of South Africa’s exceptionally rich biodiversity for all people
Members Ms ME Magomola (Board Chairperson)
Dr T Abrahamse (Chief Executive Officer)
Dr ST Cornelius
Mr T Frost
Mr S gounden
Mr g Mashamba
Dr JM Matjila
Mr F Mketeni
Ms NN Mnqeta
Ms BD Ngidi
Dr K Badenhorst
Prof CT Chimimba
Mr Jg Dladla
Mr vK Naiker
Dr S Liphadzi
Registered office 2 Cussonia Avenue
Brummeria
Pretoria
0002
Postal address Private Bag X101
Silverton
0184
Bankers Nedbank Limited
ABSA Limited

83ANNUAL REPORT20142015
SOUTH AFRICAN NATIONAL BIODIVERSITY INSTITUTEANNUAL FINANCIAL STATEMENTS for the year ended 31 March 2015
index
Report of the Auditor general 84
Statement of Financial Position 88
Statement of Financial Performance 89
Statement of Changes in Net Assets 90
Cash Flow Statement 91
Statement of Comparison of Budget and Actual Amounts 92-93
Accounting Policies 94-113
Notes to the Annual Financial Statements 114-146
The following supplementary information does not form part of the annual financial statements and is unaudited:
Annexure A 147-148
The annual financial statements set out on pages 84 to 148, which have been prepared on the going concern basis, were approved by the accounting authority on 28 May 2015 and were signed on its behalf by:
Ms ME Magomola (Board Chairperson)
Dr T Abrahamse (Chief Executive Officer)

ANNUAL REPORT84 20142015
SOUTH AFRICAN NATIONAL BIODIVERSITY INSTITUTEANNUAL FINANCIAL STATEMENTS for the year ended 31 March 2015
report on tHe Financial stateMents
introduction
1. I have audited the financial statements of the South African National Biodiversity Institute (SANBI) set out on pages 84
to 146, which comprise the statement of financial position as at 31 March 2015 , the statement of financial performance,
statement of changes in net assets, cash flow statement and the statement of comparison of budget information with
actual information for the year then ended, as well as the notes, comprising a summary of significant accounting policies
and other explanatory information.
accounting authority’s responsibility for the financial statements
2. The accounting authority is responsible for the preparation and fair presentation of these financial statements in accordance
with South African Standards of generally Recognised Accounting Practice (SA Standards of gRAP) and the requirements
of the Public Finance Management Act of South Africa, 1999 (Act No.1 of 1999) (PFMA), and for such internal control as the
accounting authority determines is necessary to enable the preparation of financial statements that are free from material
misstatement, whether due to fraud or error.
auditor-general’s responsibility
3. My responsibility is to express an opinion on these financial statements based on my audit. I conducted my audit in
accordance with International Standards on Auditing. Those standards require that I comply with ethical requirements, and
plan and perform the audit to obtain reasonable assurance about whether the financial statements are free from material
misstatement.
4. An audit involves performing procedures to obtain audit evidence about the amounts and disclosures in the financial
statements. The procedures selected depend on the auditor’s judgement, including the assessment of the risks of material
misstatement of the financial statements, whether due to fraud or error. In making those risk assessments, the auditor
considers internal control relevant to the entity’s preparation and fair presentation of the financial statements in order
to design audit procedures that are appropriate in the circumstances, but not for the purpose of expressing an opinion
on the effectiveness of the entity’s internal control. An audit also includes evaluating the appropriateness of accounting
policies used and the reasonableness of accounting estimates made by management, as well as evaluating the overall
presentation of the financial statements.
5. I believe that the audit evidence I have obtained is sufficient and appropriate to provide a basis for my audit opinion.
opinion
6. In my opinion, the financial statements present fairly, in all material respects, the financial position of SANBI as at
31 March 2015 and its financial performance and cash flows for the year then ended, in accordance with SA Standards of
gRAP and the requirements of the PFMA.
report oF tHe auditor general to parliaMent on tHe soutH aFrican national biodiversity institute

85ANNUAL REPORT20142015
SOUTH AFRICAN NATIONAL BIODIVERSITY INSTITUTEANNUAL FINANCIAL STATEMENTS for the year ended 31 March 2015
emphasis of matters
7. I draw attention to the matters below. My opinion is not modified in respect of these matters.
restatement of corresponding figures
8. As disclosed in notes 27, 29 and 30 to the financial statements, the corresponding figures for 31 March 2014 have been
restated as a result of errors discovered during the 2014-15 financial year in the financial statements of the entity at, and
for the year ended, 31 March 2015.
report on other legal and regulatory requirements
9. In accordance with the Public Audit Act of South Africa, 2004 (Act No. 25 of 2004) (PAA) and the general notice issued in
terms thereof, I have a responsibility to report findings on the reported performance information against predetermined
objectives for selected programmes presented in the annual performance report, non-compliance with legislation and
internal control. The objective of my tests was to identify reportable findings as described under each subheading but not
to gather evidence to express assurance on these matters. Accordingly, I do not express an opinion or conclusion on these
matters.
Predetermined objectives
10. I performed procedures to obtain evidence about the usefulness and reliability of the reported performance information
for the following selected programmes presented in the annual performance report of the entity for the year ended
31 March 2015:
– Programme 2: Manage and unblock benefits of the network of national botanical gardens on page 52
– Programme 5: Provide biodiversity and climate change adaptation policy tools and advice in support of South African development on page 58
– Programme 6: Drive human capital development, education and awareness in response to SANBI’s mandate on page 62
11. I evaluated the reported performance information against the overall criteria of usefulness and reliability.
12. I evaluated the usefulness of the reported performance information to determine whether it was presented in accordance
with the National Treasury’s annual reporting principles and whether the reported performance was consistent with the
planned programmes. I further performed tests to determine whether indicators and targets were well defined, verifiable,
specific, measurable, time bound and relevant, as required by the National Treasury’s Framework for managing programme performance information.
13. I assessed the reliability of the reported performance information to determine whether it was valid, accurate and complete.
report oF tHe auditor general to parliaMent on tHe soutH aFrican national biodiversity institute (continued)

ANNUAL REPORT86 20142015
SOUTH AFRICAN NATIONAL BIODIVERSITY INSTITUTEANNUAL FINANCIAL STATEMENTS for the year ended 31 March 2015
report oF tHe auditor general to parliaMent on tHe soutH aFrican national biodiversity institute (continued)
14. I did not identify any material findings on the usefulness and reliability of the reported performance information for the
following programmes:
– Programme 2: Manage and unblock benefits of the network of national botanical gardens
– Programme 5: Provide biodiversity and climate change adaptation policy tools and advice in support of South African development
– Programme 6: Drive human capital development, education and awareness in response to SANBI’s mandate
additional matters
15. Although I identified no material findings on the usefulness and reliability of the reported performance information for the
selected programmes, I draw attention to the following matters:
achievement of planned targets
16. Refer to the annual performance report on pages 50 to 63 for information on the achievement of planned targets for the
year.
adjustment of material misstatements
17. I identified material misstatements in the annual performance report submitted for auditing on the reported performance
information for programme 2: Manage and unblock benefits of the network of national botanical gardens, programme
5: Provide biodiversity and climate change adaptation policy tools and advice in support of South African development
and programme 6: Drive human capital development, education and awareness in response to SANBI’s mandate. As
management subsequently corrected the misstatements I did not identify any material findings on the usefulness and
reliability of the reported performance information.
Compliance with legislation
18. I performed procedures to obtain evidence that the entity had complied with applicable legislation regarding financial
matters, financial management and other related matters. My findings on material non-compliance with specific matters
in key legislation, as set out in the general notice issued in terms of the PAA, are as follows:
Financial statements
19. The financial statements submitted for auditing were not prepared in accordance with the prescribed financial reporting
framework as required by section 55(1) (b) of the PFMA. Material misstatements of disclosure items identified by the
auditors in the submitted financial statements were subsequently corrected, resulting in the financial statements receiving

87ANNUAL REPORT20142015
SOUTH AFRICAN NATIONAL BIODIVERSITY INSTITUTEANNUAL FINANCIAL STATEMENTS for the year ended 31 March 2015
an unqualified audit opinion.
internal control
20. I considered internal control relevant to my audit of the financial statements, performance report and compliance with
legislation. The matter reported below are limited to the significant internal control deficiencies that resulted in the findings
on non-compliance with legislation included in this report.
Financial and performance management
21. Management did not adequately review the annual financial statements to ensure that the disclosures were fairly presented
as well as supported and evidenced by reliable information, as material misstatements were identified in the financial
statement disclosures.
Cape Town29 July 2015
report oF tHe auditor general to parliaMent on tHe soutH aFrican national biodiversity institute (continued)

ANNUAL REPORT88 20142015
SOUTH AFRICAN NATIONAL BIODIVERSITY INSTITUTEANNUAL FINANCIAL STATEMENTS for the year ended 31 March 2015
stateMent oF Financial position as at 31 MarcH 2015
Figures in rand note(s) 2015 2014
assetscurrent assets
Biological assets 3 1 934 871 628 767
Operating lease asset 163 901 -
Receivables from exchange transactions 4 3 540 723 2 956 319
Cash and cash equivalents 5 277 902 420 197 819 263
283 541 915 201 404 349
non-current assets
Investment property 6 71 599 873 72 793 971
Property, plant and equipment 7 147 874 200 129 384 478
Intangible assets 8 4 259 166 4 068 047
Heritage assets 9 14 832 262 14 832 262
238 565 501 221 078 758
Total Assets 522 107 416 422 483 107
liabilitiescurrent liabilities
Payables from exchange transactions 10 75 436 882 58 771 573
Unspent committed project funds 11 165 043 957 105 726 069
Provisions 12 3 052 580 3 025 770
243 533 419 167 523 412
non-current liabilities
Employee benefit obligation 13 22 088 000 25 390 000
Total Liabilities 265 621 419 192 913 411
Net Assets 256 485 997 229 569 696
Accumulated surplus 256 485 997 229 569 695
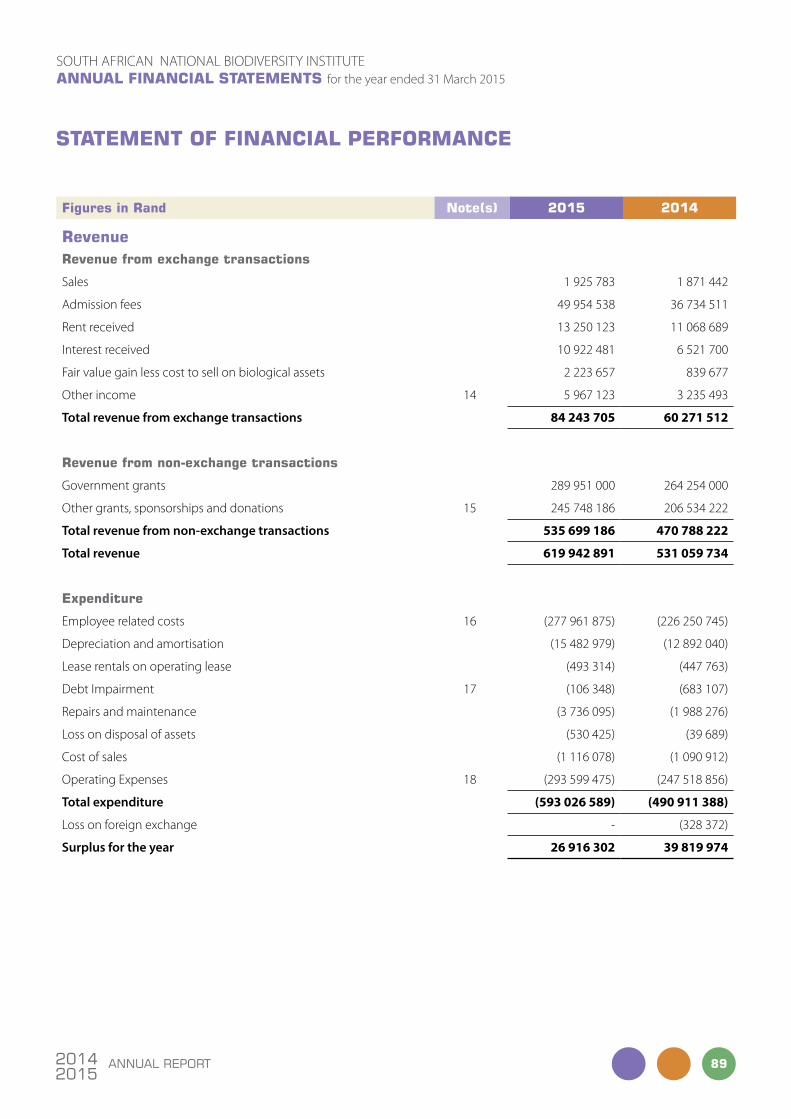
89ANNUAL REPORT20142015
SOUTH AFRICAN NATIONAL BIODIVERSITY INSTITUTEANNUAL FINANCIAL STATEMENTS for the year ended 31 March 2015
stateMent oF Financial perForMance
Figures in rand note(s) 2015 2014
revenuerevenue from exchange transactions
Sales 1 925 783 1 871 442
Admission fees 49 954 538 36 734 511
Rent received 13 250 123 11 068 689
Interest received 10 922 481 6 521 700
Fair value gain less cost to sell on biological assets 2 223 657 839 677
Other income 14 5 967 123 3 235 493
Total revenue from exchange transactions 84 243 705 60 271 512
revenue from non-exchange transactions
government grants 289 951 000 264 254 000
Other grants, sponsorships and donations 15 245 748 186 206 534 222
Total revenue from non-exchange transactions 535 699 186 470 788 222
Total revenue 619 942 891 531 059 734
expenditure
Employee related costs 16 (277 961 875) (226 250 745)
Depreciation and amortisation (15 482 979) (12 892 040)
Lease rentals on operating lease (493 314) (447 763)
Debt Impairment 17 (106 348) (683 107)
Repairs and maintenance (3 736 095) (1 988 276)
Loss on disposal of assets (530 425) (39 689)
Cost of sales (1 116 078) (1 090 912)
Operating Expenses 18 (293 599 475) (247 518 856)
Total expenditure (593 026 589) (490 911 388)
Loss on foreign exchange - (328 372)
Surplus for the year 26 916 302 39 819 974

ANNUAL REPORT90 20142015
SOUTH AFRICAN NATIONAL BIODIVERSITY INSTITUTEANNUAL FINANCIAL STATEMENTS for the year ended 31 March 2015
stateMent oF cHanges in net assets
Figures in rand accumulated surplus
total net assets
Balance at 01 April 2013 189 749 721 189 749 721
Changes in net assets
Surplus for the year 39 819 974 39 819 974
Total changes 39 819 975 39 819 975
Balance at 01 April 2014 229 569 695 229 569 695
Changes in net assets
Surplus for the year 26 916 302 26 916 302
Total changes 26 916 302 26 916 302
Balance at 31 March 2015 256 485 997 256 485 997

91ANNUAL REPORT20142015
SOUTH AFRICAN NATIONAL BIODIVERSITY INSTITUTEANNUAL FINANCIAL STATEMENTS for the year ended 31 March 2015
casH Flow stateMent
Figures in rand note(s) 2015 2014
cash flows from operating activitiesreceipts
government grants 289 951 000 264 254 000
Other grants, sponsorships and donations 305 066 072 251 987 829
Commercial and other income 81 165 397 59 032 419
676 182 469 575 274 248
payments
Employee costs (281 237 065) (248 742 443)
Suppliers and other payments (281 362 101) (243 201 912)
(562 599 166) (491 944 355)
Net cash flows from operating activities 20 113 583 303 83 329 893
cash flows from investing activitiesPurchase of property, plant and equipment 7 (29 299 217) (23 135 306)
Proceeds from sale of property, plant and equipment 7 24 419 374 116
Purchase of investment property 6 (1 050 005) -
Purchase of other intangible assets 8 (3 175 343) (1 464 431)
Net cash flows from investing activities (33 500 146) (24 225 621)
Net increase/(decrease) in cash and cash equivalents 80 083 157 59 104 272
Cash and cash equivalents at the beginning of the year 197 819 263 138 714 991
Cash and cash equivalents at the end of the year 5 277 902 420 197 819 263

ANNUAL REPORT92 20142015
SOUTH AFRICAN NATIONAL BIODIVERSITY INSTITUTEANNUAL FINANCIAL STATEMENTS for the year ended 31 March 2015
stateMent oF coMparison oF budget and actual aMounts
budget on cash basis
Figures in rand approved budget adjustments Final budget
actual amounts on comparable
basis
difference between
final budget and actual
statement of Financial performancerevenuerevenue from exchange transactions
Sales 600 000 - 600 000 1 925 783 1 325 783
Admission fees 33 000 000 - 33 000 000 49 954 538 16 954 538
Rent received 11 000 000 - 11 000 000 12 395 471 1 395 471
Interest received 2 939 420 - 2 939 420 10 922 481 7 983 061
Other income 3 811 586 - 3 811 586 5 967 123 2 155 537
Proceeds on disposal of assets - - - 24 419 24 419
Total revenue from exchange transactions 51 351 006 - 51 351 006 81 189 815 29 838 809
revenue from non-exchange transactionsgovernment grants 291 207 000 - 291 207 000 289 951 000 (1 256 000)
Other grants, sponsorships and donations
324 286 202 - 324 286 202 305 066 072 (19 220 130)
Total revenue from non-exchange transactions 615 493 202 - 615 493 202 595 017 072 (20 476 130)
Total revenue 666 844 208 - 666 844 208 676 206 887 9 362 679
-
expenditureEmployee related costs (300 628 434) - (300 628 434) (281 237 065) 19 391 369
Lease rentals on operating lease (460 000) - (460 000) (493 314) (33 314)
Repairs and maintenance (4 100 000) - (4 100 000) (3 736 095) 363 905
Cost of sales (1 000 000) - (1 000 000) (198 525) 801 475
Operating expenses (343 547 322) - (343 547 322) (310 458 732) 33 088 590
Total expenditure (649 735 756) - (649 735 756) (596 123 731) 53 612 025
Surplus before taxation 17 108 452 - 17 108 452 80 083 156 62 974 704
Actual Amount on Comparable Basis as Presented in the Budget and Actual Comparative Statement 17 108 452 - 17 108 452 80 083 156 62 974 704

93ANNUAL REPORT20142015
SOUTH AFRICAN NATIONAL BIODIVERSITY INSTITUTEANNUAL FINANCIAL STATEMENTS for the year ended 31 March 2015
stateMent oF coMparison oF budget and actual aMounts
budget on cash basis
Figures in rand approved budget adjustments Final budget
actual amounts on comparable
basis
difference between
final budget and actual
reconciliationbasis difference
Depreciation and amorisation (15 482 979)
Loss on sale of assets (530 425)
Non cash items 4 638 845
timing difference
Capital expenditure 33 524 565
Unspent project committed funds
(59 317 886)
Adjustments for accrual basis accounting entries
(15 998 974)
Actual Amount in the Statement of Financial Performance 26 916 302
Reasons for material variances between budget and actuals amounts are detailed in Note 23.
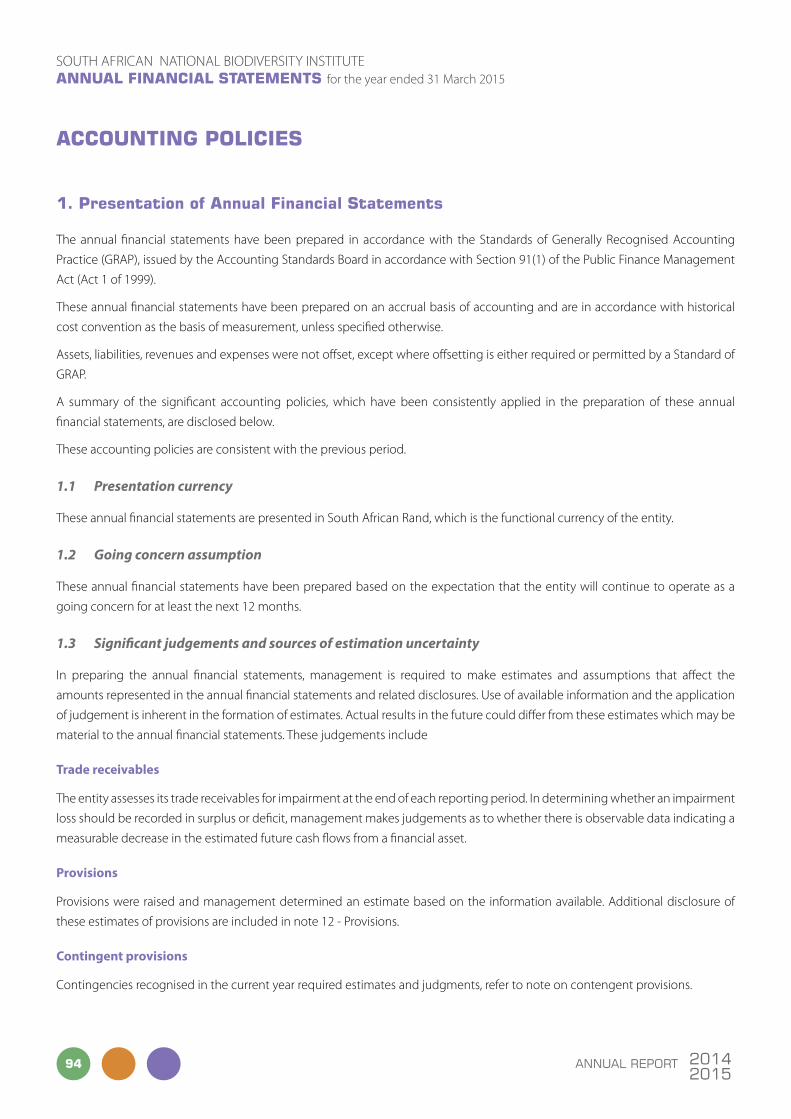
ANNUAL REPORT94 20142015
SOUTH AFRICAN NATIONAL BIODIVERSITY INSTITUTEANNUAL FINANCIAL STATEMENTS for the year ended 31 March 2015
ACCoUNTINg poLICIES
1. presentation of annual Financial statements
The annual financial statements have been prepared in accordance with the Standards of generally Recognised Accounting
Practice (gRAP), issued by the Accounting Standards Board in accordance with Section 91(1) of the Public Finance Management
Act (Act 1 of 1999).
These annual financial statements have been prepared on an accrual basis of accounting and are in accordance with historical
cost convention as the basis of measurement, unless specified otherwise.
Assets, liabilities, revenues and expenses were not offset, except where offsetting is either required or permitted by a Standard of
gRAP.
A summary of the significant accounting policies, which have been consistently applied in the preparation of these annual
financial statements, are disclosed below.
These accounting policies are consistent with the previous period.
1.1 Presentation currency
These annual financial statements are presented in South African Rand, which is the functional currency of the entity.
1.2 Going concern assumption
These annual financial statements have been prepared based on the expectation that the entity will continue to operate as a
going concern for at least the next 12 months.
1.3 Significant judgements and sources of estimation uncertainty
In preparing the annual financial statements, management is required to make estimates and assumptions that affect the
amounts represented in the annual financial statements and related disclosures. Use of available information and the application
of judgement is inherent in the formation of estimates. Actual results in the future could differ from these estimates which may be
material to the annual financial statements. These judgements include
Trade receivables
The entity assesses its trade receivables for impairment at the end of each reporting period. In determining whether an impairment
loss should be recorded in surplus or deficit, management makes judgements as to whether there is observable data indicating a
measurable decrease in the estimated future cash flows from a financial asset.
Provisions
Provisions were raised and management determined an estimate based on the information available. Additional disclosure of
these estimates of provisions are included in note 12 - Provisions.
Contingent provisions
Contingencies recognised in the current year required estimates and judgments, refer to note on contengent provisions.

95ANNUAL REPORT20142015
SOUTH AFRICAN NATIONAL BIODIVERSITY INSTITUTEANNUAL FINANCIAL STATEMENTS for the year ended 31 March 2015
ACCoUNTINg poLICIES
1.3 Significant judgements and sources of estimation uncertainty (continued)
Post retirement benefits
The present value of the post retirement obligation depends on a number of factors that are determined on an actuarial basis
using a number of assumptions. The assumptions used in determining the net cost (income) include the discount rate. Any
changes in these assumptions will impact on the carrying amount of post retirement obligations.
The cost of defined benefit pension plans and other post employment medical benefits as well as the present value of the
pension obligation is determined using actuarial valuations. The actuarial valuation involves making assumptions about discount
rates, expected rates of return of assets, future salary increases, mortality rates and future pension increases. All assumptions
are reviewed at each reporting date. In determining the appropriate discount rate management considers the interest rates of
corporate bonds in the respective country with an AAA or AA rating. The mortality rate is based on publicly available mortality
tables for the specific country.
Future salary increases and pension increases are based on expected future inflation rates for the specific country.
Other key assumptions for pension obligations are based on current market conditions. Additional information is disclosed in
Note 13.
Effective interest rate
The entity used the prime interest rate to discount future cash flows.
Allowance for doubtful debts
On debtors an impairment loss is recognised in surplus and deficit when there is objective evidence that it is impaired. The
impairment is measured as the difference between the debtors carrying amount and the present value of estimated future cash
flows discounted at the effective interest rate, computed at initial recognition.
1.4 Biological assets
The entity recognises a biological asset or agricultural produce when, and only when:
• the entity controls the asset as a result of past events;
• it is probable that future economic benefits or service potential associated with the asset will flow to the entity; and
• the fair value or cost of the asset can be measured reliably.
Biological assets are measured at their fair value less costs to sell.
A gain or loss arising on initial recognition of biological asset or agricultural produce at fair value less costs to sell and from a
change in fair value less costs to sell of a biological asset is included in surplus or deficit for the period in which it arises.
Where market determined prices or values are not available, the present value of the expected net cash inflows from the asset,
discounted at a current market-determined pre-tax rate where applicable is used to determine fair value.

ANNUAL REPORT96 20142015
SOUTH AFRICAN NATIONAL BIODIVERSITY INSTITUTEANNUAL FINANCIAL STATEMENTS for the year ended 31 March 2015
ACCoUNTINg poLICIES
1.5 Investment property
Investment property is property (land or a building - or part of a building - or both) held to earn rentals or for capital appreciation
or both, rather than for:
• use in the production or supply of goods or services or for
• administrative purposes, or
• sale in the ordinary course of operations.
Investment property is recognised as an asset when, it is probable that the future economic benefits or service potential that
are associated with the investment property will flow to the entity, and the cost or fair value of the investment property can be
measured reliably.
Investment property is initially recognised at cost. Transaction costs are included in the initial measurement.
Where investment property is acquired through a non-exchange transaction, its cost is its fair value as at the date of acquisition.
Costs include costs incurred initially and costs incurred subsequently to add to, or to replace a part of, or service a property.
If a replacement part is recognised in the carrying amount of the investment property, the carrying amount of the replaced part
is derecognised.
Cost model
Investment property is carried at cost less accumulated depreciation and any accumulated impairment losses.
Depreciation is provided to write down the cost, less estimated residual value by equal installments over the useful life of
the property, which is as follows:
Item Useful life
Property - buildings 40 years
Investment property is derecognised on disposal or when the investment property is permanently withdrawn from use and no
future economic benefits or service potential are expected from its disposal.
gains or losses arising from the retirement or disposal of investment property is the difference between the net disposal proceeds
and the carrying amount of the asset and is recognised in surplus or deficit in the period of retirement or disposal.
Compensation from third parties for investment property that was impaired, lost or given up is recognised in surplus or deficit
when the compensation becomes receivable.

97ANNUAL REPORT20142015
SOUTH AFRICAN NATIONAL BIODIVERSITY INSTITUTEANNUAL FINANCIAL STATEMENTS for the year ended 31 March 2015
ACCoUNTINg poLICIES
1.6 Property, plant and equipment
Property, plant and equipment are tangible non-current assets (including infrastructure assets) that are held for use in the
production or supply of goods or services, rental to others, or for administrative purposes, and are expected to be used during
more than one reporting period.
The cost of an item of property, plant and equipment is recognised as an asset when:
• it is probable that future economic benefits or service potential associated with the item will flow to the entity; and
• the cost or fair value of the item can be measured reliably.
Property, plant and equipment is initially measured at cost.
The cost of an item of property, plant and equipment is the purchase price and other costs attributable to bring the asset to the
location and condition necessary for it to be capable of operating in the manner intended by management. Trade discounts and
rebates are deducted in arriving at the cost.
Where an asset is acquired through a non-exchange transaction, its cost is its fair value as at date of acquisition.
Where an item of property, plant and equipment is acquired in exchange for a non-monetary asset or assets, or a combination of
assets and non-monetary assets, the asset acquired is initially measured at fair value (the cost). If the acquired item’s fair value was
not determinable, it’s deemed cost is the carrying amount of the asset(s) given up.
The initial estimate of the costs of dismantling and removing the item and restoring the site on which it is located is also included
in the cost of property, plant and equipment, where the entity is obligated to incur such expenditure, and where the obligation
arises as a result of acquiring the asset or using it for purposes other than the production of inventories.
Recognition of costs in the carrying amount of an item of property, plant and equipment ceases when the item is in the location
and condition necessary for it to be capable of operating in the manner intended by management.
Property, plant and equipment is carried at cost less accumulated depreciation and any impairment losses.
Property, plant and equipment are depreciated on the straight line basis over their expected useful lives to their estimated residual
value.
The useful lives of items of property, plant and equipment have been assessed as follows:
Item Average useful life
Buildings 40 years
Motor vehicles 5 - 10 years
Operational equipment
• Office equipment, furniture and fittings, machinery 5 - 10 years
• IT equipment 3 - 8 years
The residual value, the useful life and depreciation method of each asset are reviewed at least at of each reporting date. If the
expectations differ from previous estimates, the change is accounted for as a change in accounting estimate.
Reviewing the useful life of an asset on an annual basis does not require the entity to amend the previous estimate unless
expectations differ from the previous estimate.
ANNUAL REPORT98 20142015
SOUTH AFRICAN NATIONAL BIODIVERSITY INSTITUTEANNUAL FINANCIAL STATEMENTS for the year ended 31 March 2015
ACCoUNTINg poLICIES
1.6 Property, plant and equipment (continued)
The depreciation charge for each period is recognised in surplus or deficit unless it is included in the carrying amount of another
asset.
Items of property, plant and equipment are derecognised when the asset is disposed of or when there are no further economic
benefits or service potential expected from the use or disposal of the asset.
The gain or loss arising from the derecognition of an item of property, plant and equipment is included in surplus or deficit
when the item is derecognised. The gain or loss arising from the derecognition of an item of property, plant and equipment is
determined as the difference between the net disposal proceeds, if any, and the carrying amount of the item.
1.7 Intangible assets
An asset is identifiable if it either:
• is separable, i.e. is capable of being separated or divided from an entity and sold, transferred, licensed, rented or exchanged, either individually or together with a related contract, identifiable assets or liability, regardless of whether the entity intends to do so; or
• arises from binding arrangements (including rights from contracts), regardless of whether those rights are transferable or separable from the entity or from other rights and obligations.
An intangible asset is recognised when:
• it is probable that the expected future economic benefits or service potential that are attributable to the asset will flow to the entity; and
• the cost or fair value of the asset can be measured reliably.
The entity assesses the probability of expected future economic benefits or service potential using reasonable and supportable
assumptions that represent management’s best estimate of the set of economic conditions that will exist over the useful life of
the asset.
Where an intangible asset is acquired through a non-exchange transaction, its initial cost at the date of acquisition is measured at
its fair value as at that date.
Expenditure on research (or on the research phase of an internal project) is recognised as an expense when it is incurred.
After initial recognition an intangible asset shall be carried at cost less any accumulated amortisation and impairment losses.
The amortisation period and the amortisation method for intangible assets are reviewed at least at each reporting date.
Internally generated brands, mastheads, publishing titles, customer lists and items similar in substance are not recognised as
intangible assets.
Internally generated goodwill is not recognised as an intangible asset.
Amortisation is provided to write down the intangible assets, on a straight line basis, to their residual values as follows:
Item Useful life
Computer software 3 - 8 years

99ANNUAL REPORT20142015
SOUTH AFRICAN NATIONAL BIODIVERSITY INSTITUTEANNUAL FINANCIAL STATEMENTS for the year ended 31 March 2015
ACCoUNTINg poLICIES
1.8 Heritage assets
Assets are resources controlled by an entity as a result of past events and from which future economic benefits or service potential are expected to flow to the entity.
Carrying amount is the amount at which an asset is recognised after deducting accumulated impairment losses.
Class of heritage assets means a grouping of heritage assets of a similar nature or function in an entity’s operations that is shown as a single item for the purpose of disclosure in the annual financial statements.
Cost is the amount of cash or cash equivalents paid or the fair value of the other consideration given to acquire an asset at the time of its acquisition or construction or, where applicable, the amount attributed to that asset when initially recognised in accordance with the specific requirements of other Standards of gRAP.
Heritage assets are assets that have a cultural, environmental, historical, natural, scientific, technological or artistic significance and
are held indefinitely for the benefit of present and future generations.
Recognition
The entity recognises a heritage asset as an asset if it is probable that future economic benefits or service potential associated with
the asset will flow to the entity, and the cost or fair value of the asset can be measured reliably.
Initial measurement
Heritage assets are measured at cost.
Where a heritage asset is acquired through a non-exchange transaction, its cost is measured at its fair value as at the date of
acquisition.
Subsequent measurement
After recognition as an asset, a class of heritage assets is carried at its cost less any accumulated impairment losses.
Impairment
The entity assess at each reporting date whether there is an indication that it may be impaired. If any such indication exists, the
entity estimates the recoverable amount or the recoverable service amount of the heritage asset.
Transfers
Transfers from heritage assets are only made when the particular asset no longer meets the definition of a heritage asset.
Transfers to heritage assets are only made when the asset meets the definition of a heritage asset.
Derecognition
The entity derecognises heritage asset on disposal, or when no future economic benefits or service potential are expected from
its use or disposal.
The gain or loss arising from the derecognition of a heritage asset is determined as the difference between the net disposal proceeds, if any, and the carrying amount of the heritage asset. Such difference is recognised in surplus or deficit when the heritage asset is derecognised.

ANNUAL REPORT100 20142015
SOUTH AFRICAN NATIONAL BIODIVERSITY INSTITUTEANNUAL FINANCIAL STATEMENTS for the year ended 31 March 2015
ACCoUNTINg poLICIES
1.9 Financial instruments
A financial instrument is any contract that gives rise to a financial asset of one entity and a financial liability or a residual interest
of another entity.
Credit risk is the risk that one party to a financial instrument will cause a financial loss for the other party by failing to discharge
an obligation.
Currency risk is the risk that the fair value or future cash flows of a financial instrument will fluctuate because of changes in foreign
exchange rates.
Derecognition is the removal of a previously recognised financial asset or financial liability from an entity’s statement of financial
position.
Fair value is the amount for which an asset could be exchanged, or a liability settled, between knowledgeable willing parties in
an arm’s length transaction.
A financial asset is:
• cash;
• a residual interest of another entity; or
• a contractual right to:
– receive cash or another financial asset from another entity; or
– exchange financial assets or financial liabilities with another entity under conditions that are potentially favourable to the entity.
A financial liability is any liability that is a contractual obligation to:
• deliver cash or another financial asset to another entity; or
• exchange financial assets or financial liabilities under conditions that are potentially unfavourable to the entity.
Interest rate risk is the risk that the fair value or future cash flows of a financial instrument will fluctuate because of changes in
market interest rates.
Liquidity risk is the risk encountered by an entity in the event of difficulty in meeting obligations associated with financial liabilities
that are settled by delivering cash or another financial asset.
Market risk is the risk that the fair value or future cash flows of a financial instrument will fluctuate because of changes in market
prices. Market risk comprises three types of risk: currency risk, interest rate risk and other price risk.
Other price risk is the risk that the fair value or future cash flows of a financial instrument will fluctuate because of changes in
market prices (other than those arising from interest rate risk or currency risk), whether those changes are caused by factors
specific to the individual financial instrument or its issuer, or factors affecting all similar financial instruments traded in the market.
A financial asset is past due when a counterparty has failed to make a payment when contractually due.
101ANNUAL REPORT20142015
SOUTH AFRICAN NATIONAL BIODIVERSITY INSTITUTEANNUAL FINANCIAL STATEMENTS for the year ended 31 March 2015
ACCoUNTINg poLICIES
1.9 Financial instruments (continued)
A residual interest is any contract that manifests an interest in the assets of an entity after deducting all of its liabilities. A residual
interest includes contributions from owners, which may be shown as:
• equity instruments or similar forms of unitised capital;
• a formal designation of a transfer of resources (or a class of such transfers) by the parties to the transaction as forming part of an entity’s net assets, either before the contribution occurs or at the time of the contribution; or
• a formal agreement, in relation to the contribution, establishing or increasing an existing financial interest in the net assets of an entity.
Transaction costs are incremental costs that are directly attributable to the acquisition, issue or disposal of a financial asset or
financial liability. An incremental cost is one that would not have been incurred if the entity had not acquired, issued or disposed
of the financial instrument.
Financial instruments at cost are investments in residual interests that do not have a quoted market price in an active market, and
whose fair value cannot be reliably measured.
Initial recognition
The entity recognises a financial asset or a financial liability in its statement of financial position when the entity becomes a party
to the contractual provisions of the instrument.
The entity recognises financial assets using trade date accounting.
Initial measurement of financial assets and financial liabilities
The entity measures a financial asset and financial liability initially at its fair value plus transaction costs that are directly attributable
to the acquisition or issue of the financial asset or financial liability.
Subsequent measurement of financial assets and financial liabilities
The entity measures all financial assets and financial liabilities after initial recognition using the following categories:
• Financial instruments at cost.
All financial assets measured at cost, are subject to an impairment review.
Reclassification
The entity does not reclassify a financial instrument while it is issued or held unless it is:
• combined instrument that is required to be measured at fair value; or
• an investment in a residual interest that meets the requirements for reclassification.
If a reliable measure becomes available for an investment in a residual interest for which a measure was previously not available,
and the instrument would have been required to be measured at fair value, the entity reclassifies the instrument from cost to fair
value.

ANNUAL REPORT102 20142015
SOUTH AFRICAN NATIONAL BIODIVERSITY INSTITUTEANNUAL FINANCIAL STATEMENTS for the year ended 31 March 2015
ACCoUNTINg poLICIES
1.9 Financial instruments (continued)
Gains and losses
A gain or loss arising from a change in the fair value of a financial asset or financial liability measured at fair value is recognised in
surplus or deficit.
For financial assets and financial liabilities measured at amortised cost or cost, a gain or loss is recognised in surplus or deficit when
the financial asset or financial liability is derecognised or impaired, or through the amortisation process.
Derecognition
Financial assets
The entity derecognises a financial asset only when:
• the contractual rights to the cash flows from the financial asset expire, are settled or waived;
• the entity transfers to another party substantially all of the risks and rewards of ownership of the financial asset; or
• the entity, despite having retained some significant risks and rewards of ownership of the financial asset, has transferred control of the asset to another party and the other party has the practical ability to sell the asset in its entirety to an unrelated third party, and is able to exercise that ability unilaterally and without needing to impose additional restrictions on the transfer. In this case, the entity :
– derecognise the asset; and
– recognise separately any rights and obligations created or retained in the transfer.
Financial liabilities
The entity removes a financial liability (or a part of a financial liability) from its statement of financial position when it is extinguished
— i.e. when the obligation specified in the contract is discharged, cancelled, expires or waived.
Presentation
Interest relating to a financial instrument or a component that is a financial liability is recognised as revenue or expense in surplus
or deficit.
Losses and gains relating to a financial instrument or a component that is a financial liability is recognised as revenue or expense
in surplus or deficit.
A financial asset and a financial liability are only offset and the net amount presented in the statement of financial position when
the entity currently has a legally enforceable right to set off the recognised amounts and intends either to settle on a net basis, or
to realise the asset and settle the liability simultaneously.
In accounting for a transfer of a financial asset that does not qualify for derecognition, the entity does not offset the transferred
asset and the associated liability.

103ANNUAL REPORT20142015
SOUTH AFRICAN NATIONAL BIODIVERSITY INSTITUTEANNUAL FINANCIAL STATEMENTS for the year ended 31 March 2015
ACCoUNTINg poLICIES
1.10 Taxation
Tax expenses
No provision has been made for taxation as SANBI is exempt from income tax in terms of Section 10 of the Income Tax Act, 1962
(Act no. 58 of 1962).
1.11 Leases
A lease is classified as a finance lease if it transfers substantially all the risks and rewards incidental to ownership. A lease is classified
as an operating lease if it does not transfer substantially all the risks and rewards incidental to ownership.
When a lease includes both land and buildings elements, the entity assesses the classification of each element separately.
Operating leases - lessor
Operating lease revenue is recognised as revenue on a monthly basis as the higher of the minimum contractually agreed amount
or as a percentage of the lessees turnover.
Income for leases is disclosed under revenue in statement of financial performance.
Operating leases - lessee
Operating lease payments are recognised as an expense on a straight-line basis over the lease term. The difference between the
amounts recognised as an expense and the contractual payments are recognised as an operating lease asset or liability.
1.12 Impairment of cash-generating assets
Cash-generating assets are those assets held by the entity with the primary objective of generating a commercial return.
When an asset is deployed in a manner consistent with that adopted by a profit-orientated entity, it generates a commercial
return.
Impairment is a loss in the future economic benefits or service potential of an asset, over and above the systematic recognition of
the loss of the asset’s future economic benefits or service potential through depreciation (amortisation).
Carrying amount is the amount at which an asset is recognised in the statement of financial position after deducting any
accumulated depreciation and accumulated impairment losses thereon.
Recoverable amount of an asset or a cash-generating unit is the higher of its fair value less costs to sell and its value in use.
Identification
When the carrying amount of a cash-generating asset exceeds its recoverable amount, it is impaired.
The entity assesses at each reporting date whether there is any indication that a cash-generating asset may be impaired. If any
such indication exists, the entity estimates the recoverable amount of the asset.

ANNUAL REPORT104 20142015
SOUTH AFRICAN NATIONAL BIODIVERSITY INSTITUTEANNUAL FINANCIAL STATEMENTS for the year ended 31 March 2015
ACCoUNTINg poLICIES
1.12 Impairment of cash-generating assets (continued)
Value in use
When estimating the value in use of an asset, the entity estimates the future cash inflows and outflows to be derived from
continuing use of the asset and from its ultimate disposal and the entity applies the appropriate discount rate to those future cash
flows.
Basis for estimates of future cash flows
In measuring value in use the entity:
• base cash flow projections on reasonable and supportable assumptions that represent management’s best estimate of the range of economic conditions that will exist over the remaining useful life of the asset. greater weight is given to external evidence.
Recognition and measurement (individual asset)
If the recoverable amount of a cash-generating asset is less than its carrying amount, the carrying amount of the asset is reduced
to its recoverable amount. This reduction is an impairment loss.
An impairment loss is recognised immediately in surplus or deficit.
Any impairment loss of a revalued cash-generating asset is treated as a revaluation decrease.
Cash-generating units
Cash-generating units are identified consistently from period to period for the same asset or types of assets, unless a change is
justified.
The carrying amount of a cash-generating unit is determined on a basis consistent with the way the recoverable amount of the
cash-generating unit is determined.
An impairment loss is recognised for a cash-generating unit if the recoverable amount of the unit is less than the carrying amount
of the unit. The impairment is allocated to reduce the carrying amount of the cash-generating assets of the unit on a pro rata basis,
based on the carrying amount of each asset in the unit. These reductions in carrying amounts are treated as impairment losses
on individual assets.
In allocating an impairment loss, the entity does not reduce the carrying amount of an asset below the highest of:
• its fair value less costs to sell (if determinable);
• its value in use (if determinable); and
• zero.
The amount of the impairment loss that would otherwise have been allocated to the asset is allocated pro rata to the other cash-
generating assets of the unit.
Where a non-cash-generating asset contributes to a cash-generating unit, a proportion of the carrying amount of that non- cash-
generating asset is allocated to the carrying amount of the cash-generating unit prior to estimation of the recoverable amount of
the cash-generating unit.

105ANNUAL REPORT20142015
SOUTH AFRICAN NATIONAL BIODIVERSITY INSTITUTEANNUAL FINANCIAL STATEMENTS for the year ended 31 March 2015
ACCoUNTINg poLICIES
1.12 Impairment of cash-generating assets (continued)
Reversal of impairment loss
The entity assess at each reporting date whether there is any indication that an impairment loss recognised in prior periods
for a cash-generating asset may no longer exist or may have decreased. If any such indication exists, the entity estimates the
recoverable amount of that asset.
A reversal of an impairment loss for a cash-generating asset is recognised immediately in surplus or deficit.
Redesignation
The redesignation of assets from a cash-generating asset to a non-cash-generating asset or from a non-cash-generating asset to
a cash-generating asset only occur when there is clear evidence that such a redesignation is appropriate.
1.13 Impairment of non-cash-generating assets
Non-cash-generating assets are assets other than cash-generating assets.
Impairment is a loss in the future economic benefits or service potential of an asset, over and above the systematic recognition of
the loss of the asset’s future economic benefits or service potential through depreciation (amortisation).
Carrying amount is the amount at which an asset is recognised in the statement of financial position after deducting any
accumulated depreciation and accumulated impairment losses thereon.
Recoverable service amount is the higher of a non-cash-generating asset’s fair value less costs to sell and its value in use.
Identification
When the carrying amount of a non-cash-generating asset exceeds its recoverable service amount, it is impaired.
The entity assesses at each reporting date whether there is any indication that a non-cash-generating asset may be impaired. If
any such indication exists, the entity estimates the recoverable service amount of the asset.
Value in use
value in use of non-cash-generating assets is the present value of the non-cash-generating assets remaining service potential.
Depreciated replacement cost approach
The present value of the remaining service potential of a non-cash-generating asset is determined as the depreciated replacement
cost of the asset. The replacement cost of an asset is the cost to replace the asset’s gross service potential. This cost is depreciated
to reflect the asset in its used condition. An asset may be replaced either through reproduction (replication) of the existing asset
or through replacement of its gross service potential. The depreciated replacement cost is measured as the reproduction or
replacement cost of the asset, whichever is lower, less accumulated depreciation calculated on the basis of such cost, to reflect
the already consumed or expired service potential of the asset.

ANNUAL REPORT106 20142015
SOUTH AFRICAN NATIONAL BIODIVERSITY INSTITUTEANNUAL FINANCIAL STATEMENTS for the year ended 31 March 2015
ACCoUNTINg poLICIES
1.13 Impairment of non-cash-generating assets (continued)
Recognition and measurement
If the recoverable service amount of a non-cash-generating asset is less than its carrying amount, the carrying amount of
the asset is reduced to its recoverable service amount. This reduction is an impairment loss.
An impairment loss is recognised immediately in surplus or deficit.
Reversal of an impairment loss
The entity assesses at each reporting date whether there is any indication that an impairment loss recognised in prior periods for
a non-cash-generating asset may no longer exist or may have decreased. If any such indication exists, the entity estimates the
recoverable service amount of that asset.
A reversal of an impairment loss for a non-cash-generating asset is recognised immediately in surplus or deficit.
Redesignation
The redesignation of assets from a cash-generating asset to a non-cash-generating asset or from a non-cash-generating asset to
a cash-generating asset only occur when there is clear evidence that such a redesignation is appropriate.
1.14 Employee benefits
Employee benefits are all forms of consideration given by an entity in exchange for service rendered by employees.
A qualifying insurance policy is an insurance policy issued by an insurer that is not a related party (as defined in the
Standard of gRAP on Related Party Disclosures) of the reporting entity, if the proceeds of the policy can be used only to pay
or fund employee benefits under a defined benefit plan and are not available to the reporting entity’s own creditors (even in
liquidation) and cannot be paid to the reporting entity, unless either:
• the proceeds represent surplus assets that are not needed for the policy to meet all the related employee benefit obligations; or
• the proceeds are returned to the reporting entity to reimburse it for employee benefits already paid.
Termination benefits are employee benefits payable as a result of either:
• an entity’s decision to terminate an employee’s employment before the normal retirement date; or
• an employee’s decision to accept voluntary redundancy in exchange for those benefits.
Other long-term employee benefits are employee benefits (other than post-employment benefits and termination benefits) that
are not due to be settled within twelve months after the end of the period in which the employees render the related service.
Short-term employee benefits
Short-term employee benefits are employee benefits (other than termination benefits) that are due to be settled within twelve
months after the end of the period in which the employees render the related service.

107ANNUAL REPORT20142015
SOUTH AFRICAN NATIONAL BIODIVERSITY INSTITUTEANNUAL FINANCIAL STATEMENTS for the year ended 31 March 2015
ACCoUNTINg poLICIES
1.14 Employee benefits (continued)
Short-term employee benefits include items such as:
• wages, salaries and social security contributions;
• short-term compensated absences (such as paid annual leave and paid sick leave) where the compensation for the absences is due to be settled within twelve months after the end of the reporting period in which the employees render the related employee service;
• bonus, incentive and performance related payments payable within twelve months after the end of the reporting period in which the employees render the related service; and
• non-monetary benefits (for example, medical care, and free or subsidised goods or services such as housing, cars and cellphones) for current employees.
When an employee has rendered service to the entity during a reporting period, the entity recognise the undiscounted amount
of short-term employee benefits expected to be paid in exchange for that service:
• as a liability (accrued expense), after deducting any amount already paid. If the amount already paid exceeds the undiscounted amount of the benefits, the entity recognise that excess as an asset (prepaid expense) to the extent that the prepayment will lead to, for example, a reduction in future payments or a cash refund; and
• as an expense, unless another Standard requires or permits the inclusion of the benefits in the cost of an asset.
The expected cost of compensated absences is recognised as an expense as the employees render services that increase their
entitlement or, in the case of non-accumulating absences, when the absence occurs. The entity measure the expected cost of
accumulating compensated absences as the additional amount that the entity expects to pay as a result of the unused entitlement
that has accumulated at the reporting date.
The entity recognise the expected cost of bonus, incentive and performance related payments when the entity has a present legal
or constructive obligation to make such payments as a result of past events and a reliable estimate of the obligation can be made.
A present obligation exists when the entity has no realistic alternative but to make the payments.
Post-employment benefits
Post-employment benefits are employee benefits (other than termination benefits) which are payable after the completion of
employment.
Post-employment benefits: Defined contribution plans
Defined contribution plans are post-employment benefit plans under which an entity pays fixed contributions into a separate
entity (a fund) and will have no legal or constructive obligation to pay further contributions if the fund does not hold sufficient
assets to pay all employee benefits relating to employee service in the current and prior periods.
When an employee has rendered service to the entity during a reporting period, the entity recognise the contribution payable to
a defined contribution plan in exchange for that service:
• as a liability (accrued expense), after deducting any contribution already paid. If the contribution already paid exceeds the contribution due for service before the reporting date, an entity recognise that excess as an asset (prepaid expense) to the extent that the prepayment will lead to, for example, a reduction in future payments or a cash refund; and
• as an expense, unless another Standard requires or permits the inclusion of the contribution in the cost of an asset.

ANNUAL REPORT108 20142015
SOUTH AFRICAN NATIONAL BIODIVERSITY INSTITUTEANNUAL FINANCIAL STATEMENTS for the year ended 31 March 2015
ACCoUNTINg poLICIES
1.14 Employee benefits (continued)
Where contributions to a defined contribution plan do not fall due wholly within twelve months after the end of the reporting
period in which the employees render the related service, they are discounted. The rate used to discount reflects the time value
of money. The currency and term of the financial instrument selected to reflect the time value of money is consistent with the
currency and estimated term of the obligation.
Post-employment benefits: Defined benefit plans
Defined benefit plans are post-employment benefit plans other than defined contribution plans.
Actuarial valuations are conducted on an annual basis by independent actuaries separately for each plan. The results of the
valuation are updated for any material transactions and other material changes in circumstances (including changes in market
prices and interest rates) up to the reporting date.
Actuarial assumptions
Actuarial assumptions are unbiased and mutually compatible.
Financial assumptions are based on market expectations, at the reporting date, for the period over which the obligations are to
be settled.
The rate used to discount post-employment benefit obligations (both funded and unfunded) reflect the time value of money.
The currency and term of the financial instrument selected to reflect the time value of money is consistent with the currency and
estimated term of the post-employment benefit obligations.
Post-employment benefit obligations are measured on a basis that reflects:
• estimated future salary increases;
• the benefits set out in the terms of the plan (or resulting from any constructive obligation that goes beyond those terms) at the reporting date; and
• estimated future changes in the level of any state benefits that affect the benefits payable under a defined benefit plan, if, and only if, either:
• those changes were enacted before the reporting date; or
• past history, or other reliable evidence, indicates that those state benefits will change in some predictable manner, for example, in line with future changes in general price levels or general salary levels.
Assumptions about medical costs take account of estimated future changes in the cost of medical services, resulting from both
inflation and specific changes in medical costs.

109ANNUAL REPORT20142015
SOUTH AFRICAN NATIONAL BIODIVERSITY INSTITUTEANNUAL FINANCIAL STATEMENTS for the year ended 31 March 2015
ACCoUNTINg poLICIES
1.15 Provisions and contingencies
Provisions are recognised when:
• the entity has a present obligation as a result of a past event;
• it is probable that an outflow of resources embodying economic benefits or service potential will be required to settle the obligation; and
• a reliable estimate can be made of the obligation.
The amount of a provision is the best estimate of the expenditure expected to be required to settle the present obligation at the
reporting date.
Where some or all of the expenditure required to settle a provision is expected to be reimbursed by another party, the
reimbursement is recognised when, and only when, it is virtually certain that reimbursement will be received if the entity settles
the obligation. The reimbursement is treated as a separate asset. The amount recognised for the reimbursement does not exceed
the amount of the provision.
Provisions are not recognised for future operating deficits.
Contingent assets and contingent liabilities are not recognised. Contingencies are disclosed in note 22.
1.16 Revenue from exchange transactions
Revenue is the gross inflow of economic benefits or service potential during the reporting period when those inflows result in an
increase in net assets, other than increases relating to contributions from owners.
Measurement
Revenue is measured at the fair value of the consideration received or receivable.
Sale of goods
Revenue from the sale of goods is recognised when all the following conditions have been satisfied:
• the entity has transferred to the purchaser the significant risks and rewards of ownership of the goods;
• the entity retains neither continuing managerial involvement to the degree usually associated with ownership nor effective control over the goods sold;
• the amount of revenue can be measured reliably;
• it is probable that the economic benefits or service potential associated with the transaction will flow to the entity; and
• the costs incurred or to be incurred in respect of the transaction can be measured reliably.
Rendering of services
When the outcome of a transaction involving the rendering of services can be estimated reliably, revenue associated with the
transaction is recognised by reference to the stage of completion of the transaction at the reporting date. The outcome of a
transaction can be estimated reliably when all the following conditions are satisfied:
• the amount of revenue can be measured reliably;
• it is probable that the economic benefits or service potential associated with the transaction will flow to the entity;

ANNUAL REPORT110 20142015
SOUTH AFRICAN NATIONAL BIODIVERSITY INSTITUTEANNUAL FINANCIAL STATEMENTS for the year ended 31 March 2015
ACCoUNTINg poLICIES
1.16 Revenue from exchange transactions (continued)
• the stage of completion of the transaction at the reporting date can be measured reliably; and
• the costs incurred for the transaction and the costs to complete the transaction can be measured reliably.
When the outcome of the transaction involving the rendering of services cannot be estimated reliably, revenue is recognised only
to the extent of the expenses recognised that are recoverable.
Service revenue is recognised by reference to the stage of completion of the transaction at the reporting date. Stage of completion
is determined by services performed to date as a percentage of total services to be performed.
Interest, royalties and dividends
Revenue arising from the use by others of entity assets yielding interest, royalties and dividends or similar distributions is recognised
when:
• It is probable that the economic benefits or service potential associated with the transaction will flow to the entity, and
• The amount of the revenue can be measured reliably.
Interest is recognised, in surplus or deficit, using the effective interest rate method.
Royalties are recognised as they are earned in accordance with the substance of the relevant agreements.
Dividends or similar distributions are recognised, in surplus or deficit, when the entity’s right to receive payment has been
established.
Service fees included in the price of the product are recognised as revenue over the period during which the service is performed.
1.17 Revenue from non-exchange transactions
Non-exchange transactions are transactions that are not exchange transactions. In a non-exchange transaction, an entity either
receives value from another entity without directly giving approximately equal value in exchange, or gives value to another entity
without directly receiving approximately equal value in exchange.
Transfers are inflows of future economic benefits or service potential from non-exchange transactions, other than taxes.
Recognition
An inflow of resources from a non-exchange transaction recognised as an asset is recognised as revenue, except to the extent that
a liability is also recognised in respect of the same inflow.
Measurement
Revenue from a non-exchange transaction is measured at the amount of the increase in net assets recognised by the entity.
gifts and donations, including goods and services in-kind
gifts and donations, including goods are services in kind, are recognised as assets and revenue when it is probable that the future
economic benefits or service potential will flow to the entity and the fair value of the assets can be measured reliably.

111ANNUAL REPORT20142015
SOUTH AFRICAN NATIONAL BIODIVERSITY INSTITUTEANNUAL FINANCIAL STATEMENTS for the year ended 31 March 2015
ACCoUNTINg poLICIES
1.18 Cost of sales
When inventories are sold, the carrying amount of those inventories is recognised as an expense in the period in which the
related revenue is recognised. The amount of any write-down of inventories to net realisable value and all deficits of inventories
are recognised as an expense in the period the write-down or loss occurs. The amount of any reversal of any write-down of
inventories, arising from an increase in net realisable value, is recognised as a reduction in the amount of inventories recognised
as an expense in the period in which the reversal occurs.
1.19 Investment income
Investment income is recognised in the period that it accrues using the effective interest method.
1.20 Borrowing costs
Borrowing costs are interest and other expenses incurred by an entity in connection with the borrowing of funds.
Borrowing costs are recognised as an expense in the period in which they are incurred.
1.21 Translation of foreign currencies
Foreign currency transactions
A foreign currency transaction is recorded, on initial recognition in Rands, by applying to the foreign currency amount the spot
exchange rate between the functional currency and the foreign currency at the date of the transaction.
At each reporting date:
• foreign currency monetary items are translated using the closing rate;
• non-monetary items that are measured in terms of historical cost in a foreign currency are translated using the exchange rate at the date of the transaction; and
• non-monetary items that are measured at fair value in a foreign currency are translated using the exchange rates at the date when the fair value was determined.
Exchange differences arising on the settlement of monetary items or on translating monetary items at rates different from those
at which they were translated on initial recognition during the period or in previous annual financial statements are recognised in
surplus or deficit in the period in which they arise.
Cash flows arising from transactions in a foreign currency are recorded in Rands by applying to the foreign currency amount the
exchange rate between the Rand and the foreign currency at the date of the cash flow.
1.22 Unauthorised expenditure
Unauthorised expenditure means:
• overspending of a vote or a main division within a vote; and
• expenditure not in accordance with the purpose of a vote or, in the case of a main division, not in accordance with the purpose of the main division.

ANNUAL REPORT112 20142015
SOUTH AFRICAN NATIONAL BIODIVERSITY INSTITUTEANNUAL FINANCIAL STATEMENTS for the year ended 31 March 2015
ACCoUNTINg poLICIES
1.22 Unauthorised expenditure (continued)
All expenditure relating to unauthorised expenditure is recognised as an expense in the statement of financial performance in the year that the expenditure was incurred and disclosed in a note to the financial statements when it has been identified. The expenditure is classified in accordance with the nature of the expense, and where recovered, it is subsequently accounted for as
revenue in the statement of financial performance.
1.23 Fruitless and wasteful expenditure
Fruitless expenditure means expenditure which was made in vain and would have been avoided had reasonable care been
exercised.
All expenditure relating to fruitless and wasteful expenditure is recognised as an expense in the statement of financial performance in the year that the expenditure was incurred and disclosed in a note to the financial statements when it has been identified. The
expenditure is classified in accordance with the nature of the expense, and where recovered, it is subsequently accounted for as
revenue in the statement of financial performance.
1.24 Irregular expenditure
Irregular expenditure as defined in section 1 of the PFMA is expenditure other than unauthorised expenditure, incurred in
contravention of or that is not in accordance with a requirement of any applicable legislation, including -
a. this Act; or
b. the State Tender Board Act, 1968 (Act No. 86 of 1968), or any regulations made in terms of the Act; or
c. any provincial legislation providing for procurement procedures in that provincial government.
National Treasury practice note no. 4 of 2008/2009 which was issued in terms of sections 76(1) to 76(4) of the PFMA requires the
following (effective from 1 April 2008):
Irregular expenditure that was incurred and identified during the current financial and which was condoned before year end and/or before finalisation of the financial statements must also be recorded appropriately in the irregular expenditure register. In such an instance, no further action is also required with the exception of updating the note to the financial statements.
Irregular expenditure that was incurred and identified during the current financial year and for which condonement is being awaited at year end must be recorded in the irregular expenditure register. No further action is required with the exception of updating the note to the financial statements.
Where irregular expenditure was incurred in the previous financial year and is only condoned in the following financial year, the register and the disclosure note to the financial statements must be updated with the amount condoned.
Irregular expenditure that was incurred and identified during the current financial year and which was not condoned by the National Treasury or the relevant authority must be recorded appropriately in the irregular expenditure register. If liability for the irregular expenditure can be attributed to a person, a debt account must be created if such a person is liable in law. Immediate
steps must thereafter be taken to recover the amount from the person concerned. If recovery is not possible, the accounting
officer or accounting authority may write off the amount as debt impairment and disclose such in the relevant note to the
financial statements. The irregular expenditure register must also be updated accordingly. If the irregular expenditure has not
been condoned and no person is liable in law, the expenditure related thereto must remain against the relevant programme/
expenditure item, be disclosed as such in the note to the financial statements and updated accordingly in the irregular expenditure
register.
113ANNUAL REPORT20142015
SOUTH AFRICAN NATIONAL BIODIVERSITY INSTITUTEANNUAL FINANCIAL STATEMENTS for the year ended 31 March 2015
ACCoUNTINg poLICIES
1.25 Budget information
Public entities are typically subject to budgetary limits in the form of appropriations or budget authorisations (or equivalent),
which is given effect through authorising legislation, appropriation or similar.
general purpose financial reporting by entity shall provide information on whether resources were obtained and used in
accordance with the legally adopted budget.
The approved budget is prepared on a cash basis and presented by economic classification linked to performance outcome
objectives.
The approved budget covers the fiscal period from 2014/04/01 to 2015/03/31.
The budget for the economic entity includes all the entities approved budgets under its control.
The annual financial statements and the budget are not on the same basis of accounting therefore a reconciliation between the
statement of financial performance and the budget have been included in the annual financial statements. Refer to note 23.
Comparative information is not required.
1.26 Related parties
The entity operates in an economic sector currently dominated by entities directly or indirectly owned by the South African
government. As a consequence of the constitutional independence of the three spheres of government in South Africa, only
entities within the national sphere of government are considered to be related parties.
Management are those persons responsible for planning, directing and controlling the activities of the entity, including those
charged with the governance of the entity in accordance with legislation, in instances where they are required to perform such
functions.
Close members of the family of a person are considered to be those family members who may be expected to influence, or be
influenced by, that management in their dealings with the entity.
All transactions with related parties are disclosed.
1.27 Events after reporting date
Events after reporting date are those events, both favourable and unfavourable, that occur between the reporting date and the
date when the financial statements are authorised for issue. Two types of events can be identified:
• those that provide evidence of conditions that existed at the reporting date (adjusting events after the reporting date); and
• those that are indicative of conditions that arose after the reporting date (non-adjusting events after the reporting date).
The entity will adjust the amount recognised in the financial statements to reflect adjusting events after the reporting date once
the event occurred.
The entity will disclose the nature of the event and an estimate of its financial effect or a statement that such estimate cannot be
made in respect of all material non-adjusting events, where non-disclosure could influence the economic decisions of users taken
on the basis of the financial statements.

ANNUAL REPORT114 20142015
SOUTH AFRICAN NATIONAL BIODIVERSITY INSTITUTEANNUAL FINANCIAL STATEMENTS for the year ended 31 March 2015
NoTES To ThE ANNUAL FINANCIAL STATEMENTS
2. new standards and interpretations
2.1 Standards and interpretations issued, but not yet effective
The entity has not applied the following standards and interpretations, which have been published and are mandatory for the
entity’s accounting periods beginning on or after 01 April 2015 or later periods:
GRAP 105: Transfers of functions between entities under common control
The objective of this standard is to establish accounting principles for the acquirer and transferor in a transfer of functionsbetween
entities under common control. It requires an acquirer and a transferor that prepares and presents financial statements under the
accrual basis of accounting to apply this standard to a transaction or event that meets the definition of a transfer of functions. It
includes a diagram and requires that entities consider the diagram in determining whether this standard should be applied in
accounting for a transaction or event that involves a transfer of functions or merger.
It furthermore covers definitions, identifying the acquirer and transferor, determining the transfer date, assets acquired or
transferred and liabilities assumed or relinquished, accounting by the acquirer and transferor, disclosure, transitional provisions as
well as the effective date of the standard.
The effective date of the standard is for years beginning on or after 01 April 2015.
It is unlikely that the amendment will have a material impact on the entity’s annual financial statements.
GRAP 106: Transfers of functions between entities not under common control
The objective of this standard is to establish accounting principles for the acquirer in a transfer of functions between entities not
under common control. It requires an entity that prepares and presents financial statements under the accrual basis of accounting
to apply this standard to a transaction or other event that meets the definition of a transfer of functions. It includes a diagram and
requires that entities consider the diagram in determining whether this standard should be applied in accounting for a transaction
or event that involves a transfer of functions or merger.
It furthermore covers definitions, identifying a transfer of functions between entities not under common control, the acquisition
method, recognising and measuring the difference between the assets acquired and liabilities assumed and the consideration
transferred, measurement period, determining what is part of a transfer of functions, subsequent measurement and accounting,
disclosure, transitional provisions as well as the effective date of the standard.
The effective date of the standard is for years beginning on or after 01 April 2015.
It is unlikely that the amendment will have a material impact on the entity’s annual financial statements.

115ANNUAL REPORT20142015
SOUTH AFRICAN NATIONAL BIODIVERSITY INSTITUTEANNUAL FINANCIAL STATEMENTS for the year ended 31 March 2015
NoTES To ThE ANNUAL FINANCIAL STATEMENTS
2. new standards and interpretations (continued)
GRAP 107: Mergers
The objective of this standard is to establish accounting principles for the acquirer in a transfer of functions between entities not
under common control. It requires an entity that prepares and presents financial statements under the accrual basis of accounting
to apply this standard to a transaction or other event that meets the definition of a transfer of functions. It includes a diagram and
requires that entities consider the diagram in determining whether this standard should be applied in accounting for a transaction
or event that involves a transfer of functions or merger.
It furthermore covers definitions, identifying a transfer of functions between entities not under common control, the acquisition
method, recognising and measuring the difference between the assets acquired and liabilities assumed and the consideration
transferred, measurement period, determining what is part of a transfer of functions, subsequent measurement and accounting,
disclosure, transitional provisions as well as the effective date of the standard.
The effective date of the standard is for years beginning on or after 01 April 2015.
It is unlikely that the amendment will have a material impact on the entity’s annual financial statements.
GRAP 20: Related parties
The objective of this standard is to ensure that a reporting entity’s annual financial statements contain the disclosures necessary to
draw attention to the possibility that its financial position and surplus or deficit may have been affected by the existence of related
parties and by transactions and outstanding balances with such parties.
An entity that prepares and presents financial statements under the accrual basis of accounting (in this standard referred to as the
reporting entity) shall apply this standard in:
• identifying related party relationships and transactions;
• identifying outstanding balances, including commitments, between an entity and its related parties;
• identifying the circumstances in which disclosure of the items in (a) and (b) is required; and
• determining the disclosures to be made about those items.
This standard requires disclosure of related party relationships, transactions and outstanding balances, including commitments,
in the consolidated and separate financial statements of the reporting entity in accordance with the standard of gRAP on
Consolidated and Separate Financial Statements. This standard also applies to individual annual financial statements.
Disclosure of related party transactions, outstanding balances, including commitments, and relationships with related parties may
affect users’ assessments of the financial position and performance of the reporting entity and its ability to deliver agreed services,
including assessments of the risks and opportunities facing the entity. This disclosure also ensures that the reporting entity is
transparent about its dealings with related parties.

ANNUAL REPORT116 20142015
SOUTH AFRICAN NATIONAL BIODIVERSITY INSTITUTEANNUAL FINANCIAL STATEMENTS for the year ended 31 March 2015
NoTES To ThE ANNUAL FINANCIAL STATEMENTS
2. new standards and interpretations (continued)
The standard states that a related party is a person or an entity with the ability to control or jointly control the other party, or
exercise significant influence over the other party, or vice versa, or an entity that is subject to common control, or joint control. As
a minimum, the following are regarded as related parties of the reporting entity:
• A person or a close member of that person’s family is related to the reporting entity if that person:
– has control or joint control over the reporting entity;
– has significant influence over the reporting entity;
– is a member of the management of the entity or its controlling entity.
• An entity is related to the reporting entity if any of the following conditions apply:
– the entity is a member of the same economic entity (which means that each controlling entity, controlled entity and fellow controlled entity is related to the others);
– one entity is an associate or joint venture of the other entity (or an associate or joint venture of a member of an economic entity of which the other entity is a member);
– both entities are joint ventures of the same third party;
– one entity is a joint venture of a third entity and the other entity is an associate of the third entity;
– the entity is a post-employment benefit plan for the benefit of employees of either the entity or an entity related to the entity. If the reporting entity is itself such a plan, the sponsoring employers are related to the entity;
– the entity is controlled or jointly controlled by a person identified in (a); and
– a person identified in (a)(i) has significant influence over that entity or is a member of the management of that entity (or its controlling entity).
The standard furthermore states that related party transaction is a transfer of resources, services or obligations between the
reporting entity and a related party, regardless of whether a price is charged.
The standard elaborates on the definitions and identification of:
• Close member of the family of a person;
• Management;
• Related parties;
• Remuneration; and
• Significant influence
The standard sets out the requirements, inter alia, for the disclosure of:
• Control;
• Related party transactions; and
• Remuneration of management
The effective date of the standard is for years beginning on or after 01 April 2016.
The impact of this standard is currently being assessed.

117ANNUAL REPORT20142015
SOUTH AFRICAN NATIONAL BIODIVERSITY INSTITUTEANNUAL FINANCIAL STATEMENTS for the year ended 31 March 2015
NoTES To ThE ANNUAL FINANCIAL STATEMENTS
2. new standards and interpretations (continued)
IGRAP 11: Consolidation – Special purpose entities
An entity may be created to accomplish a narrow and well-defined objective (e.g. to effect a lease, research and development
activities or a securitisation of financial assets). Such a special purpose entity (‘SPE’) may take the form of a corporation, trust,
partnership or unincorporated entity. SPEs often are created with legal arrangements that impose strict and sometimes permanent
limits on the decision-making powers of their management over the operations of the SPE. Frequently, these provisions specify
that the policy guiding the ongoing activities of the SPE cannot be modified, other than perhaps by its creator or sponsor (ie they operate on so-called ‘autopilot’). The sponsor (or entity on whose behalf the SPE was created) frequently transfers assets to the SPE, obtains the right to use assets held by the SPE or performs services for the SPE, while other parties (‘capital providers’) may provide the funding to the SPE. An entity that engages in transactions with an SPE (frequently the creator or sponsor) may in substance control the SPE. A beneficial interest in an SPE may, for example, take the form of a debt instrument, an equity instrument, a participation right, a residual interest or a lease. Some beneficial interests may simply provide the holder with a fixed or stated rate of return, while others give the holder rights or access to other future economic benefits or service potential of the SPE’s activities. In most cases, the creator or sponsor (or the entity on whose behalf the SPE was created) retains a significant beneficial interest in the SPE’s activities, even though it may own little or none of the SPE’s net assets.
The standard of gRAP on Consolidated and Separate Financial Statements requires the consolidation of entities that are controlled by the reporting entity. However, the standard of gRAP does not provide explicit guidance on the consolidation of SPEs. The issue is under what circumstances an entity should consolidate an SPE. This interpretation of the standards of gRAP does not apply to post-employment benefit plans or other long-term employee benefit plans to which the standard of gRAP on Employee Benefits applies.
A transfer of assets from an entity to an SPE may qualify as a sale by that entity. Even if the transfer does qualify as a sale, the provisions of the standard of gRAP on Consolidated and Separate Financial Statements and this Interpretation of the standards of gRAP may mean that the entity should consolidate the SPE. This Interpretation of the standards of gRAP does not address the circumstances in which sale treatment should apply for the entity or the elimination of the consequences of such a sale upon consolidation.
The effective date of this interpretation is dependent on/in conjunction with the effective date of gRAP105, 106 and 107.
It is unlikely that the interpretation will have a material impact on the entity’s annual financial statements.
IGRAP 12: Jointly controlled entities – Non-monetary contributions by ventures
Paragraph .54 in the standard of gRAP on Interests in Joint ventures refers to both contributions and sales between a venturer and
a joint venture as follows: ‘When a venturer contributes or sells assets to a joint venture, recognition of any portion of a gain or loss from the transaction shall reflect the substance of the transaction’. In addition, paragraph 31 in the standard of gRAP on Interests in Joint ventures says that ‘a jointly controlled entity is a joint venture that involves the establishment of a corporation, partnership or other entity in which each venturer has an interest’. There is no explicit guidance on the recognition of gains and losses resulting from contributions of non-monetary assets to jointly controlled entities (‘JCEs’).
Contributions to a JCE are transfers of assets by venturers in exchange for an interest in the net asset in the JCE. Such contributions may take various forms. Contributions may be made simultaneously by the venturers either upon establishing the JCE or
subsequently. The consideration received by the venturer(s) in exchange for assets contributed to the JCE may also include cash
or other consideration that does not depend on future cash flows of the JCE (‘additional consideration’).
ANNUAL REPORT118 20142015
SOUTH AFRICAN NATIONAL BIODIVERSITY INSTITUTEANNUAL FINANCIAL STATEMENTS for the year ended 31 March 2015
NoTES To ThE ANNUAL FINANCIAL STATEMENTS
2. new standards and interpretations (continued)
The issues are:
• when the appropriate portion of gains or losses resulting from a contribution of a non-monetary asset to a JCE in exchange for an interest in the net assets in the JCE should be recognised by the venturer in surplus or deficit;
• how additional consideration should be accounted for by the venturer; and
• how any unrealised gain or loss should be presented in the consolidated
This Interpretation of the standards of gRAP deals with the venturer’s accounting for non-monetary contributions to a JCE in
exchange for an interest in the net assets in the JCE that is accounted for using either the equity method or proportionate
consolidation.
The effective date of this interpretation is dependent on/in conjunction with the effective date of gRAP105, 106 and 107.
It is unlikely that the interpretation will have a material impact on the entity’s annual financial statements.
GRAP 6 (as revised 2010): Consolidated and Separate Financial Statements
The definition of ‘minority interest’ has been amended to ‘non-controlling interest’, and paragraph .60 was added by the
Improvements to the standards of gRAP issued in November 2010. An entity shall apply these amendments prospectively for
annual financial periods beginning on or after the effective date [in conjunction with the effective date to be determined by the
Minister of Finance for gRAP 105, 106 and 107]. If an entity elects to apply these amendments earlier, it shall disclose this fact.
Paragraph .59 was amended by Improvements to the standards of gRAP issued in November 2010. An entity shall apply these
amendments prospectively for annual financial periods beginning on or after the effective date [in conjunction with the effective
date to be determined by the Minister of Finance for gRAP 105, 106 and 107] from the date at which it first applied the standard
of gRAP on Non-current Assets Held for Sale and Discontinued Operations. If an entity elects to apply these amendments earlier,
it shall disclose this fact.
The standards of gRAP on Transfer of Functions Between Entities Under Common Control, Transfer of Functions Between Entities
Not Under Common Control and Mergers amended paragraphs .03, .39, .47 to .50 and added paragraphs .51 to .58 and .61 to .62.
An entity shall apply these amendments when it applies the standards of gRAP on Transfer of Functions Between Entities Under
Common Control, Transfer of Functions Between Entities Not Under Common Control and Mergers.
An entity shall apply this amendment for annual financial statements covering periods beginning on or after the effective date [in
conjunction with the effective date to be determined by the Minister of Finance for gRAP 105, 106 and 107].
It is unlikely that the amendment will have a material impact on the entity’s annual financial statements.
GRAP 7 (as revised 2010): Investments in Associates
Paragraphs .03 and .42 were amended by the Improvements to the standards of gRAP issued in November 2010. An entity shall
apply these amendments prospectively for annual financial periods beginning on or after the effective date [in conjunction
with the effective date to be determined by the Minister of Finance for gRAP 105, 106 and 107]. If an entity elects to apply these
amendments earlier, it shall disclose this fact.

119ANNUAL REPORT20142015
SOUTH AFRICAN NATIONAL BIODIVERSITY INSTITUTEANNUAL FINANCIAL STATEMENTS for the year ended 31 March 2015
NoTES To ThE ANNUAL FINANCIAL STATEMENTS
2. new standards and interpretations (continued)
The standards of gRAP on Transfer of Functions Between Entities Under Common Control, Transfer of Functions Between Entities
Not Under Common Control and Mergers amended paragraphs .22, .28 and .38 and added paragraph .24. An entity shall apply
these amendments and addition when it applies the standards of gRAP on Transfer of Functions Between Entities Under Common
Control, Transfer of Functions Between Entities Not Under Common Control and Mergers.
An entity shall apply this amendment for annual financial statements covering periods beginning on or after the effective date [in
conjunction with the effective date to be determined by the Minister of Finance for gRAP 105, 106 and 107].
It is unlikely that the amendment will have a material impact on the entity’s annual financial statements.
GRAP 8 (as revised 2010): Interests in Joint Ventures
Paragraph .04 was amended by the Improvements to the standards of gRAP issued in November 2010. An entity shall apply these
amendments prospectively for annual financial periods beginning on or after the effective date [in conjunction with the effective
date to be determined by the Minister of Finance for gRAP 105, 106 and 107]. If an entity elects to apply these amendments earlier,
it shall disclose this fact.
The standards of gRAP on Transfer of Functions Between Entities Under Common Control, Transfer of Functions Between Entities
Not Under Common Control and Mergers added paragraph .50 and amended paragraphs .51 and .52. An entity shall apply these
amendments and addition when it applies the standards of gRAP on Transfer of Functions Between Entities Under Common
Control, Transfer of Functions Between Entities Not Under Common Control and Mergers.
An entity shall apply this amendment for annual financial statements covering periods beginning on or after the effective date [in
conjunction with the effective date to be determined by the Minister of Finance for gRAP 105, 106 and 107].
It is unlikely that the amendment will have a material impact on the entity’s annual financial statements.
GRAP 32: Service Concession Arrangements: Grantor
The objective of this standard is: to prescribe the accounting for service concession arrangements by the grantor, a public sector
entity.
It furthermore covers: definitions, recognition and measurement of a service concession asset, recognition and measurement of
liabilities, other liabilities, contingent liabilities, and contingent assets, other revenues, presentation and disclosure, transitional
provisions, as well as the effective date.
The effective date of the standard is not yet set by the Minister of Finance.
The entity opted not to early adopt the standard.
The entity expects to adopt the standard for the first time when the Minister sets the effective date for the standard.
It is unlikely that the standard will have a material impact on the entity’s annual financial statements.

ANNUAL REPORT120 20142015
SOUTH AFRICAN NATIONAL BIODIVERSITY INSTITUTEANNUAL FINANCIAL STATEMENTS for the year ended 31 March 2015
NoTES To ThE ANNUAL FINANCIAL STATEMENTS
2. new standards and interpretations (continued)
GRAP 108: Statutory Receivables
The objective of this standard is: to prescribe accounting requirements for the recognition, measurement, presentation and
disclosure of statutory receivables.
It furthermore covers: Definitions, recognition, derecognition, measurement, presentation and disclosure, transitional provisions,
as well as the effective date.
The effective date of the standard is not yet set by the Minister of Finance.
The entity expects to adopt the standard for the first time when the Minister sets the effective date for the standard.
It is unlikely that the standard will have a material impact on the entity’s annual financial statements.
IGRAP 17: Service Concession Arrangements where a Grantor Controls a Significant Residual Interest in an Asset
This Interpretation of the standards of gRAP provides guidance to the grantor where it has entered into a service concession
arrangement, but only controls, through ownership, beneficial entitlement or otherwise, a significant residual interest in a service
concession asset at the end of the arrangement, where the arrangement does not constitute a lease. This Interpretation of the
standards of gRAP shall not be applied by analogy to other types of transactions or arrangements.
A service concession arrangement is a contractual arrangement between a grantor and an operator in which the operator uses
the service concession asset to provide a mandated function on behalf of the grantor for a specified period of time. The operator
is compensated for its services over the period of the service concession arrangement, either through payments, or through
receiving a right to earn revenue from third party users of the service concession asset, or the operator is given access to another
revenue-generating asset of the grantor for its use.
Before the grantor can recognise a service concession asset in accordance with the standard of gRAP on Service Concession
Arrangements: grantor, both the criteria as noted in paragraph .01 of this Interpretation of the standards of gRAP need to be met.
In some service concession arrangements, the grantor only controls the residual interest in the service concession asset at the
end of the arrangement, and can therefore not recognise the service concession asset in terms of the standard of gRAP on Service
Concession Arrangements: grantor.
A consensus is reached, in this Interpretation of the standards of gRAP, on the recognition of the performance obligation and the
right to receive a significant interest in a service concession asset.
The effective date of the standard is not yet set by the Minister of Finance.
The entity expects to adopt the standard for the first time when the Minister sets the effective date for the standard.
It is unlikely that the standard will have a material impact on the entity’s annual financial statements.
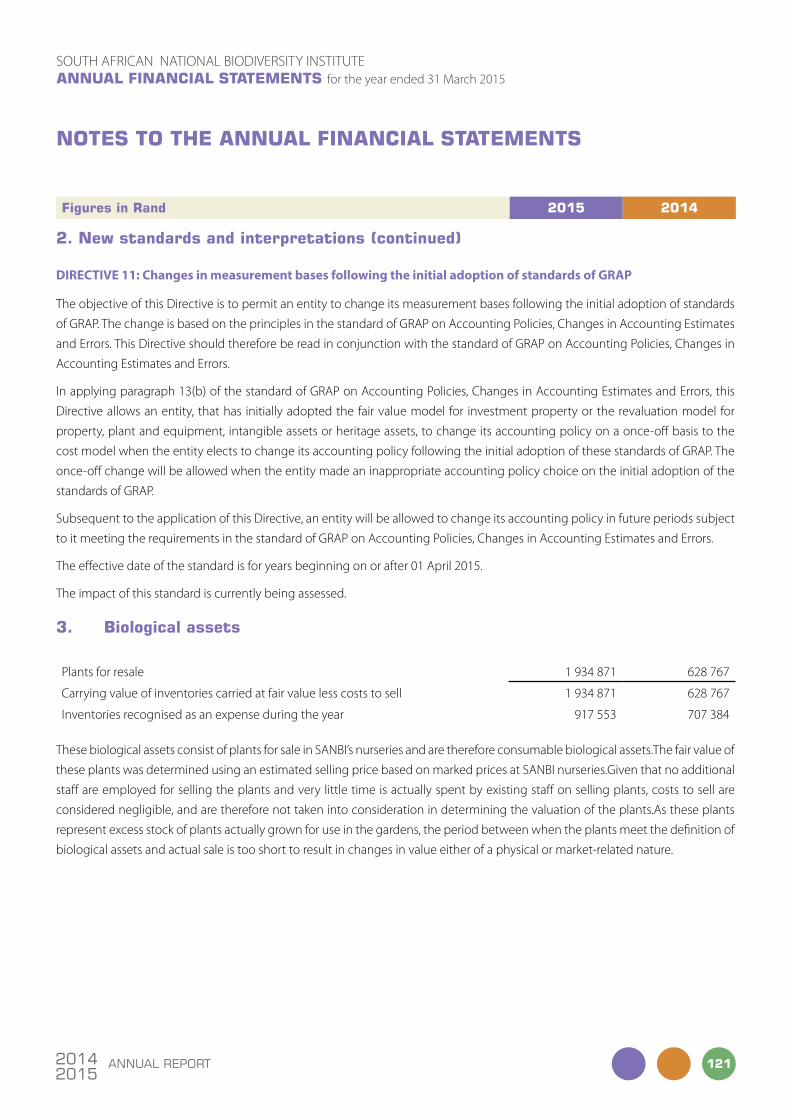
121ANNUAL REPORT20142015
SOUTH AFRICAN NATIONAL BIODIVERSITY INSTITUTEANNUAL FINANCIAL STATEMENTS for the year ended 31 March 2015
NoTES To ThE ANNUAL FINANCIAL STATEMENTS
Figures in rand 2015 2014
2. new standards and interpretations (continued)
DIRECTIVE 11: Changes in measurement bases following the initial adoption of standards of GRAP
The objective of this Directive is to permit an entity to change its measurement bases following the initial adoption of standards
of gRAP. The change is based on the principles in the standard of gRAP on Accounting Policies, Changes in Accounting Estimates
and Errors. This Directive should therefore be read in conjunction with the standard of gRAP on Accounting Policies, Changes in
Accounting Estimates and Errors.
In applying paragraph 13(b) of the standard of gRAP on Accounting Policies, Changes in Accounting Estimates and Errors, this
Directive allows an entity, that has initially adopted the fair value model for investment property or the revaluation model for
property, plant and equipment, intangible assets or heritage assets, to change its accounting policy on a once-off basis to the
cost model when the entity elects to change its accounting policy following the initial adoption of these standards of gRAP. The
once-off change will be allowed when the entity made an inappropriate accounting policy choice on the initial adoption of the
standards of gRAP.
Subsequent to the application of this Directive, an entity will be allowed to change its accounting policy in future periods subject
to it meeting the requirements in the standard of gRAP on Accounting Policies, Changes in Accounting Estimates and Errors.
The effective date of the standard is for years beginning on or after 01 April 2015.
The impact of this standard is currently being assessed.
3. biological assets
Plants for resale 1 934 871 628 767
Carrying value of inventories carried at fair value less costs to sell 1 934 871 628 767
Inventories recognised as an expense during the year 917 553 707 384
These biological assets consist of plants for sale in SANBI’s nurseries and are therefore consumable biological assets.The fair value of
these plants was determined using an estimated selling price based on marked prices at SANBI nurseries.given that no additional
staff are employed for selling the plants and very little time is actually spent by existing staff on selling plants, costs to sell are
considered negligible, and are therefore not taken into consideration in determining the valuation of the plants.As these plants
represent excess stock of plants actually grown for use in the gardens, the period between when the plants meet the definition of
biological assets and actual sale is too short to result in changes in value either of a physical or market-related nature.

ANNUAL REPORT122 20142015
SOUTH AFRICAN NATIONAL BIODIVERSITY INSTITUTEANNUAL FINANCIAL STATEMENTS for the year ended 31 March 2015
NoTES To ThE ANNUAL FINANCIAL STATEMENTS
Figures in rand 2015 2014
4. receivables from exchange transactions
Trade debtors (net of provisions for doubtful debts) 2 320 723 2 077 969
Accrued income 984 845 689 444
Sundry receivables 235 155 188 906
3 540 723 2 956 319
Trade receivables consist mainly of rental income from restaurants. Trade receivables are non-interest bearing and based on 30
days from invoice.
Fair value of trade and other receivables
Trade and other receivables 3 540 723 2 956 319
Amounts neither past due nor impaired are considered fully recoverable. No credit quality issues are noted.
Trade and other receivables past due but not impaired
Trade and other receivables which are less than 1 month past due are not considered to be impaired. At 31 March 2015, R89 111
(2014: R nil) were past due but not impaired.
31 to 60 days past due 89 111 -
Trade and other receivables impaired
As of 31 March 2015, trade and other receivables of R 184 765 (2014: R 272 056) were impaired and provided for.
The ageing of these debtors is as follows:
61 to 90 days past due 32 352 127 829
Over 90 days past due 152 413 144 227
184 765 272 056
Reconciliation of provision for impairment of trade and other receivables
Opening balance 272 056 280 847
Provision for impairment/(reversed) in the year (87 291) (8 791)
184 765 272 056

123ANNUAL REPORT20142015
SOUTH AFRICAN NATIONAL BIODIVERSITY INSTITUTEANNUAL FINANCIAL STATEMENTS for the year ended 31 March 2015
NoTES To ThE ANNUAL FINANCIAL STATEMENTS
Figures in rand 2015 2014
5. cash and cash equivalents
Cash and cash equivalents consist of:
Short-term deposits 171 536 106 157 515 968
Bank balances 105 188 578 39 078 537
Cash on hand 1 177 736 1 224 758
277 902 420 197 819 263
Cash on current accounts at banks earn interest. Short-term deposits are made for varying periods of between one day and
three months, depending on the immediate cash requirements of SANBI and earn interest at the respective short-term deposit rates.
6. investment property
2015 2014
cost
accumulated depreciation
and accumulated impairment
carrying value cost
accumulated depreciation
and accumulated impairment
carrying value
Investment property 90 622 484 (19 022 611) 71 599 873 89 572 478 (16 778 507) 72 793 971
Reconciliation of investment property - 2015
opening balance additions depreciation total
Investment property 72 793 971 1 050 005 (2 244 103) 71 599 873

ANNUAL REPORT124 20142015
SOUTH AFRICAN NATIONAL BIODIVERSITY INSTITUTEANNUAL FINANCIAL STATEMENTS for the year ended 31 March 2015
NoTES To ThE ANNUAL FINANCIAL STATEMENTS
Figures in rand 2015 2014
6. investment property (continued)
Reconciliation of investment property - 2014
opening balance depreciation total
Investment property 75 033 282 (2 239 311) 72 793 971
Net surplus for the period is stated after:
Income from investment properties - rental 7 204 721 6 372 029
Operating costs of investment properties - occupied by tenants
(2 013 310) (1 698 342)
Operating costs of investment properties - unoccupied - (63 542)
5 191 411 4 610 145
It is not possible to disclose a fair value of investment property as the property is not available for sale on the open market.
A register containing the details of investment property is available for inspection at the Institute’s registered office.
There are no restrictions, as no title / investment property is pledged as security for any liabilities.
7. property, plant and equipment
2015 2014
cost
accumulated depreciation
and accumulated impairment
carrying value cost
accumulated depreciation
and accumulated impairment
carrying value
Buildings 143 040 385 (32 639 350) 110 401 035 133 029 859 (29 251 644) 103 778 215
Motor vehicles 33 486 541 (11 690 459) 21 796 082 24 398 544 (10 207 627) 14 190 917
Operational equipment 50 616 199 (34 939 116) 15 677 083 46 979 100 (35 563 754) 11 415 346
Total 227 143 125 (79 268 925) 147 874 200 204 407 503 (75 023 025) 129 384 478

125ANNUAL REPORT20142015
SOUTH AFRICAN NATIONAL BIODIVERSITY INSTITUTEANNUAL FINANCIAL STATEMENTS for the year ended 31 March 2015
NoTES To ThE ANNUAL FINANCIAL STATEMENTS
Reconciliation of property, plant and equipment - 2015
opening balance additions disposals depreciation total
Buildings 103 778 215 10 010 525 - (3 387 705) 110 401 035
Motor vehicles 14 190 917 11 085 342 (799 340) (2 680 837) 21 796 082
Operational equipment 11 415 346 8 857 958 (248 728) (4 347 493) 15 677 083
129 384 478 29 953 825 (1 048 068) (10 416 035) 147 874 200
Reconciliation of property, plant and equipment - 2014
opening balance additions disposals depreciation total
Buildings 99 581 269 7 402 800 - (3 205 854) 103 778 215
Motor vehicles 8 142 278 7 840 330 (237 564) (1 554 126) 14 190 918
Operational equipment 6 728 799 7 892 176 (172 323) (3 033 306) 11 415 346
114 452 346 23 135 306 (409 887) (7 793 286) 129 384 479
In accordance with the mandate as envisaged in the National Environmental Management Biodiversity Act (NEMBA), SANBI is
responsible for managing, controlling and maintaining all National Botanical gardens. The majority of the land that is currently
utilised as National Botanical gardens in the Republic belongs to the different tiers of government, and the control of the land is
vested in SANBI in accordance with its mandate.
A register containing the details of property, plant and equipment is available for inspection at the Institute’s registered office.
There are no restrictions, as no title / property, plant and equipment is pledged as security for any liabilities.
8. intangible assets
2015 2014
cost
accumulated depreciation
and accumulated impairment
carrying value cost
accumulated depreciation
and accumulated impairment
carrying value
Computer software 13 630 560 (9 371 394) 4 259 166 11 274 352 (7 206 305) 4 068 047
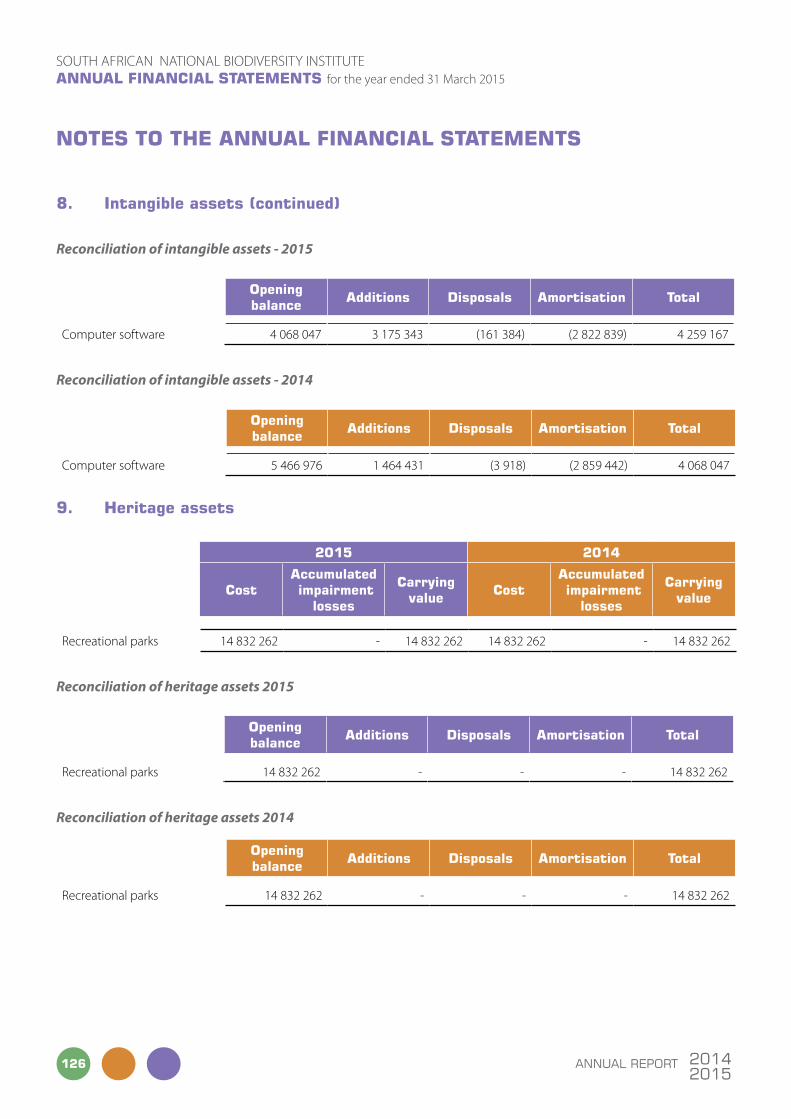
ANNUAL REPORT126 20142015
SOUTH AFRICAN NATIONAL BIODIVERSITY INSTITUTEANNUAL FINANCIAL STATEMENTS for the year ended 31 March 2015
NoTES To ThE ANNUAL FINANCIAL STATEMENTS
8. intangible assets (continued)
Reconciliation of intangible assets - 2015
opening balance additions disposals amortisation total
Computer software 4 068 047 3 175 343 (161 384) (2 822 839) 4 259 167
Reconciliation of intangible assets - 2014
opening balance additions disposals amortisation total
Computer software 5 466 976 1 464 431 (3 918) (2 859 442) 4 068 047
9. Heritage assets
2015 2014
cost
accumulated impairment
losses
carrying value cost
accumulated impairment
losses
carrying value
Recreational parks 14 832 262 - 14 832 262 14 832 262 - 14 832 262
Reconciliation of heritage assets 2015
opening balance additions disposals amortisation total
Recreational parks 14 832 262 - - - 14 832 262
Reconciliation of heritage assets 2014
opening balance additions disposals amortisation total
Recreational parks 14 832 262 - - - 14 832 262
127ANNUAL REPORT20142015
SOUTH AFRICAN NATIONAL BIODIVERSITY INSTITUTEANNUAL FINANCIAL STATEMENTS for the year ended 31 March 2015
NoTES To ThE ANNUAL FINANCIAL STATEMENTS
9. Heritage assets (continued)
The above information relates only to transactions in land purchase that are held indefinitely for the benefit of present and future
generations. The land is protected, kept unencumbered, cared for and preserved for its natural heritage.
SANBI has a rich and valuable collection of original watercolour plates and pen and ink drawings housed at herbaria in Pretoria
and Cape Town. The Pretoria collection was built up from around 1916, by the former Botanical Research Institute, as the original
artwork for its many journals and books. It continues to be added to as new papers and books are published. Additional smaller
collections of artwork were acquired by means of bequests to the nation or purchased by grants.
The National Herbarium (PRE) houses archived specimens of dried plant material mounted on cardboards or in packets, stored in
cupboards arranged in an accessible system. These plant specimens are kept in modern steel cabinets with magnetic sealing doors
(some are kept in older wooden cabinets made of different kinds of wood and now forming a valuable collection of examples of
worked timber). The collection currently stands at approximately 1.2 million specimens of which 914 741 are computerized. Most
specimens are from Southern Africa, but the collection extends into the rest of Africa and surrounding islands and includes small
collections from outside Africa. vascular plants, bryophytes, and lichens are represented.
The collection of the National Herbarium (PRE) was extended by several valuable collections over the years, including that of E.E.
gal pin and, in 1952, the Transvaal Museum (TRv). More recently the Saasveld Herbarium and the Forestry Herbarium (PRF) were
incorporated in the National Herbarium (PRE), currently making it by far the largest herbarium in Africa.
The oldest specimen in this collection is a specimen of Erica Mammasa, collected by W.J. Burchell (1781-1863) on the Cape Flats
near Salt River in January 1811. Other historically significant specimens in the collection includes: Dichrostachys cinerea subsp.
africana var. africana collected by Burke & Zeyher on their first trip to the Magaliesberg in 1841 and Ochna pulchra, collected by
general J.C. Smuts near the Pienaars River, 50 miles west of Warmbaths, in October 1932.
There are approximately 10,000 type specimens in the collections of the National Herbarium. Type specimens are scientifically
significant specimens in the collection as they are acting as a reference for the plant name, upon which the name is based.
The cryptogrammic collection of the National Herbarium consists of more than 80,000 mounted specimens of bryophytes
(Hornworths, liverworts and mosses). It contains the largest and most representative collection of Southern African cryptogams.
The PRE cryptogrammic herbarium is the largest of its kind in Africa and one of the largest in the southern hemisphere.
SANBI has two main libraries - the Mary gunn Library in Pretoria and the Harry Molteno Library in Cape Town. They rank amongst
the biggest botanical libraries in the southern hemisphere and are a valuable resource for information on Southern African flora
and biodiversity.
The Mary gunn Library dates back to 1916 and is housed in the National Herbarium in Pretoria and is currently the most
comprehensive botanical library of its kind in Africa and serves as one of the important botanical and biodiversity resources
in Africa. The library houses a magnificent Africana and Rare Antiquarian Book Collection such as the 18 broadsheet edition of
Redouté’s Les Liliacées (1807-1816) and the Xylotech Book Collection by Clementz H. Wehdemann (early 1800s).
The Harry Molteno Library at Kirstenbosch dates back to 1913 when the garden was founded but was officially started in 1921.
Since that time it has grown considerably and has moved several times. It is presently housed in the Kirstenbosch Research Centre.
The mission of SANBI libraries is to meet the information needs of all SANBI staff and to address a public demand for comprehensive,
easily accessed information on the biodiversity of Southern Africa.

ANNUAL REPORT128 20142015
SOUTH AFRICAN NATIONAL BIODIVERSITY INSTITUTEANNUAL FINANCIAL STATEMENTS for the year ended 31 March 2015
NoTES To ThE ANNUAL FINANCIAL STATEMENTS
Figures in rand 2015 2014
10. payables from exchange transactions
Trade payables 13 382 210 10 164 050
Income received in advance 170 292 103 035
Other payables 5 166 662 1 833 285
Service bonuses 5 652 974 5 116 362
Accrued expense 39 766 343 31 014 683
Leave liability 11 298 401 10 540 157
75 436 882 58 771 572
Payables from exchange transactions are non-interest bearing and are normally settled within 30-days.
11. unspent committed project funds
Movement during the year
Balance at the beginning of the year 105 726 071 60 272 462
Funds received during the year 375 905 974 251 987 829
Income recognition during the year (316 588 088) (206 534 222)
165 043 957 105 726 069
12. provisions
Reconciliation of provisions - 2015
opening balance
increases in provision
utilised during the year total
Performance and related incentives 3 025 770 3 529 514 (3 502 704) 3 052 580
Reconciliation of provisions - 2014
opening balance
increases in provision
utilised during the year total
Performance and related incentives 3 082 116 2 901 242 (2 957 588) 3 025 770
The provision for performance incentives is based on 1.5% of total budgeted employee remunerations and other related
incentives is based on past cost with incremental percentage where deemed necessary.
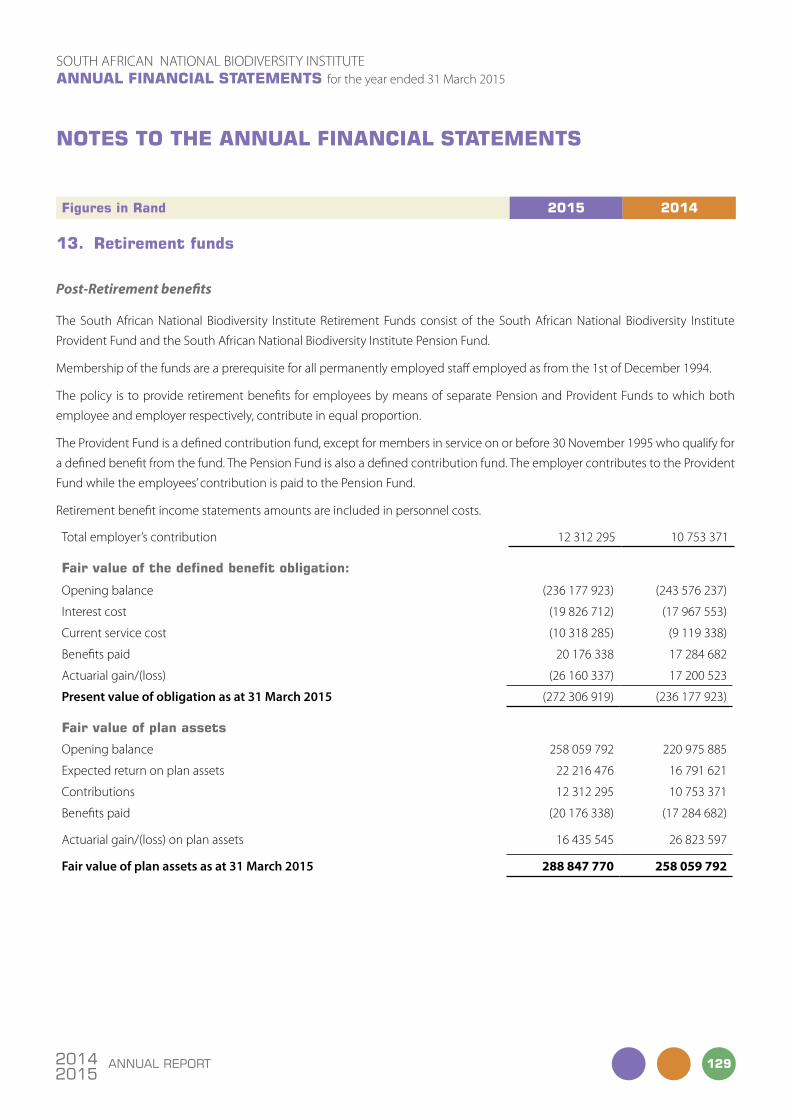
129ANNUAL REPORT20142015
SOUTH AFRICAN NATIONAL BIODIVERSITY INSTITUTEANNUAL FINANCIAL STATEMENTS for the year ended 31 March 2015
NoTES To ThE ANNUAL FINANCIAL STATEMENTS
Figures in rand 2015 2014
13. retirement funds
Post-Retirement benefits
The South African National Biodiversity Institute Retirement Funds consist of the South African National Biodiversity Institute
Provident Fund and the South African National Biodiversity Institute Pension Fund.
Membership of the funds are a prerequisite for all permanently employed staff employed as from the 1st of December 1994.
The policy is to provide retirement benefits for employees by means of separate Pension and Provident Funds to which both
employee and employer respectively, contribute in equal proportion.
The Provident Fund is a defined contribution fund, except for members in service on or before 30 November 1995 who qualify for
a defined benefit from the fund. The Pension Fund is also a defined contribution fund. The employer contributes to the Provident
Fund while the employees’ contribution is paid to the Pension Fund.
Retirement benefit income statements amounts are included in personnel costs.
Total employer’s contribution 12 312 295 10 753 371
Fair value of the defined benefit obligation:
Opening balance (236 177 923) (243 576 237)
Interest cost (19 826 712) (17 967 553)
Current service cost (10 318 285) (9 119 338)
Benefits paid 20 176 338 17 284 682
Actuarial gain/(loss) (26 160 337) 17 200 523
Present value of obligation as at 31 March 2015 (272 306 919) (236 177 923)
Fair value of plan assets
Opening balance 258 059 792 220 975 885
Expected return on plan assets 22 216 476 16 791 621
Contributions 12 312 295 10 753 371
Benefits paid (20 176 338) (17 284 682)
Actuarial gain/(loss) on plan assets 16 435 545 26 823 597
Fair value of plan assets as at 31 March 2015 288 847 770 258 059 792

ANNUAL REPORT130 20142015
SOUTH AFRICAN NATIONAL BIODIVERSITY INSTITUTEANNUAL FINANCIAL STATEMENTS for the year ended 31 March 2015
NoTES To ThE ANNUAL FINANCIAL STATEMENTS
Figures in rand 2015 2014
13. retirement funds (continued)
unrecognised actuarial gain
Opening balance (21 881 870) -
Actuarial (gains) losses – on present value of obligation 26 160 337 (17 200 523)
Actuarial (gains) losses – on fair value of plan assets (16 435 545) (26 823 597)
Asset (liability) to be recognised (4 383 773) 22 142 250
Unrecognised actuarial (gains)/losses (16 540 851) (21 881 870)
amounts recognised in the statement of Financial position
Present value of funded obligation (272 306 919) (236 177 923)
Fair value of plan assets 288 847 770 258 059 792
Surplus (Deficit) in plan 16 540 851 21 881 869
Unrecognised actuarial (gains)/losses (16 540 851) (21 881 869)
- -
Post-retirement benefits
In terms of gRAP 25 an asset should not be recognised in the entity’s statement of financial position unless the entity has control
of the asset, the asset arises due to past events (e.g. excess contributions) and the entity has beneficial use of the assets (e.g. via a
contribution holiday or cash refund). A liability must always be recognised.
Current service cost 10 318 285 9 119 338
Interest on obligation 19 826 712 17 967 553
Expected return on plan assets (22 216 476) (16 791 621)
Net acturial (gains)/loss recognised in the current year 9 724 792 (44 024 120)
17 653 313 (33 728 850)
Key actuarial assumptions in determining the above positions
Discount rate annualised yield on R186 (2014:R186) 7,95 % 8,57 %
Inflation rate 6,10 % 6,70 %
Expected rate of salary increases (Inflation +1%) 7,10 % 7,70 %
Expected rate of return on plan assets (Actuarial valuation) 7,95 % 8,57 %
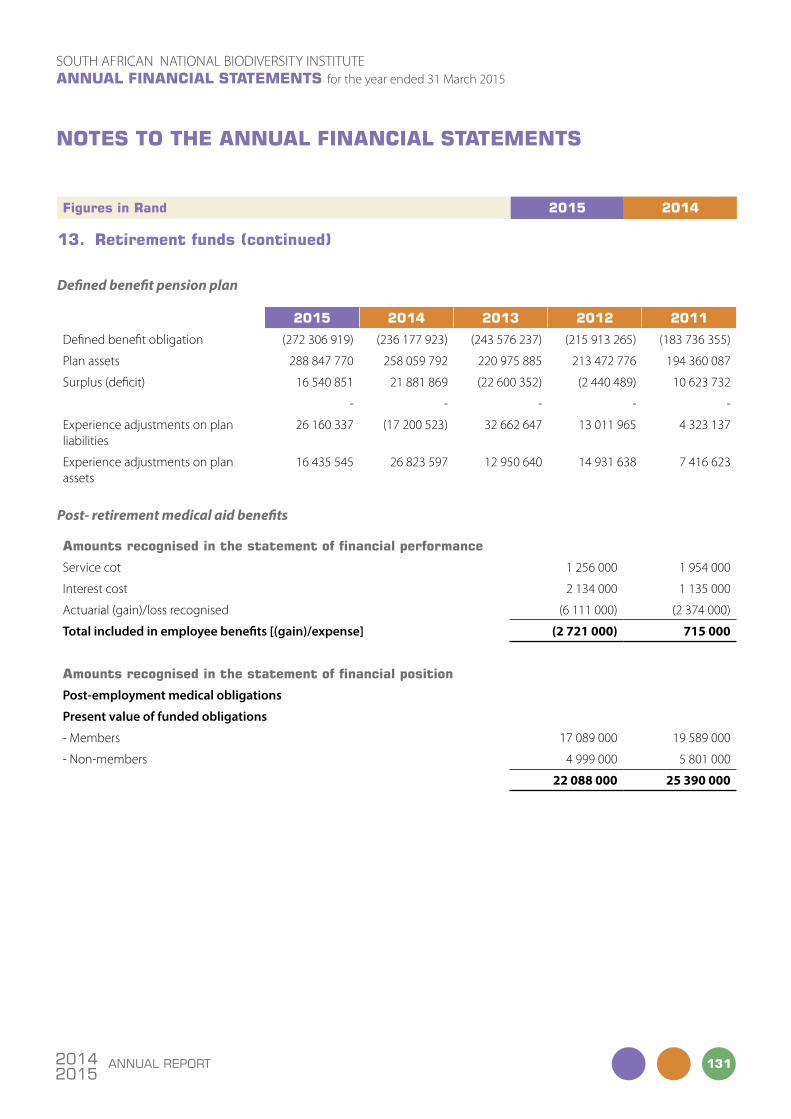
131ANNUAL REPORT20142015
SOUTH AFRICAN NATIONAL BIODIVERSITY INSTITUTEANNUAL FINANCIAL STATEMENTS for the year ended 31 March 2015
NoTES To ThE ANNUAL FINANCIAL STATEMENTS
Figures in rand 2015 2014
13. retirement funds (continued)
Defined benefit pension plan
2015 2014 2013 2012 2011
Defined benefit obligation (272 306 919) (236 177 923) (243 576 237) (215 913 265) (183 736 355)
Plan assets 288 847 770 258 059 792 220 975 885 213 472 776 194 360 087
Surplus (deficit) 16 540 851 21 881 869 (22 600 352) (2 440 489) 10 623 732
- - - - -
Experience adjustments on plan liabilities
26 160 337 (17 200 523) 32 662 647 13 011 965 4 323 137
Experience adjustments on plan assets
16 435 545 26 823 597 12 950 640 14 931 638 7 416 623
Post- retirement medical aid benefits
amounts recognised in the statement of financial performance
Service cot 1 256 000 1 954 000
Interest cost 2 134 000 1 135 000
Actuarial (gain)/loss recognised (6 111 000) (2 374 000)
Total included in employee benefits [(gain)/expense] (2 721 000) 715 000
amounts recognised in the statement of financial position
Post-employment medical obligations
Present value of funded obligations
- Members 17 089 000 19 589 000
- Non-members 4 999 000 5 801 000
22 088 000 25 390 000

ANNUAL REPORT132 20142015
SOUTH AFRICAN NATIONAL BIODIVERSITY INSTITUTEANNUAL FINANCIAL STATEMENTS for the year ended 31 March 2015
NoTES To ThE ANNUAL FINANCIAL STATEMENTS
Figures in rand 2015 2014
13. retirement funds (continued)
Movements in the net liability in the statement of financial position
Post-employment medical obligation
Net liability at start of year 25 390 000 25 225 000
Interest cost 2 134 000 1 135 000
Current service cost 1 256 000 1 954 000
Benefit payment (581 000) (550 000)
Projected accrued services liability at end of the year 28 199 000 27 764 000
Actuarial (gain) loss (6 111 000) (2 374 000)
22 088 000 25 390 000
principal actuarial assumptions at statement of reporting date
Discount rate 31 March (%) 8,80 % 8,50 %
general increases to medical aid subsidy (%) 7,98 % 7,50 %
Proportion continuing membership at retirement (%) 100,00 % 100,00 %
Proportion of retiring members who are married (%) 90,00 % 90,00 %
Retirement age (years) 65 65
Projection of liability to 31 March 2016
The project of the results from 01 April 2015 to 31 March 2016, assuming that the experience follows the assumptions exactly, is
as follows:
post-employment medical obligation:
Net liability at start of year 1 April 2015 22 088 000
Interest cost 1 919 000
Current service cost 1 068 000
Benefit payments (556 000)
Projected accrued service liability as at 31 March 2016 24 519 000
Sensitivity analysis
The results are dependent on the assumptions used. In order to illustrate the sensitivity of the Actuarial results to changes in certain key variables, the Actuaries have recalculated the liabilities using the following assumptions:
• A 1% increase / decrease in the Medical Aid maxium cap inflation will result in the following amounts as disclosed below;
• A PA(90) and PA(90)-2 in the assumed level of mortality will result in the following amounts as disclosed below PA(90)-2 (PA(90) with a two-year adjustment) means that, to each beneficiary a mortality rate of an individual two years younger than that beneficiary was attached. A lighter mortality rate implies that the individual lives longer than expected in the valuation basis.
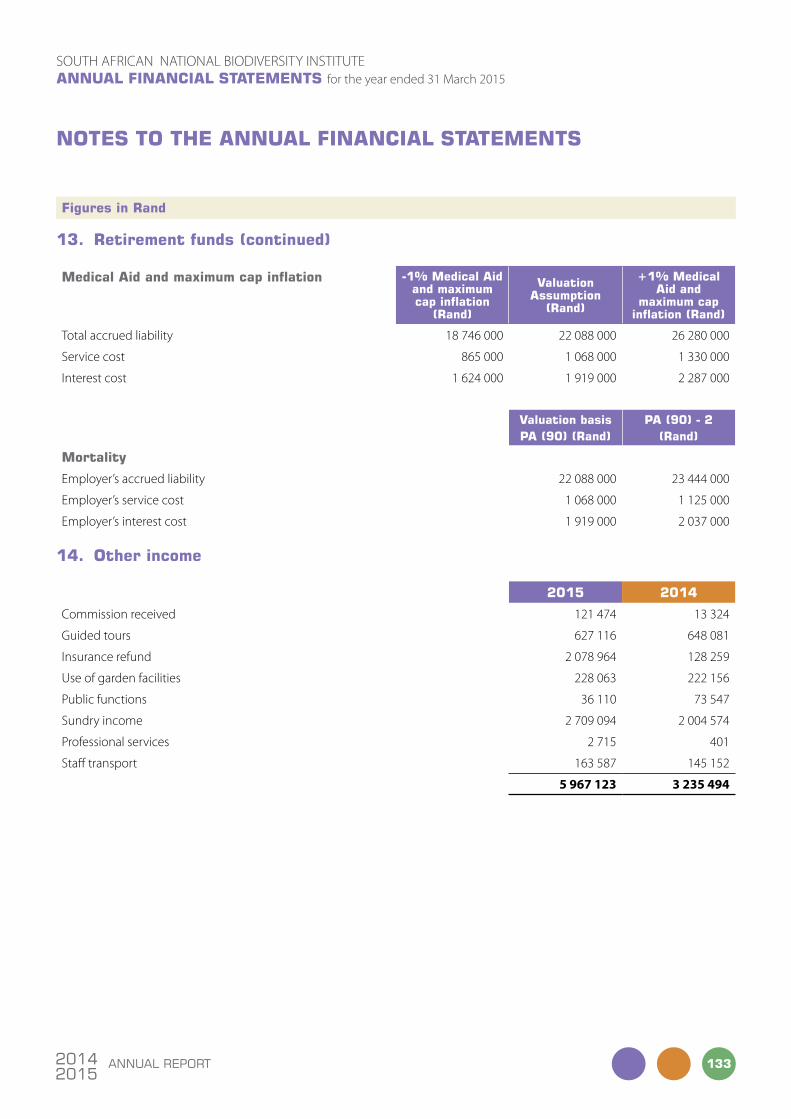
133ANNUAL REPORT20142015
SOUTH AFRICAN NATIONAL BIODIVERSITY INSTITUTEANNUAL FINANCIAL STATEMENTS for the year ended 31 March 2015
NoTES To ThE ANNUAL FINANCIAL STATEMENTS
Figures in rand
13. retirement funds (continued)
Medical aid and maximum cap inflation -1% Medical aid and maximum cap inflation
(rand)
valuation assumption
(rand)
+1% Medical aid and
maximum cap inflation (rand)
Total accrued liability 18 746 000 22 088 000 26 280 000
Service cost 865 000 1 068 000 1 330 000
Interest cost 1 624 000 1 919 000 2 287 000
valuation basispa (90) (rand)
pa (90) - 2(rand)
Mortality
Employer’s accrued liability 22 088 000 23 444 000
Employer’s service cost 1 068 000 1 125 000
Employer’s interest cost 1 919 000 2 037 000
14. other income
2015 2014
Commission received 121 474 13 324
guided tours 627 116 648 081
Insurance refund 2 078 964 128 259
Use of garden facilities 228 063 222 156
Public functions 36 110 73 547
Sundry income 2 709 094 2 004 574
Professional services 2 715 401
Staff transport 163 587 145 152
5 967 123 3 235 494

ANNUAL REPORT134 20142015
SOUTH AFRICAN NATIONAL BIODIVERSITY INSTITUTEANNUAL FINANCIAL STATEMENTS for the year ended 31 March 2015
NoTES To ThE ANNUAL FINANCIAL STATEMENTS
Figures in rand 2015 2014
15. other grants, sponsorships and donations
Other grants, sponsorships and donations 245 748 186 206 534 222
Total public contributions and donations 305 066 072 251 987 829
Unspent conditional grants and receipts (59 317 886) (45 453 607)
245 748 186 206 534 222
Refer to annexure A for detailed schedule on other grants, sponsorships and donations.
16. employee related costs
Basic 255 470 609 205 400 126
Medical aid - company contributions 636 262 622 507
WCA 745 414 1 270 359
Pensioners annuities 4 307 10 122
SMS: Allowances 11 266 844 10 327 483
Cell phone allowances 610 332 -
Overtime payments 3 979 757 3 606 248
Housing benefits and allowances 5 248 350 5 013 900
277 961 875 226 250 745
Employee related costs - MTEF funded 194 155 033 151 961 102
Employee related costs - Projects funded 83 806 842 74 289 643
277 961 875 226 250 745
17. debt impairment
Provision for impairment movement (87 291) -
Bad debts written off 193 639 683 107
106 348 683 107
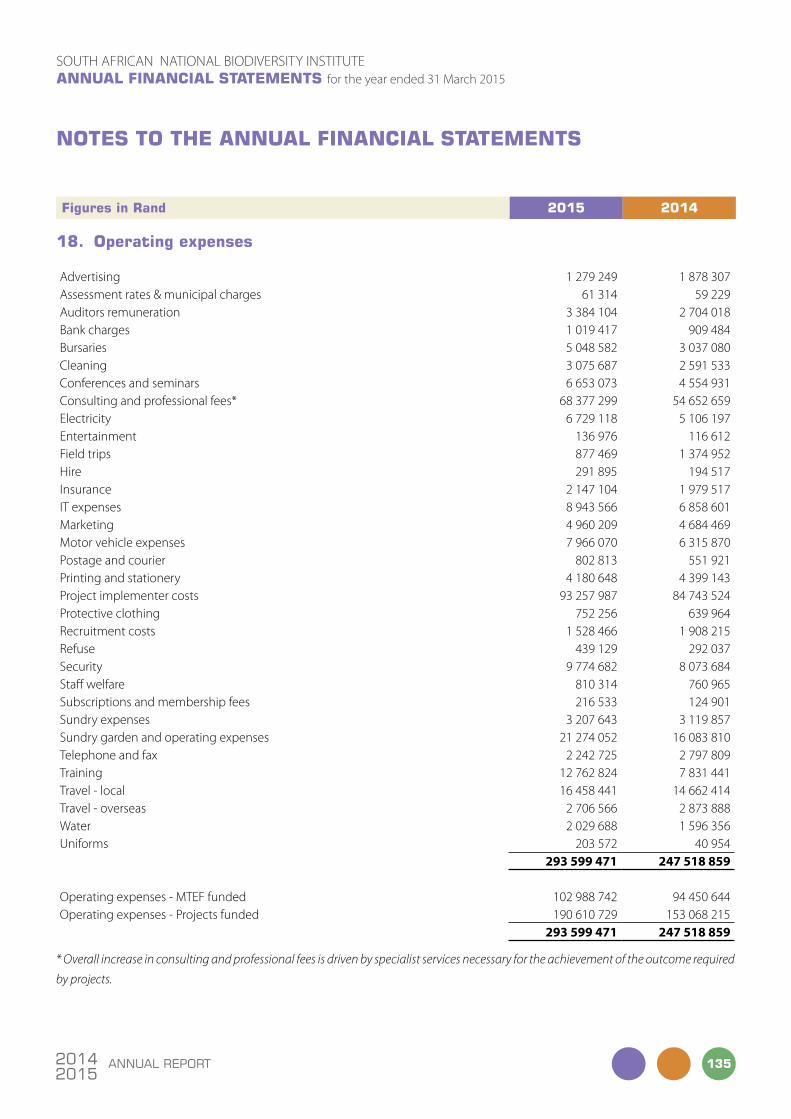
135ANNUAL REPORT20142015
SOUTH AFRICAN NATIONAL BIODIVERSITY INSTITUTEANNUAL FINANCIAL STATEMENTS for the year ended 31 March 2015
NoTES To ThE ANNUAL FINANCIAL STATEMENTS
Figures in rand 2015 2014
18. operating expenses
Advertising 1 279 249 1 878 307Assessment rates & municipal charges 61 314 59 229Auditors remuneration 3 384 104 2 704 018Bank charges 1 019 417 909 484Bursaries 5 048 582 3 037 080Cleaning 3 075 687 2 591 533Conferences and seminars 6 653 073 4 554 931Consulting and professional fees* 68 377 299 54 652 659Electricity 6 729 118 5 106 197Entertainment 136 976 116 612Field trips 877 469 1 374 952Hire 291 895 194 517Insurance 2 147 104 1 979 517IT expenses 8 943 566 6 858 601Marketing 4 960 209 4 684 469Motor vehicle expenses 7 966 070 6 315 870Postage and courier 802 813 551 921Printing and stationery 4 180 648 4 399 143Project implementer costs 93 257 987 84 743 524Protective clothing 752 256 639 964Recruitment costs 1 528 466 1 908 215Refuse 439 129 292 037Security 9 774 682 8 073 684Staff welfare 810 314 760 965Subscriptions and membership fees 216 533 124 901Sundry expenses 3 207 643 3 119 857Sundry garden and operating expenses 21 274 052 16 083 810Telephone and fax 2 242 725 2 797 809Training 12 762 824 7 831 441Travel - local 16 458 441 14 662 414Travel - overseas 2 706 566 2 873 888Water 2 029 688 1 596 356Uniforms 203 572 40 954
293 599 471 247 518 859
Operating expenses - MTEF funded 102 988 742 94 450 644Operating expenses - Projects funded 190 610 729 153 068 215
293 599 471 247 518 859
* Overall increase in consulting and professional fees is driven by specialist services necessary for the achievement of the outcome required
by projects.

ANNUAL REPORT136 20142015
SOUTH AFRICAN NATIONAL BIODIVERSITY INSTITUTEANNUAL FINANCIAL STATEMENTS for the year ended 31 March 2015
NoTES To ThE ANNUAL FINANCIAL STATEMENTS
Figures in rand 2015 2014
19. auditors’ remuneration
Fees 3 384 104 2 702 319
Expenses - 1 699
3 384 104 2 704 018
20. cash generated from operations
Surplus 26 916 302 39 819 975
Adjustments for:
Depreciation and amortisation 15 482 979 12 892 040
Loss on sale of assets 530 425 39 689
Fair value adjustments (2 223 657) (839 677)
Debt impairment 106 348 683 107
Movements in operating lease assets (163 901) -
Movements in retirement benefit assets and liabilities (3 302 000) (22 435 352)
Movements in provisions 26 810 (56 346)
Movement in non current payables from exchange transactions - (3 067 295)
Cost of sales 917 552 918 294
Loss on foreign exchange - 328 372
Changes in working capital:
Receivables from exchange transactions (690 752) (399 417)
Payables from exchange transactions 16 665 309 9 992 896
Unspent committed project funds 59 317 888 45 453 607
113 583 303 83 329 893

137ANNUAL REPORT20142015
SOUTH AFRICAN NATIONAL BIODIVERSITY INSTITUTEANNUAL FINANCIAL STATEMENTS for the year ended 31 March 2015
NoTES To ThE ANNUAL FINANCIAL STATEMENTS
Figures in rand 2015 2014
21. commitments
Authorised capital expenditureAlready approved and contracted for
• Capital project infrastructure 46 370 705 12 909 653
Total capital commitments
Already approved and contracted for 46 370 705 12 909 653
This committed expenditure relates to property and will be financed by retained surpluses, existing cash resources, funds internally generated and government grants.
operating leases - as lessee (expense)
Minimum lease payments due
• within one year 500 631 311 307
• in second to fifth year inclusive 461 643 144 786
962 274 456 093
Operating lease payments represent rentals payable by the entity for certain of its office equipment. Leases are negotiated for an
average term of three years and rentals are fixed for an average of three years. No contingent rent is payable.
22. contingencies
Guarantees
Staff housing guarantees, estimated maximum 118 170 118 170
Recoverable from retirement funds (118 170) (118 170)
- -
SANBI assists qualifying officials partly for housing loans from financial institutions. For this purpose agreements have been entered
into with approved financial institutions to the effect that SANBI will guarantee a maximum of 20% of the housing loan for which
a person qualifies. The maximum amount is based on the official’s basic salary. SANBI guaranteed 8 loans in the current year (2014:
8). The guarantees are fully recoverable from the employees’ cash portion of their retirement fund.
Claims submitted by third parties
Claims totalling R56 000 have been submitted by 3rd parties for injury suffered at some gardens. The claims have been submitted
to insurers for assessment of liability. The claims are still under investigation.
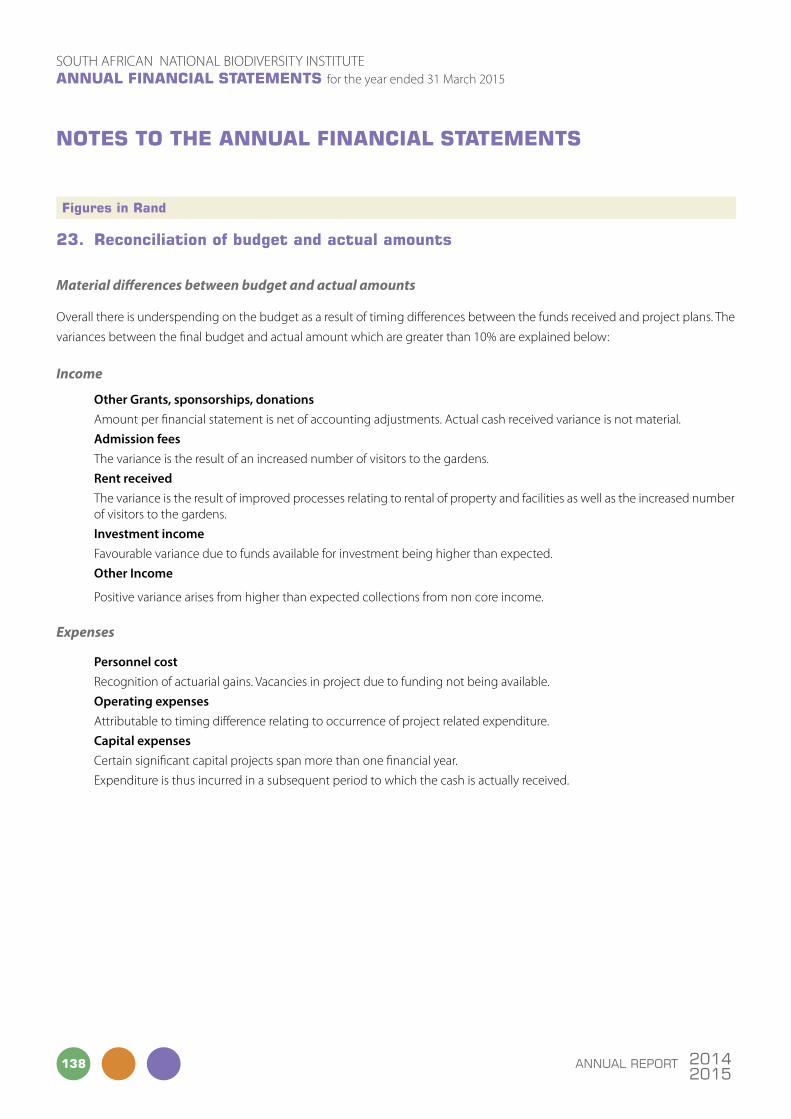
ANNUAL REPORT138 20142015
SOUTH AFRICAN NATIONAL BIODIVERSITY INSTITUTEANNUAL FINANCIAL STATEMENTS for the year ended 31 March 2015
NoTES To ThE ANNUAL FINANCIAL STATEMENTS
Figures in rand
23. reconciliation of budget and actual amounts
Material differences between budget and actual amounts
Overall there is underspending on the budget as a result of timing differences between the funds received and project plans. The
variances between the final budget and actual amount which are greater than 10% are explained below:
Income
Other Grants, sponsorships, donationsAmount per financial statement is net of accounting adjustments. Actual cash received variance is not material.
Admission feesThe variance is the result of an increased number of visitors to the gardens.
Rent receivedThe variance is the result of improved processes relating to rental of property and facilities as well as the increased number of visitors to the gardens.
Investment incomeFavourable variance due to funds available for investment being higher than expected.
Other Income
Positive variance arises from higher than expected collections from non core income.
Expenses
Personnel costRecognition of actuarial gains. vacancies in project due to funding not being available.
Operating expensesAttributable to timing difference relating to occurrence of project related expenditure.
Capital expensesCertain significant capital projects span more than one financial year.
Expenditure is thus incurred in a subsequent period to which the cash is actually received.

139ANNUAL REPORT20142015
SOUTH AFRICAN NATIONAL BIODIVERSITY INSTITUTEANNUAL FINANCIAL STATEMENTS for the year ended 31 March 2015
NoTES To ThE ANNUAL FINANCIAL STATEMENTS
Figures in rand 2015 2014
24. related parties
Relationships
Controlling entity Department of Environmental Affairs
Entities under common control of controlling entity South African National Parks South African Weather Services iSimangaliso Wetland Park
Members of key management Refer to note 27
related party balancesTrade receivablesDepartment of Environmental Affairs 84 649 84 649
South African National Parks 4 920 4 640
Trade payablesiSimangaliso Wetland Park 499 102 542 478
South African National Parks 1 341 325 1 058 977
related party transactionsGovernment grantsDepartment of Environmental Affairs 289 951 000 264 254 000
Other grants, sponsorships and donationsDepartment of Environmental Affairs 149 597 825 129 572 078
SalesDepartment of Environmental Affairs - 11 194
South African National Parks 4 920 4 640
PurchasesDepartment of Environmental Affairs 4 381 130 2 664 624
iSimangaliso Wetland Park 4 048 328 2 492 478
South African National Parks 12 474 042 10 001 031
South African National Biodiversity Institute mandate derives from the National Environmental Management Biodiversity Act
( No.10 of 2004) , and a national public entity as listed under Schedule 3A of the Public Finance Management Act, 1999 (Act No.
1 of 1999) as amended. In the ordinary course of business, the entity enters into various sales and purchase transactions on an arm’s length basis at market rates with other state controlled entities.
South African National Biodiversity Institute does not have control or significant influence over any other entity. Management is
required to declare all instances of interests in contracts relating to SANBI’s business.
Compensation to members and other key management
Fees and short-term employee benefits 12 363 621 11 608 725

ANNUAL REPORT140 20142015
SOUTH AFRICAN NATIONAL BIODIVERSITY INSTITUTEANNUAL FINANCIAL STATEMENTS for the year ended 31 March 2015
NoTES To ThE ANNUAL FINANCIAL STATEMENTS
Figures in rand
25. captial mangement policy
The objective of SANBI is to maintain a strong capital base so as to maintain public sector confidence and to sustain future
development of SANBI. The Institute is a schedule 3A public entity and reports to the Department of Environmental Affairs (DEA)
and the latter reports to National Treasury.
26. risk management
Financial risk management
The entity’s activities expose it to a variety of financial risks: market risk (including foreign exchange risk, fair value interest rate risk
and cash flow interest rate risk), credit risk and liquidity risk.
In the course of SANBI’s operations it is exposed to credit, liquidity and market risk. SANBI has developed a comprehensive risk
strategy in terms of Treasury Regulation 27.2 (require a public entity to have a comprehensive risk management strategy, which
includes a fraud prevention plan) in order to monitor and control these risks. The risk management process relating to each of
these risks is discussed under the headings below.
SANBI’s overall risk management programme focuses on the unpredictability of financial markets and seeks to minimise potential
adverse effects on SANBI’s financial performance. SANBI does not use derivative financial instruments to hedge risk exposures.
Risk management is performed by management under policies approved by the executive committee. Management identifies,
evaluates and manages financial risks in close co-operation with SANBI’s operating units.
Liquidity risk
The entity’s risk to liquidity is a result of the funds available to cover future commitments. The entity manages liquidity risk through
an ongoing review of future commitments and credit facilities. Cash flow forecasts are prepared.
Prudent liquidity risk management implies maintaining sufficient cash and obtaining the continued commitment from the
Department of Environmental Affairs for the government grant and related project funding.
Due to the nature of the business, management maintains flexibility in funding by maintaining expenses below budget.
The table below analyses SANBI’s financial liabilities into relevant maturity groupings based on the remaining period at the
statement of financial position date to the contractual maturity date. The amounts disclosed in the table are the contractual
undiscounted cash flows. Carrying amounts equate to their fair values.

141ANNUAL REPORT20142015
SOUTH AFRICAN NATIONAL BIODIVERSITY INSTITUTEANNUAL FINANCIAL STATEMENTS for the year ended 31 March 2015
NoTES To ThE ANNUAL FINANCIAL STATEMENTS
Figures in rand
26. risk management (continued)
at 31 March 2015 Current to 30 days 31 to 60 days 61 to 90 days Over 90 days
Trade and other payables 58 315 215 - - -
at 31 March 2014 Current to 30 days 31 to 60 days 61 to 90 days Over 90 days
Trade and other payables 43 012 018 - - -
Credit risk
Credit risk is the risk that one party to a financial instrument will cause a financial loss for the other party by failing to discharge
an obligation. Financial assets, which potentially subject SANBI to the risk of non performance by counter parties, consist mainly
of cash and cash equivalents and accounts receivable. SANBI limits its treasury counter-party exposure by only dealing with
well-established financial institutions approved by National Treasury through the approval of their cash management policy in
terms of Treasury Regulation. SANBI’s exposure is continuously monitored by the Accounting Authority. SANBI does not have
any material exposure to any individual or counter-party. SANBI’s largest concentration of credit risk is limited mainly to the sale
of plants. No events occurred in the industry during the financial year that may have an impact on the accounts receivable that
has not been adequately provided for. SANBI no longer assists qualifying employees to obtain 100% housing loans from financial
institutions without a cash deposit, as the financial institution concentrate more on the affordability other than what the staff
member qualifies for. However, these guarantees are fully recoverable from the employees’ cash portion of their retirement fund.
Due to the nature of the Institute’s financial instruments it is highly unlikely that the Institute will encounter difficulty in raising
funds to meet commitments associated with financial instruments.
2015 2014
Maximum exposure to credit risk of financial assets at year-end
Trade receivables 3 540 723 3 228 375
Cash and cash equivalents 277 902 420 197 819 263
guaranteed loans 29 500 118 170
281 472 643 201 165 808
Fair value of financial assets at year-end
Trade receivables 3 540 723 3 228 375
Cash and cash equivalents 277 902 420 197 819 263
281 443 143 201 047 638

ANNUAL REPORT142 20142015
SOUTH AFRICAN NATIONAL BIODIVERSITY INSTITUTEANNUAL FINANCIAL STATEMENTS for the year ended 31 March 2015
NoTES To ThE ANNUAL FINANCIAL STATEMENTS
Figures in rand 2015 2014
26. risk management (continued)
Market risk
Interest rate risk
Interest rate risk is the risk that the fair value or future cash flows of a financial instrument will fluctuate because of changes in
market interest rates. SANBI obtains competitive rates from approved financial institutions on a monthly basis.
As SANBI has significant interest-bearing assets, hence SANBI’s income and operating cash flows are dependent on changes in
market interest rates. SANBI reviews its interest rate exposure on a regular basis. Market rates are compared with stable and credit-
rated financial institutions. various institutional rates are simulated taking into consideration terms of deposits, availability of cash
resources and any related risk factors. SANBI’s exposure to interest rate risk and the effective interest rates on financial instruments
at the financial reporting date are as follows:
assets
Cash deposits: 5% effective interest (2014: 5%) 171 536 106 157 515 968
sensitivity analysis
Investment income at a 1% deposit rate increase 1 715 361 1 575 160
sensitivity analysis
Investment income at a 1% deposit rate decrease (1 715 361) (1 575 160)
Based on these scenarios, the impact of a positive 1% shift in deposit interest rates will have a R 1,715,361 (2014: R 1,575,160) impact on income.
Foreign exchange risk
The entity does not operate internationally, but undertakes some transactions denominated in foreign currencies, and is thus
exposed to foreign exchange risk arising from fluctuations in foreign currencies. The entity does not hedge itself against exposure
to foreign exchange risk. Foreign currency exposure at financial year-end relates to trade payables and is disclosed in the note to
the annual report.

143ANNUAL REPORT20142015
SOUTH AFRICAN NATIONAL BIODIVERSITY INSTITUTEANNUAL FINANCIAL STATEMENTS for the year ended 31 March 2015
NoTES To ThE ANNUAL FINANCIAL STATEMENTS
Figures in rand 2015 2014
27. board and executive members’ emoluments
board and committee members
Ms ME Magomola (Board Chairperson) 19 072 15 940
Dr T Abrahamse (Chief Executive Officer)** - -
Dr K Badenhorst 18 120 8 726
Prof CT Chimimba 2 880 2 909
Dr ST Cornelius 39 696 30 288
Mr Jg Dladla 11 856 19 273
Dr S Liphadzi 3 048 -
Mr T Frost 53 840 47 626
Mr S gounden 26 760 2 909
Mr g Mashamba* - -
Dr JM Matjila 33 936 27 419
Mr F Mketeni* - -
Ms NN Mnqeta 35 904 20 206
Mr vK Naiker 15 072 8 571
Ms BD Ngidi 40 528 25 868
300 712 209 735
* No honoraria were paid - State employee
** Remunerated as Executive member

ANNUAL REPORT144 20142015
SOUTH AFRICAN NATIONAL BIODIVERSITY INSTITUTEANNUAL FINANCIAL STATEMENTS for the year ended 31 March 2015
NoTES To ThE ANNUAL FINANCIAL STATEMENTS
Figures in rand
27. board and executive members’ emoluments (continued)
executive members2015 basic
non pensionable allowances
performance bonjus
pension and medical
benefitstotal 2015
TE Abrahamse - Chief Executive Officer 1 149 780 499 759 133 880 121 138 1 904 557
CH Mbizvo - Head of Branch: Biodiversity Research, Policy and Knowledge Management 1 020 665 467 894 - 100 895 1 589 454
L Sithole - Chief Financial Officer 962 757 263 134 - 73 991 1 299 882
ME Khoahli - Chief Corporate Officer 767 955 345 492 55 888 87 221 1 256 556
MJ Netshiombo - Chief Director: Human Resources 844 152 195 279 51 879 92 936 1 184 246
CK Willis - Chief Director: Conservation gardens and Tourism 723 559 320 918 51 879 83 892 1 180 248
gF Smith - Chief Director: Biosystematics and Collections 818 173 279 388 - 71 068 1 168 629
JS Donaldson - Chief Director: Biodiversity Research, Information and Monitoring 702 330 311 079 50 357 82 299 1 146 065
KE Maze - Chief Director: Biodiversity Information and Policy Advice 702 330 305 799 50 357 87 579 1 146 065
gF Midgley - Chief Director: Climate Change Adaptation - resigned 30/04/2014 95 285 82 009 - 9 913 187 207
7 786 986 3 070 751 394 240 810 932 12 062 909

145ANNUAL REPORT20142015
SOUTH AFRICAN NATIONAL BIODIVERSITY INSTITUTEANNUAL FINANCIAL STATEMENTS for the year ended 31 March 2015
NoTES To ThE ANNUAL FINANCIAL STATEMENTS
Figures in rand
27. board and executive members’ emoluments (continued)
executive members2014 basic
non pensionable allowances
performance bonjus
pension and medical
benefitstotal 2014
TE Abrahamse - Chief Executive Officer
1 052 702 471 023 95 085 113 857 1 732 667
CH Mbizvo - Head of Branch: Biodiversity Research, Policy and Knowledge Management
852 959 384 603 72 769 88 316 1 398 647
ME Khoahli - Chief Corporate Officer
726 543 325 085 - 84 053 1 135 681
MJ Netshiombo - Chief Director: Human Resources
786 825 180 094 58 082 88 636 1 113 637
CK Willis - Chief Director: Conservation gardens and Tourism
674 421 297 208 58 082 80 206 1 109 917
TI Bouwer - Chief Financial Officer
504 471 120 305 - 38 876 663 652
gF Smith - Chief Director: Biosystematics and Collections
798 630 208 451 - 70 322 1 077 403
KE Maze - Chief Director: Biodiversity Information and Policy Advice
654 635 282 758 56 377 84 002 1 077 772
JS Donaldson - Chief Director: Biodiversity Research, Information and Monitoring
654 635 288 038 56 377 78 722 1 077 772
gF Midgley - Chief Director: Climate Change Adaptation
741 329 185 289 - 85 224 1 011 842
7 447 150 2 742 854 396 772 812 214 11 398 990
The executive members emoluments has changed from last year in that it only discloses the emoluments of the executive
committee members and excludes that of the management committee emoluments as previously disclosed.

ANNUAL REPORT146 20142015
SOUTH AFRICAN NATIONAL BIODIVERSITY INSTITUTEANNUAL FINANCIAL STATEMENTS for the year ended 31 March 2015
NoTES To ThE ANNUAL FINANCIAL STATEMENTS
Figures in rand 2015 2014
28. operating lease - as lessor
Minimum lease payments due
• Within one year 3 497 272 3 764 233
• Between two to five years 9 814 778 11 309 365
• Later than five years 2 648 934 4 651 619
15 960 984 19 725 217
29. prior period errors
Related parties disclosure under note 24 - Other grants, sponsorships and donations, relating to the Department of Environmental
Affairs has been restated from R 92 823 667 to reflect the total contributions of R 129 572 078. This adjustment did not have an
impact on the balance sheet or income statement.
30. comparative figures
Certain comparative figures have been reclassified in order to align with the current year presentation.The reclassification had
no effect on the net surplus recorded in the prior year financial statements.The income statement expenditure reclassification is
tabled below disclosing current disclosure as compared to that of previous year.
statement of Financial performance
Operating expenses 247 518 856 163 690 460
Project implementer’s cost - 84 243 524
Audit fees - 2 704 018
Lease rentals on operating leases 447 763 -
Debt impairment 683 107 -
Repairs and maintenance 1 988 276 -
31. losses due to fraud
Inculded in operating expenses is an amount of R12 737 arising from fraudulent travel claims submitted by an employee. The
employee was dismissed after due disciplinary process. The Institute will attempt to recover the money due to SANBI through a
civil claim.
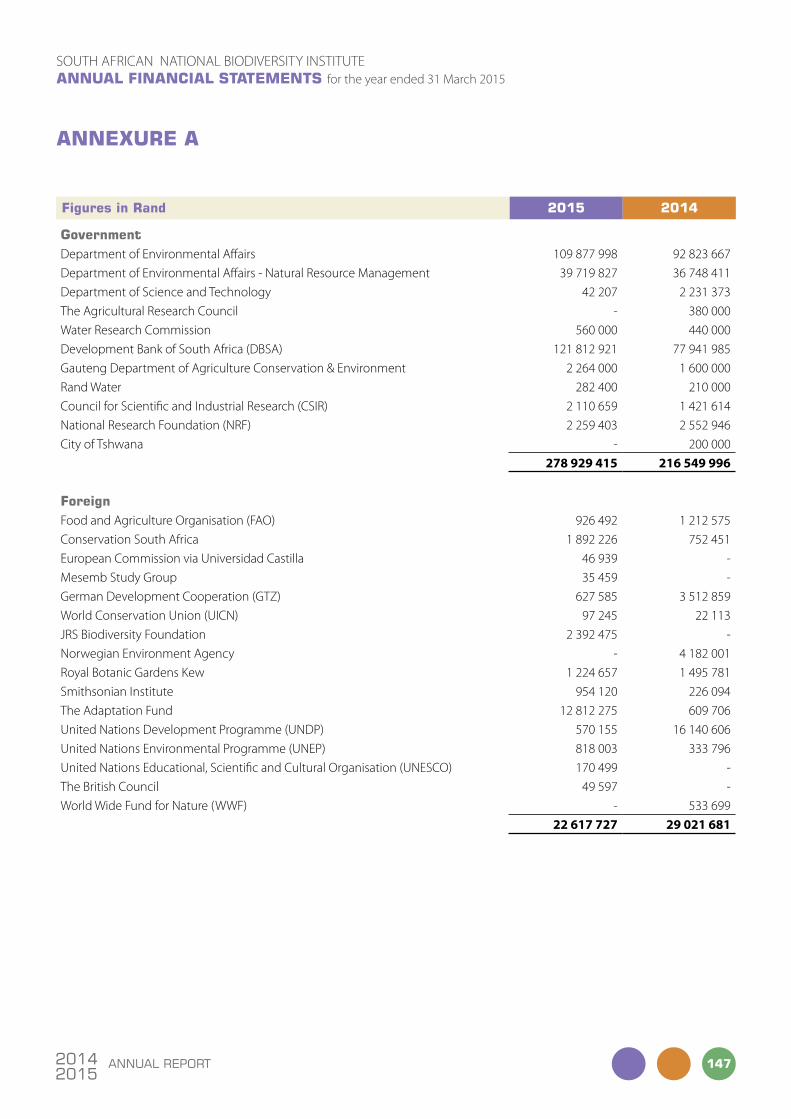
147ANNUAL REPORT20142015
SOUTH AFRICAN NATIONAL BIODIVERSITY INSTITUTEANNUAL FINANCIAL STATEMENTS for the year ended 31 March 2015
ANNExUrE A
Figures in rand 2015 2014
governmentDepartment of Environmental Affairs 109 877 998 92 823 667
Department of Environmental Affairs - Natural Resource Management 39 719 827 36 748 411
Department of Science and Technology 42 207 2 231 373
The Agricultural Research Council - 380 000
Water Research Commission 560 000 440 000
Development Bank of South Africa (DBSA) 121 812 921 77 941 985
gauteng Department of Agriculture Conservation & Environment 2 264 000 1 600 000
Rand Water 282 400 210 000
Council for Scientific and Industrial Research (CSIR) 2 110 659 1 421 614
National Research Foundation (NRF) 2 259 403 2 552 946
City of Tshwana - 200 000
278 929 415 216 549 996
ForeignFood and Agriculture Organisation (FAO) 926 492 1 212 575
Conservation South Africa 1 892 226 752 451
European Commission via Universidad Castilla 46 939 -
Mesemb Study group 35 459 -
german Development Cooperation (gTZ) 627 585 3 512 859
World Conservation Union (UICN) 97 245 22 113
JRS Biodiversity Foundation 2 392 475 -
Norwegian Environment Agency - 4 182 001
Royal Botanic gardens Kew 1 224 657 1 495 781
Smithsonian Institute 954 120 226 094
The Adaptation Fund 12 812 275 609 706
United Nations Development Programme (UNDP) 570 155 16 140 606
United Nations Environmental Programme (UNEP) 818 003 333 796
United Nations Educational, Scientific and Cultural Organisation (UNESCO) 170 499 -
The British Council 49 597 -
World Wide Fund for Nature (WWF) - 533 699
22 617 727 29 021 681
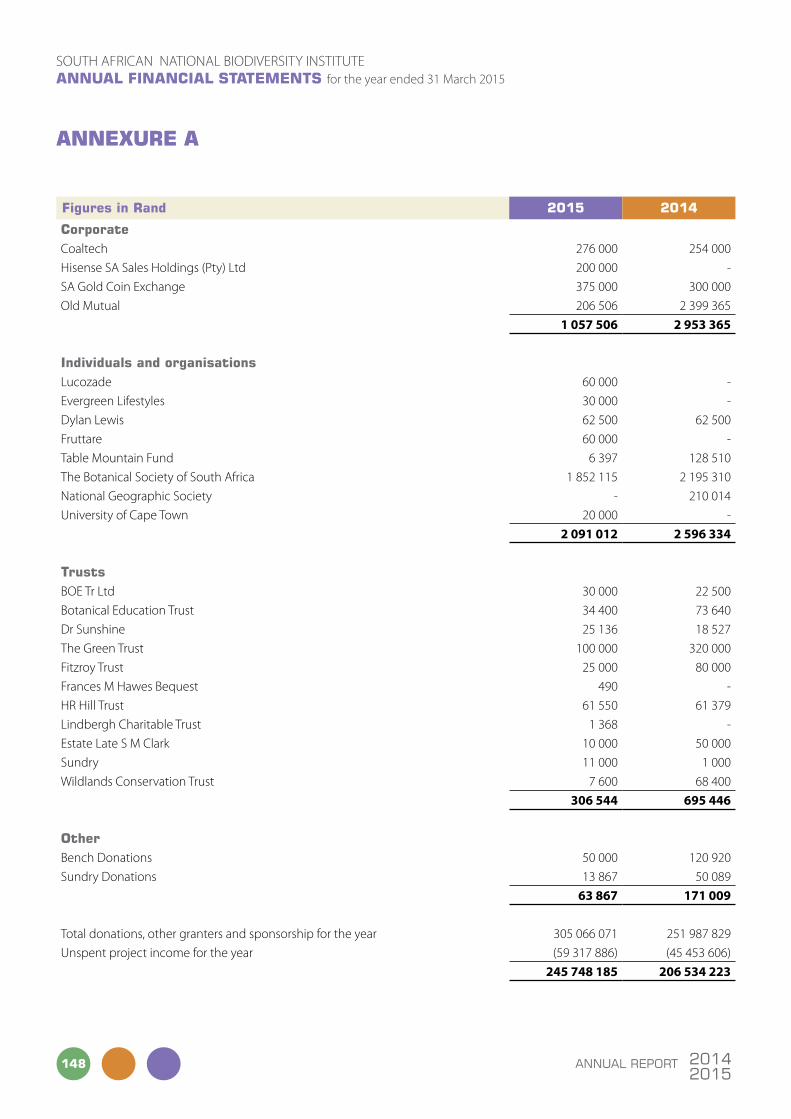
ANNUAL REPORT148 20142015
SOUTH AFRICAN NATIONAL BIODIVERSITY INSTITUTEANNUAL FINANCIAL STATEMENTS for the year ended 31 March 2015
ANNExUrE Aannexure a
Figures in rand 2015 2014
corporateCoaltech 276 000 254 000
Hisense SA Sales Holdings (Pty) Ltd 200 000 -
SA gold Coin Exchange 375 000 300 000
Old Mutual 206 506 2 399 365
1 057 506 2 953 365
individuals and organisationsLucozade 60 000 -
Evergreen Lifestyles 30 000 -
Dylan Lewis 62 500 62 500
Fruttare 60 000 -
Table Mountain Fund 6 397 128 510
The Botanical Society of South Africa 1 852 115 2 195 310
National geographic Society - 210 014
University of Cape Town 20 000 -
2 091 012 2 596 334
trustsBOE Tr Ltd 30 000 22 500
Botanical Education Trust 34 400 73 640
Dr Sunshine 25 136 18 527
The green Trust 100 000 320 000
Fitzroy Trust 25 000 80 000
Frances M Hawes Bequest 490 -
HR Hill Trust 61 550 61 379
Lindbergh Charitable Trust 1 368 -
Estate Late S M Clark 10 000 50 000
Sundry 11 000 1 000
Wildlands Conservation Trust 7 600 68 400
306 544 695 446
otherBench Donations 50 000 120 920
Sundry Donations 13 867 50 089
63 867 171 009
Total donations, other granters and sponsorship for the year 305 066 071 251 987 829
Unspent project income for the year (59 317 886) (45 453 606)
245 748 185 206 534 223

149ANNUAL REPORT20142015
SOUTH AFRICAN NATIONAL BIODIVERSITY INSTITUTEANNUAL FINANCIAL STATEMENTS for the year ended 31 March 2015
notes

ANNUAL REPORT150 20142015
SOUTH AFRICAN NATIONAL BIODIVERSITY INSTITUTEANNUAL FINANCIAL STATEMENTS for the year ended 31 March 2015
notes
151ANNUAL REPORT20142015
SOUTH AFRICAN NATIONAL BIODIVERSITY INSTITUTEANNUAL FINANCIAL STATEMENTS for the year ended 31 March 2015
notes
ANNUAL REPORT152 20142015
SOUTH AFRICAN NATIONAL BIODIVERSITY INSTITUTEANNUAL FINANCIAL STATEMENTS for the year ended 31 March 2015
notes


We acknowledge the photographic contributions
of SANBI staff, fellow researchers and
conservationists with appreciation.
For submission in terms of the
Public Finance Management Act,
No. 1 of 1999, August 2012
ISSN 1021-7460
Visit our website at www.sanbi.org
Copies of this report
are available from:
SANBI:
Private Bag X7, Claremont, 7735
Tel: 021 799 8800 • Fax: 021 762 3229
or
Private Bag X101, Silverton, 0184
Tel: 012 843 5000 • Fax: 012 804 3211