Annual Report | 2014-15 · New. No. 6, Old No. 12, Appavoo Gramani 1st Street, Mandaveli, Chennai -...
162
Transcript of Annual Report | 2014-15 · New. No. 6, Old No. 12, Appavoo Gramani 1st Street, Mandaveli, Chennai -...


Annual Report | 2014-15
SOLUTIONS THAT SUSTAIN LIFE
TECHNOLOGY &
INNOVATION
TOTAL WATER
SOLUTIONS
CUSTOMER
FOCUS
ENGINEERING
EXCELLENCE
ECOLOGICAL
BALANCE
GLOBAL
FOOTPRINT
Forward-looking statement
In this Annual Report, we have disclosed forward looking information
to enable investors to comprehend our prospects and take investment
decisions. This report and other statements - written and oral - that
we periodically make contain forward looking statements that set out
anticipated results based on the management’s plans and assumptions.
We have tried, wherever possible, to identify such statements by using
words such as ‘anticipate’, ‘estimate’, ‘expects’, ‘projects’, ‘intends’,
‘plans’, ‘believes’, and words of similar substance in connection with
any discussion of future performance. We cannot guarantee that these
forward looking statements will be realised, although we believe we
have been prudent in our assumptions. The achievements of results
are subject to risks, uncertainties and even inaccurate assumptions.
Should known or unknown risks or uncertainties materialize, or
should underlying assumptions prove inaccurate, actual results
could vary materially from those anticipated, estimated or projected.
Readers should keep this in mind. We undertake no obligation to
publicly update any forward looking statement, whether as a result of
new information, future events or otherwise.
CORPORATE OVERVIEWCorporate Information 1
World of WABAG 4
Value through vision
Project canvas
6
8
Sustainable Performance 10
Chairman’s Communiqué 12
Managing Director’s Insight 14
Case Studies 16
Performing with a global mandate 26
Co-creating shared value 28
STATUTORY REPORTSDirectors’ Report 30
Management’s Discussion and Analysis 54
Report on Corporate Governance 70
FINANCIAL STATEMENTSStandalone Financials 86
Consolidated Financials 122
CONTENTS

Registered & Corporate Office‘WABAG HOUSE’No. 17, 200 Feet Thoraipakkam - Pallavaram Main Road,Sunnambu Kolathur,Chennai - 600 117 P: +91 44 - 3923 2323F: +91 44 - 3923 2324
Statutory AuditorsWalker Chandiok & Co LLPChartered AccountantsArihant Nitco Park, 6th floorNo. 90, Dr. Radhakrishnan SalaiMylapore, Chennai - 600 004 P: +91 44 - 4294 0000
Internal AuditorsG. Balu AssociatesChartered Accountants4 - A, Venkatesa Agraharam RoadMylapore, Chennai - 600 004 P : +91 44 - 2464 2377
Cost AuditorS.Chandrasekaran,Practicing Cost Accountant, Membership No. 47844 Sreshta, 57 Subramaniam Street, Abhiramapuram, Chennai - 600 018. P: +91 44 - 2499 0286
Secretarial AuditorM.Damodaran,Practicing Company Secretary,Membership No. 5837,M. Damodaran & Associates,New. No. 6, Old No. 12, Appavoo Gramani1st Street, Mandaveli, Chennai - 600 028.P : +91 44 4360 1111
Registrar and Transfer AgentsKarvy Computershare Private Limited,Unit : VA TECH WABAG LIMITEDKarvy Selenium Tower B, Plot 31-32, Gachibowli,Financial District, Nanakramguda, Hyderabad - 500 032Mr. B. Srinivas,P : +91 40 6716 1530Email : [email protected]
Bankers Axis Bank Limited HDFC Bank Limited ICICI Bank Limited IDBI Bank Limited Kotak Mahindra Bank Limited Punjab National Bank Societe Generale Bank Standard Chartered Bank State Bank of India The Hongkong and Shanghai Banking Corporation Limited
YES Bank Limited
Board CommitteesAudit CommitteeBhagwan Dass NarangChairmanJaithirth Rao
Sumit Chandwani
Stakeholders Relationship CommitteeSumit ChandwaniChairmanRajiv Mittal
Corporate Social ResponsibilityCommitteeRevathi KasturiChairpersonSumit Chandwani
Rajiv Mittal
Nomination and RemunerationCommitteeRevathi KasturiChairpersonBhagwan Dass Narang
Sumit Chandwani
Rajiv Mittal
Monitoring CommitteeBhagwan Dass NarangChairmanSumit Chandwani
Revathi Kasturi
Rajiv Mittal
Corporate InformationThe Board
Bhagwan Dass Narang
Independent Chairman
S. Varadarajan
Chief Financial Officer
Rajiv Balakrishnan
Company Secretary
Rajiv Mittal
Managing Director & Group CEO
Jaithirth Rao
Independent Director
Revathi Kasturi
Independent Director
Sumit Chandwani
Independent Director


3
Of all our planet’s resources, perhaps none has greater
influence in our lives than water. Water shapes, renews
and nourishes life.
To support the world’s growing population, consumption
and industrial activity we need more water everyday.
Nature can’t always be bountiful. Therefore, the way
forward is to innovate and create newer and sustainable
solutions that can drive change in the water landscape.
In the global movement for the optimal management,
conservation and recycle of this precious resource, WABAG
acts as a reliable partner.
Our nine decades of rich experience has enabled us to
design, build and operate drinking water and waste water
plants for both municipal and industrial sectors globally.
Our customers rely on us, because we provide
environmentally compatible solutions, backed by advanced
technologies, meticulous research and wide-ranging
innovations.
WABAG’s solutions support communities and industries
across the world in making the most of this precious natural
resource.
And in so doing, we contribute towards sustaining life on Earth.

4 VA TECH WABAG LIMITED | Annual Report 2014-15
World of WABAG
Ranked among Top
10 desalination
companies in the
world
Top 10
The WABAG brand is
trusted and respected
globally for its nine-
decade-old know-how
and domain expertise
9+ decades
We have over hundred
patented technologies
helping us to customise
projects, based on
customer requirements
and offer solutions..
100+ patents
` 422 Crore
Cash balance reflects
our balance
sheet’s liquidity
quotient
2,300+ projects
Project reference list of
more than 2,250 projects
built over the past
three decades, giving us
expertise and experience
to pre-qualify for complex
and large projects.
World of WABAG

5
30+ years
Professionally
managed Company
with promoters having
an average of 30 years
work experience in
the industry
3State-of-the-art
R&D centres
driving consistent
innovation
30+ countries
Presence across diverse
geographies spanning
three continents,
minimising geographic
concentration risk
2,000+Global team
strength
` 5,439+ Crore
Firm order book ensuring
sustainable revenue
inflow for the
coming years.
Financial
Statements
Statutory
Reports
Corporate
Overview

6 VA TECH WABAG LIMITED | Annual Report 2014-15
Value through vision
Value through vision
WABAG represents a confluence of tradition and modernity, inspired by a vision to serve customers and the wider community of stakeholders.
Our plants facilitate waste water disposal and secure access to clean drinking water for a growing number of people from Europe, Africa and Asia.
Our visionWABAG shall be a professionally managed Indian
Multinational having Market Leadership in Emerging
Markets and significant position in the Global Market both
in the EPC and Service Sector of Water Business
WABAG shall encourage and practice a culture of Caring,
Trust and Continuous Learning, while meeting Expectations
of Employees, Stakeholders and Society.
WABAG-ites shall be an Innovative, Entrepreneurial and
Empowered Team committed to Total Customer Satisfaction
and Value Creation.
Our missionWe, at WABAG, exist to provide total water solutions to our
valued customers.
Our strong, capable, agile and customer focused team shall
ensure that every customer solution is creative, priced
competitively and provided in the agreed time frame with
essence of quality at optimum cost.
We, at WABAG, always have concern for the welfare of our
employees and shall do everything it takes to attract and
retain the best of the talent.

7
Financial
Statements
Statutory
Reports
Corporate
Overview
Credible certifications Quality management system conforms to international
standards (ISO 9001:2008)
Highest standards in health, safety and environment
(HSE) (ISO 14001 and OHSAS 18001 certifications)
Awards and accolades WABAG was chosen as one of the Billion Dollar Babies
by TIECON. TIECON is a not-for-profit organisation who
focuses on development of entrepreneurship.
The Engineering Export Promotion Council (EEPC) India
presented Export Excellence Awards for 2012-13 under
the category - ‘Project Exports-Large Enterprise’
The Indian Desalination Association conferred the
‘Lifetime Achievement Award’ to our Managing
Director & Group CEO, Mr. Rajiv Mittal, recognising his
contribution to the water and desalination industry and
entrepreneurial excellence.
Won the Researchbytes IC Awards 2014 for the Best
Investor Communication Practice (Category - Small Cap)
WABAG’s Industrial Project in Namibia wins the
Distinction Award for ‘Industrial Water Project of the Year,
2015’ at the Global Water Summit held in Athens, Greece
Won the ‘Water Digest - Water Awards’ in the category
‘Best Desalination project company’
Our rich heritage The WABAG brand is in existence since 1924
WABAG is in the water treatment business in India since
1996
One of the few pure-play water technology companies in
the world
Our offeringsWe provide turnkey solution in the following categories:
Drinking water treatment
Industrial waste water treatment
Municipal waste water treatment
Industrial and process water treatment
Desalination (sea water and brackish water)
Recycling (industrial and municipal waste water)
End-to-end solution provider
CONCEPTUAL AND PROCESS ENGINEERING
DESIGN & ENGINEERING
EQUIPMENT SUPPLY
PROCUREMENT & CONSTRUCTION
ERECTION & COMMISSIONING
OPERATIONS & MAINTENANCE
The water expert An extensive technology portfolio with more than 100
patents
Proven process know-how and experience
Provide complete water solutions: Engineering,
Procurement and Construction (EPC), Design-Build-
Operate (DBO) and Build-Own-Operate-Transfer (BOOT)
Experience as a reclamation plant operator
Multinational experience, which ensures an
understanding of different local needs
Opportunity to leverage low-cost economic advantage in
the global market
In-house R&D centres in Austria, India and Switzerland

Project canvas
8 VA TECH WABAG LIMITED | Annual Report 2014-15
ONGC Mangalore
Petrochemicals (OMPL)
- DM Plant and CPU
Flow more - Rourkela Steel Plant (SAIL) – (20 nos). High Rate Mill Scale Filtration System
Reliance Dahej
PTA Waste Water
Treatment Plant
Reliance Hazira Effluent Recycle Plant
Werdhölzli WWTP,
Zurich, Switzerland
Plant Water System
for Durgapur Projects
Limited
Siverek WWTP,
Turkey
Ujams Industrial
Water Reclamation
Plant with patented
Fine Sieve Technology
Pappankalan STP for
Delhi Jal Board
Major projects executed during FY 2014-15
Project canvas

9
Design, Construction
and Commissioning
of 147 MLD Water
Treatment Plant
(WTP) for KMDA - West
Bengal, India
60 MLD Sewage
Treatment Plant
(STP) funded by World
Bank - Valenzuela, the
Philippines
Design and Construction
of 140 MLD Sewage
Treatment Plant (STP)
under Ganga Action
Plan Project funded by
JICA for UP Jal Nigam -
Varanasi, India
O&M of all the Waste
Water Treatment
Plants (WWTPs) and
Waste Water Pumping
Stations of Istanbul
Mega City - Istanbul,
Turkey
Waste Water Treatment
Plant for the new
industrial park of the
Al Kharj city - Saudi
Arabia
Produced water
treatment plant
(PWTP) from OMV
Petrom SA - Romania
Major orders bagged during FY 2014-15
Financial
Statements
Statutory
Reports
Corporate
Overview
10 VA TECH WABAG LIMITED | Annual Report 2014-15
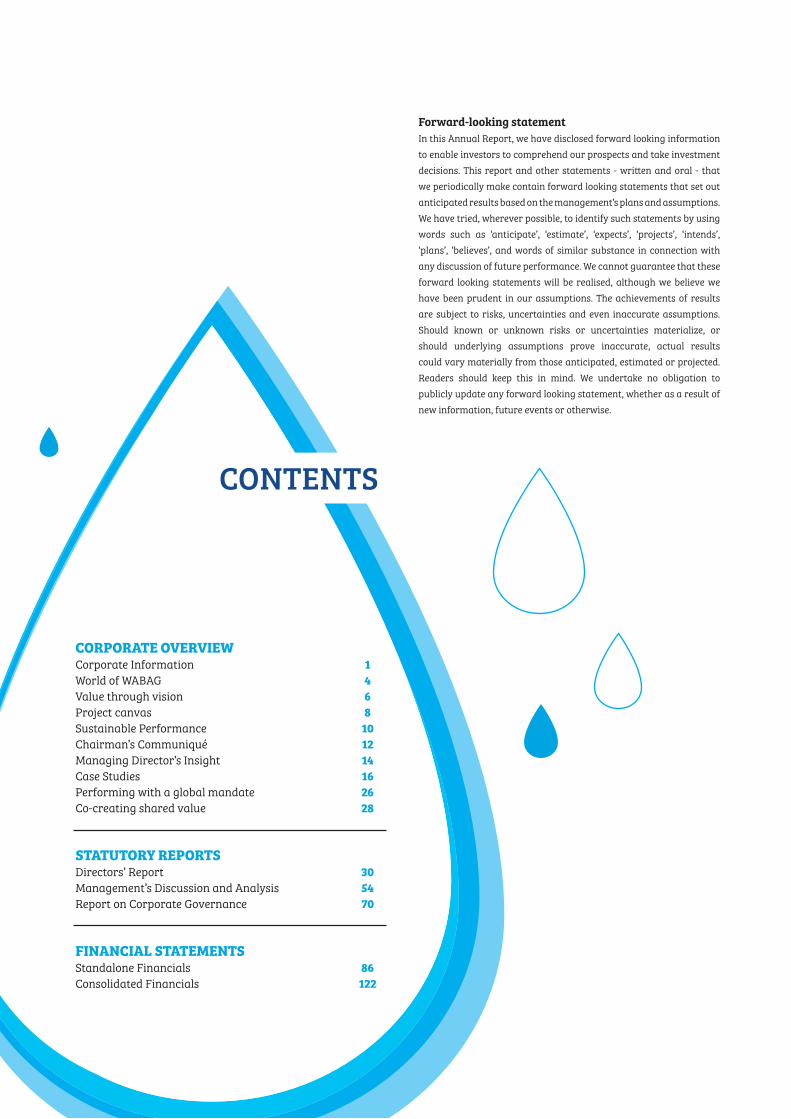
Sustainable Performance
10-11
11-12
12-13
13-14
14-15
3,402
3,731
4,284
5,354
5,439
Order book (` in Crore)
12.45%5-year CAGR
10-11
11-12
12-13
13-14
14-15
570.96
643.00
717.33
843.99
907.63
Net worth (` in Crore)
12.29%5-year CAGR
10-11
11-12
12-13
13-14
14-15
1,242
1,444
1,619
2,239
2,435
Revenue (` in Crore)
18.33%5-year CAGR
10-11
11-12
12-13
13-14
14-15
52.57
73.75
90.34
113.35
110.10
Profit after tax (` in Crore)
20.30%5-year CAGR
Sustainable performance

11
Financial
Statements
Statutory
Reports
Corporate
Overview
10-11
11-12
12-13
13-14
14-15
121.03
130.03
154.02
188.50
209.47
EBITDA (` in Crore)
14.63%5-year CAGR
10-11
11-12
12-13
13-14
14-15
10.62
13.35
17.04
21.31
20.39
Earnings per share (`)
17.71%5-year CAGR
12 VA TECH WABAG LIMITED | Annual Report 2014-15
Dear Shareholders,The world is now on the cusp of an interesting
transformation, where aspirations and requirements of a
society have to be balanced with intelligent utilisation of
natural resources. For centuries, we have taken bountiful
nature for granted; now such an approach can lead to
dangerous consequences. Water, an essential natural
resource, has to be viewed in that perspective.
By 2050, we will have more than 9 billion people on the
planet, demanding access to clean water as one of the
vital prerequisites for a better quality of life. Not just that,
growing urbanisation, industrialisation, environmental
degradation and climate change can radically change the
global water landscape, jeopardising lives and livelihoods
of millions of people on the planet. How are we going to
meet those challenges? There are no easy answers, but
innovation can show the way forward. At WABAG, we are
partnering cities and industries across the world to find
innovative solutions to optimise the management of water
resources so critical for human survival.
India offers an interesting example as to how critical
water can be for an emerging economy with billion-plus
aspirations. In India, water demand is expected to grow
at 2.8% CAGR from 2010 to 2030. Water is needed for
agriculture, industry and human consumption. However,
India’s water resources are facing the twin challenges of
depletion and pollution. Therefore, sustainable solutions
must be put in place to conserve, purify and recycle the
precious resource.
WABAG offers one of the most advanced technologically-
driven expertise to cater to customer requirements in India
and many other parts of the world. We have the relevant
know-how to first understand the specific requirement
of the client and then provide need-based solutions,
considering the socio-economic dynamics of a particular
project.
Chairman’s Communiqué
BD Narang | Chairman
We have so far executed
2,300+ water treatment
and waste water projects
successfully in the last three
decades globally to help
improve the lives of millions
of people.
Chairman’s Communiqué

13
Financial
Statements
Statutory
Reports
Corporate
Overview
WABAG is also setting up a Sewage Treatment Plant
(STP) Facility at the Cancer Institute, Adyar, Chennai.
I am also delighted that we have partnered with M.S.
Swaminathan Research Foundation to implement a project
on Augmentation of Water Resources for small farmers in
Villupuram District, Tamil Nadu.
Also, WABAG has engaged the services of Care Earth Trust, a
Chennai-based NGO for the implementation of an integrated
programme for building capacities for managing wetlands
among the defined group of stakeholders
A long-term growth storyWhat WABAG is today is because of the creativity and
determination of our global team and I am proud to be
at the helm of such an organisation. We have a strong
legacy of doing what matters most to the world and we will
continue to follow our vision with renewed energy. Today,
we are bigger, stronger and more connected to the world
and to local communities than ever. Being a pure-play water
technology company with accent on ecological balance, we
are now well on our way to achieve our ‘One Billion Euro’
vision.
WABAG is a long-term growth story and we will continue to
add exciting new chapters to the story by bringing the most
innovative and sustainable solutions to the world.
I would like to thank all WABAGites for their contribution
to WABAG’s success story. I look forward to their continued
support as we strive to make WABAG even stronger. I also
take this opportunity to express my gratitude to all our
stakeholders who have reposed trust in WABAG.
Best wishes,
Bhagwan Dass Narang
We have so far executed 2,300+ water treatment and
waste water projects successfully in the last three decades
globally to help improve the lives of millions of people.
As governments and industries across the world are
focusing on preparing a sustainable water blueprint, more
investments are on the anvil. We see this scenario as a
positive development, which will help us create more value
for all stakeholders.
Year under reviewDuring the year, WABAG executed large and complex
projects across geographies. We continue to bid for big-
ticket projects and have ` 5,439 Crore order book as on
31st March 2015.
Our Multi Domestic Units (MDU) performed well with the
Philippines and Turkey leading from the front; we have
secured a good number of high-value orders from these
units. We have now gained a larger share of the water
treatment market in the Philippines. I am happy that
WABAG Turkey is taking care of complete management of
waste water in the city of Istanbul.
During the year, we established new subsidiaries in
Thailand, Bahrain and Qatar to capture the emerging
opportunities in those regions. In India too we see good
opportunities - the Namami Gange project, Development of
100 Smart Cities, Swachh Bharath Mission and the Delhi Jal
Board’s initiatives to clean the Yamuna are some of the key
opportunities which augur well for your Company.
Social commitmentsOur solutions are an important aspect of community
wellbeing. Taking this corporate ethos further, we put our
resources and energy to find ways and means to help uplift
the community. Our Rain Water Harvesting (RWH) initiative
in partnership with Akash Ganga Trust significantly
benefits the Kanchi Kamakoti Child Trust Hospital, Chennai.
It recharges groundwater sources in order to sustain and
improve the water table and water quality.

14 VA TECH WABAG LIMITED | Annual Report 2014-15
Managing Director’s Insight
Dear Shareholders,With over nine decades of experience, WABAG has built
a credible reputation as a reliable, cost-efficient and
customised solutions provider in the global water treatment
space. Being a pure-play water technology company we
have always considered it as our responsibility to provide
holistic water solutions to sustain life. This may entail
improving our processes, reimagining business strategies
in some cases and bolstering technological and people
capabilities to a very large extent. We are doing all this and
more, and our performance for the year shows not just what
we are, but what we can be.
Company’s performanceIn FY 2014-15, we achieved ` 2,435 Crore consolidated
revenue (` 2,239 Crore in FY 2013-14), owing to enhanced
global scale of operations and growing order book. We
reported a ` 209 Crore consolidate EBIDTA, against
` 189 Crore in FY 2013-14 and a ` 110 Crore consolidated
net profit against ` 113 Crore in FY 2013-14. Our consistent
focus on faster project execution, bagging newer project
and concentration on international markets has enabled
us to grow even in challenging times. The order book
stood at ` 5,439 Crore as on 31st March, demonstrating
sustainable business operations. During the year, with a
view to encourage the participation of small investors by
making equity shares of the Company affordable, increasing
the liquidity of the equity shares and to expand the retail
shareholders’ base, we issued bonus shares. The Board has
recommended a dividend at a payout ratio of 20% as in the
previous years, subject to the approval of shareholders.
Strategic Business Units’ (SBU) performance The Municipal Business Group (MBG) continues to be the
front runner in terms of order book and revenue. The
Group bagged key orders from India and abroad and
continues to bid for large projects globally. This business
unit is well poised to clinch business deals from three major
government initiatives: (i) Namami Gange Plan (ii) Swachh
Bharat Mission and (iii) 100 Smart Cities. Also, in India
the idea of building tertiary treatment plants is gaining
momentum and I see a good opportunity in this space.
In the Industrial Water Group (IWG), performance was
muted during the year due to delay in the government’s
policy making and Industrial project clearances. However,
going forward, we envisage bright prospects for this
business unit in fertilizer, power and oil & gas sectors with
more impetus being given by the central government. With
the Indian industrial scenario being subdued during the
Rajiv Mittal | Managing Director
Our consistent focus
on faster project execution,
bagging newer project and
concentration on international
markets has enabled us to grow
even in challenging times.
Managing Director’s Insight

15
Financial
Statements
Statutory
Reports
Corporate
Overview
year, the unit focused on overseas market opportunities.
Following the success of the order won in Nigeria last year,
the unit has bagged a project in Malaysia during the year
under review.
The Operations Business Group (OBG) is the margin driver
of the Company and the business is growing steadily.
We see good traction in the Middle East market for this
service business. We have won projects in Qatar, Bahrain
and in Singapore. This business unit is looking to further
expand into to Middle East and is continuously exploring
opportunities in this region. During the year, OBG bagged
many repeat orders in India.
The Desalination Business Group (DBG) is focusing on
the large opportunities emanating from the desalination
segment. Following the success of the 100 Million Litres
per day (MLD) Desalination plant at Nemmeli, Chennai, the
Government of Tamil Nadu has proposed to set up two new
Desalination plants in Chennai of 150 MLD and 400 MLD
capacity. Apart from these, two new plants in the southern
part of Tamil Nadu in Tuticorin and Ramanad districts, each
of 60 MLD have been proposed. Given the water scarcity and
the need for alternate water sources, many coastal states
are examining the possibilities of setting up desalination
plants. The business unit is also seeing good opportunities in
the LATAM market through our Spanish subsidiary setup a
couple of years back.
Multi Domestic Units’ (MDU) performance:This year WABAG Turkey and WABAG Philippines have
recorded phenomenal performance. In Turkey, WABAG now
operates and maintains the entire waste water system of
the Istanbul Mega-City, comprising 120+ plants. WABAG
Philippines has emerged as a leader in the water market in
the Philippines in a short span of time. During the year, this
MDU has received two large orders both funded by World
Bank. WABAG Austria continues to cater to the Middle East
market requirements and supports WABAG India in key
projects in this region. WABAG Romania continued its good
performance and bagged an important order for Produced
Water Treatment Plant (PWTP) in Suplacu de Barcau, which
is Romania’s largest oilfield. The year 2014 saw WABAG
Czech celebrate 20 years of success in this region. WABAG
Switzerland continues to enjoy technology leadership
in the high-end market of Switzerland. WABAG Spain is
actively forging partnerships in the LATAM region to tap
opportunities in this market.
FY 2014-15 in retrospectDuring the year, our major achievements include the
following:
Won the first project under the prestigious Ganga
Action Plan - a 140 MLD Sewage Treatment Plant order
in Varanasi, India
Executed a BOOT Project in Ujams, Namibia, an
Industrial Water Reclamation Plant.
Entered into a technology agreement with Royal
Haskoning DHV of Netherlands to introduce Nereda
technology for waste water treatment in India and
Switzerland markets
Incorporated a new subsidiary in Thailand to target the
Indo-China region, where we see good opportunities in
the water treatment space
Incorporated a new subsidiary in Bahrain and Qatar -
bagged O&M projects in this region
Our business priorities and focusGoing forward, we have prioritised our focus on the
following:
Grow our order book with a sustainable mix of volume
driven and margin-accretive projects
Enhance productivity to complete on-going and new
projects on scheduled time
Reinforce our leadership in key regions like the
Philippines and Turkey
Establish, develop and sustain leadership in other
emerging markets
Encourage a culture of continuous innovation and
engineering excellence
In order to leverage the experience and expertise of all the
SBUs / MDUs and to promote cross collaboration among
various geographies and to tap the Group’s inherent
strength, we are realigning our organisation structure to
catalyse our vision of achieving € 1 Billion top line.
Thinking bigI believe innovative ideas driven by smart WABAGites can
produce great results towards the triple bottom line - people,
planet and profit. Our technological prowess coupled with
customer focus and glocal presence are targeted to provide
sustainable solutions globally. WABAG is well-poised to
seize this moment of opportunity and continue its journey
towards becoming a Global Leader. I am more confident
than ever before that our best days lie ahead.
Best regards,
Rajiv Mittal

16 VA TECH WABAG LIMITED | Annual Report 2014-15
In safe hands
Ca
se s
tud
y 1
Our technology, talent and
teamwork are making a difference
in the lives of Istanbul’s citizens
by ensuring that no effluent is
discharged in the surrounding
water landscape.
Mahmut Gedek
MD, WABAG Turkey
In safe hands

The necessityHome to around 16 Million people, Istanbul manages close to 40% of Turkey’s total
industrial output. Such a bustling city with a burgeoning population demands
efficient waste water management. The demands related to the safe and efficient
operational management of waste system are manifold and therefore the need for
global domain expertise.
The executionIstanbul Water and Sewage Administration (ISKI) relied on WABAG’s expertise to
provide safe and efficient operational management of over 5,000,000 m3/d of waste
water at 124 locations.
The facilities in question include three large treatment plants with a combined
capacity of around 1 Million m3 per day. The facilities also include sustainable,
anaerobic sludge treatment systems that allow the use of biogas for energy
generation purposes and provide a total output of 23 MW. The three central plants
are supplemented by roughly 50 additional, small mechanical/biological as well
as nine pre-treatment plants of which some are extremely large and can handle
throughput of up to 850,000 m3 daily.
A massive flow of more than five million cubic metres of waste water is thus treated
on a daily basis. The project also involves the servicing of 64 waste water pumping
stations. We have leveraged our technological excellence and lower cost structures
to successfully treat all the waste water plants in Istanbul.
The impactOur initiatives in Istanbul will benefit millions of people and make a major and
sustainable contribution to environmental protection and an enhanced quality
of life.
Our solutions reassure people in need as they go
about their daily lives and civic authorities are
convinced that water management of their city is
in safe hands.
5,000,000 m3/d
23 MW
of waste water management
at 124 locations.
The facilities also include sustainable,
anaerobic sludge treatment systems
that allow the use of biogas for energy
generation purposes and provide a
total output of 23 MW.
Financial
Statements
Statutory
Reports
Corporate
Overview

18 VA TECH WABAG LIMITED | Annual Report 2014-15
Doing what matters most
Ca
se s
tud
y 2
There can be few things as
critical as providing drinking water
to people in acute need. We put
our expertise and determination to
cater to such a requirement.
Rajiv Mittal
MD & Group CEO
Doing what matters most

The necessityChennai’s potable water challenge grew with enhanced urbanisation and pressure
of population. An efficient desalination plant was the need of the hour as the
Cooum and Adyar rivers which meander through the city of Chennai, became
increasingly polluted and unsuitable for providing potable water.
The executionWABAG built the 100 MLD Nemmeli Seawater Desalination Plant for Chennai
Metropolitan Water Supply and Sewage Board. It is India‘s largest seawater reverse
osmosis desalination plant. The plant converts sea water into fresh potable water,
which is supplied to two million people from Chennai’s southern suburbs. The facility
processes around 1,00,000 cubic metre per day through reverse osmosis (RO).
The execution faced multiple challenges: first, hard rock encountered at the
intake chamber required controlled blasting; second, construction work was also
jeopardised by two cyclones; third, earthquakes in Indonesia caused the coastline to
move towards the shores of Nemmeli site, causing more hardships along the way.
The process of desalination is a comprehensive one. It includes pre-treatment of
saline water followed by RO and post treatment to supply pure drinking water.
The impactThe project as per design serves the drinking water needs 15 lakhs people of water
starved Chennai.
Our efforts have helped the government and relevant
authorities to respond to the urgent requirements of
people with speed.
100 MLD
15 Lakhs
WABAG built the 100
MLD Nemmeli Seawater
Desalination Plant for
Chennai Metropolitan Water
Supply and Sewage Board.
The project as per design
serves the drinking water
needs 15 lakhs people of water
starved Chennai.
Financial
Statements
Statutory
Reports
Corporate
Overview

20 VA TECH WABAG LIMITED | Annual Report 2014-1520 VA TECH WABAG LIMITED | Annual Report 2014-15
Making every drop count
Ca
se s
tud
y 3
When we undertake a particular
project, we don’t follow a fixed
pattern. There is no one-shoe-fits-
all strategy. Building the water
reclamation plant in Namibia posed
challenges which were unique in
their own right. We relied on our
technological proficiency and design
capabilities to usher in positive
change on Windhoek’s water horizon.
Erik Gothlin
MD, WABAG Austria
Making every drop count

The necessityThe Ujams industrial area needed consistent supply of water with a high degree of
purification following the treatment of effluents from brewery, abattoir, beverages,
chocolate and tannery sectors. The purified water was needed for irrigating
agricultural lands and for industrial consumption.
A detailed piloting study showed that the plant can be built very compact, and the
energy balance improved by using the latest technology of fine sieving for WABAG.
The challengeThe challenge was to clean various impurities from diverse production facilities
and the pollutant concentrations that are subject to major fluctuations within
hours. The project required full biological treatment, advanced nitrogen and
phosphorus elimination and disinfection.
The executionWABAG presented the best-in-class design concept for project implementation.
The process design comprised screening, grit removal, a waste water buffer,
MICROPUR® fine sieving (250 μm) followed by an MBR and a combined odour
treatment system.
We conducted pilot tests to verify the proposed compact process design and applied
the MICROPUR® process, which involves innovative fine sieving, for the first time in
a client’s plant.
The impactThe plant effectively treats effluents from various industrial sectors. The high
degree of purification allows water reuse for landscape irrigation or as process
water for industry and indirect discharge into nearby water extraction areas. Now
an additional reclamation plant is operational and the waste water from the Ujams
industrial park is being treated for reuse. This leads to savings of 5,175 m3 fresh
water per day. Over five million litres of water daily can now be used for irrigation
or as industrial water.
Today, WABAG’s intervention has made it possible for
water-scarce Windhoek to utilise every drop of water
in the region.
5 million litres+Over five million litres of water
daily can now be used for
irrigation or as industrial water.
Technologies used
Mechanical pre-treatment
Fine sieving or advanced
pre-treatment technology:
MICROPUR®- first time for
WABAG’s client plant
Membrane bioreactor (MBR)
technology: MARAPUR®
Disinfection
Sludge treatment
Odour treatment
Financial
Statements
Statutory
Reports
Corporate
Overview

22 VA TECH WABAG LIMITED | Annual Report 2014-1522 VA TECH WABAG LIMITED | Annual Report 2014-15
Achieving higher benchmarks
Ca
se s
tud
y 4
The Paradip Refinery project
represents WABAG’s biggest ever
EPC initiative for the largest
Industrial waste water recycling
plant. Our consistent innovation,
design capabilities and technology
leadership have enabled us to build
this extensive waste water treatment
facility.
Patrick Andrade
Head, Industrial Water Group
Achieving higher benchmarks

32,000 m3
WABAG set-up a 32,000 m3 per
day effluent treatment plant
(ETP) and water recovery
plant (WRP) for Indian Oil
Corporation Limited (IOCL) at
Paradip, Odisha.
The necessityThe need at Paradip was to set up a water recovery plant, which could also safely
treat refinery effluents for onward processing. Effluents in this grass root refinery
include oily water, contaminated rain water, salty oily water, stripped sour water,
cooling tower blow down, steam system blow downs, side-stream filter backwash,
spent caustic, leachate, municipal sewage and coke pile surface water run-off,
among many others.
The challengeThe plant had to be highly efficient enough to maximise water recovery as well as
render final effluents safe for discharge, meeting stringent international standards.
The executionWABAG set up a 32,000 m3 per day effluent treatment Plant (ETP) and water recovery
plant (WRP) for Indian Oil Corporation Limited (IOCL) at Paradip, Odisha. The waste
water from the refinery is treated in three stages.
Stage 1: Free oil and emulsified oil is removed in primary treatment. Waste water
is further treated in secondary treatment using bio-tower and activated sludge
process. Sludge removed from both primary and secondary treatment is further
thickened, dewatered and returned back to client. Spent caustic and landfill
leachate are treated separately and re-circulated into the secondary treatment.
Stage 2: The treated effluent from secondary treatment is taken into water
recovery plant (tertiary treatment) and is subjected to further treatment using
rapid gravity sand filters, membrane technology (ultra-filtration and reverse
osmosis (RO). This 75% recovered high quality permeate water is stored and sent
back to refinery for process water usage. Stage 3: The RO reject from the water
recovery plant is treated through a Hard COD treatment plant before final disposal
to sea meeting full safe disposal limit standards. The effluent treatment plant
also has Volatile Organic Removal Plant (VOC) that removes VOC odour from oil
treatment units, there by maintaining the ambient air quality as per international
standards and operator friendly environment.
The impactMaximum effluent recycled to high quality recycled water put to use and a clean
environment have made the plant not only a model waste water treatment facility,
but also an eco-friendly site.
The project is a milestone in our journey over the
years and it gives us the confidence that we can
achieve even higher benchmarks of excellence in
the coming years.
Financial
Statements
Statutory
Reports
Corporate
Overview

24 VA TECH WABAG LIMITED | Annual Report 2014-1524 VA TECH WABAG LIMITED | Annual Report 2014-15
Managing an uphill task
Managing an uphill task
Ca
se s
tud
y 5
For the project at Lausanne
we had the opportunity to compete
with the best players in the industry
globally. We were confident that we
could deliver solutions that were
technologically advanced and at the
same time cost-effective.
Gerhard Ryhiner
MD, WABAG Switzerland
The necessityThe Swiss city of Lausanne partially covers its daily water demand with spring
waters from Sonzier. However, spring water treatment was needed to maximise use
of the energy efficient spring water supply as much as possible. This goal was to be
achieved by implementing an energy efficient turbidity treatment. Lausanne was
looking for a fully automated ultrafiltration plant featuring maximised hydraulic
yield and offering a high degree of production stability and security. WABAG provided
advanced technology and best-in-class expertise to the client.
The challengeThe hilly city of Lausanne depends primarily on two lake water treatment plants
situated on the shore. The treated lake water therefore has to be pumped uphill into
the reservoirs, when turbid spring waters cannot be used. This would consume a
lot of energy and thus is also cost intensive. The new uphill ultrafiltration helps to
reduce these energy costs remarkably.
The executionWABAG used ultrafiltration membranes, which have already been implemented
successfully in various other plants built by WABAG. They ensure a high level
of water purity and seamless supply. Primary goals of this plant are turbidity
removal and disinfection. It consists of six self-regulating ultrafiltration trains with
pressurised membranes, bearing a total production capacity of 22 MLD.
The largest ultrafiltration plant for spring water treatment in Switzerland built by
us is now running for more than one year. The ultrafiltration, driven by hydrostatic
uphill pressure, is a big achievement since it allows producing permeate without
electrical energy and ensures drinking water production even when no power is
available.
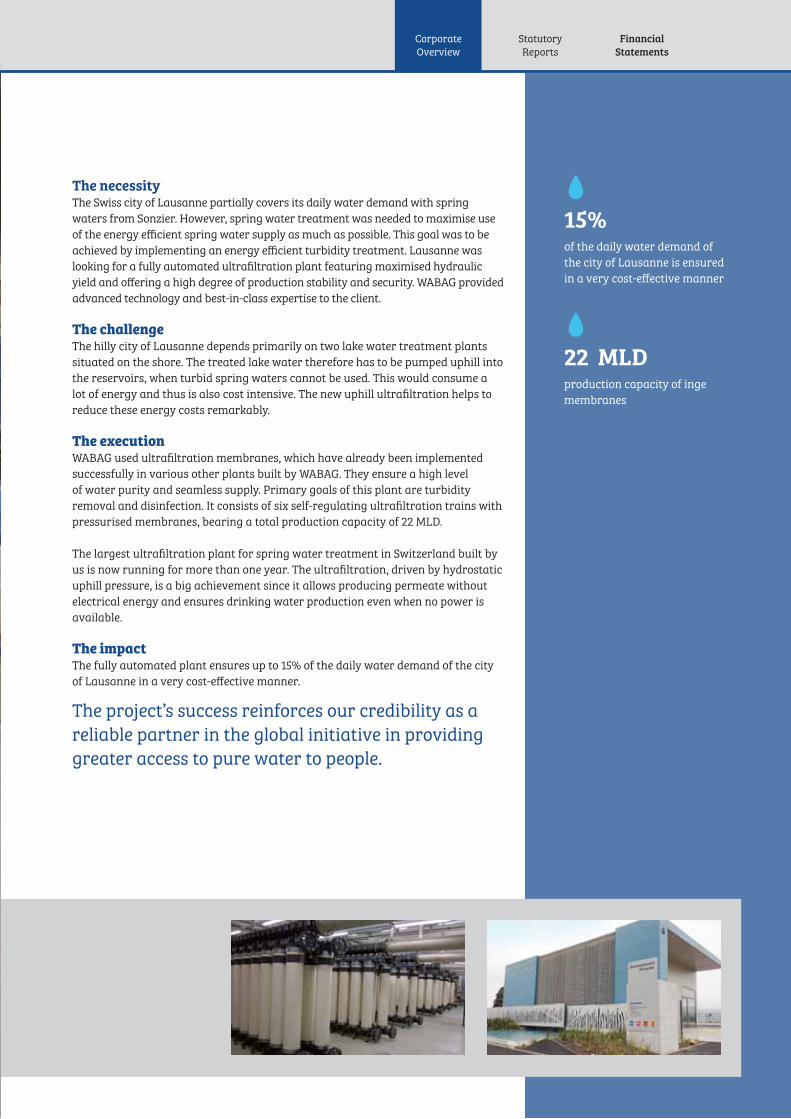
The impactThe fully automated plant ensures up to 15% of the daily water demand of the city
of Lausanne in a very cost-effective manner.
The project’s success reinforces our credibility as a
reliable partner in the global initiative in providing
greater access to pure water to people.
15%of the daily water demand of
the city of Lausanne is ensured
in a very cost-effective manner
22 MLDproduction capacity of inge
membranes
Financial
Statements
Statutory
Reports
Corporate
Overview

26 VA TECH WABAG LIMITED | Annual Report 2014-15
Waste water treatment plant, Siverek, Turkey
During FY 2014-15, we have bagged several prestigious projects
around the world. Below are some of the major ones:
140 MLD Sewage Treatment Plant (STP) under Ganga
Action Plan Project
We bagged the first order under Ganga Action Plan Project
in Varanasi for design and construction of 140 MLD STP
worth ` 2,200 Million funded by JICA (including operation
and maintenance for 10 years).
We will employ the Activated Sludge Process with biogas-
based power generation for this project. This process will
help the plant to generate power from biogas and the
plant will be largely self-sufficient in terms of power using
this ‘Green Energy’. This will not only help the project to
reduce its operational costs but will also reduce the carbon
emissions and thus will qualify for carbon credits.
Two World Bank funded projects in the Philippines
The first project we bagged from Maynilad Water Services,
the Philippines for construction of 20 MLD Sewage
Treatment Plant (STP) at Tunasan, the Philippines worth
` 1,000 Million. This project is unique since this STP is
constructed to handle waste water flowing into the Laguna
Lake, which is one of the biggest alternate drinking water
sources of the Philippines.
The second project (60 MLD Sewage Treatment Plant) is in
Valenzuela, the Philippines from Maynilad Water Services Inc
and is worth ` 1,750 Million.
Several projects in Turkey
We won a major order from Istanbul Water and Sewerage
Corporation for operation and maintenance of the entire
Performing with a global mandate
Performing with a global
mandate

27
Waste water treatment plant, Zurich, Switzerland
waste water of the Istanbul Mega City. This includes
operation and maintenance of all the Waste Water
Treatment Plants (WWTPs) and Waste Water Pumping Stations.
We are responsible for the complete drinking water supply and
Waste Water Treatment Plant of the sixth biggest city in Turkey,
Adana. We are also building a 366 MLD Water Treatment Plant
in Izmir.
We bagged a municipal waste water treatment plant in
Polatli, Turkey worth ` 400 Million. The waste water treatment
plant will be equipped with mechanical/biological treatment
technology on the basis of the activated sludge process, and
also incorporate carbon and nitrogen removal. In addition,
the plant will operate using aerobic sludge treatment, sludge
dewatering and a biological waste air filter. The facility will
correspond with EU regulations regarding eco-friendly waste
water treatment, and in particular with
the Environmental Impact Assessment Report.
Waste water treatment plant in Saudi Arabia
We bagged a 200 MLD waste water treatment plant order
in Saudi Arabia worth ` 1,530 Million. This is a repeat order
for WABAG in Saudi Arabia, demonstrating our customer’s
continued faith in our expertise.
Produced water treatment plant (PWTP), Romania
We bagged an order from OMV Petrom SA for a PWTP in
Suplacu de Barcau, Romania worth ` 1,130 Million. Suplacu de
Barcau is the biggest oil field in Romania with a daily 1,000-
ton production capacity. The process steps that are to be
employed in this plant are for the first time used in this kind
of a plant, which makes this order very unique.
Water Treatment Plant in Habra, West Bengal
We won an order for a value of around ` 200 Crore for
Design, Construction and Commissioning of 147 MLD Water
Treatment Plant (WTP) for Arsenic affected areas of Habra –
Gaighata in the District of North 24 Parganas, West Bengal.
The contract also includes operations and maintenance of
the plant for a period of one year.
Financial
Statements
Statutory
Reports
Corporate
Overview
28 VA TECH WABAG LIMITED | Annual Report 2014-15
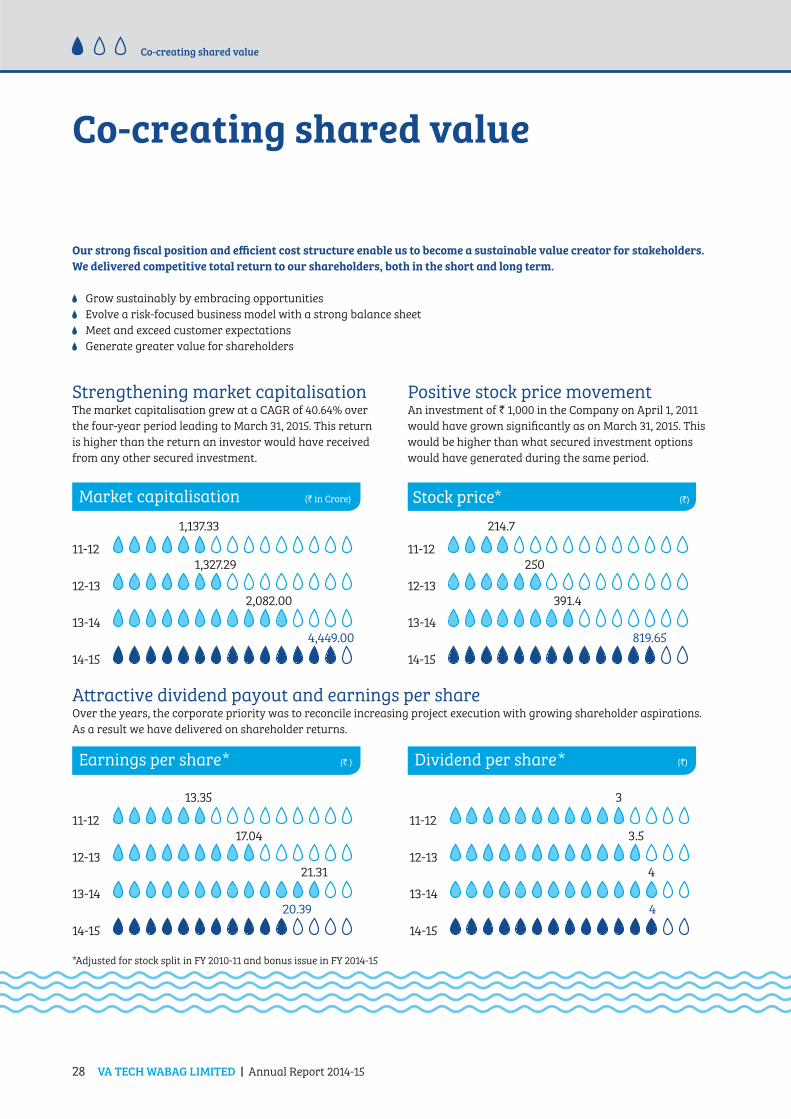
11-12
12-13
13-14
14-15
1,137.33
1,327.29
2,082.00
4,449.00
11-12
12-13
13-14
14-15
13.35
17.04
21.31
20.39
Earnings per share * (` )
11-12
12-13
13-14
14-15
3
3.5
4
4
Dividend per share * (`)
11-12
12-13
13-14
14-15
214.7
250
391.4
819.65
Stock price* (`)
Co-creating shared value
Our strong fiscal position and efficient cost structure enable us to become a sustainable value creator for stakeholders.
We delivered competitive total return to our shareholders, both in the short and long term.
Grow sustainably by embracing opportunities
Evolve a risk-focused business model with a strong balance sheet
Meet and exceed customer expectations
Generate greater value for shareholders
Positive stock price movementAn investment of ` 1,000 in the Company on April 1, 2011
would have grown significantly as on March 31, 2015. This
would be higher than what secured investment options
would have generated during the same period.
Attractive dividend payout and earnings per shareOver the years, the corporate priority was to reconcile increasing project execution with growing shareholder aspirations.
As a result we have delivered on shareholder returns.
Strengthening market capitalisationThe market capitalisation grew at a CAGR of 40.64% over
the four-year period leading to March 31, 2015. This return
is higher than the return an investor would have received
from any other secured investment.
*Adjusted for stock split in FY 2010-11 and bonus issue in FY 2014-15
Market capitalisation (` in Crore)
Co-creating shared value
29
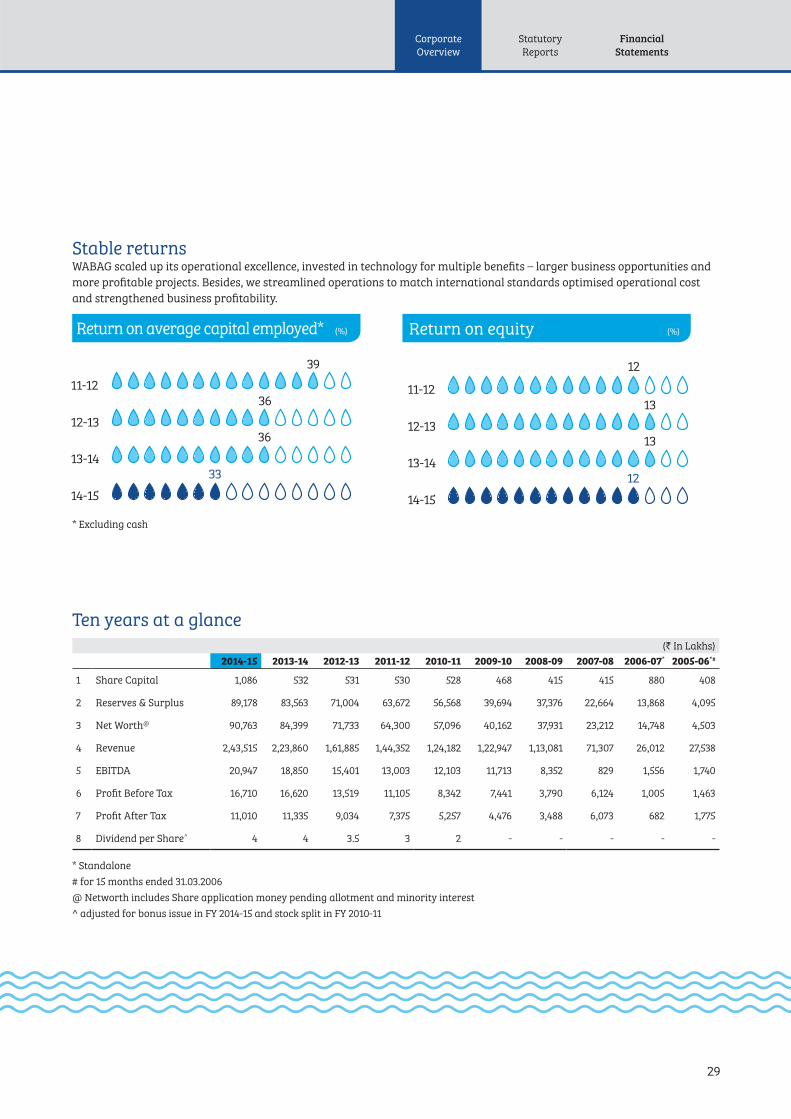
11-12
12-13
13-14
14-15
12
13
13
12
Return on equity (%)
39
11-12
12-13
13-14
14-15
36
36
33
Return on average capital employed* (%)
Stable returnsWABAG scaled up its operational excellence, invested in technology for multiple benefits – larger business opportunities and
more profitable projects. Besides, we streamlined operations to match international standards optimised operational cost
and strengthened business profitability.
Ten years at a glance
(` In Lakhs)
2014-15 2013-14 2012-13 2011-12 2010-11 2009-10 2008-09 2007-08 2006-07* 2005-06*#
1 Share Capital 1,086 532 531 530 528 468 415 415 880 408
2 Reserves & Surplus 89,178 83,563 71,004 63,672 56,568 39,694 37,376 22,664 13,868 4,095
3 Net Worth@ 90,763 84,399 71,733 64,300 57,096 40,162 37,931 23,212 14,748 4,503
4 Revenue 2,43,515 2,23,860 1,61,885 1,44,352 1,24,182 1,22,947 1,13,081 71,307 26,012 27,538
5 EBITDA 20,947 18,850 15,401 13,003 12,103 11,713 8,352 829 1,556 1,740
6 Profit Before Tax 16,710 16,620 13,519 11,105 8,342 7,441 3,790 6,124 1,005 1,463
7 Profit After Tax 11,010 11,335 9,034 7,375 5,257 4,476 3,488 6,073 682 1,775
8 Dividend per Share^ 4 4 3.5 3 2 - - - - -
* Standalone
# for 15 months ended 31.03.2006
@ Networth includes Share application money pending allotment and minority interest
^ adjusted for bonus issue in FY 2014-15 and stock split in FY 2010-11
* Excluding cash
Financial
Statements
Statutory
Reports
Corporate
Overview
30 VA TECH WABAG LIMITED | Annual Report 2014-15
Directors’ Report
Directors’ Report
Dear Shareholders,
Your Directors are pleased to present the 20th Annual Report of the Company, together with the audited financial statements
for the year ended 31 March 2015.
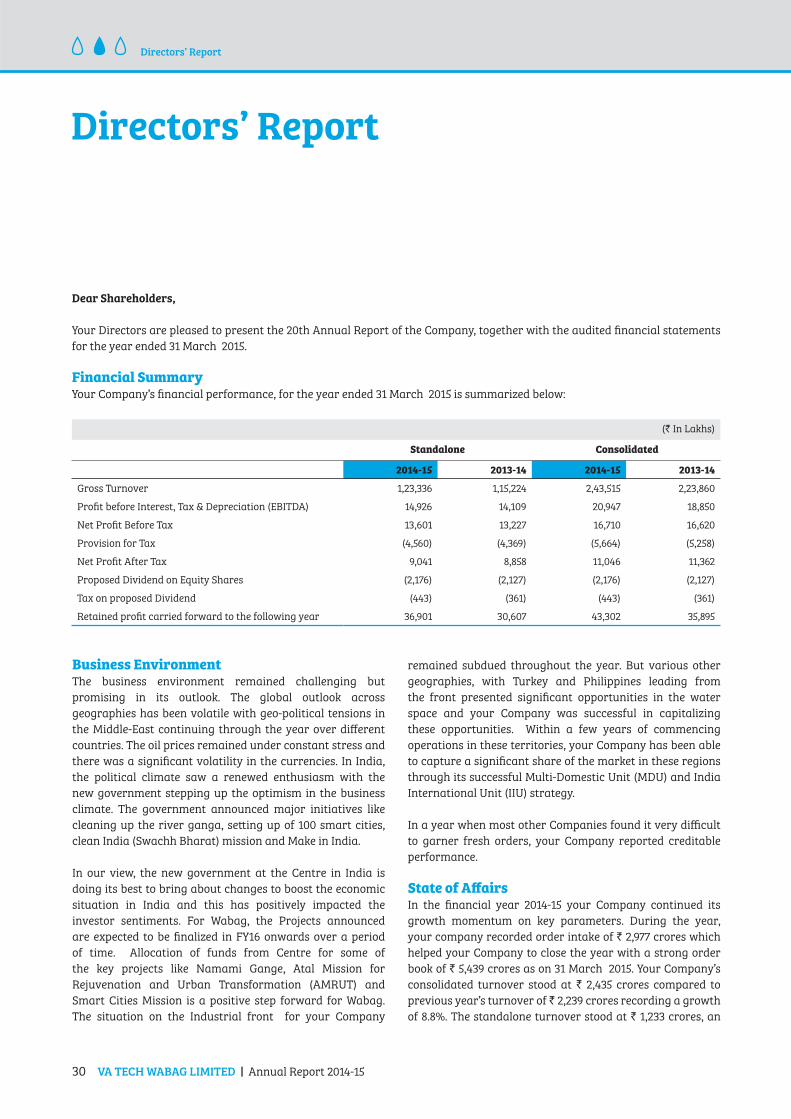
Financial SummaryYour Company’s financial performance, for the year ended 31 March 2015 is summarized below:
(` In Lakhs)
Standalone Consolidated
2014-15 2013-14 2014-15 2013-14
Gross Turnover 1,23,336 1,15,224 2,43,515 2,23,860
Profit before Interest, Tax & Depreciation (EBITDA) 14,926 14,109 20,947 18,850
Net Profit Before Tax 13,601 13,227 16,710 16,620
Provision for Tax (4,560) (4,369) (5,664) (5,258)
Net Profit After Tax 9,041 8,858 11,046 11,362
Proposed Dividend on Equity Shares (2,176) (2,127) (2,176) (2,127)
Tax on proposed Dividend (443) (361) (443) (361)
Retained profit carried forward to the following year 36,901 30,607 43,302 35,895
Business EnvironmentThe business environment remained challenging but
promising in its outlook. The global outlook across
geographies has been volatile with geo-political tensions in
the Middle-East continuing through the year over different
countries. The oil prices remained under constant stress and
there was a significant volatility in the currencies. In India,
the political climate saw a renewed enthusiasm with the
new government stepping up the optimism in the business
climate. The government announced major initiatives like
cleaning up the river ganga, setting up of 100 smart cities,
clean India (Swachh Bharat) mission and Make in India.
In our view, the new government at the Centre in India is
doing its best to bring about changes to boost the economic
situation in India and this has positively impacted the
investor sentiments. For Wabag, the Projects announced
are expected to be finalized in FY16 onwards over a period
of time. Allocation of funds from Centre for some of
the key projects like Namami Gange, Atal Mission for
Rejuvenation and Urban Transformation (AMRUT) and
Smart Cities Mission is a positive step forward for Wabag.
The situation on the Industrial front for your Company
remained subdued throughout the year. But various other
geographies, with Turkey and Philippines leading from
the front presented significant opportunities in the water
space and your Company was successful in capitalizing
these opportunities. Within a few years of commencing
operations in these territories, your Company has been able
to capture a significant share of the market in these regions
through its successful Multi-Domestic Unit (MDU) and India
International Unit (IIU) strategy.
In a year when most other Companies found it very difficult
to garner fresh orders, your Company reported creditable
performance.
State of AffairsIn the financial year 2014-15 your Company continued its
growth momentum on key parameters. During the year,
your company recorded order intake of ` 2,977 crores which
helped your Company to close the year with a strong order
book of ` 5,439 crores as on 31 March 2015. Your Company’s
consolidated turnover stood at ` 2,435 crores compared to
previous year’s turnover of ` 2,239 crores recording a growth
of 8.8%. The standalone turnover stood at ` 1,233 crores, an

Corporate
Overview
Statutory
Reports
31
Financial
Statements
increase of 7.04 %, compared to previous year’s turnover of
` 1,152 crores. The consolidated EBITDA increased to ` 209
crores in 2014-15 as against ` 189 crores in the previous
year registering a growth of 10.58% over previous year. On
a standalone basis the EBITDA stood at ` 149 crores in 2014-
15 as against the previous year’s EBITDA of ` 141 crores.
The consolidated PAT stood at ` 110 crores as against ` 113
crores in the previous year. The consolidated EPS was at
` 20.39 for the year ended 31 March 2015 as against ` 21.31
in the previous year. The paid up equity shares as of 1 April,
2014 was 2,65,92,130. During the year, 5,50,425 equity shares
were allotted pursuant to exercise of ESOPs and 2,71,42,555
equity shares were issued as bonus shares. The paid up
equity shares as on 31 March 2015 is 5, 42, 85,110.
DividendYour directors are pleased to recommend a final dividend of
` 4 per equity share on the face value of ` 2 per equity share
for the financial year ended 31 March 2015 amounting to
` 26.19 crores (inclusive of tax of ` 4.43 crores). The dividend
payout is subject to approval of members at the ensuing
Annual General Meeting (AGM).
The dividend will be paid to members whose names appear
in the Register of Members as on 17 July 2015; in respect
of shares held in dematerialized form, it will be paid to
members whose names are furnished by National Securities
Depository Limited and Central Depository Services (India)
Limited as beneficial owners as on that date.
DepositsYour Company has not accepted any deposit and as such no
amount of principal and interest were outstanding as of the
Balance Sheet date.
Particulars of Loans, Guarantees or InvestmentsDetails of Loans, Guarantees and Investments covered under
the provisions of Section 186 of the Companies Act, 2013 form
part of the notes to the Financial Statements.
Subsidiaries , Joint Ventures and Associate CompaniesDuring the year, your Board of Directors reviewed the affairs
of the subsidiaries. The consolidated financial statements
of the Company and all its subsidiaries which form part of
the Annual report have been prepared in accordance with
Section 129(3) of the Companies Act, 2013. Further, a statement
containing the salient features of the financial statement of our
subsidiaries, joint ventures and associates in the prescribed
format AOC-1 is appended as Annexure I to the Board’s report.
The statement also provides the details of performance and
financial position of each of the subsidiaries, joint ventures
and associates .
In accordance with Section 136 of the Companies Act, 2013
the Audited financial statements, including the consolidated
financial statements and related information of the company
and audited accounts of each of its subsidiaries are available
on our website www.wabag.com. These documents will also
be available for inspection during business hours at our
registered office in Chennai, India.
During the year, your Company made investments in the
following subsidiaries:
Wabag Ltd, Thailand; Wabag Operation and Maintenance WLL,
Bahrain; VA Tech Wabag & Roots Contracting LLC, Qatar.
During the year, the Board of Directors reviewed the affairs
of the subsidiary Companies. Details of major subsidiaries of
the Company and their business operations during the year
under review are covered in the Management’s Discussion
and Analysis Report.
Remuneration PolicyThe Company’s remuneration policy is driven by the
success and performance of the individual employee and
the Company. Through its compensation programme, the
Company endeavors to attract, retain, develop and motivate
a high performance workforce. The Company follows a
compensation mix of fixed pay benefits and performance
based variable pay. Individual performance pay is
determined by business performance and the performance
of the individuals are measured through quarterly & annual
appraisal process.
The objective of this policy is to formulate criteria for
determining qualifications, competencies, positive attributes
and independence for the appointment of a director
(executive / non-executive) and recommend to the Board
policies relating to the remuneration of the directors, KMPs
and other employees. This includes reviewing and approving
corporate goals and objectives relevant to the compensation
of the Managing Director (MD) and Group CEO, evaluating
the MD & Group CEO’s performance in the light of those goals
and objectives, and either as a committee or together with
the other independent directors (as directed by the Board),
determine and approve the MD & Group CEO’s compensation
level based on this evaluation and making recommendations
to the Board with respect to Key Managerial Personnel’s
(KMPs) compensation, incentive -compensation and equity
based plans that are subject to the Board’s approval;
The policy also addresses committee members’ qualifications,
appointment and removal, committee structure and
functions reporting to the Board apart from formulating
the criteria for evaluation of performance of all the directors
on the Board. The policy also addresses Board diversity and

32 VA TECH WABAG LIMITED | Annual Report 2014-15
Directors’ Report
outlines remuneration principles for employees linked to
their effort, performance and achievement relating to the
Company’s goals.
Employees’ Stock Option SchemeNomination and Remuneration Committee of the Board
of Directors of the Company, inter alia administers and
monitors the Employees’ Stock Option Scheme of the
Company in accordance with the applicable SEBI Guidelines.
The applicable disclosures as stipulated under the SEBI
Guidelines as on 31 March 2015 is appended as Annexure II
to the Board’s report. The Company has received a certificate
from the Statutory Auditors that the Scheme has been
implemented in accordance with the SEBI Guidelines and the
resolutions passed by the shareholders. The Certificate would
be placed at the Annual General Meeting for inspection by
the members.
Significant and Material OrdersThere are no significant material orders passed by the
regulators or courts or tribunals impacting the going
concern status and company’s operations in future.
Management’s Discussion and AnalysisManagement’s Discussion and Analysis as stipulated under
Clause 49 of the Listing Agreement, is set out in this Annual
Report.
Corporate Social ResponsibilityAs per the provisions of the Companies Act, 2013 all
Companies having net worth of ` 500 crore or more or
turnover of ` 1000 crores or more or a net profit of ` 5 Crore
or more during any financial year are required to constitute
a Corporate Social Responsibility (CSR) committee of the
Board of Directors comprising three or more directors,
atleast one of whom shall be an independent director and
such Company shall spend atleast 2% of the average net
profits of the Company for the three immediately preceding
financial years as per Section 198 of the Companies Act, 2013.
Our CSR Committee comprises Revathi Kasturi (Chairperson),
Sumit Chandwani and Rajiv Mittal. The Committee is
responsible for formulating and monitoring the CSR policy
of the Company.
Details about the CSR policy and initiatives taken by the
Company on Corporate Social Responsibility approved by the
Board is available on the Company’s website www.wabag.com.
The annual report on our CSR activities is appended as
Annexure III to the Board’s report.
Directors & Key Managerial PersonnelSub Section (10) of Section 149 of the Companies Act 2013
provides that independent directors shall hold office for
a term of upto 5 consecutive years on the board of the
Company, and shall be eligible for reappointment on passing
a special resolution by the shareholders of the Company.
Accordingly all the Independent directors were appointed by
the shareholders at the Annual General Meeting held on 21
July 2014 for a term of 3 consecutive years upto the conclusion
of the 22nd Annual General Meeting of the Company in the
calendar year 2017. Sub Section (13) of Section 149 states that
provisions of retirement by rotation as defined in Sub Section
(6) & (7) of Section 152 of the Act shall not apply to such
Independent directors. Accordingly, none of the Independent
directors will retire at the ensuing Annual General Meeting.
Further in view of explanation to Section 152 (6) which states
that the expression ‘total number of directors’ shall not
include Independent directors of the Company, the board
has been advised that the office of the Managing Director
shall be liable to determination by retirement of directors by
rotation.
In view of the above provisions of the Companies Act,
2013, Rajiv Mittal retires at the ensuing Annual General
Meeting and being eligible seeks re-appointment. The Board
recommends his re-appointment.
Rajiv Mittal was re-appointed as the Managing Director
of the Company for a period of five years with effect from
1 October 2010 by the shareholders at the AGM held on 15
July 2011. The Board of Directors on the recommendation
of the Nomination and Remuneration Committee at their
Meeting held on 25 May 2015 re-appointed Mr. Rajiv Mittal,
Managing Director and Group CEO of the Company for a
period of 5 years w.e.f 1 October 2015 subject to the approval
of shareholders on the terms and conditions as set out in the
Explanatory Statement annexed to the notice of the ensuing
Annual General Meeting. Approval of the members is sought
for the re-appointment of Mr. Rajiv Mittal as Managing
Director and Group CEO of the Company for a period of 5
years w.e.f 1 October 2015.
A brief profile of the Directors proposed to be appointed/
re-appointed has been given in the notice dated 25 May 2015
convening the Annual General Meeting of the Company.
In compliance with the provisions of Section 203 of the
Companies Act, 2013, Board of Directors at their Meeting held
on 24 May 2014 designated S Varadarajan - Chief Financial
Officer and Rajiv Balakrishnan – Company Secretary as Key
Managerial Personnel of the Company.
Corporate
Overview
Statutory
Reports
33
Financial
Statements
A) Board Evaluation
Pursuant to the provisions of the Companies Act, 2013
and Clause 49 of the Listing Agreement, the Board has
carried out the annual performance evaluation of its own
performance, the Directors individually as well as the
evaluation of the working of its Audit, Nomination and
Remuneration, Stakeholders Relationship and Corporate
Social Responsibility Committee. A structured questionnaire
was prepared after taking into consideration inputs received
from the Directors, covering various aspects of the Board’s
functioning such as adequacy of the composition of the
Board and its Committees, Board culture, execution and
performance of specific duties, obligations and governance.
A separate exercise was carried out to evaluate the
performance of individual Directors including the Chairman
of the Board, who were evaluated on parameters such as
level of engagement and contribution, independence of
judgment, safeguarding the interest of the Company and its
minority shareholders etc. The performance evaluation of the
Independent Directors was carried out by the entire Board.
The performance evaluation of the Chairman and Managing
Director were carried out by the Independent Directors. The
Board also reviewed the performance of the Chief Financial
Officer, Company Secretary and other Senior Managerial
Personnel. The Directors expressed their satisfaction with
the evaluation process.
B) Policy on Directors appointment and Remuneration:
Your Company’s current policy is to have an appropriate
mix of Executive and Independent directors to maintain the
independence of the Board, and separate its functions of
governance and management. As on 31 March 2015 the Board
consists of 5 Directors, majority of them being Independent
Directors. The Chairman of the Board is an Independent
Director. Besides the Chairman, the Board comprises the
Managing Director, who is a promoter Director and 4
Independent Directors. The Board periodically evaluates the
need for change in its composition and size.
The policy of the Company on directors appointment
and remuneration, including criteria for determining
qualifications, positive attributes, independence of a director
and other matters adopted by the board are as provided
under sub section 3 of Section 178 of the Companies Act, 2013.
C) Number of Meetings of the Board:
The Board met four times during the financial year, the
details of which are given in the corporate governance report
that forms part of this Annual report. The intervening gap
between any two meetings was within the period prescribed
by the Companies Act, 2013.
Induction & Training of Board Members:
On appointment, the concerned Director is issued a Letter of
Appointment setting out in detail, the terms of appointment,
duties, responsibilities and expected time commitments.
Each newly appointed/ designated Independent Director is
taken through a formal induction program including the
presentation from the Managing Director & Group CEO on
the Company’s operations, marketing, finance and other
important functions. The Company Secretary briefs the
Director about their legal and regulatory responsibilities as
a Director. The induction for Independent Directors include
interactive sessions with Executive Committee Members,
Business and Functional Heads, visit to the plant site etc.
The above initiatives help the Director to understand the
Company, its business and the regulatory framework
in which the Company operates and equips him/ her to
effectively fulfill his role as a Director of the Company.
Periodic Presentations are made at the Board and Committee
Meetings on business and performance updates of the
Company, global business environment, business strategy
and risks involved.
The details of the Familiarization programs imparted to
Independent Directors is available on the Company’s website
www.wabag.com
Directors Responsibility StatementPursuant to the requirement under Section 134 (3)(c) of the
Companies Act, 2013, your directors confirm that:
in the preparation of the annual financial statements for
the year ended 31 March 2015, the applicable accounting
standards have been followed;
the Directors have selected such accounting policies
and applied them consistently and made judgments and
estimates that are reasonable and prudent so as to give
a true and fair view of the state of affairs of the Company
at the end of the financial year and of the profit & loss of
the Company for that period;
the Directors have taken proper and sufficient care
towards the maintenance of adequate accounting
records in accordance with the provisions of this Act
for safeguarding the assets of the Company and for
preventing and detecting fraud and other irregularities;
that Directors have prepared the annual accounts on a
going concern basis;
34 VA TECH WABAG LIMITED | Annual Report 2014-15
Directors’ Report
that Directors have laid down internal financial controls
which are adequate and are operating effectively;
that Directors have devised proper systems to ensure
compliance with the provisions of all applicable laws and
such systems are adequate and operating effectively.
Auditors A) Statutory Auditors:
M/s. Walker Chandiok & Co. LLP, Chartered Accountants,
Chennai (Registration No. 001076N/N500013 & LLP
Registration No. AAC-2085) Statutory Auditors of the
Company, hold office till the conclusion of the ensuing Annual
General Meeting and are eligible for re-appointment.
The Board, on the recommendation of the Audit Committee
has proposed the appointment of M/s. Walker Chandiok
& Co. LLP, Chartered Accountants, as Statutory Auditors
of the Company to hold office for a period of 3 years from
the conclusion of this Annual General Meeting (Twentieth
Annual General Meeting) till the conclusion of Twenty Third
Annual General Meeting to be held in the calendar year 2018
subject to ratification of such appointment by members at
every annual general meeting of the Company .
The Company has received the requisite certificate under
Section 139 of the Companies Act, 2013 from the Auditors
to the effect that if they are re-appointed, it would be
in accordance with the provisions of Section 141 of the
Companies Act, 2013.
B) Cost Auditor:
Pursuant to Section 148 of the Companies Act, 2013 read
with The Companies (Cost Records and Audit) Amendment
Rules, 2014, the cost audit records maintained by the
Company is required to be audited. Your Directors, on
the recommendation of the Audit Committee, appointed
Mr. S Chandrasekaran, Practicing Cost Accountant
(Membership No.4784) to audit the cost accounts of the
Company for the financial year ending 31 March 2015 on a
remuneration of ` 5 Lakhs. As required under Section 148 of
the Companies Act, 2013, the remuneration payable to the
cost auditor is required to be placed before the Members
in a general meeting for their ratification. Accordingly,
a Resolution seeking Member’s ratification for the
remuneration payable to Mr. S Chandrasekaran, Practicing
Cost Accountant is included in the Notice dated 25 May 2015
convening the Annual General Meeting.
C) Secretarial Auditor:
Pursuant to the provisions of Section 204 of the Companies
Act, 2013 and Rules thereunder, M.Damodaran (Membership
No. 5837) of M.Damodaran & Associates, Practicing Company
Secretaries was appointed to conduct the Secretarial Audit of
the Company for the FY 2014-15. The Secretarial Audit Report
for FY 2014-15 forms part of the Annual report as Annexure
IV to the Board’s report.
The Board has appointed M.Damodaran of M.Damodaran
& Associates Practicing Company Secretaries, as secretarial
auditor of the Company for the FY 2015-16.
Extract of Annual ReturnThe details forming part of the extract of the Annual Return
in form MGT 9 is appended as Annexure V to the Board’s
report.
Particulars of Contracts or Arrangements Made With Related Parties Particulars of contracts or arrangements with related parties
referred to in Section 188 (1) of the Companies Act 2013, in the
prescribed Form AOC – 2, is appended as Annexure VI to the
Board’s report.
Internal Financial Control The Board has adopted policies and procedures for ensuring
the orderly and efficient conduct of its business including
adherence to the Company’s policies, safeguarding of its
assets, prevention and detection of frauds and errors,
accuracy and completeness of the accounting records and
timely preparation of reliable financial disclosures.
Risk Management PolicyDetails on the Company’s risk management framework,
risk identification, risk evaluation, mitigation measures
and monitoring mechanism form part of the management’s
discussion and analysis section of this Annual report.
Equal opportunityThe Company has always provided a congenial atmosphere
for work to all employees that is free from discrimination and
harassment including Sexual Harrasment. It has provided
equal opportunities of employment to all without regard
to the nationality, religion, caste, colour, language, marital
status and sex. The Company has also framed a policy on
‘Prevention of Sexual Harassment’ at the workplace. There
were no cases reported during the year under review under
the said policy.
Conservation of Energy, Technology Absorption, Foreign Exchange Earnings and Outgo The particulars as prescribed under Section 134(3)(m) of the
Companies Act, 2013 read with the Companies Rule 8 of The
Companies (Accounts) Rules, 2014, is appended as Annexure
VII to the Board’s report.

Corporate
Overview
Statutory
Reports
35
Financial
Statements
Investor education and protection fundPursuant to the provisions of Investor Education and
Protection Fund (Uploading of information regarding
unpaid and unclaimed amounts lying with companies) Rules,
2012, the Company has uploaded the details of unpaid and
unclaimed amounts lying with the Company as on 21 July
2014 (date of last Annual General Meeting) on the Company’s
website (www.wabag.com), and on the Ministry of Corporate
Affairs’ website.
SustainabilityYour Company is in the space of providing solutions in the
realm of Water and Waste Water treatment. Sustainability
runs through the Company in all its operations and functions.
Your Company continuously focuses on solutions which have
low carbon footprint and that are sustainable. Globally, your
Company is actively involved in providing solutions that
are eco-friendly and renewable in nature. Your Company’s
contribution towards Sustainability is continuous in nature
as is reflected throughout this report and form an integral
part of our business.
Particulars of employeesThe names and other particulars of employees in accordance
with the provisions of Section 197(12) of the Companies Act,
2013, read with Rule 5(1) of the Companies (Appointment and
Remuneration of Managerial Personnel) Rules, 2014 and a
statement containing the names of every employee employed
throughout the financial year and in receipt of remuneration
of ` 60 lakh or more, or employed for part of the year and in
receipt of ` 5 lakh or more a month, under Rule 5(2) of the
Companies (Appointment and Remuneration of Managerial
Personnel) Rules, 2014, is annexed herewith as Annexure VIII
to the Board’s report.
Corporate governanceYour Company is committed to maintain the highest
standards of Corporate Governance and comply with the
Securities and Exchange Board of India (SEBI)’s guidelines on
corporate governance. Your Company has also implemented
several best corporate governance practices as prevalent
globally. The Report on corporate governance as stipulated
under Clause 49 of the Listing Agreement forms part of this
Annual Report. The requisite Certificate from the Auditors
of the Company confirming compliance with the conditions
of corporate governance as stipulated under the aforesaid
Clause 49 is annexed to the report on corporate governance.
AcknowledgmentsYour Directors would like to express their appreciation
for the assistance and cooperation received from various
financial institutions, banks, government authorities,
customers, vendors and members during the year under
review. Your Directors place on record their appreciation for
the committed services from every member of the WABAG
family globally.
For and on behalf of the Board of Directors
Place : Chennai Rajiv Mittal Sumit Chandwani
Date : 25 May 2015 Managing Director Director

36 VA TECH WABAG LIMITED | Annual Report 2014-15
Directors’ Report
Annexure - I
Sta
tem
en
t co
nta
inin
g t
he
sa
lie
nt
fea
ture
s o
f th
e fi
na
nci
al
sta
tem
en
ts o
f su
bsi
dia
rie
s/ a
sso
cia
te c
om
pa
nie
s/ j
oin
t v
en
ture
s
(Pu
rsu
an
t to
firs
t p
rov
iso
to
Su
b-s
ecti
on
(3
) o
f S
ecti
on
12
9 o
f th
e C
om
pa
nie
s A
ct, 2
013
, re
ad
wit
h R
ule
5 o
f th
e C
om
pa
nie
s (A
cco
un
ts)
Ru
les,
20
14 -
AO
C-1
) (` I
n L
ak
hs)
S. N
o.N
ame
of th
e Co
mpa
nyR
epor
ting
Yea
rR
epor
ting
curr
ency
Cap
ital
Res
erve
sTo
tal A
sset
sTo
tal
Liab
iliti
es
Det
ails
of I
nves
tmen
t
(Exc
ept i
n ca
se o
f
Inve
stm
ent i
n Su
bsid
iary
)
Turn
over
Pro
fit
befo
re
Taxa
tion
Pro
visi
on fo
r
Taxa
tion
Pro
fit a
fter
Taxa
tion
Pro
pose
d
Div
iden
d
% o
f
shar
ehol
ding
1V
A T
EC
H W
ab
ag
(S
ing
ap
ore
) P
te. L
tdS
am
e a
s In
dia
SG
D 2
,02
3.6
2
1,4
81.
99
4
,12
5.52
6
19.9
2
-
-
473
.46
-
4
73.4
6
-10
0
2V
A T
EC
H W
ab
ag
(H
on
gk
on
g)
Ltd
.S
am
e a
s In
dia
HK
D 2
,28
0.7
1 (
254
.85)
2,0
30
.49
4
.63
-
-
(
18.0
9)
-
(18
.09
) -
100
3V
A T
EC
H W
ab
ag
Gm
bH
, Vie
nn
aS
am
e a
s In
dia
EU
R -
1
2,0
83.7
3
-
5,3
45.
50
3,3
66
.01
41,
319
.07
28
0.3
3
426
.76
(
146
.43
) -
100
4B
eiji
ng
VA
TE
CH
Wa
ba
g W
ate
r
Tre
atm
ent
Tech
no
log
y C
o. L
td.
Sa
me
as
Ind
iaC
NY
1,8
67.
32
(1,
969
.32
) 5
6.6
3
158
.62
-
8
3.2
3
(10
7.6
8)
-
(10
7.6
8)
-10
0
5V
A T
EC
H W
ab
ag
Deu
tsch
lan
d, G
mb
HS
am
e a
s In
dia
EU
R 1
56.4
1 (
585.
20
) 1
,12
5.2
2
1,5
54.0
1 -
5
8.8
2
23
.52
-
2
3.5
2
-10
0
6V
A T
EC
H W
ab
ag
Alg
erie
SA
RL
Sa
me
as
Ind
iaE
UR
856
.13
(
1,2
33.7
2)
29
.43
4
07.
02
-
4
21.
50
312
.54
-
3
12.5
4
-10
0
7W
AB
AG
Wa
sser
tech
nik
AG
Sa
me
as
Ind
iaE
UR
46
4.6
6
2,1
17.6
8
8,0
04
.66
5
,42
2.3
2
-
9,4
67.
92
3
3.5
7 4
.22
2
9.3
6
-10
0
8V
A T
EC
H W
AB
AG
BR
NO
sp
ol.
S.r
.o.
Sa
me
as
Ind
iaE
UR
50
.36
1
,82
0.9
1 5
,29
7.9
6
3,4
26.7
0
-
9,9
05.
29
6
30
.65
13
0.6
9
49
9.9
6
-10
0
9V
A T
EC
H W
AB
AG
Tu
nis
ie S
.A.R
.L.
Sa
me
as
Ind
iaE
UR
436
.15
22
7.86
1
,64
1.0
7 9
77.0
6
-
1,0
52.4
2
74
.79
0
.17
74
.62
-
100
10W
ab
ag
wa
ter
serv
ices
(M
aca
o)l
tdS
am
e a
s In
dia
EU
R 1
.43
5
39.6
9
910
.43
3
69.3
0
-
1,6
43
.97
26
0.9
9
23
.10
2
37.
89
-10
0
11W
AB
AG
Wa
ter
Ser
vic
es S
.R.L
.S
am
e a
s In
dia
EU
R 6
.79
2
,883
.96
4
,69
2.8
0
1,8
02
.05
-
11,
571.
74
1,1
29
.55
177
.48
9
52.0
7 -
100
12V
A T
EC
H W
ab
ag
Tec
hk
no
loji
si v
e
Tic
are
t L
imit
ed
Sa
me
as
Ind
iaE
UR
1,0
34
.46
(
797.
25)
5,2
10.3
7 4
,973
.16
-
1
1,6
63
.79
3
0.3
1 -
3
0.3
1 -
100
13V
A T
ech
Wa
ba
g M
usc
at
LL
C, O
ma
nS
am
e a
s In
dia
OM
R 2
43
.71
71.
11
519
.62
2
04
.81
-
1,2
98
.68
1
13.2
9
7.9
5 1
05.
34
-
70
14V
A T
ech
Wa
ba
g (
Ph
ilip
pin
es)
Inc.
Sa
me
as
Ind
iaP
HP
119
.85
1,6
56.4
3
9,7
05.
82
7
,92
9.5
5 -
1
3,9
77.4
4
1,2
07.
72
36
2.2
6
84
5.4
6
-10
0
15U
jam
s W
ast
ewa
ter
Tre
atm
ent
Co
mp
an
y (
Pty
) L
imit
ed, N
am
ibia
Jan
to
Dec
EU
R 6
49
.21
40
4.2
4
8,7
50.8
6
7,6
97.
41
-
2,8
19.9
2
354
.22
7
4.0
2
28
0.2
0
-78
.9
16V
A T
EC
H W
AB
AG
(S
PA
IN)
S.L
.US
am
e a
s In
dia
EU
R 3
57.0
5 (
654
.02
) 1
87.
87
48
4.8
4
-
95.
23
(
46
3.8
9)
18
.91
(4
82
.80
) -
100
17V
A T
ech
Wa
ba
g L
imit
ed P
rati
bh
a
Ind
ust
ries
Lim
ited
JV
Sa
me
as
Ind
iaN
PR
- 9
36.9
2
7,4
19.6
5 6
,48
2.7
4
-
9,4
24.0
5 1
,255
.69
3
15.3
7 9
40
.32
-
100
18W
ab
ag
Op
era
tio
n a
nd
Ma
inte
na
nce
WL
L
Sa
me
as
Ind
iaB
HD
82
.96
1
1.4
5 1
62
.93
6
8.5
1 7
9.4
2
11.
19
-
11.
19
-70
19V
A T
ech
Wa
ba
g a
nd
Ro
ots
Co
ntr
act
ing
L.L
.C
Sa
me
as
Ind
iaQ
AR
34
.36
2
74.5
8
1,0
24.3
5 7
15.4
1 9
67.
03
2
82
.05
13
.83
2
68
.22
6
0
20W
ab
ag
Lim
ited
Sa
me
as
Ind
iaT
HB
38
.43
(
27.
37)
17.
49
6
.43
0
.03
(
26.8
0)
-
(26
.80
)9
0.6
No
te: E
xch
an
ge
rate
use
d f
or
Ba
lan
ce S
hee
t it
ems
is t
he
rate
as
on
31st
Ma
rch
20
15 a
nd
fo
r P
rofi
t a
nd
Lo
ss a
cco
un
t it
ems
is t
he
av
era
ge
rate
fo
r th
e F
ina
nci
al
Yea
r 20
14-1
5
Cu
rren
cyR
ate
fo
r B
ala
nce
Sh
ee
t It
em
s IN
R
Ra
te f
or
Pro
fit
& L
oss
Acc
ou
nt
ite
ms
INR
1 E
uro
67.
93
7
7.4
9
1 S
ing
ap
ore
do
lla
r 4
5.56
4
7.4
6
1 H
KD
8.0
7 7
.88
1 C
NY
10
.23
9
.93
1 P
HP
1.4
0
1.3
8
1 O
MR
16
2.4
7 1
58.7
3
1 B
HD
16
5.9
2
16
2.0
9
1 Q
AR
17.
18
16
.78
1 N
PR
0.6
2
0.6
2
1 T
HB
1.9
2
1.8
8

Corporate
Overview
Statutory
Reports
37
Financial
Statements
Na
me
of
Ass
oci
ate
s/
Join
t V
entu
res
Win
dh
oe
k G
ore
an
ga
b O
pe
rati
ng
Co
mp
an
y (
Pty
) L
imit
ed
Inte
rna
tio
na
l W
ate
r
Tre
atm
en
t L
LC
, Om
an
OE
G R
en
ew
Wa
ters
(T
ho
oth
uk
ud
i)
Pv
t. L
td
La
test
au
dit
ed
Ba
lan
ce S
hee
t D
ate
MA
RC
H 3
1, 2
015
MA
RC
H 3
1, 2
015
MA
RC
H 3
1, 2
015
Sh
are
s o
f A
sso
cia
te/J
oin
t V
en
ture
s h
eld
by
th
e
com
pa
ny
on
th
e y
ea
r e
nd
N
o o
f sh
are
s33
48
,750
2,6
00
A
mo
un
t o
f In
ves
tmen
t in
Ass
oci
ate
s/Jo
int
Ven
ture
185.
74 L
ak
hs
69 L
ak
hs
0.2
6 L
ak
hs
E
xte
nd
of
Ho
ldin
g %
33%
32.5
0%
26%
De
scri
pti
on
of
ho
w t
he
re i
s si
gn
ifica
nt
infl
ue
nce
Th
ere
is
sig
nifi
can
t in
flu
en
ce d
ue
to
pe
rce
nta
ge
(%
) o
f sh
are
ca
pit
al.
Th
ere
is
sig
nifi
can
t in
flu
en
ce d
ue
to
pe
rce
nta
ge
(%
) o
f sh
are
ca
pit
al.
Th
ere
is
sig
nifi
can
t in
flu
en
ce d
ue
to
pe
rce
nta
ge
(%
) o
f sh
are
ca
pit
al
Re
aso
n w
hy
th
e a
sso
cia
te/j
oin
t v
en
ture
is
no
t
con
soli
da
ted
Th
ere
is
no
Co
ntr
ol
Th
ere
is
Join
t C
on
tro
lN
on
-op
era
tiv
e C
om
pa
ny
Ne
two
rth
att
rib
uta
ble
to
Sh
are
ho
ldin
g a
s p
er
late
st
au
dit
ed
Ba
lan
ce S
hee
t2
56.8
4 l
ak
hs
83.3
9 l
ak
hs
1 la
kh
Pro
fit
/ L
oss
fo
r th
e y
ea
r
C
on
sid
ered
in
Co
nso
lid
ati
on
159
.07
lak
hs
(1,0
11.9
0)
lak
hs
-
N
ot
Co
nsi
der
ed i
n C
on
soli
da
tio
n-
--
Fo
r a
nd
on
beh
alf
of
the
Bo
ard
of
Dir
ecto
rs
Pla
ce :
Ch
enn
ai
R
aji
v M
itta
l S
um
it C
ha
nd
wa
ni
Da
te :
25
Ma
y 2
015
M
an
ag
ing
Dir
ecto
r
Dir
ecto
r

38 VA TECH WABAG LIMITED | Annual Report 2014-15
Directors’ Report
S. No Particulars ESOP 2006# ESOP 2010*
Grant I Grant II Grant III
1 Number of options granted* 995,053 1,355,455 126,453 317,728
2 The Pricing Formula The options were
granted prior to the
listing of Company’s
shares. These options
were granted, based on
the valuation done by an
Independent Chartered
Account using Net Asset
Value (NAV) / Profit
Earning Capacity Value
Method (PECV)
The options were granted
prior to the listing of
Company’s shares. These
options were granted,
based on the valuation
done by an Independent
SEBI Registered Merchant
Banking Company using
Net Asset Value (NAV) /
Profit earning capacity
value method (PECV).
Discount up to a maximum
of 25% to the Closing Market
price per options, where
the Closing Market Price
shall be the latest available
closing price one day prior
to the date of the meeting
of the Remuneration
Committee in which the
options are granted. The
market price on the stock
exchange showing the
highest volume of trading
would be considered. The
Discount rate applicable
will be decide by the
Remuneration Committee.
3 Number of options vested 935,362 13,22,250 1,20,778 2,81,978
4 Number of options exercised 934,487 468,996 52,490 111,922
5 Total number of shares arising
as a result of exercise of options
929,353 468,996 52,490 111,922
6 Number of options Cancelled
and lapsed
60,566 375,259 34,911 35,750
7 Variation in the terms of options NA NA NA NA
8 Money realised by exercise of
options (`)
33,230,358 27,040,680 4,681,440 0
9 Total number of options in force 0 511,200 39,052 170,056
* During the year Company has issued bonus shares in the ratio of 1:1, hence number of options has been updated accordingly.
# The effect of bonus shares issued during the year has not been taken in to account in the case of options under the Scheme ESOP 2006 since, all the options
were either exerised or cancelled/lapsed prior to the effective date of Bonus Issue.
(B) Employee-wise details of options granted to
No options granted during
the year 2014-15
1. Senior managerial personnel
2. Employees who were granted, in any one year, options amounting to 5% or more of the
options granted during the year
3. Identified employees who were granted options, during any one year,
equal to or exceeding 1% of the issued capital (excluding outstanding
warrants and conversions) of the Company at the time of grant
(C) Diluted Earning per Share pursuant to issue of shares on exercise of options
calculated in accordance with Accounting Standard (AS) 20` 20.20
(D) The impact on the profits and EPS of the fair value method is given in the table below:
` in Lakhs
Consolidated Profits as reported 11,010
Add - Intrinsic Value Cost 77.00
Less - Fair Value Cost 128.00
Profits as adjusted 10,959.00
`Earnings Per Share (Basic) as reported 20.39
Earnings Per Share (Basic) adjusted 20.29
Earnings Per Share (Diluted) as reported 20.20
Earnings Per Share (Diluted) adjusted 20.09
E. Weighted average exercise price and fair value of options:
F. Method and assumptions used to estimate the fair value
of options granted during the year.
No options granted during the year 2014-15
Annexure II Disclosures with respect to Employees Stock Option Scheme of the Company
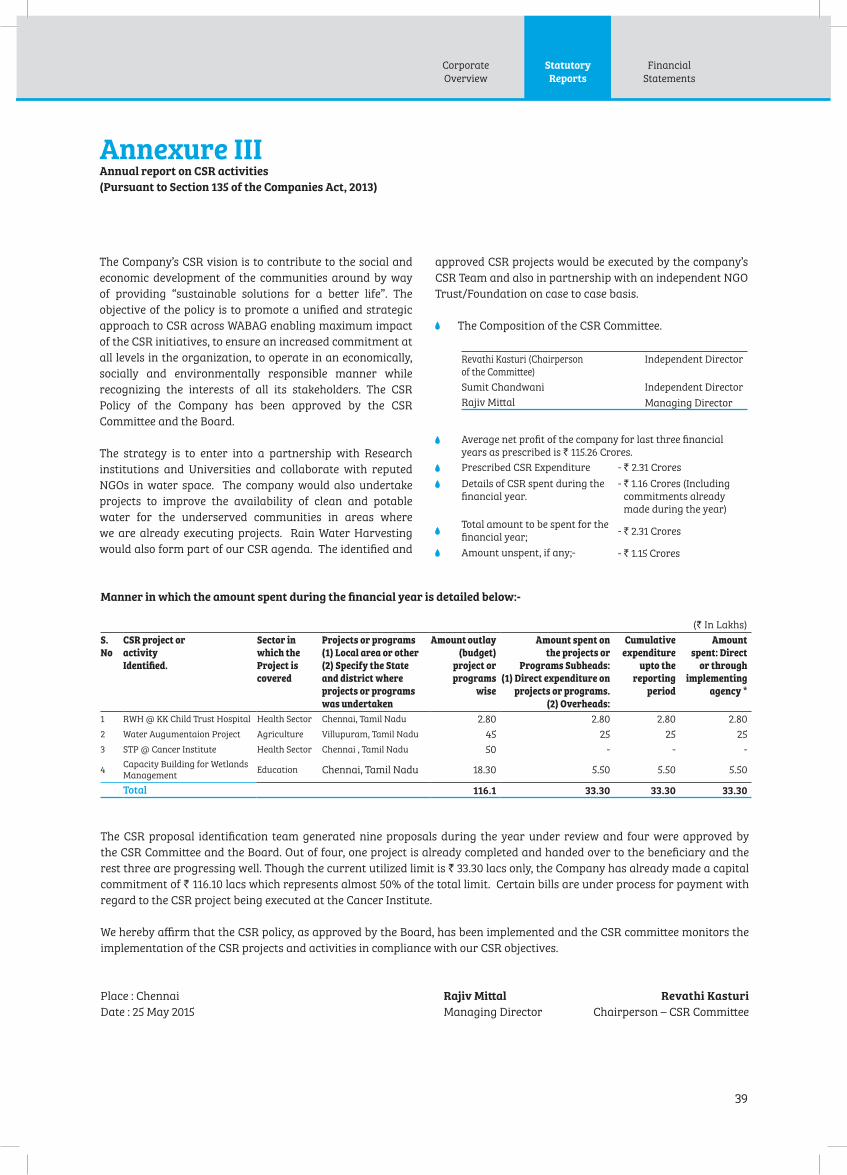
Corporate
Overview
Statutory
Reports
39
Financial
Statements
The Company’s CSR vision is to contribute to the social and
economic development of the communities around by way
of providing “sustainable solutions for a better life”. The
objective of the policy is to promote a unified and strategic
approach to CSR across WABAG enabling maximum impact
of the CSR initiatives, to ensure an increased commitment at
all levels in the organization, to operate in an economically,
socially and environmentally responsible manner while
recognizing the interests of all its stakeholders. The CSR
Policy of the Company has been approved by the CSR
Committee and the Board.
The strategy is to enter into a partnership with Research
institutions and Universities and collaborate with reputed
NGOs in water space. The company would also undertake
projects to improve the availability of clean and potable
water for the underserved communities in areas where
we are already executing projects. Rain Water Harvesting
would also form part of our CSR agenda. The identified and
Manner in which the amount spent during the financial year is detailed below:-
(` In Lakhs)
S.
No
CSR project or
activity
Identified.
Sector in
which the
Project is
covered
Projects or programs
(1) Local area or other
(2) Specify the State
and district where
projects or programs
was undertaken
Amount outlay
(budget)
project or
programs
wise
Amount spent on
the projects or
Programs Sub heads:
(1) Direct expenditure on
projects or programs.
(2) Overheads:
Cumul ative
expenditure
upto the
reporting
period
Amount
spent: Direct
or through
implementing
agency *
1 RWH @ KK Child Trust Hospital Health Sector Chennai, Tamil Nadu 2.80 2.80 2.80 2.80
2 Water Augumentaion Project Agriculture Villupuram, Tamil Nadu 45 25 25 25
3 STP @ Cancer Institute Health Sector Chennai , Tamil Nadu 50 - - -
4Capacity Building for Wetlands
ManagementEducation Chennai, Tamil Nadu 18.30 5.50 5.50 5.50
Total 116.1 33.30 33.30 33.30
The CSR proposal identification team generated nine proposals during the year under review and four were approved by
the CSR Committee and the Board. Out of four, one project is already completed and handed over to the beneficiary and the
rest three are progressing well. Though the current utilized limit is ` 33.30 lacs only, the Company has already made a capital
commitment of ` 116.10 lacs which represents almost 50% of the total limit. Certain bills are under process for payment with
regard to the CSR project being executed at the Cancer Institute.
We hereby affirm that the CSR policy, as approved by the Board, has been implemented and the CSR committee monitors the
implementation of the CSR projects and activities in compliance with our CSR objectives.
Annexure III Annual report on CSR activities
(Pursuant to Section 135 of the Companies Act, 2013)
Place : Chennai Rajiv Mittal Revathi Kasturi
Date : 25 May 2015 Managing Director Chairperson – CSR Committee
approved CSR projects would be executed by the company’s
CSR Team and also in partnership with an independent NGO
Trust/Foundation on case to case basis.
The Composition of the CSR Committee.
Revathi Kasturi (Chairperson
of the Committee)
Independent Director
Sumit Chandwani Independent Director
Rajiv Mittal Managing Director
Average net profit of the company for last three financial
years as prescribed is ` 115.26 Crores.
Prescribed CSR Expenditure - ` 2.31 Crores
Details of CSR spent during the
financial year.
- ̀ 1.16 Crores (Including
commitments already
made during the year)
Total amount to be spent for the
financial year; - ` 2.31 Crores
Amount unspent, if any;- - ` 1.15 Crores

40 VA TECH WABAG LIMITED | Annual Report 2014-15
Directors’ Report
Annexure IV
To,
The Members,
VA TECH WABAG LIMITED
(CIN: L45205TN1995PLC030231)
“Wabag House”,No. 17, 200 Feet Thoraipakkam-,
PallavaramMain Road, Sunnambu Kolathur,
Chennai-600117.
I have conducted the secretarial audit of the compliance
of applicable statutory provisions and the adherence to
good corporate practices by VA TECH WABAG LIMITED
(hereinafter called the company). Secretarial Audit was
conducted in a manner that provided me a reasonable basis
for evaluating the corporate conducts/statutory compliances
and expressing my opinion thereon.
Based on my verification of the VA TECH WABAG LIMITED
books, papers, minute books, forms and returns filed and
other records maintained by the company and also the
information provided by the Company, its officers, agents and
authorized representatives during the conduct of secretarial
audit, I hereby report that in my opinion, the company has,
during the audit period covering the financial year ended
on 31.03.2015 complied with the statutory provisions listed
hereunder and also that the Company has proper Board-
processes and compliance-mechanism in place to the extent,
in the manner and subject to the reporting made hereinafter:
I have examined the books, papers, minute books, forms
and returns filed and other records maintained by VA TECH
WABAG LIMITED (“theCompany”) for the financial year
ended on 31.03.2015 according to the provisions as may be
applicable:
(i) The Companies Act, 2013 (the Act) and the rules made
thereunder;
(ii) The Securities Contracts (Regulation) Act, 1956 (‘SCRA’)
andthe rules made thereunder;
(iii) The Depositories Act, 1996 and the Regulations and Bye-
laws framed thereunder;
(iv) Foreign Exchange Management Act, 1999 and the rules
and regulations made thereunder to the extent of
Foreign Direct Investment, Overseas Direct Investment
(v) The following Regulations and Guidelines prescribed
under the Securities and Exchange Board of India Act,
1992 (‘SEBI Act’):-
(a) The Securities and Exchange Board of India
(Substantial Acquisition of Shares and Takeovers)
Regulations, 2011;
(b) The Securities and Exchange Board of India
(Prohibition of Insider Trading) Regulations, 1992;
(c) The Securities and Exchange Board of India (Issue of
Capital and Disclosure Requirements) Regulations,
2009;
(d) The Securities and Exchange Board of India
(Employee Stock Option Scheme and Employee Stock
Purchase Scheme)Guidelines, 1999.
(e) The Securities and Exchange Board of India
(Registrars to an Issue and Share Transfer Agents)
Regulations, 1993 regarding the Companies Act and
dealing with client;
I have also examined compliance with the applicable
clauses ofthe following:
i. The Listing Agreements entered into by the
Company with The National Stock Exchange of
India Limited and BSE Limited.
During the period under review the Company
has complied with the provisions of the Act,
Rules, Regulations, Guidelines, Standards,
etc. mentioned above subject to the following
Observations: NIL
I further report that
The Board of Directors of the Company is duly
constituted with proper balance of Executive Director
and Independent Directors.
Adequate notice is given to all directors to schedule the
Board Meetings, agenda and detailed notes on agenda
were sent at least seven days in advance, and a system
exists for seeking andobtaining further information and
Secretarial Audit Report for the financial year ended March 31, 2015(Pursuant to section 204(1) of the Companies Act, 2013 and the rules made thereunder)

Corporate
Overview
Statutory
Reports
41
Financial
Statements
clarifications on the agenda items before the meeting
and for meaningful participation at the meeting.
Majority decision is carried through while the
dissenting members’views are captured and recorded
as part of the minutes.
I further report that there are adequate systems and
processes in the company commensurate with the size
and operations of the company to monitor and ensure
compliance with applicable laws, rules, regulations
and guidelines.
I further report that during the audit period the
a. Company has passed Ordinary resolution for
the Appointment of Mr. Sumit Chandwani (DIN
00179100) as an independent Director of the
company in accordance with Section 149, 152 and
other applicable provisions of the Companies Act,
2013. Vide Annual General Meeting dated 21/07/2014
b. Company has passed Ordinary resolution for the
Appointment of Ms. Revathi Kasturi (DIN 01837477)
as an independent Director of the company
in accordance with Section 149, 152 and other
applicable provisions of the Companies Act, 2013.
Vide Annual General Meeting dated 21/07/2014
c. Company has passed Ordinary resolution for
the Appointment of Mr. Bhagwan Dass Narang
(DIN 00038052) as an independent Director of the
company in accordance with Section 149, 152 and
other applicable provisions of the Companies Act,
2013. Vide Annual General Meeting dated 21/07/2014
d. Company has passed Ordinary resolution for the
Appointment of Mr. Jaithirth Rao (DIN 00025289)
as an independent Director of the company
in accordance with Section 149, 152 and other
applicable provisions of the Companies Act, 2013.
Vide Annual General Meeting dated 21/07/2014
e. Company has passed Special resolution for the
Payment of remuneration to non-executive directors
in accordance with Section 197, 198 and other
applicable provisions of the Companies Act, 2013
f. Company has allotted equity shares under
Employee Stock Option Scheme 2006 and 2010 on
various dates.
g. Company has obtained Shareholders Approval
through Postal Ballot for reclassification of
Authorized Capital and Issue of Bonus Shares on
17.03.2015.
h. Company has allotted Bonus shares vide
Stakeholders Relationship Committee Meeting
dated 27.03.2015.
Sd /-
Name of Company Secretary in practice : M. Damodaran
FCS No : 5837
C P No : 5081
Place : Chennai
Date : 25.05.2015
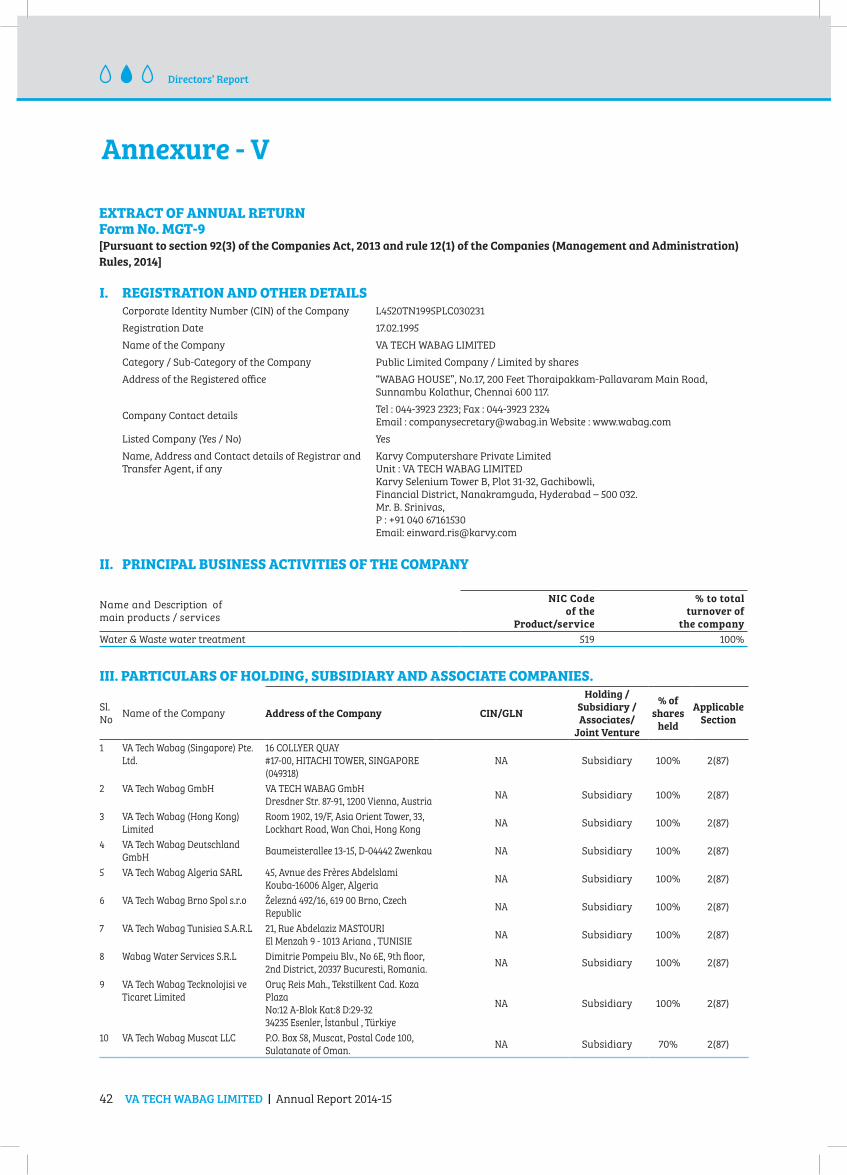
42 VA TECH WABAG LIMITED | Annual Report 2014-15
Directors’ Report
Annexure - V
EXTRACT OF ANNUAL RETURN Form No. MGT-9[Pursuant to section 92(3) of the Companies Act, 2013 and rule 12(1) of the Companies (Management and Administration)
Rules, 2014]
I. REGISTRATION AND OTHER DETAILSCorporate Identity Number (CIN) of the Company L4520TN1995PLC030231
Registration Date 17.02.1995
Name of the Company VA TECH WABAG LIMITED
Category / Sub-Category of the Company Public Limited Company / Limited by shares
Address of the Registered office “WABAG HOUSE”, No.17, 200 Feet Thoraipakkam-Pallavaram Main Road,
Sunnambu Kolathur, Chennai 600 117.
Company Contact detailsTel : 044-3923 2323; Fax : 044-3923 2324
Email : [email protected] Website : www.wabag.com
Listed Company (Yes / No) Yes
Name, Address and Contact details of Registrar and
Transfer Agent, if any
Karvy Computershare Private Limited
Unit : VA TECH WABAG LIMITED
Karvy Selenium Tower B, Plot 31-32, Gachibowli,
Financial District, Nanakramguda, Hyderabad – 500 032.
Mr. B. Srinivas,
P : +91 040 67161530
Email: [email protected]
II. PRINCIPAL BUSINESS ACTIVITIES OF THE COMPANY
Name and Description of
main products / services
NIC Code
of the
Product/service
% to total
turnover of
the company
Water & Waste water treatment 519 100%
III. PARTICULARS OF HOLDING, SUBSIDIARY AND ASSOCIATE COMPANIES.
Sl.
NoName of the Company Address of the Company CIN/GLN
Holding /
Subsidiary /
Associates/
Joint Venture
% of
shares
held
Applicable
Section
1 VA Tech Wabag (Singapore) Pte.
Ltd.
16 COLLYER QUAY
#17-00, HITACHI TOWER, SINGAPORE
(049318)
NA Subsidiary 100% 2(87)
2 VA Tech Wabag GmbH VA TECH WABAG GmbH
Dresdner Str. 87-91, 1200 Vienna, AustriaNA Subsidiary 100% 2(87)
3 VA Tech Wabag (Hong Kong)
Limited
Room 1902, 19/F, Asia Orient Tower, 33,
Lockhart Road, Wan Chai, Hong KongNA Subsidiary 100% 2(87)
4 VA Tech Wabag Deutschland
GmbHBaumeisterallee 13-15, D-04442 Zwenkau NA Subsidiary 100% 2(87)
5 VA Tech Wabag Algeria SARL 45, Avnue des Frères Abdelslami
Kouba-16006 Alger, AlgeriaNA Subsidiary 100% 2(87)
6 VA Tech Wabag Brno Spol s.r.o Železná 492/16, 619 00 Brno, Czech
RepublicNA Subsidiary 100% 2(87)
7 VA Tech Wabag Tunisiea S.A.R.L 21, Rue Abdelaziz MASTOURI
El Menzah 9 - 1013 Ariana , TUNISIENA Subsidiary 100% 2(87)
8 Wabag Water Services S.R.L Dimitrie Pompeiu Blv., No 6E, 9th floor,
2nd District, 20337 Bucuresti, Romania.NA Subsidiary 100% 2(87)
9 VA Tech Wabag Tecknolojisi ve
Ticaret Limited
Oruç Reis Mah., Tekstilkent Cad. Koza
Plaza
No:12 A-Blok Kat:8 D:29-32
34235 Esenler, İstanbul , Türkiye
NA Subsidiary 100% 2(87)
10 VA Tech Wabag Muscat LLC P.O. Box 58, Muscat, Postal Code 100,
Sulatanate of Oman.NA Subsidiary 70% 2(87)
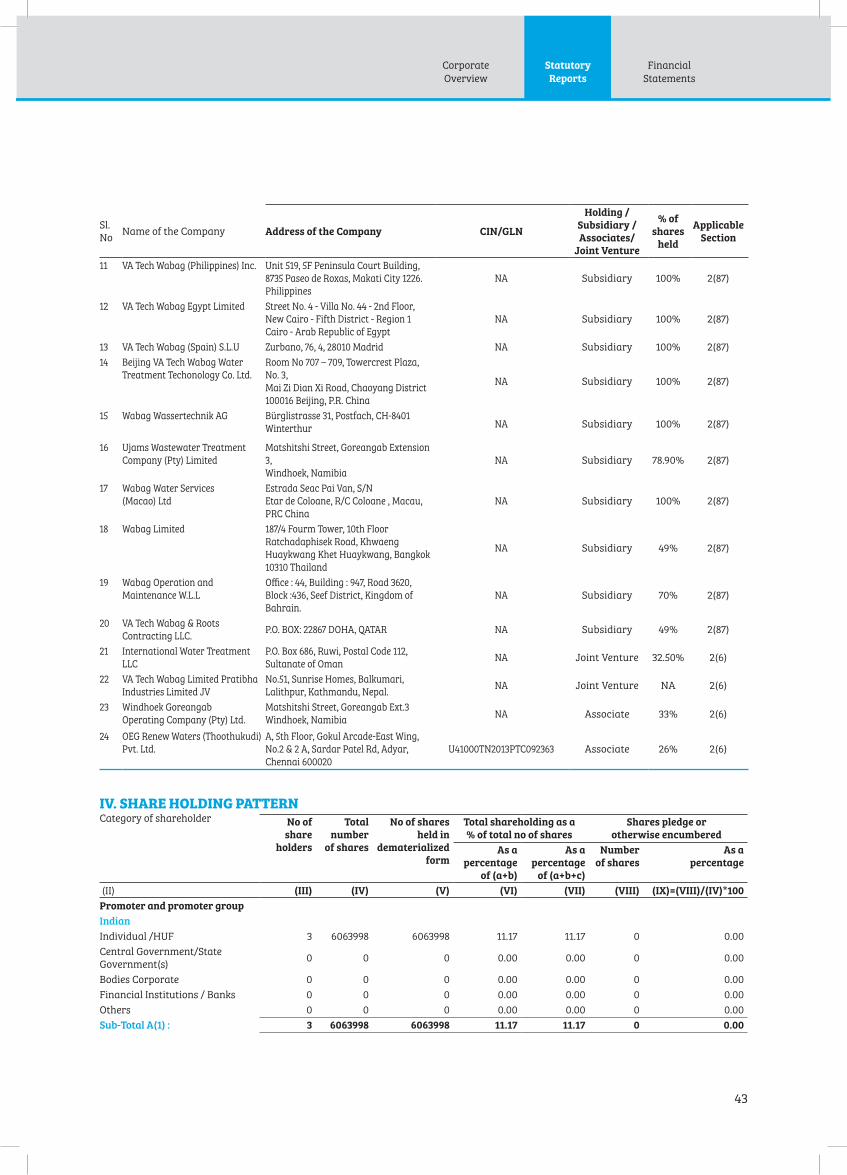
Corporate
Overview
Statutory
Reports
43
Financial
Statements
Sl.
NoName of the Company Address of the Company CIN/GLN
Holding /
Subsidiary /
Associates/
Joint Venture
% of
shares
held
Applicable
Section
11 VA Tech Wabag (Philippines) Inc. Unit 519, 5F Peninsula Court Building,
8735 Paseo de Roxas, Makati City 1226.
Philippines
NA Subsidiary 100% 2(87)
12 VA Tech Wabag Egypt Limited Street No. 4 - Villa No. 44 - 2nd Floor,
New Cairo - Fifth District - Region 1
Cairo - Arab Republic of Egypt
NA Subsidiary 100% 2(87)
13 VA Tech Wabag (Spain) S.L.U Zurbano, 76, 4, 28010 Madrid NA Subsidiary 100% 2(87)
14 Beijing VA Tech Wabag Water
Treatment Techonology Co. Ltd.
Room No 707 – 709, Towercrest Plaza,
No. 3,
Mai Zi Dian Xi Road, Chaoyang District
100016 Beijing, P.R. China
NA Subsidiary 100% 2(87)
15 Wabag Wassertechnik AG Bürglistrasse 31, Postfach, CH-8401
Winterthur NA Subsidiary 100% 2(87)
16 Ujams Wastewater Treatment
Company (Pty) Limited
Matshitshi Street, Goreangab Extension
3,
Windhoek, Namibia
NA Subsidiary 78.90% 2(87)
17 Wabag Water Services
(Macao) Ltd
Estrada Seac Pai Van, S/N
Etar de Coloane, R/C Coloane , Macau,
PRC China
NA Subsidiary 100% 2(87)
18 Wabag Limited 187/4 Fourm Tower, 10th Floor
Ratchadaphisek Road, Khwaeng
Huaykwang Khet Huaykwang, Bangkok
10310 Thailand
NA Subsidiary 49% 2(87)
19 Wabag Operation and
Maintenance W.L.L
Office : 44, Building : 947, Road 3620,
Block :436, Seef District, Kingdom of
Bahrain.
NA Subsidiary 70% 2(87)
20 VA Tech Wabag & Roots
Contracting LLC.P.O. BOX: 22867 DOHA, QATAR NA Subsidiary 49% 2(87)
21 International Water Treatment
LLC
P.O. Box 686, Ruwi, Postal Code 112,
Sultanate of OmanNA Joint Venture 32.50% 2(6)
22 VA Tech Wabag Limited Pratibha
Industries Limited JV
No.51, Sunrise Homes, Balkumari,
Lalithpur, Kathmandu, Nepal.NA Joint Venture NA 2(6)
23 Windhoek Goreangab
Operating Company (Pty) Ltd.
Matshitshi Street, Goreangab Ext.3
Windhoek, NamibiaNA Associate 33% 2(6)
24 OEG Renew Waters (Thoothukudi)
Pvt. Ltd.
A, 5th Floor, Gokul Arcade-East Wing,
No.2 & 2 A, Sardar Patel Rd, Adyar,
Chennai 600020
U41000TN2013PTC092363 Associate 26% 2(6)
IV. SHARE HOLDING PATTERNCategory of shareholder No of
share
holders
Total
number
of shares
No of shares
held in
dematerialized
form
Total shareholding as a
% of total no of shares
Shares pledge or
otherwise encumbered
As a
percentage
of (a+b)
As a
percentage
of (a+b+c)
Number
of shares
As a
percentage
(II) (III) (IV) (V) (VI) (VII) (VIII) (IX)=(VIII)/(IV)*100
Promoter and promoter group
Indian
Individual /HUF 3 6063998 6063998 11.17 11.17 0 0.00
Central Government/State
Government(s)0 0 0 0.00 0.00 0 0.00
Bodies Corporate 0 0 0 0.00 0.00 0 0.00
Financial Institutions / Banks 0 0 0 0.00 0.00 0 0.00
Others 0 0 0 0.00 0.00 0 0.00
Sub-Total A(1) : 3 6063998 6063998 11.17 11.17 0 0.00

44 VA TECH WABAG LIMITED | Annual Report 2014-15
Directors’ Report
Category of shareholder No of
share
holders
Total
number
of shares
No of shares
held in
dematerialized
form
Total shareholding as a
% of total no of shares
Shares pledge or
otherwise encumbered
As a
percentage
of (a+b)
As a
percentage
of (a+b+c)
Number
of shares
As a
percentage
(II) (III) (IV) (V) (VI) (VII) (VIII) (IX)=(VIII)/(IV)*100
Foreign
Individuals (NRIs/Foreign
Individuals)1 9709406 9709406 17.89 17.89 0 0.00
Bodies Corporate 0 0 0 0.00 0.00 0 0.00
Institutions 0 0 0 0.00 0.00 0 0.00
Qualified Foreign Investor 0 0 0 0.00 0.00 0 0.00
Others 0 0 0 0.00 0.00 0 0.00
Sub-Total A(2) : 1 9709406 9709406 17.89 17.89 0 0.00
Total A=A(1)+A(2) 4 15773404 15773404 29.06 29.06 0 0.00
Public Shareholding
Institutions
Mutual Funds /UTI 77 11731516 11731516 21.61 21.61
Financial Institutions /Banks 4 97726 97726 0.18 0.18
Central Government / State
Government(s)0 0 0 0.00 0.00
Venture Capital Funds 0 0 0 0.00 0.00
Insurance Companies 1 12914 12914 0.02 0.02
Foreign Institutional Investors 114 16095918 16095918 29.65 29.65
Foreign Venture Capital Investors 0 0 0 0.00 0.00
Qualified Foreign Investor 0 0 0 0.00 0.00
Others 0 0 0 0.00 0.00
Sub-Total B(1) : 196 27938074 27938074 51.47 51.47
Non-Institutions
Bodies Corporate 706 3518450 3518450 6.48 6.48
Individuals
(i) Individuals holding nominal
share capital upto ` 1 lakh32595 5087852 5087706 9.37 9.37
(ii) Individuals holding nominal
share capital in excess of ` 1
lakh
1 128000 128000 0.24 0.24
Others
Foreign Bodies 3 1464920 1464920 2.70 2.70
Clearing Members 99 107010 107010 0.20 0.20
Non Resident Indians 673 230204 230204 0.42 0.42
Trusts 5 37196 37196 0.07 0.07
Qualified Foreign Investor 0 0 0 0.00 0.00
Sub-Total B(2) : 34082 10573632 10573486 19.48 19.48
Total B=B(1)+B(2) : 34278 38511706 38511560 70.94 141.89
Total (A+B) : 34282 54285110 54284964 100.00 200.00
Shares held by custodians,
against which Depository
Receipts have been issued
Promoter and Promoter Group
Public 0 0 0 0.00 0.00
GRAND TOTAL (A+B+C) : 34282 54285110 54284964 100.00 100.00 0 0.00

Corporate
Overview
Statutory
Reports
45
Financial
Statements
(ii) Shareholding of Promoters
Sl.
No
Shareholder's
Name
Shareholding at the beginning of the year Shareholding at the end of the year
No. of
Shares
% of total
Shares of
the company
%of Shares
Pledged /
encumbered
to total shares
No.of
Shares
% of total
Shares of
the Company
%of Shares
Pledged /
encumbered to
total shares
% change in
share- holding
during the
year
1 Rajiv Mittal 48,54,703 18.26% Nil 97,09,406 17.89% Nil (0.37%)
2 S. Varadarajan 10,92,881 4.11% Nil 21,85,762 4.03% Nil (0.08%)
3 Amit Sengupta 12,08,941 4.55% Nil 22,77,882 4.20% Nil (0.35%)
4 Shiv Narayan Saraf 9,00,177 3.39% Nil 16,00,354 2.95% Nil (0.44%)
Total 80,56,702 30.31% 1,57,73,404 29.07% 1.24%
(iii) Change in Promoters’ Shareholding
SI.
No.Name of the shareholder
Shareholding at the
beginning of the year
Cumulative Shareholding
during the year
No. of
shares
% of total
shares of the
company
No. of
shares
% of total
shares of the
company
1 Rajiv Mittal
At the beginning of the year
Bonus Issue in the ratio of 1:1
At the end of the year
48,54,703
48,54,703
-
18.26%
-
-
4,85,4,703
97,09,406
97,09,406
18.26%
17.89%
17.89%
2 S. Varadarajan
At the beginning of the year
Bonus Issue in the ratio of 1:1
At the end of the year
10,92,881
10,92,881
-
4.11%
-
-
10,92,881
21,85,762
21,85,762
4.11%
4.03%
4.03%
3 Amit Sengupta
At the beginning of the year
Sale of shares on 10.09.2014
Bonus Issue in the ratio of 1:1
At the end of the year
12,08,941
70,000
11,38,941
-
4.55%
-
-
-
12,08,941
11,38,941
22,77,882
22,77,882
4.55%
4.25%
4.20%
4.20%
4 Shiv Narayan Saraf
At the beginning of the year
Sale of shares on 10.09.2014
Bonus Issue in the ratio of 1:1
At the end of the year
9,00,177
1,00,000
8,00,177
-
3.39%
-
-
-
9,00,177
8,00,177
16,00,354
16,00,354
3.39%
2.99%
2.95%
2.95%
(iv) Shareholding Pattern of top ten Shareholders (other than Directors, Promoters and Holders of GDRs and ADRs):
SI.
No.Name of the shareholder
Shareholding at the beginning of
the year
Cumulative Shareholding during
the year
No. of
shares
% of total
shares of the
company
No. of
shares*
% of total
shares of the
company*
1 IDFC PREMIER EQUITY FUND
01/04/2014 Opening Balance 1937417 7.29 1937417 7.29
16/05/2014 Purchase 37583 0.14 1975000 7.43
30/09/2014 Sale 35000 0.13 1940000 7.24
03/10/2014 Sale 10000 0.04 1930000 7.20
06/02/2015 Purchase 104000 0.38 2034000 7.51
13/03/2015 Purchase 13000 0.05 2047000 7.54
20/03/2015 Sale 60266 0.22 1986734 7.32
27/03/2015 Sale 18145 0.07 1968589 7.25
27/03/2015 Bonus Allotment 1968589 3.63 3937178 7.25
31/03/2015 Closing Balance 0.00 3937178 7.25

46 VA TECH WABAG LIMITED | Annual Report 2014-15
Directors’ Report
SI.
No.Name of the shareholder
Shareholding at the beginning of
the year
Cumulative Shareholding during
the year
No. of
shares
% of total
shares of the
company
No. of
shares*
% of total
shares of the
company*
2 EMERGING MARKETS GROWTH FUND, INC.
01/04/2014 Opening Balance 1584552 5.96 1584552 5.96
04/04/2014 Sale 135197 0.51 1449355 5.45
11/04/2014 Sale 30040 0.11 1419315 5.34
16/05/2014 Sale 250652 0.94 1168663 4.39
25/07/2014 Sale 66585 0.25 1102078 4.13
08/08/2014 Sale 75413 0.28 1026665 3.84
22/08/2014 Sale 7221 0.03 1019444 3.82
29/08/2014 Sale 45168 0.17 974276 3.65
12/09/2014 Sale 93084 0.35 881192 3.29
31/10/2014 Sale 2760 0.01 878432 3.28
07/11/2014 Sale 61617 0.23 816815 3.05
14/11/2014 Sale 11276 0.04 805539 2.99
21/11/2014 Sale 4912 0.02 800627 2.97
06/02/2015 Sale 10500 0.04 790127 2.92
13/02/2015 Sale 57000 0.21 733127 2.70
27/03/2015 Bonus Allotment 733127 1.35 1466254 2.70
31/03/2015 Closing Balance 0.00 1466254 2.70
3 SBI MAGNUM TAXGAIN SCHEME
01/04/2014 Opening Balance 1280227 4.81 1280227 4.81
04/04/2014 Sale 16227 0.06 1264000 4.75
13/03/2015 Sale 13962 0.05 1250038 4.61
20/03/2015 Sale 50038 0.18 1200000 4.42
27/03/2015 Bonus Allotment 1200000 2.21 2400000 4.42
27/03/2015 Sale 17659 0.03 2382341 4.39
31/03/2015 Closing Balance 0.00 2382341 4.39
4 HSBC BANK (MAURITIUS) LTD A/C SUMITOMO CORPORATION
01/04/2014 Opening Balance 1228460 4.62 1228460 4.62
27/03/2015 Bonus Allotment 1228460 2.26 2456920 4.53
31/03/2015 Closing Balance 0.00 2456920 4.53
5 ICICI PRUDENTIAL LIFE INSURANCE CO LTD
01/04/2014 Opening Balance 990647 3.73 990647 3.73
04/04/2014 Sale 955 0.00 989692 3.72
09/05/2014 Sale 24224 0.09 965468 3.63
16/05/2014 Purchase 24224 0.09 989692 3.72
30/06/2014 Sale 19022 0.07 970670 3.63
01/08/2014 Sale 246 0.00 970424 3.63
08/08/2014 Purchase 240 0.00 970664 3.63
15/08/2014 Sale 4255 0.02 966409 3.62
29/08/2014 Purchase 180 0.00 966589 3.62
05/09/2014 Sale 240 0.00 966349 3.61
19/09/2014 Sale 160 0.00 966189 3.60
30/09/2014 Sale 540 0.00 965649 3.60
03/10/2014 Sale 100 0.00 965549 3.60
10/10/2014 Sale 3128 0.01 962421 3.59
17/10/2014 Sale 312 0.00 962109 3.59
24/10/2014 Sale 72 0.00 962037 3.59
31/10/2014 Sale 552 0.00 961485 3.59
07/11/2014 Sale 72 0.00 961413 3.59

Corporate
Overview
Statutory
Reports
47
Financial
Statements
SI.
No.Name of the shareholder
Shareholding at the beginning of
the year
Cumulative Shareholding during
the year
No. of
shares
% of total
shares of the
company
No. of
shares*
% of total
shares of the
company*
14/11/2014 Sale 240 0.00 961173 3.57
28/11/2014 Sale 220 0.00 960953 3.57
05/12/2014 Purchase 160 0.00 961113 3.55
12/12/2014 Purchase 80 0.00 961193 3.55
19/12/2014 Purchase 40504 0.15 1001697 3.70
31/12/2014 Sale 220 0.00 1001477 3.70
23/01/2015 Sale 1478 0.01 999999 3.69
06/02/2015 Purchase 121 0.00 1000120 3.69
13/02/2015 Purchase 345 0.00 1000465 3.69
20/02/2015 Sale 15487 0.06 984978 3.63
27/02/2015 Sale 24021 0.09 960957 3.54
06/03/2015 Sale 2565 0.01 958392 3.53
20/03/2015 Sale 10875 0.04 947517 3.49
27/03/2015 Sale 8400 0.03 939117 3.46
27/03/2015 Bonus Allotment 939117 1.73 1878234 3.46
31/03/2015 Closing Balance 0.00 1878234 3.46
6 CAPITAL INTERNATIONAL EMERGING MARKETS FUND
01/04/2014 Opening Balance 783897 2.95 783897 2.95
30/06/2014 Sale 53203 0.20 730694 2.74
25/07/2014 Sale 61953 0.23 668741 2.50
08/08/2014 Sale 73697 0.28 595044 2.23
22/08/2014 Sale 15113 0.06 579931 2.17
29/08/2014 Sale 94509 0.35 485422 1.82
05/09/2014 Sale 2977 0.01 482445 1.80
12/09/2014 Sale 48600 0.18 433845 1.62
10/10/2014 Sale 5000 0.02 428845 1.60
31/10/2014 Sale 4740 0.02 424105 1.58
07/11/2014 Sale 61183 0.23 362922 1.35
14/11/2014 Sale 10463 0.04 352459 1.31
21/11/2014 Sale 5614 0.02 346845 1.29
20/03/2015 Sale 5000 0.02 341845 1.26
27/03/2015 Sale 113500 0.42 228345 0.84
27/03/2015 Bonus Allotment 228345 0.42 456690 0.84
31/03/2015 Closing Balance 0.00 456690 0.84
7 GOVERNMENT PENSION FUND GLOBAL
01/04/2014 Opening Balance 672966 2.53 672966 2.53
20/06/2014 Sale 82299 0.31 590667 2.21
30/06/2014 Sale 5300 0.02 585367 2.19
21/11/2014 Sale 585367 2.17 0 0.00
31/03/2015 Closing Balance 0.00 0 0.00
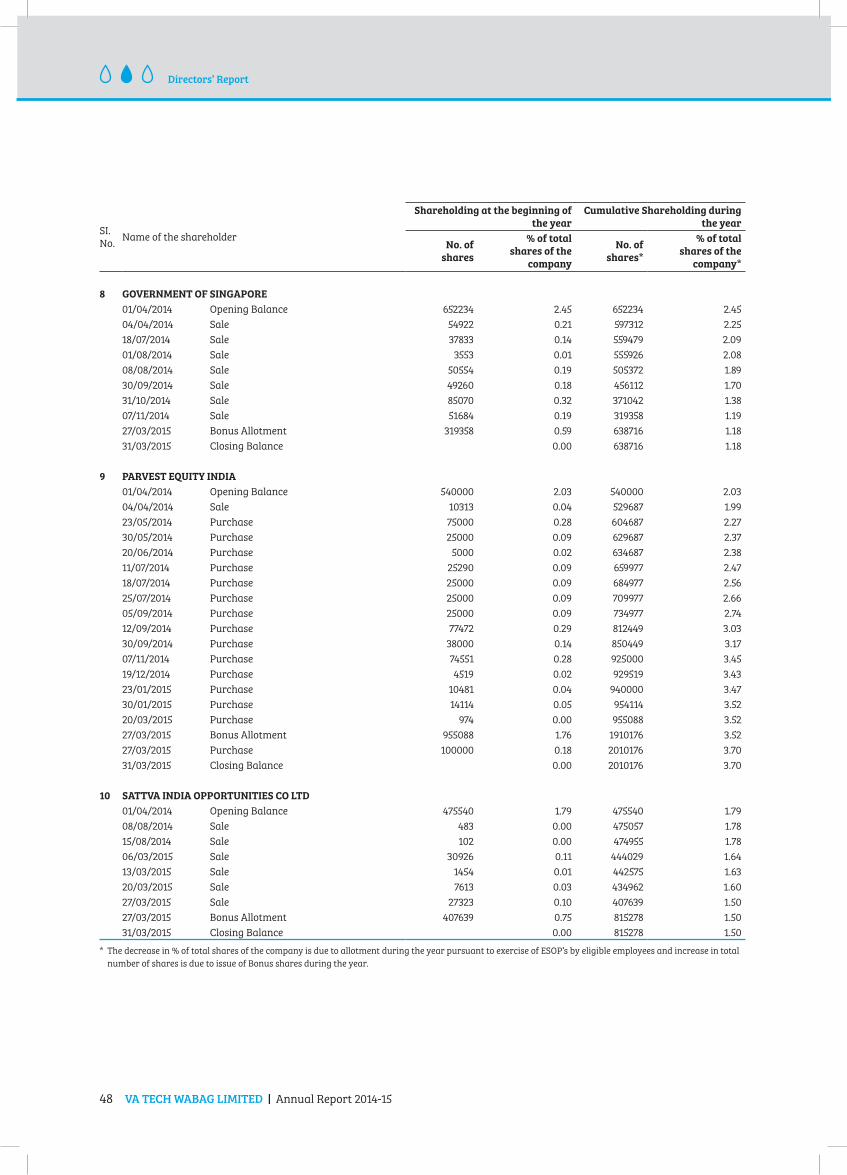
48 VA TECH WABAG LIMITED | Annual Report 2014-15
Directors’ Report
SI.
No.Name of the shareholder
Shareholding at the beginning of
the year
Cumulative Shareholding during
the year
No. of
shares
% of total
shares of the
company
No. of
shares*
% of total
shares of the
company*
8 GOVERNMENT OF SINGAPORE
01/04/2014 Opening Balance 652234 2.45 652234 2.45
04/04/2014 Sale 54922 0.21 597312 2.25
18/07/2014 Sale 37833 0.14 559479 2.09
01/08/2014 Sale 3553 0.01 555926 2.08
08/08/2014 Sale 50554 0.19 505372 1.89
30/09/2014 Sale 49260 0.18 456112 1.70
31/10/2014 Sale 85070 0.32 371042 1.38
07/11/2014 Sale 51684 0.19 319358 1.19
27/03/2015 Bonus Allotment 319358 0.59 638716 1.18
31/03/2015 Closing Balance 0.00 638716 1.18
9 PARVEST EQUITY INDIA
01/04/2014 Opening Balance 540000 2.03 540000 2.03
04/04/2014 Sale 10313 0.04 529687 1.99
23/05/2014 Purchase 75000 0.28 604687 2.27
30/05/2014 Purchase 25000 0.09 629687 2.37
20/06/2014 Purchase 5000 0.02 634687 2.38
11/07/2014 Purchase 25290 0.09 659977 2.47
18/07/2014 Purchase 25000 0.09 684977 2.56
25/07/2014 Purchase 25000 0.09 709977 2.66
05/09/2014 Purchase 25000 0.09 734977 2.74
12/09/2014 Purchase 77472 0.29 812449 3.03
30/09/2014 Purchase 38000 0.14 850449 3.17
07/11/2014 Purchase 74551 0.28 925000 3.45
19/12/2014 Purchase 4519 0.02 929519 3.43
23/01/2015 Purchase 10481 0.04 940000 3.47
30/01/2015 Purchase 14114 0.05 954114 3.52
20/03/2015 Purchase 974 0.00 955088 3.52
27/03/2015 Bonus Allotment 955088 1.76 1910176 3.52
27/03/2015 Purchase 100000 0.18 2010176 3.70
31/03/2015 Closing Balance 0.00 2010176 3.70
10 SATTVA INDIA OPPORTUNITIES CO LTD
01/04/2014 Opening Balance 475540 1.79 475540 1.79
08/08/2014 Sale 483 0.00 475057 1.78
15/08/2014 Sale 102 0.00 474955 1.78
06/03/2015 Sale 30926 0.11 444029 1.64
13/03/2015 Sale 1454 0.01 442575 1.63
20/03/2015 Sale 7613 0.03 434962 1.60
27/03/2015 Sale 27323 0.10 407639 1.50
27/03/2015 Bonus Allotment 407639 0.75 815278 1.50
31/03/2015 Closing Balance 0.00 815278 1.50
* The decrease in % of total shares of the company is due to allotment during the year pursuant to exercise of ESOP’s by eligible employees and increase in total
number of shares is due to issue of Bonus shares during the year.

Corporate
Overview
Statutory
Reports
49
Financial
Statements
v. Shareholding of Directors and Key Managerial Personnel:
SI.
No.Name of the Director / KMP
Shareholding at the beginning of
the year
Cumulative Shareholding during
the year
No. of
shares
% of total
shares of the
company
No. of
shares*
% of total
shares of the
company*
1 Rajiv Mittal ( Managing Director)
At the beginning of the year
Sale/Purchase from 1 April 2014 till Bonus Issue
Bonus Issue in the ratio of 1:1
At the end of the year
48,54,703
-
48,54,703
-
18.26%
-
-
-
48,54,703
48,54,703
97,09,406
97,09,406
18.26%
18.26%
17.89%
17.89%
2 Jaithirth Rao (Director)
At the beginning of the year
Sale/Purchase from 1 April 2014 till Bonus Issue
Bonus Issue in the ratio of 1:1
At the end of the year
92,734
12,734
80,000
-
0.35%
-
-
-
92,734
80,000
1,60,000
1,60,000
0.35%
-
0.29%
0.29%
3 S. Varadarajan (KMP)
At the beginning of the year
Sale/Purchase from 1 April 2014 till Bonus Issue
Bonus Issue in the ratio of 1:1
At the end of the year
10,92,881
-
10,92,881
-
4.11%
-
-
-
10,92,881
10,92,881
21,85,762
21,85,762
4.11%
4.11%
4.03%
4.03%
4 Rajiv Balakrishnan (KMP)
At the beginning of the year
Sale/Purchase from 1 April 2014 till Bonus Issue
Bonus Issue in the ratio of 1:1
At the end of the year
2,819
1,568
1,251
-
0.01%
-
-
-
2,819
1,251
2,502
2,502
0.01%
-
0.00%
0.00%
* The decrease in % of total shares of the company is due to allotment during the year pursuant to increase of ESOP’s by eligible employees and exercise in total
number of shares is due ti issue of Bonus shares during the year.
INDEBTEDNESS:
Indebtedness of the Company including interest outstanding/accrued but not due for payment
(` In Lakhs)
Secured Loans
excluding
deposits
Unsecured
LoansDeposits
Total
Indebtedness
Indebtedness at the beginning of the financial year
i) Principal Amount
ii) Interest due but not paid
iii) Interest accrued but not due
8,903
44
-
-
-
-
-
8,903
44
-
Total (i+ii+iii) 8,947 - - 8,947
Change in Indebtedness during the financial year
Addition
Reduction
35,837
38,521
-
-
-
-
35,837
38,521
Net Change (2,684) - - (2,684)
Indebtedness at the end of the financial year
i) Principal Amount
ii) Interest due but not paid
iii) Interest accrued but not due
6,260
2
-
-
-
-
-
-
-
6,260
2
-
Total (i+ii+iii) 6,263 - - 6,263

50 VA TECH WABAG LIMITED | Annual Report 2014-15
Directors’ Report
vi. Remuneration of Directors and Key Managerial Personnel
A. Remuneration to Managing Director, Whole-time Directors and/or Manager:
(` In Lakhs)
SI.
No.Particulars of Remuneration
Managing Director Total Amount
Rajiv Mittal
1. Gross salary
(a) Salary as per provisions contained in section 17(1) of the Income-tax Act, 1961 235.63 235.63
(b) Value of perquisites u/s 17(2) Income-tax Act, 1961 6.90 6.90
(c) Profits in lieu of salary under section 17(3) Income-tax Act, 1961 - -
2. Stock Option - -
3. Sweat Equity - -
4. Commission - -
- as % of profit - -
- others, specify. - -
5. Others, (Provident Fund & Superannuation) 13.10 13.10
Total (A) 255.63 255.63
Ceiling as per the Act 807.20
B. Remuneration to other Directors
(` In Lakhs)
SI.
No.Particulars of Remuneration
Name of DirectorsTotal
AmountBD NarangJaithirth
Rao
Sumit
Chandwani
Revathi
Kasturi
3. Independent Directors
Fee for attending board committee meetings - - - - -
Commission 20 15 15 15 65
Others, please specify - - - - -
Total (1) 20 15 15 15 65
3. Non-Executive Directors
Fee for attending board committee meetings - - - - -
Commission - - - - -
Others, please specify - - - - -
Total (2) - - - - -
Total (B)=(1+2) 20 15 15 15 65
Total Managerial Remuneration 20 15 15 15 65
Overall Ceiling as per the Act 161.44
C. Remuneration to Key Managerial Personnel other than MD/Manager/WTD SI.
No.Particulars of Remuneration Key Managerial Personnel
Total
AmountCFOCompany
Secretary
1. Gross salary
(a) Salary as per provisions contained in section 17(1) of the Income-tax Act, 1961 67.81 22.06 89.87
(b) Value of perquisites u/s 17(2) Income-tax Act, 1961 0.40 0.350.75
(c) Profits in lieu of salary under section 17(3) Income-tax Act, 1961 - - -
2. Stock Option - 35.27 35.27
3. Sweat Equity - -
4. Commission
- as % of profit
- others, specify...
- -
5. Others, (Provident Fund & Superannuation) 4.40 1.44 5.84
Total (A) 72.61 59.12 131.73
vii. Penalties / Punishment/ Compounding Of Offences: Nil
There were no penalties/punishments/compounding offences for the year ended 31st March 2015.
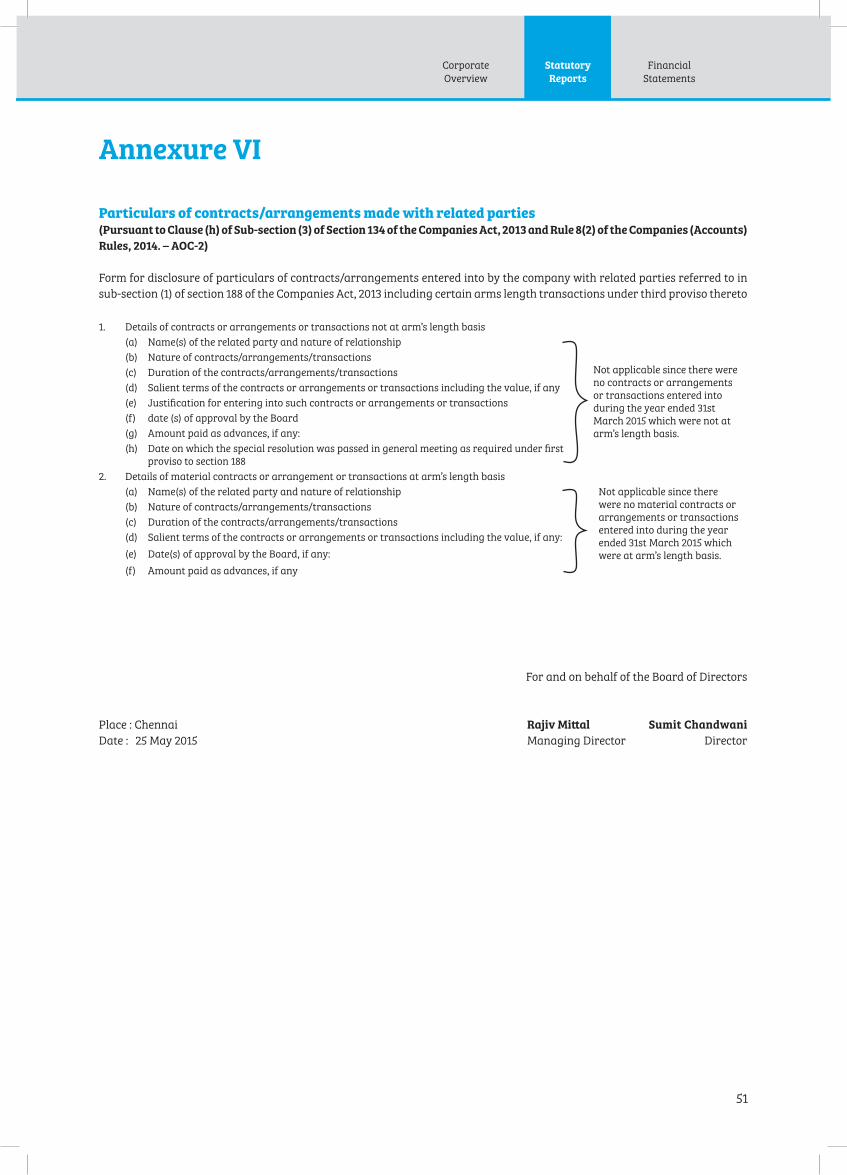
Corporate
Overview
Statutory
Reports
51
Financial
Statements
Particulars of contracts/arrangements made with related parties(Pursuant to Clause (h) of Sub-section (3) of Section 134 of the Companies Act, 2013 and Rule 8(2) of the Companies (Accounts)
Rules, 2014. – AOC-2)
Form for disclosure of particulars of contracts/arrangements entered into by the company with related parties referred to in
sub-section (1) of section 188 of the Companies Act, 2013 including certain arms length transactions under third proviso thereto
1. Details of contracts or arrangements or transactions not at arm’s length basis
(a) Name(s) of the related party and nature of relationship
Not applicable since there were
no contracts or arrangements
or transactions entered into
during the year ended 31st
March 2015 which were not at
arm’s length basis.
(b) Nature of contracts/arrangements/transactions
(c) Duration of the contracts/arrangements/transactions
(d) Salient terms of the contracts or arrangements or transactions including the value, if any
(e) Justification for entering into such contracts or arrangements or transactions
(f) date (s) of approval by the Board
(g) Amount paid as advances, if any:
(h) Date on which the special resolution was passed in general meeting as required under first
proviso to section 188
2. Details of material contracts or arrangement or transactions at arm’s length basis
(a) Name(s) of the related party and nature of relationship Not applicable since there
were no material contracts or
arrangements or transactions
entered into during the year
ended 31st March 2015 which
were at arm’s length basis.
(b) Nature of contracts/arrangements/transactions
(c) Duration of the contracts/arrangements/transactions
(d) Salient terms of the contracts or arrangements or transactions including the value, if any:
(e) Date(s) of approval by the Board, if any:
(f) Amount paid as advances, if any
Annexure VI
For and on behalf of the Board of Directors
Place : Chennai Rajiv Mittal Sumit Chandwani
Date : 25 May 2015 Managing Director Director

52 VA TECH WABAG LIMITED | Annual Report 2014-15
Directors’ Report
Annexure VII
Conservation of energy, research and development, technology absorption, foreign exchange earnings and outgo.(Particulars pursuant to the Companies (Accounts) Rules, 2014)
(A) Conservation of energy-
(i) The steps taken or impact on
conservation of energy;
The Company has been Designing and Executing “Power Neutral” plants wherein the
methane from biogas is digested and is used to generate energy to run the waste water
treatment plants on self-sustaining basis. Recently the Company had also designed
and installed Energy Recovery system in the 100MLD Nemmeli Desalination plant.
(ii) The steps taken by the
company for utilizing
alternate sources of energy;
The Company has entered into a wheeling agreement with M/s Ganpathi Marine
Enterprise Pvt Ltd., one of the Wind Power Companies, for supply of Wind Power thru
TANGEDCO from Feb 2015. Since then, the Company has been receiving Wind Power
@ ` 1 less than the TNEB Power. In this process, Company is not only controlling
the overall energy cost, but also become part of efficient green energy compliant
Corporate.
(iii) The capital investment
on energy conservation
equipments;
Variable frequency drive (VFD) for our rotary equipments like AHUs .
Reduction of frequency depending upon the load will lead to energy conservation
and optimum utilization.
Heat Recovery Wheel (HRW)
Fresh air being brought into the building and stale air being removed from the
system with minimum loss on Heat.
Building Management System
Remote Monitoring and operation of HVAC Equipments, leading to energy
conservation and optimum utilization
(B) Technology absorption-
The details on R&D efforts
and technology absorption
are disclosed in the
Management Discussion
and Analysis forming part
of this report.
(i) The efforts made towards technology absorption;
(ii) The benefits derived like product improvement, cost reduction, Product
development or import substitution;
(iii) In case of imported technology (imported during the last three years reckoned
from the beginning of the financial year)
(a) The details of technology imported;
(b) The year of import;
(c) Whether the technology been fully absorbed;
(d) If not fully absorbed, areas where absorption has not taken place, and the
reasons thereof; and
(iv) The expenditure incurred on Research and Development ` 141 Lakhs
(C) Foreign exchange earnings and Outgo-
The Foreign Exchange earned in terms of actual inflows during the year and the Foreign Exchange outgo during the year
in terms of actual outflows.
` In Lakhs
2014-15 2013-14
Earnings in Foreign Currency 31,198.00 31,808.00
Expenditure in Foreign Currency 5,184.00 3,575.00
For and on behalf of the Board of Directors
Place : Chennai Rajiv Mittal Sumit Chandwani
Date : 25 May 2015 Managing Director Director
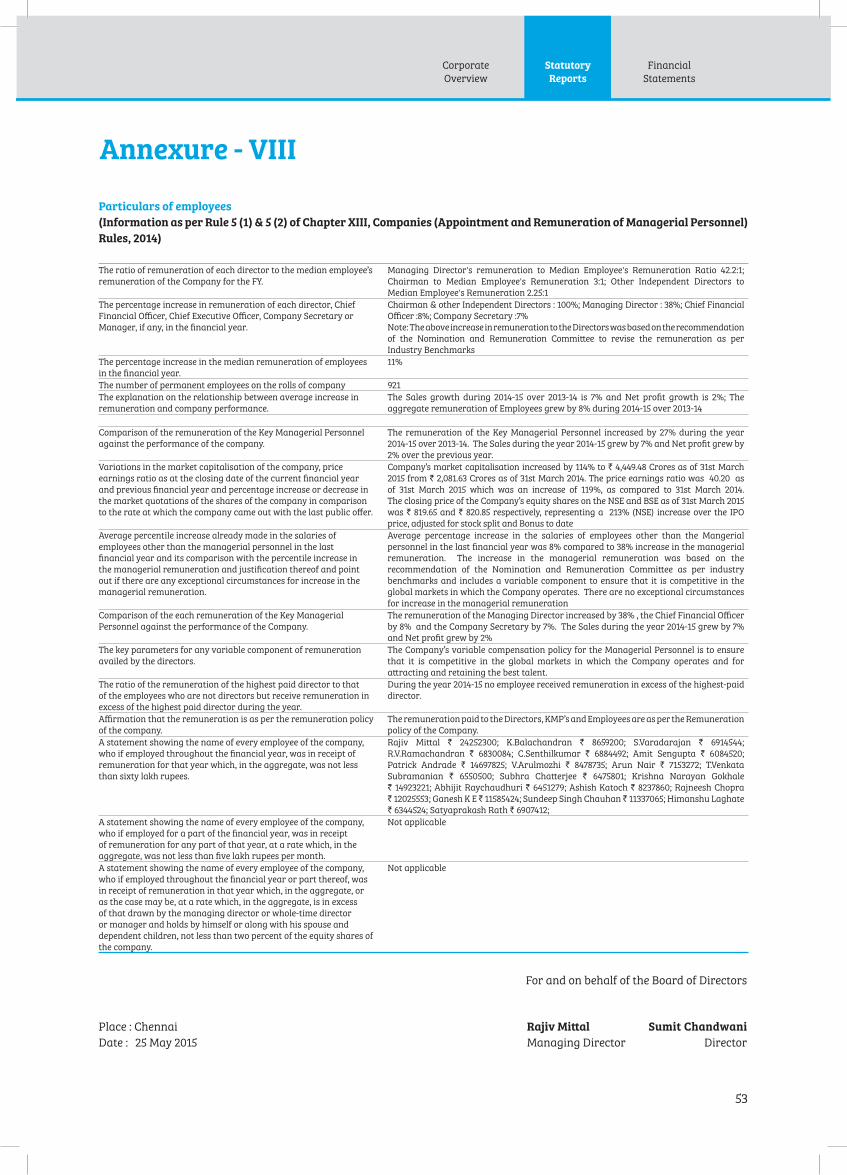
Corporate
Overview
Statutory
Reports
53
Financial
Statements
Particulars of employees
(Information as per Rule 5 (1) & 5 (2) of Chapter XIII, Companies (Appointment and Remuneration of Managerial Personnel)
Rules, 2014)
The ratio of remuneration of each director to the median employee’s
remuneration of the Company for the FY.
Managing Director's remuneration to Median Employee's Remuneration Ratio 42.2:1;
Chairman to Median Employee's Remuneration 3:1; Other Independent Directors to
Median Employee's Remuneration 2.25:1
The percentage increase in remuneration of each director, Chief
Financial Officer, Chief Executive Officer, Company Secretary or
Manager, if any, in the financial year.
Chairman & other Independent Directors : 100%; Managing Director : 38%; Chief Financial
Officer :8%; Company Secretary :7%
Note: The above increase in remuneration to the Directors was based on the recommendation
of the Nomination and Remuneration Committee to revise the remuneration as per
Industry Benchmarks
The percentage increase in the median remuneration of employees
in the financial year.
11%
The number of permanent employees on the rolls of company 921
The explanation on the relationship between average increase in
remuneration and company performance.
The Sales growth during 2014-15 over 2013-14 is 7% and Net profit growth is 2%; The
aggregate remuneration of Employees grew by 8% during 2014-15 over 2013-14
Comparison of the remuneration of the Key Managerial Personnel
against the performance of the company.
The remuneration of the Key Managerial Personnel increased by 27% during the year
2014-15 over 2013-14. The Sales during the year 2014-15 grew by 7% and Net profit grew by
2% over the previous year.
Variations in the market capitalisation of the company, price
earnings ratio as at the closing date of the current financial year
and previous financial year and percentage increase or decrease in
the market quotations of the shares of the company in comparison
to the rate at which the company came out with the last public offer.
Company’s market capitalisation increased by 114% to ` 4,449.48 Crores as of 31st March
2015 from ` 2,081.63 Crores as of 31st March 2014. The price earnings ratio was 40.20 as
of 31st March 2015 which was an increase of 119%, as compared to 31st March 2014.
The closing price of the Company’s equity shares on the NSE and BSE as of 31st March 2015
was ` 819.65 and ` 820.85 respectively, representing a 213% (NSE) increase over the IPO
price, adjusted for stock split and Bonus to date
Average percentile increase already made in the salaries of
employees other than the managerial personnel in the last
financial year and its comparison with the percentile increase in
the managerial remuneration and justification thereof and point
out if there are any exceptional circumstances for increase in the
managerial remuneration.
Average percentage increase in the salaries of employees other than the Mangerial
personnel in the last financial year was 8% compared to 38% increase in the managerial
remuneration. The increase in the managerial remuneration was based on the
recommendation of the Nomination and Remuneration Committee as per industry
benchmarks and includes a variable component to ensure that it is competitive in the
global markets in which the Company operates. There are no exceptional circumstances
for increase in the managerial remuneration
Comparison of the each remuneration of the Key Managerial
Personnel against the performance of the Company.
The remuneration of the Managing Director increased by 38% , the Chief Financial Officer
by 8% and the Company Secretary by 7%. The Sales during the year 2014-15 grew by 7%
and Net profit grew by 2%
The key parameters for any variable component of remuneration
availed by the directors.
The Company’s variable compensation policy for the Managerial Personnel is to ensure
that it is competitive in the global markets in which the Company operates and for
attracting and retaining the best talent.
The ratio of the remuneration of the highest paid director to that
of the employees who are not directors but receive remuneration in
excess of the highest paid director during the year.
During the year 2014-15 no employee received remuneration in excess of the highest-paid
director.
Affirmation that the remuneration is as per the remuneration policy
of the company.
The remuneration paid to the Directors, KMP’s and Employees are as per the Remuneration
policy of the Company.
A statement showing the name of every employee of the company,
who if employed throughout the financial year, was in receipt of
remuneration for that year which, in the aggregate, was not less
than sixty lakh rupees.
Rajiv Mittal ` 24252300; K.Balachandran ` 8659200; S.Varadarajan ` 6914544;
R.V.Ramachandran ` 6830084; C.Senthilkumar ` 6884492; Amit Sengupta ` 6084520;
Patrick Andrade ` 14697825; V.Arulmozhi ` 8478735; Arun Nair ` 7153272; T.Venkata
Subramanian ` 6550500; Subhra Chatterjee ` 6475801; Krishna Narayan Gokhale
` 14923221; Abhijit Raychaudhuri ` 6451279; Ashish Katoch ` 8237860; Rajneesh Chopra
` 12025553; Ganesh K E ̀ 11585424; Sundeep Singh Chauhan ̀ 11337065; Himanshu Laghate
` 6344524; Satyaprakash Rath ` 6907412;
A statement showing the name of every employee of the company,
who if employed for a part of the financial year, was in receipt
of remuneration for any part of that year, at a rate which, in the
aggregate, was not less than five lakh rupees per month.
Not applicable
A statement showing the name of every employee of the company,
who if employed throughout the financial year or part thereof, was
in receipt of remuneration in that year which, in the aggregate, or
as the case may be, at a rate which, in the aggregate, is in excess
of that drawn by the managing director or whole-time director
or manager and holds by himself or along with his spouse and
dependent children, not less than two percent of the equity shares of
the company.
Not applicable
Annexure - VIII
For and on behalf of the Board of Directors
Place : Chennai Rajiv Mittal Sumit Chandwani
Date : 25 May 2015 Managing Director Director
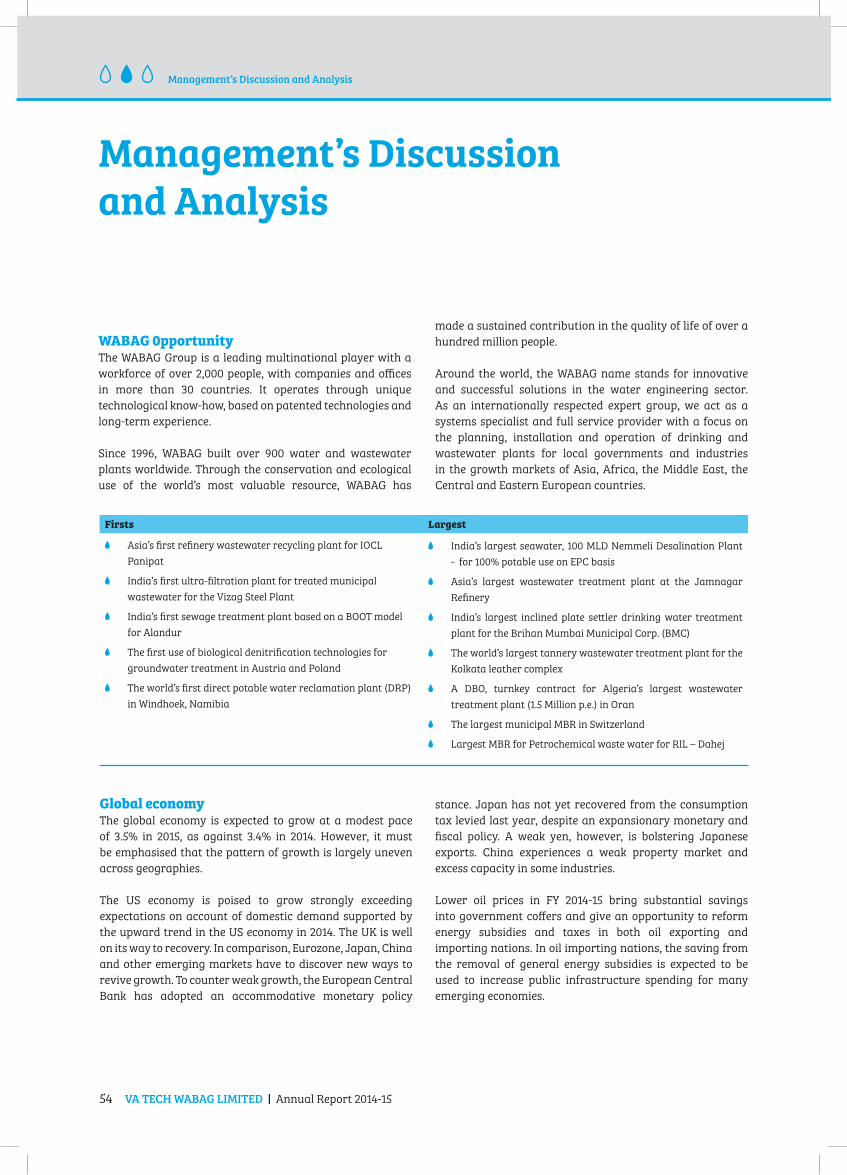
54 VA TECH WABAG LIMITED | Annual Report 2014-15
Management’s Discussion and Analysis
Management’s Discussion
and Analysis
WABAG 0pportunityThe WABAG Group is a leading multinational player with a
workforce of over 2,000 people, with companies and offices
in more than 30 countries. It operates through unique
technological know-how, based on patented technologies and
long-term experience.
Since 1996, WABAG built over 900 water and wastewater
plants worldwide. Through the conservation and ecological
use of the world’s most valuable resource, WABAG has
made a sustained contribution in the quality of life of over a
hundred million people.
Around the world, the WABAG name stands for innovative
and successful solutions in the water engineering sector.
As an internationally respected expert group, we act as a
systems specialist and full service provider with a focus on
the planning, installation and operation of drinking and
wastewater plants for local governments and industries
in the growth markets of Asia, Africa, the Middle East, the
Central and Eastern European countries.
Firsts Largest
Asia’s first refinery wastewater recycling plant for IOCL
Panipat
India’s first ultra-filtration plant for treated municipal
wastewater for the Vizag Steel Plant
India’s first sewage treatment plant based on a BOOT model
for Alandur
The first use of biological denitrification technologies for
groundwater treatment in Austria and Poland
The world’s first direct potable water reclamation plant (DRP)
in Windhoek, Namibia
India’s largest seawater, 100 MLD Nemmeli Desalination Plant
- for 100% potable use on EPC basis
Asia’s largest wastewater treatment plant at the Jamnagar
Refinery
India’s largest inclined plate settler drinking water treatment
plant for the Brihan Mumbai Municipal Corp. (BMC)
The world’s largest tannery wastewater treatment plant for the
Kolkata leather complex
A DBO, turnkey contract for Algeria’s largest wastewater
treatment plant (1.5 Million p.e.) in Oran
The largest municipal MBR in Switzerland
Largest MBR for Petrochemical waste water for RIL – Dahej
Global economyThe global economy is expected to grow at a modest pace
of 3.5% in 2015, as against 3.4% in 2014. However, it must
be emphasised that the pattern of growth is largely uneven
across geographies.
The US economy is poised to grow strongly exceeding
expectations on account of domestic demand supported by
the upward trend in the US economy in 2014. The UK is well
on its way to recovery. In comparison, Eurozone, Japan, China
and other emerging markets have to discover new ways to
revive growth. To counter weak growth, the European Central
Bank has adopted an accommodative monetary policy
stance. Japan has not yet recovered from the consumption
tax levied last year, despite an expansionary monetary and
fiscal policy. A weak yen, however, is bolstering Japanese
exports. China experiences a weak property market and
excess capacity in some industries.
Lower oil prices in FY 2014-15 bring substantial savings
into government coffers and give an opportunity to reform
energy subsidies and taxes in both oil exporting and
importing nations. In oil importing nations, the saving from
the removal of general energy subsidies is expected to be
used to increase public infrastructure spending for many
emerging economies.
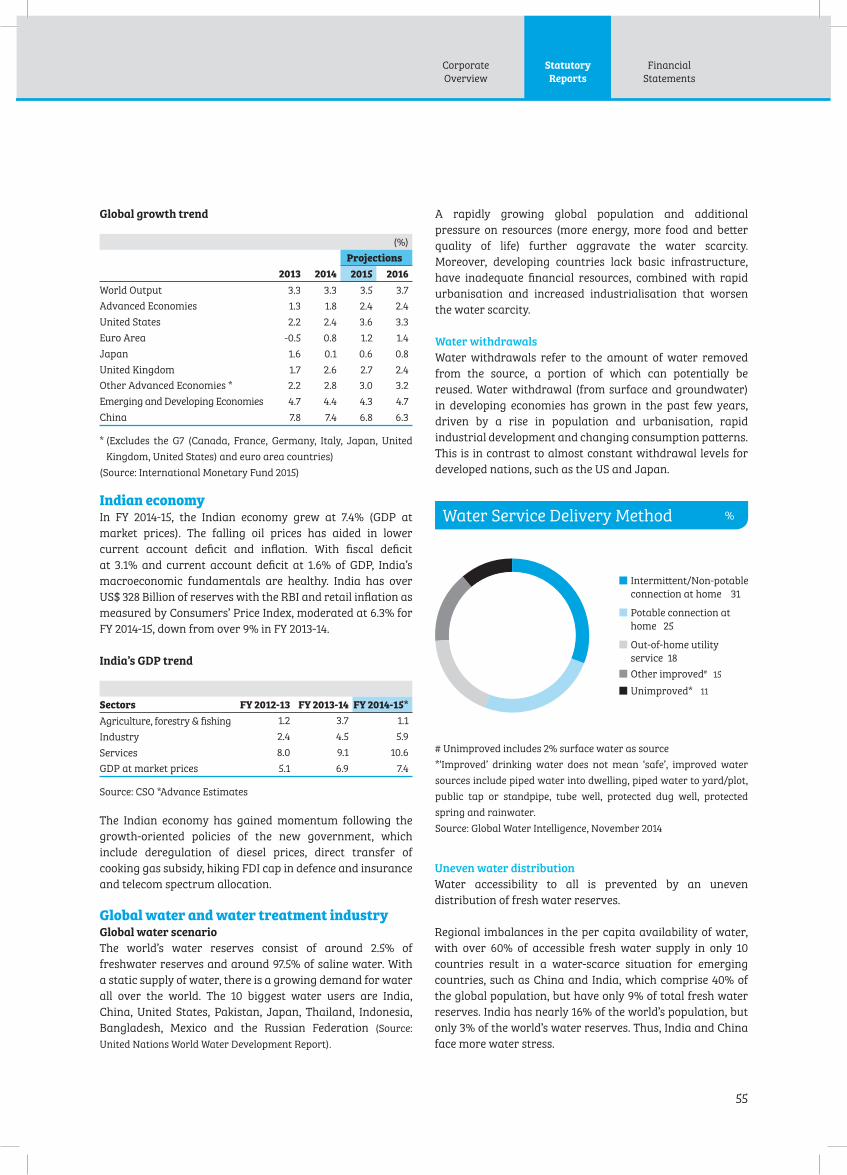
Corporate
Overview
Statutory
Reports
55
Financial
Statements
Global growth trend
(%)
Projections
2013 2014 2015 2016
World Output 3.3 3.3 3.5 3.7
Advanced Economies 1.3 1.8 2.4 2.4
United States 2.2 2.4 3.6 3.3
Euro Area -0.5 0.8 1.2 1.4
Japan 1.6 0.1 0.6 0.8
United Kingdom 1.7 2.6 2.7 2.4
Other Advanced Economies * 2.2 2.8 3.0 3.2
Emerging and Developing Economies 4.7 4.4 4.3 4.7
China 7.8 7.4 6.8 6.3
* (Excludes the G7 (Canada, France, Germany, Italy, Japan, United
Kingdom, United States) and euro area countries)
(Source: International Monetary Fund 2015)
Indian economyIn FY 2014-15, the Indian economy grew at 7.4% (GDP at
market prices). The falling oil prices has aided in lower
current account deficit and inflation. With fiscal deficit
at 3.1% and current account deficit at 1.6% of GDP, India’s
macroeconomic fundamentals are healthy. India has over
US$ 328 Billion of reserves with the RBI and retail inflation as
measured by Consumers’ Price Index, moderated at 6.3% for
FY 2014-15, down from over 9% in FY 2013-14.
India’s GDP trend
Sectors FY 2012-13 FY 2013-14 FY 2014-15*
Agriculture, forestry & fishing 1.2 3.7 1.1
Industry 2.4 4.5 5.9
Services 8.0 9.1 10.6
GDP at market prices 5.1 6.9 7.4
Source: CSO *Advance Estimates
The Indian economy has gained momentum following the
growth-oriented policies of the new government, which
include deregulation of diesel prices, direct transfer of
cooking gas subsidy, hiking FDI cap in defence and insurance
and telecom spectrum allocation.
Global water and water treatment industryGlobal water scenario
The world’s water reserves consist of around 2.5% of
freshwater reserves and around 97.5% of saline water. With
a static supply of water, there is a growing demand for water
all over the world. The 10 biggest water users are India,
China, United States, Pakistan, Japan, Thailand, Indonesia,
Bangladesh, Mexico and the Russian Federation (Source:
United Nations World Water Development Report).
A rapidly growing global population and additional
pressure on resources (more energy, more food and better
quality of life) further aggravate the water scarcity.
Moreover, developing countries lack basic infrastructure,
have inadequate financial resources, combined with rapid
urbanisation and increased industrialisation that worsen
the water scarcity.
Water withdrawals
Water withdrawals refer to the amount of water removed
from the source, a portion of which can potentially be
reused. Water withdrawal (from surface and groundwater)
in developing economies has grown in the past few years,
driven by a rise in population and urbanisation, rapid
industrial development and changing consumption patterns.
This is in contrast to almost constant withdrawal levels for
developed nations, such as the US and Japan.
Uneven water distribution
Water accessibility to all is prevented by an uneven
distribution of fresh water reserves.
Regional imbalances in the per capita availability of water,
with over 60% of accessible fresh water supply in only 10
countries result in a water-scarce situation for emerging
countries, such as China and India, which comprise 40% of
the global population, but have only 9% of total fresh water
reserves. India has nearly 16% of the world’s population, but
only 3% of the world’s water reserves. Thus, India and China
face more water stress.
# Unimproved includes 2% surface water as source
*‘Improved’ drinking water does not mean ‘safe’, improved water
sources include piped water into dwelling, piped water to yard/plot,
public tap or standpipe, tube well, protected dug well, protected
spring and rainwater.
Source: Global Water Intelligence, November 2014
Intermittent/Non-potable
connection at home 31
Potable connection at
home 25
Other improved# 15
Unimproved* 11
Out-of-home utility
service 18
Water Service Delivery Method %

56 VA TECH WABAG LIMITED | Annual Report 2014-15
Management’s Discussion and Analysis
Water and wastewater market
The global water industry including sectors like desalination,
wastewater treatment and water-efficiency technologies, is
expected to be worth over US$ 400 Billion (Source: UN Water
for Life).
Water usage – Profile
Agriculture sector consumes highest amount of water (70%)
followed by manufacturing. An expanding middle class
segment in developing nations wields pressure on more
water-intensive diary and meat rich dietary preference.
The oil and gas industry uses water extensively, where
extraction results in high volumes of ‘produced water’, which
comes out of the well, along with the oil and gas. Produced
water is difficult and costly to treat. Thermal power plants
yield 80% of global electricity production and are major
water users.
BRIICS: Brazil, Russia, India, Indonesia, China, South Africa; OECD: Organisation for Economic Co-operation and Development; ROW: Rest of
the world. This graph only measures ‘blue water’ demand and does not consider rainfed agriculture.
Source: OECD Environmental Outlook to 2050
Wastewater scenario
The wastewater treatment sector has been growing at 5.8%
CAGR. Within the wastewater sector, the fastest growing
areas are sludge management (26% CAGR) and water reuse
(21% CAGR) (Source: Global Water Intelligence Report, December
2014).
Wastewater is increasingly being used to generate biogas
or sludge and convert it to heat or electricity. Water reuse,
recycling or the use of reclaimed wastewater and zero
discharge technologies are being increasingly accepted by
industries worldwide.
Region-wise demand trend for water and wastewater
market
Latin America
Latin America as a region has adequate provisions for water
supply and sanitation services, 94% of its population has
access to improved water sources (Source: UN Water and
energy 2014). Latin America has several water and wastewater
investments targeted at increasing productivity. The region
as a whole now needs to build water (re)allocation systems
that integrate the development and conservation of water
resources and facilitate coordination and control.
The Middle East
Many countries in this region experience water vulnerability.
The Middle East tackles this problem through large-scale
desalination plants. Some countries have adopted water
efficient technologies like treatment and reuse of wastewater
for irrigation.
Water tariffs in the Middle East are among the least globally,
with most of the water utilities relying on government
subsidies to meet their operating costs, let alone the cost of
capital investment.
Many countries in the Middle East have now ushered in tariff
reform plans that raise the price of water for consumers. This
is partly due to bearish oil prices that forced governments to
km
3
Global water demand (freshwater withdrawals)
6,000
5,000
4,000
3,000
2,000
2000 2050
OECD
Irrigation Domestic Livestock Manufacturing Electricity
BRIICS ROW World
2000 2050 2000 2050 2000 2050
1,000
0

Corporate
Overview
Statutory
Reports
57
Financial
Statements
curb costs and decrease domestic fuel usage. Abu Dhabi is
charging higher rates and has reduced the subsidy in water
prices since January 2015.
North Africa and Sub-Saharan Africa
Africa is made up of Northern Africa and Sub-Saharan Africa.
Both these regions have made different levels of progress
in providing drinking water, with the Sub-Saharan region
having 40% of its 783 Million inhabitants without access to
improved sources of drinking water. Desalination plants are
increasingly being set up in Africa to solve the water crises
in its countries, notably in the Sub-Sahara region. High-
income countries in the North African region utilise treated
wastewater for agricultural and landscape irrigation (Source:
United Nations Department of Economic and Social Affairs).
Untreated wastewater is used to irrigate peri-urban zones
around Kumasi in Ghana, Dakar in Senegal, Nairobi in Kenya
and Bulawayo in Zimbabwe.
South East Asia
South East Asia has many emerging countries experiencing
mid to extreme water stress. Indonesia, Vietnam and the
Philippines offer huge opportunities for water players
because of the efforts of their governments to improve the
water supply infrastructure.
Indonesia
Indonesia still has 76% of its population without access to
improved drinking water. Only 24% are connected to local
water utility companies. The government is funding drinking
water and wastewater treatment projects with international
assistance.
Vietnam
Vietnam is the one of the world’s most populous countries
with a population of over 90 Million. Rapid urbanisation is
expected to bring 48% of its population to urban cities. This
opens large scale opportunities for wastewater treatment,
because currently, only 10% of the urban wastewater is
treated.
The Philippines
The water market in the Philippines has become both
substantially larger and more attractive. Capital expenditure
on water and wastewater infrastructure is expected to see
healthy CAGR of 7.7% until 2018 – reaching US$ 690 Million
compared with US$ 140 Million in 2011. Not only is the
government very committed to improving the water system
in the Philippines, but they are also very open to private
sector participation to meet these objectives – making this
a very attractive market for international and local water
companies. (Source: Global Water Intelligence)
Sri Lanka
In Sri Lanka, there is an imbalance between the wet zone and
the dry zone. In the latter segment river flows impounded
in tanks change the availability structure thus abating
water stress. It is the coastal stretch from the North to East
and South that remains impoverished. In the eastern and
southern coasts, most districts would require salt water
desalination plants.
Global water outlook
The global water industry is poised to touch US$ 529 Billion
in 2016 (Source: Nomura Research Institute, January 2015). Water
usage opportunities are expected to increase with the
maximum growth occurring in emerging economies. Water
demand from various industries is expected to record a
higher pace of 3% CAGR, while agriculture and municipal
demand is expected to grow at 2% CAGR. Growing demand
is likely to emanate from manufacturing, thermal electricity
generation and domestic usage. Egypt, Vietnam, India,
Canada and Saudi Arabia top the list of promising markets.
Source: GWI, December 2014
Top 10 water markets by CAGR 2014-2020 (%)
Wabag present Wabag not present
Vietnam
India
Canada
Saudi Arabia
Spain
Australia
Indonesia
Peru
Oman
Egypt 56
30
21
19
16
10
9
9
9
9
Indian water and wastewater treatment industryIndia faces acute water crisis and has sub-optimal water
infrastructure in place. This presents a strong growth
opportunity for the country’s water treatment players. This has
brought both large international groups and niche players with
successful applications serving particular market segments in
the Indian water market.
Most of the wastewater (sewage) is never treated before being
discharged into the water bodies. This pollutes the water at the
source making it unsafe for consumption. Besides, drinking
water from this very water body is supplied without adequate
treatment, thereby resulting in water stress for a rapidly
growing population demanding more water per capita.

58 VA TECH WABAG LIMITED | Annual Report 2014-15
Management’s Discussion and Analysis
Safe water demand-supply gap necessitates investments
in building water infrastructure
It is estimated that the water growth rate contributed by
residential, industrial, agricultural and commercial use
will be growing substantially with increasing demand from
India’s population, coupled with a steady industrial growth.
For India, there are different water demand estimates
available; the Ministry of Water Resources (MoWR) and
the National Commission on Integrated Water Resources
Development (NCIWRD), which put current water demand
at 813 billion cubic metres and 710 billion cubic metres per
annum respectively. Current water reserves are higher
at 1,123 billion cubic metres (BCM) per annum as per the
Ministry of Water Resources (MoWR). However, based on
the demand projections of MoWR, the situation could turn
around in the next 10 years, when supply would just be
matching the demand.
Indian water treatment infrastructure scenario
Despite ample water reserves, the water distribution remains
unequal. As against the requirement of 140 litres per capita
per day, urban India receives only 105 litres of water. Rural
India fares even worse. One in four rural families across India
draws water from untreated taps and uncovered wells. Poor
access to clean drinking water and sanitation contribute to
major health concerns, particularly in rural India.
Increasing urbanisation is aggravating India’s difficulties.
India’s urban population is expected to reach close to 600
Million by 2031, twice as much as in 2011. The number of
metropolitan cities with a population of 1 Million and above
has increased from 35 in 2001 to 50 in 2011 and is likely to
increase further to 87 by 2031. Clearly, this requires higher
capacity of water treatment plants.
The Government of India aims to set up 100 smart cities in
the near future. This will require smart water metering and
other efficient water management and a holistic approach
would be the need of the hour.
Water quality in Indian states
Chemical contamination Number of states affected
Arsenic 8
Fluoride 19
Salinity-inland and coastal 15
Iron 21
Nitrate 12
Source: Ministry of Drinking water and sanitation From Credit
Suisse Report 2014
Indian wastewater scenario
India’s total water and wastewater treatment market is
growing annually by about 18% (Source: The Guardian, Article:
Treating India’s wastewater: why inaction is no longer an option,
dated March 2014). Economic growth requires water especially
when India is one of the largest consumers of water in the
world. Such is the importance of the wastewater and water
treatment industry in India.
Today, our growing cities require approximately 740 billion
cubic meters of water annually. This is likely to go up to
1,500 billion cubic meters in 2030. Present wastewater
infrastructure can treat only 30% of the household wastes.
The rest is released into the ground or into open drains.
Delhi is one example, which releases 90% of all its untreated
wastewater into the Yamuna River, the source for the
city’s drinking water. The Delhi government has drafted a
` 19,500 Crore master plan that aims to fix the capital’s failing
wastewater management system and reduce pollution in
Yamuna. The blueprint proposes a 10,000-km pipe network,
75 WWTPs and integration of various ongoing sewerage
projects.
Municipal wastewater
India is witnessing an increasing number of cities that
generate huge amounts of wastewater. As per Central
Public Health and Environmental Engineering Organisation
(CPHEEO) estimates, 70-80% of total water supplied for
domestic use end up generating wastewater. Maharashtra,
Delhi, Uttar Pradesh, West Bengal and Gujarat are the major
contributors of wastewater. Overall in Class I cities, nearly
68% of sewage goes untreated, which is even worse in Class
II cities where nearly 90% of sewage discharged is left
untreated.
Significant shortfall in STP capacity
CitiesSewage
Generated
Present Sewage
Treatment Capacity/
Capacity
Shortfall
35 Metropolitan
Cities (>1 mn
population)
15,644 MLD 8,040 MLD (51%) 7,604 MLD
Class I cities 35,558 MLD 11,553 MLD (32%) 24,005 MLD
Class II cities 2,696 MLD 233 MLD (9%) 2,463 MLD
Source: Central Pollution Control Board
Among metropolitan cities, Delhi has the highest capacity of
STP at 2,330 MLD but still has a shortfall of 40%. Treatment
capacity in metro cities is at 2,130 MLD but still there is a 20%
shortfall as against the requirement. Treatment capacity
meets the volume of sewage generation in some cities, such as
Hyderabad, Vadodara, Chennai, Ludhiana and Ahmedabad.
Most other metropolitan cities have STP capacities to cater
to <50% of sewage generation. (Source: Central Pollution Control
Board)
Inadequate performance of installed Sewage Treatment
Plants
Central Pollution Control Board (CPCB) evaluated the
performance of 152 STPs (funded under National River
Conservation Plan) spread over 15 states in the country with
a total treatment capacity of 4,716 MLD. Actual treatment
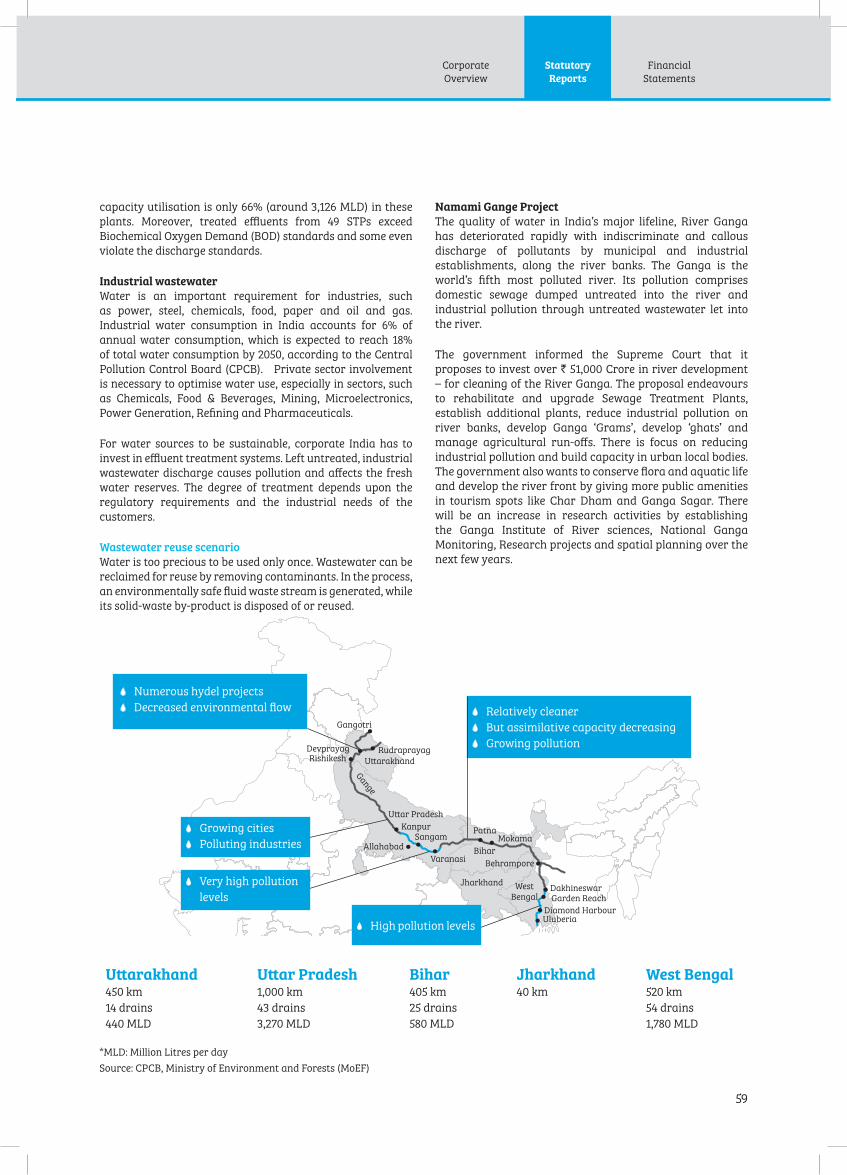
Corporate
Overview
Statutory
Reports
59
Financial
Statements
capacity utilisation is only 66% (around 3,126 MLD) in these
plants. Moreover, treated effluents from 49 STPs exceed
Biochemical Oxygen Demand (BOD) standards and some even
violate the discharge standards.
Industrial wastewater
Water is an important requirement for industries, such
as power, steel, chemicals, food, paper and oil and gas.
Industrial water consumption in India accounts for 6% of
annual water consumption, which is expected to reach 18%
of total water consumption by 2050, according to the Central
Pollution Control Board (CPCB). Private sector involvement
is necessary to optimise water use, especially in sectors, such
as Chemicals, Food & Beverages, Mining, Microelectronics,
Power Generation, Refining and Pharmaceuticals.
For water sources to be sustainable, corporate India has to
invest in effluent treatment systems. Left untreated, industrial
wastewater discharge causes pollution and affects the fresh
water reserves. The degree of treatment depends upon the
regulatory requirements and the industrial needs of the
customers.
Wastewater reuse scenario
Water is too precious to be used only once. Wastewater can be
reclaimed for reuse by removing contaminants. In the process,
an environmentally safe fluid waste stream is generated, while
its solid-waste by-product is disposed of or reused.
Namami Gange Project
The quality of water in India’s major lifeline, River Ganga
has deteriorated rapidly with indiscriminate and callous
discharge of pollutants by municipal and industrial
establishments, along the river banks. The Ganga is the
world’s fifth most polluted river. Its pollution comprises
domestic sewage dumped untreated into the river and
industrial pollution through untreated wastewater let into
the river.
The government informed the Supreme Court that it
proposes to invest over ` 51,000 Crore in river development
– for cleaning of the River Ganga. The proposal endeavours
to rehabilitate and upgrade Sewage Treatment Plants,
establish additional plants, reduce industrial pollution on
river banks, develop Ganga ‘Grams’, develop ‘ghats’ and
manage agricultural run-offs. There is focus on reducing
industrial pollution and build capacity in urban local bodies.
The government also wants to conserve flora and aquatic life
and develop the river front by giving more public amenities
in tourism spots like Char Dham and Ganga Sagar. There
will be an increase in research activities by establishing
the Ganga Institute of River sciences, National Ganga
Monitoring, Research projects and spatial planning over the
next few years.
Gangotri
Rudraprayag
Uttarakhand
Uttar Pradesh
KanpurSangam
Allahabad
PatnaMokama
Varanasi
Jharkhand
Behrampore
West Bengal
DakhineswarGarden Reach
Diamond HarbourUluberia
Bihar
Gange
DevprayagRishikesh
*MLD: Million Litres per day
Source: CPCB, Ministry of Environment and Forests (MoEF)
Uttarakhand450 km
14 drains
440 MLD
Uttar Pradesh1,000 km
43 drains
3,270 MLD
Bihar405 km
25 drains
580 MLD
Jharkhand40 km
West Bengal520 km
54 drains
1,780 MLD
Relatively cleaner
But assimilative capacity decreasing
Growing pollution
Growing cities
Polluting industries
Numerous hydel projects
Decreased environmental flow
Very high pollution
levels
High pollution levels

60 VA TECH WABAG LIMITED | Annual Report 2014-15
Management’s Discussion and Analysis
Domestic sewage treatment opportunity
Domestic sewage generates approximately, 2,723 MLD of
sewage in 50 cities located along the Ganga, which adds up to
around 85% of the river’s pollution load. The Project proposes
setting up of 70 STPs in the five Ganga basin states by 2018.
(Source: Central Pollution Control Board estimates)
Growing gap between STP capacity
The 36 Class 1 cities contribute 96% of the waste water that is
generated in the country. In India, 99% of the water treatment
capacity is also installed in these same cities. However,
there is an increasing gap between installed capacity and
treatment. Treatment capacity lags at 1,209 MLD as against
sewage generation of 2,723 MLD.
Industrial pollution treatment
There are 764 small-scale industries around the banks of
the Ganga (and its two tributaries, Kali and Ramganga),
which consume 1,123 MLD of water and discharge 500 MLD
of effluent. Almost 90% of these industries operate in Uttar
Pradesh. These include tanneries, pulp and paper industries,
distilleries, and textile and dyeing units (Source: National
Mission for Clean Ganga).
Growth drivers in India
India with its huge population and depleting water
resources is one of the largest markets for water treatment.
Opportunities arise from municipal segment, through more
stringent norms by the government:
Under penetration of water treatment in India
Multilateral agencies (World Bank, JICA and ADB) give
funding support, stressing on private participation
Stricter disposal rules for industrial waste water
Recycle treated waste water to tackle disposal and fresh
water availability issues
Increased O&M outsourcing by authorities for new/
existing municipal plants
Power sector, a key user of water/waste water treatment
is witnessing new projects being set up – this shall drive
demand for water treatment/reuse
Desalination opportunities in Tamil Nadu
Integrated Ganges Development Project to clean up
the Ganga river by 2017 is a multi-year waste water
treatment opportunity – aims to set up STPs along
Ganga, Yamuna and Ramganga, and rehabilitate old
and non-functional plants
Fast tracking initiatives
The Supreme Court has directed the GOI to present a stage-
wise plan to clean up the River Ganga and take concrete
steps in the Namami Ganga project. The Centre was told to
have clear objectives for the project and set clear milestones
so that an appraisal can be done and the progress assessed.
Desalination
The current size of India’s desalination market is US$ 660
Million. The desalination business in India is poised to reach
US$ 1.9 Billion within five years, driven by industrial demand,
urban growth and freshwater scarcity issues (Source:
Bloomberg).
India has a coastline of 7,517 km (4,672 miles). Coastal states
of Tamil Nadu (Chennai) and Andhra Pradesh plan to set up
desalination plants. Apart from city governments, power
generators also account for 18% of the desalination capacity
in India. There are upcoming opportunities for desalination
plants in the coastal states.
India water outlook
The projected water demand from India is expected to increase
to 1,500 Billion cubic metres in 2030, while the current supply
of water is 740 Billion cubic metres, which would result in a
large gap between current supply and projected demand —
amounting to 50% of demand shortfall (Source: The Guardian).
This may lead to exploitation of alternate sources of water
and result in opportunities for setting up of desalination and
water reuse plants.
Moreover, according to GWI report, India is likely to continue
spending large sums on sewage treatment, irrigation and
water recycling in the forthcoming years. Although less
than 10% of available water in India is currently used by
industries, industrial water demand is likely to rise by 57% in
10 years (Source: Global Water Intelligence Report). This augurs
well for the water treatment business in India.
Strategic Business Unit (SBU) reviewMunicipal Business Group (MBG)
The Municipal Business Group (MBG) continues to be at the
forefront, both in terms of order book and sales turnover.
Although the order intake was not on expected lines, this
business unit bagged key orders from India and abroad
during the year.
In keeping with the Company’s strategy to be the technology
leader in the industry, WABAG entered into a technology tie
up with Royal Haskoning DHV for the introduction of state-of-
the-art Nereda Technology in India, apart from Switzerland
to meet the growing market expectations in terms of less
power consumption, reduced footprint and more cost-
effective solutions for waste water management. The market
is very receptive to this new innovative technology.
Highlights, FY 2014-15
Secured the first 140 MLD Sewage Treatment Plant order
under the Ganga Action Plan in Varanasi
Bagged two World Bank funded waste water treatment
Corporate
Overview
Statutory
Reports
61
Financial
Statements
plant projects at Tunasan and Valenzuela in the
Philippines
Completed Reliance Dahej PTA Waste water Plant;
Pappankalan STP for Delhi Jal Board, Bangalore Water
Supply and Sewerage Board, Melamchi Water Supply
Development Board, Nepal, Odisha Water Supply and
Sewerage Board and Plant Water System for Durgapur
Projects Limited
Operations started at Dwaraka Drinking Water
Treatment Plant
MBG continues to focus on margin expansion and
understands that growing profitably is more important
than growing fast. The business outlook is very promising
nationally and internationally.
As for the Indian municipal market, MBG is well poised to
clinch business deals from three major schemes – (i) Ganga
Rejuvenation Plan; (ii) Swachh Bharat Mission and (iii) 100
Smart Cities in the coming years. MBG also envisages good
business opportunities for sewage treatment plants and
water treatment plants in the form of funded jobs overseas.
Industrial Water Group (IWG)
Industrial Water Group (IWG) offers water management
solutions for steel, petrochemicals, fertilisers, oil and gas,
and power industry, among others. IWG consistently delivers
projects on time, which has enabled the unit to deepen
relationships and generate repeat orders from customers.
National regulations and WABAG’s innovation-driven efforts
have led to the unit achieving technological proficiency.
Highlights FY 2014-15
Forayed and bagged a project in Malaysia for the first
time from BASF Petronas Chemicals.
Bagged orders from BHEL at Suratgarh, Rajasthan
Successfully executed OMPL DM Plant & CPU, RIL
Effluent Recycle Plant, RIL PTA Waste water Plant and
High Rate Mill Scale Filtration System at Rourkela Steel
Plant during the year
Successfully commissioned SWRO Plant along with DM
Plant (total water management) and High Pressure CPU
at 34 bar pressure (650m3/hr of 6 units) for 2x800 MW
supercritical power plant at Krishnapatnam.
Commissioned and handed over total Demin plant
and High Pressure CPU for 500 MW( 600m3X3) Korba
power plant.
In continuation with the Unit’s venture into overseas market last
year in Nigeria, IWG bagged its first project in Malaysia during
the year and continues to explore further opportunities in the
overseas market.
Operations Business Group (OBG)
The Operations Business Group (OBG) operates and maintains
more than 70 water and waste water treatment plants for
the Company in India and has now ventured overseas for
tapping more business opportunities in this segment. It
provides complete O&M services including organisation,
staffing, supply of chemicals and consumables, supply of
spares, major and minor repairs, equipment replacement
and plant refurbishment. Apart from clocking high margins,
these contracts also provide consistent cash flow.
Highlights, FY 2014-15
Secured new orders in Oman, Qatar, Bahrain and
Singapore
Added new clients from the industrial segment
Remote Monitoring - An innovative step in the plant
operation monitoring
The different O&M sites spread across the country are
connected and monitored at HO in a control room called
Network operating centre (NOC). From a single place, remote
monitoring enables us to monitor the plant performance
and process changes of plants located at various places,
thousands of kilometres away. Remote monitoring increases
overall efficiency by enhancing troubleshooting, analysing
and improving plant performance. It also increases plant
efficiency by continuous monitoring in addition to saving
time as well as cost.
Desalination Business Group (DBG)
WABAG is one of the top 10 desalination companies globally
according to Global Water Intelligence. WABAG has executed
desalination projects in various countries worldwide and the
successful execution of the 100 MLD desalination plant in
Chennai carries a strong reference. The 191 MLD desalination
plant under execution at Oman will further increase the
desalination business opportunities.
Highlights, FY 2014-15
Remained cash positive with low debt and interest costs
Executing 191 MLD desalination plant project at Al
Ghubra, Oman
The demand for water desalination in India is slated to grow
steadily. There is opportunity for membrane-based solutions
in inland regions because of high levels of salt, fluoride,
arsenic, nitrates and iron in the groundwater. The Company
is constantly exploring global business prospects in India, the
Middle East and Latam regions.

62 VA TECH WABAG LIMITED | Annual Report 2014-15
Management’s Discussion and Analysis
Operation & Maintenance is a critical
function in the treatment plants. We have time
and again proved the benefits that can be ushered
in by engaging the services of WABAG in running
the plants and this is evident in the repeat orders
we have bagged continuously over the years.
This proven advantage provides us attractive
opportunities in tapping the huge market in India
and overseas.
Rajneesh Chopra
Head - Operations Business Group
Multi-Domestic Unit (MDU) reviewWABAG Austria
WABAG Austria provides end-to-end solution for water
treatment and waste water treatment, water reclamation
and sludge treatment for municipalities and industries.
It is executing several projects under DBO (Design Build
Operate) framework, creating both new capacity, along with
modernisation and expansion of existing plants.
WABAG Austria possesses strong competencies in advanced
water treatment technologies built over the years.
Core strengths
Strong technological capabilities with a history of
creating high quality plants
Deep knowledge in specific technologies like nitrate
removal from ground water (BIODEN®), innovative pre-
treatment technologies (MICROPUR®), advanced waste
water treatment by MBR - Technology (MARAPUR®) or
sludge disintegration (BIOZONE-AD®)
Executed projects in diverse and challenging terrains
- RO-plants in deserts in Saudi Arabia, comprehensive
refurbishment of drinking water and waste water
treatment plants (in Romania, Poland and Algeria), the
first industrial water reclamation plant in Windhoek,
Namibia.
Adept in handling large ticket size plants
Certified for EN ISO 9001:2008, ISO 14001:2004
and OHSAS 18001: 2007 standards
Highlights, FY 2014-15
Commissioned Industrial Water Reclamation Plant in
Ujams, Namibia using new best-in-class technologies,
which recently won global recognition at the Global
Water Summit held in Athens, Greece
Demineralisation and electro chlorination projects for
four power plants in Libya is under execution and in
good progress
Several repeat orders from the Middle East, reflects
WABAG’s proven performance
WABAG Austria aims to bag newer orders; consistently
generate repeat business; continue to explore potential
markets and consolidate its presence in the MENA region.
WABAG Czech Republic
WABAG Czech Republic is headquartered in Brno and during
the year, the MDU celebrated its 20 years of success in this
geography. The Unit addresses the industrial and municipal
water market of the Czech Republic. Besides addressing the
country’s water requirements, the unit also holds strategic
importance for gaining business in Eastern Europe. Its
activities include drinking water, waste water and sludge
treatment in the municipal, industrial and energy sector.
Services include pre-treatment systems, demineralisation,
condensate polishing, ion exchange technology, cooling water
treatment, filtration and neutralisation. WABAG Brno is also
the Group’s competence centre in the industrial process and
service water sector for the European region.
Core strengths
One of the oldest WABAG subsidiaries with excellent
project references
Built the first steam waste water treatment plant of the
Czech capital
Accredited with EN ISO 9001:2008, ISO 14001:2004 and
OHSAS 18001:2008 certification
Highlights, FY 2014-15
Bagged the oiled water treatment order for Ferganska
Refinery in Uzbekistan
Also bagged project in Turkmenistan
The subsidiary is going to focus on industries like
petrochemicals, tanneries and energy in Uzbekistan and
rehabilitation of existing plants in Turkmenistan. Besides,
WABAG Czech Republic plans to explore other nearby
markets for big-ticket projects.
WABAG Philippines
WABAG Philippines is a wholly-owned subsidiary of WABAG
India. It caters to EPC requirements in municipal water
and waste water treatment in the growing markets of the
Philippines and neighbouring countries. Being an island
nation, the availability of fresh water remains scarce in
the Philippines and desalination is difficult due to high
power costs. WABAG Philippines has pioneered industry-
best innovations to resolve this problem. It concentrates on
project management through effective execution, material
procurement and price-value management.

Corporate
Overview
Statutory
Reports
63
Financial
Statements
Worldwide, there is a real scarcity of clean
drinking water. With the technological development
significantly reducing the cost for setting up
desalination plants, desalination has become a
viable option to create drinking water for the
masses. We see a big opportunity in this segment to
provide reliable potable water.
Fernando Portillo Valles
Desalination Business Group
The subsidiary has adopted effective cross-unit collaboration
and delivered various projects successfully.
Core strengths
Expertise and local insights help it obtain repeat orders
and prove that WABAG Philippines has become a trusted
partner in water treatment space in the Philippines
Established over 50% market share in three years
Creating differentiation with technology and quality
excellence
Execution excellence by completing projects ahead of time
Highlights, FY 2014-15
Leader in the sewage treatment market in the Philippines
Secured two key orders funded by World Bank
Leveraging the best-in-class European technology,
Indian engineering and local execution expertise to win
new projects and execute existing ones
WABAG Philippines aims to sustain its market leadership and
expand its presence to other neighbouring countries, such as
Vietnam, Cambodia and Indonesia.
WABAG Romania
WABAG Romania provides EPC and O&M solutions in the
water and waste water treatment space to industrial and
municipal customers.
Core strengths
Specialist for complex water technology solutions for the
oil and gas industry
Rich experience of operating refinery ETPs
Quality management system accredited by EN ISO
9001:2008, ISO14001:2004 and OHSAS 18001:2008
Highlights, FY 2014-15
Bagged an order for Produced Water Treatment Plant
(PWTP) in Suplacu de Barcau, Romania’s largest oilfield
Completed execution of its two municipal orders for
Aiud, Ocna Mures and Cugir WWTPs and its first small
export business for ERBIL, Iraq (Containerised WWTP for
the KAR Refinery)
New filtration system for water reuse was installed at
the Petrobrazi Refinery ETP, comprising self-washing
filter units
Completion of investment programme - improvement of
Petrobrazi WTP, second stage.
Being part of the European Union is a definite advantage for
WABAG Romania. It will lead to higher effluent treatment
activity as per EU standards, which augurs well for the MDU.
It aims at delivering projects with quality and efficiency and
within timelines, and continues building its market presence
in Romania and its surrounding countries, such as Moldova,
Bulgaria and Serbia.
WABAG Switzerland
WABAG Switzerland holds 70% municipal market share of
the advanced technology segment of the Switzerland market.
It is the biggest supplier of drinking water and waste water
treatment plants in Switzerland. It has executed over 50
municipal and industrial projects, which comprise virtually
all large lake water treatment plants in Switzerland and
other modern facilities.
In addition, the subsidiary supplies to markets in western and
southern Europe. This MDU also provides planning, design,
commissioning, start-up and by providing services for all
type of projects from system components to turnkey plants.
Core strengths
Over 70% of the market share is in the technology savvy
market of Switzerland
Has deep knowledge in specific technologies like biological
waste water treatment (BIOPUR®, FLUOPUR®), innovative
filtration systems and the treatment of specific impurities
(micro-pollutants) in water or waste water.
Expert in advanced water solutions
Cost-effective solutions through constant innovation
In-house R&D Centre and technology powerhouse for the
Group
Highlights, FY 2014-15
Received Ultra filtration drinking water treatment order
in Germany
Successfully executed the large-scale tertiary filtration
plant for the Zurich Werdhölzli WWTP of 561,600 m3/d
The subsidiary aims to expand its presence in Western
Europe, particularly France, Italy and Germany.
64 VA TECH WABAG LIMITED | Annual Report 2014-15
Management’s Discussion and Analysis
WABAG TurkeyWABAG Turkey caters to the municipal water and waste water treatment (EPC and O&M) needs in Turkey, working closely with municipalities.
Aspirations for a better lifestyle have led to increased demand for clean drinking water too in Turkey. WABAG Turkey has completed major projects like the large-scale Kayseri and Adana West and East plants. The Unit is currently building a large-scale drinking water treatment plant in Izmir (360,000 m3/d) and is operating all the waste water treatment plants and pumping stations in Istanbul, water treatment plants in Adana (500,000 m3/d) and in Mersin (390,000 m3/d).
The subsidiary offers services like planning, design, engineering, construction and operational management of municipal water and waste water treatment plants, anaerobic sludge treatment plants with optimised energy recovery and tailor-made solutions for industrial plants. At present, WABAG Turkey holds the key for waste water management for the entire city of Istanbul.
Core strengths Market leaders with strong brand positioning Scale to manage large and diverse range of projects in a
short time span Localised operations and leveraging proprietary
technological expertise at competitive costs
Highlights, FY 2014-15 Bagged over 80% of O&M business in Turkey All O&M contracts, initially won, have been renewed Key projects bagged comprise operations and
maintenance of Istanbul’s waste water treatment plants and pumping stations, LuIeburgaz O&M which is the first long term O&M contract for a period of five years (waste water treatment plant) and Mersin O&M (waste water treatment plants and water treatment plants) and the EPC for Polatli Waste water treatment plant
The Turkish market promises huge potential in both EPC and O&M business. The MDU also intends to bid for international projects in nearby Commonwealth of Independent States (CIS), such as Azerbaijan and Turkmenistan, among others. The unit focuses on big EPC projects ensuring revenue and high margins.
Human CapitalWABAG considers its employees as its greatest asset and has created a work environment that ensures their continued well-being. The Company’s talent pool is a combination of varied qualifications and experiences in the domains of engineering, management and finance.
The Company employs more than 2,000 employees globally. At WABAG, human resources (HR) function is divided into three divisions - Corporate HR (for Training and Development
purpose), Business HR (for Strategic Business Unit (SBU) and Multi Domestic Unit (MDU) HR functions) and Group HR (for Senior Management recruitment).
The Company’s HR policy focuses on developing local managerial talent in every operating country and units. Local HR team at every SBU and MDU works together with corporate HR in training and development of its employees.
RecruitmentThe Company completes manpower planning at the beginning of the year, based on targeted growth and business requirements. The Human Resource department in every business unit recruits junior and middle management locally. The Company recruits 40-50 Graduate Engineer Trainees (GETs) through campus recruitment from premier Engineering and Management institutions annually. Senior management personnel are recruited by the Group HR. Key Managerial Personnel are recruited by the Board, based on the recommendation of the Nomination and Remuneration Committee.
Training and developmentDeveloping employee skills is a top priority at WABAG so that employees become agents of transformation and help deliver world-class services.
Training and development requirements originate from the annual performance appraisal process. The consolidated training needs thus identified, become the training calendar.
In FY 2014-15, the Company undertook the competency mapping exercise through which competencies required for the various positions were identified and defined. Moreover, the requisite skills and competencies were defined under two broad categories – technical and managerial. This exercise helped in identifying gaps in performance and accordingly aligning training programmes to enhance employee productivity.
The Company continues to invest in its flagship Graduate Engineer Training (GET) programme – where graduate engineers are trained across different business functions for two years and are placed on assignments both in India and overseas.
The Company runs two leadership programmes: (1) Leadership Excellence Programme (LEX) to develop leaders from middle level managers; (2) Young Entrepreneurship Programme (YEP) for bright GETs, providing opportunities like access to a part time management education programme and participation in seminars to emerge as future business leaders. The Company imparted 2,733 person days of training through over 123 training programmes across locations.
Rewards and Recognition ProgrammeAs part of Reward and Recognition Programme, the Company bestows ‘Star Performer’ awards to recognise
Corporate
Overview
Statutory
Reports
65
Financial
Statements
efforts of employees and ‘Best Employee of the Month Award’ in Business Units. The HR department engages employees by promoting global integration and cross-functionality. To facilitate this, WABAG set up a Group Executive Council (GEC). The GEC will integrate people initiatives across WABAG to forge one WABAG identity and capture the synergies across business units and group companies. Another significant step forward is the Collective Leadership Proposition (CLP), which is being formed to focus on technology, engineering and procurement.
Health, Safety and Environment (HSE)Sustainable development is an integral part of WABAG’s management credo. The Company continues to take significant initiatives towards enhancing safety of the employees and improving health and environment.
WABAG formulated its Occupational Health, Safety and Environment (OHSE) Policy in August 2010 requiring its managers and employees to manage HSE issues. It has set targets for improvements, which is first measured appraised and corrective / preventive measures are recommended, if required.
HealthDuring the year, WABAG conducted various free vaccination camps at plant locations against. Several employees including contractual workers were vaccinated and benefitted out of this drive. Besides the Company organised blood donation camps at various project locations.
SafetyIn May 2014, WABAG launched the QHSE Passports, which facilitated employee identification at all its EPC and O&M sites. It certifies the holder’s status with respect to personal details including blood group, HSE training, communicating the Vision, Mission, Values and QHSE and IT policies. It also serves as an evidence to legal authorities and reckoner during emergency. Such a strategy promotes good in-house HSE practices and helps to reduce accidents. Besides, the Company during the year received appreciation from various customers viz., RIL, IOCL and BWSSB for achieving more than a million safe man-hours.
The Company launched the excavation and personal protective equipment training manual, which aims to strengthen the HSE awareness during excavation with respect to identification of major hazards risk assessment and control measures.
WABAG regularly conducts first aid training programmes for its own staff and for various other associated stakeholders. During the year, WABAG also conducted training on basic life support and standard first aid at all its EPC and O&M sites. The Company conducted fire fighting training at its head office, EPC and O&M sites. These sessions were conducted in partnership with local authority’s fire fighting team and fire brigade volunteers.
EnvironmentGreen cover development: In an effort to increase green cover in and around the operational EPC and O&M sites the Company’s employees undertook tree plantation drives at various plant locations. The celebration of ‘World Environment Day’ promoted unity and social responsibility, especially in preserving the environment and fostering environment awareness.
Research and Development Over the years, the Company’s research and development evolved efficiently and effectively. The Company has three R&D centres at Switzerland, Austria and India. The department has developed requisite infrastructure and expertise to develop the know-how to execute globally benchmarked projects.
Focus of WABAG’s R&D Reduce operational and life cycle costs Reduce space utilisation for water infrastructure
projects Enhance efficiency in converting waste into biogas Increase environmental friendliness Scalability from pilot scale to plant scale System standardisation to accelerate design generation
WABAG is providing compact biological waste water treatment - the solution for fast growing dense populated urban areas around the world.
Due to land scarcity, high land cost and bad soil conditions, integration and improvement of waste water treatment in the fast growing urban areas around the world is a huge challenge.The location of the treatment plants may be in the vicinity of touristic, residential or commercial area, but it should be noiseless, odourless or invisible to the public eye. Also, like in the case of the recently completed Ujams Waste water Treatment Plant, there could be complex processes required for treating the effluent depending on the type of inflow, which demands a high technological know-how and patented processes.
In order to overcome these challenges, the Technology Portfolio of WABAG offers a wide range of possibilities, enabling us to provide optimum solution.
FLOUPURThe FLOUPUR is WABAG’s MBBR Technology (Moving Bed Bio-Reactor). In this type of reactor the biomass used for removal of the pollution in the waste water is fixed onto the surface of millions of small carriers moving around in the water to be cleaned.
This allows a much higher concentration of biomass in the reactor compared to conventional activated sludge technology where the biomass is ‘suspended’ in the waste water to be treated and the system hence gets limited by the capacity of the secondary settler used to separate the biomass from the treated water.

66 VA TECH WABAG LIMITED | Annual Report 2014-15
Management’s Discussion and Analysis
For instance, in Ilanz Swizerland the existing WWTP from 1978 had to be extended to achieve complete nitrification (8000 m3/d). To optimise the running cost and maximise the utilisation of the existing plant, the Hybrid version of FLUOPUR, with nitrification by Biomass Fixed on Fluopur carriers combined with denitrification in conventional activated sludge has been chosen.
BIOPUROne of WABAG’s most successful technologies over time is the BIOPUR with more than 60 global installations, which treats the waste water generated of almost 5mn PE (People Equivalent). This is the Group’s Biological Aerated Filter (BAF) Technology. BAF is the most compact biological treatment available. As in the MBBR, BAF also relies on biomass fixation on a media, allowing biomass concentration. This media is also used as filtration media, which eliminates the need for secondary settlers.
A key reason for the success of the BIOSTYR, also compared to other BAF competitors, is the utilisation of different biomass support types to achieve the required effluent quality in the given hydraulic conditions. The Algeciras WWTP, Spain was done using BIOPUR technology.
MARAPURIn the Membrane Bio-Reactor (MBR) the secondary settling tank of the conventional activated sludge is replaced by a membrane. This allows the biomass concentration to more than double and at the same time the membrane installation would be more compact than the secondary clarifier. As such MBR is a very compact solution and thanks to the utilisation of a membrane at the final treatment stage a very high effluent quality can be achieved. WABAG’s MBR solution is called MARAPUR and is based on the Company’s longstanding experiments and research work in this field. In fact, the Company’s first reference dates back to 1999 and since then we have been continuously improving this technology. This includes reducing energy demand and maintenance cost by integrating pre-filtration of the influent using the new pre-treatment technology called MICROPUR. The Zermatt WWTP, Switzerland was done using MARAPUR technology.
MICROPURMICROPUR is WABAG’s new fine sieve technology. By slowing down the rotation speed in a Rotation drum Filter utilising a relatively open mesh size, a filtration cake layer is formed. This combination of cake layer (good filtration) and open mesh (high hydraulic throughput) results in a high removal rate combined with high hydraulic capacity. The combined air water cleaning ensures a minimum production of back-wash water and full recovery of the filtration capacity. MICROPUR will perform as good as a conventional primary settler, but it will only use 1/5th of the space. In addition, the sludge will be thickened in the integrated mechanical thickener, so that it is possible to take the sludge directly to anaerobic digestion for energy recovery. The Ujams Industrial Water Reclamation, Windhoek, Namibia was done using MICROPUR technology.
NEREDA®NEREDA® is a new entrant in WABAG’s technology portfolio of compact biological waste water solutions. This technology is based on aerobic granules, where the bacteria normally found in suspended form in conventional activated sludge plants are forced to grow in dense granules, instead of the lighter and fluffier flock structure they normally have. These granules settle much faster and will again allow operating at much higher biomass concentrations than in conventional activated sludge. The dense structure will allow stratification of oxygen and nutrients within the granule, making it possible to achieve simultaneously complete biological phosphorous and nitrogen removal.
NEREDA® has been developed and patented by Royal Haskoning DHV (in cooperation with TU Delft) and in November 2014 WABAG signed a license agreement for introduction of this technology in India and Swiss markets.
International Engineering Centre (IEC)WABAG established IEC at Pune and a branch in Vadodara to fulfil the design and engineering needs for SBUs and MDUs located worldwide. Since 2008, IEC delivered over 50 projects. This engineering and design innovation hub employs around 100 engineers in the above locations.
System Tools: IEC combines proprietary and purchased technology/software, customising it to serve the needs of its customers. The Centre has invested in automation and developed system tools like 3D software (Propipe) and high-tech software like PDMS. The Centre adopted the CADISON® platform for engineering solutions, to optimise project running time, by reducing the planning period. IEC’s design solutions eliminate redundancy and reduce analysis time and hence bring down costs, besides allowing premature and concurrent testing/quality control.
Engineering: IEC uses the most innovative technology for data management to provide unique solutions for water and waste water treatment. Its proficiency ranges from process design to the delivery of immediately operational plants.
Highlights, FY 2014-15 Provided complete engineering support for successful
execution of over 10 projects in FY 2014-15 Facilitated 100% utilisation of CADISON® software,
fully customised in-house to create an integrated 3D modelling/simulation of the plant, which helped in improving the accuracy
Realised automation goals for design process and created in-house Smart Plant instrumentation (INTOOLS) and SP 3D software
Designed for the first time, a high pressure spherical vessel design which was commissioned by the Industrial Water Group
Designed maintenance-free auto valve-less gravity filter, which was commissioned during the year
IEC realises there are huge opportunities from the worldwide market and to tap these opportunities IEC plans to cater

Corporate
Overview
Statutory
Reports
67
Financial
Statements
to third-party clients. IEC also plans to offer engineering solutions to non-water sectors. Service offerings planned from this Centre shall include automation, feed engineering, detailed engineering, analytical services and special product designs.
IEC also brings diverse forms of know-how together, and by executing projects more efficiently strives to become more competitive and serve its customers better.
Information Technology WABAG considers Information Technology (IT) as a key enabler for efficiency and intends to have a ‘centralised administration with a local break-fix service model’. At WABAG, IT forms the backbone for carrying out all the business processes, for communication, collaboration and for effective decision-making. It enables the Company to provide standardised services, optimise cost, deliver value and monitor and manage technology in all operations and at all levels.
The Company has established ERP systems at new locations, leading to cost optimisation. WABAG has also been utilising Lync and SharePoint for better communication and collaboration. The communication tool Lync connects employees globally and many portals over SharePoint have been set up to facilitate greater ease of cross-geography collaboration and knowledge sharing.
WABAG’s IT focuses on Expanding communication and collaboration across
locations Using specific cloud applications for better mobility Consolidating and standardising global IT services Establishing ERP at new sites depending on business
growth
Corporate Social ResponsibilityWABAG’s CSR vision positions the Company as a thought leader on water management by leveraging nine decades of expertise in building sustainable water treatment solutions for betterment of society. WABAG constituted a Committee on Corporate Social Responsibility on 24 May 2014, comprising three members of the Board. The CSR Committee and the Board approved the Company’s CSR policy. According to the policy, WABAG is executing all identified and approved projects in partnership with research institutions, universities and in collaboration with reputed NGOs in water space. The CSR Committee meets and reviews the CSR projects on a regular basis. WABAG’s CSR team is also undertaking projects to improve the availability of clean and potable water for the underserved communities in areas where the Company operates.
Project Highlights, FY 2014-15Rain Water Harvesting (RWH) Facility at Kanchi Kamakoti Child Trust Hospital, Chennai: WABAG has implemented the RWH programme in collaboration with Akash Ganga Trust under the leadership of Dr. Sekhar Raghavan who is
an expert in RWH. This CSR initiative would bring financial savings to the hospital on a recurring basis and improve the water table and water quality, besides avoiding flooding within the hospital premises. The daily requirement of fresh water is met mostly from groundwater sources through three bore wells. This project shall inject the maximum possible rain water falling into the soil within the premises, and recharge groundwater sources (GWR) in order to sustain and improve it.
Sewage Treatment Plant (STP) Facility at the Cancer Institute, Gandhinagar Complex, Adyar, Chennai: Cancer Institute, Adyar, is a public charitable voluntary organisation dedicated to the care of cancer patients for over 55 years. ‘General beds’ or free boarding and lodging comprise 60% of hospital beds. The Institute offers free treatment to patients occupying 20% of the remaining beds and the rest are offered subsidised treatment. Annually, over 15,000 new patients and around 1,20,000 follow-up cases are treated. An NABH accreditation for the Institute, which would ensure improved quality care and patient safety, required an STP facility in their Gandhinagar complex. WABAG made a spontaneous offer to the Cancer Institute and agreed to execute the project on its own. It is likely to be commissioned by June 2015.
Augmentation of Water Resources project in partnership with MSSRF: WABAG entered into a partnership with M.S. Swaminathan Research Foundation (MSSRF) to implement a project on augmentation of water resources in Mailam Block, Villupuram District, Tamil Nadu to enhance crop diversity and productivity of small farmers. MSSRF was established in 1988 as a not-for-profit trust by Professor M.S. Swaminathan. The Foundation aims to accelerate the use of modern science and technology for agricultural and rural development to improve lives and livelihoods of tribal and rural communities. The entire research activity of this Foundation aims to utilise science and technology for improving the lives of the poor and has a pro-women, pro-nature and pro-jobs orientation. The purpose of this CSR project is to renovate 30 open wells to promote crop diversity and enhance productivity of small farmers in dry lands. This rejuvenation process would increase the area under pulses and groundnut to address issues of malnutrition. This project would be completed by August 2015.
Capacity Building for Wetlands Management: WABAG has engaged the services of Care Earth Trust which is based out of Chennai. This Trust is an NGO with the mission to conserve biodiversity for human well-being through research, advocacy and capacity building. The scope of this CSR project includes implementation of an integrated programme for building capacities for managing wetlands among the defined stakeholder groups. The target audience will be imparted training to increase their knowledge and skills to protect and preserve the wetlands.

68 VA TECH WABAG LIMITED | Annual Report 2014-15
Management’s Discussion and Analysis
The project’s duration is one year from April 2015 with the following targets: 1) Maintain current wetland area;2) Restore adequate water retention in wetlands;3) Reduce ecological risk in wetlands to acceptable levels;4) Restore and maintain species diversity
Besides, WABAG extended support to various other health initiatives during the year. WABAG supported Samanvay Foundation, Kanpur for provision of Mobile ZD Toilet Systems and the Rotary Club, Chennai for meeting the local requirements for safe drinking water.
Risk Management and Internal ControlWABAG believes in managing risks and uncertainties in a manner that allows the Company to pursue business opportunities and create continuous shareholder value. The Company’s approach towards risk management is reinforced by its understanding of the risks that it is exposed to, its risk appetite and how the risks change over time. The objective of the Company’s risk management is to ensure that an appropriate balance is maintained between the levels of risk assumed and expected return, while ensuring that it remains agile and have an unhindered business decision-making process.
The Board, Audit Committee and Monitoring Committee are responsible for maintaining the risk management framework and internal control processes and policies. The Board assesses and approves its overall risk appetite, monitors the risk exposure and sets the group-wide limits, which are periodically reviewed. WABAG’s risk framework thus is based on the concept of ‘three lines of defence’ comprising risk-taking and management, risk control and oversight and independent assurance.
The Company’s management systems, organisational structures, processes, standards, code of conduct and behaviours together form a system of internal control that governs how it conducts its businesses and manages associated risks.
The Company has an integrated risk assessment and management process, wherein all relevant external and internal risks are identified, evaluated and mitigated across the life cycle of the projects and their operations. It starts from pre tendering stage till closure of a project and /or operations and maintenance of the project. These are monitored and enhanced through the global Enterprise Resource Planning (ERP) package in the Company. There are well documented procedures, policies and authorisation levels for the various business decisions that govern the conduct of business at various levels across geographies. These have embedded in them the various risks identified and their mitigation aspects.
WABAG also has a strong internal assurance team to support the Group CEO and Managing Director directly to identify and manage the various operational, business, commercial and external risks. The effectiveness of the internal control
mechanism is reviewed by an independent professional internal audit function and by the statutory auditors. The Audit Committee of the Board periodically reviews the functioning of the internal audit and the implementation of the recommended measures to improve the internal control mechanism.
Risk management framework
Risk
Identification
Business
Activities
Risk
Response/
Mitigation
plan
Risk
Evaluation/
Assessment
Risk
Monitoring
Macroeconomic risk
Changes in economic and relevant regulatory policies, lower
GDP growth, scaling back of government initiatives and
termination of government contracts with little or no prior
notice, insufficiency of funds and the reluctance of government
departments to make quick decisions may adversely impact
opportunities from a specific country or region.
Mitigation measures
WABAG evaluates every country for their risk rating and
takes account of this evaluation, while making Bid / No
Bid and pricing decisions. The Company creates a road
map for responsive actions to maintain manageable risk
exposure. Macroeconomic risks largely relate to order
intake. The Company is operating in over 30 countries and
the geographical risk that may arise in one country may be
mitigated through diversified presence.
Political risk
Disruptive geopolitical scenario (includes political shifts,
such as major policy changes, coups, revolutions and wars)
and changes in governments or unstable political regimes

Corporate
Overview
Statutory
Reports
69
Financial
Statements
in the geographies where the Company is present, can delay
project execution.
Mitigation measures
WABAG adds ‘force majeure clauses’ in all its contracts to
indemnify its business operations. The Company also takes
adequate insurance cover to proactively manage political
risks. The Company continuously assesses insecure political
climate, new legislation and elections among others and
avoids contracts in areas found to be too risky. For all
international projects, the Company treats contracts as
order intake only after down payment and Letter of Credit is
received and credit insurance secured.
Competition risk
Rising competition from other global organised players in
the bidding process may compel the Company to lower prices
to win contracts and maintain market share. This may lead
to substantial margin pressure.
Mitigation measures
The Company’s brand value and relentless focus on quality
and customer service gives it a competitive advantage over
others. Past performance, legacy brand and benchmark
project references help it secure contracts consistently. The
Company offers competitive pricing to customers, due to
technological superiority and large presence in low-cost
economies and maintains an edge over competition.
Vendor risk
WABAG depends on vendors for the construction of its
various projects and supply of key equipment. Therefore,
it is exposed to uncertainty in the quality of their services,
equipment and supply including timely delivery. This can
cause operational delays and increased costs.
Mitigation measures
WABAG has vendor sourcing decisions incorporated into
its key risk factors. The Company follows a strict vendor
evaluation and re-classification programme along with vendor
due diligence for a comprehensive vendor stratification.
There are multiple levels of authority within the Company
for approvals to choose an appropriate vendor.
Customers credit profile risk
Poor credit worthiness of customers can cause multiple
setbacks in the midst of an order execution and lead to
project delays.
Mitigation measures
WABAG evaluates customer balance sheet and risk analysis
at pre-bidding stage. The Company prefers to bid for funded
projects. It chooses projects, which involve government
bodies and institutions with stable financing capabilities
like the World Bank, JBIC, JICA, ADB and EXIM bank, among
others, where payments are made directly to contractors by
these agencies.
Consortium partners credit profile risk
Consortium partners may default on their obligations,
causing project delays and financial losses for the Company.
Mitigation measures
WABAG evaluates consortium partners to gauge their
business and financial health at pre-bidding stage. The
Company minimises losses of liquid funds deposited with or
invested in such partnerships by careful partner selection.
Commodity price risk
Inconsistent commodity supply and price volatility of specific
commodities/raw materials could affect project cost and
gross margins.
Mitigation measures
WABAG provides clauses in supplier contracts to deal with price
contingencies. The Company optimises operations to estimate
overall costs correctly and minimise cost overruns that arise due
to unexpected commodity price changes. Most of the contracts
with municipality are funded by multilateral agencies and these
contracts have price adjustment clause linked to inflation index
published to compensate increase in cost of goods or services.
Most of these contracts follow FIDIC norms.
Forex risk
Volatile global currencies may impact WABAG’s profitability
adversely.
Mitigation measures
The Company regularly evaluates foreign exchange
movements and hedges positions through forward / options
contracts to safeguard against currency volatility. In most
international projects the Company negotiates US$ or Euro
for offshore portion and local currency for onshore portion,
which acts as a natural hedge. Translation risks are not
hedgeable and they are non-cash in nature.
Disclaimer
The Management Discussion and Analysis contains “forward-looking
statements” , identified by words like ‘plans’, ‘expects’, ‘will’, ‘anticipates’,
‘believes’, ‘intends’, ‘projects’, ‘estimates’ and so on within the meaning of
applicable securities laws and regulations concerning WABAG’s future
business prospects and business profitability. All statements that address
expectations or projections about the future, the Company’s strategy for
growth, product development, market position, expenditures and financial
results, are forward-looking statements. All these prospects are subject to
a number of risks and uncertainties and the actual results could materially
differ from those in such forward looking statements. The risks and
uncertainties relating to these statements include, but are not limited to,
risks and uncertainties regarding fluctuations in earnings, ability to manage
growth, competition (both domestic and international), economic growth
in India and the target countries worldwide, ability to attract and retain
highly skilled professionals, time and cost over runs on contracts, ability to
manage international operations, government policies and actions with
respect to investments, fiscal deficits, regulations, interest and other fiscal
costs generally prevailing in the economy etc. Past performance may not be
indicative of future performance. The Company does not undertake to make
any announcement in case any of these forward looking statements become
materially incorrect in future nor shall the Company update any forward
looking statements made from time to time by or on its behalf.

70 VA TECH WABAG LIMITED | Annual Report 2014-15
Report on Corporate Governance
Report on Corporate
Governance
1. Company’s Philosophy on Corporate GovernanceAt Wabag, we conduct our business in a manner that is
fair to all our stakeholders, practice a high standard of
integrity in all our actions, respect and comply with the
laws of the geographies in which we are present.
Our Company’s Corporate Governance philosophy
extends beyond regulatory and legal requirements and
strives to enhance stakeholders’ value through:
effective strategic process incorporating
stakeholder value
ethical business conduct
firm commitment to values
sound business decisions
prudent financial management
reporting system structured to provide transparency
and accountability
At Wabag, we consider stakeholders as partners in
our success, and remain committed to maximising
stakeholder value, be it shareholders, employees,
suppliers, customers, investors, communities or
policy makers. Over the years, we have strengthened
governance practices. These practices define the
way business is conducted and value is generated.
Stakeholders’ interests are taken into account, before
making any business decision. This is of vital importance
and retains the trust of our stakeholders.
We consider it as our inherent responsibility to disclose
timely and accurate information regarding our
financials and performance, as well as the leadership
and governance of the Company.
In the years of its existence, Wabag has created a
richly competent, informed and independent Board of
Directors (“the Board”). The Board of Wabag is at the
core of our corporate governance practice. It oversees
how the management serves and protects stakeholder
interests by following best practices. The majority of
our Board, 5 out of 7 are Independent Directors. Further
all the committees of the Board comprises majority of
Independent Directors. The Board focuses on upholding
the core values of excellence, integrity, responsibility,
unity and understanding to ensure that there is a strong
legacy of fair, transparent and ethical governance
practice in the Company.
Recently, the Securities and Exchange Board of India
(SEBI) amended the equity listing agreement to bring
in additional corporate governance norms for listed
entities. These norms provide for stricter disclosures
and protection of investor rights, including equitable
treatment for minority and foreign shareholders. The
amended norms are aligned with the provisions of
the Companies Act, 2013 and are aimed to encourage
companies to “adopt best practices on corporate
governance”.
The Company is not only in compliance with the
requirements stipulated under Clause 49 of the Listing
Agreement entered into with the Stock Exchanges with
regard to corporate governance but is also committed
to sound corporate governance principles & practices
and constantly strives to adopt emerging best corporate
governance practices being followed worldwide.
2. Board of DirectorsThe Board being aware of its fiduciary responsibilities,
recognizes its responsibilities towards all stakeholders
to uphold highest standards in all matters concerning
the Company and has empowered responsible persons
to implement its broad policies and guidelines and
has set up adequate review processes. The Board
provides strategic guidance on affairs of the Company.
The Independent Directors provide independent and
objective judgment on matters placed before them.
The Company’s day to day affairs are managed by the
Managing Director, assisted by a competent management
team under the overall supervision of the Board. The
Company’s commitment to ethical and lawful business
conduct is a fundamental shared value of the Board,
senior management and all its employees. The Board is
committed to representing the long terms interests of the
stakeholders and in providing effective governance over
the Company’s affairs and exercise reasonable business
judgment on the affairs of the Company.

Corporate
Overview
Statutory
Reports
71
Financial
Statements
The Directors are elected based on their qualification and
experience in varied fields. At the time of induction of a
Director, a formal invitation to join the Board is sent out
and a Directors’ handbook comprising a compendium of
the role, powers and duties to be performed is given to
the new Director. The Independent Directors annually
provide a certificate of independence in accordance
with the applicable laws which is taken on record by the
Board. All Board members have the opportunity and
access to interact with the management.
2.1 Composition Of The Board
The Company’s policy is to maintain optimum
combination of Directors. The composition of the Board
during the financial year was in conformity with Clause
49 of the Listing Agreement entered into with the stock
exchanges and in line with the Companies Act 2013. The
Board has been constituted in an appropriate manner,
to preserve its independence and to separate the Board
functions of governance and management.
As on 31 March 2015 in compliance with the Corporate
Governance norms the Board comprised 5 Directors
majority of them being Independent Directors. The
Chairman of the Board is an Independent Director.
Besides the Chairman, the Board comprises the
Managing Director, who is a promoter Director and 4
Independent Directors. No director is, inter se, related to
any other director on the Board.
2.2 Board Procedure
A detailed agenda folder is sent to each Director in
advance of Board and Committee Meetings. All material
information is incorporated in the agenda for facilitating
meaningful and focused discussions at the meeting.
Where it is not practicable to attach any document
to the agenda, the same is tabled before the meeting
with specific reference to this effect in the agenda. In
special and exceptional circumstances, additional or
supplementary item(s) on the agenda are permitted.
To enable the Board to discharge its responsibilities
effectively, the Managing Director apprises the Board at
every meeting, the overall performance of the Company.
The Board reviews strategy and business plans, annual
operating and capital expenditure budgets, investment
and exposure limits, compliance reports of all laws
applicable to the Company, as well as steps taken by
the Company to rectify instances of non-compliances, if
any. The Board also reviews major legal issues, minutes
of meeting of various Committees of the Board and
subsidiary companies, significant transactions and
arrangements entered into by the subsidiary companies,
adoption of financial results, transactions pertaining to
purchase or disposal of properties, major accounting
provisions and write-offs, corporate restructuring and
information on recruitment of officers just below the
Board level, including the Chief Financial Officer and the
Company Secretary.
The Company Secretary records minutes of proceedings
of each Board and Committee meeting. Draft minutes
are circulated to Board/ Committee members for their
comments. The minutes are entered in the Minutes Book
within 30 days from the conclusion of the meeting.
The guidelines for Board and Committee meetings
facilitate an effective post meeting follow-up, review and
reporting process for decisions taken by the Board and
Committees thereof. Important decisions taken at Board/
Committee meetings are communicated promptly to the
concerned departments/divisions. Action-taken report
on decisions/minutes of the previous meeting(s) is placed
at the succeeding meeting of the Board/Committee for
noting.
The Company Secretary, while preparing the agenda,
notes on agenda, minutes of the meeting(s) etc., is
responsible for and ensures adherence to all applicable
laws and regulations, including the Companies Act,
2013 read with rules thereunder, and the Secretarial
Standards recommended by the Institute of Company
Secretaries of India as applicable.
2.3 Number Of Board Meetings:
The Board met four times during the Financial Year
2014-15 on 24 May 2014, 11 August 2014, 8 November 2014
and 7 February 2015.
The Company held at least one Board meeting in every
three months. The maximum gap between any two
meetings was less than one hundred and twenty days, as
stipulated under Clause 49.

72 VA TECH WABAG LIMITED | Annual Report 2014-15
Report on Corporate Governance
2.4 Details of Board Members as on 31 March 2015
Name/Din Category
Attendance Particulars No. of Directorships and Committee Memberships/
Chairmanships as on 31 March 20151
No. of Board
MeetingsLast
AGMDirectorships2
Committee
Memberships3
Committee
Chairmanships3
Held Attended
Rajiv Mittal
01299110
Promoter /Managing
Director
4 4 Present 1 1 -
Jaithirth Rao
00025289
Independent Director 4 1 Absent 2 1 -
Sumit Chandwani
00179100
Independent Director 4 4 Present 2 2 1
Revathi Kasturi
01837477
Independent Director 4 4 Present 1 - -
Bhagwan Dass Narang
00038052
Independent
Chairman
4 4 Present 5 5 4
1. Excludes Private Limited Companies, Foreign Companies and Companies registered under Section 8 of the Companies Act,2013.
2. Excludes alternate Directorships but includes Additional Directorships and Directorship in VA TECH WABAG LIMITED
3. Committees considered are Audit Committee and Stakeholders Relationship Committee, as per Clause 49 of the Listing Agreement.
Report on Corporate Governance
2.5 Directors’ Shareholding
The details of company’s shares held by the Directors as
on 31 March 2015 are as below:
Name of Director No. of shares held (` 2/- paid up)
Bhagwan Dass Narang* Nil
Jaithirth Rao 1,60,000
Sumit Chandwani Nil
Revathi Kasturi Nil
Rajiv Mittal 97,09,406
*Bhagwan Dass Narang currently holds 50% of the Share
Capital of Shri Venimadhav Portfolio Private Limited, which
in turn held 35,740 equity shares of the Company as on 31 March 2015.
3. Committees of The BoardThe Board has constituted various committees to support
the Board in discharging its responsibilities. There are
five committees constituted by the Board
Audit Committee
Stakeholders Relationship Committee
Nomination and Remuneration Committee
Corporate Social Responsibility Committee
Monitoring Committee
The Company’s guidelines relating to Board meetings are
applicable to Committee meetings as far as practicable.
Each Committee has the authority to engage outside experts,
advisors and counsels to the extent it considers appropriate
to assist in its functions. Senior officers/ functional heads
of Company are invited to present various details called for
by the committee in its meeting. Minutes of proceedings of
Committee meetings are circulated to the Directors and placed
before Board meetings for noting. The recommendations of
the Committees are submitted to the Board for approval.
Terms of Reference and Other Details of Board Committees3.1 Audit Committee
3.1.A. Terms Of Reference
The Board of Directors at their Meeting held on
24 May 2014 revised the terms of reference of the
committee which are in compliance with the provisions
of section 177 of the Companies Act, 2013 and the revised
clause 49 of the listing agreement.
The powers, role and terms of reference of the audit
committee are in line with the provisions of section 177
of the Act and clause 49 of the listing agreement.
3.1.B Composition
Bhagwan Dass Narang
(Chairman of the Committee)
Independent Director
Jaithirth Rao Independent Director
Sumit Chandwani Independent Director

Corporate
Overview
Statutory
Reports
73
Financial
Statements
The Committee’s composition meets the requirements of
Section 177 of the Companies Act, 2013 and Clause 49 of
the Listing Agreement. All the members of the committee
possess financial / accounting expertise / exposure.
Senior Executives of the Accounts /Finance Department
and representatives of Statutory and Internal Auditors
attend Audit Committee Meetings. The Company
Secretary acts as the Secretary to the Audit Committee.
The Chairman of the Audit Committee, Bhagwan Das
Narang was present at the last Annual General Meeting
held on 21 July 2014.
3.1.C Meetings & Attendance
The Committee met four times during the Financial Year
2014-15 on 24 May 2014, 11 August 2014, 8 November 2014
and 7 February 2015. The attendance at the meetings is
as under:
Members Number of Meetings
Held Attended
Bhagwan Dass Narang 4 4
Jaithirth Rao 4 1
Sumit Chandwani 4 4
3.2 Stakeholders Relationship Committee
3.2.A Terms Of Reference
The Board of Directors at their Meeting held on 24 May
2014 revised the terms of reference of the committee
which are in compliance with the provisions of section
178 of the Companies Act, 2013 and the revised clause 49
of the listing agreement.
The Stakeholders Relationship Committee is primarily
responsible for redressal of shareholders’/investors’/
security holders’ grievances including complaints
related to transfer of shares, non-receipt of declared
dividends, annual reports etc. The Committee’s terms
of reference also include allotment of equity shares to
option grantees under the prevailing ESOP Schemes of
the Company.
The terms of reference of the Stakeholders Relationship
Committee are in line with the provisions of section 178
of the Act and clause 49 of the listing agreement.
3.2.B Composition
Sumit Chandwani
(Chairman of the Committee)
Independent Director
Rajiv Mittal Managing Director
The Committee’s composition meets the requirements of
Section 178 of the Companies Act, 2013 and Clause 49 of
the Listing Agreement.
3.2.C Meetings & Attendance
The Committee met five times during the Financial Year
2014-15 on 24 May 2014, 11 August 2014, 8 November 2014,
1 December 2014 and 7 February 2015. The attendance at
the Meetings is as under:
Members Number of Meetings
Held Attended
Sumit Chandwani 5 5
Rajiv Mittal 5 5
During the year, 8 complaints were received and
resolved to the satisfaction of investors. As on 31 March
2015, there were no outstanding complaints from the
investors.
3.3 Nomination And Remuneration Committee
3.3.A Terms Of Reference:
The Board of Directors at their Meeting held on
24 May 2014 revised the terms of reference of the
committee which are in compliance with the provisions
of section 178 of the Companies Act, 2013 and the revised
clause 49 of the listing agreement.
3.3.B Composition
Revathi Kasturi
(Chairperson of the Committee)
Independent Director
Bhagwan Dass Narang Independent Director
Sumit Chandwani Independent Director
Rajiv Mittal Managing Director
The Committee’s composition is in compliance with the
provisions of the Companies Act, 2013, Clause 49 of the
Listing Agreement and Securities and Exchange Board
of India (Employee Stock Option Scheme and Employee
Stock Purchase Scheme) Guidelines, 1999, as amended
from time to time.
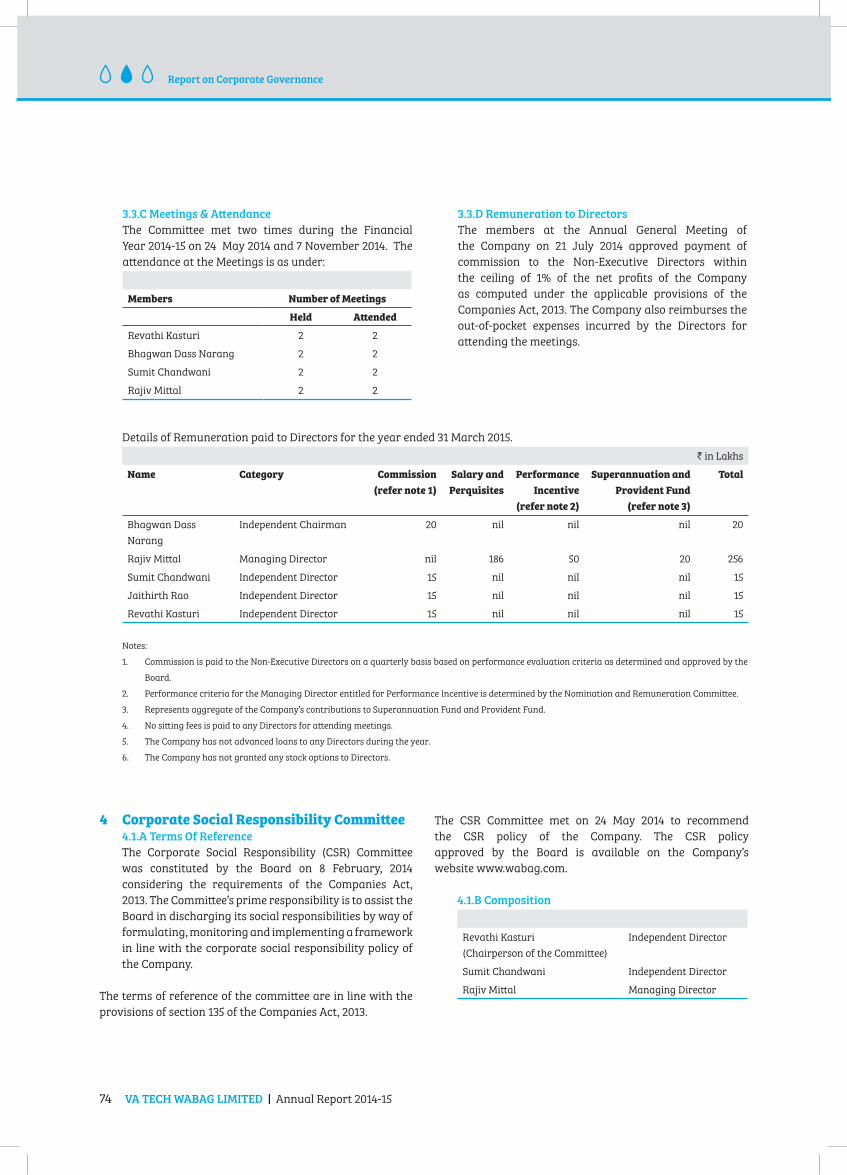
74 VA TECH WABAG LIMITED | Annual Report 2014-15
Report on Corporate Governance
3.3.C Meetings & Attendance
The Committee met two times during the Financial
Year 2014-15 on 24 May 2014 and 7 November 2014. The
attendance at the Meetings is as under:
Members Number of Meetings
Held Attended
Revathi Kasturi 2 2
Bhagwan Dass Narang 2 2
Sumit Chandwani 2 2
Rajiv Mittal 2 2
3.3.D Remuneration to Directors
The members at the Annual General Meeting of
the Company on 21 July 2014 approved payment of
commission to the Non-Executive Directors within
the ceiling of 1% of the net profits of the Company
as computed under the applicable provisions of the
Companies Act, 2013. The Company also reimburses the
out-of-pocket expenses incurred by the Directors for
attending the meetings.
Details of Remuneration paid to Directors for the year ended 31 March 2015.
` in Lakhs
Name Category Commission
(refer note 1)
Salary and
Perquisites
Performance
Incentive
(refer note 2)
Superannuation and
Provident Fund
(refer note 3)
Total
Bhagwan Dass
Narang
Independent Chairman 20 nil nil nil 20
Rajiv Mittal Managing Director nil 186 50 20 256
Sumit Chandwani Independent Director 15 nil nil nil 15
Jaithirth Rao Independent Director 15 nil nil nil 15
Revathi Kasturi Independent Director 15 nil nil nil 15
Notes:
1. Commission is paid to the Non-Executive Directors on a quarterly basis based on performance evaluation criteria as determined and approved by the
Board.
2. Performance criteria for the Managing Director entitled for Performance Incentive is determined by the Nomination and Remuneration Committee.
3. Represents aggregate of the Company’s contributions to Superannuation Fund and Provident Fund.
4. No sitting fees is paid to any Directors for attending meetings.
5. The Company has not advanced loans to any Directors during the year.
6. The Company has not granted any stock options to Directors.
4 Corporate Social Responsibility Committee 4.1.A Terms Of Reference
The Corporate Social Responsibility (CSR) Committee
was constituted by the Board on 8 February, 2014
considering the requirements of the Companies Act,
2013. The Committee’s prime responsibility is to assist the
Board in discharging its social responsibilities by way of
formulating, monitoring and implementing a framework
in line with the corporate social responsibility policy of
the Company.
The terms of reference of the committee are in line with the
provisions of section 135 of the Companies Act, 2013.
The CSR Committee met on 24 May 2014 to recommend
the CSR policy of the Company. The CSR policy
approved by the Board is available on the Company’s
website www.wabag.com.
4.1.B Composition
Revathi Kasturi
(Chairperson of the Committee)
Independent Director
Sumit Chandwani Independent Director
Rajiv Mittal Managing Director

Corporate
Overview
Statutory
Reports
75
Financial
Statements
4.1.C Meetings & Attendance
The Committee met six times during the Financial Year
2014-15 on 24 May 2014, 21 July 2014, 11 August 2014, 8
November 2014, 1 December 2014 and 7 February 2015.
The attendance at the Meetings is as under:
Members Number of Meetings
Held Attended
Revathi Kasturi 6 6
Sumit Chandwani 6 6
Rajiv Mittal 6 6
5 Monitoring Committee 5.1.A .Terms Of Reference
The terms of reference of the committee inter-alia
include:
To monitor various on-going projects.
To review projects that are time-over-run, cost over-
run etc.
To review specific matters that is assigned by the
Board.
To review Company’s risk management practices
and activities.
5.1.B Composition
Bhagwan Dass Narang
(Chairman of the Committee)
Independent Director
Sumit Chandwani Independent Director
Revathi Kasturi Independent Director
Rajiv Mittal Managing Director
5.1.C Meetings & Attendance
The Committee met two times during the Financial
Year 2014-15 on 21 July 2014 and 1 December 2014 .The
attendance at the Meetings is as under:
Members Number of Meetings
Held Attended
Bhagwan Dass Narang 2 2
Sumit Chandwani 2 2
Revathi Kasturi 2 2
Rajiv Mittal 2 2
6. Disclosures 6.1 Related Party Transactions :
All related party transactions entered into by the
Company during the year has prior approval of the
Audit Committee. There have been no materially
significant related party transactions with the
Company’s Promoters, Directors, and the Management,
their Subsidiaries or relatives which may have potential
conflict with the interests of the Company. The necessary
disclosures regarding the transactions with related
parties are given in the Notes to the Annual Accounts
for the year 2014-15.
The transactions with related parties are disclosed in
note 32 of the standalone financial statements in the
annual report. There were no materially significant
transactions with related parties during the year that
may have potential conflict with the interests of the
Company at large or that requires approval of the
shareholders through special resolution. The Company’s
major related party transactions are generally with
its subsidiaries and associates. The related party
transactions are entered into based on considerations
of various business exigencies, such as synergy in
operations, geographic expansion plans and the
Company’s multi domestic unit strategy, profitability,
legal requirements, liquidity and capital resources of
subsidiaries and associates.
All related party transactions are negotiated on arm’s
length basis, and are intended to further the Company’s
interests. The Audit Committee of the Board periodically
reviews the related party transactions entered into by
the Company. The Related Party Transactions of the
Company during the year are as per the related party
transactions policy available on the Company’s website
www.wabag.com
6.2 Non Compliances:
There have been no instances of non-compliance by the
Company on any matters related to the capital markets,
nor have any penalty/strictures been imposed on the
Company by the Stock Exchanges or SEBI or any other
statutory authority on such matters during the last
three years.
6.3 Whistle Blower Policy/ Vigil Mechanism:
The Company has established a whistle blower
mechanism to provide an avenue to raise concerns,
in line with the Company’s commitment to the high
standards of ethical, moral and legal conduct of
business. The mechanism also provides for adequate
safeguards against victimization of employees who
avail of the mechanism. The policy also lays down the
process to be followed for dealing with complaints and
in exceptional cases, also provides for direct appeal to
the Chairperson of the Audit Committee. It is affirmed
that during the year, no employee has been denied
access to the Audit Committee. The Company’s Whistle

76 VA TECH WABAG LIMITED | Annual Report 2014-15
Report on Corporate Governance
Blower policy approved by the Board on 24 May 2014 is
available on the Company’s website www.wabag.com.
6.4 CEO and CFO Certification
The Managing Director and the Chief Financial Officer
of the Company give annual certification on financial
reporting and internal controls to the Board in terms
of Clause 49 of the Listing Agreement. The Managing
Director and the Chief Financial Officer also give
quarterly certification on financial results while placing
the financial results before the Board in terms of Clause
41 of the Listing Agreement. The annual certificate given
by the Managing Director and the Chief Financial Officer
is published in this Report.
6.5 Subsidiary Companies’ Monitoring Framework
All the Company’s subsidiaries are Board managed
with their Boards having the rights and obligations to
manage such Companies in the best interest of their
stakeholders. The Company does not have any material
unlisted Indian subsidiary and hence is not required
to nominate an Independent Director of the Company
on the Board of any subsidiary. The Audit committee
reviews the financial statements, in particular
investments made by the unlisted subsidiary companies.
Minutes of the Board meetings of unlisted subsidiary
companies are placed and reviewed periodically by the
Company’s Board. A statement containing all significant
transactions and arrangements entered into by unlisted
subsidiary companies is placed before the Company’s
Board periodically.
6.6 Corporate Governance Voluntary Guidelines 2009
The Ministry of Corporate Affairs, Government of
India, published the Corporate Governance Voluntary
Guidelines in 2009. These guidelines provide corporate
India a framework to govern themselves voluntarily
as per the highest standards of ethical and responsible
conduct of business. The guidelines broadly focus on
areas such as Board, responsibilities of the Board,
audit committee functions, roles and responsibilities,
appointment of auditors, compliance with secretarial
standards and a mechanism for whistle blower support.
The Company is in substantial compliance with the
Corporate Governance Voluntary Guidelines.
6.7 Adoption of Mandatory and Non- Mandatory
requirements of Clause 49
The Company has complied with all the mandatory
requirements of Clause 49 of the Listing Agreement.
Certificate from M/s Walker Chandiok & Co LLP, Statutory
Auditors, confirming compliance with conditions of
Corporate Governance as stipulated under Clause 49 of the
Listing Agreement, is forming part of the Annual Report.
The Company has adopted the following non-mandatory
requirements of Clause 49 of the Listing Agreement and
the Companies Act 2013.
6.7.A The Board
The Chairman of the Board is an Independent Director
and a Chairman’s office is maintained at the Company’s
expense. The Company reimburses the Chairman any
expenses incurred in performance of his duties.
6.7.B Audit Qualification
The Company is in the regime of unqualified financial
statements.
6.7.C Separate posts of Chairman and CEO
The post of the Chairman and Managing Director of the
Company are held by separate persons.
6.7.D Reporting of Internal Auditor
The Internal auditor of the Company reports directly to
the Audit Committee.
7. 1 CODE OF CONDUCT
The Code of Conduct (“the Code”) for Board Members and
Senior Management Personnel as adopted by the Board,
is a comprehensive Code applicable to Directors and
Senior Management Personnel. The Code lays down in
detail, the standards of business conduct, ethics and strict
governance norms for the Board and Senior Management
Personnel. A copy of the Code has been put on the
Company’s website www.wabag.com. The Code has been
circulated to Directors and Senior Management Personnel
and its compliance is affirmed by them annually. A
declaration signed by the Company’s Managing Director
to this effect is published in this Report.
7.2 Code For Prevention Of Insider Trading Practices
Securities and Exchange Board of India (SEBI) had
formulated SEBI (Insider Trading) Regulations 1992.
The Company had earlier formulated a comprehensive
Code of Conduct for Prevention of Insider Trading for
its Designated Employees, in compliance with Securities
and Exchange Board of India (Prohibition of Insider
Trading) Regulations, 1992, as amended from time to
time. SEBI has since amended the existing regulations
and these regulations are now called Securities and

Corporate
Overview
Statutory
Reports
77
Financial
Statements
Exchange Board of India (Prohibition of Insider
Trading) Regulations, 2015 (‘Regulations’). The new
Regulations have been effective from 15 May 2015. “The
Code of Conduct for Prevention of Insider Trading” of
the Company was amended to bring in line with the
provisions of Securities and Exchange Board of India
(Prohibition of Insider Trading) Regulations, 2015.
8. Meetings of Independent DirectorsDuring the Financial Year 2014-15, the Company’s
Independent Directors met on 7 February 2015 without
the presence of Executive Directors and members of
the management. All the Independent Directors were
present at the meeting.
9. General Body Meetings:9.1 Annual General Meetings
The date, time, location of Annual General Meetings held during last three years, and the special resolutions passed there
at are as follows:
Year Date Time Location Special Resolution passed
FY 2013-14 21 July 2014 10.30 A.M Rani Seethai Hall, 603, Anna
Salai, Chennai - 600 006
Approval for Non – Executive Directors
Remuneration
FY 2012-13 21 July 2013 10.00 AM Rani Seethai Hall, 603, Anna
Salai, Chennai - 600 006
NIL
FY 2011-12 23 July 2012 10.00 AM Russian Centre of Science
and Culture, 74, Kasturi
Rangan Road, Alwarpet,
Chennai 600 018
NIL
9.2 Special Resolution Passed Through Postal Ballot:
During the year, the Board sought consent of the Shareholders of the Company for passing the following Special Resolutions
through Postal Ballot.
Special Resolution under Section 13 of the Companies Act, 2013 for reclassification of Authorized Share Capital and
amendment to the Memorandum of Association.
S. Sandeep of S. Sandeep & Associates, Company Secretaries (FCS No. 5853, COP No. 5987) was appointed as Scrutinizer
for conducting the postal ballot / e-voting process.
Voting pattern of the results dated 17 March 2015:
S.No Particulars No. of Shareholders who
casted valid votes
Total No. of
Shares
% of Votes cast to
total valid votes cast
1. Total number of votes cast in favour of the
Resolution
794 1,63,52,983 99.98%
2. Total number of votes cast against the
Resolution
18 2,011 0.01%
3. Total number of votes invalid 19 1,032 0.01%
Total 831 1,63,56,026 100.00%
78 VA TECH WABAG LIMITED | Annual Report 2014-15
Report on Corporate Governance
Postal Ballot procedure was conducted in
accordance with the provisions of Section 110 of
the Companies Act 2013 read with Rule 22 of The
Companies (Management and Administration)
Rules, 2014 and clause 35B of the Listing Agreement.
10. Means of Communication:10.1 Quarterly Results: Quarterly Results of the Company
are published in Business Standard and Makkal Kural
(Tamil edition) and are displayed on the Company’s
Website www.wabag.com
10.2 News Releases, Presentations etc.: Official news / Press
releases are sent to the Stock Exchanges.
10.3 Presentations to Institutional Investors / Analysts:
Presentations are made to Institutional Investors and
Financial Analysts, on the unaudited quarterly financial
results of the Company. These presentations are also
uploaded on the Company’s website www.wabag.com
10.4 Website: The Company’s website www.wabag.com
contains a separate dedicated section ‘Investor
Relations’ where shareholders information is available.
The Company’s Annual Report is also uploaded on the
website in a user-friendly and downloadable form.
10.5 Nse Electronic Application Processing System (Neaps):
The NEAPS is a web-based application designed by NSE
for corporates. All periodical compliance filings like
shareholding pattern, corporate governance report,
media releases, among others are filed electronically on
NEAPS.
10.6 BSE Corporate Compliance & Listing Centre (the
’Listing Centre‘): BSE’s Listing Centre is a web-based
application designed for corporates. All periodical
compliance filings like shareholding pattern, corporate
governance report, media releases, among others are
also filed electronically on the Listing Centre.
11. SEBI Complaints Redress System (SCORES): The investor complaints are processed in a centralised
web-based complaints redress system. The salient
features of this system are: Centralised database of
all complaints, online upload of Action Taken Reports
(ATRs) by concerned companies and online viewing
by investors of actions taken on the complaint and its
current status.
12. General Shareholder Information:12.1 Company Registration Details
The Company is registered in the State of Tamil Nadu,
India. The Corporate Identity Number (CIN) allotted to
the Company by the Ministry of Corporate Affairs (MCA)
is L45205TN1995PLC030231
12.2 Auditors
12.2.A Statutory Auditor:
Walker, Chandiok & Co LLP
(Formerly Walker, Chandiok & Co)
Chartered Accountants
Firm Registration No. 001076N/ N500013
Arihant Nitco Park, 6th Floor,
No.90, Dr. Radhakrishnan Salai
Mylapore, Chennai – 600 004
12.2.B Internal Auditor:
G.Balu Associates,
Chartered Accountants,
4-A, Venkatesa Agraharam Road,
Mylapore, Chennai – 600 004
12.2.C Cost Auditor:
S.Chandrasekaran,
Practicing Cost Accountant,
Membership No. 4784
4 Sreshta, 57 Subramaniam Street,
Abhiramapuram,
Chennai – 600 018.
12.2.D Secretarial Auditor:
M.Damodaran,
Practicing Company Secretary
Membership No. FCS5837
M.Damodaran & Associates
New No.6, Old No.12,
Appavoo Gramani,
1st Street, Mandaveli,
Chennai – 600 028
12.3 Address for Correspondence:
12.3.A Registered Office:
VA TECH WABAG LIMITED
WABAG HOUSE’
No.17, 200 Feet Thoraipakkam – Pallavaram Main Road,
Sunnambu Kolathur,
Chennai 600 117
Phone : 91-44-3923 2323
Fax : 91-44-3923 2324
12.3.B Registrar and Share Transfer Agents
Karvy Computershare Private Limited
Unit : VA TECH WABAG LIMITED
Karvy Selenium Tower B, Plot 31-32, Gachibowli,
Financial District, Nanakramguda, Hyderabad – 500 032.
Mr. B. Srinivas,
P : +91 040 67161530
Email: [email protected]
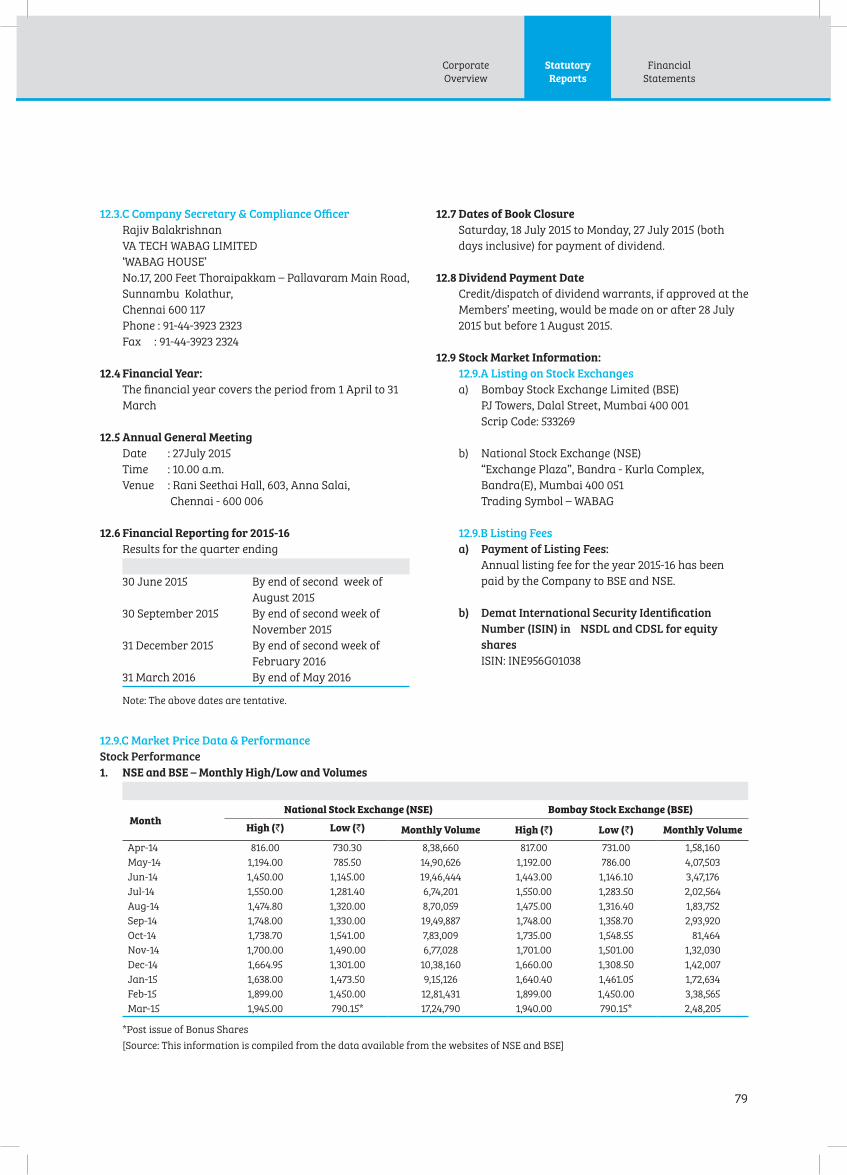
Corporate
Overview
Statutory
Reports
79
Financial
Statements
12.3.C Company Secretary & Compliance Officer
Rajiv Balakrishnan
VA TECH WABAG LIMITED
‘WABAG HOUSE’
No.17, 200 Feet Thoraipakkam – Pallavaram Main Road,
Sunnambu Kolathur,
Chennai 600 117
Phone : 91-44-3923 2323
Fax : 91-44-3923 2324
12.4 Financial Year:
The financial year covers the period from 1 April to 31
March
12.5 Annual General Meeting
Date : 27July 2015
Time : 10.00 a.m.
Venue : Rani Seethai Hall, 603, Anna Salai,
Chennai - 600 006
12.6 Financial Reporting for 2015-16
Results for the quarter ending
30 June 2015 By end of second week of
August 2015
30 September 2015 By end of second week of
November 2015
31 December 2015 By end of second week of
February 2016
31 March 2016 By end of May 2016
Note: The above dates are tentative.
12.7 Dates of Book Closure
Saturday, 18 July 2015 to Monday, 27 July 2015 (both
days inclusive) for payment of dividend.
12.8 Dividend Payment Date
Credit/dispatch of dividend warrants, if approved at the
Members’ meeting, would be made on or after 28 July
2015 but before 1 August 2015.
12.9 Stock Market Information:
12.9.A Listing on Stock Exchanges
a) Bombay Stock Exchange Limited (BSE)
PJ Towers, Dalal Street, Mumbai 400 001
Scrip Code: 533269
b) National Stock Exchange (NSE)
“Exchange Plaza”, Bandra - Kurla Complex,
Bandra(E), Mumbai 400 051
Trading Symbol – WABAG
12.9.B Listing Fees
a) Payment of Listing Fees:
Annual listing fee for the year 2015-16 has been
paid by the Company to BSE and NSE.
b) Demat International Security Identification
Number (ISIN) in NSDL and CDSL for equity
shares
ISIN: INE956G01038
12.9.C Market Price Data & Performance
Stock Performance
1. NSE and BSE – Monthly High/Low and Volumes
MonthNational Stock Exchange (NSE) Bombay Stock Exchange (BSE)
High (`) Low (`) Monthly Volume High (`) Low (`) Monthly Volume
Apr-14 816.00 730.30 8,38,660 817.00 731.00 1,58,160
May-14 1,194.00 785.50 14,90,626 1,192.00 786.00 4,07,503
Jun-14 1,450.00 1,145.00 19,46,444 1,443.00 1,146.10 3,47,176
Jul-14 1,550.00 1,281.40 6,74,201 1,550.00 1,283.50 2,02,564
Aug-14 1,474.80 1,320.00 8,70,059 1,475.00 1,316.40 1,83,752
Sep-14 1,748.00 1,330.00 19,49,887 1,748.00 1,358.70 2,93,920
Oct-14 1,738.70 1,541.00 7,83,009 1,735.00 1,548.55 81,464
Nov-14 1,700.00 1,490.00 6,77,028 1,701.00 1,501.00 1,32,030
Dec-14 1,664.95 1,301.00 10,38,160 1,660.00 1,308.50 1,42,007
Jan-15 1,638.00 1,473.50 9,15,126 1,640.40 1,461.05 1,72,634
Feb-15 1,899.00 1,450.00 12,81,431 1,899.00 1,450.00 3,38,565
Mar-15 1,945.00 790.15* 17,24,790 1,940.00 790.15* 2,48,205
*Post issue of Bonus Shares
[Source: This information is compiled from the data available from the websites of NSE and BSE]
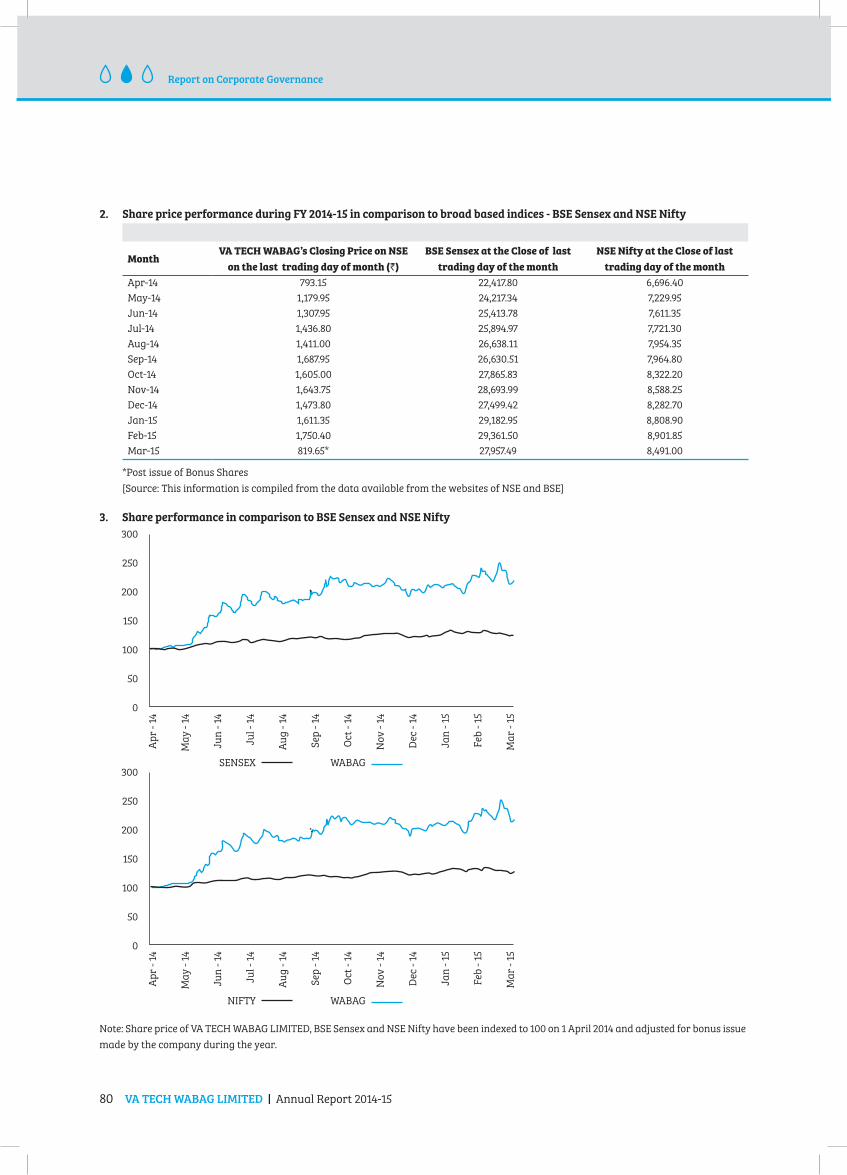
80 VA TECH WABAG LIMITED | Annual Report 2014-15
Report on Corporate Governance
2. Share price performance during FY 2014-15 in comparison to broad based indices - BSE Sensex and NSE Nifty
MonthVA TECH WABAG’s Closing Price on NSE
on the last trading day of month (`)
BSE Sensex at the Close of last
trading day of the month
NSE Nifty at the Close of last
trading day of the month
Apr-14 793.15 22,417.80 6,696.40
May-14 1,179.95 24,217.34 7,229.95
Jun-14 1,307.95 25,413.78 7,611.35
Jul-14 1,436.80 25,894.97 7,721.30
Aug-14 1,411.00 26,638.11 7,954.35
Sep-14 1,687.95 26,630.51 7,964.80
Oct-14 1,605.00 27,865.83 8,322.20
Nov-14 1,643.75 28,693.99 8,588.25
Dec-14 1,473.80 27,499.42 8,282.70
Jan-15 1,611.35 29,182.95 8,808.90
Feb-15 1,750.40 29,361.50 8,901.85
Mar-15 819.65* 27,957.49 8,491.00
*Post issue of Bonus Shares
[Source: This information is compiled from the data available from the websites of NSE and BSE]
Note: Share price of VA TECH WABAG LIMITED, BSE Sensex and NSE Nifty have been indexed to 100 on 1 April 2014 and adjusted for bonus issue
made by the company during the year.
3. Share performance in comparison to BSE Sensex and NSE Nifty
Ap
r -
14
Ma
y -
14
Jun
- 1
4
Jul
- 14
Au
g -
14
Sep
- 1
4
Oct
- 1
4
No
v -
14
Dec
- 1
4
Jan
- 1
5
Feb
- 1
5
Ma
r -
15
300
250
200
150
100
50
0
SENSEX WABAG
Ap
r -
14
Ma
y -
14
Jun
- 1
4
Jul
- 14
Au
g -
14
Sep
- 1
4
Oct
- 1
4
No
v -
14
Dec
- 1
4
Jan
- 1
5
Feb
- 1
5
Ma
r -
15
300
250
200
150
100
50
0
NIFTY WABAG
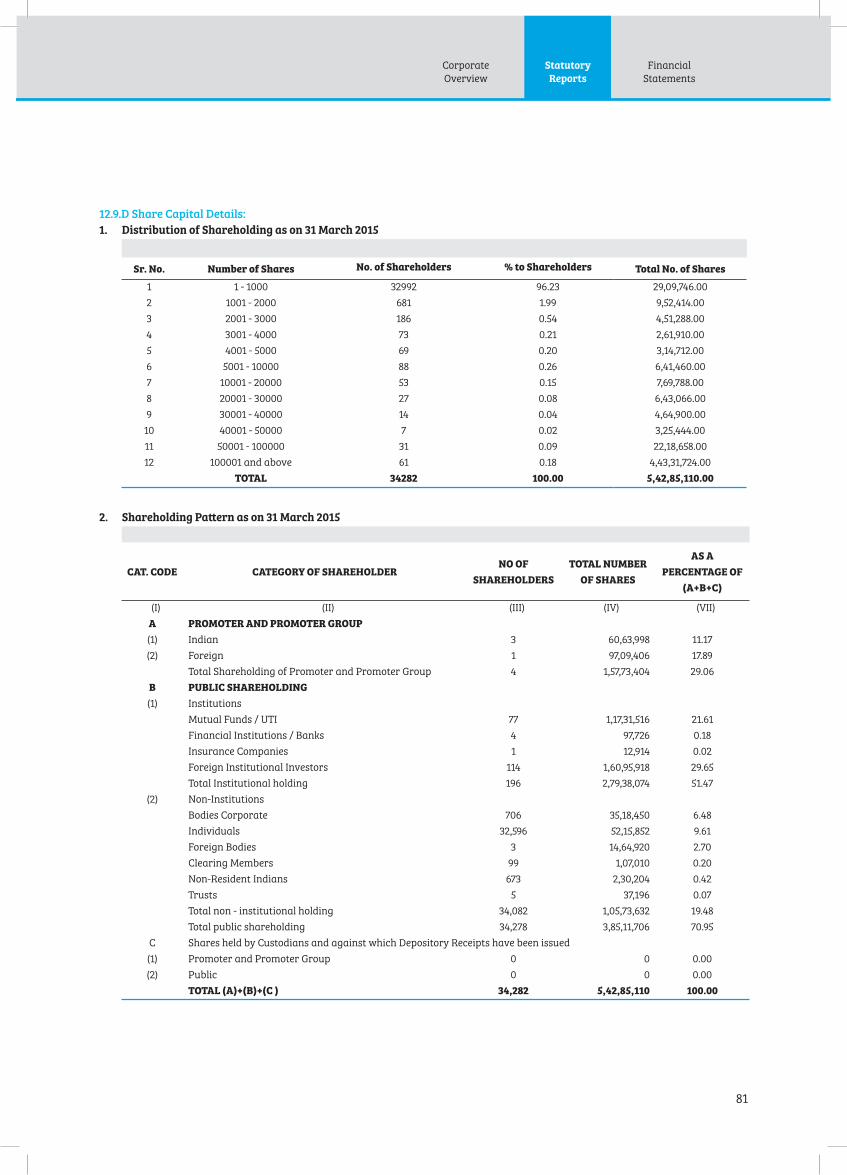
Corporate
Overview
Statutory
Reports
81
Financial
Statements
12.9.D Share Capital Details:
1. Distribution of Shareholding as on 31 March 2015
Sr. No. Number of Shares No. of Shareholders % to Shareholders Total No. of Shares
1 1 - 1000 32992 96.23 29,09,746.00
2 1001 - 2000 681 1.99 9,52,414.00
3 2001 - 3000 186 0.54 4,51,288.00
4 3001 - 4000 73 0.21 2,61,910.00
5 4001 - 5000 69 0.20 3,14,712.00
6 5001 - 10000 88 0.26 6,41,460.00
7 10001 - 20000 53 0.15 7,69,788.00
8 20001 - 30000 27 0.08 6,43,066.00
9 30001 - 40000 14 0.04 4,64,900.00
10 40001 - 50000 7 0.02 3,25,444.00
11 50001 - 100000 31 0.09 22,18,658.00
12 100001 and above 61 0.18 4,43,31,724.00
TOTAL 34282 100.00 5,42,85,110.00
2. Shareholding Pattern as on 31 March 2015
CAT. CODE CATEGORY OF SHAREHOLDERNO OF
SHAREHOLDERS
TOTAL NUMBER
OF SHARES
AS A
PERCENTAGE OF
(A+B+C)
(I) (II) (III) (IV) (VII)
A PROMOTER AND PROMOTER GROUP
(1) Indian 3 60,63,998 11.17
(2) Foreign 1 97,09,406 17.89
Total Shareholding of Promoter and Promoter Group 4 1,57,73,404 29.06
B PUBLIC SHAREHOLDING
(1) Institutions
Mutual Funds / UTI 77 1,17,31,516 21.61
Financial Institutions / Banks 4 97,726 0.18
Insurance Companies 1 12,914 0.02
Foreign Institutional Investors 114 1,60,95,918 29.65
Total Institutional holding 196 2,79,38,074 51.47
(2) Non-Institutions
Bodies Corporate 706 35,18,450 6.48
Individuals 32,596 52,15,852 9.61
Foreign Bodies 3 14,64,920 2.70
Clearing Members 99 1,07,010 0.20
Non-Resident Indians 673 2,30,204 0.42
Trusts 5 37,196 0.07
Total non - institutional holding 34,082 1,05,73,632 19.48
Total public shareholding 34,278 3,85,11,706 70.95
C Shares held by Custodians and against which Depository Receipts have been issued
(1) Promoter and Promoter Group 0 0 0.00
(2) Public 0 0 0.00
TOTAL (A)+(B)+(C ) 34,282 5,42,85,110 100.00

82 VA TECH WABAG LIMITED | Annual Report 2014-15
Report on Corporate Governance
3. Share Transfer System
Share transfers are processed and share certificates
duly endorsed are returned within a period of fifteen
days from the date of receipt, subject to documents being
valid and complete in all respects. The Stakeholders
Relationship Committee (“the Committee”) has delegated
the authority for approving transfer, transmission
etc., of the Company’s securities to the Managing
Director / Chief Financial Officer / Company Secretary.
A summary of transfer/transmission of securities of
the Company so approved by the Managing Director /
Chief Financial Officer /Company Secretary is placed at
every Committee meeting. The Company obtains from a
Company Secretary in Practice, half-yearly certificate
of compliance with the share transfer formalities as
required under Clause 47(c) of the Listing Agreement
and files a copy of the said certificate with the Stock
Exchanges.
4. Dematerialisation of Shares
99.99% of the Company’s paid-up Equity Share Capital
has been dematerialised as on 31 March 2015. Trading
in Equity Shares of the Company is permitted only in
dematerialized form.
Mode of holding as on 31 March
2015
Number of
shares
% of
shares
NSDL 5,19,06,536 95.62
CDSL 23,78,428 4.38
PHYSICAL 146 0.00
TOTAL 5,42,85,110 100
Liquidity
The Company’s Equity Shares are actively traded
shares on both NSE and BSE. Substantial increase in
daily trading activity of the Company’s equity shares
was witnessed during FY 2014-15 as compared to FY
2013 -14.
Outstanding ADRs/GDRs/Warrants or any
Convertible Instruments, conversion date and
likely impact on Equity
The Company has not issued any ADRs/GDRs/
Warrants or any convertible instruments.
Designated Exclusive email-id:
The Company has designated the following
email-id exclusively for investor servicing.
This has also been displayed on the Company’s
website.
Equity Shares in the Suspense Account
In terms of Clause 5A of the Listing Agreement, the
Company reports the following details in respect
of equity shares issued pursuant to Initial Public
Offer (IPO) and are lying in the “VA TECH WABAG
LIMITED” – Unclaimed Shares Demat Suspense
account:
S.no Particulars Number of
shareholders
Number
of equity
shares
1 Aggregate number of
shareholders and the
outstanding shares lying in
the Suspense Account as on
01.04.2014
2 39
2 Number of shareholders who
approached the issuer for
transfer of shares from the
Suspense Account during the
year
- -
3 Number of shareholders to
whom shares were transferred
from the Suspense Account
during the year
- -
4 Aggregate number of
shareholders and the
outstanding shares lying in
the Suspense Account at the
end of 31.03.2015
2 78*
* The voting rights on the shares outstanding in the suspense account
as on 31 March 2015 shall remain frozen till the rightful owner of
such shares claims the shares.

Corporate
Overview
Statutory
Reports
83
Financial
Statements
12.10 Plant Locations:
Plant Locations as on 31.03.2015:
S No Country Locations/Project
1 India Andhra Pradesh, Assam, Chattisgarh, New Delhi, Gujarat, Haryana, Jharkand,
Karnataka, Kerala, Maharashtra, Odisha, Punjab, Rajasthan, Tamil Nadu, Telegana,
Uttar Pradesh, and West Bengal.
2 Austria Vienna
3 Switzerland Vuippens, Muttenz, Lauterbrunnen, Frauenfeld Thunbach, Windisch, Zurich lengg,
Seengen, Bauma, Rute, Ilanz , Reinach, Weesen
4 Czech Prunéřov, Mostiště, Meziboří, Břeclav, Plzeň, Semtin
5 Romania Suplacu, Bucharest, Ploiești, Pitești, Ocna Mures, Auid and Cugir
6 Turkey Istanbul,Adana,Izmir,Polatli, Eskişehir
7 Turkmenistan Sojunali
8 Algeria Beni Messous
9 Bosnia and Herzegovina Bijeljina
10 Bulgaria Vidin
11 Egypt Madinaty,Suez,El Razwa
12 Namibia Windhoek,Ujams
13 Republic of Uzbekistan Ferghana
14 Saudi Arabia Al Kharj Mecca and Madinah
15 Libya Tripoli
16 Tunisia Gafsa , Bizerte & Choutrana
17 Philippines Tunasan,Valenzuela,South Pasig, Illugin, Putatan, Babgbag, Tatalon and Donaimelda.
18 Sri Lanka Dambulla
19 Tanzania Dar es salaam
20 Nigeria Port Harcourt
21 Oman Duqum ,Ibri, Majis, Muscat
22 Bahrain Tubli
23 Qatar Barwa,Doha
24 Singapore Singapore City
25 Macao Macao
26 Germany Miltenberg
27 Spain Antilla
28 China Changchun
29 Malaysia Pahang
Declaration on Code of Conduct
To
The members of VA TECH WABAG LIMITED
This is to confirm that the Board has laid down a Code of Conduct for all Board members and senior management of the
Company.
It is further confirmed that all Directors and senior management personnel of the Company have affirmed compliance with the
Code of Conduct of the Company as at 31 March 2015, as envisaged in clause 49 of the listing Agreement with stock exchanges.
Place : Chennai
Date : 25 May 2015
Rajiv Mittal
Managing Director
84 VA TECH WABAG LIMITED | Annual Report 2014-15
Report on Corporate Governance
CERTIFICATION BY CEO/CFO UNDER CLAUSE 49 IX OF THE LISTING AGREEMENT
To
The Board of Directors of VA TECH WABAG LIMITED
We have reviewed the financial statements and the cash flow
statement of VA TECH WABAG LIMITED for the year ended 31
March 2015 and to the best of our knowledge and belief:
(a) (i) these statements do not contain any materially
untrue statement or omit any material fact or
contain statements that might be misleading;
(ii) these statements together present a true and fair
view of the Company’s affairs and are in compliance
with existing Accounting Standards, applicable
laws and regulations.
(b) There are, to the best of our knowledge and belief, no
transactions entered into by the Company during the
year which are fraudulent, illegal or violative of the
Company’s code of conduct.
(c) We accept responsibility for establishing and maintaining
internal controls for financial reporting and that we have
evaluated the effectiveness of internal control systems
of the Company pertaining to financial reporting and
have disclosed to the Auditors and the Audit Committee,
deficiencies in the design or operation of such internal
controls, if any, of which we are aware and the steps
we have taken or propose to take to rectifying these
deficiencies.
(d) We have indicated to the Auditors and the Audit
committee:
(i) no significant changes in internal control over
financial reporting during the year;
(ii) no significant changes in accounting policies made
during the year except for change in the accounting
policy for providing depreciation on tangible assets
from ‘Written Down Value’ method to ‘Straight Line’
method effective 1 April 2014 in order to reflect a
suitable allocation of cost of tangible and intangible
assets over the pattern in which the economic
benefits are derived from the use of these assets
and resulting in more appropriate presentation of
the financial statements and the same have been
disclosed in the notes to the financial statements;
and
(iii) no instances of significant fraud of which we have
become aware and the involvement therein, if
any, of the management or an employee having a
significant role in the Company’s internal control
system over financial reporting.
Place: Chennai S. Varadarajan Rajiv Mittal
Date: 25 May 2015 Chief Financial Officer Managing Director

Corporate
Overview
Statutory
Reports
85
Financial
Statements
AUDITORS’ CERTIFICATE ON CORPORATE GOVERNANCE
To the Members,
VA TECH WABAG LIMITED
We have examined the compliance of conditions of Corporate Governance by VA TECH WABAG LIMITED (“the Company”) for
the year ended on 31 March 2015, as stipulated in Clause 49 of the Listing Agreement of the said Company with stock exchanges.
The compliance of conditions of Corporate Governance is the responsibility of the management. Our examination was limited
to procedures and implementation thereof, adopted by the Company, for ensuring the compliance of the conditions of the
Corporate Governance. It is neither an audit nor an expression of opinion on the financial statements of the Company.
In our opinion and to the best of our information and according to the explanations given to us and the representations made
by the Directors and the management, we certify that the Company has complied with the conditions of Corporate Governance
as stipulated in of the above- mentioned Listing Agreement.
We further state that such compliance is neither an assurance as to the future viability of the Company nor of the efficiency or
effectiveness with which the management has conducted the affairs of the Company.
For Walker, Chandiok & Co LLP
(Formerly Walker, Chandiok & Co)
Chartered Accountants
Firm Registration No. 001076N/N500013
per Sumesh E S
Partner
Membership No. 206931
Chennai
25 May 2015

86 VA TECH WABAG LIMITED | Annual Report 2014-15
Standalone
Independent Auditors’ Report
To the Members of VA TECH WABAG LIMITED
Report on the Standalone Financial Statements1. We have audited the accompanying standalone
financial statements of VA TECH WABAG LIMITED
(“the Company”), which comprise the Balance Sheet
as at 31 March 2015, the Statement of Profit and Loss,
the Cash Flow Statement for the year then ended, and
a summary of the significant accounting policies and
other explanatory information.
Management’s Responsibility for the Standalone Financial Statements2. The Company’s Board of Directors is responsible for the
matters stated in Section 134(5) of the Companies Act,
2013 (“the Act”) with respect to the preparation of these
standalone financial statements, that give a true and
fair view of the financial position, financial performance
and cash flows of the Company in accordance with
the accounting principles generally accepted in India,
including the Accounting Standards specified under
Section 133 of the Act, read with Rule 7 of the Companies
(Accounts) Rules, 2014 (as amended). This responsibility
also includes maintenance of adequate accounting
records in accordance with the provisions of the Act;
safeguarding the assets of the Company; preventing and
detecting frauds and other irregularities; selection and
application of appropriate accounting policies; making
judgments and estimates that are reasonable and
prudent; and design, implementation and maintenance
of adequate internal financial controls, that were
operating effectively for ensuring the accuracy and
completeness of the accounting records, relevant to the
preparation and presentation of the financial statements
that give a true and fair view and are free from material
misstatement, whether due to fraud or error.
Auditor’s Responsibility3. Our responsibility is to express an opinion on these
standalone financial statements based on our audit.
4. We have taken into account the provisions of the Act, the
accounting and auditing standards and matters which
are required to be included in the audit report under the
provisions of the Act and the Rules made thereunder.
5. We conducted our audit in accordance with the
Standards on Auditing specified under Section 143(10) of
the Act. Those Standards require that we comply with
ethical requirements and plan and perform the audit
to obtain reasonable assurance about whether the
standalone financial statements are free from material
misstatement
6. An audit involves performing procedures to obtain audit
evidence about the amounts and the disclosures in the
financial statements. The procedures selected depend
on the auditor’s judgment, including the assessment
of the risks of material misstatement of the financial
statements, whether due to fraud or error. In making
those risk assessments, the auditor considers internal
financial controls relevant to the Company’s preparation
of the financial statements that give a true and fair view
in order to design audit procedures that are appropriate
in the circumstances, but not for the purpose of
expressing an opinion on whether the Company has in
place an adequate internal financial controls system
over financial reporting and the operating effectiveness
of such controls. An audit also includes evaluating the
appropriateness of the accounting policies used and the
reasonableness of the accounting estimates made by the
Company’s Directors, as well as evaluating the overall
presentation of the financial statements.
7. We believe that the audit evidence we have obtained
is sufficient and appropriate to provide a basis for our
audit opinion on the standalone financial statements.
Opinion8. In our opinion and to the best of our information and
according to the explanations given to us, the aforesaid
standalone financial statements give the information
required by the Act in the manner so required and give
a true and fair view in conformity with the accounting
principles generally accepted in India, of the state of
affairs of the Company as at 31 March 2015, and its profit
and its cash flows for the year ended on that date.
Emphasis of Matter9. We draw attention to notes 3.3(a) and 3.3(b) to the
accompanying financial statements which describe
the uncertainty related to the outcome of litigations in
connection with certain deductions being disallowed
which, according to the management, is due to
retrospective amendment of section 80-IA of the Income
tax Act, 1961 pursuant to Finance Act, 2009. Our opinion
is not qualified in respect of this matter.
Report on Other Legal and Regulatory Requirements10. As required by the Companies (Auditor’s Report) Order,
2015 (“the Order”) issued by the Central Government of
India in terms of Section 143(11) of the Act, we give in
the Annexure a statement on the matters specified in
paragraphs 3 and 4 of the Order.

Corporate
Overview
Statutory
Reports
87
Financial
Statements
11. As required by Section 143(3) of the Act, we report that:
a. we have sought and obtained all the information and
explanations which to the best of our knowledge and
belief were necessary for the purpose of our audit;
b. in our opinion, proper books of account as required by
law have been kept by the Company so far as it appears
from our examination of those books;
c. the standalone financial statements dealt with by this
report are in agreement with the books of account;
d. in our opinion, the aforesaid standalone financial
statements comply with the Accounting Standards
specified under Section 133 of the Act, read with Rule 7 of
the Companies (Accounts) Rules, 2014 (as amended);
e. on the basis of the written representations received
from the directors as on 31 March 2015 and taken on
record by the Board of Directors, none of the directors is
disqualified as on 31 March 2015 from being appointed as
a director in terms of Section 164(2) of the Act;
f. with respect to the other matters to be included in the
Auditor’s Report in accordance with Rule 11 of the
Companies (Audit and Auditors) Rules, 2014, in our
opinion and to the best of our information and according
to the explanations given to us:
i. as detailed in note 3.3 (a) and (b) to the standalone
financial statements, the Company has disclosed the
impact of pending litigations on its standalone financial
position;
ii. the Company, as detailed in Note 8 (b) (iv) to the
standalone financial statements, has made provision,
as required under the applicable law or accounting
standards, for material foreseeable losses, if any, on
long-term contracts including derivative contracts;
iii. there were no amounts which were required to be
transferred to the Investor Education and Protection
Fund by the Company.
For Walker Chandiok & Co LLP
(Formerly Walker, Chandiok & Co)
Chartered Accountants
Firm’s Registration No.: 001076N/N500013
per Sumesh ES
Partner
Membership No.: 206931
Place: Chennai
Date: 25 May 2015

88 VA TECH WABAG LIMITED | Annual Report 2014-15
Standalone
Annexure to the Independent Auditor’s Reportof even date to the members of VA Tech Wabag Limited on the financial statements for the year ended 31 March 2015
Based on the audit procedures performed for the purpose of
reporting a true and fair view on the financial statements of
the Company and taking into consideration the information
and explanations given to us and the books of account and
other records examined by us in the normal course of audit,
we report that:
(i) (a) The Company has maintained proper records
showing full particulars, including quantitative
details and situation of fixed assets.
(b) The Company has a regular program of physical
verification of its fixed assets under which fixed
assets are verified in a phased manner over a period
of three years, which, in our opinion, is reasonable
having regard to the size of the Company and the
nature of its assets. No material discrepancies were
noticed on such verification.
(ii) (a) The management has conducted physical
verification of inventory at reasonable intervals
during the year.
(b) The procedures of physical verification of inventory
followed by the management are reasonable and
adequate in relation to the size of the Company and
the nature of its business.
(c) The Company is maintaining proper records of
inventory and no material discrepancies between
physical inventory and book records were noticed
on physical verification.
(iii) The Company has not granted any loan, secured
or unsecured to companies, firms or other parties
covered in the register maintained under Section
189 of the Act. Accordingly, the provisions of clauses
3(iii)(a) and 3(iii)(b) of the Order are not applicable.
(iv) In our opinion, there is an adequate internal control
system commensurate with the size of the Company
and the nature of its business for the purchase of
inventory and fixed assets and for the sale of goods
and services. During the course of our audit, no
major weakness has been noticed in the internal
control system in respect of these areas.
(v) The Company has not accepted any deposits within
the meaning of Sections 73 to 76 of the Act and the
Companies (Acceptance of Deposits) Rules, 2014 (as
amended). Accordingly, the provisions of clause 3(v)
of the Order are not applicable.
(vi) We have broadly reviewed the books of account
maintained by the Company pursuant to the
Rules made by the Central Government for the
maintenance of cost records under sub-section (1)
of Section 148 of the Act in respect of Company’s
products/service and are of the opinion that, prima
facie, the prescribed accounts and records have
been made and maintained. However, we have not
made a detailed examination of the cost records
with a view to determine whether they are accurate
or complete.
(vii) (a) Undisputed statutory dues including provident
fund, employees’ state insurance, income-tax, sales-
tax, wealth tax, service tax, duty of customs, duty
of excise, value added tax, cess and other material
statutory dues, as applicable, have generally
been regularly deposited with the appropriate
authorities, though there has been a slight delay in a
few cases. Further, no undisputed amounts payable
in respect thereof were outstanding at the year-end
for a period of more than six months from the date
they became payable.
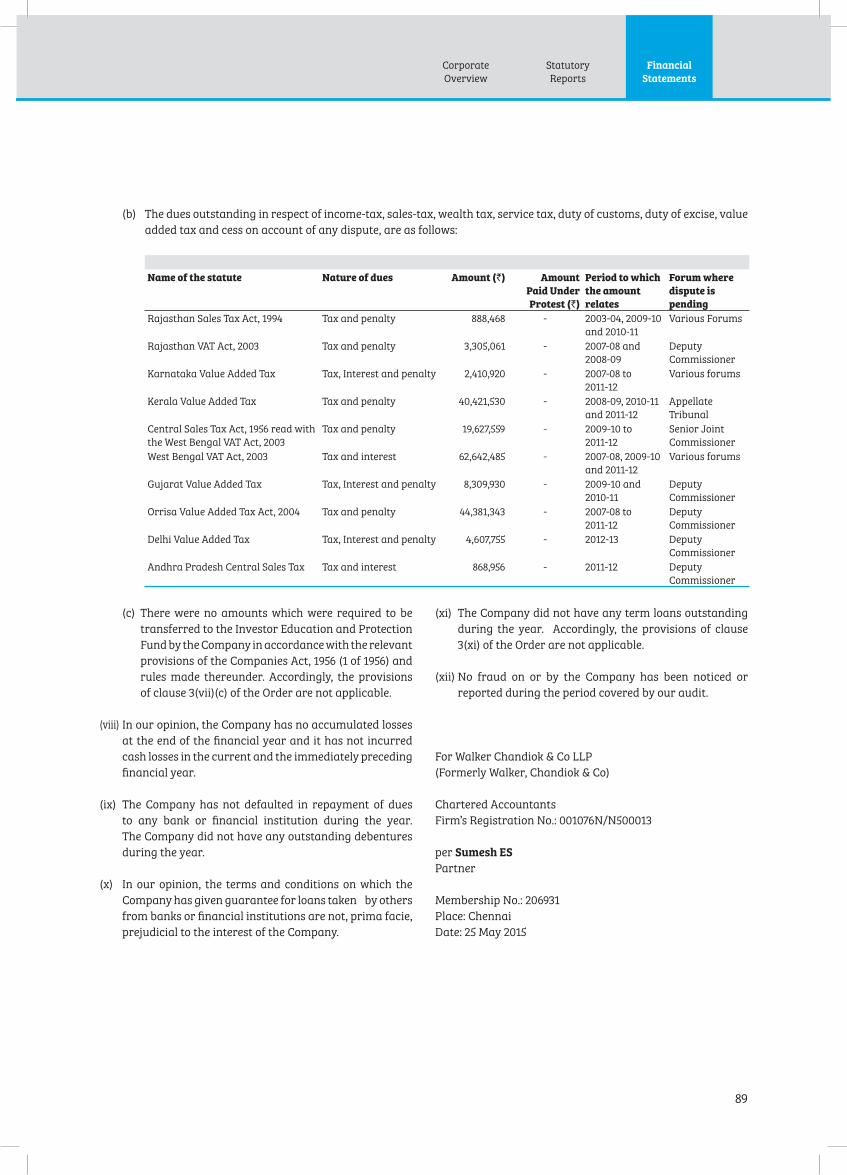
Corporate
Overview
Statutory
Reports
89
Financial
Statements
(b) The dues outstanding in respect of income-tax, sales-tax, wealth tax, service tax, duty of customs, duty of excise, value
added tax and cess on account of any dispute, are as follows:
Name of the statute Nature of dues Amount (`) Amount
Paid Under
Protest (`)
Period to which
the amount
relates
Forum where
dispute is
pending
Rajasthan Sales Tax Act, 1994 Tax and penalty 888,468 - 2003-04, 2009-10
and 2010-11
Various Forums
Rajasthan VAT Act, 2003 Tax and penalty 3,305,061 - 2007-08 and
2008-09
Deputy
Commissioner
Karnataka Value Added Tax Tax, Interest and penalty 2,410,920 - 2007-08 to
2011-12
Various forums
Kerala Value Added Tax Tax and penalty 40,421,530 - 2008-09, 2010-11
and 2011-12
Appellate
Tribunal
Central Sales Tax Act, 1956 read with
the West Bengal VAT Act, 2003
Tax and penalty 19,627,559 - 2009-10 to
2011-12
Senior Joint
Commissioner
West Bengal VAT Act, 2003 Tax and interest 62,642,485 - 2007-08, 2009-10
and 2011-12
Various forums
Gujarat Value Added Tax Tax, Interest and penalty 8,309,930 - 2009-10 and
2010-11
Deputy
Commissioner
Orrisa Value Added Tax Act, 2004 Tax and penalty 44,381,343 - 2007-08 to
2011-12
Deputy
Commissioner
Delhi Value Added Tax Tax, Interest and penalty 4,607,755 - 2012-13 Deputy
Commissioner
Andhra Pradesh Central Sales Tax Tax and interest 868,956 - 2011-12 Deputy
Commissioner
(c) There were no amounts which were required to be
transferred to the Investor Education and Protection
Fund by the Company in accordance with the relevant
provisions of the Companies Act, 1956 (1 of 1956) and
rules made thereunder. Accordingly, the provisions
of clause 3(vii)(c) of the Order are not applicable.
(viii) In our opinion, the Company has no accumulated losses
at the end of the financial year and it has not incurred
cash losses in the current and the immediately preceding
financial year.
(ix) The Company has not defaulted in repayment of dues
to any bank or financial institution during the year.
The Company did not have any outstanding debentures
during the year.
(x) In our opinion, the terms and conditions on which the
Company has given guarantee for loans taken by others
from banks or financial institutions are not, prima facie,
prejudicial to the interest of the Company.
(xi) The Company did not have any term loans outstanding
during the year. Accordingly, the provisions of clause
3(xi) of the Order are not applicable.
(xii) No fraud on or by the Company has been noticed or
reported during the period covered by our audit.
For Walker Chandiok & Co LLP
(Formerly Walker, Chandiok & Co)
Chartered Accountants
Firm’s Registration No.: 001076N/N500013
per Sumesh ES
Partner
Membership No.: 206931
Place: Chennai
Date: 25 May 2015

90 VA TECH WABAG LIMITED | Annual Report 2014-15
Standalone
Balance Sheet
` In Lakhs
NoteAs at
31 March 2015
As at
31 March 2014
EQUITY AND LIABILITIES
Shareholders’ funds
Share capital 4 1,086 532
Reserves and surplus 5 67,534 59,751
68,620 60,283
Share application money pending allotment 6 13 22
Non-current liabilities
Other long-term liabilities 7 20,462 15,488
Long-term provisions 8 1,686 737
22,148 16,225
Current liabilities
Short-term borrowings 9 6,260 8,903
Trade payables 10 55,753 54,443
Other current liabilities 11 9,681 13,614
Short-term provisions 8 8,177 6,737
79,871 83,697
Total 1,70,652 1,60,227
ASSETS
Non-current assets
Fixed assets 12
Tangible assets 9,064 9,275
Intangible assets 780 914
Capital work-in-progress 55 5
Non-current investments 13 2,536 1,842
Deferred tax assets, net 14 2,009 1,047
Long-term loans and advances 15 955 97
Other non-current assets 16 20,886 19,700
36,285 32,880
Current assets
Current investments 17 3,500 2,000
Inventories 18 2,983 1,442
Trade receivables 19 98,331 92,368
Cash and bank balances 20 12,826 15,643
Short-term loans and advances 15 7,417 7,353
Other current assets 21 9,310 8,541
1,34,367 1,27,347
Total 1,70,652 1,60,227
Notes 1 to 42 form an integral part of these financial statements
This is the balance sheet referred to in our report of even date
For Walker Chandiok & Co LLP For and on behalf of the Board of Directors of
(formerly Walker, Chandiok & Co) VA Tech Wabag Limited
Chartered Accountants
per Sumesh E S Rajiv Mittal Sumit Chandwani
Partner Managing Director Director
S Varadarajan Rajiv Balakrishnan
Chief Financial Officer Company Secretary
Place : Chennai Place : Chennai
Date : 25 May 2015 Date : 25 May 2015
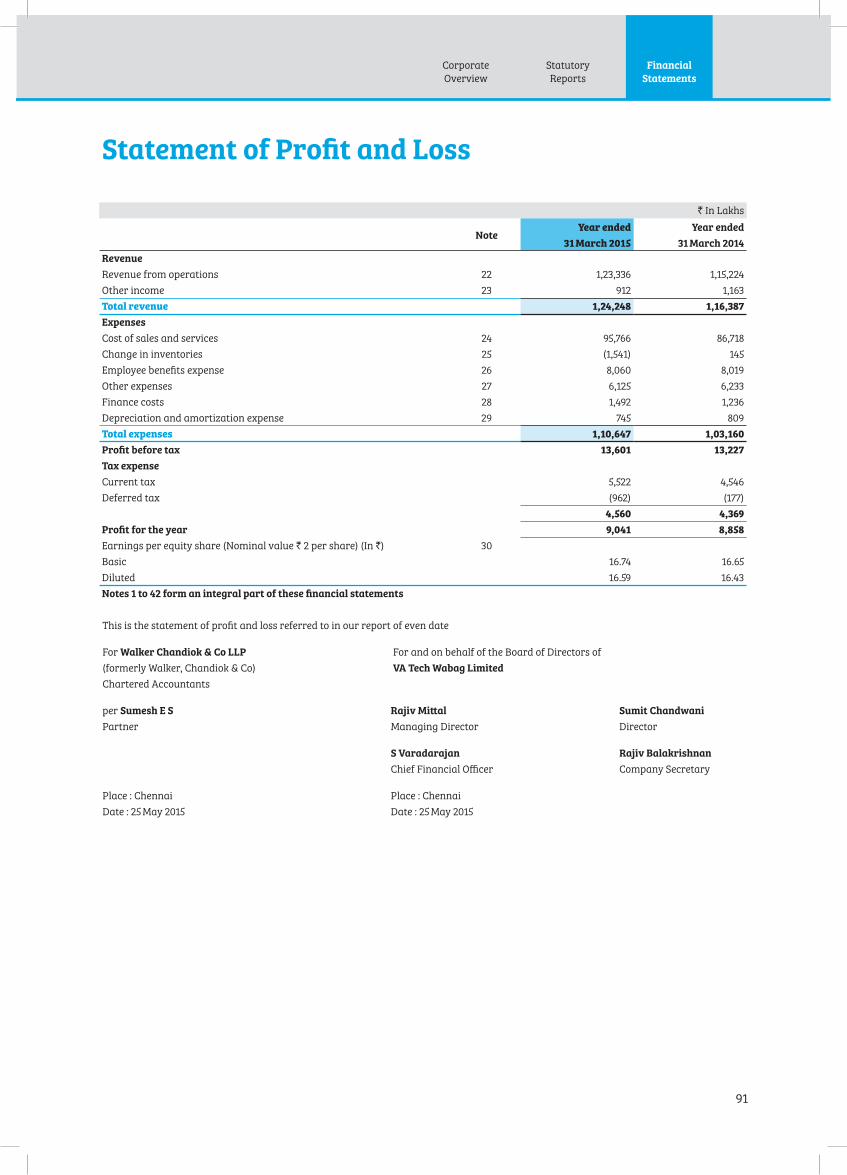
Corporate
Overview
Statutory
Reports
91
Financial
Statements
Statement of Profit and Loss
This is the statement of profit and loss referred to in our report of even date
For Walker Chandiok & Co LLP For and on behalf of the Board of Directors of
(formerly Walker, Chandiok & Co) VA Tech Wabag Limited
Chartered Accountants
per Sumesh E S Rajiv Mittal Sumit Chandwani
Partner Managing Director Director
S Varadarajan Rajiv Balakrishnan
Chief Financial Officer Company Secretary
Place : Chennai Place : Chennai
Date : 25 May 2015 Date : 25 May 2015
` In Lakhs
Note Year ended
31 March 2015
Year ended
31 March 2014
Revenue
Revenue from operations 22 1,23,336 1,15,224
Other income 23 912 1,163
Total revenue 1,24,248 1,16,387
Expenses
Cost of sales and services 24 95,766 86,718
Change in inventories 25 (1,541) 145
Employee benefits expense 26 8,060 8,019
Other expenses 27 6,125 6,233
Finance costs 28 1,492 1,236
Depreciation and amortization expense 29 745 809
Total expenses 1,10,647 1,03,160
Profit before tax 13,601 13,227
Tax expense
Current tax 5,522 4,546
Deferred tax (962) (177)
4,560 4,369
Profit for the year 9,041 8,858
Earnings per equity share (Nominal value ` 2 per share) (In `) 30
Basic 16.74 16.65
Diluted 16.59 16.43
Notes 1 to 42 form an integral part of these financial statements

92 VA TECH WABAG LIMITED | Annual Report 2014-15
Standalone
Cash Flow Statement
` In Lakhs
Year ended
31 March 2015
Year ended
31 March 2014
A. Cash flow from operating activities
Net Profit before tax 13,601 13,227
Adjustments for:
Depreciation and amortization 745 809
Interest expenses 689 545
Interest and dividend income (912) (1,161)
Unrealised forex gain, net (366) (556)
(Profit)/Loss on sale of tangible assets, net 34 (2)
Bad debts and provision for bad and doubtful debts 2,201 2,355
Expense on Employee Stock Option Plan (ESOP) 77 127
Provison for foreseeable losses on contracts 2,899 1,078
Provision for compensated absences and gratuity 308 235
Provision for litigation - (81)
Provision for liquidated damages 2,252 -
Provision for warranty 949 8,876 (352) 2,997
Operating profit before working capital changes 22,477 16,224
Adjustments for:
(Increase) in trade receivables (7,798) (15,934)
(Increase)/Decrease in short term loans and advances (859) 2,130
(Increase)/Decrease in long term loans and advances (340) 4
(Increase) / Decrease in inventory (1,541) 145
(Increase) in other current assets (596) (1,310)
(Increase) in non-current assets (1,390) (8,265)
Increase in trade payables 1,310 1,087
(Decrease) in short-term provisions (4,328) (750)
(Decrease) in long-term provisions (307) (43)
(Decrease)/ increase in other current liabilities (3,870) 6,261
Increase in other long term liabilities 4,974 (14,745) 7,508 (9,167)
Cash generated from operations 7,732 7,057
Direct taxes paid (4,648) (5,430)
Net cash generated from operating activities 3,084 1,627
B. Cash flow from investing activities
Purchase of assets (including capital work in progress and capital advances) (1,148) (3,647)
Proceeds on disposal of assets 32 30
Purchase of non-current investments (289) (306)
Purchase of current investments (2,500) (2,000)
Proceeds on sale of current investments 1,000 -
Movement in bank deposits 3,455 2,394
Interest and dividend received 739 152
Net cash used in investing activities 1,289 (3,377)

Corporate
Overview
Statutory
Reports
93
Financial
Statements
` In Lakhs
Year ended
31 March 2015
Year ended
31 March 2014
C. Cash flow from financing activities
Proceeds from issue of share capital including share premium and share
application money 1,957 147
Repayment of short term borrowings (38,478) (20,546)
Proceeds from short term borrowings 35,835 23,998
Interest paid to banks and others (751) (612)
Dividend paid (2,139) (1,857)
Dividend distribution tax paid (363) (316)
Net cash used in financing activities (3,939) 814
D. Net cash flows during the year 434 (936)
E. Cash and cash equivalents at the beginning 11,929 12,865
F. Cash and cash equivalents at the end 12,363 11,929
Cash and cash equivalents comprise of:
Cash on hand 36 38
Cheques on hand 9,088 5,714
Balances with banks - in current accounts 1,851 1,857
Balances with banks - in deposit accounts (maturity upto 3 months) 1,388 4,320
Cash and cash equivalents as per note 20 12,363 11,929
This is the cash flow statement referred to in our report of even date
For Walker Chandiok & Co LLP For and on behalf of the Board of Directors of
(formerly Walker, Chandiok & Co) VA Tech Wabag Limited
Chartered Accountants
per Sumesh E S Rajiv Mittal Sumit Chandwani
Partner Managing Director Director
S Varadarajan Rajiv Balakrishnan
Chief Financial Officer Company Secretary
Place : Chennai Place : Chennai
Date : 25 May 2015 Date : 25 May 2015
94 VA TECH WABAG LIMITED | Annual Report 2014-15
Summary of Significant Accounting Policies and other Explanatory Information
Standalone
1 General Information VA Tech Wabag Limited (‘the Company’), its subsidiaries,
associates and joint ventures (collectively referred to as
‘the Group’) is one of the world’s leading companies in
the water treatment field. The group’s principal activities
include design, supply, installation, construction and
operational management of drinking water, waste
water treatment , industrial water treatment and
desalination plants. The shares of the Company are
listed in the Bombay Stock Exchange (BSE) and National
Stock Exchange (NSE).
All amounts in the standalone financial statements
are presented in Rupees in lakhs except per share data
and as otherwise stated. Figures for the previous year
have been regrouped / rearranged wherever considered
necessary to conform to the figures presented in the
current year.
The Company is in the business of execution of
turnkey projects for water management and hence the
requirements under paragraph 5(ii)(a), 5(ii)(b) and 5(ii)
(d) of Part II of Schedule III to the Companies Act, 2013
are not applicable.
2 Summary of accounting policies 2.1 Basis of accounting
These standalone financial statements are prepared
under the historic cost convention on accrual basis
of accounting in accordance with generally accepted
accounting principles (“GAAP”) applicable in India.
GAAP comprises mandatory accounting standards
prescribed under Section 133 of the Companies Act,
2013 read with Rule 7 of the Companies (Accounts)
Rules, 2014 (as amended) and pronouncements of
the Institute of Chartered Accountants of India and
guidelines issued by the Securities and Exchange
Board of India (SEBI). Accounting policies have been
consistently applied as in the previous year except
for the change in accounting policy explained in
note 12 (c). The management evaluates all recently
issued or revised accounting standards on an
ongoing basis.
2.2 Use of estimates
The preparation of standalone financial statements
in conformity with generally accepted accounting
principles requires management to make estimates
and assumptions that affect the reported amounts
of assets and liabilities and the disclosure of
contingent assets and liabilities on the date of the
standalone financial statements and the results of
operations during the reporting periods. Significant
estimates include percentage of completion of
contracts, estimate of costs to complete, provision
for doubtful receivables and loans and advances,
income taxes, future obligations under employee
benefit plans, estimated useful life of tangible and
intangible assets, provision for warranty, liquidated
damages and litigations. Although these estimates
are based upon management’s best knowledge of
current events and actions, actual results could
differ from those estimates and any revisions to
accounting estimates is recognised prospectively in
the current and future periods.
Assets and liabilities are classified as current or
non-current as per Company’s normal operating
cycle and other criteria set out in Schedule III to
the Act. Based on the nature of work, the Company
has ascertained its operating cycle as upto twelve
months for the purpose of current and non-current
classification of assets and liabilities.
2.3 Tangible assets and depreciation
Tangible assets are stated at acquisition cost less
accumulated depreciation and impairment losses, if
any. Cost of acquisition comprises of purchase price
and directly attributable costs of bringing the asset
to its working condition for the intended use and
is net of refundable duties and taxes as applicable.
Cost of tangible assets not ready for the intended
use before such date is disclosed as capital work in
progress.
Subsequent expenditure incurred on an item of
tangible asset is added to the book value of that
asset only if this increases the future benefits from
the existing asset beyond its previously assessed
standard of performance.
Gains or losses that arise on disposal or retirement
of an asset are measured as the difference between
net disposal proceeds and the carrying value of an
asset and are recognised in the statement of profit
and loss when the asset is derecognised.
Depreciation on assets is provided on straight line
method at the rates and in the manner prescribed
in Schedule II to the Companies Act, 2013 except
for vehicles where the management believes that
the useful life of 5 years would best represent the
period over which the Management expects to use
these assets. Hence the useful life of these assets
is different from that prescribed under Part C of
Schedule II to the Companies Act, 2013. During

Corporate
Overview
Statutory
Reports
95
Financial
Statements
the year the Company has changed the policy of
depreciation from written down value method to
straight line method [Also refer note 12 (c ) and (d)]
Tangible assets held for sale or retired from active
use are stated at the lower of their net book value
and net realisable value and shown separately in
the standalone financial statements. In addition,
any expected loss is recognized immediately in the
statement of profit and loss.
2.4 Intangible assets and amortization
Intangible assets acquired separately are measured
on initial recognition at cost. Following initial
recognition, the intangible assets are carried at cost
less accumulated amortization and accumulated
impairment, if any.
Software is stated at cost less accumulated
amortization and are being amortised on a straight
line basis over the estimated useful life of 5 years.
Gains or losses that arise on disposal or retirement
of an intangible asset are measured as the difference
between net disposal proceeds and the carrying
value of an intangible asset and are recognised in
the statement of profit and loss when the intangible
asset is derecognised.
The amortization period and method are reviewed at
each balance sheet date. If the expected useful life of
the asset is significantly different from the previous
estimates, the amortization period is changed
accordingly. If there has been a significant change
in the expected pattern of economic benefit from
the asset, the method of amortization is changed
to reflect the changed pattern. Such changes are
accounted in accordance with Accounting Standard
(AS) 5, Net Profit or Loss for the Period, Prior Period
Items and Changes in Accounting Policies.
2.5 Impairment of assets
The Company assesses at each balance sheet date
whether there is any indication that an asset may
be impaired. If any such indication exists, the
Company estimates the recoverable amount of the
asset. An asset’s recoverable amount is the higher
of an asset’s or cash generating unit’s net selling
price and its value in use. Recoverable amount is
determined for an individual asset, unless the asset
does not generate cash inflows from continuing
use that are largely independent of those from
other assets or group of assets. If such recoverable
amount of the asset or the recoverable amount of
the cash generating unit to which the asset belongs
is less than its carrying amount, the carrying
amount is reduced to its recoverable amount and
the reduction is treated as an impairment loss and
is recognised in the statement of profit and loss. If
at the balance sheet date there is an indication that
a previously assessed impairment loss no longer
exists, the recoverable amount is reassessed and the
asset is reflected at the recoverable amount subject
to a maximum of depreciated historical cost and is
accordingly reversed in the statement of profit and
loss.
2.6 Investments
Investments that are readily realizable and are
intended to be held for not more than one year
from the date on which such investments are made
are classified as current investments. All other
investments are classified as long-term investments.
Long-term investments are valued at cost. Provision
is made for diminution in value to recognize a
decline, if any, other than that of temporary in
nature. Current investments are valued at lower
of cost and fair market value. Gains or losses that
arise on disposal of an investment are measured as
the difference between disposal proceeds and the
carrying value and are recognised in the statement
of profit and loss.
2.7 Inventories
Inventory of stores and spares are stated at lower of
cost and net realizable value and is determined on
weighted average cost method. Net realisable value
is the estimated selling price in the ordinary course
of business less estimated cost to completion and
applicable selling expenses.
Construction work in progress are contract costs
incurred for a future activity on a contract and are
recognized as an asset if it is probable that they
would be recovered. The cost comprises of material
and other expenses directly attributable to the
contract.
2.8 Revenue recognition
Revenue is measured on the basis of consideration
received or receivable by the Company for goods
supplied and services provided, excluding trade
discounts, VAT and other applicable taxes and are
recognised upon the performance of service or
transfer of risk to the customer.
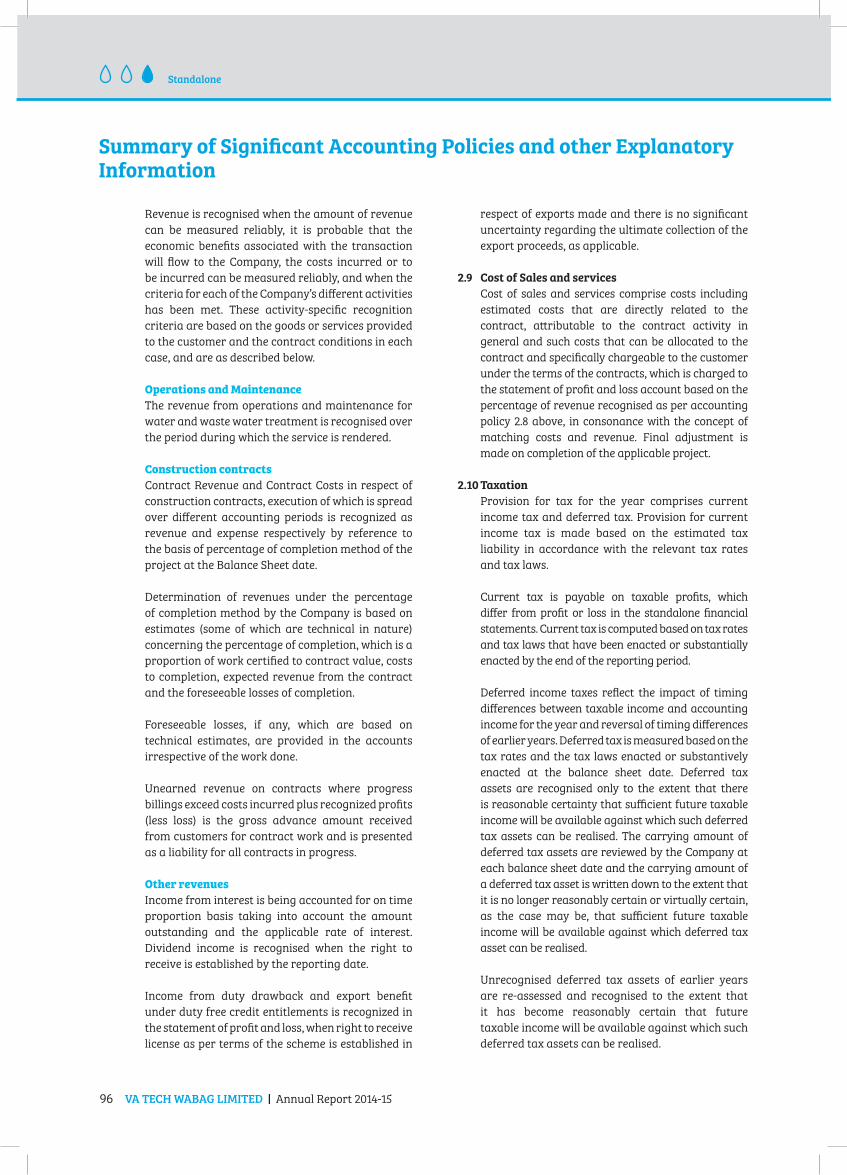
96 VA TECH WABAG LIMITED | Annual Report 2014-15
Summary of Significant Accounting Policies and other Explanatory Information
Standalone
Revenue is recognised when the amount of revenue
can be measured reliably, it is probable that the
economic benefits associated with the transaction
will flow to the Company, the costs incurred or to
be incurred can be measured reliably, and when the
criteria for each of the Company’s different activities
has been met. These activity-specific recognition
criteria are based on the goods or services provided
to the customer and the contract conditions in each
case, and are as described below.
Operations and Maintenance
The revenue from operations and maintenance for
water and waste water treatment is recognised over
the period during which the service is rendered.
Construction contracts
Contract Revenue and Contract Costs in respect of
construction contracts, execution of which is spread
over different accounting periods is recognized as
revenue and expense respectively by reference to
the basis of percentage of completion method of the
project at the Balance Sheet date.
Determination of revenues under the percentage
of completion method by the Company is based on
estimates (some of which are technical in nature)
concerning the percentage of completion, which is a
proportion of work certified to contract value, costs
to completion, expected revenue from the contract
and the foreseeable losses of completion.
Foreseeable losses, if any, which are based on
technical estimates, are provided in the accounts
irrespective of the work done.
Unearned revenue on contracts where progress
billings exceed costs incurred plus recognized profits
(less loss) is the gross advance amount received
from customers for contract work and is presented
as a liability for all contracts in progress.
Other revenues
Income from interest is being accounted for on time
proportion basis taking into account the amount
outstanding and the applicable rate of interest.
Dividend income is recognised when the right to
receive is established by the reporting date.
Income from duty drawback and export benefit
under duty free credit entitlements is recognized in
the statement of profit and loss, when right to receive
license as per terms of the scheme is established in
respect of exports made and there is no significant
uncertainty regarding the ultimate collection of the
export proceeds, as applicable.
2.9 Cost of Sales and services
Cost of sales and services comprise costs including
estimated costs that are directly related to the
contract, attributable to the contract activity in
general and such costs that can be allocated to the
contract and specifically chargeable to the customer
under the terms of the contracts, which is charged to
the statement of profit and loss account based on the
percentage of revenue recognised as per accounting
policy 2.8 above, in consonance with the concept of
matching costs and revenue. Final adjustment is
made on completion of the applicable project.
2.10 Taxation
Provision for tax for the year comprises current
income tax and deferred tax. Provision for current
income tax is made based on the estimated tax
liability in accordance with the relevant tax rates
and tax laws.
Current tax is payable on taxable profits, which
differ from profit or loss in the standalone financial
statements. Current tax is computed based on tax rates
and tax laws that have been enacted or substantially
enacted by the end of the reporting period.
Deferred income taxes reflect the impact of timing
differences between taxable income and accounting
income for the year and reversal of timing differences
of earlier years. Deferred tax is measured based on the
tax rates and the tax laws enacted or substantively
enacted at the balance sheet date. Deferred tax
assets are recognised only to the extent that there
is reasonable certainty that sufficient future taxable
income will be available against which such deferred
tax assets can be realised. The carrying amount of
deferred tax assets are reviewed by the Company at
each balance sheet date and the carrying amount of
a deferred tax asset is written down to the extent that
it is no longer reasonably certain or virtually certain,
as the case may be, that sufficient future taxable
income will be available against which deferred tax
asset can be realised.
Unrecognised deferred tax assets of earlier years
are re-assessed and recognised to the extent that
it has become reasonably certain that future
taxable income will be available against which such
deferred tax assets can be realised.

Corporate
Overview
Statutory
Reports
97
Financial
Statements
The Company offsets deferred tax assets and
deferred tax liabilities if the Company has a legally
enforceable right to set off assets against liabilities
representing current tax.
2.11 Borrowing cost
Borrowing cost includes interest incurred in
connection with the arrangement of borrowings.
Borrowings costs directly attributable to the
construction of an asset that necessarily takes
a substantial period of time to get ready for its
intended use are capitalized as part of the cost of
the respective asset. All other borrowing costs are
expensed in the period they are incurred.
2.12 Foreign currency translations
Transactions in foreign currency and non-monetary
assets are accounted for at the exchange rate
prevailing on the date of the transaction duly
approximated. All monetary items denominated
in foreign currency are converted at the year-end
exchange rate. The exchange differences arising on
such conversion and on settlement of the transactions
are dealt with in the statement of profit and loss.
Gain or loss on forward exchange contract, not
in the nature of hedge, is calculated based on
difference between forward rate available at the
reporting date for the remaining maturity of the
contract and the contracted forward rate. The
premium or discount arising at the inception of
forward exchange contracts is amortised as income
or expense over the life of contract and exchange
differences on such contracts is recognised as
income or expense in the reporting period in which
the exchange rate change.
2.13 Retirement and other employee benefits
Provident fund
The Company makes contribution to the statutory
provident fund in accordance with Employees
Provident Fund and Miscellaneous Provisions Act,
1952, which is a defined contribution plan, and
contribution paid or payable is recognized as an
expense in the period in which it falls due.
Gratuity
Gratuity is a post employment benefit and is in the
nature of a defined benefit obligation. The liability
recognised in the balance sheet in respect of gratuity
is the present value of the defined benefit obligation
at the balance sheet date less the fair value of plan
assets. The defined benefit obligation is calculated
at the balance sheet date by an independent actuary
using the projected unit credit method. Actuarial
gains and losses arising from past experience and
changes in actuarial assumptions are charged or
credited to the statement of profit and loss in the
year in which such losses or gains are determined.
Compensated absences
Liability in respect of compensated absences
becoming due or expected to be availed after the
balance sheet date is estimated on the basis of an
actuarial valuation performed by an independent
actuary using the projected unit credit method.
Actuarial gains and losses arising from past
experience and changes in actuarial assumptions
are charged or credited to the statement of profit
and loss in the year in which such losses or gains are
determined. Accumulated compensated absences
which are expected to be availed or encashed
beyond 12 month from the end of the year end are
treated as other long term employee benefits.
Superannuation Fund
Contribution made towards Superannuation
Fund (funded by payments to ICICI Prudential Life
Insurance) which is a defined contribution plan, is
charged as expenses on accrual basis. There are
no obligations other than the contribution made to
respective fund.
2.14 Employees Stock Option Plan
The accounting value of stock options is determined
on the basis of “intrinsic value” representing the
excess of the market price on the date of grant over
the exercise price of the shares granted under the
“Employees Stock Option Scheme” of the Company,
and is being amortised as “Deferred employees
compensation” on a straight-line basis over the
vesting period in accordance with the Guidance
Note 18 “Employee share-based payments” issued
by the Institute of Chartered Accountants of India
and Securities and Exchange Board of India (share-
based employee benefits) Regulations, 2014.
2.15 Contingent liabilities and provisions
A provision is recognised when the Company has
a present obligation as a result of past event i.e.,
it is probable that an outflow of resources will
be required to settle the obligation in respect of
which a reliable estimate can be made. Provisions
are not discounted to its present value and are
determined based on best estimate required to settle
the obligation at the Balance Sheet date. These are

98 VA TECH WABAG LIMITED | Annual Report 2014-15
Summary of Significant Accounting Policies and other Explanatory Information
Standalone
reviewed at each Balance Sheet date and adjusted to
reflect the current best estimates. A disclosure of the
contingent liability is made when there is a possible
or a present obligation that may, but probably will
not, require an outflow of resources.
2.16 Cash and Cash equivalents
In the cash flow statement, cash and cash equivalent
includes cash in hand, cheques on hand, balances
with banks in current accounts and other short term
highly liquid investments with original maturities of
three months or less.
2.17 Earnings per share
Basic earnings per share is calculated by dividing the
net profit or loss for the period attributable to equity
shareholders (after deducting preference dividends
and attributable taxes, if any) by the weighted
average number of equity shares outstanding
during the period. The weighted average number
of equity shares outstanding during the period is
adjusted for events including a bonus issue, bonus
element in a rights issue to existing shareholders,
share split and reverse share split (consolidation
of shares). In this scenario, the number of equity
shares outstanding increases without an increase
in resources due to which the number of equity
shares outstanding before the event is adjusted for
the proportionate change in the number of equity
shares outstanding as if the event had occurred at
the beginning of the earliest period reported. .For the
purpose of calculating diluted earnings per share,
the net profit or loss for the period attributable
to equity shareholders and the weighted average
number of shares outstanding during the period
are adjusted for the effects of all dilutive potential
equity shares.
2.18 Leases
Leases where the lessor effectively retains, substantially all
the risks and benefits of ownership of the leased term, are
classified as operating leases. Operating lease payments
are recognized as an expense in the statement of profit and
loss on a straight-line basis over the lease term.
3 Others 3.1 Capital Commitments
The estimated amount of contracts to be executed on capital account and not provided for, (net of advances) ` 516
lakhs (Previous year – Nil). Other commitments are cancellable at the option of the Company and hence not disclosed.
3.2 Guarantees
` In Lakhs
As at
31 March 2015
As at
31 March 2014
Corporate Guarantees issued by the Company on behalf of its subsidiary/ third party
- For VA Tech Wabag GmbH, Vienna 9,171 14,292
- For VA Tech Wabag Muscat LLC, Oman 812 777
- For VA Tech Wabag (Philippines) Inc 2,504 1,196
- For Ujams Waste Water Treatment Company (pty) Ltd 6,213 7,742
- For Ferrovial Agroman 43,842 41,886
- For VA Tech Wabag Tecknolojisi Ve Ticaret Limited, Turkey 3,568 -
- For International Water Treatment LLC, Oman 20,408 25,474
3.3 Contingent liabilities
` In Lakhs
As at
31 March 2015
As at
31 March 2014
Income tax impact on account of non-deductibility U/s 80-IA (Refer ‘a’ below) 2,422 2,422
Out of the above, Income tax demand contested in appeal 939 939
Interest U/s 234B on the tax liability referred above (Refer ‘b’ below) 2,559 2,263
Sales tax matters under dispute (Refer ‘c’ below) 1,875 1,913

Corporate
Overview
Statutory
Reports
99
Financial
Statements
a) The Company had been claiming deduction
under section 80-IA of the Income Tax Act, 1961
from the financial year ended 31 March 2002 as
a developer of infrastructure projects in India.
The Finance Act 2009 amended the provisions
of Section 80-IA retrospectively with effect
from 1 April 2000 to make it inapplicable for
persons having a mere works contract with
the government or statutory authority. The
Company believes that this amendment is in
line with the objective of the government of
incentivising only a developer of infrastructure
facility and not a mere works contractor.
The Company strongly opines that, being
a developer of infrastructure turnkey
development contracts starting from the
conceptualisation to execution assuming
significant financial commitment and risks, the
Company would be treated as a developer and
the amendment would not apply to it. Based
on a legal opinion from a Senior Counsel, the
Company has filed a writ petition in the High
Court of Madras challenging the Constitutional
validity of the retrospective amendment. The
Company has subsequently received favourable
Appellate Orders from CIT (Appeals) from FY
2001-02 to FY 2006-07 allowing the benefit under
section 80-IA of the Income Tax Act, while, the
Income Tax department has raised a demand
for ` 939 Lakhs denying benefit under section
80-IA for FY 2008-09. Further to this, the Income
Tax department had gone on appeal against the
CIT (Appeals) order and is currently pending at
the Income Tax Appellate Tribunal. Considering
these facts and as a matter of prudence, the
Company has disclosed the total tax benefit
so far claimed u/s 80-IA as contingent liability
in the standalone financial statements for 31
March 2015.
However, on a conservative basis the liability
on account of possible denial of deduction
prospectively from 1 April 2009 has been fully
provided as current tax in the respective years.
b) The Company, also based on an opinion taken
from a professional firm believes that the
interest under section 234B on account of 80-IA
disallowance discussed in paragraph ‘a’ above
amounting to ` 2,559 Lakhs as at 31 March 2015
would not be payable as the Jurisdictional High
Court rulings and various assessment orders
commencing from FY 2001-02 are in favour of
the Company on this aspect and on this basis,
the amount of interest has been disclosed as
contingent liability.
c) The additional liability assessed by sales tax
authorities for various financial years from
FY 2003-04 to FY 2012-13 amounts to ` 1,875 Lakhs.
3.4 Transfer Pricing
As per the Transfer pricing norms introduced in
India with effect from 1 April 2001, the Company is
required to use certain specific methods in computing
arm’s length price of international transactions
between the associated enterprises and maintain
prescribed information and documents relating to
such transactions. The appropriate method to be
adopted will depend on the nature of transactions/
class of transactions, class of associated persons,
functions performed and other factors, which have
been prescribed. The Transfer pricing study for
the fiscal year ended 31 March 2015 is in progress
and accordingly, the contracts may be amended
subsequently and related adjustment, if any, will be
quantified upon completion of this study. However,
in the opinion of the Management, the outcome
of the study will not have material impact on the
Company’s results.
3.5 Corporate Social Responsibility
As mandated by Section 135 of the Companies
Act, 2013, the company has constituted a CSR
committee. The company has identified areas for
its CSR activities as specified in schedule VII of the
Companies Act, 2013 and incurred expenses as
disclosed in Note 27 to these financial statements
towards such activities.

100 VA TECH WABAG LIMITED | Annual Report 2014-15
Summary of Significant Accounting Policies and other Explanatory Information
Standalone
` In Lakhs
As at
31 March 2015
As at
31 March 2014
Nos. Amount Nos. Amount
4 Share capital
Authorised
Equity Shares of ` 2 each 7,50,00,000 1,500 5,08,75,000 1,018
Preference shares of ` 10 each - - 48,25,000 482
Issued, subscribed and fully paid up
Equity Shares of ` 2 each 5,42,85,110 1,086 2,65,92,130 532
5,42,85,110 1,086 2,65,92,130 532
a) Reconciliation of share capital (Equity)
Balance at the beginning of the year 2,65,92,130 532 2,65,45,772 531
Add : Issued pursuant to Employee Stock Option Plan 5,50,425 11 46,358 1
Add : Issued pursuant to Bonus issue (Also refer note 4(e)) 2,71,42,555 543 - -
Balance at the end of the year 5,42,85,110 1,086 2,65,92,130 532
b) Shareholders holding more than 5% of the aggregate shares in the Company
Nos. % holding Nos. % holding
Equity Shares of ` 2 each
Mr. Rajiv Mittal (Managing Director) 97,09,406 18% 48,54,703 18%
IDFC Premier Equity Fund 39,37,178 7% 19,37,417 7%
Emerging Markets Growth Fund Inc. 14,66,254 3% 15,84,552 6%
1,51,12,838 83,76,672
c) Details of shares issued as fully paid up by way of bonus issues
Year Face value Number of shares
Equity Shares
During YE 31 March 2015 2 2,71,42,555
d) Terms/ rights attached to equity shares
The Company has issued only one class of equity shares having a face value of ` 2 per share. Each holder of equity
shares is entitled to one vote per share. The Company declares and pays dividends in Indian Rupees. The dividend
proposed by the Board of Directors, if any, is subject to the approval of the shareholders in the ensuing Annual General
Meeting, except interim dividend, which was approved by the Board of Directors.
In the event of liquidation, the holders of equity shares will be entitled to receive remaining assets of the Company,
after distribution of all preferential amounts, if any. The distribution will be in proportion to the number of equity
shares held by the shareholders.
During the year ended 31 March 2015, the amount of dividend per share, recognised as distributions to the equity
shareholders of face value ` 2 each was ` 4 (Previous year : ` 8).
e) Bonus issue
The Company has allotted 2,71,42,555 fully paid up equity shares of face value ` 2 each during the year ended 31 March
2015, pursuant to the bonus issue approved by the shareholders through postal ballot by capitalization of share
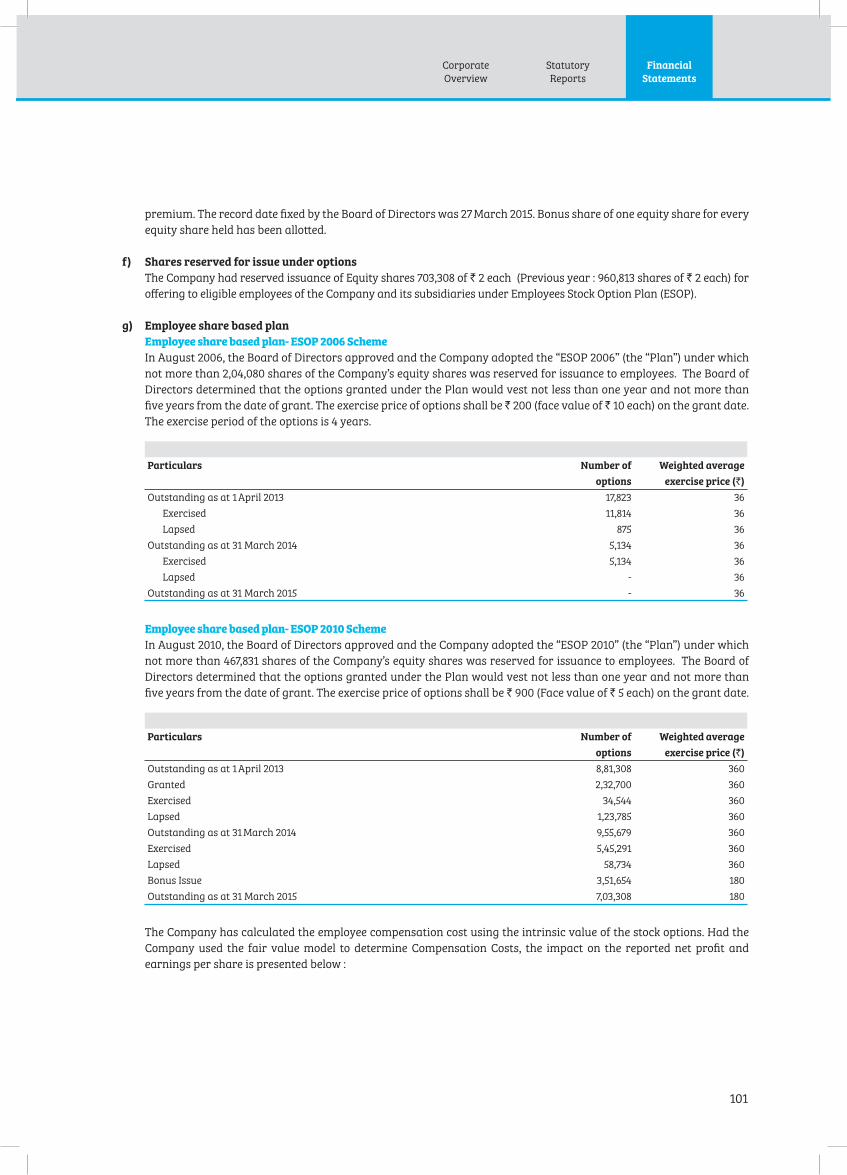
Corporate
Overview
Statutory
Reports
101
Financial
Statements
premium. The record date fixed by the Board of Directors was 27 March 2015. Bonus share of one equity share for every
equity share held has been allotted.
f) Shares reserved for issue under options
The Company had reserved issuance of Equity shares 703,308 of ` 2 each (Previous year : 960,813 shares of ` 2 each) for
offering to eligible employees of the Company and its subsidiaries under Employees Stock Option Plan (ESOP).
g) Employee share based plan
Employee share based plan- ESOP 2006 Scheme
In August 2006, the Board of Directors approved and the Company adopted the “ESOP 2006” (the “Plan”) under which
not more than 2,04,080 shares of the Company’s equity shares was reserved for issuance to employees. The Board of
Directors determined that the options granted under the Plan would vest not less than one year and not more than
five years from the date of grant. The exercise price of options shall be ` 200 (face value of ` 10 each) on the grant date.
The exercise period of the options is 4 years.
Particulars Number of
options
Weighted average
exercise price (`)
Outstanding as at 1 April 2013 17,823 36
Exercised 11,814 36
Lapsed 875 36
Outstanding as at 31 March 2014 5,134 36
Exercised 5,134 36
Lapsed - 36
Outstanding as at 31 March 2015 - 36
Employee share based plan- ESOP 2010 Scheme
In August 2010, the Board of Directors approved and the Company adopted the “ESOP 2010” (the “Plan”) under which
not more than 467,831 shares of the Company’s equity shares was reserved for issuance to employees. The Board of
Directors determined that the options granted under the Plan would vest not less than one year and not more than
five years from the date of grant. The exercise price of options shall be ` 900 (Face value of ` 5 each) on the grant date.
Particulars Number of
options
Weighted average
exercise price (`)
Outstanding as at 1 April 2013 8,81,308 360
Granted 2,32,700 360
Exercised 34,544 360
Lapsed 1,23,785 360
Outstanding as at 31 March 2014 9,55,679 360
Exercised 5,45,291 360
Lapsed 58,734 360
Bonus Issue 3,51,654 180
Outstanding as at 31 March 2015 7,03,308 180
The Company has calculated the employee compensation cost using the intrinsic value of the stock options. Had the
Company used the fair value model to determine Compensation Costs, the impact on the reported net profit and
earnings per share is presented below :
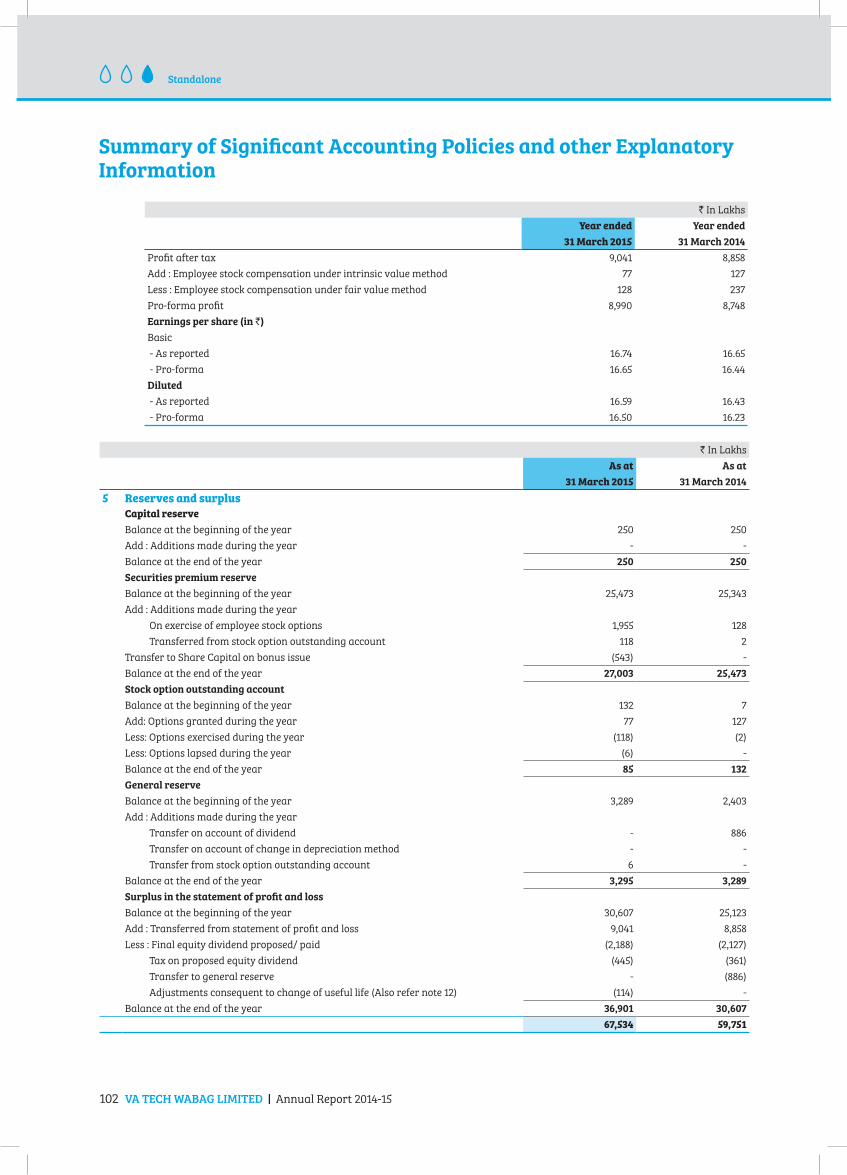
102 VA TECH WABAG LIMITED | Annual Report 2014-15
Summary of Significant Accounting Policies and other Explanatory Information
Standalone
` In Lakhs
Year ended
31 March 2015
Year ended
31 March 2014
Profit after tax 9,041 8,858
Add : Employee stock compensation under intrinsic value method 77 127
Less : Employee stock compensation under fair value method 128 237
Pro-forma profit 8,990 8,748
Earnings per share (in `)
Basic
- As reported 16.74 16.65
- Pro-forma 16.65 16.44
Diluted
- As reported 16.59 16.43
- Pro-forma 16.50 16.23
` In Lakhs
As at
31 March 2015
As at
31 March 2014
5 Reserves and surplus
Capital reserve
Balance at the beginning of the year 250 250
Add : Additions made during the year - -
Balance at the end of the year 250 250
Securities premium reserve
Balance at the beginning of the year 25,473 25,343
Add : Additions made during the year
On exercise of employee stock options 1,955 128
Transferred from stock option outstanding account 118 2
Transfer to Share Capital on bonus issue (543) -
Balance at the end of the year 27,003 25,473
Stock option outstanding account
Balance at the beginning of the year 132 7
Add: Options granted during the year 77 127
Less: Options exercised during the year (118) (2)
Less: Options lapsed during the year (6) -
Balance at the end of the year 85 132
General reserve
Balance at the beginning of the year 3,289 2,403
Add : Additions made during the year
Transfer on account of dividend - 886
Transfer on account of change in depreciation method - -
Transfer from stock option outstanding account 6 -
Balance at the end of the year 3,295 3,289
Surplus in the statement of profit and loss
Balance at the beginning of the year 30,607 25,123
Add : Transferred from statement of profit and loss 9,041 8,858
Less : Final equity dividend proposed/ paid (2,188) (2,127)
Tax on proposed equity dividend (445) (361)
Transfer to general reserve - (886)
Adjustments consequent to change of useful life (Also refer note 12) (114) -
Balance at the end of the year 36,901 30,607
67,534 59,751
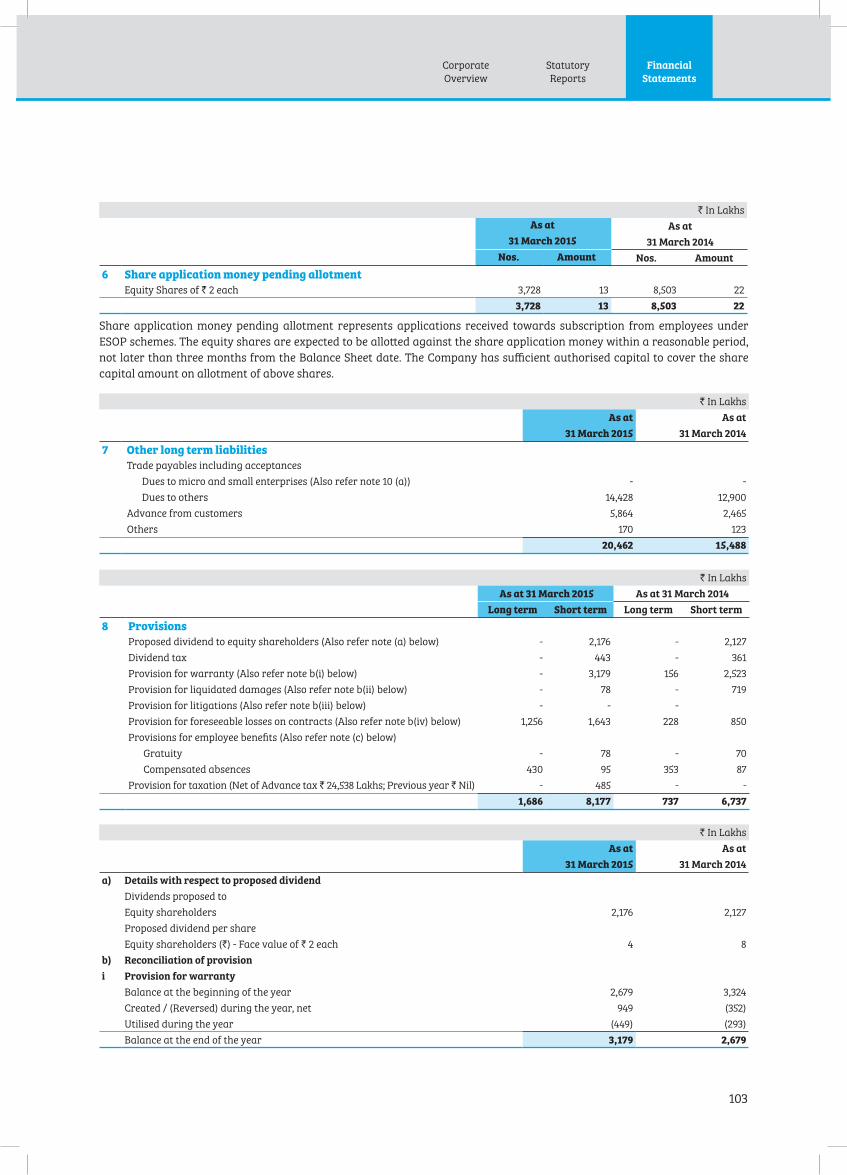
Corporate
Overview
Statutory
Reports
103
Financial
Statements
` In Lakhs
As at
31 March 2015
As at
31 March 2014
Nos. Amount Nos. Amount
6 Share application money pending allotment
Equity Shares of ` 2 each 3,728 13 8,503 22
3,728 13 8,503 22
Share application money pending allotment represents applications received towards subscription from employees under
ESOP schemes. The equity shares are expected to be allotted against the share application money within a reasonable period,
not later than three months from the Balance Sheet date. The Company has sufficient authorised capital to cover the share
capital amount on allotment of above shares.
` In Lakhs
As at
31 March 2015
As at
31 March 2014
7 Other long term liabilities
Trade payables including acceptances
Dues to micro and small enterprises (Also refer note 10 (a)) - -
Dues to others 14,428 12,900
Advance from customers 5,864 2,465
Others 170 123
20,462 15,488
` In Lakhs
As at 31 March 2015 As at 31 March 2014
Long term Short term Long term Short term
8 Provisions
Proposed dividend to equity shareholders (Also refer note (a) below) - 2,176 - 2,127
Dividend tax - 443 - 361
Provision for warranty (Also refer note b(i) below) - 3,179 156 2,523
Provision for liquidated damages (Also refer note b(ii) below) - 78 - 719
Provision for litigations (Also refer note b(iii) below) - - -
Provision for foreseeable losses on contracts (Also refer note b(iv) below) 1,256 1,643 228 850
Provisions for employee benefits (Also refer note (c) below)
Gratuity - 78 - 70
Compensated absences 430 95 353 87
Provision for taxation (Net of Advance tax ` 24,538 Lakhs; Previous year ` Nil) - 485 - -
1,686 8,177 737 6,737
` In Lakhs
As at
31 March 2015
As at
31 March 2014
a) Details with respect to proposed dividend
Dividends proposed to
Equity shareholders 2,176 2,127
Proposed dividend per share
Equity shareholders (`) - Face value of ` 2 each 4 8
b) Reconciliation of provision
i Provision for warranty
Balance at the beginning of the year 2,679 3,324
Created / (Reversed) during the year, net 949 (352)
Utilised during the year (449) (293)
Balance at the end of the year 3,179 2,679
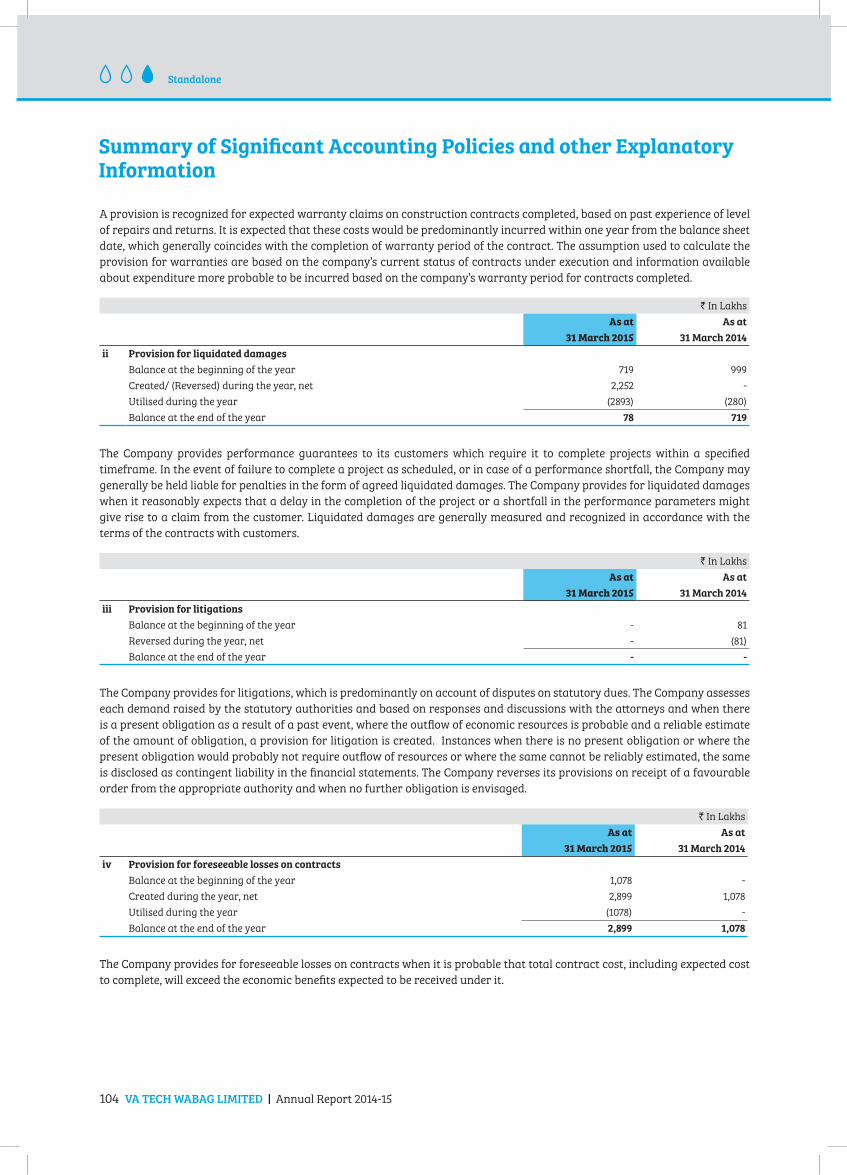
104 VA TECH WABAG LIMITED | Annual Report 2014-15
Summary of Significant Accounting Policies and other Explanatory Information
Standalone
A provision is recognized for expected warranty claims on construction contracts completed, based on past experience of level
of repairs and returns. It is expected that these costs would be predominantly incurred within one year from the balance sheet
date, which generally coincides with the completion of warranty period of the contract. The assumption used to calculate the
provision for warranties are based on the company’s current status of contracts under execution and information available
about expenditure more probable to be incurred based on the company’s warranty period for contracts completed.
` In Lakhs
As at
31 March 2015
As at
31 March 2014
ii Provision for liquidated damages
Balance at the beginning of the year 719 999
Created/ (Reversed) during the year, net 2,252 -
Utilised during the year (2893) (280)
Balance at the end of the year 78 719
The Company provides performance guarantees to its customers which require it to complete projects within a specified
timeframe. In the event of failure to complete a project as scheduled, or in case of a performance shortfall, the Company may
generally be held liable for penalties in the form of agreed liquidated damages. The Company provides for liquidated damages
when it reasonably expects that a delay in the completion of the project or a shortfall in the performance parameters might
give rise to a claim from the customer. Liquidated damages are generally measured and recognized in accordance with the
terms of the contracts with customers.
` In Lakhs
As at
31 March 2015
As at
31 March 2014
iii Provision for litigations
Balance at the beginning of the year - 81
Reversed during the year, net - (81)
Balance at the end of the year - -
The Company provides for litigations, which is predominantly on account of disputes on statutory dues. The Company assesses
each demand raised by the statutory authorities and based on responses and discussions with the attorneys and when there
is a present obligation as a result of a past event, where the outflow of economic resources is probable and a reliable estimate
of the amount of obligation, a provision for litigation is created. Instances when there is no present obligation or where the
present obligation would probably not require outflow of resources or where the same cannot be reliably estimated, the same
is disclosed as contingent liability in the financial statements. The Company reverses its provisions on receipt of a favourable
order from the appropriate authority and when no further obligation is envisaged.
` In Lakhs
As at
31 March 2015
As at
31 March 2014
iv Provision for foreseeable losses on contracts
Balance at the beginning of the year 1,078 -
Created during the year, net 2,899 1,078
Utilised during the year (1078) -
Balance at the end of the year 2,899 1,078
The Company provides for foreseeable losses on contracts when it is probable that total contract cost, including expected cost
to complete, will exceed the economic benefits expected to be received under it.

Corporate
Overview
Statutory
Reports
105
Financial
Statements
c) Employee benefits
i) Gratuity
In accordance with applicable Indian laws, the Company provides for gratuity, a defined benefit retirement plan (“the
Gratuity Plan”) covering eligible employees. The Gratuity Plan provides for a lump sum payment to vested employees
on retirement (subject to completion of five years of continuous employment), death, incapacitation or termination
of employment that are based on last drawn salary and tenure of employment. Liabilities with regard to the Gratuity
Plan are determined by actuarial valuation on the reporting date and the Company makes annual contribution to the
gratuity fund maintained by ICICI Prudential Life Insurance
The following table sets out the funded status of the Gratuity Plan and the amounts recognized in the financial
statement:
` In Lakhs
As at
31 March 2015
As at
31 March 2014
Change in projected benefit obligation
Projected benefit obligation at the beginning of the year 441 365
Service cost 65 57
Interest cost 37 28
Actuarial (gain) / loss 37 10
Benefits paid (52) (19)
Projected benefit obligation at the end of the year 528 441
Thereof
Unfunded 78 70
Partly or wholly funded 450 371
` In Lakhs
As at
31 March 2015
As at
31 March 2014
Change in plan assets
Fair value of plan assets at the beginning of the year 371 283
Expected return on plan assets 34 28
Actuarial gain / (loss) 27 (3)
Employer contributions 70 82
Benefits paid (52) (19)
Fair value of plan assets at the end of the year 450 371
Reconciliation of present value of obligation on the fair value of plan assets
Present value of projected benefit obligation at the end of the year 528 441
Fair value of plan assets at the end of the year 450 371
Liability / (asset) recognised in the balance sheet 78 70
Components of net gratuity costs are
Current Service cost 65 57
Interest cost 37 28
Expected returns on plan assets (34) (28)
Recognized net actuarial (gain)/ loss 10 13
Net gratuity costs recognised in the income statement 78 70
Principal actuarial assumptions used:
Discount rate 7.80% 8.90%
Long-term rate of compensation increase 7.50% 7.50%
Expected rate of return on plan assets 9.00% 9.00%
Average remaining life (in years) 24 25
Attrition rate 15.00% 15.00%
The Company assesses these assumptions with the projected long-term plans of growth and prevalent industry standards.
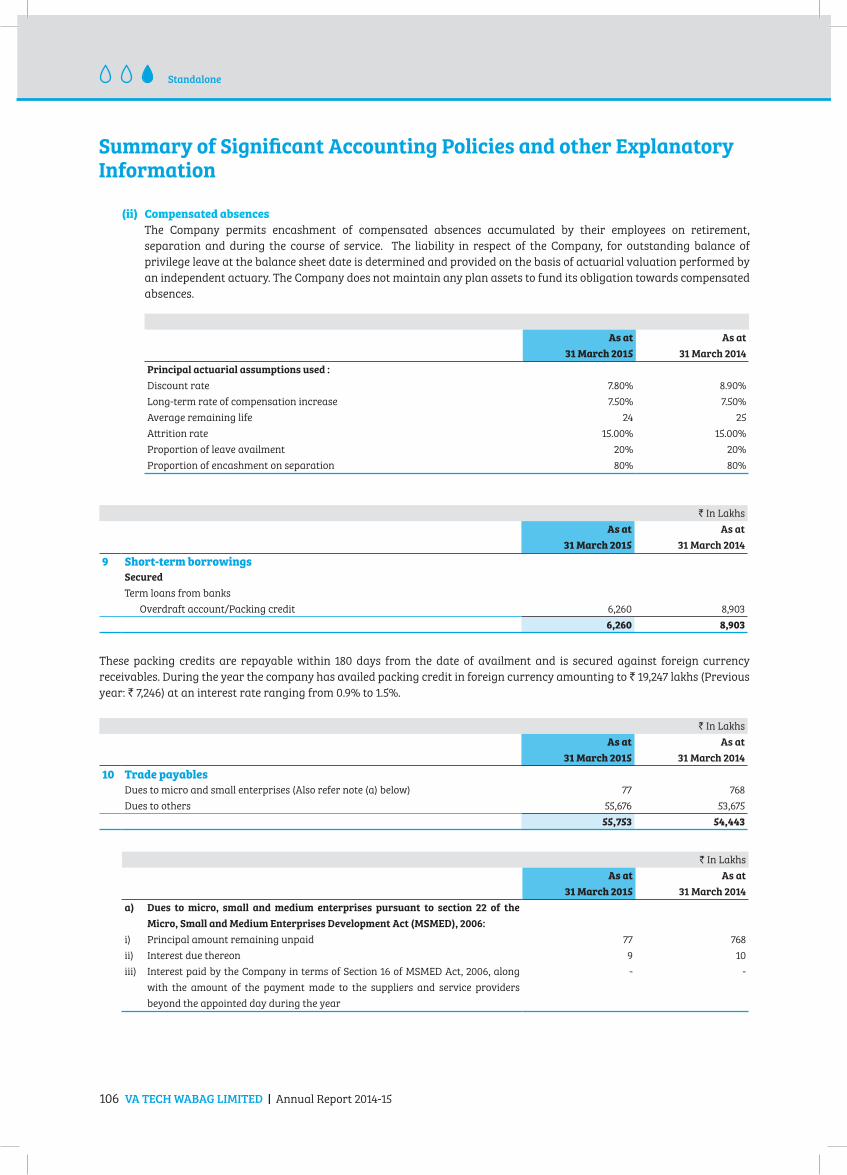
106 VA TECH WABAG LIMITED | Annual Report 2014-15
Summary of Significant Accounting Policies and other Explanatory Information
Standalone
(ii) Compensated absences
The Company permits encashment of compensated absences accumulated by their employees on retirement,
separation and during the course of service. The liability in respect of the Company, for outstanding balance of
privilege leave at the balance sheet date is determined and provided on the basis of actuarial valuation performed by
an independent actuary. The Company does not maintain any plan assets to fund its obligation towards compensated
absences.
As at
31 March 2015
As at
31 March 2014
Principal actuarial assumptions used :
Discount rate 7.80% 8.90%
Long-term rate of compensation increase 7.50% 7.50%
Average remaining life 24 25
Attrition rate 15.00% 15.00%
Proportion of leave availment 20% 20%
Proportion of encashment on separation 80% 80%
` In Lakhs
As at
31 March 2015
As at
31 March 2014
9 Short-term borrowings
Secured
Term loans from banks
Overdraft account/Packing credit 6,260 8,903
6,260 8,903
These packing credits are repayable within 180 days from the date of availment and is secured against foreign currency
receivables. During the year the company has availed packing credit in foreign currency amounting to ` 19,247 lakhs (Previous
year: ` 7,246) at an interest rate ranging from 0.9% to 1.5%.
` In Lakhs
As at
31 March 2015
As at
31 March 2014
10 Trade payables
Dues to micro and small enterprises (Also refer note (a) below) 77 768
Dues to others 55,676 53,675
55,753 54,443
` In Lakhs
As at
31 March 2015
As at
31 March 2014
a) Dues to micro, small and medium enterprises pursuant to section 22 of the
Micro, Small and Medium Enterprises Development Act (MSMED), 2006:
i) Principal amount remaining unpaid 77 768
ii) Interest due thereon 9 10
iii) Interest paid by the Company in terms of Section 16 of MSMED Act, 2006, along
with the amount of the payment made to the suppliers and service providers
beyond the appointed day during the year
- -

Corporate
Overview
Statutory
Reports
107
Financial
Statements
` In Lakhs
As at
31 March 2015
As at
31 March 2014
iv) Interest due and payable for the period of delay in making payment (which has
been paid but beyond the appointed day during the year) but without adding the
interest specified under MSMED Act, 2006
- -
v) Interest accrued and remaining unpaid as at 31 March 2014 - -
vi) Further interest remaining due and payable even in the succeeding years, until
such date when the interest dues as above are actually paid to the small enterprise
for the purpose of disallowance as a deductible expenditure under section 23 of
the MSMED Act, 2006
- -
86 778
The above information is based on the information available with the Company. The above disclosure has been determined
to the extent such parties have been identified on the basis of information available with the Company. This has been relied
upon by the auditors.
As at
31 March 2015
As at
31 March 2014
11 Other current liabilities
Billing in advance (Also refer note 31) 4,552 4,828
Advance from customers 3,362 5,956
Unpaid dividends 3 3
Statutory dues 271 215
Due to subsidiaries (Also refer note 32 (c )) 97 166
Other payables 865 1,340
Employee related payables 531 1,106
9,681 13,614
There are no amounts due for payment to the Investor education and protection fund under Section 125 of the Companies Act,
2013 as at the balance sheet date.

108 VA TECH WABAG LIMITED | Annual Report 2014-15
Summary of Significant Accounting Policies and other Explanatory Information
Standalone
`
In
La
kh
s
Ta
ng
ible
ass
ets
In
tan
gib
le a
sse
ts
Fre
eh
old
la
nd
B
uil
din
gs
Pla
nt
an
d
ma
chin
ery
Fu
rnit
ure
an
d fi
ttin
gs
Ele
ctri
cal
eq
uip
me
nt
Offi
ce
eq
uip
me
nt
Co
mp
ute
rs
Ve
hic
les
To
tal
Co
mp
ute
r S
oft
wa
re
12
Fix
ed
ass
ets
Gro
ss b
lock
Ba
lan
ce a
s a
t 3
1 Ma
rch
20
13
1,69
8 -
18
64
44
232
127
970
721
4,3
782
,09
1
Ad
dit
ion
s -
3
,653
561,
738
46
66
46
180
264
7,0
03
197
Dis
po
sals
-
-
-
-
7
-
3977
123
-
Dis
po
sals
rep
rese
nti
ng
ass
ets
hel
d f
or
sale
-
-
4
0
26
6
94
2
6
-
-
426
-
Ba
lan
ce a
s a
t 3
1 M
arc
h 2
014
1,
69
83
,65
3 2
02
1
,916
5
97
7
47
1
,111
9
08
1
0,8
32
2
,28
8
Ad
dit
ion
s -
-
7
3
9
12
4
7
4
226
36
2 2
18
Dis
po
sals
-
-
3
4
10
6
18
1
3
1
117
2
89 -
Ba
lan
ce
as
at
31
Ma
rc
h 2
01
5
1,6
98
3,6
53
175
1,8
49
59
17
38
1,1
84
1,0
171
0,9
05
2,5
06
Acc
um
ula
ted
de
pre
cia
tio
n/a
mo
rtiz
ati
on
Ba
lan
ce a
s a
t 3
1 Ma
rch
20
13
-
-
56
2
62
1
15
64
7
97
34
1 1
,635
9
15
Dep
reci
ati
on
/am
ort
iza
tio
n f
or
the
yea
r -
1
4
19
5
7 2
1 1
6
89
1
34
350
4
59
Rev
ersa
l o
n d
isp
osa
l o
f a
sset
s -
-
-
-
5
-
3
9
51
95
-
Rev
ersa
l re
pre
sen
tin
g a
sset
s h
eld
fo
r sa
le
-
-
33
2
20
60
2
0
-
-
333
-
Ba
lan
ce a
s a
t 3
1 M
arc
h 2
014
-
14
42
99
716
084
74
241,
557
1,37
4
Dep
reci
ati
on
/am
ort
iza
tio
n f
or
the
yea
r -
5
1 (1
4)
124
2611
977
10 3
93
35
2
Rev
ersa
l o
n d
isp
osa
l o
f a
sset
s -
-
31
105
612
16
8 2
23
-
Ad
just
men
ts c
on
seq
uen
t to
ch
an
ge
in u
sefu
l li
fe
-
-
57
538
43
16 1
14
-
Ba
lan
ce
as
at
31
Ma
rc
h 2
01
5
-
65
21
25
96
20
59
66
38
21
,84
11
,72
6
Net
blo
ck
Ba
lan
ce a
s a
t 3
1 M
arc
h 2
014
1,
698
3,6
3916
01,
817
526
687
264
484
9,2
759
14
Ba
lan
ce
as
at
31
Ma
rc
h 2
01
5
1,6
98
3,5
88
173
1,7
244
95
53
32
18
63
59
,06
47
80
No
tes
a.
Ass
ets
he
ld f
or
sale
:
T
he
Co
mp
an
y h
ad
du
rin
g t
he
pre
vio
us
yea
r m
ov
ed in
to it
s n
ew p
rem
ises
“W
ab
ag
ho
use
” a
nd
hen
ce r
etir
ed c
erta
in a
sset
s a
t it
s o
ld p
rem
ises
fro
m a
ctiv
e u
se. T
hes
e a
sset
s h
av
e b
een
va
lued
at
low
er o
f n
et b
oo
k
va
lue
an
d n
et r
eali
sab
le v
alu
e. A
lso
ref
er n
ote
21.
b.
Ca
pit
ali
zed
bo
rro
win
g c
ost
s:
T
he
bo
rro
win
g c
ost
ca
pit
ali
zed
du
rin
g t
he
yea
r en
ded
31
Ma
rch
20
15 i
s N
il (
31 M
arc
h 2
014
: ` 1
33 L
ak
hs)
.
c.
Ch
an
ge
in
me
tho
d o
f d
ep
reci
ati
on
T
he
com
pa
ny
ha
s ch
an
ged
th
e a
cco
un
tin
g p
oli
cy f
or
pro
vid
ing
dep
reci
ati
on
on
ta
ng
ible
ass
ets
fro
m ‘W
ritt
en D
ow
n V
alu
e’ m
eth
od
to
‘Str
aig
ht
Lin
e’ m
eth
od
eff
ecti
ve
1 A
pri
l 20
14 i
n o
rder
to
refl
ect
a s
uit
ab
le
all
oca
tio
n o
f co
st o
f ta
ng
ible
an
d i
nta
ng
ible
ass
ets
ov
er t
he
pa
tter
n i
n w
hic
h t
he
eco
no
mic
ben
ifits
are
der
ived
fro
m t
he
use
of
thes
e a
sset
s a
nd
res
ult
ing
in
mo
re a
pp
rop
ria
te p
rese
nta
tio
n o
f th
e fi
na
nci
al
sta
tem
ents
. Acc
ord
ing
ly a
n a
mo
un
t o
f `
597
La
kh
s b
ein
g a
ccu
mu
late
d d
epre
cia
tio
n c
ha
rged
du
rin
g t
he
earl
ier
yea
rs h
as
bee
n r
ever
sed
in t
he
sta
tem
ent
of
pro
fit
an
d lo
ss f
or
the
yea
r en
ded
31
Ma
rch
20
15 a
nd
dep
reci
ati
on
fo
r th
e cu
rren
t y
ear
ha
s b
een
co
mp
ute
d u
nd
er t
he
rev
ised
po
licy
.
d.
Ch
an
ge
in
use
ful
life
of
tan
gib
le a
sse
ts
E
ffec
tiv
e 1
Ap
ril
2014
, th
e C
om
pa
ny
ha
s re
vis
ed t
he
use
ful
life
of
fix
ed a
sset
s b
ase
d o
n S
ched
ule
II
to t
he
Co
mp
an
ies
Act
, 20
13. C
on
seq
uen
tly,
th
e d
epre
cia
tio
n f
or
the
yea
r en
ded
31
Ma
rch
20
15 i
s h
igh
er t
o t
he
exte
nt
of
` 4
26 L
ak
hs.
Fu
rth
er, a
n a
mo
un
t o
f `
114
La
kh
s re
pre
sen
tin
g t
he
carr
yin
g v
alu
e o
f a
sset
s w
ith
rev
ised
use
ful
life
as
nil
, ha
s b
een
ch
arg
ed t
o t
he
op
enin
g r
eser
ves
as
on
1 A
pri
l 20
14.

Corporate
Overview
Statutory
Reports
109
Financial
Statements
` In Lakhs
As at
31 March 2015
As at
31 March 2014
13 Non-current investments
Trade Investments (Valued at cost unless stated otherwise)
Investments in equity instruments - Unquoted
In Subsidiaries
VA Tech Wabag (Singapore) Pte Ltd 1,735 1,540
(44,41,478 (Previous year : 40,38,278) equity shares of SGD 1 each)
VA Tech Wabag Muscat LLC 124 124
(1,05,000 (Previous year : 1,05,000 ) equity shares of OMR 1 each)
VA Tech Wabag (Philippines) Inc. 90 90
(85,70,200 (Previous year:85,70,200 equity shares of PHP 1 each)
VA Tech Wabag ( Spain ) S.L.U 407 2
(5,25,604 (Previous year : 3,000) equity shares of Euro 1 each)
Wabag Limited (Thailand) 19 -
(29,400 (Previous year : Nil) preference shares of THB 34.0136 each)
Wabag Operations and Maintenance LLC (Bahrain) 58 -
(350 (Previous year : Nil) equity shares of BHD 100 each)
VA Tech Wabag and Roots Contracting (Qatar) 17 -
(98 (Previous year : Nil) equity shares of QAR 1000 each)
In Joint Venture
International Water Treatment LLC 69 69
(48,750 (Previous year : 48,750) equity shares of OMR 1 each)
In Other Companies
First STP Private Limited 15 15
(1,50,000 (Previous year :1,50,000) equity shares of ` 10 each)
Konark Water Infraprojects Private Limited 1 1
(5,000 (Previous year : 5,000 ) equity shares of ` 10 each)
Aurangabad City Water Utility Company Limited 1 1
(5,000 (Previous year : 5,000 ) equity shares of ` 10 each)
OEG Renew Waters (Thoothukudi) Private Limited* - -
(2,600 (Previous year : 2,600 ) equity shares of ` 10 each)
Ganapati Marine Enterprises Private Limited# - -
(158 (Previous Year:Nil) equity shares of ` 10 each)
2,536 1,842
Aggregate amount of unquoted investments 2,536 1,842
Aggregate provision for diminution in value of investments - -
* Since the amount of investment is ` 26,000, the same is below the rounding off norm adopted by the Company.
# Since the amount of investment is ` 1,580, the same is below the rounding off norm adopted by the Company.

110 VA TECH WABAG LIMITED | Annual Report 2014-15
Summary of Significant Accounting Policies and other Explanatory Information
Standalone
` In Lakhs
As at
31 March 2015
As at
31 March 2014
Extent of Investment in Subsidiaries
VA Tech Wabag (Singapore) Pte Ltd 100% 100%
VA Tech Wabag Muscat LLC 70% 70%
VA Tech Wabag (Philippines) Inc. 100% 100%
VA Tech Wabag ( Spain ) S.L.U 100% 100%
Wabag Limited (Thailand)## 49% -
Wabag Operations and Maintenance LLC (Bahrain) 70% -
VA Tech Wabag and Roots Contracting (Qatar)* 49% -
Extent of Investment in Joint Venture
International Water Treatment LLC 32.50% 32.50%
Extent of Investment in Other Companies
First STP Private Limited 5% 5%
Konark Water Infraprojects Private Limited 10% 10%
Aurangabad City Water Utility Company Limited 10% 10%
Ganapati Marine Enterprises Private Limited# 0% -
OEG Renew Waters (Thoothukudi) Private Limited 26% 26%
* Pursuant to an exclusive contractual arrangement proving for a share of 60% in the economic interests in the entity and
control of voting power, the investment has been classified as subsidiary.
# Since the extent of investment is .016%, the same is below rounding off norm adopted by the Company.
## Pursuant to the statutory document providing for a share of 90.6% in the economic interests in the entity and control of
voting power, the investment has been classified as subsidiary.
` In Lakhs
As at
31 March 2015
As at
31 March 2014
14 Deferred tax asset, net
The breakup of net deferred tax asset is as follows:
Deferred tax asset arising on account of :
- Provision for employee benefits, liquidated damages and foreseeable losses 1,217 429
- Allowances for bad and doubtful debts 1,372 1,015
- Other provisions - -
2,589 1,444
Less: Deferred tax liability arising on account of :
- Timing difference between depreciation/ amortization as per financials and
depreciation as per tax
(580) (397)
2,009 1,047
` In Lakhs
As at 31 March 2015 As at 31 March 2014
Long term Short term Long term Short term
15 Loans and advances
Capital advances
- Secured, considered good 518 - - -
- Unsecured, considered good - - - -
(A) 518 - - -
Security deposits
- Unsecured, considered good 342 1,079 19 957
(B) 342 1,079 19 957

Corporate
Overview
Statutory
Reports
111
Financial
Statements
` In Lakhs
As at 31 March 2015 As at 31 March 2014
Long term Short term Long term Short term
15 Loans and advances
Other loans and advances
(Unsecured, considered good)
- Advances to supplier - 4,519 - 4,116
- Advances to employees* 95 244 78 221
- Due from subsidiaries (Also refer note 32(c)) - 1,575 - 1,669
- Advance tax (Net of provision for tax ̀ Nil; Previous year ̀ 19,500 Lakhs ) - - - 390
(C) 95 6,338 78 6,396
Total (A+B+C) 955 7,417 97 7,353
* No amount is due from officers of the company
` In Lakhs
As at
31 March 2015
As at
31 March 2014
16 Other non-current assets
Non-current bank balances (Also refer note 20)
Long-term trade receivables 7,540 7,744
Customer retention - Unsecured, considered good 13,346 11,956
20,886 19,700
` In Lakhs
As at
31 March 2015
As at
31 March 2014
17 Current investments
Valued at lower of cost and fair value
Investments in mutual funds - Unquoted
- SBI Mutual Fund fixed maturity plan (1,00,00,000 units of ` 10 each) - 1,000
- HDFC Mutual Fund fixed maturity plan (1,00,00,000 units of ` 10 each) 1,000 1,000
- ICICI Prudential fixed maturity plan (1,00,00,000 units of 10 each) 1,000 -
- Reliance yearly interval fund (45,91,916 units of ` 10.8887 each) 500 -
- Reliance yearly interval fund (45,90,694 units of ` 10.8916 each) 500 -
- UTI fixed term interval fund (50,00,000 units of ` 10 each) 500 -
3,500 2,000
Aggregate amount of
- Unquoted investments 3,500 2,000
- Provision for diminution in value of investments - -
` In Lakhs
As at
31 March 2015
As at
31 March 2014
18 Inventories
Construction work-in-progress 2,285 798
Stores and spares 698 644
2,983 1,442
(contd.)
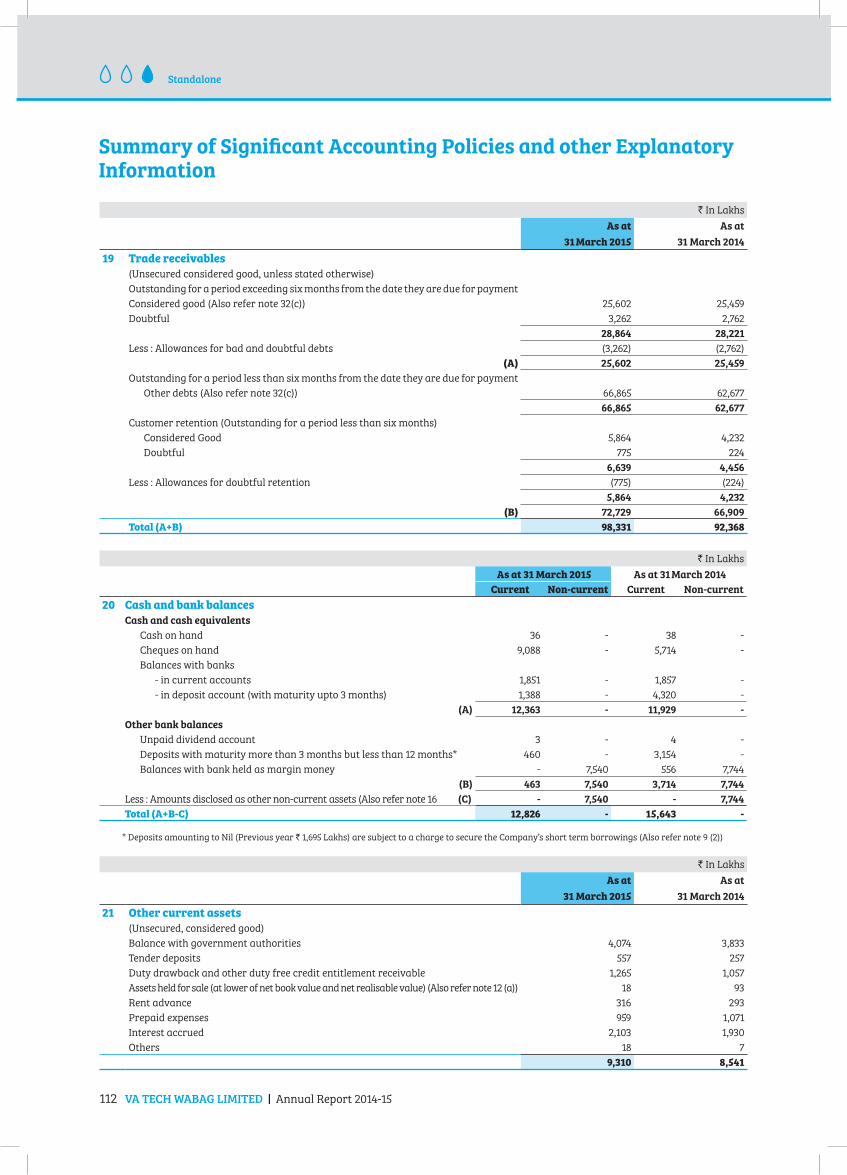
112 VA TECH WABAG LIMITED | Annual Report 2014-15
Summary of Significant Accounting Policies and other Explanatory Information
Standalone
` In Lakhs
As at
31 March 2015
As at
31 March 2014
19 Trade receivables
(Unsecured considered good, unless stated otherwise)
Outstanding for a period exceeding six months from the date they are due for payment
Considered good (Also refer note 32(c)) 25,602 25,459
Doubtful 3,262 2,762
28,864 28,221
Less : Allowances for bad and doubtful debts (3,262) (2,762)
(A) 25,602 25,459
Outstanding for a period less than six months from the date they are due for payment
Other debts (Also refer note 32(c)) 66,865 62,677
66,865 62,677
Customer retention (Outstanding for a period less than six months)
Considered Good 5,864 4,232
Doubtful 775 224
6,639 4,456
Less : Allowances for doubtful retention (775) (224)
5,864 4,232
(B) 72,729 66,909
Total (A+B) 98,331 92,368
` In Lakhs
As at 31 March 2015 As at 31 March 2014
Current Non-current Current Non-current
20 Cash and bank balances
Cash and cash equivalents
Cash on hand 36 - 38 -
Cheques on hand 9,088 - 5,714 -
Balances with banks
- in current accounts 1,851 - 1,857 -
- in deposit account (with maturity upto 3 months) 1,388 - 4,320 -
(A) 12,363 - 11,929 -
Other bank balances
Unpaid dividend account 3 - 4 -
Deposits with maturity more than 3 months but less than 12 months* 460 - 3,154 -
Balances with bank held as margin money - 7,540 556 7,744
(B) 463 7,540 3,714 7,744
Less : Amounts disclosed as other non-current assets (Also refer note 16 (C) - 7,540 - 7,744
Total (A+B-C) 12,826 - 15,643 -
* Deposits amounting to Nil (Previous year ` 1,695 Lakhs) are subject to a charge to secure the Company’s short term borrowings (Also refer note 9 (2))
` In Lakhs
As at
31 March 2015
As at
31 March 2014
21 Other current assets
(Unsecured, considered good)
Balance with government authorities 4,074 3,833
Tender deposits 557 257
Duty drawback and other duty free credit entitlement receivable 1,265 1,057
Assets held for sale (at lower of net book value and net realisable value) (Also refer note 12 (a)) 18 93
Rent advance 316 293
Prepaid expenses 959 1,071
Interest accrued 2,103 1,930
Others 18 7
9,310 8,541

Corporate
Overview
Statutory
Reports
113
Financial
Statements
` In Lakhs
As at
31 March 2015
As at
31 March 2014
22 Revenue from operations
Sale of services
Export 31,198 31,808
Domestic 90,815 82,191
1,22,013 1,13,999
Other operating revenues, net 1,323 1,225
1,23,336 1,15,224
` In Lakhs
As at
31 March 2015
As at
31 March 2014
23 Other income
Interest income 749 1,000
Dividend income 163 161
912 1,163
` In Lakhs
As at
31 March 2015
As at
31 March 2014
24 Cost of sales and services
Material costs 39,433 40,504
Civil costs 19,454 21,019
Erection and commissioning costs 2,667 4,300
Taxes and duties 6,562 4,852
Site establishment cost 2,941 2,920
Engineering costs 1,133 1,052
Project consultancy fee 458 562
Warranty expenses/(reversal) 949 (352)
Forseeable losses on contracts (Also refer note 8 b(iv)) 2,899 1,078
Project travel 1,164 1,266
Insurance costs 437 244
Power and fuel 5,878 1,563
Liquidated damages 2,252 0
Other project expenses, net 9,539 7,710
95,766 86,718
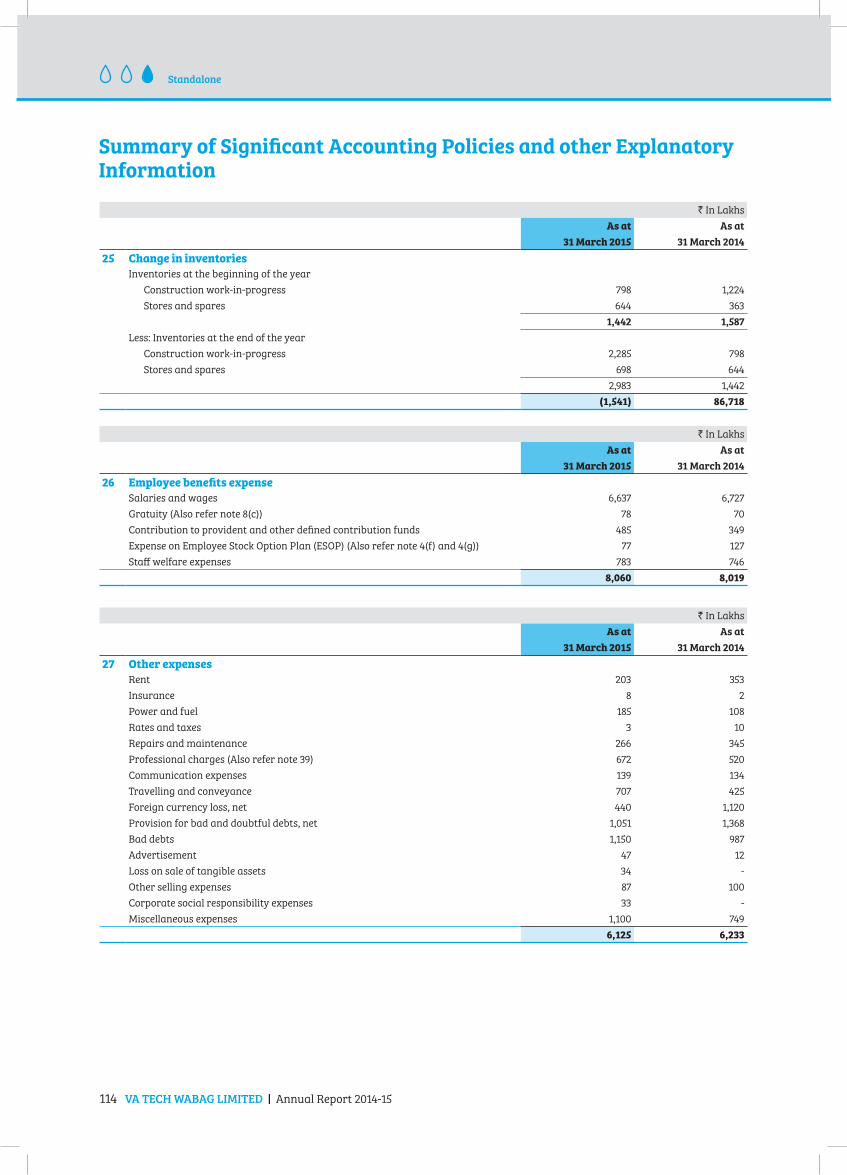
114 VA TECH WABAG LIMITED | Annual Report 2014-15
Summary of Significant Accounting Policies and other Explanatory Information
Standalone
` In Lakhs
As at
31 March 2015
As at
31 March 2014
25 Change in inventories
Inventories at the beginning of the year
Construction work-in-progress 798 1,224
Stores and spares 644 363
1,442 1,587
Less: Inventories at the end of the year
Construction work-in-progress 2,285 798
Stores and spares 698 644
2,983 1,442
(1,541) 86,718
` In Lakhs
As at
31 March 2015
As at
31 March 2014
26 Employee benefits expense
Salaries and wages 6,637 6,727
Gratuity (Also refer note 8(c)) 78 70
Contribution to provident and other defined contribution funds 485 349
Expense on Employee Stock Option Plan (ESOP) (Also refer note 4(f) and 4(g)) 77 127
Staff welfare expenses 783 746
8,060 8,019
` In Lakhs
As at
31 March 2015
As at
31 March 2014
27 Other expenses
Rent 203 353
Insurance 8 2
Power and fuel 185 108
Rates and taxes 3 10
Repairs and maintenance 266 345
Professional charges (Also refer note 39) 672 520
Communication expenses 139 134
Travelling and conveyance 707 425
Foreign currency loss, net 440 1,120
Provision for bad and doubtful debts, net 1,051 1,368
Bad debts 1,150 987
Advertisement 47 12
Loss on sale of tangible assets 34 -
Other selling expenses 87 100
Corporate social responsibility expenses 33 -
Miscellaneous expenses 1,100 749
6,125 6,233

Corporate
Overview
Statutory
Reports
115
Financial
Statements
` In Lakhs
As at
31 March 2015
As at
31 March 2014
28 Finance costs
Interest expenses 689 545
Bank charges 803 691
1,492 1,236
` In Lakhs
As at
31 March 2015
As at
31 March 2014
29 Depreciation and amortization expense
Depreciation of tangible assets (Refer note 12) 393 350
Amortization of intangible assets (Refer note 12) 352 459
745 809
` In Lakhs
As at
31 March 2015
As at
31 March 2014
30 Earnings per equity share (EPS)
Nominal value of equity shares 2 2
Profit attributable to equity shareholders (A) 9,041 8,858
Weighted average number of equity shares outstanding during the year (B)* 5,40,04,064 5,31,55,509
Basic earnings per equity share (A/B) (in `) 16.74 16.65
Dilutive effect on profit (C) - -
Profit attributable to equity shareholders for computing diluted EPS (D) = (A+C) 9,041 8,858
Dilutive effect on weighted average number of equity shares outstanding during the
year (E)
5,37,281 7,07,993
Weighted average number of equity shares for computing Diluted EPS (F) = (B+E)* 5,45,41,345 5,38,63,502
Diluted earnings per equity share (D/F) (in `) 16.59 16.43
*adjusted for bonus issue (Also refer note 4(e))
` In Lakhs
As at
31 March 2015
As at
31 March 2014
31 Construction contracts
In terms of the disclosures required to be made under the Accounting Standard (AS)
7 as notified in section 133 of the Companies Act, 2013, the amounts considered in the
financial statements up to the balance sheet date are as follows:
Contract revenue recognised 95,497 94,554
Aggregate amount of costs incurred and recognised profits and losses for all contracts
in progress
2,54,809 2,51,705
Less : Progress billings 2,59,361 2,56,533
(4,552) (4,828)
Recognised as :
Due to customers for construction contract work, recognised in current liabilities (4,552) (4828)
(4,552) (4,828)
Advances received from customers for contracts related to work not yet performed
included in ‘Other long term liabilities’ and ‘Other current liabilities’
9,226 8,421
Retention on contracts included within ‘Trade receivables’ and ‘Other non-current assets’ 19,985 16,412

116 VA TECH WABAG LIMITED | Annual Report 2014-15
Summary of Significant Accounting Policies and other Explanatory Information
Standalone
32 Related parties
a) Names of related parties and nature of relationship
Nature of relationship Name of related party
Subsidiary companies VA Tech Wabag Singapore (Pte) Ltd, Singapore
VA Tech Wabag GmbH, Austria
Wabag Wassertechnik AG, Switzerland
VA Tech Wabag Deutschland GmbH, Germany
VA Tech Wabag Brno Spol S.R.O, Czech Republic
Wabag Water Services (Macao) Limited, Macao
Wabag Water Services s.r.l, Romania
VA Tech Wabag Tunisia s.a.r.l., Tunisia
Ujams Wastewater Treatment Company (Pty) Limited, Namibia
VA Tech Wabag Algeria s.a.rl., Algeria
VA Tech Wabag Tecknolojisi Ve Ticaret Limited, Turkey
VA Tech Wabag (Hong Kong) Limited, Hong Kong
VA Tech Wabag Egypt Limited, Egypt
Beijing VA Tech Wabag Water Treatment Technology Company Limited, China
VA Tech Wabag Muscat LLC, Oman
VA Tech Wabag (Philippines) Inc, Philippines
VA Tech Wabag (Spain) S.L.U, Spain
VA Tech Wabag Ltd - Pratibha Industries Ltd JV, Nepal
Wabag Limited, Thailand
Wabag Operation And Maintenance WLL, Bahrain
VA Tech Wabag and Roots Contracting LLC , Qatar
Associates Windhoek Goreangab Operating Company Limited, Namibia
OEG Renew Waters (Thoothukudi) Private Limited
Joint Venture International Water Treatment LLC, Oman
Key Management Personnel (KMP) Mr. Rajiv Mittal – Managing Director
Mr. S Varadarajan – Chief Financial Officer
Mr. Shiv Narayan Saraf – Executive Director (Management Board)
Mr. Amit Sengupta – Executive Director (Management Board)
Mr. Patrick Andrade – President - Industrial Water Group
Mr. Krishna Narayan Gokhale - President - International Engineering Centre
Mr. Rajneesh Chopra - Senior Vice President - Operations and Maintenance
Business Group

Corporate
Overview
Statutory
Reports
117
Financial
Statements
b)
Tra
nsa
ctio
ns
wit
h r
ela
ted
pa
rtie
s
` In
La
kh
s20
14-1
520
13-1
4
Rel
ate
d P
art
yP
urc
ha
se/
(Sa
le)
of
go
od
s/A
sset
s
Ren
der
ing
of
serv
ices
Inv
estm
ent
pu
rch
ase
d/
(so
ld)
Rem
un
era
tio
n
pa
id
Div
iden
d
Pa
id
Oth
ers
-
Ex
pen
se /
(In
com
e) *
Rei
mb
urs
emen
ts
rece
ived
/
rece
iva
ble
Pu
rch
ase
/
(Sa
le) o
f
go
od
s/
Ass
ets
Ren
der
ing
of
serv
ices
Inv
estm
ent
pu
rch
ase
d/
(so
ld)
Rem
un
era
tio
n
pa
id
Div
iden
d
Pa
id
Oth
ers
-
Exp
ense
/
(In
com
e) *
Rei
mb
urs
emen
ts
rece
ived
/
rece
iva
ble
VA T
ech
Wa
ba
g G
mb
H, A
ust
ria
-
(1
,116
) -
-
-
(2
16)
(122
) 1
10
(1,4
03)
-
-
-
(138
) (1
12)
Wa
ba
g W
ass
erte
chn
ik A
G,
Swit
zerl
an
d
-
-
-
-
-
54
(45)
76
-
-
-
-
(45)
(23)
VA T
ech
Wa
ba
g S
ing
ap
ore
(Pte
) Ltd
,
Sin
ga
por
e
-
-
195
-
-
-
(6
) -
-
3
05
-
-
-
-
VA T
ech
Wa
ba
g (P
hili
pp
ines
) In
c,
Ph
ilip
pin
es
(3,3
46)
(50
6) -
-
-
(1
13)
(274
) (2
,969
) -
-
-
-
(1
31)
(196
)
VA T
ech
Wa
ba
g M
usc
at
LLC
, Om
an
531
(6
2) -
-
-
(1
) (2
2) 9
6 (2
) (1
5)
Bei
jin
g V
A T
ech
Wa
ba
g W
ate
r
Trea
tmen
t Te
chn
olog
y C
omp
an
y
Lim
ited
, Ch
ina
-
-
-
-
-
2
-
-
-
-
-
-
5
-
VA T
ech
Wa
ba
g T
eckn
oloj
isi V
e
Tic
are
t Li
mit
ed, T
urk
ey
-
-
-
-
-
(169
) (4
9) -
-
-
-
-
(2
5) (3
0)
Wa
ba
g W
ate
r Se
rvic
es s
.r.l,
Rom
an
ia
-
-
-
-
-
(90
) (2
0)
-
-
-
-
-
(159
) (1
2)
VA T
ech
Wa
ba
g (S
pa
in) S
.L.U
, Sp
ain
-
-
4
05
-
-
67
(12)
-
-
-
-
-
65
-
Inte
rna
tion
al W
ate
r Tr
eatm
ent
LLC
,
Om
an
-
(496
) -
-
-
-
(4
9) (2
,10
4) -
-
-
-
-
(1
64)
VA T
ech
Wa
ba
g B
rno
Spol
S.R
.O,
Cze
ch R
epu
blic
-
-
-
-
-
(73)
(9)
-
-
-
-
-
(10
0)
VA T
ech
Wa
ba
g L
td -
Pra
tib
ha
Ind
ust
ries
Ltd
JV,
Nep
al
(2,7
67)
(825
) -
-
-
-
(3
75)
(3,6
72)
-
-
-
-
-
-
Uja
ms
Wa
stew
ate
r Tr
eatm
ent
Com
pa
ny
(Pty
) Lim
ited
, Na
mib
ia
-
-
-
-
-
(13)
-
-
-
-
-
-
(9)
-
Wa
ba
g W
ate
r Se
rvic
es (M
aca
o)
Lim
ited
, Ma
cao
-
-
-
-
-
(9)
-
VA T
ech
Wa
ba
g T
un
isia
s.a
.r.l.
, Tu
nis
ia
-
-
-
-
-
(8)
(3)
Wa
ba
g O
per
ati
on A
nd
Ma
inte
na
nce
WLL
, Ba
hra
in
-
-
58
-
-
-
(35)
VA T
ech
Wa
ba
g a
nd
Roo
ts
Con
tra
ctin
g L
LC ,
Qa
tar
-
(41)
17
-
-
-
(215
)
Wa
ba
g L
imit
ed, T
ha
ilan
d -
-
1
9 -
-
8
-
Key
Ma
na
gem
ent
Per
son
nel
-
-
-
-
Ra
jiv
Mitt
al
-
-
-
256
3
91
-
-
-
-
-
202
3
37
-
-
Oth
ers
-
-
-
629
2
57
-
-
-
-
-
480
2
38
-
-
*
Oth
er i
nco
me
als
o i
ncl
ud
es g
rou
p f
ees
SU
MM
AR
Y O
F S
IGN
IFIC
AN
T A
CC
OU
NT
ING
PO
LIC
IES
AN
D O
TH
ER
E
XP
LA
NA
TO
RY
IN
FO
RM
AT
ION

118 VA TECH WABAG LIMITED | Annual Report 2014-15
Standalone
c)B
ala
nce
wit
h r
ela
ted
pa
rtie
s
` In
La
kh
s
Rel
ate
d P
art
y
As
at
31 M
arc
h 2
015
As
at
31 M
arc
h 2
014
Inv
estm
ents
1A
dv
an
ces/
Am
ou
nt
reco
ver
ab
le1
"Cre
dit
ors
/
Pa
ya
ble
s"
Inv
estm
ents
1A
dv
an
ces/
Am
ou
nt
reco
ver
ab
le1
"Cre
dit
ors
/
Pa
ya
ble
s"
VA T
ech
Wa
ba
g S
ing
ap
ore
(Pte
) Ltd
, Sin
ga
por
e 1
,735
4
56
-
1,5
40
960
-
VA T
ech
Wa
ba
g G
mb
H, A
ust
ria
-
1,8
00
-
-
1
,371
-
WA
BA
G W
ass
erte
chn
ik A
G, S
wit
zerl
an
d2
-
29
-
-
8
-
VA T
ech
Wa
ba
g (P
hili
pp
ines
) In
c, P
hili
pp
ines
2 9
0
2,6
68
-
90
2
,939
-
VA T
ech
Wa
ba
g M
usc
at
LLC
, Om
an
124
7
0
94
124
-
1
42
Wa
ba
g W
ate
r Se
rvic
es s
.r.l,
Rom
an
ia
-
34
-
-
153
-
VA T
ech
Wa
ba
g (S
pa
in) S
.L.U
, Sp
ain
4
07
40
8 3
2
3
88
24
Inte
rna
tion
al W
ate
r Tr
eatm
ent
LLC
, Om
an
69
1,4
22
-
69
938
-
VA T
ech
Wa
ba
g T
eckn
oloj
isi V
e T
ica
ret
Lim
ited
, Tu
rkey
-
237
-
-
5
0
-
VA T
ech
Wa
ba
g L
td -
Pra
tib
ha
Ind
ust
ries
Ltd
JV,
Nep
al
-
4,5
28
-
-
3,4
31
-
Uja
ms
Wa
stew
ate
r Tr
eatm
ent
Com
pa
ny
(Pty
) Lim
ited
, Na
mib
ia -
1
8 -
-
9
-
VA T
ech
Wa
ba
g B
rno
Spol
S.R
.O, C
zech
Rep
ub
lic -
9
-
-
-
-
Wa
ba
g O
per
ati
on A
nd
Ma
inte
na
nce
WLL
, Ba
hra
in 5
8 3
5 -
-
-
-
VA T
ech
Wa
ba
g a
nd
Roo
ts C
ontr
act
ing
LLC
, Q
ata
r 1
7 2
60
-
-
-
-
Wa
ba
g L
imit
ed, T
ha
ilan
d 1
9 -
-
-
-
-
Wa
ba
g W
ate
r Se
rvic
es (M
aca
o) L
imit
ed, M
aca
o -
2
-
-
-
-
VA T
ech
Wa
ba
g T
un
isia
s.a
.r.l.
, Tu
nis
ia
-
10
-
-
-
-
Bei
jin
g V
A T
ech
Wa
ba
g W
ate
r Tr
eatm
ent
Tech
nol
ogy
Com
pa
ny
Lim
ited
, Ch
ina
--
--
--
N
ote
:
1.
A
lso
rep
rese
nts
th
e m
ax
imu
m a
mo
un
t o
f in
ves
tmen
ts/
loa
ns/
ad
va
nce
s/ i
n s
ub
sid
iari
es i
n a
cco
rda
nce
wit
h C
lau
se 3
2 o
f th
e li
stin
g a
gre
emen
t su
bje
ct t
o N
ote
2 b
elo
w.
2
. T
he
ma
xim
um
am
ou
nt
of
ad
va
nce
s o
uts
tan
din
g d
uri
ng
th
e y
ear
is a
s b
elo
w:
a.
WA
BA
G W
ass
erte
chn
ik A
G, S
wit
zerl
an
d -
` 2
9 L
ak
hs
(Pre
vio
us
yea
r `
140
La
kh
s)
b.
VA
Tec
h W
ab
ag
(P
hil
ipp
ines
) In
c -
` 3
,419
La
kh
s (P
rev
iou
s y
ear
` 29
39 L
ak
hs)
Su
mm
ar
y o
f S
ign
ific
an
t A
cc
ou
nti
ng
Po
lic
ies
an
d o
the
r E
xp
lan
ato
ry
In
for
ma
tio
n
33
D
er
iva
tiv
e i
nst
ru
me
nts
an
d u
nh
ed
ge
d f
or
eig
n c
ur
re
nc
y e
xp
osu
re
P
art
icu
lars
of
un
he
dg
ed
fo
reig
n c
urr
en
cy e
xp
osu
re a
s a
t th
e r
ep
ort
ing
da
te
In L
ak
hs
Pa
rtic
ula
rsIn
US
DIn
Eu
roIn
OM
RIn
GB
PIn
CN
YIn
JP
YIn
MY
RIn
AE
DIn
LK
RIn
QA
RIn
` e
qu
iva
len
t
a)
Tra
de
rece
iva
ble
s in
clu
din
g r
eten
tio
n n
et o
f a
dv
an
ces
239
138
-
-
7,56
22
1 -
-
2
21,
46
3
(P
rev
iou
s y
ear)
24
47
13 -
-
5,
892
11 -
-
1
20,8
60
b)
Pro
ject
rel
ate
d c
red
ito
rs
66
14
7 -
-
1
-
3,4
17 -
7,
218
(P
rev
iou
s y
ear)
36
1810
-
- -
-
2
8,6
831
8,3
38

Corporate
Overview
Statutory
Reports
119
Financial
Statements
34 Interest in joint venture The group has 32.5% (31 March 2014 : 32.5%) interest in International Water Treatment LLC, a joint venture, classified as a
Jointly controlled entity domiciled in Oman which is involved in construction of a desalination plant. The joint venture was
incorporated during February 2013 and commenced operations from April 2013.
The aggregate amounts of each of the assets, liabilities, income and expenses related to the Company’s interest in the
jointly controlled entity is as follows:
` In Lakhs
Particulars As at
31 March 2015
As at
31 March 2014
Non-current assets
Property, plant and equipment - 383
Deferred tax assets - -
- 383
Current assets
Trade receivables 7,752 4,939
Loans and advances and other current assets 402 723
Cash and cash equivalents 2,046 5,343
10,200 11,005
Total assets 10,200 11,388
Non current liabilities
Deferred tax liabilities - 83
- 83
Current Liabilities
Short-term borrowings 2,092 -
Provisions 4,013 146
Trade and other liabilities 4,011 10,088
10,116 10,234
Total liabilities 10,116 10,317
Included in the Consolidated Statement of Profit and Loss
` In Lakhs
Particulars As at
31 March 2015
As at
31 March 2014
Income
Revenue from operations 19,292 21,524
Other income 120 63
Finance income 19 42
19,431 21,629
Expenditure
Cost of material 19,135 19,597
Employee benefits expense 556 210
Depreciation 163 314
Other expenses 673 283
Finance costs 58 83
20,585 20,487
Profit before tax (1,154) 1,142
Income tax expense (141) 139
Profit after tax (1,013) 1,003
Notes :
i. Contingent liabilities of the above joint venture entity ` Nil (Previous year ` Nil)
ii. Capital commitments of the above joint venture entity ` Nil (Previous year ` Nil)
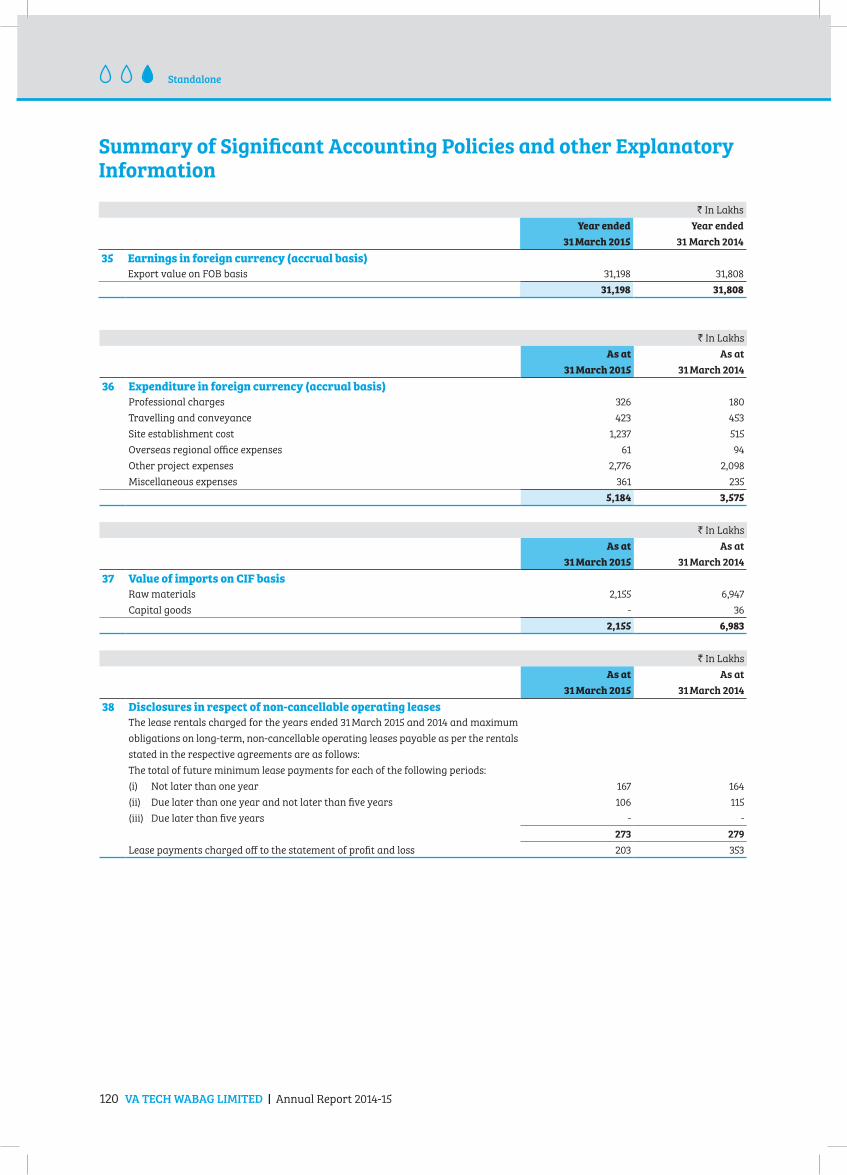
120 VA TECH WABAG LIMITED | Annual Report 2014-15
Summary of Significant Accounting Policies and other Explanatory Information
Standalone
` In Lakhs
Year ended
31 March 2015
Year ended
31 March 2014
35 Earnings in foreign currency (accrual basis)
Export value on FOB basis 31,198 31,808
31,198 31,808
` In Lakhs
As at
31 March 2015
As at
31 March 2014
36 Expenditure in foreign currency (accrual basis)
Professional charges 326 180
Travelling and conveyance 423 453
Site establishment cost 1,237 515
Overseas regional office expenses 61 94
Other project expenses 2,776 2,098
Miscellaneous expenses 361 235
5,184 3,575
` In Lakhs
As at
31 March 2015
As at
31 March 2014
37 Value of imports on CIF basis
Raw materials 2,155 6,947
Capital goods - 36
2,155 6,983
` In Lakhs
As at
31 March 2015
As at
31 March 2014
38 Disclosures in respect of non-cancellable operating leases
The lease rentals charged for the years ended 31 March 2015 and 2014 and maximum
obligations on long-term, non-cancellable operating leases payable as per the rentals
stated in the respective agreements are as follows:
The total of future minimum lease payments for each of the following periods:
(i) Not later than one year 167 164
(ii) Due later than one year and not later than five years 106 115
(iii) Due later than five years - -
273 279
Lease payments charged off to the statement of profit and loss 203 353
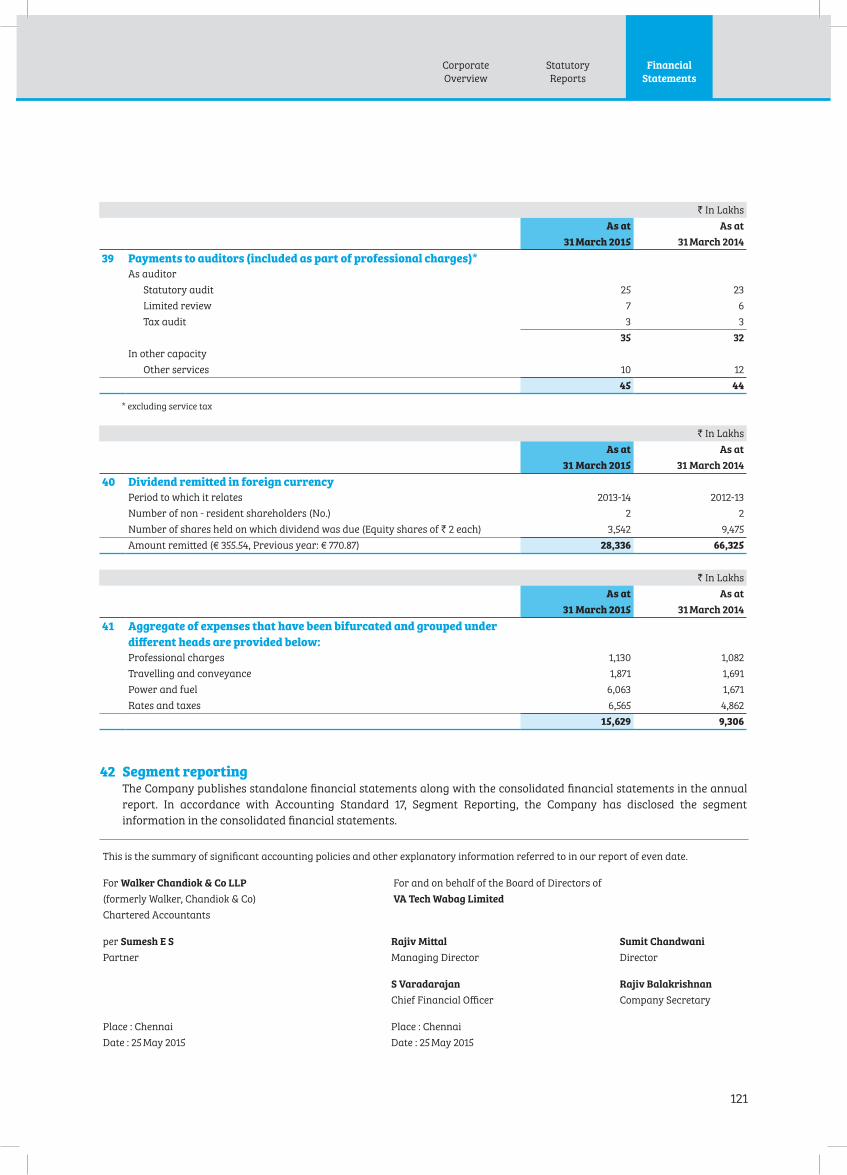
Corporate
Overview
Statutory
Reports
121
Financial
Statements
` In Lakhs
As at
31 March 2015
As at
31 March 2014
39 Payments to auditors (included as part of professional charges)*
As auditor
Statutory audit 25 23
Limited review 7 6
Tax audit 3 3
35 32
In other capacity
Other services 10 12
45 44
* excluding service tax
` In Lakhs
As at
31 March 2015
As at
31 March 2014
40 Dividend remitted in foreign currency
Period to which it relates 2013-14 2012-13
Number of non - resident shareholders (No.) 2 2
Number of shares held on which dividend was due (Equity shares of ` 2 each) 3,542 9,475
Amount remitted (€ 355.54, Previous year: € 770.87) 28,336 66,325
` In Lakhs
As at
31 March 2015
As at
31 March 2014
41 Aggregate of expenses that have been bifurcated and grouped under
different heads are provided below:
Professional charges 1,130 1,082
Travelling and conveyance 1,871 1,691
Power and fuel 6,063 1,671
Rates and taxes 6,565 4,862
15,629 9,306
42 Segment reporting The Company publishes standalone financial statements along with the consolidated financial statements in the annual
report. In accordance with Accounting Standard 17, Segment Reporting, the Company has disclosed the segment
information in the consolidated financial statements.
This is the summary of significant accounting policies and other explanatory information referred to in our report of even date.
For Walker Chandiok & Co LLP For and on behalf of the Board of Directors of
(formerly Walker, Chandiok & Co) VA Tech Wabag Limited
Chartered Accountants
per Sumesh E S Rajiv Mittal Sumit Chandwani
Partner Managing Director Director
S Varadarajan Rajiv Balakrishnan
Chief Financial Officer Company Secretary
Place : Chennai Place : Chennai
Date : 25 May 2015 Date : 25 May 2015

122 VA TECH WABAG LIMITED | Annual Report 2014-15
Consolidated
Independent Auditor’s Report
To the Members of VA TECH WABAG LIMITED
Report on the Consolidated Financial Statements1. We have audited the accompanying consolidated
financial statements of VA TECH WABAG LIMITED, (“the
Holding Company”), its subsidiaries, its associates and
jointly controlled entities (the Holding Company and its
subsidiaries together referred to as “the Group”), which
comprise the Consolidated Balance Sheet as at 31 March
2015, the Consolidated Statement of Profit and Loss and the
Consolidated Cash Flow Statement for the year then ended,
and a summary of the significant accounting policies and
other explanatory information.
Management’s Responsibility for the Consolidated Financial Statements2. The Holding Company’s Board of Directors is responsible for
the preparation of these consolidated financial statements
in terms of the requirements of the Companies Act, 2013
(“the Act”) that give a true and fair view of the consolidated
financial position, consolidated financial performance and
consolidated cash flows of the Group and its associates
and jointly controlled entities, in accordance with the
accounting principles generally accepted in India, including
the Accounting Standards specified under Section 133 of the
Act, read with Rule 7 of the Companies (Accounts) Rules, 2014
(as amended). The Holding Company’s Board of Directors,
and the respective Board of Directors/management of the
subsidiaries included in the Group, and of its associates
and jointly controlled entities are responsible for the
design, implementation and maintenance of internal
control relevant to the preparation and presentation of the
financial statements that give a true and fair view and are
free from material misstatement, whether due to fraud or
error. Further, in terms with the provisions of the Act, the
respective Board of Directors of the Holding Company and
its subsidiary, associate and jointly controlled companies,
which are incorporated in India, are responsible for
maintenance of adequate accounting records; safeguarding
the assets; preventing and detecting frauds and other
irregularities; selection and application of appropriate
accounting policies; making judgments and estimates that
are reasonable and prudent; and design, implementation
and maintenance of adequate internal financial controls,
that were operating effectively for ensuring the accuracy
and completeness of the accounting records, relevant to the
preparation and presentation of the financial statements,
which have been used for the purpose of preparation of the
consolidated financial statements by the directors of the
Holding Company, as aforesaid.
Auditor’s Responsibility3. Our responsibility is to express an opinion on these
consolidated financial statements based on our audit.
4. While conducting the audit, we have taken into account
the provisions of the Act, the accounting and auditing
standards and matters which are required to be included in
the auditor’s report under the provisions of the Act and the
Rules made thereunder.
5. We conducted our audit in accordance with the Standards
on Auditing specified under Section 143(10) of the Act.
Those Standards require that we comply with ethical
requirements and plan and perform the audit to obtain
reasonable assurance about whether the consolidated
financial statements are free from material misstatement.
6. An audit involves performing procedures to obtain
audit evidence about the amounts and the disclosures
in the consolidated financial statements. The procedures
selected depend on the auditor’s judgment, including the
assessment of the risks of material misstatement of the
consolidated financial statements, whether due to fraud
or error. In making those risk assessments, the auditor
considers internal financial controls relevant to the Holding
Company’s preparation of the consolidated financial
statements that give a true and fair view in order to design
audit procedures that are appropriate in the circumstances,
but not for the purpose of expressing an opinion on whether
the Holding Company has in place an adequate internal
financial controls system over financial reporting and
the operating effectiveness of such controls. An audit also
includes evaluating the appropriateness of the accounting
policies used and the reasonableness of the accounting
estimates made by the Holding Company’s Board of
Directors, as well as evaluating the overall presentation of
the consolidated financial statements.
7. We believe that the audit evidence obtained by us and the
audit evidence obtained by the other auditors in terms of
their reports referred to in sub-paragraph 10 of the Other
Matters paragraph below, is sufficient and appropriate to
provide a basis for our audit opinion on the consolidated
financial statements.
Opinion8. In our opinion and to the best of our information and
according to the explanations given to us and based on
the consideration of the reports of the other auditors on
the financial statements of the subsidiaries, associates
and jointly controlled entities as noted below, the aforesaid
consolidated financial statements give the information
required by the Act in the manner so required and give a true
and fair view in conformity with the accounting principles
generally accepted in India, of the consolidated state of
affairs of the Group, its associates and jointly controlled
entities as at 31 March 2015, and their consolidated profit
and their consolidated cash flows for the year ended on
that date.
Emphasis of Matter9. We draw attention to notes 3.3(a) and 3.3(b) to the
accompanying financial statements which describe
the uncertainty related to the outcome of litigations in
connection with certain deductions being disallowed which,
according to the management, is due to retrospective

Corporate
Overview
Statutory
Reports
123
Financial
Statements
amendment of section 80-IA of the Income tax Act, 1961
pursuant to Finance Act, 2009. Our opinion is not qualified
in respect of this matter.
Other Matter10. We did not audit the financial statements of 20 subsidiaries
and 1 jointly controlled entities, included in the consolidated
financial statements, whose financial statements reflect
total assets (after eliminating intra-group transactions)
of ` 93,208 Lakhs as at 31 March 2015, total revenues
(after eliminating intra-group transactions) of ` 1,21,501
Lakhs and net cash flows amounting to ` (4,756) Lakhs for
the year ended on that date. The consolidated financial
statements also include the Group’s share of net profit of
` 159 Lakhs for the year ended 31 March 2015, as considered
in the consolidated financial statements, in respect of
one associate, whose financial statements have not been
audited by us. These financial statements have been audited
by other auditors whose reports have been furnished to us
by the Management and our opinion on the consolidated
financial statements, in so far as it relates to the amounts
and disclosures included in respect of these subsidiaries,
jointly controlled entities and associates, and our report in
terms of sub-sections (3) and (11) of Section 143 of the Act,
in so far as it relates to the aforesaid subsidiaries, jointly
controlled entities and associates, is based solely on the
reports of the other auditors.
Our opinion on the consolidated financial statements, and
our report on Other Legal and Regulatory Requirements
below, is not modified in respect of the above matters with
respect to our reliance on the work done by and the reports
of the other auditors.
Report on Other Legal and Regulatory Requirements11. As required by Section 143(3) of the Act, and based on the
auditor’s reports of the subsidiaries, associates and jointly
controlled entities, we report, to the extent applicable, that:
a) We have sought and obtained all the information and
explanations which to the best of our knowledge and
belief were necessary for the purpose of our audit of the
aforesaid consolidated financial statements;
b) in our opinion, proper books of account as required
by law relating to preparation of the aforesaid
consolidated financial statements have been kept so far
as it appears from our examination of those books and
the reports of the other auditors;
c) The consolidated financial statements dealt with by
this Report are in agreement with the relevant books of
account maintained for the purpose of preparation of
the consolidated financial statements;
d) in our opinion, the aforesaid consolidated financial
statements comply with the Accounting Standards
specified under Section 133 of the Act, read with Rule 7
of the Companies (Accounts) Rules, 2014(as amended);
e) On the basis of the written representations received
from the directors of the Holding Company as on
31 March 2015 taken on record by the Board of Directors
of the Holding Company and the reports of the other
statutory auditors of its subsidiary companies and
associate companies and jointly controlled companies
incorporated in India, none of the directors of the
Group companies, its associate companies and
jointly controlled companies, incorporated in India is
disqualified as on 31 March 2015 from being appointed
as a director in terms of Section 164 (2) of the Act.
f) With respect to the other matters to be included in
the Auditor’s Report in accordance with Rule 11 of
the Companies (Audit and Auditor’s) Rules, 2014, in
our opinion and to the best of our information and
according to the explanations given to us:
(i) as detailed in note 3.3(a) and (b) to the consolidated
financial statements, the Company has disclosed
the impact of pending litigations on its consolidated
position;
(ii) as detailed in note 10 (c) to the consolidated financial
statements, provision has been made in the consolidated
financial statements, as required under the applicable
law or accounting standards, for material foreseeable
losses on long-term contracts including derivative
contracts;
(iii) There were no amounts which were required to be
transferred to the Investor Education and Protection
Fund by the Holding Company, and its subsidiary
companies, associate companies and joint controlled
companies incorporated in India.
For Walker Chandiok & Co LLP
(Formerly Walker, Chandiok & Co)
Chartered Accountants
Firm’s Registration No.: 001076N/N500013
per Sumesh ES
Partner
Membership No.: 206931
Place : Chennai
Date : 25 May 2015

124 VA TECH WABAG LIMITED | Annual Report 2014-15
Consolidated
Consolidated Balance Sheet
` In Lakhs
NoteAs at
31 March 2015
As at
31 March 2014
EQUITY AND LIABILITIES
Shareholders’ funds
Share capital 4 1,086 532
Reserves and surplus 5 89,178 83,563
90,264 84,095
Share application money pending allotment 6 13 22
Minority interest 486 282
Non-current liabilities
Long-term borrowings 7 6,932 4,496
Deferred tax liabilities 8 300 367
Other long term liabilities 9 21,126 15,734
Long-term provisions 10 2,799 2,143
31,157 22,740
Current liabilities
Short-term borrowings 7 11,132 11,329
Trade payables 11 86,531 86,195
Other current liabilities 12 21,105 23,714
Short-term provisions 10 16,087 15,196
1,34,855 1,36,434
Total 2,56,775 2,43,573
ASSETSNon-current assets
Fixed assets
Tangible assets 13 10,696 10,806
Intangible assets 13 8,437 1,112
Capital work-in-progress 55 74
Intangible assets under development 6,846
Non-current investments 14 274 315
Deferred tax assets, net 8 2,289 1,070
Long-term loans and advances 15 955 97
Other non-current assets 16 22,668 19,725
45,374 40,045
Current assets
Current investments 17 3,500 2,000
Inventories 18 4,699 3,502
Trade receivables 19 1,48,066 1,38,748
Cash and bank balances 20 31,117 37,016
Short-term loans and advances 15 10,629 9,946
Other current assets 21 13,390 12,316
2,11,401 2,03,528
Total 2,56,775 2,43,573
Notes 1 to 37 form an integral part of these consolidated financial statements
This is the consolidated balance sheet referred to in our report of even date
For Walker Chandiok & Co LLP For and on behalf of the Board of Directors of
(formerly Walker, Chandiok & Co) VA Tech Wabag Limited
Chartered Accountants
per Sumesh E S Rajiv Mittal Sumit Chandwani
Partner Managing Director Director
S Varadarajan Rajiv Balakrishnan
Chief Financial Officer Company Secretary
Place : Chennai Place : Chennai
Date : 25 May 2015 Date : 25 May 2015
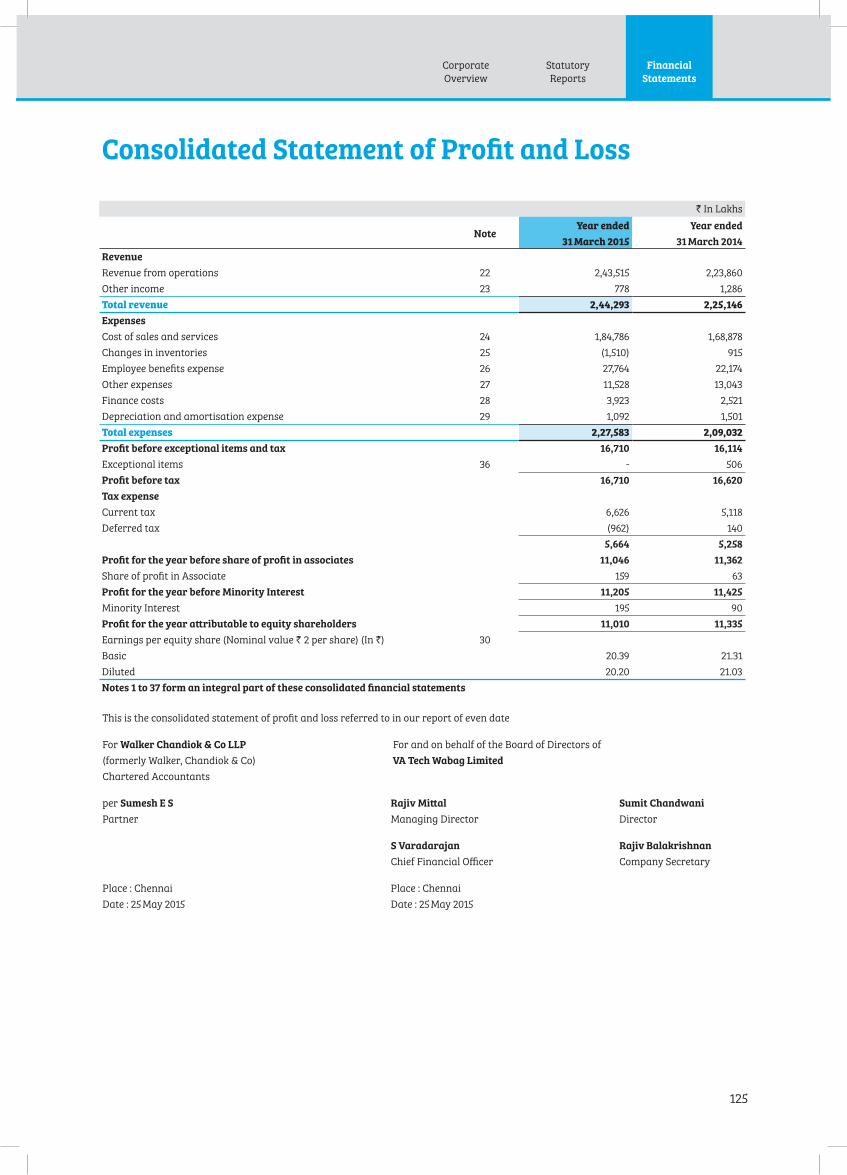
Corporate
Overview
Statutory
Reports
125
Financial
Statements
Consolidated Statement of Profit and Loss
This is the consolidated statement of profit and loss referred to in our report of even date
For Walker Chandiok & Co LLP For and on behalf of the Board of Directors of
(formerly Walker, Chandiok & Co) VA Tech Wabag Limited
Chartered Accountants
per Sumesh E S Rajiv Mittal Sumit Chandwani
Partner Managing Director Director
S Varadarajan Rajiv Balakrishnan
Chief Financial Officer Company Secretary
Place : Chennai Place : Chennai
Date : 25 May 2015 Date : 25 May 2015
` In Lakhs
Note Year ended
31 March 2015
Year ended
31 March 2014
Revenue
Revenue from operations 22 2,43,515 2,23,860
Other income 23 778 1,286
Total revenue 2,44,293 2,25,146
Expenses
Cost of sales and services 24 1,84,786 1,68,878
Changes in inventories 25 (1,510) 915
Employee benefits expense 26 27,764 22,174
Other expenses 27 11,528 13,043
Finance costs 28 3,923 2,521
Depreciation and amortisation expense 29 1,092 1,501
Total expenses 2,27,583 2,09,032
Profit before exceptional items and tax 16,710 16,114
Exceptional items 36 - 506
Profit before tax 16,710 16,620
Tax expense
Current tax 6,626 5,118
Deferred tax (962) 140
5,664 5,258
Profit for the year before share of profit in associates 11,046 11,362
Share of profit in Associate 159 63
Profit for the year before Minority Interest 11,205 11,425
Minority Interest 195 90
Profit for the year attributable to equity shareholders 11,010 11,335
Earnings per equity share (Nominal value ` 2 per share) (In `) 30
Basic 20.39 21.31
Diluted 20.20 21.03
Notes 1 to 37 form an integral part of these consolidated financial statements
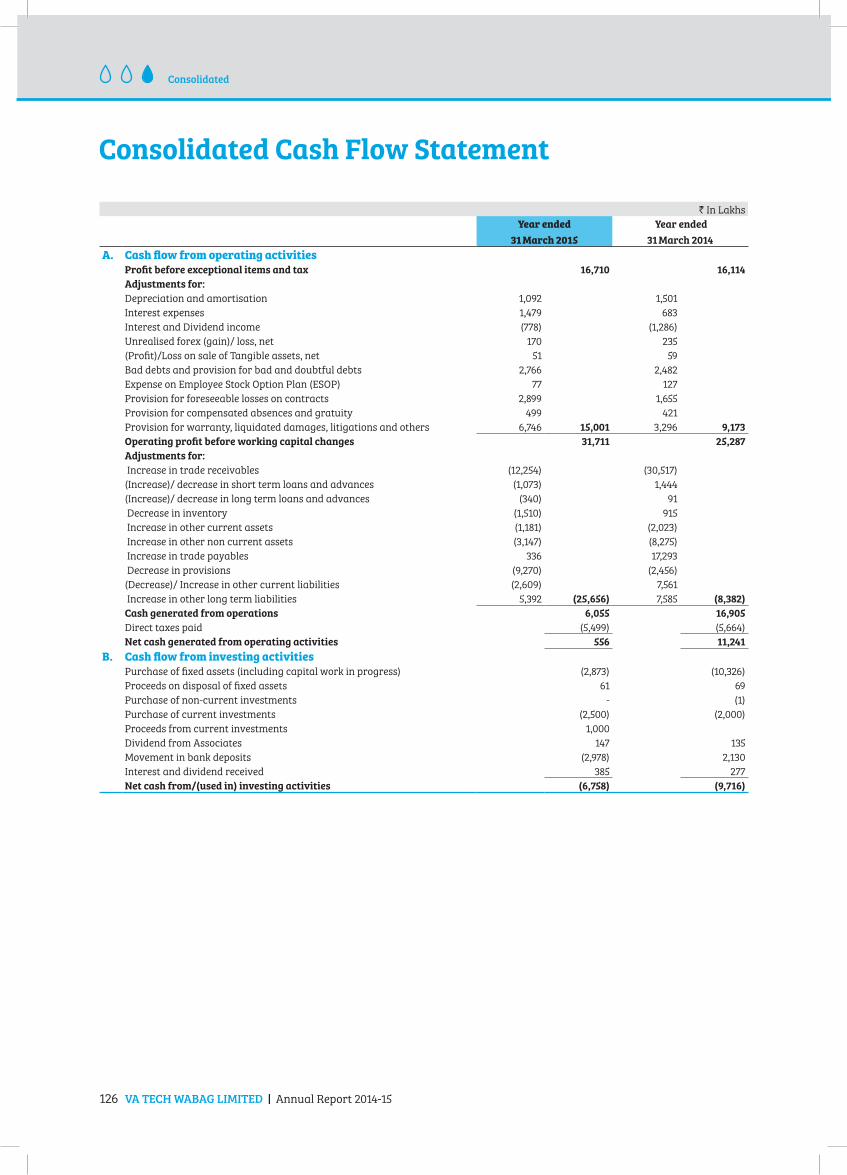
126 VA TECH WABAG LIMITED | Annual Report 2014-15
Consolidated
Consolidated Cash Flow Statement
` In Lakhs
Year ended
31 March 2015
Year ended
31 March 2014
A. Cash flow from operating activities
Profit before exceptional items and tax 16,710 16,114
Adjustments for:
Depreciation and amortisation 1,092 1,501
Interest expenses 1,479 683
Interest and Dividend income (778) (1,286)
Unrealised forex (gain)/ loss, net 170 235
(Profit)/Loss on sale of Tangible assets, net 51 59
Bad debts and provision for bad and doubtful debts 2,766 2,482
Expense on Employee Stock Option Plan (ESOP) 77 127
Provision for foreseeable losses on contracts 2,899 1,655
Provision for compensated absences and gratuity 499 421
Provision for warranty, liquidated damages, litigations and others 6,746 15,001 3,296 9,173
Operating profit before working capital changes 31,711 25,287
Adjustments for:
Increase in trade receivables (12,254) (30,517)
(Increase)/ decrease in short term loans and advances (1,073) 1,444
(Increase)/ decrease in long term loans and advances (340) 91
Decrease in inventory (1,510) 915
Increase in other current assets (1,181) (2,023)
Increase in other non current assets (3,147) (8,275)
Increase in trade payables 336 17,293
Decrease in provisions (9,270) (2,456)
(Decrease)/ Increase in other current liabilities (2,609) 7,561
Increase in other long term liabilities 5,392 (25,656) 7,585 (8,382)
Cash generated from operations 6,055 16,905
Direct taxes paid (5,499) (5,664)
Net cash generated from operating activities 556 11,241
B. Cash flow from investing activities
Purchase of fixed assets (including capital work in progress) (2,873) (10,326)
Proceeds on disposal of fixed assets 61 69
Purchase of non-current investments - (1)
Purchase of current investments (2,500) (2,000)
Proceeds from current investments 1,000
Dividend from Associates 147 135
Movement in bank deposits (2,978) 2,130
Interest and dividend received 385 277
Net cash from/(used in) investing activities (6,758) (9,716)

Corporate
Overview
Statutory
Reports
127
Financial
Statements
This is the Consolidated cash flow statement referred to in our report of even date
For Walker Chandiok & Co LLP For and on behalf of the Board of Directors of
(formerly Walker, Chandiok & Co) VA Tech Wabag Limited
Chartered Accountants
per Sumesh E S Rajiv Mittal Sumit Chandwani
Partner Managing Director Director
S Varadarajan Rajiv Balakrishnan
Chief Financial Officer Company Secretary
Place : Chennai Place : Chennai
Date : 25 May 2015 Date : 25 May 2015
` In Lakhs
Year ended
31 March 2015
Year ended
31 March 2014
C. Cash flow from financing activities
Proceeds from issue of share capital including share premium and share
application money
1,957 147
Proceeds from issue of shares to minority shareholders of overseas
subsidiaries
- -
Repayment of Borrowings (38,648) (21,526)
Proceeds from Borrowings 40,887 29,133
Interest paid to Banks and others (1,479) (816)
Dividend paid (2,139) (1,857)
Dividend distribution tax paid (363) (316)
Dividend paid to minority shareholders of overseas subsidiaries - -
Net cash from/(used in) financing activities 215 4,765
D. Net cash flows during the year (5,987) 6,290
Effects of foreign currency translation (3,094) 2,355
E. Cash and cash equivalents at the beginning 33,038 24,393
F. Cash and cash equivalents at the end 23,957 33,038
Cash and cash equivalents comprise of:
Cash on hand 154 102
Cheques on hand 9,088 5,714
Balances with banks - in current accounts 10,112 20,859
Balances with banks - in deposit accounts (maturity upto 3 months) 4,603 6,363
Cash and cash equivalents as per note 20 23,957 33,038

128 VA TECH WABAG LIMITED | Annual Report 2014-15
Summary of the Significant Accounting Policies and Other Explanatory Information
Consolidated
1. General Information Va Tech Wabag Limited (‘the Company’), its subsidiaries,
associates and joint ventures as listed in note 2.2
(collectively referred to as ‘the Group’) is one of the
world’s leading companies in the water treatment field.
The group’s principal activities include design, supply,
installation, construction and operational management
of drinking water, waste water treatment, industrial
water treatment and desalination plants. The shares of
the Company are listed in the Bombay Stock Exchange
(BSE) and National Stock Exchange (NSE).
All amounts in the consolidated financial statements
are presented in ` in Lakhs except per share data and as
otherwise stated. Figures for the previous year have been
regrouped / rearranged wherever considered necessary
to conform to the figures presented in the current year.
The Group is in the business of execution of turnkey
projects for water management and hence the
requirements under paragraph 5(ii)(a), 5(ii)(b) and 5(ii)
(d) of Part II of Schedule III to the Companies Act, 2013
are not applicable.
2. Summary of accounting policies 2.1 Basis of accounting
The financial statements are prepared under
the historic cost convention on accrual basis of
accounting in accordance with generally accepted
accounting principles (“GAAP”) applicable in India.
GAAP comprises mandatory accounting standards
prescribed under Section 133 of the Companies Act,
2013 read with Rule 7 of the Companies (Accounts)
Rules, 2014 (as amended) and pronouncements of
the Institute of Chartered Accountants of India and
guidelines issued by the Securities and Exchange
Board of India (SEBI). Accounting policies have been
consistently applied as in the previous year except
for the change in accounting policy explained in
note 13 (c). The management evaluates all recently
issued or revised accounting standards on an
ongoing basis.
2.2 Basis of Consolidation
The Consolidated financial statements include the
financial statements of the Subsidiary companies
and associates as listed below. The financial
statements of the subsidiary undertakings and
associates forming part of these consolidated
financial statements are drawn up to 31 March 2015.
Subsidiaries are all entities over which the Company
has the ability to control the financial and operating
policies. All material inter-company transactions
and accounts are eliminated on consolidation.
The following subsidiaries, associates and joint ventures have been included in the consolidated financial statements:
Subsidiaries Country of
Incorporation
Percentage of Holding/
Interest As at 31 March
2015 2014
Va Tech Wabag (Singapore) Pte Ltd Singapore 100 100
Va Tech Wabag GmbH Austria 100 100
WABAG Wassertechnik AG Switzerland 100 100
Va Tech Wabag Deutschland GmbH Germany 100 100
Va Tech Wabag Brno Spol S.R.O Czech Republic 100 100
Wabag Water Services (Macao) Limited Macao 100 100
WABAG Water Services s.r.l Romania 100 100
Va Tech Wabag Tunisia s.a.r.l. Tunisia 100 100
Va Tech Wabag Algeria s.a.r.l. Algeria 100 100
Beijing Va Tech Wabag Water Treatment Technology Co. Limited China 100 100
VA Tech Wabag Tecknolojisi Ve Ticaret Limited Turkey 100 100
Va Tech Wabag (Hong Kong) Limited Hong Kong 100 100
Ujams Wastewater Treatment Company (Pty) Ltd. Namibia 78.90 82
Va Tech Wabag (SPAIN) S.LU Spain 100 100
VA Tech Wabag Muscat LLC Oman 70 70

Corporate
Overview
Statutory
Reports
129
Financial
Statements
Subsidiaries Country of
Incorporation
Percentage of Holding/
Interest As at 31 March
2015 2014
VA Tech Wabag (Philippines) Inc Philippines 100 100
VA Tech Wabag Limited Pratibha Industries Limited JV Nepal 100 100
Wabag Operation and Maintenance W.L.L. (Incorporated on 3 March 2015) Bahrain 70 -
VA Tech Wabag and Roots Contracting L.L.C. (Incorporated on 29 March 2015) Qatar 60 -
Wabag Limited (Incorporated on 20 October 2014) Thailand 90.60 -
Associates
Windhoek Goreangab Operating Company (Pty) Limited Namibia 33.00 33.00
Joint Venture
International Water Treatment LLC Oman 32.50 32.50
The following subsidiaries, associates and joint ventures have been included in the consolidated financial statements: (Contd.)
The subsidiary in Egypt, VA Tech Wabag Egypt
Limited, has completed the incorporation procedures
but is non-operative; hence the same has not been
consolidated the percentage of shareholding in
this subsidiary is 100% as at 31 March 2015 and
31 March 2014. The accounting period for the
associate in Namibia is 1 January 2014 to 31
December 2014. However, for the purpose of
inclusion in the consolidated financial statements of
the parent, the accounts of the associate company
in Namibia have been drawn up for the period from
1 April 2014 to 31 March 2015.
The group entered into a joint venture with Pratibha
Industries Limited in Nepal to execute a project.
Considering the fact that the group has control
over the governing body and over the operating
and financial decisions of the JV entity, the same
has been treated as a subsidiary in the consolidated
financial statements.
The group entered into a Joint Venture with
Cadagua S.A and Galfar LLC in Oman to construct a
desalination water treatment plant for the Sultanate
of Oman. The group has classified this as a joint
venture and it has been consolidated accordingly.
The group has entered into an exclusive contract
with Roots Contracting L.L.C in Qatar for a share
of 60% in the economic interests in VA Tech Wabag
and Roots Contracting L.L.C., and control in voting
power. Accordingly the investment has been
treated as a subsidiary in the consolidated financial
statements.
2.3 Principles of consolidation:
The Consolidated financial statements are prepared
in accordance with the principles and procedures
required for the preparation and presentation of
consolidated financial statements as laid down
under the accounting standards 21 (AS 21) on
Consolidated Financial Statements, accounting
standards 23 (AS 23) on Accounting for Investments
in Associates in Consolidated Financial Statements
and accounting standards 27 (AS 27) on Financial
Reporting of Interests in Joint Ventures as specified
in the standards prescribed under Section 133 of
the Companies Act, 2013 read with Rule 7 of the
Companies (Accounts) Rules, 2014 (as amended)
and pronouncements of the Institute of Chartered
Accountants of India.
The financial statements of the parent company
and its subsidiary have been combined on a line by
line basis by adding together the book values of like
items of assets, liabilities, income and expenses after
eliminating intra-group balances / transaction and
unrealized profits in full. Unrealised losses resulting
from intra-group transactions are also eliminated
except to the extent recoverable value of related
assets is lower than their cost to the Group. Profit or
loss of subsidiaries acquired or disposed of during
the year is recognised from the effective date of
acquisition, or up to the effective date of disposal, as
applicable.
Investments in Associates are accounted for using
the equity method, under which the investment is
initially recorded at cost, identifying any goodwill
or capital reserve arising at the time of acquisition.
The carrying amount of the investment is adjusted
thereafter for the post acquisition change in the
share of net assets of the Associate. However, the
share of losses is accounted for only to the extent
of the cost of investment. Subsequent profits of
such Associates are not accounted for unless the
130 VA TECH WABAG LIMITED | Annual Report 2014-15
Summary of the Significant Accounting Policies and Other Explanatory Information
Consolidated
accumulated losses (not accounted for by the Group)
are recouped. Where the associate prepares and
presents consolidated financial statements, such
consolidated financial statements of the associate
are used for the purpose of equity accounting. In
other cases, standalone financial statements of
associates are used for the purpose of consolidation.
Interests in the assets, liabilities, income and
expenses of the Joint Ventures are consolidated
using proportionate consolidation method. Intra
group balances, intra-group transactions and
unrealized profit or loss are eliminated to the extent
of the Company’s proportionate share, except where
cost cannot be recovered.
Minorities’ interest in net profits/losses of
consolidated Subsidiaries for the year is identified
and adjusted against the income in order to arrive
at the net income attributable to the shareholders of
the Company. Their share of net assets is identified
and presented in the consolidated balance sheet
separately. Where accumulated losses attributable
to the minorities are in excess of their equity, in the
absence of the contractual/legal obligation on the
minorities, the same is accounted for by the holding
company, except where there is contractual/legal
obligation on minority.
Excess of acquisition cost over the carrying amount
of the parent company’s share of equity of the
acquiree at the date of acquisition is recognized as
goodwill. In cases where the share of the equity in
the acquiree as on the date of acquisition is in excess
of acquisition cost, such excess of share in equity is
recognised as ‘Capital reserve’ and classified under
‘Reserves and Surplus’. The parent company’s share
of equity in the subsidiary is determined on the basis
of book values of assets and liabilities as per the
financial statements of the subsidiary as at the date
of acquisition.
The construction cost incurred by the Group as
part of the Build-Own-Operate-Transfer (BOOT)
contract is considered as exchanged with the
grantor against the right to operate and generate
revenues from the project and the profit from such
contract is considered as realized. Accordingly
BOOT contract awarded to group companies where
work is subcontracted to other group companies,
the intra group transactions on BOOT contract and
the profits arising thereon are taken as realized and
not eliminated on consolidation under AS 21.
The amounts shown in respect of reserves comprise
the amount of relevant reserves as per the balance
sheet of the parent company and its share in the
relevant reserves of the subsidiary.
The financial statements of the entities used for
the purpose of consolidation are drawn up to same
reporting date as that of the Company i.e. year
ended 31 March 2015.
As far as practicable, the consolidated financial
statements are prepared using uniform accounting
policies for like transactions and other events
in similar circumstances and are presented, to
the extent possible, in the same manner as the
Company’s standalone financial statements.
Differences in accounting policies are disclosed
separately.
As per Accounting Standard 21 - Consolidated
Financial Statements prescribed under Section 133
of the Companies Act, 2013 read with Rule 7 of the
Companies (Accounts) Rules, 2014 (as amended)
only the notes involving items which are material
need to be disclosed. Materiality for this purpose is
assessed in relation to the information contained
in the consolidated financial statements. Further,
additional statutory information disclosed in
separate financial statements of the subsidiary or
the parent having no bearing on the true and fair
view of the consolidated financial statements of the
group is not disclosed in the consolidated financial
statements.
2.4 Use of estimates
The preparation of consolidated financial
statements in conformity with generally accepted
accounting principles requires management to
make estimates and assumptions that affect the
reported amounts of assets and liabilities and the
disclosure of contingent assets and liabilities on
the date of the consolidated financial statements
and the results of operations during the reporting
periods. Significant estimates include percentage of
completion of contracts, revenues recognised under
BOOT contracts, estimate of costs to complete,
provision for doubtful receivables and loans
and advances, income taxes, future obligations
under employee benefit plans, estimated useful
life of tangible and intangible assets, provision
for warranty, liquidated damages and litigations
foreseeable. Although these estimates are based
upon management’s best knowledge of current
Corporate
Overview
Statutory
Reports
131
Financial
Statements
events and actions, actual results could differ from
those estimates and any revisions to accounting
estimates is recognised prospectively in the current
and future periods.
Assets and liabilities are classified as current or non-
current as per Group’s normal operating cycle and
other criteria set out in schedule III to the Act. Based
on the nature of work, the Company has ascertained
its operating cycle as up to twelve months for the
purpose of current and non-current classification of
assets and liabilities.
2.5 Tangible assets and depreciation
Tangible assets are stated at acquisition cost less
accumulated depreciation and impairment losses, if
any. Cost of acquisition comprises of purchase price
and directly attributable costs of bringing the asset
to its working condition for the intended use and is
net of refundable duties and taxes. Cost of tangible
assets not ready for the intended use before such
date is disclosed as capital work in progress.
Subsequent expenditure incurred on an item of
tangible asset is added to the book value of that
asset only if this increases the future benefits from
the existing asset beyond its previously assessed
standard of performance.
Gains or losses that arise on disposal or retirement
of an asset are measured as the difference between
net disposal proceeds and the carrying value of an
asset and are recognised in the Statement of profit
and loss when the asset is derecognised.
Depreciation on assets is provided on straight line
method at the rates and in the manner prescribed
in Schedule II to the Companies Act, 2013 except
for vehicles where the management believes that
the useful life of 5 years would best represent the
period over which the Management expects to use
these assets. Hence the useful life of these assets
is different from that prescribed under Part C of
Schedule II to the Companies Act, 2013.
Tangible assets held for sale or retired from active
use are stated at the lower of their net book value
and net realisable value and shown separately in
the financial statements. In addition, any expected
loss is recognized immediately in the statement of
profit and loss.
2.6 Intangible assets and amortisation
Intangible assets acquired separately are measured
on initial recognition at cost. Following initial
recognition, the intangible assets are carried at cost
less accumulated amortisation and accumulated
impairment, if any.
Software is stated at cost less accumulated
amortisation and are being amortised on a straight
line basis over the estimated useful life of 5 years.
Gains or losses that arise on de-recognition or
retirement of an intangible asset are measured as
the difference between net disposal proceeds and
the carrying value of an intangible asset and are
recognised in the Statement of profit and loss when
the intangible asset is derecognised.
The amortisation period and method are reviewed at
each balance sheet date. If the expected useful life of
the asset is significantly different from the previous
estimates, the amortisation period is changed
accordingly. If there has been a significant change
in the expected pattern of economic benefit from
the asset, the method of amortisation is changed
to reflect the changed pattern. Such changes are
accounted in accordance with Accounting Standard
(AS) 5, Net Profit or Loss for the Period, Prior Period
Items and Changes in Accounting Policies.
Intangibles under development
The right to operate and generate revenues from
projects under BOOT contract are capitalized as
an intangible asset under development based on
the cumulative construction costs incurred by the
group including related margins (refer accounting
policy on revenue recognition). This intangible asset
arising out of BOOT contract will be amortised over
the operating period of the concession agreement.
2.7 Impairment of assets
The Group assesses at each balance sheet date
whether there is any indication that an asset may
be impaired. If any such indication exists, the Group
estimates the recoverable amount of the asset.
An asset’s recoverable amount is the higher of an
asset’s or cash generating unit’s (CGU) net selling
price and its value in use. The recoverable amount is
determined for an individual asset, unless the asset
does not generate cash inflows from continuing
use that are largely independent of those from
other assets or group of assets. Where the carrying
amount of an asset or CGU exceeds its recoverable
amount, the asset is considered impaired and is

132 VA TECH WABAG LIMITED | Annual Report 2014-15
Summary of the Significant Accounting Policies and Other Explanatory Information
Consolidated
written down to its recoverable amount and the
reduction is treated as an impairment loss and is
recognised in the Statement of profit and loss.
In assessing value in use, the estimated future cash
flows are discounted to their present value using a
pre-tax discount rate that reflects current market
assessments of the time value of money and the
risks specific to the asset. In determining net selling
price, recent market transactions are taken into
account, if available. If no such transactions can
be identified, an appropriate valuation model is
used. If such recoverable amount of the asset or
the recoverable amount of the cash generating unit
to which the asset belongs is less than its carrying
amount, the carrying amount is reduced to its
recoverable amount. If at the balance sheet date
there is an indication that a previously assessed
impairment loss no longer exists, the recoverable
amount is reassessed and the asset is reflected at
the recoverable amount subject to a maximum
of depreciated historical cost and is accordingly
reversed in the statement of profit and loss.
2.8 Investments
Investments that are readily realizable and are
intended to be held for not more than one year
from the date on which such investments are
made are classified as current investments. All
other investments are classified as long-term
investments. Long-term investments are valued
at cost. Provision is made for diminution in value
to recognize a decline other than temporary in the
value of the investments. Current investments are
valued at lower of cost and fair market value. Gains
or losses that arise on disposal of an investment
are measured as the difference between disposal
proceeds and the carrying value and are recognised
in the Statement of profit and loss.
2.9 Inventories
Inventory of stores and spares are stated at lower of
cost and net realizable value and is determined on
weighted average cost method. Net realisable value
is the estimated selling price in the ordinary course
of business less estimated cost to completion and
applicable selling expenses.
Construction work-in-progress is contract costs
incurred for a future activity on a contract and are
recognized as an asset if it is probable that they
would be recovered. The cost comprises of material
and other expenses directly attributable to the
contract.
2.10 Revenue recognition
Revenue is measured on the basis of consideration
received or receivable by the Group for goods
supplied and services provided, excluding trade
discounts, VAT and other applicable taxes and are
recognised upon the performance of service or
transfer of risk to the customer.
Revenue is recognised when the amount of revenue
can be measured reliably, it is probable that the
economic benefits associated with the transaction
will flow to the Group, the costs incurred or to be
incurred can be measured reliably, and when the
criteria for each of the Group’s different activities
have been met. These activity-specific recognition
criteria are based on the goods or solutions provided
to the customer and the contract conditions in each
case, and are as described below.
Operations and Maintenance
The revenue from operations and maintenance for
water and waste water treatment is recognised over
the period during which the service is rendered.
Construction contracts
Contract Revenue and Contract Costs in respect of
construction contracts, execution of which is spread
over different accounting periods is recognized as
revenue and expense respectively by reference to
the basis of percentage of completion method of the
project at the Balance Sheet date.
For the Company, determination of revenues under
the percentage of completion method is based on
estimates (some of which are technical in nature)
concerning the percentage of completion, which is a
proportion of work certified to contract value, costs
to completion, expected revenue from the contract
and the foreseeable losses of completion.
For overseas entities, determination of revenues
under the percentage of completion method is
based on estimates concerning the percentage of
completion, which is determined by the proportion
that contract costs incurred for the work performed
bear to the estimated total contract costs up to the
balance sheet date.

Corporate
Overview
Statutory
Reports
133
Financial
Statements
Current tax is payable on taxable profits, which
differ from profit or loss in the financial statements.
Current tax is computed based on tax rates and
tax laws that have been enacted or substantially
enacted by the end of the reporting period.
Deferred income taxes reflect the impact of
timing differences between taxable income and
accounting income for the year and reversal of
timing differences of earlier years. Deferred tax is
measured based on the tax rates and the tax laws
enacted or substantively enacted at the balance
sheet date. Deferred tax assets are recognised only
to the extent that there is reasonable certainty that
sufficient future taxable income will be available
against which such deferred tax assets can be
realised. The carrying amount of deferred tax
assets are reviewed by the Group management at
each balance sheet date and the carrying amount
of a deferred tax asset is written down to the extent
that it is no longer reasonably certain or virtually
certain, as the case may be, that sufficient future
taxable income will be available against which
deferred tax asset can be realised.
Unrecognised deferred tax assets of earlier years
are re-assessed and recognised to the extent that
it has become reasonably certain that future
taxable income will be available against which such
deferred tax assets can be realised.
The Group offsets deferred tax assets and deferred
tax liabilities if there is a legally enforceable right
to set off assets against liabilities representing
current tax.
2.13 Borrowing costs
Borrowing cost includes interest incurred in
connection with the arrangement of borrowings.
Borrowing costs directly attributable to the
acquisition or construction of an asset that
necessarily takes a substantial period of time to get
ready for its intended use are capitalized as part of
the cost of the respective asset. All other borrowing
costs are expensed in the period they are incurred.
2.14 Foreign currency transactions
Transactions in foreign currency and non-monetary
assets are accounted for at the exchange rate
prevailing on the date of the transaction duly
approximated. All monetary items denominated
in foreign currency are converted at the year-end
exchange rate. The exchange differences arising
Foreseeable losses, if any, which are based on
technical estimates, are provided in the accounts
irrespective of the work done.
Unearned revenue on contracts where progress
billings exceed costs incurred plus recognized profits
(less loss) is the gross advance amount received
from customers for contract work and is presented
as a liability for all contracts in progress.
Revenue relatable to construction services rendered
in connection with BOOT projects undertaken by the
group is recognized during the period of construction
and is measured at fair value of consideration
receivable using percentage of completion method.
After the completion of construction period, revenue
relatable to collections of such projects from users
of facilities is accounted when the amount is due
and recovery is certain.
Other revenues
Income from interest is being accounted for on time
proportion basis taking into account the amount
outstanding and the applicable rate of interest.
Dividend income is recognised when the right to
receive is established by the reporting date.
Income from duty drawback and export benefit
under duty free credit entitlements is recognized
in the Statement of profit and loss, when the right
to receive license as per terms of the scheme is
established in respect of exports made and there is
no significant uncertainty regarding the ultimate
collection of the export proceeds, as applicable.
2.11 Cost of Sales and Services
Cost of sales and services comprise costs including
estimated costs that are directly related to the
contract, attributable to the contract activity in
general and such costs that can be allocated to the
contract and specifically chargeable to the customer
under the terms of the contracts, which is charged to
the statement of profit and loss account based on the
percentage of revenue recognised as per accounting
policy (2.9) above, in consonance with the concept
of matching costs and revenue. Final adjustment is
made on completion of the applicable project.
2.12 Taxation
Provision for tax for the year comprises current
income tax and deferred tax. Provision for current
income tax is made based on the estimated tax liability
in accordance with the relevant tax rates and tax laws.

134 VA TECH WABAG LIMITED | Annual Report 2014-15
Summary of the Significant Accounting Policies and Other Explanatory Information
Consolidated
on such conversion and on settlement of the
transactions are dealt with in the statement of
profit and loss.
Gain or loss on forward exchange contract, not in
the nature of hedge, is calculated based on difference
between forward rate available at the reporting date
for the remaining maturity of the contract and the
contracted forward rate. The premium or discount
arising at the inception of forward exchange
contracts is amortized as income or expense over
the life of contract and exchange differences on
such contracts is recognised as income or expense
in the reporting period in which the exchange rate
change. Any profit or loss arising on cancellation or
renewal of forward foreign exchange contracts is
recognised as income or expense for the year upon
such cancellation or renewal.
2.15 Translation of integral and non-integral foreign
operations
The group classifies all its foreign operations as
either “integral foreign operations” or “non- integral
foreign operations”.
The financial statements of an integral foreign
operation are translated as if the transactions
of the foreign operation have been those of the
Company itself. The assets and liabilities of a
non-integral foreign operation are translated
into the reporting currency at the exchange rate
prevailing at the reporting date. Items of profit
and loss are translated at the average exchange
rates for the year. The exchange differences arising
on translation are accumulated in the foreign
currency translation reserve. On disposal of a non-
integral foreign operation, the accumulated foreign
currency translation reserve relating to that foreign
operation is recognized in the statement of profit
and loss.
2.16 Retirement and other employee benefits
Provident fund
The Parent Company makes contribution to the
statutory provident fund in accordance with
Employees Provident Fund and Miscellaneous
Provisions Act, 1952, which is a defined contribution
plan, and contribution paid or payable is recognized
as an expense in the period in which it falls due.
Gratuity
Gratuity is a post-employment benefit and is in the
nature of a defined benefit obligation. The liability
recognised in the balance sheet in respect of gratuity
is the present value of the defined benefit obligation
at the balance sheet date less the fair value of plan
assets. The defined benefit obligation is calculated
at the balance sheet date by an independent actuary
using the projected unit credit method. Actuarial
gains and losses arising from past experience and
changes in actuarial assumptions are charged or
credited to the statement of profit and loss in the
year in which such losses or gains are determined.
Compensated absences
Liability in respect of compensated absences
becoming due or expected to be availed after the
balance sheet date is estimated on the basis of an
actuarial valuation performed by an independent
actuary using the projected unit credit method.
Actuarial gains and losses arising from past
experience and changes in actuarial assumptions
are charged or credited to the profit and loss
account in the year in which such losses or gains are
determined. Accumulated compensated absences
which are expected to be availed or encashed
beyond 12 month from the end of the year end are
treated as other long term employee benefits.
Superannuation Fund
Contribution made towards Superannuation
Fund (funded by payments to ICICI Prudential Life
Insurance) which is a defined contribution plan, is
charged to revenue on accrual basis. There are no
obligations other than the contribution made to
respective fund.
Overseas entities
Post-employment benefits
Defined contribution
The group’s contribution towards defined
contribution plan is accrued in compliance
with the requirement of the domestic laws of
the countries in which the consolidated entities
operate in the year of which the contributions
are done. Payments to defined contribution
retirement benefit plans are charged as an
expense as they fall due.
Defined benefit liability
Management estimates the defined benefit
liability annually. The actual outcome may vary
due to estimation uncertainties. The estimate of

Corporate
Overview
Statutory
Reports
135
Financial
Statements
its defined benefit liability is based on standard
rates of inflation, medical cost trends and
mortality. It also takes into account the Group’s
specific anticipation of future salary increases.
Discount factors are determined close to
each year-end by reference to high quality
corporate bonds that are denominated in the
currency in which the benefits will be paid and
that have terms to maturity approximating
to the terms of the related pension liability.
Estimation uncertainties exist particularly with
regard to medical cost trends, which may vary
significantly in future appraisals of the Group’s
defined benefit obligations.
2.17 Employees stock option plan
The accounting value of stock options is determined
on the basis of “intrinsic value” representing the
excess of the market price on the date of grant over
the exercise price of the shares granted under the
“Employees Stock Option Scheme” of the Company,
and is being amortised as “Deferred employees
compensation” on a straight-line basis over the
vesting period in accordance with the Guidance
Note 18 “Employee share-based payments” issued by
the Institute of Chartered Accountants of India and
the Employee Stock Option Scheme and Employee
Stock Purchase Scheme Guidelines, 1999 issued by
the Securities and Exchange Board of India.
2.18 Contingent Liabilities
A contingent liability is a possible obligation that
arises from past events whose existence will be
confirmed by the occurrence or non-occurrence of
one or more uncertain future events beyond the
control of the Company or a present obligation that
is not recognized because it is not probable that
an outflow of resources will be required to settle
the obligation. A contingent liability also arises in
extremely rare cases where there is a liability that
cannot be recognized because it cannot be measured
reliably. A disclosure is made for a contingent
liability when there is a:
a) possible obligation, the existence of which
will be confirmed by the occurrence/non-
occurrence of one or more uncertain events, not
fully within the control of the Company;
b) present obligation, where it is not probable that
an outflow of resources embodying economic
benefits will be required to settle the obligation;
c) present obligation, where a reliable estimate
cannot be made.
2.19 Provisions
A provision is recognised when the Group has a
present obligation as a result of past event i.e.,
it is probable that an outflow of resources will
be required to settle the obligation in respect of
which a reliable estimate can be made. Provisions
are not discounted to its present value and are
determined based on best estimate required to settle
the obligation at the Balance Sheet date. These are
reviewed at each Balance Sheet date and adjusted to
reflect the current best estimates. A disclosure of the
contingent liability is made when there is a possible
or a present obligation that may, but probably will
not, require an outflow of resources.
2.20 Cash and Cash equivalents
In the cash flow statement, cash and cash equivalent
includes cash in hand, demand deposits with banks,
cheques on hand, balances with banks in current
accounts and other short term deposits with banks,
other short term highly liquid investments with
original maturities of three months or less.
2.21 Earnings per share
Basic earnings per share is calculated by dividing the
net profit or loss for the period attributable to equity
shareholders (after deducting preference dividends
and attributable taxes, if any) by the weighted
average number of equity shares outstanding
during the period. The weighted average number
of equity shares outstanding during the period is
adjusted for events including a bonus issue, bonus
element in a rights issue to existing shareholders,
share split and reverse share split (consolidation
of shares). For the purpose of calculating diluted
earnings per share, the net profit or loss for the
period attributable to equity shareholders and the
weighted average number of shares outstanding
during the period are adjusted for the effects of all
dilutive potential equity shares.
2.22 Segment reporting
Identification of segments
The Group is engaged in the construction and
maintenance of water treatment plants which is
considered as a single business segment. However,
the entities in the group are organized and
managed separately according to their respective
geographical location. The analysis of geographical
segments is based on the areas in which major
operating divisions of the Group operate.

136 VA TECH WABAG LIMITED | Annual Report 2014-15
Summary of the Significant Accounting Policies and Other Explanatory Information
Consolidated
Unallocated items
Unallocated items include general corporate income
and expense items which are not allocated to any
business segment.
Segment accounting policies
The Group prepares its segment information in
conformity with the accounting policies adopted for
preparing and presenting the financial statements
of the Group as a whole.
3 Others 3.1 Capital Commitments
The estimated amounts of contracts to be executed on capital account and not provided for (net of advances) ` 516
Lakhs (Previous year – ` 3,927 Lakhs). Other commitments are cancellable at the option of the Group and hence not
disclosed.
3.2 Guarantees
` In Lakhs
As at
31 March 2015
As at
31 March 2014
Corporate Guarantees issued by the Company on behalf of third party
- For Ferrovial Agroman 43,842 41,886
3.3 Contingent liabilities
` In Lakhs
As at
31 March 2015
As at
31 March 2014
Income tax impact on account of non-deductibility U/s
80-IA (Refer ‘a’ below) 2,422 2,422
- Out of the above, Income tax demand contested in appeal 939 939
Interest U/s 234B on the tax liability referred above (Refer ‘b’ below) 2,559 2,263
Sales tax matters under dispute (Refer ‘c’ below) 1,875 1,913
Tax liability of the permanent establishment in Algeria (Refer ‘d’ below) 3,057 3,702
a) The Company had been claiming deduction
under section 80-IA of the Income Tax Act, 1961
from the financial year ended 31 March 2002 as
a developer of infrastructure projects in India.
The Finance Act 2009 amended the provisions
of Section 80-IA retrospectively with effect
from 1 April 2000 to make it inapplicable for
persons having a mere works contract with
the government or statutory authority. The
Company believes that this amendment is in
line with the objective of the government of
incentivising only a developer of infrastructure
facility and not a mere works contractor.
2.23 Leases
Leases where the lessor effectively retains
substantially all the risks and benefits of ownership
of the leased asset, is classified as operating leases.
Operating lease payments are recognized as an
expense in the Statement of Profit and Loss on a
straight-line basis over the lease term.
The Company strongly opines that, being
a developer of infrastructure turnkey
development contracts starting from the
conceptualisation to execution assuming
significant financial commitment and risks, the
Company would be treated as a developer and
the amendment would not apply to it. Based
on a legal opinion from a Senior Counsel, the
Company has filed a writ petition in the High
Court of Madras challenging the Constitutional
validity of the retrospective amendment.
Also, the Company has subsequently received
favourable Appellate Orders from CIT (Appeals)

Corporate
Overview
Statutory
Reports
137
Financial
Statements
from financial years 2001-02 to 2006-07
allowing the benefit under section 80-IA of
the Income Tax Act, while, the Income Tax
department has raised a demand for ` 939
Lakhs denying benefit under section 80-IA for
the FY 2008-09. Considering these facts and as a
matter of prudence, the Company has disclosed
the total tax benefit so far claimed u/s 80-IA as
contingent liability in the financial statement
for 31 March 2015.
However, on a conservative basis the liability
on account of possible denial of deduction
prospectively from 1 April 2009 has been fully
provided as current tax in the respective years.
b) The Company, also based on an opinion taken
from a professional firm believes that the
interest under section 234B on account of 80-IA
disallowance discussed in paragraph ‘a’ above
amounting to ` 2,559 Lakhs as at 31 March 2015
would not be payable as the Jurisdictional High
Court rulings and various assessment orders
commencing from FY 2001-02 are in favor of
the Company on this aspect and on this basis,
the amount of interest has been disclosed as
contingent liability.
c) The additional liability assessed by sales tax
authorities for various financial years from
2003-04 to 2012-13 amounts to ` 1,875 Lakhs.
d) During the previous year, VA Tech Wabag
Deutschland GmbH has received a demand
order from the Office of the General Directorate
of Taxes Algeria for an amount of ` 3,057 Lakhs.
The subsidiary noted that there were prima
facie errors on the order and has approached
the relevant authority regarding the same. The
subsidiary, based on expert opinion, is of the
belief that there is more likely than not that
the tax demand received would be overturned
as the subsidiary has discharged all its tax
obligations. Hence this has been disclosed as a
contingent liability.
3.4 Transfer Pricing
As per the Transfer pricing norms, the Company
is required to use certain specific methods in
computing arm’s length price of international
transactions between the associated enterprises
and maintain prescribed information and
documents relating to such transactions. The
Company has completed the transfer pricing study
for the fiscal year ended 31 March 2014. For the
year ended 31 March 2015, the Company is in the
process of getting an independent evaluation done
for certain transactions to determine whether
the transactions with associated enterprises were
undertaken at “arm’s length price”. Based on the
transfer pricing study, the Management believes
that all transactions with associate enterprises
are at arm’s length price and accordingly, there is
no transfer pricing adjustments for the year under
consideration.
3.5 Corporate Social Responsibility
As mandated by Section 135 of the Companies
Act, 2013, the company has constituted a CSR
committee. The company has identified areas for
its CSR activities as specified in schedule VII of the
Companies Act, 2013 and incurred expenses as
disclosed in Note 27 to these consolidated financial
statements towards such activities.

138 VA TECH WABAG LIMITED | Annual Report 2014-15
Summary of the Significant Accounting Policies and Other Explanatory Information
Consolidated
` In Lakhs
As at
31 March 2015
As at
31 March 2014
Nos. Amount Nos. Amount
4 Share capital
Authorised share capital
Equity Shares of ` 2 each 7,50,00,000 1,500 5,08,75,000 1,018
Preference shares of ` 10 each 48,25,000 482
Issued, subscribed and fully paid up
Equity Shares of ` 2 each 5,42,85,110 1086 2,65,92,130 532
5,42,85,110 1,086 2,65,92,130 532
a) Reconciliation of share capital (Equity)
Balance at the beginning of the year 2,65,92,130 532 2,65,45,772 531
Add : Issued pursuant to Employee Stock Option Plan 5,50,425 11 46,358 1
Add : Issued pursuant to Bonus issue (Also refer note (4e) ) 2,71,42,555 543 - -
Balance at the end of the year 5,42,85,110 1,086 2,65,92,130 532
b) Shareholders holding more than 5% of the aggregate shares in the company
Nos. % holding Nos. % holding
Equity Shares of ` 2 each
Mr. Rajiv Mittal (Managing Director) 97,09,406 18% 48,54,703 18%
IDFC Premier Equity Fund 39,37,178 7% 19,37,417 7%
Emerging Markets Growth Fund Inc 14,66,254 3% 15,84,552 6%
1,51,12,838 83,76,672
c) Details of shares issued as fully paid up by way of bonus issues
Year ended Face value Number of shares
Equity Shares
31 March 2015 2 2,71,42,555
d) Terms/ rights attached to equity shares
The Company has issued only one class of equity shares having a face value of ` 2 per share. Each holder of equity
shares is entitled to one vote per share. The Company declares and pays dividends in Indian Rupees. The dividend
proposed by the Board of Directors, if any, is subject to the approval of the shareholders in the ensuing Annual General
Meeting, except interim dividend, which is approved by the Board of Directors.
In the event of liquidation, the holders of equity shares will be entitled to receive remaining assets of the Company,
after distribution of all preferential amounts, if any. The distribution will be in proportion to the number of equity
shares held by the shareholders.
During the year ended 31 March 2015, the amount of dividend per share, recognised as distributions to the equity
shareholders of face value ` 2 each was ` 4 (Previous year : ` 8).
e) Bonus issue
The Company has allotted 2,71,42,555 fully paid up equity shares of face value ` 2 each during the year ended 31
March 2015, pursuant to the bonus issue approved by the shareholders through postal ballot by capitalization of
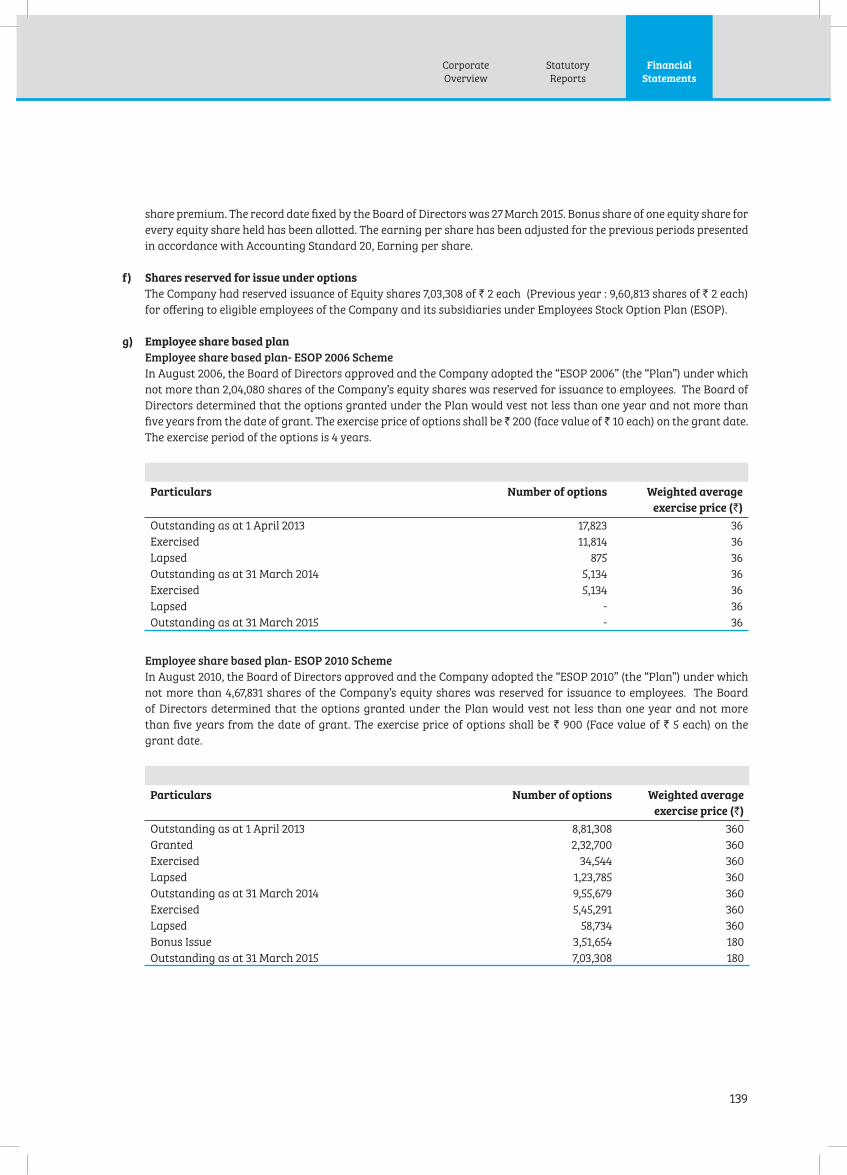
Corporate
Overview
Statutory
Reports
139
Financial
Statements
share premium. The record date fixed by the Board of Directors was 27 March 2015. Bonus share of one equity share for
every equity share held has been allotted. The earning per share has been adjusted for the previous periods presented
in accordance with Accounting Standard 20, Earning per share.
f) Shares reserved for issue under options
The Company had reserved issuance of Equity shares 7,03,308 of ` 2 each (Previous year : 9,60,813 shares of ` 2 each)
for offering to eligible employees of the Company and its subsidiaries under Employees Stock Option Plan (ESOP).
g) Employee share based plan
Employee share based plan- ESOP 2006 Scheme
In August 2006, the Board of Directors approved and the Company adopted the “ESOP 2006” (the “Plan”) under which
not more than 2,04,080 shares of the Company’s equity shares was reserved for issuance to employees. The Board of
Directors determined that the options granted under the Plan would vest not less than one year and not more than
five years from the date of grant. The exercise price of options shall be ` 200 (face value of ` 10 each) on the grant date.
The exercise period of the options is 4 years.
Particulars Number of options Weighted average
exercise price (`)
Outstanding as at 1 April 2013 17,823 36
Exercised 11,814 36
Lapsed 875 36
Outstanding as at 31 March 2014 5,134 36
Exercised 5,134 36
Lapsed - 36
Outstanding as at 31 March 2015 - 36
Employee share based plan- ESOP 2010 Scheme
In August 2010, the Board of Directors approved and the Company adopted the “ESOP 2010” (the “Plan”) under which
not more than 4,67,831 shares of the Company’s equity shares was reserved for issuance to employees. The Board
of Directors determined that the options granted under the Plan would vest not less than one year and not more
than five years from the date of grant. The exercise price of options shall be ` 900 (Face value of ` 5 each) on the
grant date.
Particulars Number of options Weighted average
exercise price (`)
Outstanding as at 1 April 2013 8,81,308 360
Granted 2,32,700 360
Exercised 34,544 360
Lapsed 1,23,785 360
Outstanding as at 31 March 2014 9,55,679 360
Exercised 5,45,291 360
Lapsed 58,734 360
Bonus Issue 3,51,654 180
Outstanding as at 31 March 2015 7,03,308 180
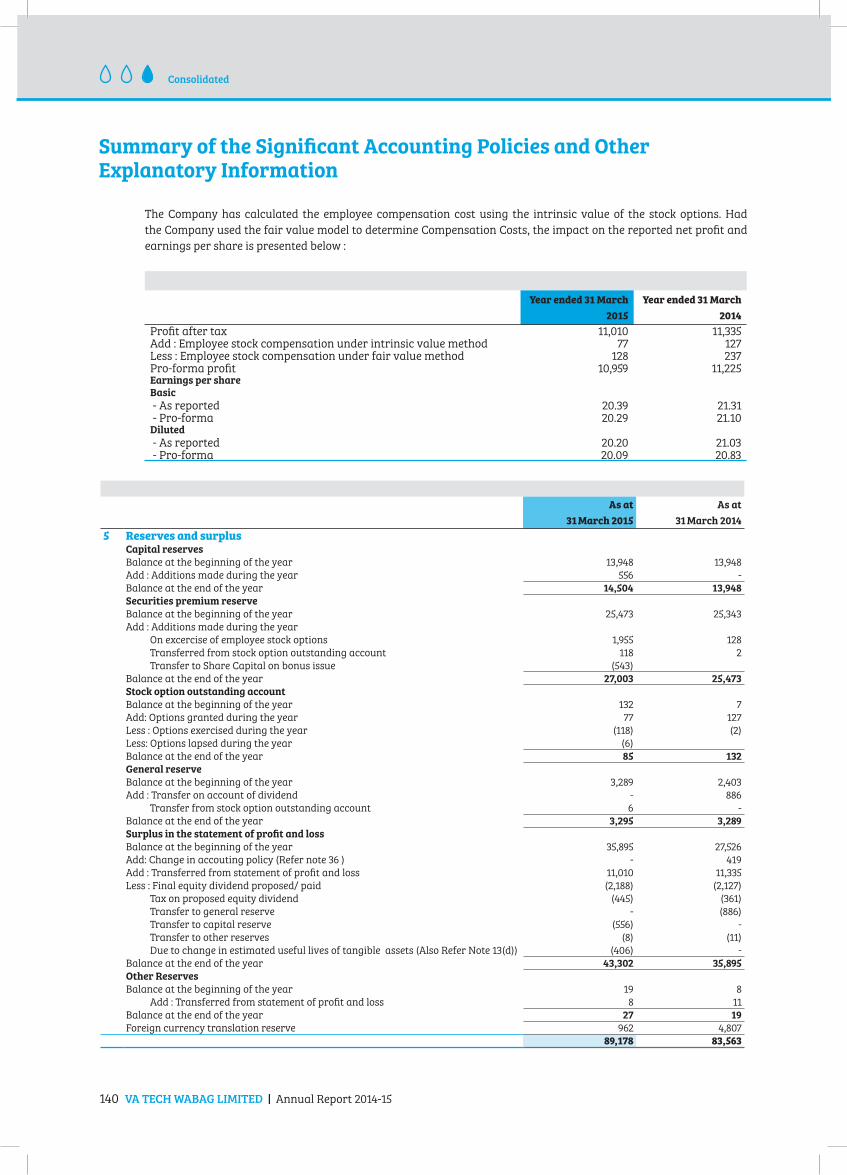
140 VA TECH WABAG LIMITED | Annual Report 2014-15
Summary of the Significant Accounting Policies and Other Explanatory Information
Consolidated
As at
31 March 2015
As at
31 March 2014
5 Reserves and surplusCapital reserves
Balance at the beginning of the year 13,948 13,948
Add : Additions made during the year 556 -
Balance at the end of the year 14,504 13,948
Securities premium reserve
Balance at the beginning of the year 25,473 25,343
Add : Additions made during the year
On excercise of employee stock options 1,955 128
Transferred from stock option outstanding account 118 2
Transfer to Share Capital on bonus issue (543)
Balance at the end of the year 27,003 25,473
Stock option outstanding account
Balance at the beginning of the year 132 7
Add: Options granted during the year 77 127
Less : Options exercised during the year (118) (2)
Less: Options lapsed during the year (6)
Balance at the end of the year 85 132
General reserve
Balance at the beginning of the year 3,289 2,403
Add : Transfer on account of dividend - 886
Transfer from stock option outstanding account 6 -
Balance at the end of the year 3,295 3,289
Surplus in the statement of profit and loss
Balance at the beginning of the year 35,895 27,526
Add: Change in accouting policy (Refer note 36 ) - 419
Add : Transferred from statement of profit and loss 11,010 11,335
Less : Final equity dividend proposed/ paid (2,188) (2,127)
Tax on proposed equity dividend (445) (361)
Transfer to general reserve - (886)
Transfer to capital reserve (556) -
Transfer to other reserves (8) (11)
Due to change in estimated useful lives of tangible assets (Also Refer Note 13(d)) (406) -
Balance at the end of the year 43,302 35,895
Other Reserves
Balance at the beginning of the year 19 8
Add : Transferred from statement of profit and loss 8 11
Balance at the end of the year 27 19
Foreign currency translation reserve 962 4,807
89,178 83,563
The Company has calculated the employee compensation cost using the intrinsic value of the stock options. Had
the Company used the fair value model to determine Compensation Costs, the impact on the reported net profit and
earnings per share is presented below :
Year ended 31 March
2015
Year ended 31 March
2014
Profit after tax 11,010 11,335 Add : Employee stock compensation under intrinsic value method 77 127 Less : Employee stock compensation under fair value method 128 237 Pro-forma profit 10,959 11,225 Earnings per shareBasic
- As reported 20.39 21.31 - Pro-forma 20.29 21.10 Diluted
- As reported 20.20 21.03 - Pro-forma 20.09 20.83

Corporate
Overview
Statutory
Reports
141
Financial
Statements
` In Lakhs
As at
31 March 2015
As at
31 March 2014
Nos. Amount Nos. Amount
6 Share application money pending allotment
Equity Shares of ` 2 each 3,728 13 8,503 22
3,728 13 8,503 22
Share application money pending allotment represents applications received towards subscription from employees under
ESOP schemes. The equity shares are expected to be allotted against the share application money within a reasonable period,
not later than three months from the Balance Sheet date. The Company has sufficient authorised capital to cover the share
capital amount on allotment of above shares.
` In Lakhs
As at 31 March 2015 As at 31 March 2014
Long-term Short-term Long-term Short-term
7 Borrowings
Secured
Term loans from banks
Overdraft account/Packing credit 1,320 6,784 2,056 9,479
Working capital loan repayable on demand - 4,296 - 1,680
1,320 11,080 2,056 11,159
Unsecured
Term loans
From banks - 52 - 170
From other parties 5,612 - 2,440 -
6,932 11,132 4,496 11,329
1 These packing credits are repayable within 180 days from the date of availment and is secured against foreign currency
receivables. During the year the company has availed packing credit in foreign currency amounting to ` 19,247 lakhs
(Previous year: ` 7,246) at an interest rate ranging from 0.9% to 1.5%.
2 VA Tech Wabag GmbH, has secured term loan facilities for an amount of ` 1,699 Lakhs (Previous Year - ` 2,056 Lakhs) which
is secured by parent company guarantee.
3 VA Tech Wabag GmbH, has a working capital loan for an amount of ` 1,457 Lakhs (Previous Year - ` 1,526 Lakhs) which is
repayable on demand and is secured by Raffeisen bank guarantee.
4 VA Tech Wabag Tunisia s.a.r.l., had availed unsecured overdraft facilities for an amount of ` 53 Lakhs during the year
(Previous year ` 170 Lakhs)
5 VA Tech Wabag (Philippines) Inc, has availed a loan of Nil (Previous Year ̀ 6 Lakhs) which was secured by the hypothecation
of a Vehicle.
6 Va Tech Wabag Brno spol. s.r.o, has availed a demand loan of ` 620 Lakhs (Previous year ` 576 Lakhs) during the year which
is secured by trade receivables.
7 VA Tech Wabag Teknolojisi Ve Ticaret Limited Şirket availed a car loan for ` 270 Lakhs (Previous year Nil). The company
also repaid the working capital loan during the year for an amount of ` 147 Lakhs.
8 Ujams Wastewater Treatment Company (Pty) Limited has availed an unsecured loan of ` 434 Lakhs (Previous Year ` 359
Lakhs) from a minority shareholder (Veolia Water Solutions & Technologies South Africa (Pty) Limited) repayable after
one year.

142 VA TECH WABAG LIMITED | Annual Report 2014-15
Summary of the Significant Accounting Policies and Other Explanatory Information
Consolidated
9 Ujams wastewater treatment company (Pty) Limited has availed another unsecured loan of ` 5,178 Lakhs (Previous Year
` 2,078 Lakhs) from a financial institution DEG - Deutshe Investitions - und Entwicklungsgesellschaft mbH (‘DEG”) repayable
in 50 quarterly installments beginning May 2015.
10 During the year, International Water Treatment LLC, Muscat, availed a working capital loan for ` 2,092 Lakhs (Previous
year Nil) .
` In Lakhs
As at
31 March 2015
As at
31 March 2014
8 Deferred taxes
Deferred tax asset arising on account of:
- Provision for employee benefits, liquidated damages and losses 1,487 1,313
- Allowances for bad and doubtful debts 2,948 1,015
Total deferred tax asset 4,435 2,328
Deferred tax liability arising on account of:
- Timing difference between depreciation/amortisation as per financials and
depreciation as per tax
580 536
- Receivables and other assets 1,803 1,126
Total deferred tax liability 2,383 1,662
Foreign exchange fluctuation (63) 37
Total Deferred tax asset, net 1,989 703
Disclosed as
Deferred tax asset 2,289 1,070
Deferred tax liability 300 367
` In Lakhs
As at
31 March 2015
As at
31 March 2014
9 Other long-term liabilities
Trade payables including acceptances
Dues to micro and small enterprises (Also, refer note 11 (a)) - -
Dues to others 15,056 13,101
Advance from customers 5,864 2,465
Others 206 168
21,126 15,734
` In Lakhs
As at 31 March 2015 As at 31 March 2014
Long-term Short-term Long-term Short-term
10 Provisions
Proposed dividend to equity shareholders(Also refer note (a) below) - 2,176 - 2,127
Dividend tax - 443 - 361
Provision for warranty, liquidated damages, litigations and others (Also
refer note (b) below)
430 10,859 509 10,944
Provision for foreseeable losses on contracts (Also refer note (c) below) 1,256 1,697 228 1,427
Provisions for gratuity, anniversary and severance payments (Also refer
note (d) below and note 36)
1,113 102 1,406 70
Provision for taxation (net of advance tax ` 312 lakhs ; previous year
` 952 lakhs)
- 810 - 267
2,799 16,087 2,143 15,196

Corporate
Overview
Statutory
Reports
143
Financial
Statements
` In Lakhs
As at
31 March 2015
As at
31 March 2014
a) Details with respect to proposed dividend
Dividends proposed to
Equity shareholders
Proposed dividend per share 2,176 2,127
Equity shareholders (`) - Face value of ` 2 each 4 8
b) Reconciliation of provision
Provision for warranty, liquidated damages, litigations and others
Balance at the beginning of the year 11,453 10,384
Created during the year, net 8,551 2,442
Utilised during the year (6,910) (2,227)
Foreign exchange fluctuation (1,805) 854
Balance at the end of the year 11,289 11,453
A provision is recognized for expected warranty claims on construction contracts completed, based on past experience of level
of repairs and returns. It is expected that these costs would be predominantely incurred within one year from the balance sheet
date, which generally coincides with the completion of warranty period of the contract. The assumption used to calculate the
provision for warranties are based on the company’s current status of contracts under execution and information available
about expenditure more probable to be incurred based on the company’s warranty period for contracts completed.
The Company provides performance guarantees to its customers which require it to complete projects within a specified time
frame. In the event of failure to complete a project as scheduled, or in case of a performance shortfall, the Company may
generally be held liable for penalties in the form of agreed liquidated damages. The Company provides for liquidated damages
when it reasonably expects that a delay in the completion of the project or a shortfall in the performance parameters might
give rise to a claim from the customer. Liquidated damages are measured and recognized in accordance with the terms of the
contracts with customers.
The Company provides for litigations, which is predominantly on account of disputes on statutory dues. The Company assesses
each demand raised by the statutory authorities and based on responses and discussions with the attorneys and when there
is a present obligation as a result of a past event, where the outflow of economic resources is probable and a reliable estimate
of the amount of obligation, a provision for litigation is created. Instances when there is no present obligation or where the
present obligation would probably not require outflow of resources or where the same cannot be reliably estimated, the same
is disclosed as contingent liability in the financial statements. The Company reverses its provisions on receipt of a favourable
order from the appropriate authority and when no further obligation is envisaged.
` In Lakhs
As at
31 March 2015
As at
31 March 2014
c) Provision for foreseeable losses on contracts
Balance at the beginning of the year 1,655 -
Created during the year, net 2,899 1,655
Utilised during the year (1,601) -
Balance at the end of the year 2,953 1,655
The Company provides for foreseeable losses on contracts when it is probable that total contract cost, including expected cost to
complete, will exceed the economic benefits expected to be received under it.
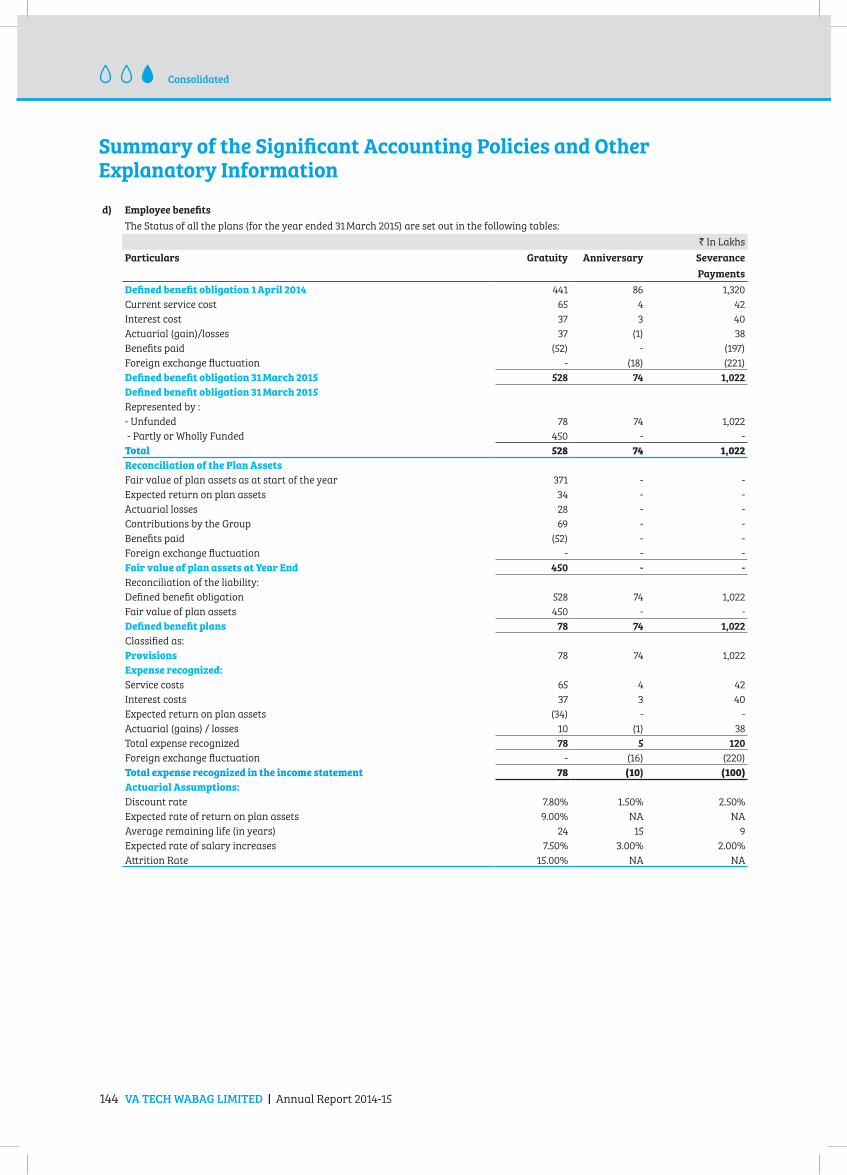
144 VA TECH WABAG LIMITED | Annual Report 2014-15
Summary of the Significant Accounting Policies and Other Explanatory Information
Consolidated
d) Employee benefits
The Status of all the plans (for the year ended 31 March 2015) are set out in the following tables:
` In Lakhs
Particulars Gratuity Anniversary Severance
Payments
Defined benefit obligation 1 April 2014 441 86 1,320
Current service cost 65 4 42
Interest cost 37 3 40
Actuarial (gain)/losses 37 (1) 38
Benefits paid (52) - (197)
Foreign exchange fluctuation - (18) (221)
Defined benefit obligation 31 March 2015 528 74 1,022
Defined benefit obligation 31 March 2015
Represented by :
- Unfunded 78 74 1,022
- Partly or Wholly Funded 450 - -
Total 528 74 1,022
Reconciliation of the Plan Assets
Fair value of plan assets as at start of the year 371 - -
Expected return on plan assets 34 - -
Actuarial losses 28 - -
Contributions by the Group 69 - -
Benefits paid (52) - -
Foreign exchange fluctuation - - -
Fair value of plan assets at Year End 450 - -
Reconciliation of the liability:
Defined benefit obligation 528 74 1,022
Fair value of plan assets 450 - -
Defined benefit plans 78 74 1,022
Classified as:
Provisions 78 74 1,022
Expense recognized:
Service costs 65 4 42
Interest costs 37 3 40
Expected return on plan assets (34) - -
Actuarial (gains) / losses 10 (1) 38
Total expense recognized 78 5 120
Foreign exchange fluctuation - (16) (220)
Total expense recognized in the income statement 78 (10) (100)
Actuarial Assumptions:
Discount rate 7.80% 1.50% 2.50%
Expected rate of return on plan assets 9.00% NA NA
Average remaining life (in years) 24 15 9
Expected rate of salary increases 7.50% 3.00% 2.00%
Attrition Rate 15.00% NA NA

Corporate
Overview
Statutory
Reports
145
Financial
Statements
(Contd.)d) Employee benefits
The Status of all the plans (for the year ended 31 March 2015) are set out in the following tables:
` In Lakhs
Particulars Gratuity Anniversary Severance
Payments
Defined benefit obligation 1 April 2013 365 71 1,130 Current service cost 57 4 38 Interest cost 28 3 41 Actuarial (gain)/losses 10 (1) (32)Benefits paid (19) (6) (57)Foreign exchange fluctuation - 15 200 Defined benefit obligation 31 March 2014 441 86 1,320 Defined benefit obligation 31 March 2014Represented by : - Unfunded 70 86 1,320 - Partly or Wholly Funded 371 - - Total 441 86 1,320 Reconciliation of the Plan AssetsFair value of plan assets as at start of the year 283 - - Expected return on plan assets 28 - - Actuarial gains/ (losses) (3) - - Contributions by the Group 82 - - Benefits paid (19) - - Foreign exchange fluctuation - - - Fair value of plan assets at Year End 371 - - Reconciliation of the liability:Defined benefit obligation 441 86 1,320 Fair value of plan assets 371 - - Defined benefit plans 70 86 1,320 Classified as:Provisions 70 86 1,320 Expense recognized:Current and Past service cost 57 4 38 Interest costs 28 3 41 Expected return on plan assets (28) - - Actuarial (gains)/losses 13 (1) (32)Foreign exchange fluctuation - 13 200 Total expense recognized in the income statement 70 19 247 Actuarial Assumptions:Discount rate 8.90% 3.50% 3.50%Expected rate of return on plan assets 9.00% NA NA Average remaining life (in years) 24 15 9 Expected rate of salary increases 7.50% 3.00% 3.00%Attrition Rate 15.00% NA NA
` In Lakhs
As at
31 March 2015
As at
31 March 2014
11 Trade payablesDues to micro and small enterprises (Also, refer note (a) below) 77 768 Dues to others 86,454 85,427
86,531 86,195
a) For details of disclosure pursuant to section 22 of Micro, Small and Medium Enterprises Development Act (MSMED), 2006
refer note 10(a) of standalone financial statements.
` In Lakhs
As at
31 March 2015
As at
31 March 2014
12 Other current liabilitiesBilling in advance 4,552 5,705 Advance from customers 11,680 12,970 Unpaid dividends 3 3 Statutory dues 1,523 1,920 Other payables 1,773 1,780 Employee related payables 1,574 1,336
21,105 23,714
There are no amounts due for payment to the Investor education and protection fund under Section 125 of the Companies Act, 2013 as at the balance sheet date.
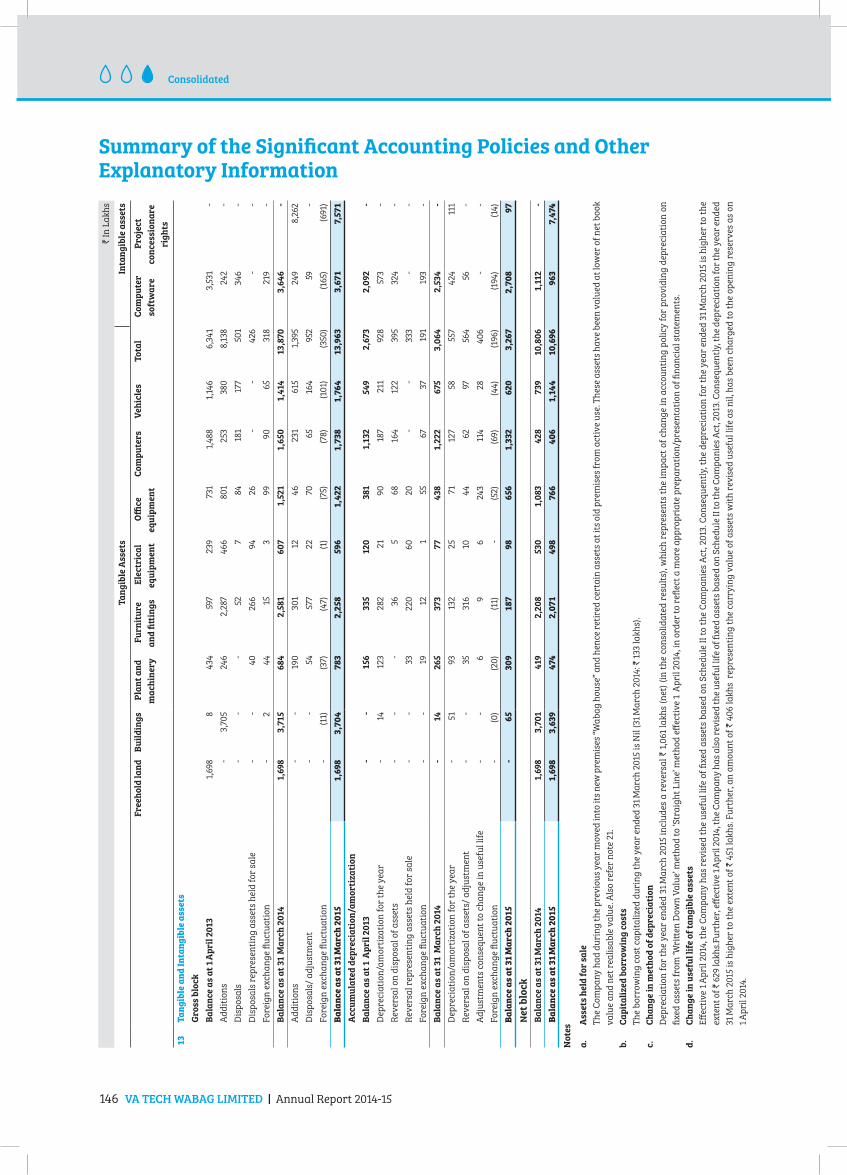
146 VA TECH WABAG LIMITED | Annual Report 2014-15
Summary of the Significant Accounting Policies and Other Explanatory Information
Consolidated
` I
n L
ak
hs
Ta
ng
ible
Ass
ets
In
tan
gib
le a
sse
ts
Fre
eh
old
la
nd
B
uil
din
gs
Pla
nt
an
d
ma
chin
ery
Fu
rnit
ure
an
d fi
ttin
gs
Ele
ctri
cal
eq
uip
me
nt
Offi
ce
eq
uip
me
nt
Co
mp
ute
rs
Ve
hic
les
To
tal
Co
mp
ute
r
soft
wa
re
Pro
ject
con
cess
ion
are
rig
hts
13
Ta
ng
ible
an
d I
nta
ng
ible
ass
ets
Gro
ss b
lock
Ba
lan
ce a
s a
t 1 A
pri
l 2
013
1,6
98
8
4
34
59
7 2
39
731
1
,48
8
1,1
46
6
,34
1 3
,531
-
Ad
dit
ion
s -
3
,70
5 2
46
2
,287
4
66
8
01
253
3
80
8
,138
2
42
-
Dis
po
sals
-
-
-
52
7
8
4
18
1 1
77
50
1 3
46
-
Dis
po
sals
rep
rese
nti
ng
ass
ets
hel
d f
or
sale
-
-
40
2
66
9
4
26
-
-
4
26
-
-
Fo
reig
n e
xch
an
ge
flu
ctu
ati
on
-
2
44
1
5 3
9
9
90
6
5 3
18
219
-
Ba
lan
ce a
s a
t 3
1 Ma
rch
20
14 1
,69
8
3,7
15
68
4
2,5
81
60
7
1,5
21
1,6
50
1
,414
1
3,8
70
3
,64
6
-
Ad
dit
ion
s -
-
1
90
3
01
12
4
6
231
6
15
1,3
95
249
8
,26
2
Dis
po
sals
/ a
dju
stm
ent
-
-
54
5
77
22
7
0
65
16
4
952
5
9
-
Fo
reig
n e
xch
an
ge
flu
ctu
ati
on
-
(11
) (
37)
(4
7) (
1) (
75)
(78
) (
101)
(35
0)
(16
5) (
691)
Ba
lan
ce
as
at
31
Ma
rc
h 2
01
5 1
,69
8
3,7
04
7
83
2
,25
8
59
6
1,4
22
1
,73
8
1,7
64
1
3,9
63
3
,67
1
7,5
71
Acc
um
ula
ted
de
pre
cia
tio
n/a
mo
rtiz
ati
on
Ba
lan
ce a
s a
t 1
Ap
ril
20
13 -
-
1
56
33
5
12
0
38
1 1
,13
2
54
9
2,6
73
2
,09
2
-
Dep
reci
ati
on
/am
ort
iza
tio
n f
or
the
yea
r -
1
4
12
3
282
2
1 9
0
187
2
11
92
8
573
-
Rev
ersa
l o
n d
isp
osa
l o
f a
sset
s -
-
-
3
6
5
68
1
64
1
22
3
95
324
-
Rev
ersa
l re
pre
sen
tin
g a
sset
s h
eld
fo
r sa
le -
-
3
3
220
6
0
20
-
-
3
33
-
-
Fo
reig
n e
xch
an
ge
flu
ctu
ati
on
-
-
19
1
2
1
55
67
37
19
1 1
93
-
Ba
lan
ce a
s a
t 3
1 M
arc
h 2
014
-
14
2
65
3
73
7
7
43
8
1,2
22
6
75
3,0
64
2
,53
4
-
Dep
reci
ati
on
/am
ort
iza
tio
n f
or
the
yea
r -
5
1 9
3
132
2
5 7
1 1
27
58
5
57
424
1
11
Rev
ersa
l o
n d
isp
osa
l o
f a
sset
s/ a
dju
stm
ent
-
-
35
316
1
0
44
6
2
97
56
4
56
-
Ad
just
men
ts c
on
seq
uen
t to
ch
an
ge
in u
sefu
l li
fe -
-
6
9
6
2
43
1
14
28
4
06
-
-
Fo
reig
n e
xch
an
ge
flu
ctu
ati
on
-
(0
) (
20)
(11
)-
(52
) (
69)
(4
4)
(19
6)
(19
4)
(14
)
Ba
lan
ce
as
at
31
Ma
rc
h 2
01
5 -
6
5
30
9
18
7
98
6
56
1
,33
2
62
0
3,2
67
2
,70
8
97
Ne
t b
lock
Ba
lan
ce a
s a
t 3
1 Ma
rch
20
14 1
,69
8
3,7
01
419
2
,20
8
53
0
1,0
83
4
28
7
39
10
,80
6
1,1
12
-
Ba
lan
ce
as
at
31
Ma
rc
h 2
01
5 1
,69
8
3,6
39
4
74
2,0
71
4
98
7
66
4
06
1
,14
4
10
,69
6
96
3
7,4
74
No
tes
a.
Ass
ets
he
ld f
or
sale
T
he
Co
mp
an
y h
ad
du
rin
g t
he
pre
vio
us
yea
r m
ov
ed in
to it
s n
ew p
rem
ises
“W
ab
ag
ho
use
” a
nd
hen
ce r
etir
ed c
erta
in a
sset
s a
t it
s o
ld p
rem
ises
fro
m a
ctiv
e u
se. T
hes
e a
sset
s h
av
e b
een
va
lued
at
low
er o
f n
et b
oo
k
va
lue
an
d n
et r
eali
sab
le v
alu
e. A
lso
ref
er n
ote
21.
b.
Ca
pit
ali
zed
bo
rro
win
g c
ost
s
T
he
bo
rro
win
g c
ost
ca
pit
ali
zed
du
rin
g t
he
yea
r en
ded
31 M
arc
h 2
015
is
Nil
(31
Ma
rch
20
14: `
133
la
kh
s).
c.
Ch
an
ge
in
me
tho
d o
f d
ep
reci
ati
on
D
epre
cia
tio
n f
or
the
yea
r en
ded
31 M
arc
h 2
015
in
clu
des
a r
ever
sal
` 1,
06
1 la
kh
s (n
et)
(in
th
e co
nso
lid
ate
d r
esu
lts)
, wh
ich
rep
rese
nts
th
e im
pa
ct o
f ch
an
ge
in a
cco
un
tin
g p
oli
cy f
or
pro
vid
ing
dep
reci
ati
on
on
fix
ed a
sset
s fr
om
‘Wri
tten
Do
wn
Va
lue’
met
ho
d t
o ‘S
tra
igh
t L
ine’
met
ho
d e
ffec
tiv
e 1
Ap
ril
2014
, in
ord
er t
o r
eflec
t a
mo
re a
pp
rop
ria
te p
rep
ara
tio
n/p
rese
nta
tio
n o
f fi
na
nci
al
sta
tem
ents
.
d.
Ch
an
ge
in
use
ful
life
of
tan
gib
le a
sse
ts
E
ffec
tiv
e 1 A
pri
l 20
14, t
he
Co
mp
an
y h
as
rev
ised
th
e u
sefu
l li
fe o
f fi
xed
ass
ets
ba
sed
on
Sch
edu
le I
I to
th
e C
om
pa
nie
s A
ct, 2
013
. Co
nse
qu
entl
y, t
he
dep
reci
ati
on
fo
r th
e y
ear
end
ed 3
1 Ma
rch
20
15 i
s h
igh
er t
o t
he
exte
nt
of
` 6
29 la
kh
s.F
urt
her
, eff
ecti
ve
1 Ap
ril 2
014
, th
e C
om
pa
ny
ha
s a
lso
rev
ised
th
e u
sefu
l lif
e o
f fi
xed
ass
ets
ba
sed
on
Sch
edu
le I
I to
th
e C
om
pa
nie
s A
ct, 2
013
. Co
nse
qu
entl
y, t
he
dep
reci
ati
on
fo
r th
e y
ear
end
ed
31 M
arc
h 2
015
is
hig
her
to
th
e ex
ten
t o
f `
451
la
kh
s. F
urt
her
, an
am
ou
nt
of
` 4
06
la
kh
s r
epre
sen
tin
g t
he
carr
yin
g v
alu
e o
f a
sset
s w
ith
rev
ised
use
ful
life
as
nil
, ha
s b
een
ch
arg
ed t
o t
he
op
enin
g r
eser
ves
as
on
1 Ap
ril
2014
.

Corporate
Overview
Statutory
Reports
147
Financial
Statements
` In Lakhs
As at
31 March 2015
As at
31 March 2014
14 Non-current investments
Trade Investments (Valued at cost unless stated otherwise)
Investments in Associate Companies
Windhoek Goreangab Operating Company (Pty) Limited 257 298
(The group holds 33 shares of 1 Namibian dollar each, representing 33% of the Share
capital (Previous year: 33 Shares)
In Other Companies
First STP Private Limited 15 15
(1,50,000 (Previous year : 1,50,000) equity shares of ` 10 each)
Konark Water Infraprojects Private Limited 1 1
( 5,000 (Previous year : 5,000 ) equity shares of ` 10 each)
Aurangabad City Water Utility Company Limited 1 1
(5,000 (Previous year : 5000 ) equity shares of ` 10 each)
OEG Renew Waters (Thoothukudi) Private Limited * - -
(2,600 (Previous year : 2600 ) equity shares of ` 10 each)
Ganapati Marine Enterprises Private Limited # - -
(158 (Previous Year:Nil) equity shares of ` 10 each)
274 315
Aggregate amount of unquoted investments 274 315
Aggregate provision for diminution in value of investments - -
Extent of Investment in Other Companies
First STP Private Limited 5% 5%
Konark Water Infraprojects Private Limited 10% 10%
Aurangabad City Water Utility Company Limited 10% 10%
OEG Renew Waters (Thoothukudi) Private Limited * 26% 26%
Ganapati Marine Enterprises Private Limited** 0% -
* Since the amount of investment is ` 26,000, the same is below the rounding off norm adopted by the company.
# Since the amount of investment is ` 1,580, the same is below the rounding off norm adopted by the Company.
** Since the extent of investment is .016%, the same is below the rounding off norm adopted by the Company.
` In Lakhs
As at 31 March 2015 As at 31 March 2014
Long-term Short-term Long-term Short-term
15 Loans and advances
Capital advances
- Secured, considered good 518 - - -
(A) 518 - - -
Security deposits
- Unsecured, considered good 342 1,079 19 957
(B) 342 1,079 19 957
Other loans and advances
(Unsecured, considered good)
- Advances to supplier - 9,250 - 7,809
- Advances to employees* 95 300 78 790
- Advance tax (Net of provision for tax Nil; Previous year ` 19,500 lakhs) - - - 390
(C) 95 9,550 78 8,989
Total (A+B+C) 955 10,629 97 9,946
* No amount is due from officers of the company

148 VA TECH WABAG LIMITED | Annual Report 2014-15
Summary of the Significant Accounting Policies and Other Explanatory Information
Consolidated
` In Lakhs
As at
31 March 2015
As at
31 March 2014
16 Other non-current assets
Non-current bank balances (Also refer note 20) 7,540 7,744
Long-term trade receivables
Customer retention - Unsecured, considered good 14,686 11,956
Others 442 25
22,668 19,725
` In Lakhs
As at
31 March 2015
As at
31 March 2014
17 Current investments
Valued at lower of cost and fair value
Investments in mutual funds - Unquoted
- SBI Mutual Fund fixed maturity plan (1,00,00,000 units of ` 10 each) - 1000
- ICICI Prudential fixed maturity plan (1,00,00,000 units of ` 10 each) 1,000 -
- Reliance yearly interval fund (45,91,916 units of ` 10.8887 each) 500 -
- Reliance yearly interval fund (45,90,694 units of ` 10.8916 each) 500 -
- UTI fixed term interval fund (50,00,000 units of ` 10 each) 500 -
- HDFC Mutual Fund fixed maturity plan (1,00,00,000 units of ` 10 each) 1,000 1,000
3,500 2,000
Aggregate amount of
- Unquoted investments 3,500 2,000
- Provision for diminution in value of investments - -
` In Lakhs
As at
31 March 2015
As at
31 March 2014
18 Inventories
Construction work-in-progress 4,001 2,858
Stores and spares 698 644
4,699 3,502
` In Lakhs
As at
31 March 2015
As at
31 March 2014
19 Trade receivables
(Unsecured considered good, unless stated otherwise)
Outstanding for a period exceeding six months from the date they are due for payment
Unsecured considered good 17,590 19,720
Doubtful 3,453 2,903
21,043 22,623
Less : Allowances for bad and doubtful debts (3,453) (2,903)
(A) 17,590 19,720
Outstanding for a period less than six months from the date they are due for payment
Other debts
Unsecured considered good 1,23,806 1,13,917
Doubtful - 411
1,23,806 1,14,328

Corporate
Overview
Statutory
Reports
149
Financial
Statements
` In Lakhs
As at
31 March 2015
As at
31 March 2014
19 Trade receivables
Less : Allowances for bad and doubtful debts - (411)
(B) 1,23,806 1,13,917
Customer retention
Unsecured considered good 6,670 5,111
Doubtful 937 421
7,607 5,532
Less : Allowances for bad and doubtful debts (937) (421)
(C) 6,670 5,111
TOTAL (A + B + C) 1,48,066 1,38,748
` In Lakhs
As at 31 March 2015 As at 31 March 2014
Current Non-current Current Non-current
20 Cash and bank balances
Cash and cash equivalents
Cash on hand 154 - 102 -
Cheques on hand 9,088 - 5,714 -
Balances with banks
- in current accounts 10,112 - 20,859 -
- in deposit account (with maturity upto 3 months) 4,603 - 6,363 -
(A) 23,957 - 33,038 -
Other bank balances
Unpaid dividend account 3 - 4 -
Deposits with maturity more than 3 months but less than 12 months* 7,157 - 3,154 -
Balances with bank held as margin money - 7,540 820 7,744
(B) 7,160 7,540 3,978 7,744
Less : Amounts disclosed as other non-current assets (Also refer note 16) (C) - 7,540 - 7,744
Total (A+B-C) 31,117 - 37,016 -
* Deposits amounting to ` Nil (Previous year ` 1,695 Lakhs) are subject to a charge to secure the Company’s short term borrowings (Also refer note 7 (1))
` In Lakhs
As at
31 March 2015
As at
31 March 2014
21 Other current assets
(Unsecured, considered good)
Balances with government authorities 6,235 5,940
Prepaid expenses 2,435 2,144
Rent advance 381 418
Assets held for sale (at lower of net book value and net realisable value) (Also refer note 13(a)) 18 93
Duty drawback and other duty free credit entitlement receivable 1,265 1,057
Interest accrued and other deposits 3,056 2,664
13,390 12,316
(Contd.)

150 VA TECH WABAG LIMITED | Annual Report 2014-15
Summary of the Significant Accounting Policies and Other Explanatory Information
Consolidated
` In Lakhs
As at
31 March 2015
As at
31 March 2014
22 Revenue from operations
Sale of services 2,42,838 2,23,015
Other operating revenues, net 677 845
2,43,515 2,23,860
` In Lakhs
As at
31 March 2015
As at
31 March 2014
23 Other income
Interest income 778 1,125
Dividend income - 161
778 1,286
` In Lakhs
As at
31 March 2015
As at
31 March 2014
24 Cost of sales and services
Material, engineering and civil costs 1,26,330 1,28,164
Service costs and other project expenses 58,456 40,714
1,84,786 1,68,878
` In Lakhs
As at
31 March 2015
As at
31 March 2014
25 Change in inventories
Inventories at the beginning of the year
Construction work-in-progress 2,858 3,645
Stores and spares 644 408
3,502 4,053
Less: Inventories at the end of the year
Construction work-in-progress 4,001 2,858
Stores and spares 698 644
4,699 3,502
Foreign exchange fluctuation (313) 364
(1,510) 915
` In Lakhs
As at
31 March 2015
As at
31 March 2014
26 Employee benefits expense
Salaries and wages 23,782 18,285
Contribution to defined benefit plans (Also refer note 10(d)) 499 421
Contribution to provident and other defined contribution funds 1,061 966
Expense on Employee Stock Option Plan (ESOP) (Also refer note 4 (f) and (g)) 77 127
Staff welfare expenses 2,345 2,375
27,764 22,174
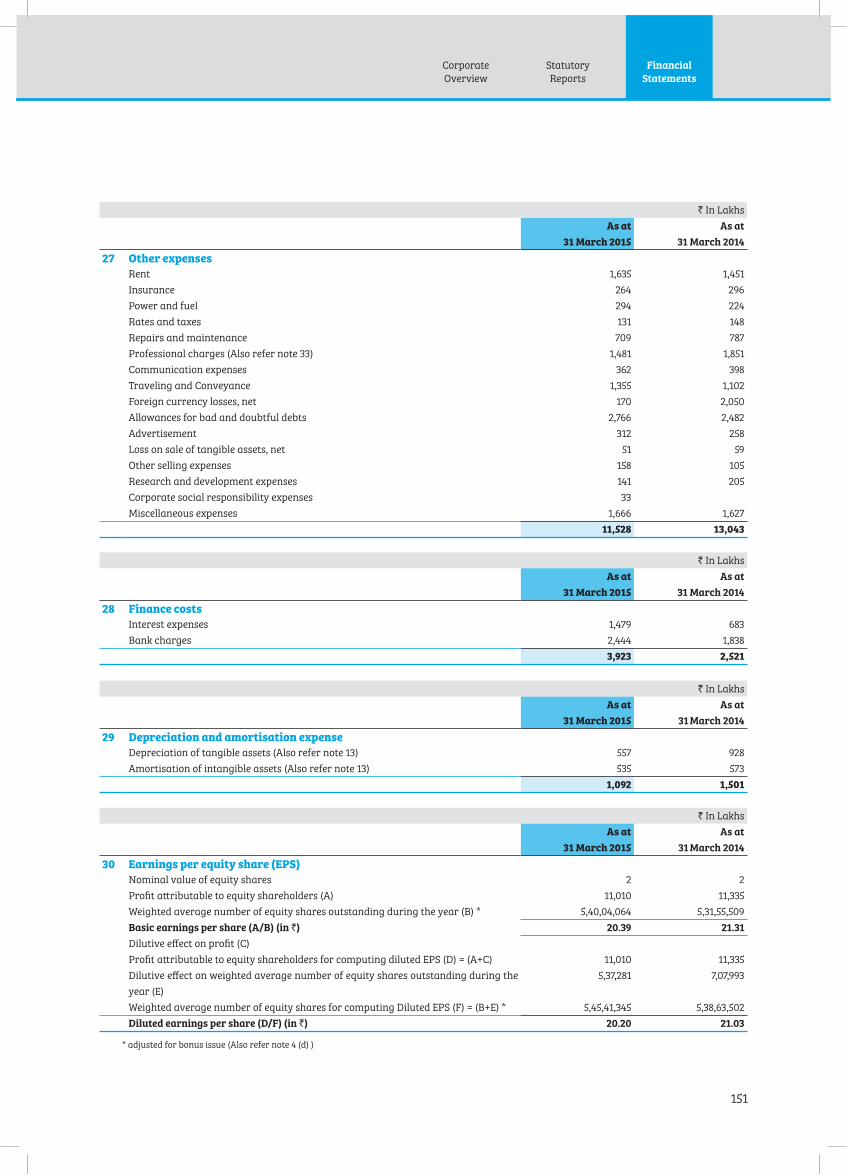
Corporate
Overview
Statutory
Reports
151
Financial
Statements
` In Lakhs
As at
31 March 2015
As at
31 March 2014
27 Other expenses
Rent 1,635 1,451
Insurance 264 296
Power and fuel 294 224
Rates and taxes 131 148
Repairs and maintenance 709 787
Professional charges (Also refer note 33) 1,481 1,851
Communication expenses 362 398
Traveling and Conveyance 1,355 1,102
Foreign currency losses, net 170 2,050
Allowances for bad and doubtful debts 2,766 2,482
Advertisement 312 258
Loss on sale of tangible assets, net 51 59
Other selling expenses 158 105
Research and development expenses 141 205
Corporate social responsibility expenses 33
Miscellaneous expenses 1,666 1,627
11,528 13,043
` In Lakhs
As at
31 March 2015
As at
31 March 2014
28 Finance costs
Interest expenses 1,479 683
Bank charges 2,444 1,838
3,923 2,521
` In Lakhs
As at
31 March 2015
As at
31 March 2014
29 Depreciation and amortisation expense
Depreciation of tangible assets (Also refer note 13) 557 928
Amortisation of intangible assets (Also refer note 13) 535 573
1,092 1,501
` In Lakhs
As at
31 March 2015
As at
31 March 2014
30 Earnings per equity share (EPS)
Nominal value of equity shares 2 2
Profit attributable to equity shareholders (A) 11,010 11,335
Weighted average number of equity shares outstanding during the year (B) * 5,40,04,064 5,31,55,509
Basic earnings per share (A/B) (in `) 20.39 21.31
Dilutive effect on profit (C)
Profit attributable to equity shareholders for computing diluted EPS (D) = (A+C) 11,010 11,335
Dilutive effect on weighted average number of equity shares outstanding during the
year (E)
5,37,281 7,07,993
Weighted average number of equity shares for computing Diluted EPS (F) = (B+E) * 5,45,41,345 5,38,63,502
Diluted earnings per share (D/F) (in `) 20.20 21.03
* adjusted for bonus issue (Also refer note 4 (d) )

152 VA TECH WABAG LIMITED | Annual Report 2014-15
Summary of the Significant Accounting Policies and Other Explanatory Information
Consolidated
` In Lakhs
As at
31 March 2015
As at
31 March 2014
31 Construction contracts
In terms of the disclosures required to be made under the Accounting Standard (AS) 7
as notified in section 133 of the Companies Act, 2013 read with rule 7 of the Companies
(Accounts) Rules, 2014 (as amended), the amounts considered in the financial
statements up to the balance sheet date are as follows:
Contract revenue recognised 1,97,627 1,90,061
Aggregate amount of costs incurred and recognised profits and losses for all contracts
in progress
4,12,290 3,66,993
Less : Progressive billings 3,70,875 3,40,185
41,415 26,808
Recognised as :
Due from customers for construction contract work, recognised in Trade receivables 96,084 32,551
Due to customers for construction contract work, recognised in current liabilities (54,669) (5,743)
41,415 26,808
Advances received from customers for contracts related to work not yet performed
included in 'Other long term liabilities' and 'Other current liabilities'.
17,531 15,435
Retention on contracts included within 'Trade receivables' and 'Other non-current assets'. 22,294 17,291
` In Lakhs
As at
31 March 2015
As at
31 March 2014
32 Disclosures in respect of non-cancellable operating leases
The lease rentals charged for the years ended 31 March 2015 and 2014 and maximum
obligation on long-term, non-cancellable operating leases payable as per the rentals
stated in the respective agreements are as provided below:
The total of future minimum lease payments for each of the following periods:
(i) Not later than one year 547 654
(ii) Due later than one year not later than five years 311 615
(iii) Due later than five years -
Total 858 1,269
Lease payments charged off to the statement of profit and loss 1,635 1,451
` In Lakhs
As at
31 March 2015
As at
31 March 2014
33 Payments to auditors (included as part of Professional Charges)*
As auditor
Statutory audit 25 23
Limited review 7 6
Tax audit 3 3
35 32
In other capacity
Other services 39 31
39 31
74 63
* excluding service tax

Corporate
Overview
Statutory
Reports
153
Financial
Statements
36 Exceptional Items WABAG Wassertechnik AG, Switzerland, (Swiss
Subsidiary) has established a contractual relationship
with BVG Collective Foundation and Swiss Life, Zurich
(BVG Collective Foundation), for administering the
retirement benefit plan for its employees. Besides the usual
contributions, this plan also has an embedded component
of insured benefit that satisfies the local requirements of
return on assets. During the previous year, the Board
reviewed the structure of this arrangement, and noted
that the substance of arrangement with BVG Collective
Foundation fully absolves the Swiss Subsidiary from
actuarial or investment risks. Inasmuch as, once the
annual contributions are made and the non-refundable
annual insurance premium is paid, the liability to
meet pension pay outs get vested in BVG Collective
Foundation, the said Plan is a Defined Contribution Plan.
This change in classification from a defined benefit plan
to a defined contribution plan in the current year by the
swiss subsidiary for the preparation of Consolidated
Financial Statements and the corresponding accounting
treatment is consistent with the accounting principles
followed by the Swiss Subsidiary in compliance with
generally accepted accouting principles in Switzerland.
Since Swiss Subsidiary does not carry any further legal
or constructive obligation to pay further contributions
if the BVG Collective Foundation does not hold sufficient
assets to pay all employee benefits relating to employee
service in the current and prior periods, the provisions
(net of deferred taxes) rendered as excess (2013-14 -
NIL, Previous Years 2009-10 to 2012-13 ` 919 Lakhs)
have been written back and disclosed as Exceptional
income during the previous year to the extent of `
506 Lakhs representing charges for the year ended
31 March 2010 to 31 March 2013 and an increase in
the retained earnings to the extent of ` 419 Lakhs
representing the change for the year ended 31 March
2008 and 31 March 2009 which was adjusted against
opening retained earnings on initial consolidation.
The number of employees of Swiss Subsidiary covered
by the retirement benefit plan was 40 , and the
corresponding number for the group as a whole was
1,736 . The employee benefit costs of Swiss Subsidiary
represents 1.18% of total employee benefit costs charged
to consolidated statement of profit and loss for the
previous year.
` In Lakhs
As at
31 March 2015
As at
31 March 2014
34 Remuneration to key managerial personnel
The following table describes the compensation to key managerial personnel which
comprises of directors and other managerial personnel. Refer note 32 of the annual
standalone financials for details.
Rajiv Mittal 243 202
Others 610 480
Total 853 682
` In Lakhs
35 Dividend remitted in foreign currency
Period to which it relates 2013-14 2012-13
Number of non - resident shareholders 2 2
Number of shares held on which dividend was due (Equity shares of ` 2 each) 3,542 9,475
Amount remitted (Euro 355.54 ,Previous year - 770.87) 28,336 66,325

154 VA TECH WABAG LIMITED | Annual Report 2014-15
Summary of the Significant Accounting Policies and Other Explanatory Information
Consolidated
37 Segment reporting Considering the risk/return profiles of the segments between product and geography, the Group has identified geography as
primary segment in accordance with Accounting Standard (AS) 17 “Segment Reporting” issued by Companies (Accounting
Standard) Rules, 2006. The Group does not have any secondary segment.
Year ended 31 March 2015
` In Lakhs
Particulars India Rest of world Unallocated Total
Revenue
External sales 90,815 1,61,863 - 2,52,678
Other operating income - - 677 677
Inter-segment sales - (9,840) - (9,840)
Total revenue 90,815 1,52,023 677 2,43,515
Results
Segment result 16,009 43,553 - 59,562
Other operating income - - 677 677
Unallocated corporate expenses - - 40,384 40,384
Operating profit 16,009 43,553 (39,707) 19,855
Interest and finance charges - - 3,923 3,923
Interest and dividend income - - 778 778
Exceptional item - - - -
Profit before tax 16,009 43,553 (42,852) 16,710
Income taxes 5,664 5,664
Profit after tax 16,009 43,553 (48,516) 11,046
Share of profit in Associate - 159 - 159
Minority Interest - 195 - 195
Profit for the year attributable to equity shareholders 16,009 43,517 (48,516) 11,010
Other information
Segment assets 1,49,903 1,06,280 - 2,56,183
Unallocated corporate assets - - 592 592
Total assets 1,49,903 1,06,280 592 2,56,775
Segment liabilities 90,078 75,051 - 1,65,129
Unallocated corporate liabilities - - 882 882
Total liabilities 90,078 75,051 882 1,66,011
Capital expenditure - - - 8,509
Depreciation and amortisation - - - 1,092
Other Non cash expenditure, net - - - 13,208
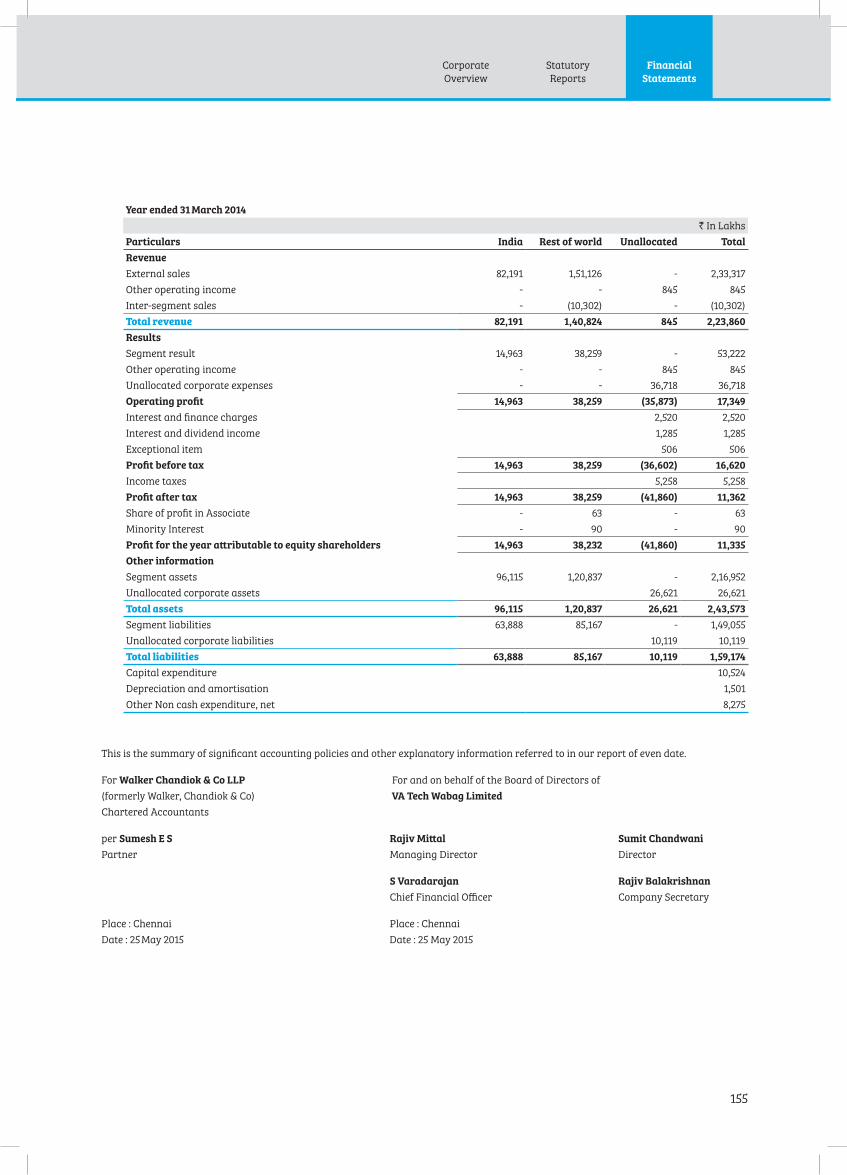
Corporate
Overview
Statutory
Reports
155
Financial
Statements
Year ended 31 March 2014
` In Lakhs
Particulars India Rest of world Unallocated Total
Revenue
External sales 82,191 1,51,126 - 2,33,317
Other operating income - - 845 845
Inter-segment sales - (10,302) - (10,302)
Total revenue 82,191 1,40,824 845 2,23,860
Results
Segment result 14,963 38,259 - 53,222
Other operating income - - 845 845
Unallocated corporate expenses - - 36,718 36,718
Operating profit 14,963 38,259 (35,873) 17,349
Interest and finance charges 2,520 2,520
Interest and dividend income 1,285 1,285
Exceptional item 506 506
Profit before tax 14,963 38,259 (36,602) 16,620
Income taxes 5,258 5,258
Profit after tax 14,963 38,259 (41,860) 11,362
Share of profit in Associate - 63 - 63
Minority Interest - 90 - 90
Profit for the year attributable to equity shareholders 14,963 38,232 (41,860) 11,335
Other information
Segment assets 96,115 1,20,837 - 2,16,952
Unallocated corporate assets 26,621 26,621
Total assets 96,115 1,20,837 26,621 2,43,573
Segment liabilities 63,888 85,167 - 1,49,055
Unallocated corporate liabilities 10,119 10,119
Total liabilities 63,888 85,167 10,119 1,59,174
Capital expenditure 10,524
Depreciation and amortisation 1,501
Other Non cash expenditure, net 8,275
This is the summary of significant accounting policies and other explanatory information referred to in our report of even date.
For Walker Chandiok & Co LLP For and on behalf of the Board of Directors of
(formerly Walker, Chandiok & Co) VA Tech Wabag Limited
Chartered Accountants
per Sumesh E S Rajiv Mittal Sumit Chandwani
Partner Managing Director Director
S Varadarajan Rajiv Balakrishnan
Chief Financial Officer Company Secretary
Place : Chennai Place : Chennai
Date : 25 May 2015 Date : 25 May 2015

Notes

VA TECH WABAG LIMITED
CIN - L45205TN1995PLC030231
‘WABAG HOUSE’
No. 17, 200 Feet,
Thoraipakkam – Pallavaram Main Road,
Sunnambu Kolathur, Chennai – 600 117
T: 91-44-3923 2323
F: 91-44-3923 2324
W: www.wabag.com conc
ept, c
onte
nt an
d de
sign a
t(in
fo@
aicl.in
)
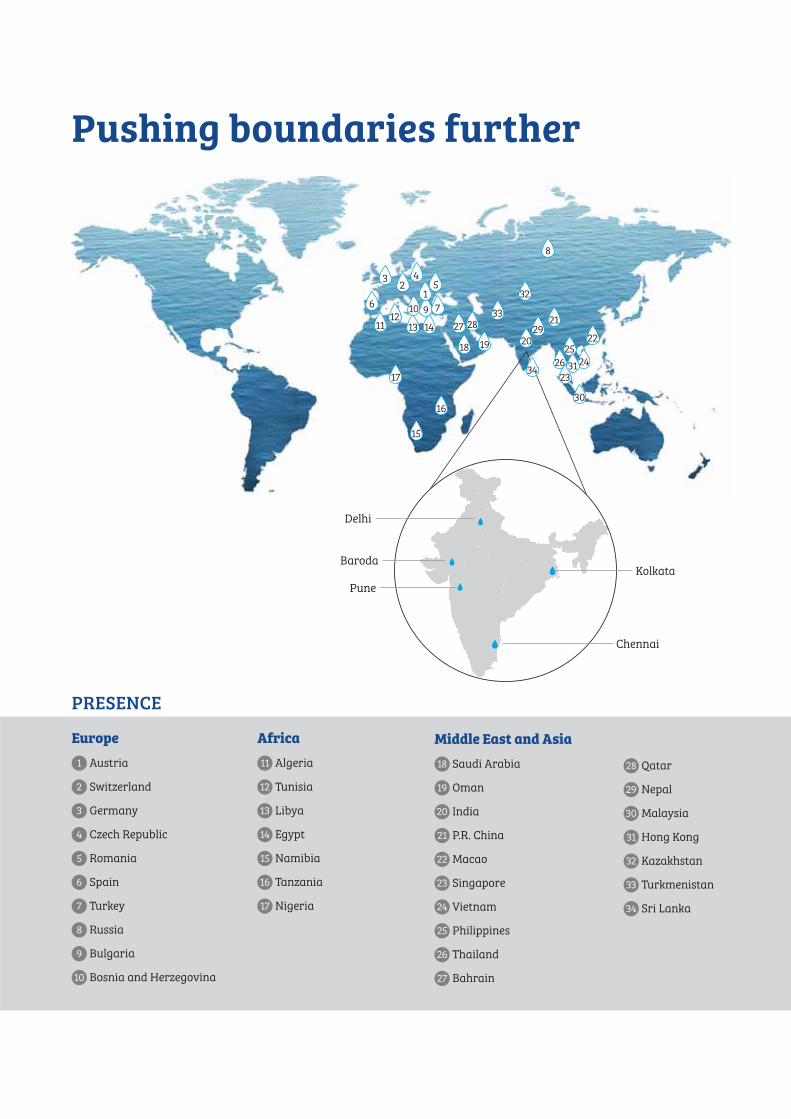
Pushing boundaries further
Kolkata
Chennai
Pune
Delhi
Baroda
3
6
1112
13 14
7910
17
18
16
19 20
21
25
32
33
3426
27 28 29
30
23
15
22
24
24
15
8
PRESENCE
Europe
1 Austria
2 Switzerland
3 Germany
4 Czech Republic
5 Romania
6 Spain
7 Turkey
8 Russia
9 Bulgaria
10 Bosnia and Herzegovina
Africa
11 Algeria
12 Tunisia
13 Libya
14 Egypt
15 Namibia
16 Tanzania
17 Nigeria
Middle East and Asia
18 Saudi Arabia
19 Oman
20 India
21 P.R. China
22 Macao
23 Singapore
24 Vietnam
25 Philippines
26 Thailand
27 Bahrain
28 Qatar
29 Nepal
30 Malaysia
31 Hong Kong
32 Kazakhstan
33 Turkmenistan
34 Sri Lanka
31