Annual Report 2013 - harrisfieldsss.eq.edu.au€¦ · Web view2012. 526. 240. 286. 89%. ... Water...
31
T DEPARTMENT OF EDUCATION, TRAINING AND EMPLOYMENT Harris Fields State School Queensland State School Reporting 2013 School Annual Report YPEOVER TO INSERT SCHOOL NAME Postal address P O Box 996 Slacks Creek 4127 Phone (07) 3387 1222 Fax (07) 3387 1200 Email [email protected] Webpages Additional reporting information pertaining to Queensland state schools is located on the My School website and the Queensland Government data website. Contact Person Principal Harris Fields State School
-
Upload
truongdieu -
Category
Documents
-
view
213 -
download
0
Transcript of Annual Report 2013 - harrisfieldsss.eq.edu.au€¦ · Web view2012. 526. 240. 286. 89%. ... Water...

T
DEPARTMENT OF EDUCATION, TRAINING AND EMPLOYMENT
Harris Fields State SchoolQueensland State School Reporting2013 School Annual Report
YPEOVER TO INSERT SCHOOL NAME
Postal address P O Box 996 Slacks Creek 4127
Phone (07) 3387 1222
Fax (07) 3387 1200
Email [email protected]
WebpagesAdditional reporting information pertaining to Queensland state schools is located on the My School website and the Queensland Government data website.
Contact Person Principal Harris Fields State School
Principal’s foreword
Introduction
Harris Fields State School has a four year Strategic Plan with set goals and targets for student improvement in literacy, numeracy, closing the gap in Indigenous education, developing he ARTs and sporting opportunities, community partnerships and parent engagement, and building quality teachers.
The staff acknowledges that education, teaching and learning is constantly changing in an increasingly complex and digital world. With this understanding, as a school we offer the latest in differentiated curriculum and pedagogy in literacy, numeracy and information communication technology. The school also focusses on the arts, sport and science.
Harris Fields acknowledges that it has a responsibility to provide a safe social context in which our students are able to develop as future citizens in an ever changing world. Consequently, we continue to provide social support to students and their families through our ever expecting social programs.
This report outlines the target areas of Harris Fields during 2013 and the school’s progress towards meeting those targets.
Harris Fields acknowledges that it has a responsibility to provide a safe social context in which our students are able to develop as future citizens in an ever changing world. Consequently, we continued to provide social support to students and their families through our ever expanding social programs
School progress towards its goals in 2013
Goals for 2013 as outlined in the Annual Implementation Plan include:Ensure that the Maths and English Curriculum are completely aligned with ACARA.Improve student learning outcomes in all areas of curriculum with a focus on:
Improving the percentage of students above NMS

DEPARTMENT OF EDUCATION, TRAINING AND EMPLOYMENT
Queensland State School Reporting2013 School Annual Report
Improving the percentage of students in the top two bands (U2B)Closing the gap with a focus on:
Attendance Improving the percentage of students above NMS Improving the percentage of students in the top two bands (U2B)
Improve pedagogical practice and leadership Through the provision of quality and relevant professional development
Harris Fields has a proud history of engaging in professional learning reflected in credible research based teaching practices that continue to influence a growth in student learning outcomes. 2013 was no different. The targeted areas of development in accordance within the AIP include: English - reading, vocabulary, writing (including spelling, grammar and punctuation) Numeracy - embedding First Steps in Maths (number, measurement, chance and data), using Natural
Maths as the tools for delivering the teacher instruction History implementation Personalised learning and differentiation of curriculum across the key learning area Visible learning and student feedback
Harris Fields State School annually audits its curriculum and continues to work diligently to ensure the requirements of the Australian Curriculum are implemented, with support from the curriculum leadership team.
Ongoing professional development provides the basis for maintaining and improving teacher pedagogical practice, focussing on:
First Steps in Maths and Natural Maths Building Blocks to Literacy Learning (with particular focus on P-2) Visible Learning – Learning goals, success criteria, feedback Reading - the literacy coach provided ongoing support to teachers
The school’s rate of improvement against Similar, State and Nation in NAPLAN continues to demonstrate success, with internal data supporting the current approaches to teaching literacy and numeracy.
Staff has continued ICT training to improve pedagogy and student engagement with the ICT curriculum. Administration staff continued to up skill to facilitate the move to the OneSchool environment. ICT is used as a teaching tool with staff trained in the use of digital devices.
Harris Fields annually audits its curriculum and is working diligently to fully implement the requirements of the Australian Curriculum. Staff continued ongoing in-service on the Australian Curriculum and are supported in its delivery through the curriculum leadership team at the school.
Our success in literacy and numeracy outcomes is evidenced by our continued rate of improvement compared to the nation in NAPLAN. Internal data shows that the approaches to teaching literacy and numeracy to our students is effective in producing strong results for our students.

DEPARTMENT OF EDUCATION, TRAINING AND EMPLOYMENT
Queensland State School Reporting2013 School Annual Report
Indigenous to our students at Harris Fields perform well and enjoy similar academic achievement to non-indigenous students. Attendance is slightly below the 93% overall attendance rate but is above 90% and improving annually. The above data may be seen on the MySchool website.
The school values The Arts and employs a visual arts teacher to provide all students with access to art lessons in a variety of media. Drama is offered in a range of forms and sport is highly valued. The school has continued to extend its goal of being a performance school. Our visual arts programs is producing talented artists in all media and the annual art show is a highlight of our school calendar and a huge success with the community. Our music program has expanded to include digital music and adds another dimension to the learning and production of music at Harris Fields.
Learning and League and The Girls’ Academy of Touch continue to be successful and attract sponsors who support the programs. Both programs are integral parts of our sports program and are producing talented sportsmen and women in their respective sports.
Ongoing professional development has been the base for maintaining and improving teacher quality.
Professional development was focussed on: Maths: First Steps in Maths, Natural Maths Building Blocks to Literacy Learning Visible Learning Reading

DEPARTMENT OF EDUCATION, TRAINING AND EMPLOYMENT
Queensland State School Reporting2013 School Annual Report
Future outlook
Harris Fields State School has extended it focus on personalising learning for all students in literacy. In 2013 the school engaged a literacy coach to further strengthen the quality of teaching of reading in years 4 to 7 and also engaged an early years’ literacy consultant to embed common practices across Prep to 2.
As we moved into 2014, Harris Fields is optimistic that its four year strategic plan and increased funding and partnerships, will provide improved learning opportunities for students and teachers. We are confident of delivering a focussed curriculum underpinned by quality teaching practices to achieve improved outcomes for our students and community.
Some of the key priorities are:
Through the National Partnership Agreement, two teachers will be employed to allow greater personalisation of learning. A numeracy coach will also facilitate teacher development and quality curriculum delivery in maths. Natural Maths became the basis of maths pedagogical development.
The school aims to develop its Arts program, both visual arts and performing arts. We will build more rigor into our programs by engaging external skilled groups to support our current programs. We aim to market the excellent cultural singing and dancing produced by our students. A visual arts teacher will continue to be employed through the national Partnership plan to extend our already successful Arts program. Drama and human movement will be become part of the Arts program and digital music program will be developed.
There will be a continued partnership with YFS and Communities for Children to embed the Family Centre into our community. This will include a playgroup, parenting programs, “drop in” for young parents and continued, referrals to counselling services for students and families.
As we move into 2014, Harris Fields State School is optimistic that its four year Strategic Plan, and increased funding through Great Results Guarantee, and partnerships, will provide improved learning opportunities for students and teachers. Some of the key priorities are: Embedding Natural Maths as the school philosophy underpinning the pedagogical practices for
Maths Committing to the core learning priority of writing, including spelling, grammar and punctuation. Embedding moderation practices for writing for all year levels based on ACARA standards Continuous monitoring of student achievement, consolidating the collection, analysis and reflection
of the data at a whole school, sector, year and individual level High quality teaching practices underpinned by deep curriculum knowledge with a focus on high
quality teaching practices, characterised by high expectations of all students, a deep knowledge of learning areas and a deep knowledge of HFSS philosophy of pedagogical practices
Targeted teaching in response to students’ specific needs and context within a safe, supportive, inclusive and disciplined learning environment
implement consistent classroom pedagogical practices aligned to the school pedagogical framework build a consistent approach to reading across all year levels commit to the core learning priority of science

DEPARTMENT OF EDUCATION, TRAINING AND EMPLOYMENT
Queensland State School Reporting2013 School Annual Report
commit to the priority of closing the gap for students in out-of-home care consolidate the implementation of the Australian Curriculum develop workforce performance evidence based decision making, using data to inform, monitor and review classroom teaching
practices maintain and extend partnerships with school community stakeholders work with the cluster to ensure a smooth Year 7 to high school transition

Our school at a glance
School Profile
Coeducational or single sex: Coeducational
Year levels offered in 2013: Prep Year - Year 7Total student enrolments for this school:
Total Girls Boys
Enrolment Continuity
(Feb – Nov)
2011 500 254 246 92%
2012 526 240 286 89%
2013 523 234 289 84%
Student counts are based on the Census (August) enrolment collection.
Characteristics of the student body:
Harris Fields State School is a low socio-economic school and has a high proportion of families living in an urban low socio economic area. The families are culturally, ethnically and financially diverse. There is a high unemployment and a significant number of single parent families. Many families speak a language other than English with approximately 50% of our students speaking a language other than English at home.
Harris Fields is a coeducational school catering for students from Prep to year 7. 89% of students were enrolled at the school for the whole year demonstrating a moderately high rate of transience. The main reason for students leaving Harris Fields during 2013 was relocation interstate, or more commonly, outside the local area. The majority of families enrolling at the school during the year are from overseas, mainly New Zealand, interstate or from outside the local area.
Most of our students live within walking distance of the school and come to school on foot or by car.
Harris Fields caters for students with disabilities through a Special Education Program. The program supports students within the mainstream classroom and with the aid of a special education teacher and teacher aides. Students with disabilities have individual programs developed and implemented by the classroom teacher and with the support of special education staff.
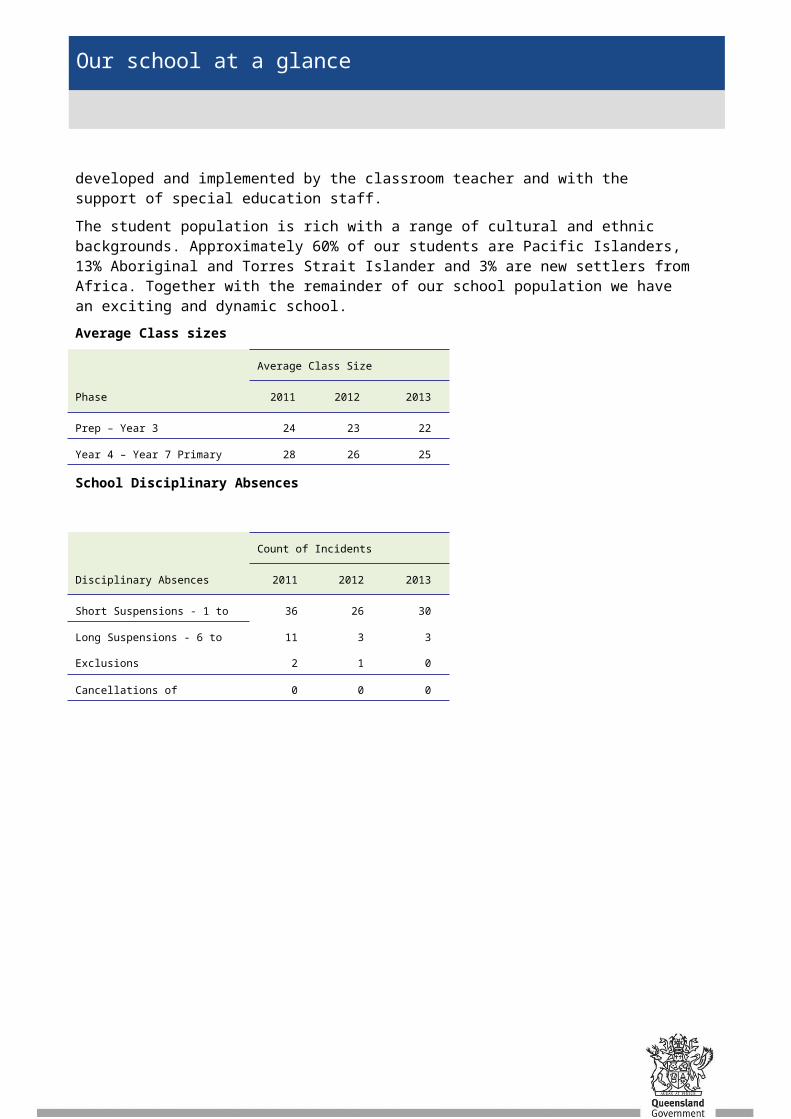
The student population is rich with a range of cultural and ethnic backgrounds. Approximately 60% of our students are Pacific Islanders, 13% Aboriginal and Torres Strait Islander and 3% are new settlers from Africa. Together with the remainder of our school population we have an exciting and dynamic school.
Average Class sizes
Phase
Average Class Size
2011 2012 2013
Prep – Year 3 24 23 22
Year 4 – Year 7 Primary 28 26 25

Our school at a glance
School Disciplinary Absences
Disciplinary Absences
Count of Incidents
2011 2012 2013
Short Suspensions - 1 to 5 days 36 26 30
Long Suspensions - 6 to 20 days 11 3 3
Exclusions 2 1 0
Cancellations of Enrolment 0 0 0

Our school at a glance
Our school at a glance
Curriculum offerings
In 2013 we moved us one step closer to achieving our vision of becoming a performance school. Our Arts program offers students the opportunity to be involved in a range of dance, music and drama activities. These culminate in school musical performances within and outside the school. Our multicultural choir continues to be recognised. Visual art also has a strong focus in the school with a specialist art teacher delivering an extensive curriculum and extension programs for our gifted artists.
The school offers a digital music program for those students who show talent in ICT and music.
ICTs are interwoven through all key learning areas and underpin teaching and learning. The school offers specific and focused ICT opportunities for all students and mobile devices are the norm for both teaching and learning.
Learning and League and the Girls’ Academy of Touch have provided opportunities for students to engage and excel in sport at a high level.
Extra curricula activities
Harris Fields State School offers a variety of extra curricula activities. Some of these are: The school concert is a highly valued extra curricula activity and engages students, staff and
parents in its production. It utilises ICT skills, visual art skills and teamwork from students and staff.
The school’s multicultural choir provides a range of song and dance opportunities for our students. These two events showcased the talent we have and are harnessing in the Arts.
Instrumental music is offered and is highly valued and expanding. Deadly Gatherings is a program for Aboriginal and Torres Strait Islander students and families
and is led by and Aboriginal elder and supported by Communities for Children.
Sporting programs provide students with the opportunity to be involved in various sports and activities all year round. The school participates in interschool sporting competitions including rugby league, touch football, soccer and netball. The cross country is also a highly valued sport with excellent student participation and results. Each year students are also involved in an interhouse and interschool athletics carnival. Students from year 5,6,7 are also eligible for representative positions in the Logan and District athletics team and many students from Harris Fields have gone on to compete at a very high level.
How Information and Communication Technologies are used to assist learning
In 2013, the Digital Pedagogical Framework was refined, with the underpinning principle being that digital technologies (resources, tools and environments) are used purposefully by staff and students, to support students, appropriate to the curriculum context and learner needs, in the five strands of the general capability. Digitally-rich, differentiated instruction is planned for to assist with student engagement, achievement of the expected learning, and to allow students to demonstrate what they know, understand, and can do. The school has continued to add to its ICTs with further purchases of mini iPads, Microsoft devices in preparation for a 1-1 device class in year 5 for 2014, and continued maintenance of all ICTs, including SmartBoards, television monitors, laptops and PCs.

Our school at a glance
Social climate
Harris Fields takes a proactive approach to its partnerships with the whole school community. Parents and students are encouraged to take an active part in all aspects of school life. Parent opinion surveys reflect a high satisfaction rate with the school as seen in the table below. The school has a strong Student Enhancement Team which oversees the support of students with Special support requirements, including all welfare programs.
The school has strong links with Youth and Family Service, Communities for Children and the Salvation Army and together with the school community engagement officer run the school’s Family Centre. The Family Centre runs a range of programs to support the needs of families in our community. One of the most popular programs is Magic Moments which is run weekly with the support of Communities for Children. It operates out of the prep are of the school for parents and children who are not yet in prep.
Harris Fields State School values and respects the rich cultural diversity of the school community and attempts to ensure equity of opportunity by challenging the barriers to participation and achievement. The school worked with the range of cultural groups in the wider community to ensure our whole school community embraced and supported the building of a state environment for all.
Anti-bullying and assertiveness training lessons are taught in the classroom through Social Skilling lessons.
Year 6 and 7 students visit early years’ classrooms and mentor with reading or on special days. Not only did this build positive relationships and networks between older and younger students, it had the added advantage of developing skills in the younger children and leadership skills in the senior students.
The School Opinion Survey reflected the effectiveness of the school programs with students saying that they feel safe at this school and that the school is a good school. Harris Fields developed a strong and productive partnership with Youth and Family Services (YFS) and Communities for Children. In partnership we have developed the Family Centre which provides a range of services to support students and families in a range of roles.
The school runs a YMCA School Breakfast Program four days each week. The program provides a healthy breakfast to all children, with our school library open from 8am for parents and students. These results are reflected also in parent and staff surveys outlined below.

Our school at a glance

Our school at a glance
Parent, student and staff satisfaction with the school
Parents, students and staff all show a high level of satisfaction with the school. The school has worked hard to build a level of confidence in the school by the whole school community. 2013 saw an increase in the percentage of parents satisfied with the performance of the school. The school opinion survey indicated that parents and students were getting a good education. Feedback from parents cited the support of teachers, the well maintained grounds, improved facilities and internet access as very positive aspects of the school. There continues to be an increase in the number of parents who think their children are getting a good education.
Staff morale continued to remain high, with the recognition that an improvement trajectory is key (100%). Feedback from staff suggested that the strong sense of team that the school is building and staff retention was the basis for this improvement. Continuing improvement in this area remains a key priority for 2014. Teachers feel that little recognition is given to the value being added through studies such as life skills programs which are helping children to develop resilience and the skills needed to cope effectively with situations and circumstances children in more affluent areas do not experience to the same degree.
All staff had access to professional development throughout the year and 96.7% of teachers said they were satisfied with quality and relevance of the professional development experienced.
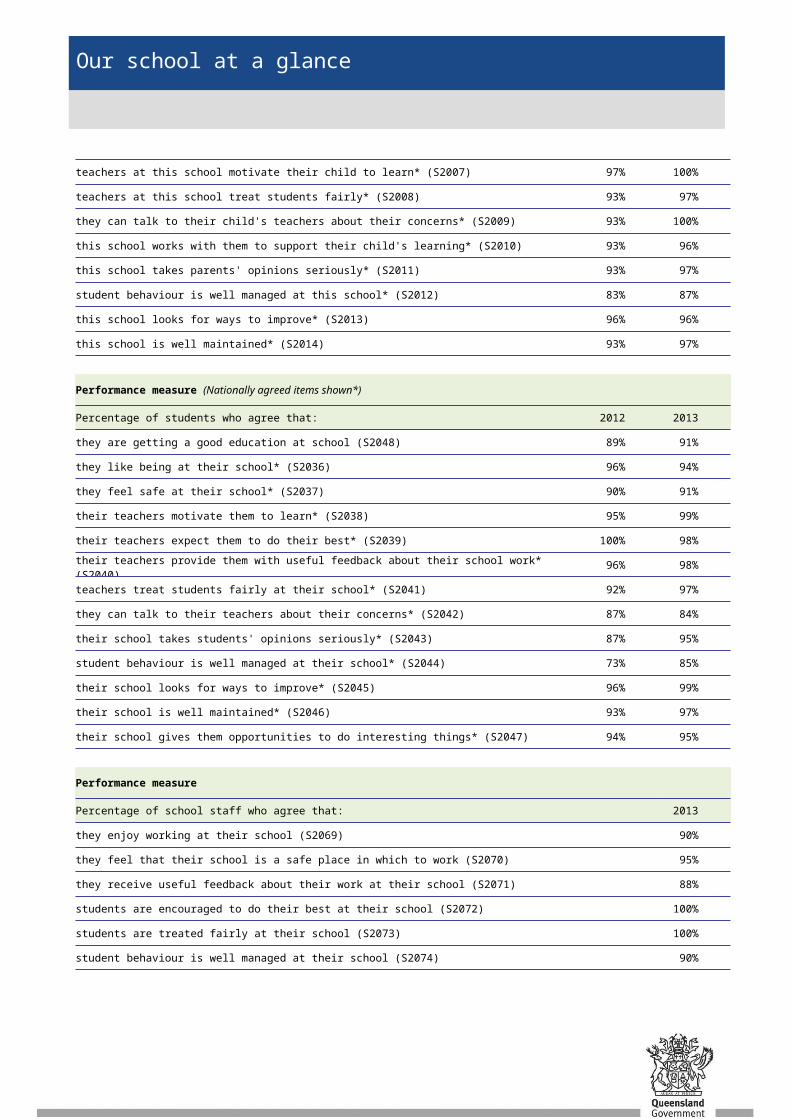
Performance measure (Nationally agreed items shown*)
Percentage of parents/caregivers who agree that: 2012 2013
their child is getting a good education at school (S2016) 97% 97%
this is a good school (S2035) 93% 100%
their child likes being at this school* (S2001) 93% 100%
their child feels safe at this school* (S2002) 97% 94%
their child's learning needs are being met at this school* (S2003) 97% 100%
their child is making good progress at this school* (S2004) 97% 97%
teachers at this school expect their child to do his or her best* (S2005) 97% 100%
teachers at this school provide their child with useful feedback about his or her school work* (S2006) 90% 100%
teachers at this school motivate their child to learn* (S2007) 97% 100%
teachers at this school treat students fairly* (S2008) 93% 97%
they can talk to their child's teachers about their concerns* (S2009) 93% 100%
this school works with them to support their child's learning* (S2010) 93% 96%
this school takes parents' opinions seriously* (S2011) 93% 97%
student behaviour is well managed at this school* (S2012) 83% 87%
this school looks for ways to improve* (S2013) 96% 96%
this school is well maintained* (S2014) 93% 97%

Our school at a glance
Performance measure (Nationally agreed items shown*)
Percentage of students who agree that: 2012 2013
they are getting a good education at school (S2048) 89% 91%
they like being at their school* (S2036) 96% 94%
they feel safe at their school* (S2037) 90% 91%
their teachers motivate them to learn* (S2038) 95% 99%
their teachers expect them to do their best* (S2039) 100% 98%
their teachers provide them with useful feedback about their school work* (S2040) 96% 98%
teachers treat students fairly at their school* (S2041) 92% 97%
they can talk to their teachers about their concerns* (S2042) 87% 84%
their school takes students' opinions seriously* (S2043) 87% 95%
student behaviour is well managed at their school* (S2044) 73% 85%
their school looks for ways to improve* (S2045) 96% 99%
their school is well maintained* (S2046) 93% 97%
their school gives them opportunities to do interesting things* (S2047) 94% 95%
Performance measure
Percentage of school staff who agree that: 2013
they enjoy working at their school (S2069) 90%
they feel that their school is a safe place in which to work (S2070) 95%
they receive useful feedback about their work at their school (S2071) 88%
students are encouraged to do their best at their school (S2072) 100%
students are treated fairly at their school (S2073) 100%
student behaviour is well managed at their school (S2074) 90%
staff are well supported at their school (S2075) 88%
their school takes staff opinions seriously (S2076) 90%
their school looks for ways to improve (S2077) 100%
their school is well maintained (S2078) 100%
their school gives them opportunities to do interesting things (S2079) 90%
* Nationally agreed student and parent/caregiver items were incorporated in the School Opinion Survey in 2012.
# Percentage of respondents who Somewhat Agree, Agree or Strongly Agree with the statement. Due to a major redevelopment of the surveys (parent/caregiver and student in 2012; staff in 2013), comparisons with results from previous years are not recommended.

Our school at a glance
DW = Data withheld to ensure confidentiality.
Involving parents in their child’s education
Harris Fields State School values the parent teacher relationship and acknowledges the positive impact this relationship has on the development of our students.
In 2013 parents were involved in their child’s education at a partnership level through: Parent forums to encourage parent input and feedback Parents and Citizens meetings A fortnightly newsletter Open days for parents Parents were involved in celebrations of success through:
Special days/weeks celebration, students’ work displays and open days Reporting afternoons Parent cafes Celebrations throughout each term eg: Harmony Day, Annual Art Gallery, Literacy
and Numeracy Week, under 8s’ Day are popular with parents and are well attended. NAIDOC week, Reconciliation week and Indigenous games days.
Reducing the school’s environmental footprint
The school has installed a significant number of water tanks to reduce the use of articulated water for cleaning and gardening. Cleaners and School Facilities Officers have been involved in developing practices to minimise water usage. Light globes are all energy efficient and whitegoods have been replaced by energy efficient items.
Environmental footprint indicators
ElectricitykWh Water kL
2010-2011 158,333 1,935
2011-2012 154,201 1,812
2012-2013 147,641 309
The consumption data is sourced from the validated utilities expenditure return which the school submits at the end of each financial year. The data provides an indication of the consumption trend in each of the utility categories which impact on the schools environmental footprint.

Our staff profile
Staff composition, including Indigenous staff
The staff figures below are based on Equal Employment Opportunity (EEO) 2012 census. In accordance with the EEO privacy provisions and to ensure confidentiality, the ‘less than 5’ rule has been applied in schools whose Indigenous staff numbers are less than five.
2013 Workforce Composition
Teaching Staff *
Non-teaching Staff
Indigenous Staff
Headcounts 42 17 <5
Full-time equivalents 35.4 11.8 <5
Qualifications of all teachers Double click anywhere in either of the first two columns below; a spreadsheet appears. Based on your records , enter the numbers for your school for teachers with the corresponding highest level of qualification, check that the total matches the total teaching staff above, and then click outside the spreadsheet to return to the word template. (NB: the figures inserted below are examples only , not your school’s actual figures. The Department of Education, Training and Employment does not collect a teacher qualifications record on an annual basis).
* Teaching Staff includes School Leaders
** Graduate Diploma etc. includes Graduate Diploma, Bachelor Honours Degree, and Graduate Certificate
Expenditure on and teacher participation in professional development

Our staff profile
The total funds expended on teacher professional development in 2013 were $14 093.34 .
The major professional development initiatives were as follows: Cultural Awareness training Natural Maths Building Block to Literacy Learning (Magic Caterpillar – Barbara Brann) Learning Goals and Success Criteria Pathways & Fun Friends
The proportion of the teaching staff involved in professional development activities during 2013 was 100%.
Average staff attendance 2011 2012 2013
Staff attendance for permanent and temporary staff and school leaders. 97% 97% 96%
Proportion of staff retained from the previous school year
From the end of the previous school year, 81.8% of staff was retained by the school for the entire 2013 school year.
School income broken down by funding source
School income broken down by funding source is available via the My School website at http://www.myschool.edu.au/.
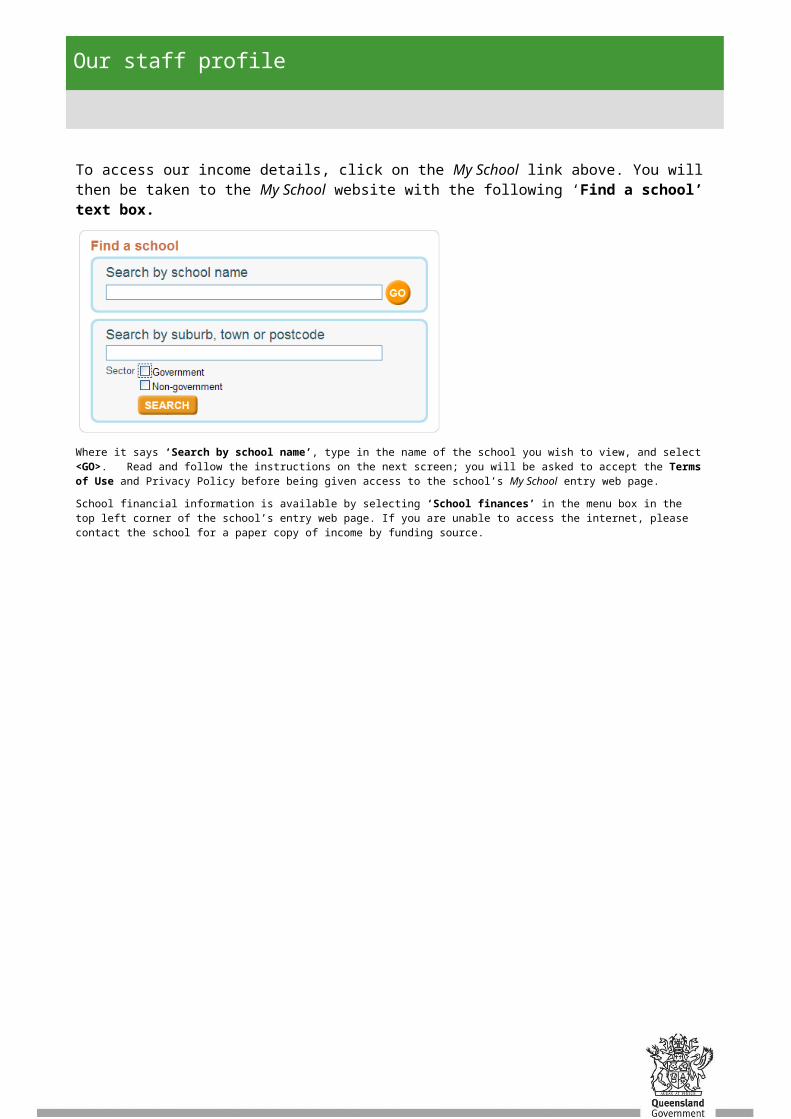
To access our income details, click on the My School link above. You will then be taken to the My School website with the following ‘Find a school’ text box.
Where it says ‘Search by school name’, type in the name of the school you wish to view, and select <GO>. Read and follow the instructions on the next screen; you will be asked to accept the Terms of Use and Privacy Policy before being given access to the school’s My School entry web page.
School financial information is available by selecting ‘School finances’ in the menu box in the top left corner of the school’s entry web page. If you are unable to access the internet, please contact the school for a paper copy of income by funding source.

Performance of our students
Key student outcomes
e Student attendance 2011 2012 2013
The overall attendance rate for the students at this school (shown as a percentage). 92% 93% 91%
The overall attendance rate in 2013 for all Queensland state Primary schools was 92%.
Student attendance rate for each year level (shown as a percentage)
Year 1
Year 2
Year 3
Year 4
Year 5
Year 6
Year 7
Year 8
Year 9
Year 10
Year 11
Year 12
2011 89% 92% 93% 91% 94% 93% 92%
2012 91% 94% 93% 92% 91% 93% 94%
2013 91% 90% 90% 90% 93% 92% 93%
Performance of our students
DW = Data withheld to ensure confidentiality.

Performance of our students
Student Attendance Distribution

Performance of our students
The proportions of students by attendance range.
17
13
21
13
12
10
26
24
23
43
51
46
0% 20% 40% 60% 80% 100%
2011
2012
* 2013
Proportion of Students
Attendance Rate: 0% to <85% 85% to <90% 90% to <95% 95% to 100%
* The method for calculating attendance changed in 2013 – care should be taken when comparing data from 2013 to that of previous years.

Performance of our students
Description of how non-attendance is managed by the school
Non-attendance is managed in state schools in line with the DET policies, SMS-PR-029: Managing Student Absences and SMS-PR-036: Roll Marking in State Schools, which outline processes for managing and recording student attendance and absenteeism.
Harris Fields State School has an attendance plan which outlines all stakeholders responsibilities in ensuring that students are in attendance, regularly and on time.
Late arrivals were tracked regularly using the OneSchool facility, and parents were contacted via text or phoned.
For excessive absences, the following proccess was implemented:
7-15 days contact is made with parents by Deputy Principal after three weeks following contact with the Deputy Principal a Notice (Form 4 – Failure to attend
(s.178(2)) will be sent
If after sending the Notice (Form 4): A meeting occurred with the parents, but there is no change in circumstances within one week (5
school days) of this meeting’; or A meeting did not occur with the parents, and there is no change in circumstances within one week
(5 school days) of sending the NoticeAn authorised officer at the school sends by registered post a Warning Notice (Form 5 – Failure to attend (s178(4)) advising parents of their legal obligations and offering a meeting to discuss support available to address failure to attend.
If there is no change in attendance a week (5 school days) after the Warning Notice (Form 5) was sent out, and the child is not enrolled at another state school or Home Education Unit, or there is no reasonable excuse for the child not attending school, an authorised officer will advise Regional Office they wish to seek the Director-General’s consent to prosecute.
Class rolls were marked twice each day, morning and afternoon, on OneSchool.
Students with appropriate attendance are acknowledged with a certificate of attendance at the end of each term.
National Assessment Program – Literacy and Numeracy (NAPLAN) results – our reading, writing, spelling, grammar and punctuation, and numeracy results for the Years 3, 5, 7 and 9.

Performance of our students
Our reading, writing, spelling, grammar and punctuation, and numeracy results for the Years 3, 5, 7 and 9 are available via the My School website at http://www.myschool.edu.au/.
To access our NAPLAN results, click on the My School link above. You will then be taken to the My School website with the following ‘Find a school’ text box.
Where it says ‘Search by school name’, type in the name of the school whose NAPLAN results you wish to view, and select <GO>.
Read and follow the instructions on the next screen; you will be asked to accept the Terms of Use and Privacy Policy before being able to access NAPLAN data.
If you are unable to access the internet, please contact the school for a paper copy of our school’s NAPLAN results.
Performance of our students
Achievement – Closing the Gap
Attendance: Indigenous attendance rate for 2013 was 88%, which was was slightly less than non-indigenous attendance at 91.5%, and marginally lower than 2012 at 90%, with a 17% transience rate which is at a rate consistent with the school population in general.
Attainment: NAPLAN – Reading in year 3, 5 and 7 - the mean was statistically similar to Queensland schools for all students and non-indigenous students in this school. Writing – In year 3 equivalent to Queensland schools and higher than the non-indigenous mean. Numeracy: Year 3 indigenous students outperformed their non-indigenous students, and in year 7 were at a similar mean to the state, and non-indigenous students in the school.