Annual Report 2011 - PNSC · 31 Ratio Analysis 32 Graphical ... 04 Annual Report 2011 ... Habib...
145
Pakistan National Shipping Corporation Annual Report 2011
Transcript of Annual Report 2011 - PNSC · 31 Ratio Analysis 32 Graphical ... 04 Annual Report 2011 ... Habib...

Pakistan National Shipping Corporation
Annual Report 2011

Contents02 Vision
03 Mission
04 Strategic Objectives
05 Corporate Information
06 Statement of Ethics & Business Practises
08 Board of Directors Profile
10 Chairman's Message
11 The Management (Profile)
14 Regulatory Appointments
15 Organization Chart
16 Fleet Strength
18 Directors' Report
24 Energy Conservation
25 Environmental Protection Measures
27 Occupational Safety and Health
28 Courses Conducted by ISM & Training Section
29 Fleet Acquisition
30 Value Added Statement
31 Ratio Analysis
32 Graphical Analysis
34 Horizontal Analysis (Group)
35 Vertical Analysis (Group)
36 Six Years at a Glance (PNSC)
37 Auditors’ Review Report on Compliance WithThe Code of Corporate Governance
38 Statement of Compliance with theCode of Corporate Governance
41 Consolidated Report and Accounts of PakistanNational Shipping Corporation Group of Companies
91 Report and Accounts of Pakistan National ShippingCorporation (Holding Company)
140 Pattern of Shareholding
141 Categories of Shareholders
142 Notice of Annual General Meeting
143 Proxy Form

To be a prominent player and key stakeholder
in global shipping industry by maintaining
diversified and efficient marine assets.
VISION
02 Annual Report 2011

MISSIONTo provide reliable & efficient shipping services to overseas andPakistan's sea borne trade, maintaining relationship of integrityand trust with our customers, partners, employees, safeguardinginterests of our stakeholders and contributing towards bettermentof national economy, society and the environment.
03Annual Report 2011

STRATEGIC OBJECTIVES
04 Annual Report 2011
• Persistent growth by strategically investing and diversifying in marine sectors according topast performance and future outlook.
• To be optimally profitable, viable, commercial organization and contribute to the nationaleconomy by securing a reasonable return on capital and minimize outflow of national foreignreserves.
• Ensure steady supplies to Pakistan defence forces in time of peace & war.
• To do highly ethical, environment friendly and socially responsible business practices.
• Ensuring that every employee feels proud of being part of PNSC team.
• To provide its clientele safe, secure, reliable and efficient services.
• To practice & believe in Equal Opportunity for every one in every aspect of business.

CORPORATE INFORMATION
AuditorsA. F. Ferguson & Co.
Chartered Accountants
Ernst & Young Ford Rhodes Sidat Hyder
Chartered Accountants
Shares RegistrarM/s Technology Trade (Pvt.) Ltd.
Dagia House 241-C,
Block 2, P.E.C.H.S Off
Sharah-e-Quaideen, Karachi.
BankersBank Al-Falah Limited
Barclays Bank Pakistan PLC
Faysal Bank Limited
Habib Bank Limited
JS Bank Limited
National Bank of Pakistan
Silk Bank
Standard Chartered Bank
United National Bank, London
National Bank of Pakistan, Tokyo
National Bank of Pakistan, Hong Kong
Bank Alfalah, Bahrain
Board of DirectorsSaleem Ahmed Meenai HI (M)
Vice Admiral (Retd) Chairman
Mr. Seerat Asghar Jaura Member
Capt. S. Akhlaq Hussain Abidi Member
Mr. Khowaja Obaid Imran Ilyas Member
Capt. Anwar Shah Member
Audit Committee of the BoardMr. Khowaja Obaid Imran Ilyas Chairman
Capt. S. Akhlaq Hussain Abidi Member
Chief Financial OfficerMr. Imtiaz C. Agboatwala
SecretaryMs. Zainab Suleman
Chief Internal AuditorMr. Muhammad Reyaz
Head OfficePNSC Building, Moulvi Tamizuddin
Khan Road. Karachi - 74000
Regional officeGulberg Heights, Lower ground floor,
Near sherpao bridge Gulberg,
Lahore, Pakistan.
05Annual Report 2011

STATEMENT OF ETHICS & BUSINESS PRACTISES
POLICY STATEMENT
1. It is the Corporation’s policy to conduct its business operations within the framework ofthe law and statutory rules and regulations, including the international law governingshipping operations.
2. The Corporation shall manage its affairs in accordance with concepts of good governance,with a high degree of integrity, transparency and accountability.
3. The Corporation shall constantly endeavour to formulate policies to ensure businessgrowth, optimize operational efficiencies and profitability, and develop a corporate cultureto reward merit and eliminate discrimination in all forms.
DEVELOPMENT OF INTERNAL CONTROL SYSTEMS
4. The Corporation shall maintain and update internal control systems, accounting/financialprocedure, rules and regulations, in keeping with modern management practices, and ensuredue compliance with regulatory requirements.
MAINTENANCE OF PROPER BOOKS OF ACCOUNT AND RECORDS
5. The Corporation shall maintain proper books of account and supporting documents inaccordance with law and regulatory requirements. No compromises as to the integrity offinancial records or financial statements shall be permitted.
6. The Corporation shall ensure that all statutory records are properly maintained and thatstatutory returns are f i led str ict ly according to the regulatory requirements.
7. All books of account, supporting documents, and statutory records shall be safeguardedand retained for such periods as may be prescribed by law or by the Corporation.
USE AND SAFEGUARDING OF CONFIDENTIAL INFORMATION
8. All information about the policies and business affairs of the Corporation is confidential.Information received from third parties under obligation of confidentiality belongs to thosethird parties and is confidential. Such information must not be used disclosed except aspermissible under the relevant agreements.
9. Employees shall not remove any documents or tangible items which belong to the Corporationor which contain any confidential information, from the Corporation’s premises without priorpermission, including vessels.
10. The responsibility to maintain the confidential nature of all non-public information in theCorporation’s possession continues after cessation of employment.
06 Annual Report 2011

07Annual Report 2011
CONFLICT OF INTEREST
11. No directors, officer or employee shall have any financial interest in or be involved in thebusiness activities of a competitor of the Corporation.
ACCEPTANCE OR GIVING OF BRIBES
12. No employee of the Corporation shall accept or give bribe or any illegal gratification in theconduct of the Corporation’s business.
DISCIPLINE AND GENERAL CONDUCT
13. All employees shall conform to and abide by the rules and regulations of the Corporation,and shall observe, comply with and abide by all orders which may from time to time be givenby any person under whose jurisdiction, superintendence or control an employee may forthe time being be placed.
14. The Corporation expects that all directors, officers and employees will understand and adhereto this statement of ethics and business practices. They shall be responsible for the consequencesof any violation. If a violationof law is also implicated, civil or criminal liability may result.

Vice Admiral (Retd) Saleem Ahmed Meenai HI (M)Chairman / CEO Pakistan National Shipping Corporationjoined Pakistan Navy in 1970. He is a graduate of Royal
Naval Staff College, Greenwich, UK. He acquired Master'sDegree from the National Defence University and
completed Senior Officers Defence Management Course,Monterey, California, USA.
He successively held various command and staffappointments ashore and afloat, such as PSC to Chief
of the Naval Staff, Assistant Chief of Naval Staff(Operations) and Deputy Chief of Naval Staff (Training
& Personnel) at Naval Headquarters, Islamabad andCommander Coast and Commander Karachi between
2006 and 2010.
He assumed the charge of the Chairman / CEO of PNSCon March 21, 2011. He also served as Director General
(Operations) and Chairman Port Qasim Authority in 2004-2006
He is an avid reader with focus on history and internationalrelations and a keen golfer.
Vice Admiral (Retd)Saleem Ahmed Meenai HI (M)
Chairman
BOARD OF DIRECTORS PROFILE
08 Annual Report 2011
Captain Anwar Shah is a reputedprofessional in the management andoperation of port terminals, maritimetransport and logistics industry with avast experience of over 33 years thatincludes marketing, chartering, marineinsurance hull and P&I Club, CargoClaim Survey, Shipping and Tradingdocumentation, Salvage of Ship andDamaged Cargoes, FrieghtForwarding, NVOCC operations,Stevedoring, Stowage Plan. CaptainShah is a Member Chartered andFellow Chartered Institute of Logistics& Transport London and a lawgraduate. He also served as DirectorGeneral Ports and Shipping/Additional Secretary Ministry of Portsand Shipping in 2003-2007.Captain Shah is an elected memberof PNSC’s Board of Directors. He is anexpert on World Bank Panel, GovernorWorld Maritime University Malmao(Sweden), Member IMO SecretaryGeneral's Panel of Experts (London)and Maritime Advisor to KCCI.
Captain Anwar ShahDirector

Captain Akhlaq HussainAbidi is a Businessman, ex-Master Mariner,commanded PNSC v esselsupto 1975. he also workedin Saudi Arabia with variousbusiness conglomeratesand also in Marine Cargoand Hull Surveys. Mr. Abidiis now operating Frozen FishProcessing and ExportHouse as a major player inseafood industry and is awell known expert.
He was elected as MemberNational Assembly andremained MNA till 2007. Hehas been on the board ofdirectors of Fishermen CoopSociety, Karachi Fish HarborAuthority and KESC andnow is a senior member ofPakistan National ShippingCorporation Board ofDirectors.
Capt. Akhlaq Hussain AbidiDirector
Khowaja Obaid Imran Ilyas is a graduate inEconomics from Cornell University New York USA.He is an ex-banker and served Standard Chartered
Bank from year 2000 till year 2002 in Corporateand Industrial Banking.
Currently he holds the position of Director BusinessDevelopment in family owned business named
IDSC (Pvt) Ltd in the business of indentingmachinery and spares for the local industry.
Mr. Khowaja Obaid Imran Ilyas is serving as anelected Director on the Board of Directors of
Pakistan National Shipping Corporation.
Khowaja Obaid Imran Ilyas
Mr. Seerat Asghar 'spublic service careerspans over 30 years.During this period, hehas held manyimportant positions inthe Provincial as wellas FederalGovernment.
Since the year 2000, heis working with theFederal Governmentand has remainedposted as jointsecretary in theministries of InformationTechnology,Commerce, PrimeMinister's Secretariat,Ministry of Interior andMinistry of Food andAgriculture.
Presently, he is workingas Additional Secretary(expenditure) in theFinance Division. Hewas nominated as theMember on PNSCBoard by the FederalGovernment on 23rdJanuary 2010.
Mr. Seerat Asghar JauraDirector
09Annual Report 2011
Director

PNSC like any other national shipping company is very special and intriguing. It is special because of,the truly global nature, the highly cyclical markets at play, and the unique competitive structure, withmany determined players in oceans to compete with. It is intriguing because fortunes are made and lostat fast pace.
The accomplishments of our corporation require the diligence and acumen of professional people workingtogether to meet our aspirations of recognition as one of the best global shipping companies and todeliver as we promise to our clients. As we march forward we continue to keep these thoughts in mindand strive to find the best mix of continuity and change to respond to volatile shipping market's dynamics.
I am fortunate to have with me a handful of people in PNSC who share my enthusiasm and desire to besecond to none in shipping business. With this goal in mind we have embarked on renewed 'vision' and'work ethics'. I am proud to say that PNSC will continue to add talented and dedicated professionals whoshare my philosophy of providing service based on hard work, integrity and professionalism.
So far, our activities have focused on diversified shipping business, derived from the transportation of oilliquids, bulk and dry cargoes of nearly all types. Our younger fleet and shipping vessels are equippedwith up-to-date facilities; with highly sophisticated equipment and computerized automation network.The success of our fleet replacement together with prudent management efforts will help us attain ourgoals. Undoubtedly, we are endeavouring to enhance our business operations. We will InshAllah continueto seek expansion of our fleet and other related services.
We take pride in Proficient and Quality Services. We are delighted to learn that our commitment toprofessional and quality service has received acknowledgment which will only reinforce our resolve andencourage us to strive for higher levels of excellence.
I thank our valued clients for their business and thank my staff for their loyalty and dedication. We lookforward to serve wi th f i r s t c lass t ransportat ion so lut ions in the twenty- f i r s t century .
Vice Admiral (Retd)Saleem Ahmed MeenaiHI (M)
CHAIRMAN'S MESSAGE
10 Annual Report 2011

THE MANAGEMENT
From Leftto Right
Capt. Aftab SiddiqiExecutive Director(Commercial)
Imtiaz C. AgboatwalaExecutive Director(Finance)
Saleem Ahmed Meenai HI (M)Chairman/CEOVice Admiral (Retd)
Brig (Retd) Rashid Siddiq SI (M)Executive Director(Administration)
Syed M. Obaidullah TI(M) SI(M)Executive Director (S P& P)Commodore (R)
Mr. Zaheer Babar QureshiExecutive Director(Ship Management)
11Annual Report 2011

12 Annual Report 2011
Executive Director (Finance) / CFOImtiaz C. Agboatwala qualified as a Chartered Accountant in 1975from Institute of Chartered Accountants of Pakistan (ICAP). He startedhis post qualifying professional carrier with A. F. Ferguson & Co in 1975.His 36 years professional experience include working with national andmultinational pharmaceutical companies/organizations as ChiefFinancial Officer.
He has extensively traveled, having attended several ManagementDevelopment Programmes and Seminars.
He joined Pakistan National Shipping Corporation on 02 January 2006as Executive Director/Chief Financial Officer. He is also a Director onthe Boards of 18 subsidiary companies of PNSC Group.
Executive Director (Administration)Brig (Retd) Rashid Siddiqi SI (M) joined PNSC in 2002 as ExecutiveDirector (Administration). He is also the Chairman Provident Fund andlooks after its investment and Asset Management.
He was appointed Chairman / CEO and Chairman Board of Directorsof Pakistan National Shipping Corporation in November 2009 till 21March 2011. During this period, he developed five-year fleetdevelopment plan and arranged loan without GOP guarantee andadded six modern vessels to the fleet.
He joined Pakistan Army in September 1971 and remained so till 2002.He is a graduate of Command and Staff College and National DefenceCollege. During his Army career he served as Member Faculty NationalDefence College Islamabad, Director Military Intelligence and BrigadeCommander.
He has widely traveled and is a keen Golfer and an ardent jogger andloves sports.
Chairman / CEOVice Admiral (Retd) Saleem Ahmed Meenai HI (M),is a recipient of Hilal-e-Imtiaz (Military). His previousassociation and experience with Pakistan MaritimeSector was in years 2004-2006 as Director General(Operations) and Chairman Port Qasim Authority.
Vice Admiral (Retd) Saleem Ahmed Meenai HI (M)Chairman / CEO Pakistan National ShippingCorporation joined Pakistan Navy in 1970 andcommissioned in the Operations Branch of PakistanNavy. He specialized in the Naval Communication inthe year 1981. He is a graduate of Royal Naval StaffCollege, Greenwich, UK. He acquired Master's Degreefrom the National Defence University and completedSenior Officers Defence Management Course,Monterey, California, USA.
He successively commanded three Guided MissileDestroyers, Submarine Chaser and Fast Attack Craftand held various command and staff appointmentsashore and afloat, such as PSC to Chief of the NavalStaff, Assistant Chief of Naval Staff (Operations) and
Deputy Chief of Naval Staff (Training & Personnel) at Naval Headquarters, Islamabad.
He had the distinction of having commanded all Surface Navy Squadrons of PN Fleet. During his fleet assignment, he heldappointments of Commander 25th Destroyer Squadron, Commander 18th Destroyer Squadron, Commander Auxiliary/Mine Countermeasure Squadron and Commander 10th Patrol and Missile Craft Squadron. He then served as Commander Coast and CommanderKarachi between 2006 and 2010.
He assumed the charge of the Chairman / CEO of Pakistan National Shipping Corporation on March 21, 2011.
He is an avid reader with focus on history and international relations and a keen golfer.

13Annual Report 2011
Executive Director(Special Projects and Plans)Commodore (R) Syed M. Obaidullah TI(M) SI(M) joinedPakistan National Shipping Corporation in 2007 as ExecutiveDirector (Special Projects and Plans). He served Pakistan Navyfor over 35 years. He joined Pakistan Navy in June 1971 with thedistinction of winning all awards, including the coveted Swordof Honor.
He is a seafarer and spent over 10 years at sea. He also servedas Director Plans (Navy), Director Public Relations (Navy), DirectorRecruitment, Chief Inspector (Navy) and Chief Staff Officer toCommander Karachi and Naval & Air Attaché at Tehran (Iran).
He is a graduate of Surface Warfare School (USA), Command& Staff College (Quetta), Royal Naval Staff College Greenwich(UK) and National Defence University.
Executive Director(Ship Management)Mr. Zaheer Babar Qureshi Executive Director (Ship Management)has over 37 years of continuous service / professional experiencewith Pakistan National Shipping Corporation in Ship Operationsand Technical Management. Both afloat and ashore.
He joined PNSC in August 1973 as an afloat officer Mr. Babar holds1st Class Certificate of Competency as Chief Engineer of MerchantShips and has also done Masters in Technical Management ofShipping Companies 1991 from the World Maritime University,Malmo Sweden established by the International MaritimeOrganization. Besides these qualifications, he is also a law graduateand member of the Middle East Region Technical AdvisoryCommittee of American Bureau of Shipping, ClassNK and Lloyd'sRegister.
Executive Director (Commercial)Capt. Aftab Siddiqi, Executive Director Commercial of PNSC isa Master Mariner by profession and a Fellow of Chartered Instituteof Transport and logistic, London. He is also a member of NauticalInstitute, London & Master Mariner Society of Pakistan.
He has almost 38 years of rich experience in the field both ashoreand afloat Capt Aftab has gained tremendous experience andknowledge about shipping industry,Extensive Knowledge on Dry& Wet Chartering, Booking notes / Charter parties / Contract ofAffreightments, Admiralty Law and Arbitration & FreightConferences. Capt. Aftab has been the Chairman of theKARMOHAM Conference (India-Pakistan-Bangladesh-CeylonConference) from 1996 to 2008. Members included such prestigiousnames like Maersk, Happag Lloyds, UASC, SCI, Evergreen, Andrewweir etc.

Chief AccoutantMr. Syed Jarar Haider Kazmi is head of Finance Department andChief Accountant since January 2007. He is associated with PNSCsince October 2005. Mr. Jarar is an associate member of the Instituteof Chartered Accountants of Pakistan and the Institute of PublicFinance Accountants of Pakistan with post qualification experienceof more than nine years on senior positions in other organizationsincluding Automobile and Pharmaceutical sector etc. Mr. Jarar isalso a member of the Public Sector Committee of the Institute ofChartered Accountant of Pakistan.
SecretaryMs. Zainab Suleman, Corporation & Board Secretary, had doneher LL.M. and is enrolled as an Advocate of High Court of Sindh.She is a member of High Court Bar Association. Prior to joiningPNSC she was working as an Advocate/Associate in a well reputedfirm of Advocates and Solicitors and gained a vast experience onthe corporate side. She has also attended a number of workshopsand conferences locally and abroad.
REGULATORY APPOINTMENTS
Chief Internal AuditorMr. Muhammad Reyaz is Head of Internal Audit since April 2004.He is Fellow Member of The Institute of Cost & ManagementAccounts of Pakistan (FCMA), Certified Internal Auditor (CIA, USA),Certified Information Systems Auditor (CISA, USA) and FellowMember of Pakistan Institute of Public Finance Accountants (FPA).Mr. Reyaz also held leadership positions in The Institute of InternalAuditors - Pakistan/ Karachi Chapter during last five years. Further,he has over 20 years previous experience on senior positions inother organizations including those of Head of Internal Audit, CFOetc.
14 Annual Report 2011
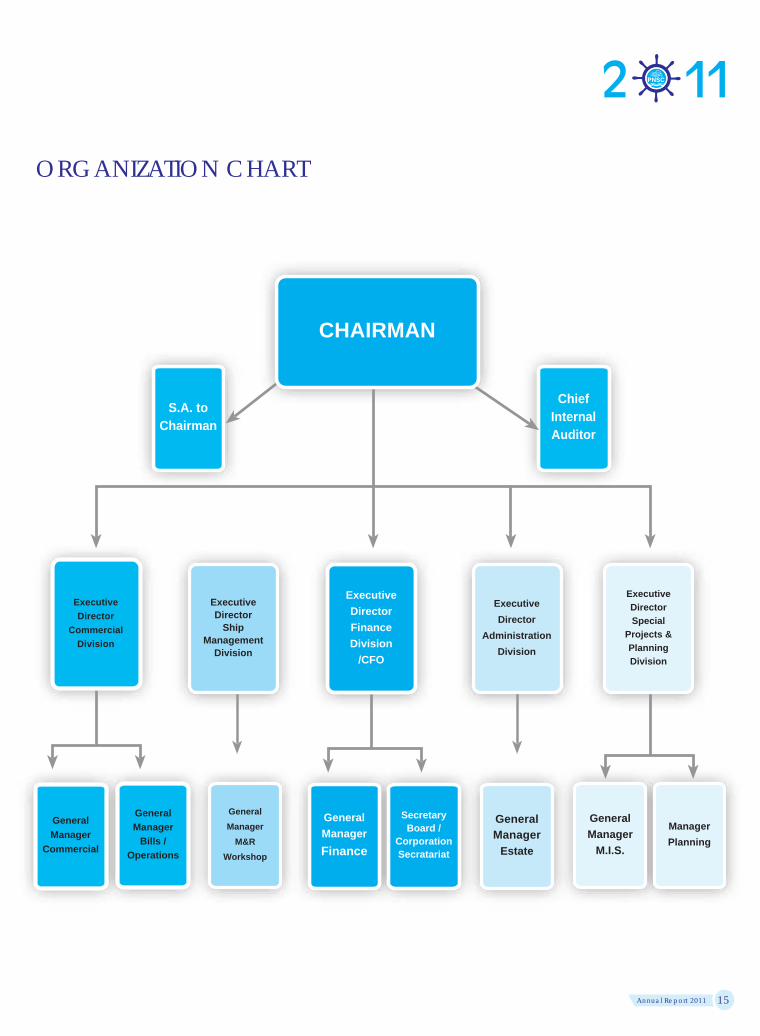
ORGANIZATION CHART
Executive
Director
Administration
Division
Executive
Director
Special
Projects &
Planning
Division
GeneralManager
Estate
General
Manager
M.I.S.
Manager
Planning
Executive
Director
Finance
Division
/CFO
General
Manager
Finance
SecretaryBoard /
CorporationSecratariat
S.A. toChairman
ChiefInternalAuditor
CHAIRMAN
General
Manager
Commercial
General
Manager
M&R
Workshop
ExecutiveDirector
ShipManagement
Division
General
Manager
Bills /
Operations
ExecutiveDirector
CommercialDivision
15Annual Report 2011

FLEET STRENGTH
Vessel Name
V.M. ISLAMABAD
IMO Number
7822706
Gross Tonnage
12395
Deadweight
18204
Length Overall
153.01 m
Built
KHI. SHIPYARD PAK.-1983
Vessel Name
M.V. Multan
IMO Number
7822093
Gross Tonnage
12395
Deadweight
18257
Length Overall
153.01 M
Built
MITUI JAMANO JAPAN - 1980
Vessel Name
M.T. QUETTA
IMO Number
9270555
Gross Tonnage
58,118 MT
Deadweight
107,215 MT
Length Overall
246.80 M
Built
Imabari Shipbuilding Co. Ltd., Japan 2003.
Vessel Name
M.T. LAHORE
IMO Number
9277541
Gross Tonnage
58,157 mt
Deadweight
107,018 mt
Length Overall
246.80 m
Built
Imabari Shipbuilding Co. Ltd., Japan 2003.
COMBI VESSELS
TANKERS
16 Annual Report 2011
Vessel Name
M.V. SARGODHA
IMO Number
7822017
Gross Tonnage
12395
Deadweight
18242
Length Overall
153.01 M
Built
OSHIMA JAPAN - 1980

Vessel Name
M.V. KAGHAN
IMO Number
8513015
Gross Tonnage
36098 MT
Deadweight
65716 MT
Length Overall
225.78 M
Built
NAMURA SHIP BUILDING CO., JAPAN-1986
Vessel Name
M.V. CHITRAL
IMO Number
9272876
Gross Tonnage
26395 MT
Deadweight
46710 MT
Length Overall
185.73 M
Built
Oshima Shipbuilding Co. Ltd, Japan - Jun 2003
Vessel Name
M.V. MALAKAND
IMO Number
9304198
Gross Tonnage
40,040 MT
Deadweight
76,830 MT
Length Overall
225 m
Built
Sasebo Heavy Industry Co. Ltd, Sasebo, Japan, 2004
Vessel Name
M.V. HYDERABAD
IMO Number
9278789
Gross Tonnage
29,365 MT
Deadweight
52,951 MT
Length Overall
12.143 M
Built
Oshima Shipyard, Nagasaki, Japan, 2004
Vessel Name
M.V. SIBI
IMO Number
9519224
Gross Tonnage
17,018 MT
Deadweight
28,442 MT
Length Overall
169.37 M
Built
Imabari Shipbuilding Co. Ltd, Marugame, Japan, 2009
Vessel Name
M.T. KARACHIIMO Number
9257814
Gross Tonnage
58,127 MT
Deadweight
107,081 MTLength Overall
246.80 M
Built
Imabari Shipbuilding Co. Ltd., Japan 2003.
BULK CARRIERS
17Annual Report 2011

18 Annual Report 2011
PAKISTAN NATIONAL SHIPPING CORPORATIONDIRECTORS' REPORT
FOR THE YEAR ENDED JUNE 30, 2011
The Board of Directors of Pakistan National Shipping Corporation is pleased to present the thirty third Annual Reporttogether with the Audited Financial Statements for the year ended June 30, 2011.
INDUSTRY OUTLOOKShipping is a global industry. It is closely tied to the rise and fall of trade in the world. Since 90% of world trade iscarried through oceans therefore shipping industry is playing a vital role in world economics. The industry is cyclicalin nature and essentially volatile. The earnings of a shipping company are primarily a function of demand andsupply dynamics of the global markets. Consequently, after year 2000, shipping sector grossly benefited from thebooming global economic environment. This gave impetus to capacity expansion and excessive new buildingorders. With this capacity enhancement trend ship tonnage is going to continuously rise until 2013. If trade demandremains subdued the industry is likely to experience capacity overhang and very competitive freight rates in theshort-medium term.
Pakistan National Shipping Corporation (PNSC) is engaged in transportation of dry bulk and liquid cargoes globally.At present it manages a fleet of 11 ships, real estates and a repair workshop. Our fleet is a mix of double hull Aframaxtankers, Panamax, Supramax, Handymax and Handy size bulk carriers, having a total carrying capacity of over646,000 tonnes of deadweight. Our vessels contribute to worldwide sea borne trade in a multitude of trade routesand carry wide range of cargoes for a number of traders and charterers of international repute.
OUR PERFORMANCEDuring current fiscal year the Group has witnessed increase in revenue despite slow global economic activity andsubdued freight rates, mainly attributable to change in the fleet mix. Moreover, the Management adhered to itspolicy of fleet modernization with the objective to lower operational costs while enhancing the deadweight carryingcapacity. This has resulted in improved financial performance of the Group.
An overview of the performance of the Group during the year was as follows:• PNSC Group achieved a turnover of Rs. 9,293 million as against Rs. 7,890 million last year with modest
growth in freight earnings, both dry cargo and liquid cargoes despite depressed freight rates.• Direct fleet expenses increased from Rs. 6,432 million to Rs. 7,303 million, an increase of 13.5%, mainly due
to inflationary increases and chartering of foreign flagged vessels.• Gross Profit of Rs. 1,990 million was achieved as against Rs. 1,458 million last year.• Admin Expenses and other operating expenses decreased by 7.5% due to better cost control measures.• Profit after tax was Rs. 1,007 mil l ion, an increase over last years’ f igure of Rs. 968 mil l ion.• Earnings per share of the Pakistan National Shipping Corporation Group of Companies were Rs. 7.62 as
against Rs. 7.33 last year.• Four new Dry Cargo Vessels were purchased and inducted in to the PNSC fleet during the year namely,
MV-Chitral, MV-Malakand, MV-Hyderabad and MV-Sibi.• During the year, one dry cargo combi vessel M.V. Bolan and two Oil Tankers, M.T. Swat and M.T. Johar were
disposed off as they were overage.
FLEET MODERNISATIONPNSC continued with its fleet expansion program and purchased 4 dry bulk carriers in fiscal year ending June 2011.The first Handy max vessel was delivered to PNSC on October 25, 2010 at Kashima-Japan, renamed as “Chitral”and second Panamax vessel “Malakand” was delivered to PNSC on December, 27 2010 at Dalian-China, ThirdSupramax vessel “Hyderabad” was delivered to PNSC on April 21, 2011 at Guangzhou China and Fourth Handy sizevessel “Sibi” was delivered to PNSC on May 17th at Kelang – Malaysia.
The global shipping industry is looking forward for the lean patch to be over and head towards the recovery whichis bound to come with the eventual rise of world economies, trade and rationalisation of ships tonnage in times tocome. Future expansion and modernisation of PNSC will resume as soon as the outlook of freight market, both dryand wet show sign of recovery.

CREDIT RATINGPakistan Credit Rating Agency (PACRA) has maintained PNSC’s credit rating as A1+ for short term and AA- for longterm. This rating denotes a very low expectation of credit risk. It indicates very strong capacity for timely paymentof financial commitments. This capacity is not significantly vulnerable to foreseeable events.
COMMERCIAL OPERATIONSDuring the year under review, PNSC and its vessel-owning subsidiary companies lifted 9.586 million freight tons ofcargo as compared to 7.921 million freight tons of cargo in the previous year.
OUR MARKET DYNAMICS
PNSC Business RelationsPNSC has excellent business relationship with Public Sector Organisations and Defence Services who continue tosupport PNSC. PNSC continues to lift crude oil for Pakistan refineries, and actively participates in global oiltransportation with its modern and newly acquired Aframax oil tankers.
Dry Cargo Bulk VesselsAt present our younger dry bulk fleet and Combis are employed worldwide with first class charterers on trip charterand period charter terms and conditions. This has helps us achieve global stature and recognition of PNSC in worldshipping community as a reputable ship owner / operator.
Market SharePNSC is engaged in global shipping business with its fleet of 11 vessels having average age of around 15 years andtotal tonnage of 646,666 DWT. Our share in the Pakistan trade is 9,586,367 tons in 2011 which is 11% of Pakistan’stotal trade estimated at 87.34 million tonnes.
Out of the total crude oil import in Pakistan of around 7.2 million tonnes per annum, PNSC tanker fleet is cateringto 6.5 million tonnes per annum. Thus almost all crude oil requirements of the country are met by PNSC alone.
Risks Including Strategic, Commercial, Operational and Financial RisksNo business is risk free and therefore there are inherent risk factors in shipping business too. Since PNSC ships aredoing business in the main international shipping markets it also exposed to risk factors that may affect any shippingcompany in the world.
Global maritime industry is at its lowest level since 2009 due to fears about over tonnage and the recession inglobal economy. The rising cost of marine fuels is also a cause for concern.
19Annual Report 2011
SECTOR 2010-2011 2009-2010 2008-2009
FREIGHT TONS FREIGHT TONS FREIGHT TONS
MILLION MILLION MILLION
Dry Bulk 0.885 0.622 0.957
Liquid Bulk (Tanker) 8.620 7.227 7.665
Slot Charter 0.081 0.072 0.062
Total 9.586 7.921 8.684

20 Annual Report 2011
Until recently, things looked optimistic, but declining world GDP growth and world trade somewhat dented shipowner's confidence.
This is the most unpredictable period since the beginning of the global financial crisis. Markets are at rock bottom,and likely to stay there for some time because of the large number of new vessels due to come into service.Likelihood is that older vessels and speculative investors, as well as low-grade operators, may disappear before thesituation can start to improve. The Group is exposed to the volatility inherent in the dry bulk and tanker market,where it has virtually all its assets and operations. Demand for dry & liquid bulk transportation is closely linked toglobal economic trends.
To counter extreme volatility in the market, the Group endeavours to keep more than half of its Bulk Carriers in fixedincome time charter over a prolonged period and a mix of spot market and voyage charter.
Credit RisksIn the present market the risk of counterparty default is very real. With a view to avoid such risks, we ensure stringentdue diligence to obviate these risks and try to restrict our dealings with the parties who are sound.
Cost for PiracyMore than 20,000 vessels transit Gulf of Aden each year. Present Piracy situation is very alarming for the internationalshipping community, which is adding to ship owner's daily operating costs and can affect the end-to-end supplychain. The Corporation being mindful of these risks takes necessary insurance cover against piracy as these are toogreat to be ignored. To protect group's ships, when passing through high risk areas, Best Management Practices(BMP-4) promulgated worldwide are being strictly adhered to and seems to be working effectively.
Financial RisksThe Group is exposed to financial risks, which include risks for interest rate and currency fluctuations. In addition,its borrowings create leverage, which will amplify the effects of rate, cost, and value movements. In addition,changes in taxation could have a material impact on the Group. However, based on thorough reviews an appropriatestrategy based on a consultative process is developed as deemed appropriate in the given circumstances toreduce the impact of risks arising out of any unfavourable situation.
FINANCING ARRANGEMENTSIn order to meet the funding requirement for purchase of vessels, PNSC concluded a long-term financing facilitywith a consortium of commercial banks and financial institutions. The facility was utilised to finance the purchaseof four dry cargo vessels as enumerated above.
HUMAN CAPITAL BUILDINGPNSC seeks to be an attractive employer and maintains a human relations policy that is open and fair. PNSC iscommitted to providing equal employment opportunity to all employees and applicants for employment, regardlessof race, ethnic background, gender, religion, or any other legally protected status. Diversity strengthens PNSC'soverall capacity and skills.
COMPLIANCE WITH CODE OF CORPORATE GOVERNANCEThe requirements of the Code of Corporate Governance set out by the Karachi Stock Exchange in its ListingRegulations have been duly complied with. A statement to this effect is annexed with the Report.
STATEMENT OF ETHICS AND BUSINESS PRACTICESThe Board has adopted the Statement of Ethics and Business Practices. All the employees are informed of thisStatement and are required to observe these rules of conduct in relation to business and its regulations.

CORPORATE SOCIAL RESPONSIBILITY
The company is committed to conducting business under good corporate governance principle, adhering
to business ethics and striving for the betterment of society and environment. The Corporation takes pride in
integrating corporate social responsibility within its vision and mission statement. PNSC's CSR policy functions
as a built-in self-regulating mechanism whereby business monitoring ensures active compliance with the spirit
of the law and maintaining ethical standards. The goal of Corporations' CSR policy is to embrace responsibility
through actions and make a positive impact through its
activities on the clients, employees, business communities and environment.
The procedures and policies laid down by the Corporation for operation of ships ensure compliance with spirit
of national and international regulations and international conventions. To keep these procedures dynamic
and updated, the Corporation has entrusted responsibility of continuous training, updating of knowledge,
protection of marine environment, safety and security of ships to a dedicated department.
PNSC directly and indirectly sponsors and promotes training and recruitment of the Pakistani national in
Pakistan Maritime Training Complex and other maritime training institutes to build a qualified maritime work
fo rce fo r employment on nat iona l and fo re ign f lag sh ips . PNSC under i t s in te r nsh ip
scheme provides training to fresh graduates from Universities across the country.
21Annual Report 2011

22 Annual Report 2011
BOARD MEETINGS HELD FOR THE PERIODFROM JULY 1, 2010 TO JUNE 30, 2011
CORPORATE AND FINANCIAL REPORTING FRAMEWORK
It is certified that:
(i) The financial statements prepared by the management present fairly its state of affairs, the result of itsoperations, cash flows and changes in equity.
(ii) Proper books of accounts of the Corporation have been maintained.
(iii) Appropriate accounting policies have been consistently applied in the preparation of financial statements. Accounting estimates are based on reasonable and prudent judgment.
(iv) International Accounting Standards, as applicable in Pakistan, have been followed in the preparation offinancial statements.
(v) The system of internal control system is sound in design and has been effectively implemented andmonitored.
(vi) There are no significant doubts about the Corporation’s ability to continue as a going concern.
(vii) There has been no material departure from the best practices of corporate governance, as detailed inthe Stock Exchange Listing Regulations.
(viii) Summary of key operating and financial data of last six financial years in summary form is annexed.
(ix) Outstanding duties and taxes if any, have been duly disclosed in financial statements.
(x) The total of investments made by Pakistan National Shipping Corporation Employees Contributory ProvidentFund, based on the un-audited accounts for the year ended June 30th, 2011 stood at Rs 845 million (2010:Rs 835 m).
(xi) During the year ended June 30th, 2011, a total of six meetings of the Board of Directors were held. Theposition of attendance during respective tenure was as follows:
MeetingsName of Directors Held Attended
Vice Admiral (Retd) Saleem Ahmed Meenai(Joined on 21st March, 2011)
Brigadier (R) Rashid Siddiqi(upto 21st March, 2011)
Mr. Seerat Asghar Jaura
Mr. Sohrab Adil Gilani(up to 3rd November, 2010)
Capt. S. Akhlaq Hussain Abidi
Mrs. Rukhsana Saleem (up to 23rd July, 2010)
Capt. Anwar Shah
Mr. Khowaja Obaid Imran Ilyas
S.NO.
1
2
3
4
5
6
7
8
2
4
6
2
6
1
6
6
2
4
4
2
6
-
6
6

AUDIT COMMITTEE MEETINGS HELD FOR THE PERIODFROM JULY 1, 2010 TO JUNE 30, 2011
23Annual Report 2011
CERTIFICATE OF RELATED PARTY TRANSACTIONSIt is confirmed that the transactions entered with related parties have been ratified by the Audit Committee and theBoard and provide the information about the amounts due from related parties at the balance sheet date.
MANAGEMENTThe Government of Pakistan has appointed Vice Admiral (R) Saleem Ahmed Meenai HI (M) as Chairman PakistanNational Shipping Corporation in place of Brigadier (R) Rashid Siddiqi SI (M) on March 21, 2011.Mr. Sohrab Adil Gilani resigned as Director from BoD PNSC on 3rd November 2010. His replacement has yet to bemade.
AUDITORSThe joint auditors, A.F. Ferguson & Co., Chartered Accountants and Ernst & Young Ford Rhodes Sidat Hyder CharteredAccountants retire and have offered themselves for reappointment. The Board recommends that, as suggested byAudit Committee, A.F. Ferguson & Co, Chartered Accountants and Ernst & Young Ford Rhodes Sidat Hyder CharteredAccountants may be appointed joint auditors for the year ending June 30, 2012.
STRATEGIES, OBJECTIVES AND FUTURE PROSPECTSThe Corporation is also taking steps to secure new business for maximum utilization of its capacity both in the domesticand regional markets. Nevertheless, the extent to recovery in the backdrop of overcapacity in the industry remainsto be seen.
FUTURE PROSPECTSPNSC has embarked upon its fleet replacement programme so that its overage vessels are replaced by newer andmodern vessels.
DIVIDENDThe Directors are pleased to recommend payment of cash dividend at 10% (Re. 1 per share) to the shareholderswhose names appear on the Share Register of the Corporation at the close of business on October 21, 2011.
ACKNOWLEDGMENTThe Board wishes to thank the officers and staff of the Corporation for their hard work and the dedication in thedischarge of their duties.
The Directors are also grateful to the refineries, shippers, agents, and other business associates for their continuedpatronage and support.
Vice Admiral (Retd)Saleem Ahmed MeenaiHI (M)
MeetingsName of Directors Held Attended
Mrs. Rukhsana Saleem(up to 23rd July, 2010)
Capt. S. Akhlaq Hussain Abidi
Mr. Khowaja Obaid Imran Ilyas
Mr. Sohrab Adil Gilani(up to 3rd November, 2010)
S.NO.
1
2
3
4
2
7
7
1
-
7
7
1

24 Annual Report 2011
ENERGY CONSERVATION
PNSC recognizes that burning of fossil fuels such as diesel and heavy fuel oil, can result in many environmentalimpacts. When fuel is combusted, pollutants such as the oxides of Carbon, Nitrogen and Sulphur are emittedto the atmosphere. These can contribute to the effects of greenhouse gases and acid rain.
We believe that the prime way in reducing the effects of the above emissions is to efficiently control andconserve energy wherever possible. Hence In order to minimize harmful emissions to the atmosphere by ourvessels, every care is taken to ensure that
• The main and auxil iary engines are operated according to the manufacturer's instructions.• The main and auxiliary engines are properly maintained as per the manufacture's instructions and
the vessel's planned maintenance system.• Funnel exhaust is correctly monitored to ensure eff icient combustion. PNSC tankers have
been fitted with video cameras on the funnel deck to continuously monitor the emissionsfrom the funnel.
• Speed is correctly adjusted to avoid excessive fuel consumption whilst staying within the parameters as directed by the concerned department/.charterers.• Speed i s reduced in heavy weather to avoid f requent pounding and consumpt ion.• The automatic pilot is correctly adjusted to avoid frequent and excessive helm movements.• The condit ion of the ship's bottom is regularly inspected for s igns of foul ing or damage
to coating.• The ship's propeller is regularly inspected for signs of damage.• Ancil lary systems, including l ighting, venti lation systems, galley hot plates, steam supplies etc. are turned off when not required.• Ship staff has been instructed to reduce paper consumption and switch over to electronic files system (computer files) PNSC is striving to eliminate all wasteful use of energy resources it deploys
in its normal course of business.

25Annual Report 2011
ENVIRONMENTAL PROTECTION MEASURES
PNSC recognizes environmental Protection and Management as one of its highest priorities and makes everyeffort to conserve and protect the environment from marine, atmospheric and other forms of Pollutions.
To eliminate the possibility of pollution at source a high standard of Safety and Environmental awareness ismaintained and all relevant legislation and conventions are followed in true spirit.The following types and sources of potential environmental pollution have been recognized by us and everyendeavour is made to mitigate their adverse impact upon the environment:
1. Oil. This includes discharge into the sea of oil from accidents and also covers the operational discharge of oi ly waste from cargo and that, which is used as fuel and lubricating oi l .2. Chemicals, l iquefied gases and other noxious liquid substances carried as cargo in bulk and chemical waste.3. Dangerous Goods. This includes dangerous dry cargoes carried in bulk and in packaged from and also covers other packaged and containerised goods, l iquid or otherwise that may
constitute a hazard to the environmental if spilled or lost.4. Garbage, including bio and non-biodegradable waste.5. Sewage.6. Ballast water. This includes the possibility of aquatic organisms or water-borne pathogens being
transported in ships' water ballast.7. Anti-fouling paints and their effect on shellfish and other aquatic life.8. Cargo vapour emissions and their effect on the natural environmental, human health and local
and global climate change.9. Exhaust emissions, including gases and unburnt hydrocarbon particles and their contribution
to smog, acid rain and the greenhouse effect.10. Ozone depleting substances, particularly CFCs and Halon gases and their effect on global warming.11. Noise levels from machinery and its effect on marine mammals, ships' crew and coastal populations.
Environmental Management in PNSCAll operations of PNSC vessels are closely monitored to ensure compliance with all the objectives of the ISMCode.

26 Annual Report 2011
Oil PollutionAll PNSC vessels carry dedicated oil spill removal equipment. This equipment complies with the Internationalrequirements and is listed in the vessel's SOPEP Manual.Regular Oil Spill drills are conducted as per PNSC/SMS/040 (Drill Schedule) so that the crew is trained in correctoperating procedures. Additionally regular onboard training is conducted in bunkering operations and the correctuse of Oil Discharge Monitoring Equipment.
Ballast WaterThe problem of harmful aquatic organism in ballast water had been at a very early stage recognized by PNSCand as such all its managed vessels stringently comply with the guidelines issued by IMO.All PNSC managed vessels carry ship specific ballast water management plan which lays down clear operatingpractices to be carried out for ballast operations as well as acting as a logbook for all ballast operations carriedout on board.
These plans have been prepared for compliance with regulation B-1 of the International Convention for theControl and Management of Ships' ballast Water and Sediments 2004 and the IMO guidelines for Ballast WaterManagement and Development of Ballast Water Management Plans' Resolution MEPC 127 (53).Ballast Water Management Plans for all our dry cargo vessels calling Brazilian ports are Class approved.Garbage Management PNSC recognizes its responsibility to fulfill all requirements under Annex V of MARPOL aswell as its responsibility to the world's environment in general. Every PNSC managed ship has its own garbagemanagement plan and record book. All the operations for collection, storage and disposal of garbage arerecorded in this garbage Record Book. Chief Officer is the ECO (Environmental Control Officer) and is responsiblefor recording all garbage management operations in the Garbage Record book. The records are regularlymoni tored by the v i s i t ing F leet Super intendents and rev iewed dur ing Internal SMS audi ts .Comprehensive instructions and training on garbage management is given to all Officers and crew joining PNSCmanaged vessels for the first time.
Anti-Fouling PaintvPNSC at a much earlier stage realized the detrimental impacts of TBT based paints and as such discontinued theuse TBT anti-fouling systems on the hulls of vessels managed by them. PNSC has practically been complying withthe provision of AFS convention since 2003.Every PNSC managed vessel which undergoes docking, after gritblasting of its hull is applied with two coats of primer paint followed by one barrier coat or sealer coat so thatthere is no chance of any previous non-compliant anti-fouling system to leach into the environment. On top ofthis barrier coat, two coats of organotin free, biocide free paint are applied.Upon completion of docking, the Class issues a certificate which evidences the voluntary compliance with therequirements of the AFS Convention.
Ozone Depleting Substances (ODS)MARPOL Annex VI prohibits any deliberate emission of ODS e.g.CFC (Chloro flouro carbons) refrigerants andHalon). PNSC is aware that existing Halon system and equipment can be used until 2020.Only one PNSC managed vessel has an Halon fire extinguishing system fitted onboard however, the ship staff hasbeen instructed to exercise due diligence and ensure that there is no deliberate venting of the Halon gas toatmosphere at anytime.
Use of refrigerant gas R-12 has been discontinued and has been replaced by R-22 gas. Emission to AtmospherePNSC support and endorse MARPOL Annex VI which covers exhaust gas emissions (NOx and Sox), ozone depletingsubstances, and volatile organic compounds (VOCs) e.t.c. Guidance to all PNSC managed vessels to preventand control emissions have been set out in relevant SMS manual. Masters and Chief Engineers have been advisedto strictly comply with Regulation 14 and 18 of MARPOL Annex VI.PNSC managed tankers are fitted with videocameras on the funnel deck to continuously monitor the emission of the funnel.
Exhaust gases from machinery& combustion of waste
Emissions ofFreon/Halon gases
Sewage &garbage
Oil spills fromengine room
Ballast Waterdischarge & exchange
Antiloulingpaint
Bilgewater disposal/tank washing

27Annual Report 2011
OCCUPATIONAL SAFETY AND HEALTHPNSC strongly believes that accidents don't just happen, then are caused and as such they may be preventedfrom occurring.
Our ultimate goal is to have
• Zero Personnel Injuries• Zero work related injuries
We in PNSC believe that improving our safety culture is the responsibility of each employee and they all havea contribution to make to achieve the ultimate goal. The management is committed to provide a workenvironment where no injury is considered acceptable and onboard our ships all activities are undertakenwithout compromising health and safety.
With the introduction of safety management system in PNSC, Occupational Safety and Health protectionhave become an integral point of all company operations and are included from the outset standing in theplanning phase - in all technical, economic and social considerations.Being the national company all relevant laws, ordinances, rules and operational regulations are compliedwith to the last detail.
PNSC Management believes that health and well being of the employees are the prerequisites for theirenhanced performance, commitment and motivation and such it is ensured that health and safety standardsare never compromised. The employee have been empowered to make decisions that will create a safework place, even if it means stopping work to make a situations safe.
Onboard our ships all personnel have the responsibility to report to the concerned DPA, any non-conformance,hazardous situation and safety accidents and therefore contribute towards their prevention. In addition toabove PNSC Training Section regularly conduct courses on health and safety aspects to the staff joining onethe PNSC managed ships.PNSC management believes that all injuries onboard can be prevented by necessary standard of safety,consciousness, personal discipline and individual accountability.

28 Annual Report 2011
COURSES CONDUCTED BY ISM & TRAINING SECTIONIntroductionThe present marine economic and environmental climate has highlighted the important that training plays in thesuccess or failure of businesses and projects. Shipping is a very risky business andquality training ensures that these risks are minimized as low as practicable.
PNSC Training SectionOne of the main responsibilities of the PNSC Training Section is to ensure that prior being employed onboard a PNSCmanaged vessel seafarer's are given proper familiarization training with PNSC Safety Management System. Thistraining is an integral part of multi session training program which is mandatory for ship staff being employed onboardship.In PNSC, training is considered to be an investment and is always on high priority both within our budget and withinstrategy.
The main objectives of PNSC multi session training programme is
1. To continuously improve safety management skills of personnel ashore and aboard ship,includingpreparing for emergencies related to safety and environmental protection.
2. To ensure that new personnel and personnel transferred to new assignments related to safetyand environment are given proper familiarization within their duties.
3. To provide a forum to share experiences.
PNSC Training Section has a very clear vision of what management desires from them and as such has progressivelyidentified areas in which training will be of benefit. In order to keep the mariners updated with the internationalcodes conventions and new requirements interactive training CDs and high quality training videos are procuredfrom UK and USA.
Courses being conducted by Training SectionThe Training Section has developed a number of courses, which are continuously being revised and updated tomeet the ever-changing requirements.

29Annual Report 2011
Flag hoisting ceremony of newly inducted PNSC vessel
Financial closing of a newly acquired Dry Bulk Carrier
FLEET ACQUISITION

VALUE ADDED STATEMENT
30 Annual Report 2011
2011
68.09%5.27%
9.61%
2.70%4.02%
1.35%8.95% Fleet Expenses
Administrative andGeneral Expenses
Salaries
Finance Cost
Taxes
66.60%6.68%
9.97%
0.24%
5.49%
2.26% 8.77%Fleet Expenses
Admin and GeneralExpenses
Salaries
Finance Cost
Taxes
2010
Wealth Generated
Income from Shipping BusinessRental IncomeOther operating income
Wealth Distributed
Fleet ExpensesAdministrative and General ExpensesSalariesFinance CostTaxesDividendRetained for Business
Rs. In '000
9,193,246 99,923
485,938 9,779,107
6,659,076 514,966 940,190 264,435 393,168 132,063 875,209
9,779,107
%
94.01%1.02%4.97%100%
68.09%5.27%9.61%2.70%4.02%1.35%8.95%100%
2011Rs. In '000
7,808,100 81,842
888,895 8,778,837
5,846,546 586,348 875,500
20,912 481,707 198,095 769,729
8,778,837
%
88.94%0.93%
10.13%100%
66.60%6.68%9.97%0.24%5.49%2.26%8.77%100%
2010

RATIO ANALYSIS
31Annual Report 2011
Profitability Ratios (%)Profit before taxGP ratioProfit after taxEBITDA margin to salesReturn on equityReturn on capital employed
Liquidity Ratios (times)Current RatioCash to Current liabilitiesCash flow from operations to Sales
Activity/Turnover Ratios (times)Debtor Turnover RatioAsset Turnover ratio
Market RatiosEarnings per shareP/E RatioDividend Yield ratioDividend Payout ratio
Cash dividend (Rs./share)Breakup value/share with surplus (Rs./share)Breakup value/share without surplus (Rs./share)Share Price at year end (Rs./share)Share Price- High Low
15.1%21.41%
10.8%29.4%5.56%3.79%
1.590.780.17
16.640.38
7.623.15
4.17%0.13
1.0146.42137.12
24.0041.7423.40
2010-11
18.4%18.48%
12.3%31.4%5.77%5.30%
2.961.020.66
12.520.42
7.335.44
3.76%0.20
1.5136.04127.00
39.8975.5438.00
2009-10
26.1%26.69%
20.2%41.8%
14.56%13.85%
5.441.330.13
16.860.56
17.512.64
6.50%0.17
3.0124.78120.25
46.1652.3144.14
2008-09
32.4%32.33%
22.8%36.3%
18.99%11.83%
4.371.890.47
19.200.55
18.543.86
4.33%0.17
3.1155.22
97.6471.55
112.2065.00
2007-08
31.3%28.53%
25.7%46.1%
22.50%15.69%
5.470.60
-0.19
23.690.61
17.705.31
1.60%0.08
1.5108.11
78.6494.0097.2040.00
2006-07
18.0%21.07%
16.1%32.9%
17.05%10.54%
3.540.800.25
31.600.60
9.656.54
1.58%0.10
1.084.9756.6263.10
139.7057.00
2005-06

GRAPHICAL ANALYSIS
32 Annual Report 2011
Revenue vs Operating Expenses
Operating Expenses
Revenue
14,000,000
12,000,000
10,000,000
8,000,000
6,000,000
4,000,000
2,000,000
0
Rs. i
n’00
0
Jun-06 Jun-07 Jun-08 Jun-09 Jun-10 Jun-11
Turnover vs Fixed Assets
Fixed Assets
Turnover
Rs. i
n’00
0
30,000,000
25,000,000
20,000,000
15,000,000
10,000,000
5,000,000
0Jun-06 Jun-07 Jun-08 Jun-09 Jun-10 Jun-11
Gross & Net Profit Ratio
GP Ratio
NP Ratio
%
35%
30%
25%
20%
15%
10%
5%Jun-06 Jun-07 Jun-08 Jun-09 Jun-10 Jun-11
Rs. i
n ‘0
00
Revenue by Segment12,000,000
10,000,000
8,000,000
6,000,000
4,000,000
2,000,000
0
Slot Charter
Dry Bulk
Liquid Bulk
Jun-06 Jun-07 Jun-08 Jun-09 Jun-10 Jun-11

33Annual Report 2011
Market/Break-up value per share
Rs. /
sha
re
Market value per share
Break-up value per share
180160140120100
80604020
0Jun-06 Jun-07 Jun-08 Jun-09 Jun-10 Jun-11
No of days performed by vessels
No
. of d
ays
No. of day performedby vessels
6,000
5,000
4,000
3,000
2,000
1,000
0Jun-06 Jun-07 Jun-08 Jun-09 Jun-10 Jun-11
Revenue & Capital Employed
Rs. i
n’00
0
Revenue
Capital Emplyed
30,000,000
25,000,000
20,000,000
15,000,000
10,000,000
5,000,000
0Jun-06 Jun-07 Jun-08 Jun-09 Jun-10 Jun-11
Dividend & EPS
Rs. /
sha
re
Dividend
EPS
20.00
15.00
10.00
5.00
0Jun-06 Jun-07 Jun-08 Jun-09 Jun-10 Jun-11

HORIZONTAL ANALYSIS (GROUP)
34 Annual Report 2011
Profit & LossRevenuesExpenditureGross ProfitAdministrative and General ExpensesOther operating expensesFinance costsOther operating incomeProfit before TaxationTaxationProfit after Taxation
Balance SheetProperty, plant and equipmentOther Non-Current AssetsTrade debtsCash and bank balancesOther Current AssetsTotal Assets
Shareholder's EquitySurplus on Revaluation of Fixed AssetsDeferred liabilitesLong Term FinancingCurrent portion of long term financingOther Current LiabilitiesTotal Equity and Liabilities
Cash Flow StatementCash Flows from Operating ActivitiesCash Flows from Investing ActivitiesCash Flows from Financing ActivitiesNet Increase/Decrease in Cash and cash equivalents
Rs. '000
9,293,169 7,303,240 1,989,929
631,646 179,346 264,435 485,938
1,400,440 393,168
1,007,272
23,975,314 1,042,715
654,580 2,100,797 1,512,474
29,285,880
18,107,931 1,228,579
320,395 6,941,693 1,079,763 1,607,519
29,285,880
1,562,377 (9,278,524)
7,766,987 50,840
% change
18%14%36%
1%-29%
1165%-45%
-3%-18%
4%
63%1%
42%60%
-25%50%
8%3%
10%--
25%50%
-70%61%
-2088%-106%
2011
Rs. '000
11,474,349 8,411,781 3,062,568
519,807 319,113
54,154 825,417
2,994,911 682,069
2,312,842
8,264,524 1,013,768
798,023 2,223,490 6,071,744
18,371,549
15,880,463 598,820 219,894
- -
1,672,37218,371,549
1,503,728 (2,304,478)
(686,251) (1,217,001)
% change
7%16%
-12%17%73%
-69%1%
-14%-34%
-6%
-39%-1%42%
-35%56%
-18%
23%-92%
5%--
-100%-18%
-70%-24%49%
-163%
Rs. '000
10,753,528 7,277,061 3,476,467
445,027 184,265 174,987 814,973
3,487,161 1,038,281 2,448,880
13,624,883 1,028,705
563,000 3,399,105 3,886,123
22,501,816
12,894,975 7,604,028
208,783 -
245,607 1,548,423
22,501,816
5,064,293 (2,662,349)
(460,745) 1,941,199
% change
18%12%34%-5%
28 %126%-11%22%
103%5%
93%-7%1%
274%-42%37%
24%95%
-47%-100%
-5%25%37%
-393%-630%
18%-220%
Rs. '000
9,089,124 6,495,702 2,593,422
468,030 143,509
77,353 943,526
2,848,056 511,183
2,336,873
7,069,437 1,107,702
557,290 907,906
6,749,267 16,391,602
10,385,689 3,892,173
397,077 215,643 258,771
1,242,249 16,391,602
(1,730,785) 502,797
(391,160) (1,619,148)
% change
15%4%
55%21%31%
6%185%100%234%
83%
-5%31%
165%-25%73%21%
39%4%
-1%-55%
--
21%
-187%-139%
-21%-864%
Rs. '000
7,924,614 6,255,047 1,669,567
385,297 109,951
73,274 331,499
1,427,552 152,955
1,274,597
7,430,919 848,178 209,936
1,207,054 3,903,604
13,599,691
7,477,504 3,744,407
399,550 474,021 258,557
1,245,652 13,599,691
1,978,268 (1,273,166)
(493,039) 212,063
Rs. '000
7,889,942 6,431,835 1,458,107
623,353 253,206
20,912 888,895
1,449,531 481,707 967,824
14,710,607 1,034,012
462,272 1,314,633 2,020,218
19,541,742
16,772,297 1,193,198
291,288 - -
1,284,95919,541,742
5,242,579 (5,762,074)
(390,752) (910,247)
% change
-31%-24%-52%20%
-21%-61%80%
-52%-29%-58%
78%2%
-42%-41%-67%
6%
6%99%32%
--
-23%6%
249%183%-43%-25%
2010 2009 2008 2007 2006
% change
-25%
-44%-9%
-66%-22%-58%-51%-22%-53%
7%-2%
-28%-71%673%
7%
29%-11%-5%
-35%1%
-1%7%
-35%44%40%
-88%

VERTICAL ANALYSIS (GROUP)
35Annual Report 2011
Profit & LossRevenuesExpenditureGross ProfitAdministrative and General ExpensesOther operating expensesFinance costsOther operating incomeProfit before TaxationTaxationProfit after Taxation
Balance SheetProperty, plant and equipmentOther Non-Current AssetsTrade debtsCash and bank balancesOther Current AssetsTotal Assets
Shareholder's EquitySurplus on Revaluation of Fixed AssetsDeferred liabilitesLong Term FinancingCurrent portion of long term financingOther Current LiabilitiesTotal Equity and Liabilities
Cash Flow StatementCash Flows from Operating ActivitiesCash Flows from Investing ActivitiesCash Flows from Financing ActivitiesNet Increase/Decrease in Cash and cash equivalents
Rs. '000
9,293,169 7,303,240 1,989,929
631,646 179,346 264,435 485,938
1,400,440 393,168
1,007,272
23,975,314 1,042,715
654,580 2,100,797 1,512,474
29,285,880
18,107,931 1,228,579
320,395 6,941,693 1,079,763 1,607,519
29,285,880
1,562,377 (9,278,524)
7,766,987 50,840
%
100%79%21%
7%2%3%5%
15%4%
11%
82%4%2%7%5%
100%
62%4%1%
24%4%5%
100%
3073%-18251%15277%
100%
2011
Rs. '000
11,474,349 8,411,781 3,062,568
519,807 319,113
54,154 825,417
2,994,911 682,069
2,312,842
8,264,524 1,013,768
798,023 2,223,490 6,071,744
18,371,549
15,880,463 598,820 219,894
- -
1,672,372 18,371,549
1,503,728 (2,304,478)
(686,251) (1,217,001)
%
100%73%27%
5%3%
-7%
26%6%
20%
45%6%4%
12%33%
100%
86%3%1%
--
9%100%
-124%167%
56%100%
Rs. '000
10,753,528 7,277,061 3,476,467
445,027 184,265 174,987 814,973
3,487,161 1,038,281 2,448,880
13,624,883 1,028,705
563,000 3,399,105 3,886,123
22,501,816
12,894,975 7,604,028
208,783 -
245,607 1,548,423
22,501,816
5,064,293 (2,662,349)
(460,745) 1,941,199
%
100%68%32%
4%2%2%8%
32%10%23%
61%5%3%
15%17%
100%
57%34%
1%-
1%7%
100%
261%-137%
-24%100%
Rs. '000
9,089,124 6,495,702 2,593,422
468,030 143,509
77,353 943,526
2,848,056 511,183
2,336,873
7,069,437 1,107,702
557,290 907,906
6,749,267 16,391,602
10,385,689 3,892,173
397,077 215,643 258,771
1,242,249 16,391,922
(1,730,785) 502,797
(391,160) (1,619,148)
%
100%71%29%
5%2%1%
10%31%
6%26%
43%7%3%6%
41%100%
63%24%
2%1%2%8%
100%
107%-31%24%
100%
Rs. '000
7,924,614 6,255,047 1,669,567
385,297 109,951
73,274 331,499
1,427,552 152,955
1,274,597
7,430,919 848,178 209,936
1,207,054 3,903,604
13,599,691
7,477,504 3,744,407
399,550 474,021 258,557
1,245,652 13,599,691
1,978,268 (1,273,166)
(493,039) 212,063
%
100%79%21%5%1%1%4%
18%2%
16%
55%6%2%9%
29%100%
55%28%3%3%2%9%
100%
933%-600%-232%100%
Rs. '000
7,889,942 6,431,835 1,458,107
623,353 253,206
20,912 888,895
1,449,531 481,707 967,824
14,710,607 1,034,012
462,272 1,314,633 2,020,218
19,541,742
16,772,297 1,193,198
291,288 - -
1,284,959 19,541,742
5,242,579 (5,762,074)
(390,752) (910,247)
%
100%82%18%
8%3%
-11%18%
6%12%
75%5%2%7%
10%100%
86%6%1%
--
7%100%
-576%633%
43%100%
2010 2009 2008 2007 2006

36 Annual Report 2011
SIX YEARS AT A GLANCE (PNSC)
Profit & LossRevenueExpenditureGross profitAdministrative, general & other expensesOther incomeProfit before taxationTaxationProfit after taxation
Balance SheetNon-current assetsCurrent assetsTotal Assets
Paid-up CapitalReservesShare-holders' equitySurplus on revaluation of fixed assetsNon-current liabilitiesCurrent liabilities
RATIOSProfitablility RatiosOperating Profit/ Operating Revenue (%)Profit Before Tax/Operating Revenue (%)Profit after Tax/Operating Revenue (%)Return on Capital Employed
Liquidity / Leverage RatiosCurrent RatioAsset Turnover Ratio (Times)Equity / Total Assets (%)
Return to ShareholdersEarnings per share (Rs.)Price Earning Ratio (Rs.)Cash Dividend (Rs. / share)Break-up Value per share
Share prices in RupeesHighLow
2010-2011
3,084,361 1,945,834 1,138,527
555,079 317,110 900,558 288,157 612,401
26,303,826 3,309,308
29,613,134
1,320,634 5,565,343 6,885,977
662,817 7,262,089
14,802,251 29,613,134
37%29.20%19.86%
4.13%
0.22 0.1225%
4.64 5.171.00
57.16
41.74 23.40
2009-2010
2,077,947 1,351,580
726,367 421,782 834,377
1,138,962 427,429 711,533
15,694,447 2,826,872
18,521,319
1,320,634 5,140,981 6,461,615
671,928 291,288
11,096,488 18,521,319
35%54.81%34.24%
9.58%
0.25 0.1339%
5.39 7.40 1.50
54.02
75.54 38.00
2008-2009
3,491,783 1,932,155 1,559,628
685,475 824,149
1,698,302 641,539
1,056,763
8,729,638 8,070,341
16,799,979
1,320,634 4,814,590 6,135,224
681,027 219,894
9,763,834 16,799,979
45%48.64%30.26%15.02%
0.83 0.4041%
8.00 5.77 3.00
51.61
52.31 44.14
2007-2008
3,100,257 1,912,278 1,187,979
615,906 765,462
1,337,535 922,644 414,891
6,143,866 7,470,470
13,614,336
1,320,634 4,152,565 5,473,199
743,324 208,783
7,189,030 13,614,336
38%43.14%13.38%
6.46%
1.04 0.5046%
3.14 22.79
3.10 47.07
112.20 65.00
2006-2007
2,168,325 802,803
1,365,522 260,768 833,398
1,938,152 480,933
1,457,219
3,542,942 8,492,819
12,035,761
1,320,634 3,874,701 5,195,335
748,461 612,720
5,479,24512,035,761
63%89.38%67.20%22.23%
1.55 0.6149%
11.03 8.52 1.50
45.01
97.20 40.00
2005-2006
1,748,341807,046941,295242,715436,112
1,134,692128,529
1,006,163
4,483,1324,843,2639,326,395
1,320,6342,542,9203,863,554
536,407873,571
4,052,8639,326,395
54%64.90%57.55%19.08%
1.200.3947%
7.628.281.00
33.32
139.7057.00
(Rupees in '000)

Pakistan National Shipping Corporation(Established under the Pakistan National Corporation Ordinance, 1979)Year Ended: 30th June 2011
This statement is being presented to comply with the Code of Corporate Governance contained inRegulation 37 of the Listing Regulations of Karachi Stock Exchange for the purpose of establishing aframework of good governance, whereby a listed corporation is managed in compliance with thebest practices of corporate governance.
The Corporation has applied the principles contained in the Code in the following manner:
1. In accordance with the provisions of the Pakistan National Shipping Corporation Ordinance, 1979,the Board of Directors consists of five directors to be appointed by Federal Government, and twodirectors to be elected by the shareholders other than the Federal Government. All directorsother than the Chairman are non-executive directors.
2. None of the directors is serving as a director in more than ten listed companies, including thisCorporation.
3. All the resident directors of the Corporation are registered as taxpayers and none of them hasdefaulted in payment of any loan to a banking company, a DFI or an NBFI or, being a memberof a stock exchange, has been declared as a defaulter by that stock exchange.
4. During the year two casual vacancies occurred when two appointed directors, Mrs. RukhsanaSaleem and Mr. Sohrab Adil Gilani resigned from the directorships of the Corporation on July 23,2010 and November 3, 2010 respectively. The Federal Government is in the process of appointingtwo new directors on the Board as per requirement of the PNSC Ordinance, 1979.
5. The Corporation has prepared a 'Statement of Ethics and Business practices', which has beensigned by all the directors and employees of the Corporation.
6. The Board has revised its vision/mission statement, overall corporate strategy and significantpolicies of the Corporation in the current year. A complete record of particulars of significantpolicies with the dates on which they were approved or amended has been maintained.
7. All the powers of the Board have been duly exercised and decisions on material transactions,including appointment and determination of remuneration and terms and conditions of employmentof the CEO and other executive directors, have been taken by the Federal Government or theBoard of Directors, as appropriate.
8. The meetings of the Board were presided over by the Chairman, and the Board met at least oncein every quarter. Written notices of the Board meetings along with the agenda and workingpapers were circulated at least seven days before the meetings. The minutes of the meetingswere appropriately recorded and circulated.
STATEMENT OF COMPLIANCE WITH THE CODE OFCORPORATE GOVERNANCE
37Annual Report 2011
38 Annual Report 2011
9. The Directors of the Corporation are professionally qualified and experienced persons and arewell aware of their duties and responsibilities. During the year continuous efforts were made toarrange orientation courses for the Directors which may materialize in due course.
10. There has been no fresh appointments of Chief Financial Officer, Corporation Secretary andHead of Internal Audit during the year.
11. The directors' report for this year has been prepared in compliance with the requirements of theCode and fully describes the salient matters required to be disclosed.
12. The financial statements of the Corporation were duly endorsed by CEO and CFO before approvalof the Board.
13. The directors, CEO and executives do not hold any interest in the shares of the Corporation otherthan that disclosed in the pattern of shareholding.
14. The Corporation has complied with all the corporate and financial reporting requirements of theCode of Corporate Governance.
15. The Board has formed an audit committee. It comprised of three members, all of whom werenon-executive directors including the chairman of the committee. During the year a casualvacancy occurred in the audit committee and the appointment of the member is still awaited.
16. The meetings of the audit committee were held at least once every quarter prior to approvalof the interim and final results of the Corporation as required by the Code.
17. The Board has set up an effective internal audit function.
18. The statutory auditors of the Corporation have confirmed that they have been given a satisfactoryrating under the quality control review programme of the Institute of Chartered Accountants ofPakistan, that they or any of the partners of the firm, their spouses and minor children do not holdshares of the Corporation and that the firm and all its partners are in compliance with InternationalFederation of Accountants (IFAC) guidelines on code of ethics as adopted by Institute of CharteredAccountants of Pakistan.
19. The statutory auditors or the persons associated with them have not been appointed to provideother services except in accordance with the listing regulations and the auditors have confirmedthat they have observed IFAC guidelines in this regard.
20. The related party transactions have been placed before the audit committee and approvedby the Board of Directors with necessary justification for non arm's length transactions and pricingmethods for transactions that were made on terms equivalent to those that prevail in the arm'slength transactions only if such terms can be substantiated.
21. We confirm that all other material principles contained in the Code have been complied with.
VICE ADMIRAL (RETD.)SALEEM AHMED MEENAI HI (M)CHAIRMAN / CHIEF EXECUTIVE

39Annual Report 2011
AUDITORS’ REVIEW REPORT ON COMPLIANCEWITH THE CODE OF CORPORATE GOVERNANCE
We have reviewed the Statement of Compliance with the best practices contained in the Code ofCorporate Governance for the year ended June 30, 2011 prepared by the Board of Directors of PakistanNational Shipping Corporation to comply with the Listing Regulation No. 35 of the Karachi Stock Exchange(Guarantee) Limited where the Corporation is listed.
The responsibility for compliance with the Code of Corporate Governance is that of the Board of Directorsof the Corporation. Our responsibility is to review, to the extent where such compliance can be objectivelyverified, whether the Statement of Compliance reflects the status of the Corporation's compliance withthe provisions of the Code of Corporate Governance and report if it does not. A review is limited primarilyto inquiries of the Corporation's personnel and review of various documents prepared by the Corporationto comply with the Code.
As a part of our audit of the financial statements, we are required to obtain an understanding of theaccounting and internal control systems sufficient to plan the audit and develop an effective auditapproach. We have not carried out any special review of the internal control system to enable us toexpress an opinion as to whether the Board's statement on internal control covers all controls and theeffectiveness of such internal controls.
Further, Sub-Regulation (xiiia) of Listing Regulations 35 notified by The Karachi Stock Exchange requires theCorporation to place before the Board of Directors for their consideration and approval of related partytransactions distinguishing between transactions carried out on terms equivalent to those that prevail inarm's length transactions and those which are not executed at arm's length prices and recording properjustification for using such alternate pricing mechanism. Further, all such transactions are also required tobe separately placed before the audit committee. We are only required and have ensured complianceof subject requirement to the extent of approval of related party transactions by the Board of Directorsand placement of such transactions before the audit committee. We have not carried out any proceduresto determine whether the related party transactions were undertaken at arm's length price or not.
Based on our review, nothing has come to our attention, which causes us to believe that the Statementof Compliance does not appropriately reflect the status of the Corporation's compliance, in all materialrespects, with the best practices contained in the Code of Corporate Governance as applicable to theCorporation for the year ended June 30, 2011.
A. F. FERGUSON & CO.Chartered AccountantsKarachi, September 28, 2011
ERNST & YOUNG FORD RHODESSIDAT HYDERChartered AccountantsKarachi, September 28, 2011
A.F. FERGUSON & CO.CHARTERED ACCOUNTANTSSTATE LIFE BULIDINGI.I. CHUNDRIGAR ROADKARACHI
ERNST & YOUNG FORD RHODESSIDAT HYDERCHARTERED ACCOUNTANTSPROGRESSIVE PLAZABEAUMONT ROADKARACHI

CONSOLIDATED
REPORT AND ACCOUNTS
OF
PAKISTAN NATIONAL
SHIPPING CORPORATION
GROUP OF COMPANIES

BLANK
Paki
stan
Nat
iona
l Shi
ppin
g C
orpo
ratio
n
Annual Report 2011 42
Paki
stan
Nat
iona
l Shi
ppin
g C
orpo
ratio
n
Annual Report 2011 43
AUDITORS’ REPORT TO THE MEMBERS
We have audited the annexed consolidated financial statements comprising consolidatedbalance sheet of Pakistan National Shipping Corporation and its subsidiary companies as at June30, 2011 and the related consolidated profit and loss account, consolidated statement ofchanges in equity and consolidated cash flow statement together with the notes forming partthereof, for the year then ended. We have also expressed separate opinions on the financialstatements of Pakistan National Shipping Corporation and its subsidiary companies. Thesefinancial statements are the responsibility of the holding company’s management. Ourresponsibility is to express an opinion on these statements based on our audit.
Our audit was conducted in accordance with the International Standards on Auditing asapplicable in Pakistan and accordingly includes such tests of accounting records and such otherauditing procedures as we considered necessary in the circumstances.
In our opinion the consolidated financial statements present fairly the financial position of PakistanNational Shipping Corporation and its subsidiary companies as at June 30, 2011 and the results oftheir operations, changes in equity and cash flows for the year then ended.
A. F. FERGUSON & CO. ERNST & YOUNG FORD RHODES SIDAT HYDERChartered Accountants Chartered AccountantsAudit Engagement Partner : Saad Kaliya Audit Engagement Partner : Riaz A. Rehman ChamdiaKarachi, September 28, 2011 Karachi, September 28, 2011
A. F. FERGUSON & CO.CHARTERED ACCOUNTANTS(a member firm of PwC network)STATE LIFE BUILDING 1-CI. I. CHUNDRIGAR ROADKARACHI
ERNST & YOUNG FORD RHODES SIDAT HYDERCHARTERED ACCOUNTANTSPROGRESSIVE PLAZABEAUMONT ROADKARACHI

Note 2011 2010(Rupees in ‘000)
ASSETSNON-CURRENT ASSETS
Property, plant and equipment 4 23,975,314 14,710,607Intangible asset 5 - - Investment properties 6 996,638 970,926Long-term investments in:
- Related party (associate) 7 - -- Listed companies and an other entity 8 26,883 26,254
Long-term loans 9 214 668Long-term deposits 90 90Deferred tax - net 10 18,890 36,074
25,018,029 15,744,619CURRENT ASSETS
Stores and spares 11 537,248 536,449Trade debts 12 654,580 462,272Agents' and owners' balances 13 6,443 1,070Loans and advances 14 62,618 38,863Deposits and short term prepayments 15 28,079 7,132Interest / mark-up accrued 2,582 1,786Other receivables 16 240,382 72,592Incomplete voyages 17 92,992 80,616Insurance claims 18 36,672 46,651Taxation - net 28,158 27,835Short-term investments 19 477,300 1,207,224Cash and bank balances 20 2,100,797 1,314,633
4,267,851 3,797,123
TOTAL ASSETS 29,285,880 19,541,742
EQUITY AND LIABILITIES
EQUITY ATTRIBUTABLE TO THE OWNERS OF THE HOLDING COMPANYShare capital 21 1,320,634 1,320,634Reserves 22 16,785,737 15,449,428
18,106,371 16,770,062
NON-CONTROLLING INTEREST 23 1,560 2,235EQUITY ATTRIBUTABLE TO EQUITY HOLDERS OF THE GROUP 18,107,931 16,772,297
SURPLUS ON REVALUATION OF FIXED ASSETS - NET OF TAX- Owners of the holding company 1,227,292 1,191,054- Non-controlling interest 1,287 2,144
24 1,228,579 1,193,198NON-CURRENT LIABILITIES
Long term financing 25 6,941,693 -Deferred liabilities 26 320,395 291,288
7,262,088 291,288CURRENT LIABILITIES AND PROVISIONTrade and other payables 27 1,414,283 1,090,585Provision against damage claims 28 28,327 39,403Accrued Mark up 134,898 -Current portion of long-term financing 25 1,079,763 -Taxation - net 30,011 154,971
2,687,282 1,284,959
TOTAL EQUITY AND LIABILITIES 29,285,880 19,541,742CONTINGENCIES AND COMMITMENTS 29
The annexed notes 1 to 50 form an integral part of these consolidated financial statements.
Paki
stan
Nat
iona
l Shi
ppin
g C
orpo
ratio
n
Annual Report 2011 44
PAKISTAN NATIONAL SHIPPING CORPORATION AND ITS SUBSIDIARY COMPANIESCONSOLIDATED BALANCE SHEETAS AT JUNE 30, 2011
Vice Admiral (R) Saleem Ahmed Meenai Khowaja Obaid Imran IlyasChairman & Chief Executive Director

Paki
stan
Nat
iona
l Shi
ppin
g C
orpo
ratio
n
Note 2011 2010(Rupees in ‘000)
REVENUESIncome from shipping business 30 9,193,246 7,808,100Rental income 99,923 81,842
9,293,169 7,889,942EXPENDITUREFleet expenses - direct 31 7,198,142 6,354,925
- indirect 32 17,038 19,799Real estate expenses 33 88,060 57,111
7,303,240 6,431,835GROSS PROFIT 1,989,929 1,458,107
Administrative and general expenses 34 631,646 623,353Other operating expenses 35 179,346 253,206Finance costs 36 264,435 20,912
1,075,427 897,471Other operating income 37 485,938 888,895PROFIT BEFORE TAXATION 1,400,440 1,449,531Taxation 38 393,168 481,707PROFIT AFTER TAXATION 1,007,272 967,824
Attributable to:Equity holders of the holding company 1,006,950 967,484Non-controlling interest 322 340
1,007,272 967,824
(Rupees)EARNINGS PER SHARE FOR PROFIT ATTRIBUTABLETO EQUITY HOLDERS OF THE HOLDING COMPANY 39 7.62 7.33
Note: The appropriations from profits are set out in the statement of changes in equity.
The annexed notes 1 to 50 form an integral part of these consolidated financial statements.
Annual Report 2011 45
PAKISTAN NATIONAL SHIPPING CORPORATION AND ITS SUBSIDIARY COMPANIESCONSOLIDATED PROFIT AND LOSS ACCOUNTFOR THE YEAR ENDED JUNE 30, 2011
Vice Admiral (R) Saleem Ahmed Meenai Khowaja Obaid Imran IlyasChairman & Chief Executive Director

Attributable to the share holders of the holding company
Issued, Captial Revenue reserves Non- Totalsubscribed reserve General Unappro- controllingand pad-up reserves priated interestshare capital profit
(Note 21)--------------------------- (Rupees in ‘000) ---------------------------
Balance as at July 1, 2009 1,320,634 131,344 129,307 14,297,283 1,895 15,880,463
Total comprehensive income for the year ended June 30, 2010 - - - 967,484 340 967,824
Surplus realised on disposal of vessels - - - 290,407 - 290,407Surplus on revaluation of fixed assets
realised through incremental depreciation charged on related assets during the year, recognised directly in equity- net of tax - - - 29,793 - 29,793
Transactions wih ownersFinal cash dividend for the year ended
June 30, 2009 paid to shareholders of the holding company(Rs 3 per Ordinary share) - - - (396,190) - (396,190)
Balance as at June 30, 2010 1,320,634 131,344 129,307 15,188,777 2,235 16,772,297
Total comprehensive income for the year ended June 30, 2011 - - - 1,006,950 322 1,007,272
Surplus realised on disposal of vessels - - - 569,340 - 569,340Surplus on revaluation of fixed assets
realised through incremental depreciation charged on related assets during the year, recognised directly in equity- net of tax - - - 93,653 - 93,653
Transaction cost incurred for issue of further share capital of subsidiaries - - - (135,788) - (135,788)
Transactions wih ownersFinal cash dividend for the year ended
June 30, 2010 paid to shareholders of the holding company(Rs 1.5 per Ordinary share) - - - (198,095) - (198,095)
Acquisition of non-controlling interest - - - 249 (997) (748)Total transactions with owners - - - (197,846) (997) (198,843)
Balance as at June 30, 2011 1,320,634 131,344 129,307 16,525,086 1,560 18,107,931
The annexed notes 1 to 50 form an integral part of these consolidated financial statements.
Paki
stan
Nat
iona
l Shi
ppin
g C
orpo
ratio
n
Annual Report 2011 46
PAKISTAN NATIONAL SHIPPING CORPORATION AND ITS SUBSIDIARY COMPANIESCONSOLIDATED STATEMENT OF CHANGES IN EQUITYFOR THE YEAR ENDED JUNE 30, 2011
Vice Admiral (R) Saleem Ahmed Meenai Khowaja Obaid Imran IlyasChairman & Chief Executive Director

Paki
stan
Nat
iona
l Shi
ppin
g C
orpo
ratio
n
Note 2011 2010(Rupees in ‘000)
Cash flows from operating activities
Cash generated from operations 40 2,482,723 5,948,677Employees' gratuity paid (42,453) (31,119)Employees' compensated absences paid (56,438) (39,736)Post retirement medical benefits paid (14,213) (15,278)Long-term loans and advances - net 454 344Finance costs paid (428,873) -Receipt under cross currency interest rate swap 228,904 -Arrangement fee paid (106,662) -Provision against damage claim paid (743) -Taxes paid (500,322) (620,309)Net cash generated from operating activities 1,562,377 5,242,579
Cash flows from investing activities
Fixed capital expenditure (10,966,645) (7,063,977)Investment in investment properties - (1,630)Proceeds from disposal of property, plant and equipment 1,490,857 540,536Interest / mark-up received 196,649 762,155Consideration paid for acquisition of non controlling interest (748) -Dividends received 1,363 842Net cash used in investing activities (9,278,524) (5,762,074)
Cash flows from financing activities
long-term financing obtained - net 8,098,218 -Transaction cost paid for issue of share capital (135,788) -Dividends paid (195,443) (390,752)Net cash generated / (used in) financing activities 7,766,987 (390,752)
Net increase / (decrease) in cash and cash equivalents 50,840 (910,247)Cash and cash equivalents at the beginning of the year 2,521,857 3,432,104
Cash and cash equivalents at the end of the year 41 2,572,697 2,521,857
The annexed notes 1 to 50 form an integral part of these consolidated financial statements.
Annual Report 2011 47
PAKISTAN NATIONAL SHIPPING CORPORATION AND ITS SUBSIDIARY COMPANIESCONSOLIDATED CASH FLOW STATEMENT FOR THE YEAR ENDED JUNE 30, 2011
Vice Admiral (R) Saleem Ahmed Meenai Khowaja Obaid Imran IlyasChairman & Chief Executive Director

1. THE GROUP AND ITS OPERATIONS
Pakistan National Shipping Corporation (the holding company), its subsidiarycompanies and an associate (together 'the Group') were incorporated under theprovisions of the Pakistan National Shipping Ordinance, 1979 and the CompaniesOrdinance, 1984 respectively. The Group is principally engaged in the business ofshipping, including charter of vessels, transportation of cargo and other relatedservices. The Group is also engaged in renting out its properties to tenants underlong term lease agreements. The Group's registered office is situated in PNSCBuilding, Moulvi Tamizuddin Khan Road, Karachi except for Pakistan Co-operativeShip Stores (Private) Limited which is situated at 70/4, Timber Pond, N.M ReclamationKemari, Karachi.
The Group consists of:
Holding companyPakistan National Shipping Corporation
Subsidiary companies- Bolan Shipping (Private) Limited- Chitral Shipping (Private) Limited- Hyderabad Shipping (Private) Limited- Islamabad Shipping (Private) Limited- Johar Shipping (Private) Limited- Kaghan Shipping (Private) Limited- Karachi Shipping (Private) Limited- Khairpur Shipping (Private) Limited- Lahore Shipping (Private) Limited - Lalazar Shipping (Private) Limited- Makran Shipping (Private) Limited- Malakand Shipping (Private) Limited- Multan Shipping (Private) Limited- Pakistan Co-operative Ship Stores (Private) Limited- Quetta Shipping (Private) Limited- Sargodha Shipping (Private) Limited- Shalamar Shipping (Private) Limited- Sibi Shipping (Private) Limited- Swat Shipping (Private) Limited
Associate - Muhammadi Engineering Works (Private) Limited
The holding company owns 73% (2010: 55%) of the share capital of Pakistan Co-operative Ship Stores (Private) Limited and 100% (2010: 100%) percent of the sharecapital of the remaining eighteen subsidiary companies. All the fully ownedsubsidiaries of the Group operate one vessel / tanker each with the exception ofBolan Shipping (Private) Limited, Swat Shipping (Private) Limited, Lalazar Shipping(Private) Limited, Johar Shipping (Private) Limited, Shalamar Shipping (Private)Limited, Khairpur Shipping (Private) Limited and Makran Shipping (Private) Limitedwhich currently do not own any vessel / tanker.
Paki
stan
Nat
iona
l Shi
ppin
g C
orpo
ratio
n
Annual Report 2011 48
PAKISTAN NATIONAL SHIPPING CORPORATION AND ITS SUBSIDIARY COMPANIESNOTES TO AND FORMING PART OF THE CONSOLIDATED FINANCIAL STATEMENTSFOR THE YEAR ENDED JUNE 30, 2011
Paki
stan
Nat
iona
l Shi
ppin
g C
orpo
ratio
n
2. SUMMARY OF SIGNIFICANT ACCOUNTING POLICIES
The significant accounting policies adopted in the preparation of theseconsolidated financial statements have been consistently applied to all yearspresented, unless otherwise stated, as set out below.
2.1 Statement of compliance
These consolidated financial statements have been prepared in accordance withthe requirements of the Companies Ordinance, 1984 (the Ordinance) and theapproved accounting standards as applicable in Pakistan. Approved accountingstandards comprise of such International Financial Reporting Standards (IFRSs) issuedby the International Accounting Standards Board as are notified under theOrdinance and the requirements of and directives issued under that Ordinance.However, the requirements of and the directives issued under that Ordinance havebeen followed where those requirements are not consistent with the requirements ofthe IFRSs, as notified under the Ordinance.
2.1.1 Standards, amendments to published approved accounting standards andinterpretations effective for the year ended June 30, 2011:
The following standards, interpretations and amendments to existing standards havebeen published that are mandatory and relevant for the Group's accounting periodbeginning on July 1, 2010.
On August 14, 2009, the Government of Pakistan (GoP) launched Benazir Employees'Stock Option Scheme (the "Schemes") for employees of certain State OwnedEnterprises (SOEs) and non-State Owned Enterprises where GoP holds significantinvestments (non-SOEs). The scheme is applicable to permanent and contractualemployees who were in employment of these entities on the date of launch of theScheme, subject to completion of five years vesting period by all contractualemployees and by permanent employees in certain instances.
The Scheme provides for a cash payment to employees on retirement or terminationbased on the price of shares of respective entities. To administer this scheme, GoPshall transfer 12% of its investment in such SOEs and non-SOEs to a trust fund to becreated for the purpose of such entities. The eligible employees would be allottedunits by each Trust Fund in proportion to their respective length of service and onretirement or termination of such employees would be entitled to receive suchamounts from Trust Funds in exchange for the surrendered units as would bedetermined based on market price of listed entities or breakup value of non-listedentities. The shares related to the surrendered units would be transferred back toGoP.
The scheme also provides that 50% of dividend related to shares transferred to therespective Trust Fund would be distributed amongst the unit-holder employees. Thebalance 50% dividend would be transferred by the respective Trust Fund to theCentral Revolving Fund managed by the Privatisation Commission of Pakistan forpayment to employees against surrendered units. The deficits, if any, in Trust Fundsto meet the re-purchase commitment would be met by GoP.
The Scheme, developed in compliance with the stated GoP policy of theempowerment of employees of State Owned Enterprises need to be accounted forby the covered entities, including the holding company, under the provisions ofamended International Financial Reporting Standard-2 'Share Based Payments' (IFRS2). However, keeping in view the difficulties that may be faced by the entitiescovered under the Scheme, the Securities & Exchange Commission of Pakistan onreceiving the representation from some of the entities covered under the Scheme
Annual Report 2011 49

and after having consulted the Institute of Chartered Accountants of Pakistan, hasgranted exemption vide SRO 587(I)/2011 dated June 7, 2011 to such entities fromapplication of IFRS 2 to the Scheme.
Had the exemption not been granted, the impact based on the independentactuarial valuations conducted as on June 30, 2011, for the years ended June 30,2010 and 2011 would have been as follows:
Year ended Year endedJune 30, June 30,
2011 2010 (Rupees in ‘000)
Staff costs of the Group for the year would have been higher by 167,338 177,446
Profit after taxation would have been lower by 167,338 177,446
(Rupees) Earnings per share would have been lower by 1.27 1.34
Year ended Year endedJune 30, June 30,
2011 2010 (Rupees in ‘000)
Retained earnings would have been lower by 167,338 177,446Reserves would have been higher by 167,338 177,446
Standards, amendments to published approved accounting standards andinterpretations becoming effective in the year ended June 30, 2011 but not relevant:
There are certain new approved accounting standards, amendments to approvedaccounting standards and interpretations that are mandatory for accountingperiods beginning on July 1, 2010 but are considered not to be relevant or to haveany significant effect on the Group's operations and are, therefore not disclosed inthese consolidated financial statements.
Standards, amendments to published approved accounting standards andinterpretations as adopted in Pakistan, that are not yet effective:
The following standards, amendments and interpretations to existing standards havebeen published and are mandatory for the Group's accounting periods beginningon or after July 1, 2011:
There are certain amendments to the approved accounting standards andinterpretations that are mandatory for accounting periods beginning on or after July1, 2011 but are considered not to be relevant or do not have any significant effectto the Group's operations and are therefore not mentioned in these consolidatedfinancial statements.
2.2 Basis of preparation
These consolidated financial statements have been prepared under the historicalcost convention except as follows:
- Certain property, plant and equipment as referred to in note 2.4.1 have beenincluded at revalued amounts; and
Paki
stan
Nat
iona
l Shi
ppin
g C
orpo
ratio
n
Annual Report 2011 50

Paki
stan
Nat
iona
l Shi
ppin
g C
orpo
ratio
n
- Certain investment properties and financial instruments as referred to in notes 2.6and 2.7.1 respectively have been carried at fair value to comply with therequirements of IAS-40 'Investment Property' and IAS-39 'Financial Instruments:Recognition and Measurement' respectively.
- Accounting for staff benefits as referred to in notes 2.15 and 2.16 respectively.
2.3 Basis of consolidation
2.3.1 Subsidiaries
These consolidated financial statements comprise the financial statements of theholding company and all of its subsidiary companies as at June 30 each year.
The financial statements of the subsidiary companies have been consolidated on aline-by-line basis and the carrying values of the investments held by the holdingcompany have been eliminated against the shareholders' equity in the subsidiarycompanies.
The financial statements of the subsidiaries are prepared for the same reporting yearas the parent company, using consistent accounting policies.
All intra-group balances, transactions, income and expenses and profits and lossesresulting from intra-group transactions are eliminated in full.
Subsidiaries are fully consolidated from the date of acquisition, being the date onwhich the Group obtains control, and continue to be consolidated until the datethat such control ceases.
The purchase method of accounting is used to account for the acquisition ofsubsidiaries by the Group. The cost of an acquisition is measured as the fair value ofthe assets given, equity instruments issued and liabilities incurred or assumed at thedate of exchange, plus costs directly attributable to the acquisition. Identifiableassets acquired and liabilities and contingent liabilities assumed in a businesscombination are measured initially at their fair values at the acquisition date,irrespective of the extent of any non-controlling interest. The excess of the cost ofacquisition over the fair value of the Group’s share of the identifiable net assetsacquired is recorded as goodwill.
Transactions with non controlling interests
Consistent with prior years, the Group treats transactions with non controlling interestas transactions with equity owners of the Group. For purchase of interest from noncontrolling interests, the difference between any consideration paid and relevantshare aquired of the carying value of net assets of the subsidiary is recorded inequity. Gains or losses on disposals to non-controlling interests are also recorded inequity.
When the group ceases to have control or significant influence, any retained interestin the equity is remeasured to its fair value, with the change in carrying amountrecognised in the income statement. The fair value is the initial carrying amount forthe purposes of subsequent accounting for the retained interest as an associate,joint venture or financial assets. In addition, any amount previously recognised inother comprehensive income in respect to that entity are accounted for as if theGroup had directly disposed of the related assets and liability.
Annual Report 2011 51

2.3.2 Associates
Associates are all entities over which the Group has significant influence but nocontrol. Investments in associate is accounted for using the equity method ofaccounting and are initially recognised at cost.
2.4 Fixed assets
2.4.1 Property, plant and equipment
Property, plant and equipment are stated at cost less accumulated depreciationexcept for leasehold land and buildings thereon, beach huts, workshop machineryand equipment and vessels which are stated at revalued amounts less anysubsequent accumulated depreciation and subsequent accumulated impairmentlosses. The revaluation of related assets is carried out with sufficient regularity toensure that the carrying amounts do not differ materially from those which wouldhave been determined using fair values at the balance sheet date.
The value assigned to leasehold land is not depreciated as the leases are expectedto be renewed for further periods on payment of relevant rentals. Annual leaserentals are charged to income and premium paid at the time of renewal, if any, isamortised over the remaining period of the lease.
Cost in relation to vessels includes cost of acquisition and other related expensesincidental to the purchase of vessel accumulated to the date the vessels arecommissioned into service. It also includes cost of spares capitalised during the year.
It is the practice of subsidiary companies to carry out continuous surveys and repairson the round-the-year basis to maintain seaworthiness of the vessels. The subsidiarycompanies are required to carry out repairs and maintenance of the vessels at thedry docks according to the specifications of the Lloyd's Register, London orAmerican Bureau of shipping, U.S.A. These dry docking and class renewal expensesare capitalised as and when incurred and amortised over a period of thirty to sixtymonths respectively.
Depreciation is charged to income applying the straight line method whereby thedepreciable amount of an asset is depreciated over its estimated useful life.
Depreciation on additions is charged from the month in which the asset is availablefor use and continued to be depreciated until it is derecognised, that is, upto themonth of disposal even if during that period the asset is in idle condition. An item ofproperty, plant and equipment is derecognised upon disposal or when no futureeconomic benefits are expected from its use.
No depreciation is charged if the asset's residual value exceeds its carrying amount.
Residual values, useful lives and methods of depreciation are reviewed at eachbalance sheet date and adjusted if expectations differ significantly from previousestimates.
Useful lives are determined by the management based on expected usage of theasset, expected physical wear and tear, technical and commercial obsolescence,legal and similar limits on the use of the assets and other similar factors.
A revaluation deficit is recognised in profit or loss, except that a deficit directlyoffsetting a previous surplus on any asset, in which case the deficit is taken to surpluson revaluation of fixed assets account. Surplus on revaluation cannot be distributedto shareholders until it is transferred to retained earnings. An annual transfer from the
Paki
stan
Nat
iona
l Shi
ppin
g C
orpo
ratio
n
Annual Report 2011 52

Paki
stan
Nat
iona
l Shi
ppin
g C
orpo
ratio
n
surplus on revaluation of fixed assets account to retained earnings is made for thedifference between depreciation based on the revalued carrying amount of theassets and the depreciation based on the assets' original cost. Additionally,accumulated depreciation as at the revaluation date is eliminated against the grosscarrying amount of the assets and the net amount is restated to the revaluedamount of the assets. Upon disposal, any revaluation reserve relating to theparticular assets being sold is transferred to retained earnings.
The surplus held on revaluation of fixed assets can be applied by the Group in settingoff or in diminution of any deficit arising from the revaluation of any other fixed assetsof the Group.
Other major renewals, replacements and improvements that meet the recognitioncriteria in IAS 16 are capitalised and the assets so replaced, if any, are retired. Normalrepairs and maintenance are charged to income as and when incurred. Gains andlosses on disposals of the assets are included in income currently.
2.4.2 Capital work-in-progress
These are stated at cost less accumlated impairment losses, if any. All expenditureconnected with specific assets incurred during installation and construction periodare carried uder this head. These are transferred to specific assets as and when theseassets are available for use.
2.4.3 Intangible assets
An intangible asset is an identifiable non-monetory asset without physical substance.Intangible assets are stated at cost less accumulated amortisation and impairmentlosses, if any. Cost in relation to intangible assets presently held by the Group includescost of computer software and other expenses incidental to the purchase ofcomputer software.
Costs associated with maintaining computer software are recognised as an expenseas and when incurred.
Intangible assets are amortised from the month when these assets are available foruse using the straight line method whereby the cost of intangible asset is amortisedover the period which takes into account the economic benefits that will beavailable to the Group.
2.5 Impairment of assets
The carrying amounts of the Group's assets are reviewed at each balance sheetdate to determine whether there is any indication of impairment loss. If any suchindication exists, the asset's recoverable amount is estimated in order to determinethe extent of impairment loss, if any. An impairment loss is recognised for the amountby which the asset's carrying amount exceeds its recoverable amount. Therecoverable amount is the higher of an asset's fair value less cost to sell and value inuse. Impairment losses are charged to profit and loss account except for impairmentloss on revalued assets, which is recognised directly against any revaluation surplusfor the asset to the extent that the impairment loss does not exceed the amountheld in the revaluation surplus for any other asset.
2.6 Investment properties
Properties held for long-term rental yields which are significantly rented out by theGroup are classified as investment properties.
Annual Report 2011 53

Investment properties are carried at fair value which is based on active marketprices, adjusted, if necessary, for any difference in the nature, location or conditionof the specific asset. The valuation of these properties is carried out with sufficientregularity.
Gains and losses arising from a change in the fair value of investment properties areincluded in income currently.
2.7 Financial instruments
2.7.1 Financial assets
The Group classifies its financial assets in the following categories: at fair valuethrough profit or loss, loans and receivables, available-for-sale and held to maturity.The classification depends on the purpose for which the financial assets wereacquired. Management determines the classification of its financial assets at thetime of initial recognition.
a) Financial assets at fair value through profit or loss
Financial assets at fair value through profit or loss are financial assets held for tradingand financial assets designated upon initial recognition as at fair value through profitand loss. A financial asset is classified as held for trading if acquired principally for thepurpose of selling in the short term (Note 43).
b) Loans and receivables
Loans and receivables are non-derivative financial assets with fixed or determinablepayments that are not quoted in an active market. Various financial assets classifiedunder this category are disclosed in Note 43.
c) Available-for-sale financial assets
Available-for-sale financial assets are non-derivatives that are either designated inthis category or not classified in any of the other categories (Note 43).
d) Held to maturity
Financial assets with fixed or determinable payments and fixed maturity, wheremanagement has the intention and ability to hold till maturity and are carried atamortised cost (Note 43).
All financial assets are recognised at the time when the Group becomes a party tothe contractual provisions of the instrument. Regular purchases and sales ofinvestments are recognised at trade-date i.e., the date on which the Group commitsto purchase or sell the asset.
Financial assets are initially recognised at fair value plus transaction costs for allfinancial assets not carried at fair value through profit and loss. Financial assetscarried at fair value through profit and loss are initially recognised at fair value andtransaction costs are expensed in the profit and loss account.
The fair values of quoted investments are based on current prices. If the market fora financial asset is not active (and for unlisted securities), the Group measures theinvestments at cost less impairment in value, if any.
Available-for-sale financial assets and financial assets at fair value through profit andloss are subsequently carried at fair value. Loans and receivables and held to
Paki
stan
Nat
iona
l Shi
ppin
g C
orpo
ratio
n
Annual Report 2011 54

Paki
stan
Nat
iona
l Shi
ppin
g C
orpo
ratio
n
maturity investments are carried at amortised cost using effective interest ratemethod.
Financial assets are derecognised when the rights to receive cash flows from theassets have expired or have been transferred and the Group has transferredsubstantially all risks and rewards of ownership.
2.7.2 Impairment
The Group assesses at each balance sheet date whether there is objectiveevidence that a financial asset or group of financial assets is impaired.
2.7.3 Financial liabilities
All financial liabilities are recognised at the time when the Group becomes a partyto the contractual provisions of the instrument.
A financial liability is derecognised when the obligation under the liability isdischarged or cancelled or expired. Where an existing financial liability is replacedby another from the same lender on substantially different terms, or the terms of anexisting liability are substantially modified, such an exchange and modification istreated as a derecognition of the original liability and the recognition of a newliability, and the difference in respective carrying amounts is recognised in the profitand loss account.
2.7.4 Derivative financial instruments
The Group uses derivative financial instruments such as interest rate and crosscurrency swaps to manage its risks associated with interest and exchange ratefluctuations. Such derivative financial instruments are initially recognised at fair valueon the date on which a derivative contract is entered into and are subsequently re-measured at fair value. Derivatives with positive market values (unrealised gains) areincluded in other asset and derivatives with negative market values (unrealisedlosses) are included in trade and other payables in the balance sheet. Any gains orlosses arising from changes in fair value of derivatives that do not qualify for hedgeaccounting are taken directly to the profit and loss account.
2.7.5 Interest - bearing loans and borrowings
Interest bearing loans and borrowings (borrowings) are recognised initially at fairvalue, net of transaction cost incurred. Borrowings are subsequently carried atamortised cost; any difference between the proceeds (net of transaction costs) andthe redemption value is recognised in the income statement over the period of theborrowings using the effective interest rate method.
Fees paid on the establishment of loan facilities (arrangement fees) are recognisedas transaction costs of the loan to the extent that it is probable that some or all ofthe facility will be drawn down in this case the fee is deferred until the draw downoccurs.
2.7.6 Off-setting of financial assets and financial liabilities
A financial asset and a financial liability is offset and the net amount is reported inthe consolidated financial statements if the Group has a legally enforceable right toset-off the transaction and also intends either to settle on a net basis or to realise theasset and settle the liability simultaneously.
Annual Report 2011 55

2.8 Stores and spares
Stores are valued at weighted average cost while spares are valued at costdetermined on first-in first-out basis. Stores and spares in transit are valued at costincurred upto the balance sheet date.
Certain spares having low value and high consumption levels are charged toincome at the time of purchase.
The Group reviews the carrying amount of stores and spares on a regular basis andprovision is made for obsolescence if there is any change in usage pattern andphysical form.
2.9 Trade debts and other receivables
Trade debts and other receivables are carried at invoice value less provision forimpairment. A provision for impairment of trade debts and other receivables isestablished when there is objective evidence that the Group will not be able tocollect all amounts due according to the original terms of the receivable. Significantfinancial difficulties of the debtor, probability that the debtor will enter bankruptcyor financial reorganisation, and default or delinquency in payments are consideredindicators that the trade receivable is impaired. Debts, considered irrecoverable,are written off, as and when identified.
2.10 Taxation
2.10.1 Current
Provision for current taxation is based on taxable income for the year at the currentrates of taxation after taking into account tax credits and tax rebates available, ifany, and tax paid on presumptive basis or minimum tax of turnover, whichever ishigher. Whereas provision for current taxation in respect of subsidiaries operatingvessel is based on Final Tax Regime (FTR) under clause 21 (a) of part II of the SecondSchedule to the Income Tax Ordinance, 2001.
2.10.2 Deferred
Deferred tax is recognised using the balance sheet liability method, on all temporarydifferences arising at the balance sheet date between the tax base of assets andliabilities and their carrying amounts for financial reporting purposes.
Deferred tax liabilities are recognised for all taxable temporary differences. Deferredtax assets are recognised for all deductible temporary differences to the extent thatit is probable that the future taxable profits will be available against which the assetsmay be utilised. Deferred tax assets are reduced to the extent that it is no longerprobable that the related tax benefit will be realised.
The carrying amount of deferred tax asset is reviewed at each balance sheet dateand reduced to the extent that it is no longer probable that sufficient taxable profitswill be available to allow all or part of the deferred tax asset to be recognised.Unrecognised deferred tax assets are reassessed at each balance sheet date andare recognised to the extent that it has become probable that future taxable profitwill allow deferred tax asset to be recovered.
Deferred tax assets and liabilities are measured at the tax rates that are expectedto apply to the period when the asset is realised or the liability is settled, based onthe tax rates (and tax laws) that have been enacted or substantively enacted at thebalance sheet date.
Paki
stan
Nat
iona
l Shi
ppin
g C
orpo
ratio
n
Annual Report 2011 56
Paki
stan
Nat
iona
l Shi
ppin
g C
orpo
ratio
n
2.11 Insurance claims
Consistent with prior years, hull claims and other claimable expenses relating to hullare charged to income currently and claims filed there against are taken to incomewhen such claims are accepted by the underwriters.
Afloat medical expenses, cargo claims and other relevant amounts recoverablefrom underwriters are taken to insurance claims receivable.
2.12 Trade and other payables
Liabilities for trade and other amounts payable are carried at cost which is the fairvalue of the consideration to be paid in future for goods and services whether billedor not.
2.13 Provisions
Provisions are recognised when the Group has a present legal or constructiveobligation as a result of past events, it is probable that an outflow of resourcesembodying economic benefits will be required to settle the obligation and a reliableestimate of the obligation can be made. Provisions are reviewed at each balancesheet date and adjusted to reflect the current best estimate.
2.14 Dividend and other appropriations
Dividends declared and transfers between reserves made subsequent to thebalance sheet date are considered as non-adjusting events and are recognised inthe consolidated financial statements in the period in which such dividends aredeclared / transfers are made.
2.15 Staff retirement benefits
2.15.1 The Group operates a contributory provident fund for permanent employees, forwhich contributions are charged to income for the year.
2.15.2 Defined benefit gratuity scheme
The Group operates a funded retirement gratuity scheme for its permanentemployees other than those who joined the Group after October 16, 1984. Further,the Group also operates an unfunded retirement gratuity scheme for contractualemployees. Annual provisions to cover the obligations under the scheme are basedon actuarial estimates and are charged to income currently. Actuarial valuationsare carried out using the Projected Unit Credit Method.
The Group's crew members are also entitled to gratuity in accordance with thePakistan Maritime Board Regulations. However, these employee benefits arerecognised upon payment as the amounts involved are not material.
The unrecognised actuarial gains or losses arising at each valuation date arerecognised as income or expense in the following year.
The benefit is payable on completion of prescribed qualifying period of serviceunder these schemes.
2.15.3 Post-retirement medical benefits
The Group provides lump sum medical allowance to its retired permanentemployees in accordance with the service regulations.
Annual Report 2011 57

The unrecognised actuarial gains or losses arising at each valuation date are recognisedas income or expense in the following year.
The benefit is payable on completion of prescribed qualifying period of service underthese schemes.
2.16 Employees' compensated absences
The Group accounts for the liability in respect of employees' compensated absences inthe year in which these are earned. Annual provisions to cover the obligations under thescheme are based on actuarial estimates and are charged to income currently. Theunrecognised actuarial gains or losses at each valuation date are recognisedimmediately.
2.17 Cash and cash equivalents
Cash and cash equivalents are carried in the balance sheet at cost. Cash and cashequivalents include cash in hand, cheques in hand, deposits held with banks and othershort term highly liquid investments with maturities of three months or less.
2.18 Foreign currency translation
These consolidated financial statements are presented in Pakistan Rupees (functionaland presentation currency). Transactions in foreign currencies are recorded in PakistanRupees at the exchange rates approximating those prevailing on the date oftransaction. Monetary assets and liabilities in foreign currencies are reported in PakistanRupees at the exchange rates approximating those prevalent at the balance sheetdate. Non-monetary items that are measured in terms of historical cost in a foreigncurrency are translated using the exchange rates as at the dates of the initialtransactions. Non-monetary items measured at fair value in foreign currencies aretranslated using the exchange rates at the date when the fair value was determined.
2.19 Revenue recognition
- Consistent with prior years, earnings in respect of voyages other than time chartervoyages are accounted for on the basis of completed voyages. Voyages are takenas complete when a vessel arrives at the last port of discharge on or before thebalance sheet date. Freight revenue, direct and indirect operating expensesassociated with the incomplete voyages are deferred until completion of voyageand are classified in the balance sheet as 'Incomplete voyages'. With respect to timecharter voyages, chartering revenue is accounted for on the basis of number of daysto the balance sheet date.
- Rental income is recognised as revenue on a straight line basis over the term of therespective lease arrangements.
- Dividend income is recognised when the Group's right to receive the dividend isestablished.
- Profit from bank accounts and return on investments is recognised on a timeproportion basis.
2.20 Borrowing costs
Consistent with prior years, borrowing costs that are directly attributable to theacquisition and construction of assets and incurred during the period in connection withthe activities necessary to prepare the asset for its intended use are capitalised as apart of the cost of related asset.
Paki
stan
Nat
iona
l Shi
ppin
g C
orpo
ratio
n
Annual Report 2011 58

Paki
stan
Nat
iona
l Shi
ppin
g C
orpo
ratio
n
All other borrowing costs are recognised as an expense in the period in which theyare incurred.
2.21 Contingent liabilities
A contingent liability is disclosed when:
- there is a possible obligation that arises from past events and whose existence willbe confirmed only by the occurrence or non occurrence of one or more uncertainfuture events not wholly within the control of the Group; or
- there is present obligation that arises from past events but it is not probable thatan outflow of resources embodying economic benefits will be required to settlethe obligation or the amount of the obligation cannot be measured with sufficientreliability.
3. CRITICAL ACCOUNTING ESTIMATES, JUDGEMENTS AND ASSUMPTIONS
The preparation of the Group's consolidated financial statements requiresmanagement to make judgments, estimates and assumptions that affect thereported amounts of revenues, expenses, assets and liabilities, and the disclosure ofcontingent liabilities, at the end of the reporting period. However, uncertainty aboutthese assumptions and estimates could result in outcomes that require a materialadjustment to the carrying amount of the asset or liability affected in future periods.
In the process of applying the accounting policies, management has made thefollowing estimates and judgements which are significant to the consolidatedfinancial statements.
(a) Valuation of property, plant and equipment and investment properties (note 4and 6).
(b) Determining the residual values and useful lives of property, plant andequipment (note 4).
(c) Recognition of deferred tax and taxation (note 10 and 38).
(d) Determining the provision for slow moving stores and spares (note 11).
(e) Accounting for provision for impairment of trade debts (note 12).
(f) Accounting for provision against damage claims (note 28).
(g) Accounting for defined benefit plans (note 26).
(h) Measuring fair value of cross currency swap (note 16); and
(i) Measuring the value of contingent assets and liabilities (note 29).
Estimates and judgements are continually evaluated and are based on historicalexperience and other factors, including expectation of future events that arebelieved to be reasonable under the circumstances.
Note 2011 2010(Rupees in ‘000)
4. PROPERTY, PLANT AND EQUIPMENT
- Operating fixed assets 4.1 23,714,500 14,041,845- Capital work-in-progress 4.9 260,814 668,762
23,975,314 14,710,607
Annual Report 2011 59

Paki
stan
Nat
iona
l Shi
ppin
g C
orpo
ratio
n4.1 The following is a statement of operating fixed assets:
Annual Report 2011 60
Cost or
revaluation
Dry docking
and class
renewal
Total
As at June 30, 2009
Cost or revalued amount 607,325 177,748 6,932,302 2,332,161 9,264,463 65,114 12,011 11,611 7 18 39,828 3,468 13,152 14,391 11,815 10,220,951
Less: accumulated
depreciation
- 41,122 884,784 1,284,878 2,169,662 39,814 5,319 4,408 7 18 24,823 3,468 - 8,443 6,942 2,304,026
Net book value 607,325 136,626 6,047,518 1,047,283 7,094,801 25,300 6,692 7,203 - - 15,005 - 13,152 5,948 4,873 7,916,925
Year ended June 30, 2010
Opening net book value 607,325 136,626 6,047,518 1,047,283 7,094,801 25,300 6,692 7,203 - - 15,005 - 13,152 5,948 4,873 7,916,925
Additions including transfers
from CWIP - 2,243 6,640,803 92,307 6,733,110 - 1,832 709 - - 2,175 - - 111 2,634 6,742,814
Beach
huts
--------------------------------------------------------------------------------------------------------------------------------------Rupees in ‘000-----------------------------------------------------------------------------------------------------
Computer
equipment
Furniture
and
fixtures
Motor
launch
and jetty
TotalContainer
fittings
Workshop
machinery
and
equipment
Leasehold
land
Equipment
on board
Buildings
on
leasehold
land
Office
machines
and
appliances
VehiclesVessel fleet Electrical
fittings
Surplus / (deficit) on revaluation - - 912,629 - 912,629 - - - - - - - - - - 912,629
Revaluation adjustment
Cost - - (228,572) - (228,572) - - - - - - - - - - (228,572)
Accumulated depreciation - - 228,572 - 228,572 - - - - - - - - - - 228,572
- - - - - - - - - - - - - - -
Disposals
Cost - (3,213) (462,536) (485,430) (947,966) - - - - - (12,016) - - - - (963,195)
Accumulated depreciation - 362 44,260 381,366 425,626 - - - - - 10,084 - - - - 436,072
- (2,851) (418,276) (104,064) (522,340) - - - - - (1,932) - - - - (527,123)
Write off
Cost or revalued amount - - - - - - - - - - (1,035) - - (1) - (1,036)
Accumulated depreciation - - - - - - - - - - 776 - - 1 - 777
- - - - - - - - - - (259) - - - - (259)
Depreciation charge for the
year
- (21,527) (349,162) (610,805) (959,967) (8,754) (1,585) (1,274) - - (4,613) - (1,315) (592) (3,514) (1,003,141)
Closing net book value 607,325 114,491 12,833,512 424,721 13,258,233 16,546 6,939 6,638 - - 10,376 - 11,837 5,467 3,993 14,041,845
As at June 30, 2010
Cost or revalued amount 607,325 176,778 13,794,626 1,939,038 15,733,664 65,114 13,843 12,320 7 18 28,952 3,468 13,152 14,501 14,449 16,683,591
Less: Accumulated
depreciation
- 62,287 961,114 1,514,317 2,475,431 48,568 6,904 5,682 7 18 18,576 3,468 1,315 9,034 10,456 2,641,746
Net book value 607,325 114,491 12,833,512 424,721 13,258,233 16,546 6,939 6,638 - - 10,376 - 11,837 5,467 3,993 14,041,845

Paki
stan
Nat
iona
l Shi
ppin
g C
orpo
ratio
n
4.2 The latest revaluation of Group's vessels (held in the books of the subsidiary companies)was carried out as of June 30, 2011 by Optima Ship Brokers (2010: June 30, 2010 by OptimaShip Brokers) on the basis of their professional assessment of present market values and onthe basis of independent surveying reports submitted by Lloyd's Register Group, surveyorand consultants. The latest revaluation resulted in a surplus of Rs 697.429 million (2010:Surplus of Rs 912.629 million) on the written down values of Rs 10,913.533 million (2010: Rs5,280.080 million) which has been incorporated in the books of the Group as at June 30,2011. During the year the Group has purchased four vessels (M.T. Sibi, M.T Hyderabad,M.T. Chitral and M.T. Malakand) having useful lives of 30 years each. No revaluation ofthese vessels have been carried out as of June 30, 2011 as the management believesthat since the vessels have been acquired close to the year end there is no significantchange in their fair values.
Annual Report 2011 61
Cost or
revaluation
Dry docking
and class
renewal
Total
Year ended June 30, 2011
Opening net book value 607,325 114,491 12,833,512 424,721 13,258,233 16,546 6,939 6,638 - - 10,376 - 11,837 5,467 3,993 14,041,845
Additions including transfers
from CWIP - 442,275 10,732,656 119,912 10,852,568 - 31,753 19,284 - - 10,289 - - 248 18,176 11,374,593
Surplus / (deficit) on
revaluation
- - 697,429 - 697,429 - - - - - - - - - - 697,429
Disposals
Cost - (609) (1,300,434) (931,578) (2,232,012) (495) - - - - (17,000) - - - - (2,250,116)
Accumulated depreciation - 162 67,467 889,669 957,136 495 - - - - 11,059 - - - - 968,852
- (447) (1,232,967) (41,909) (1,274,876) - - - - - (5,941) - - - - (1,281,264)
Revaluation adjustments
Cost (572 259) (572 259) (572 259)
Furniture
and
fixtures
Motor
launch
and jetty
Buildings
on
leasehold
land
Equipment
on board
Leasehold
land
Vessel fleet Container
fittings
Vehicles TotalBeach
huts
Workshop
machinery
and
equipment
Computer
equipment
--------------------------------------------------------------------------------------------------------------------------------------Rupees in ‘000-----------------------------------------------------------------------------------------------------
Electrical
fittings
Office
machines
and
appliances
Cost - - (572,259) - (572,259) - - - - - - - - - - (572,259)
Accumulated depreciation - - 572,259 - 572,259 - - - - - - - - - - 572,259
- - - - - - - - - - - - - - - -
Write off
Cost or revalued amount - (94,464) (7,802) (55,384) (63,186) - - - - - - - - - - (157,650)
Accumulated depreciation - 53,673 7,802 55,384 63,186 - - - - - - - - - - 116,859
- (40,791) - - - - - - - - - - - - - (40,791)
Other adjustments
Cost - - (372) (5,732) (6,104) - - - - - - - - - - (6,104)
Accumulated depreciation - - - - - - - - - - - - - - - -
- - (372) (5,732) (6,104) - - - - - - - - - - (6,104)
Depreciation charge for the
year
- (70,461) (686,640) (290,174) (976,814) (7,686) (3,254) (3,535) - - (3,348) - (1,974) (467) (3,669) (1,071,208)
Closing net book value 607,325 445,067 22,343,618 206,818 22,550,436 8,860 35,438 22,387 - - 11,376 - 9,863 5,248 18,500 23,714,500
As at June 30, 2011
Cost or revalued amount 607,325 523,980 23,343,844 1,066,256 24,410,100 64,619 45,596 31,604 7 18 22,241 3,468 13,152 14,749 32,625 25,769,484
Less: Accumulated
depreciation
- 78,913 1,000,226 859,438 1,859,664 55,759 10,158 9,217 7 18 10,865 3,468 3,289 9,501 14,125 2,054,984
Net book value 607,325 445,067 22,343,618 206,818 22,550,436 8,860 35,438 22,387 - - 11,376 - 9,863 5,248 18,500 23,714,500
Annual rate of depreciation - 3 to 20 see note 4.5 20 to 40 - 20 15 10 to 15 - 10 to 15 10 to 15 15 10 5 to 10 25

4.3 The revaluation of the 'leasehold land', 'buildings on leasehold land', 'beach huts' and'workshop machinery and equipment' were carried out as of June 30, 2009 by Pee Dee& Associates on the basis of their professional assessment of present market values. Therevaluation resulted in a deficit of Rs 48.315 million on the written down values of Rs803.607 million which had been incorporated in the books of the Group as at June 30,2009. Of the total revaluation surplus arisen, Rs 679.352 million (2010: Rs 692.352 million)remains undepreciated at June 30, 2011. However, the deficit on revaluation ofbuildings arisen during the year 2009 did not include the revaluation effect of PNSCbuilding as it was in rehabilitation stage and renovation was being carried out.
4.4 Had there been no revaluation, the carrying amount of revalued assets would havebeen as follows:
2011 2010(Rupees in ‘000)
Leasehold land and buildings on leasehold land and beach huts 383,360 36,412
Vessel Fleet 10,004,762 5,671,439Workshop machinery and equipment 4,331 4,730
10,392,453 5,712,581
4.5 During the year, the management of the Group has revised the estimated useful livesof its liquid cargo vessel. Previously, the depreciable amount of vessels was allocatedover a useful life of 25 years. In accordance with the new estimate the managementexpects the vessels to remain operational till 30 years. Had the estimate not beenrevised the depreciation charge for the year would have been higher by Rs 64.417million.
4.6 Cost and accumulated depreciation of vessel amounting to Rs 1.440 million relates toM.V Ilyas Bux. This vessel was seized by the Indian authorities during the 1965 war andthe Group does not have physical possession or control over the vessel.
4.7 The following operating fixed assets with a net book value exceeding Rs 50,000 weredisposed of during the year:
Particulars Mode of Cost or Accumulated Net Sale Gain Particulars ofdisposal revalu- depreciation book proceeds purchaser
ation value---------------------- Rupees in ‘000 -------------------------
Vessels
MV Bolan Tender 321,692 149,761 171,931 210,865 38,934 Gravity ShippingLimited, Valetta,
Malta
MV Johar --do-- 931,646 398,210 533,436 629,193 95,757 Exim Incorporated, New Jersey,
United States of America
MV Swat --do-- 995,511 420,060 575,451 603,528 28,077 Gravity ShippingLimited,
Valetta, Malta2,248,849 968,031 1,280,818 1,443,586 162,768
Building on lease hold
Lifts 609 162 447 2,572 2,125 Harmony Traders. 267,Haroon Banglows, Sector 38/A, Karachi
2,249,458 968,193 1,281,265 1,446,158 164,893
Paki
stan
Nat
iona
l Shi
ppin
g C
orpo
ratio
n
Annual Report 2011 62

Paki
stan
Nat
iona
l Shi
ppin
g C
orpo
ratio
n
4.8 The depreciation charge for the year has been allocated as follows:
Note 2011 2010(Rupees in ‘000)
Fleet expenses - direct 31 964,630 939,265Fleet expenses - indirect 32 466 592Real estate expenses 33 43,062 15,263Administrative and general expenses 34 48,217 22,817Incomplete voyages 17 14,833 25,204
1,071,208 1,003,141
4.9 Capital work-in-progress
Buildings on leasehold land 257,703 668,762Vessel fleet 3,111 -
260,814 668,762
5. INTANGIBLE ASSET
This represents cost of Rs. 16.503 million of software "Ship Management Expert System"(SES). SES was being amortised over the useful life of five years and had been fullyamortised during the year ended June 30, 2009, however, it is still in active use.
6. INVESTMENT PROPERTIES
Leasehold Buildings Total land on
leaseholdland
--------- (Rupees in ‘000) ---------
Balance as at July 1, 2009 910,700 58,596 969,296Additions during the year - 1,630 1,630Balance as at June 30, 2010 910,700 60,226 970,926
Balance as at July 1, 2010 910,700 60,226 970,926Surplus on revaluation of investment properties 41,800 (16,088) 25,712Balance as at June 30, 2011 952,500 44,138 996,638
6.1 During the period, revaluation of the holding company's investment properties wascarried out by Pee Dee & Associates as of October 31, 2010 on the basis of theirprofessional assessment of present market values. As a result, a revaluation gain of Rs41.800 million was assessed in respect of leasehold land whereas a revaluation loss wasassessed on buildings on leasehold land amounting to Rs 16.088 million. Themanagement of the holding company believes that the current market values of theinvestment properties approximate their fair values.
Annual Report 2011 63

7. LONG TERM INVESTMENTS IN RELATED PARTY (ASSOCIATE)
Equity Method
No. of ordinary Name of the company Country of share Latest % Face value 2011 2010shares incorporation of net available holding per share
assets audited financial
statements for the year
ended2011 2010 2011 2010
(Rupees in ‘000) (Rs) (Rupees in ‘000)
Associate - unlisted
12,250 12,250 Muhammadi Engineering Works Ltd. Pakistan 1,600 1,600 December 31, 49 100 1,600 1,600
Less: Accumulated impairment losses 1982
(unaudited)
Less: Accumulated impairment losses 1,600 1,600
- -
8. LONG-TERM INVESTMENTS IN LISTED COMPANIES AND AN OTHER ENTITY
Note 2011 2010(Rupees in ‘000)
Financial assets designated as 'at fair value through profit or loss'
Listed companies
6,930 (2010: 6,930) ordinary shares of Rs 10 each fully paid of Siemens (Pakistan) Engineering Company Limited. Market value per share Rs 1,084.21 (2009: Rs 1,039.56 per share)" 7,514 7,204
72,828 (2010: 72,828) ordinary shares of Rs 10 each fully paid of Pakistan State Oil Company Limited. Market value per share Rs 264.58 (2010: Rs 260.20)" 19,269 18,950
26,783 26,154Available for sale financial assets
Other entity - carried at cost
10,000 (2010: 10,000) ordinary shares of Rs 10 each of Pakistan Tourism Development Corporation Limited " 100 100
26,883 26,254
9. LONG-TERM LOANS
Others - due from employeesConsidered good 423 1,003Considered doubtful 224 - Due from employees 9.1 647 1,003Less: Provision for impairment 9.5 224 -
423 1,003Less: Recoverable within twelve months 14 209 335
214 668
Paki
stan
Nat
iona
l Shi
ppin
g C
orpo
ratio
n
Annual Report 2011 64

Paki
stan
Nat
iona
l Shi
ppin
g C
orpo
ratio
n
9.1 It comprises of house building and vehicle loans amounting to Rs 0.566 million (2010: Rs0.817 million) and Rs 0.081 million (2010: Rs 0.186 million) respectively.
9.2 Vehicle loans represent loans to employees for purchase of vehicles and are securedagainst employees' personal guarantees and charge on vehicles. Such loans arerecoverable over 36 or 48 monthly installments on which interest is being charged atthe rate of 11% (2010: 11%) per annum.
9.3 House building loans represent loans to employees for purchase of land, residentialaccommodation and construction and renovation of houses. These loans arerecoverable over 180 monthly installments. An amount of Rs 0.402 million (2010: Rs 0.792million) is secured against mortgages of the employees' properties. Interest on suchloans to officers is charged at various rates while no interest is being charged on loansgiven to other employees.
9.4 Long-term loans are being carried at cost as the effect of carrying these balances atamortised cost would not have been material.
9.5 Provision for impairmentNote 2011 2010
(Rupees in ‘000)
Balance at the beginning of the year - - Provision made during the year 224 -Balance at the end of the year 224 -
10. DEFERRED TAX - NET
Deductible temporary differences arising in respect of:- accelerated depreciation - 1,508- short-term provisions and deferred liabilities 65,211 54,990
65,211 56,498Taxable temporary differences arising in respect of:- surplus on revaluation of fixed assets 24 16,421 20,424- unamortised transaction cost 23,119 -- accelerated depreciation 6,781 -
46,321 20,42418,890 36,074
10.1 The management is confident that sufficient future taxable profits will be availableagainst which deferred tax asset will be adjusted.
2011 2010(Rupees in ‘000)
11. STORES AND SPARES
Stores- at depots 17,074 21,507- at buildings 1,630 266- on board 13,532 16,044
32,236 37,817Spares- at buildings 1,795 1,015- on board 68,957 54,651
70,752 55,666Less: Provision for slow moving and obsolete spares 4,251 6,685
66,501 48,981
Bunker on board 438,511 449,651537,248 536,449
Annual Report 2011 65

Note 2011 2010(Rupees in ‘000)
12. TRADE DEBTS
Unsecured- considered good 654,580 462,272- considered doubtful 183,448 183,418
838,028 645,690Less: Provision for impairment 12.2 183,448 183,418
654,580 462,272
12.1 The ageing analysis of these trade debts that are past due but not impaired is asfollows:
Note 2011 2010(Rupees in ‘000)
Upto 1 month 306,860 340,9121 to 6 months 180,249 72,430More than 6 months 167,471 48,930
654,580 462,272
12.2 Provision for impairment
Balance at the beginning of the year 183,418 81,663Provision made during the year 34 30 101,897Amounts reversed / written off during the year - (142)Balance at the end of the year 183,448 183,418
As at June 30, 2011, trade receivables of Rs 183.448 million (2010: Rs 183.418 million)were impaired and provided for. The ageing of these receivables is as follows:
Note 2011 2010(Rupees in ‘000)
One to three years 39,093 101,897Three years to five years 84,180 26,281Five years and over 60,175 55,240
183,448 183,418
13. AGENTS’ AND OWNERS’ BALANCES - UNSECURED
Considered good 6,443 1,070Considered doubtful 4,453 4,453
10,896 5,523Less: Provision for impairment 13.2 4,453 4,453
6,443 1,070
13.1 The ageing analysis of these agents' and owners' balances that are past due but notimpaired is as follows:
2011 2010(Rupees in ‘000)
Upto 1 month - -1 to 6 months 5,373 1,070More than 6 months 1,070 -
6,443 1,070
Paki
stan
Nat
iona
l Shi
ppin
g C
orpo
ratio
n
Annual Report 2011 66

Paki
stan
Nat
iona
l Shi
ppin
g C
orpo
ratio
n
2011 2010(Rupees in ‘000)
13.2 Provision for impairment
Balance at the beginning of the year 4,453 18,971Provision made during the year - 4,453Amounts adjusted / written off during the year - (18,971)Balance at the end of the year 4,453 4,453
As at June 30, 2011, agents' and owners' balances of Rs 4.453 million (2010: Rs 4.453million) were impaired and provided for. These receivable balances are outstandingfor more than three years.
Note 2011 2010(Rupees in ‘000)
14. LOANS AND ADVANCES
Considered goodLoans due from employees 9 209 335
Advances to:- employees 25,872 17,108- contractors and suppliers 32,737 14,856- others 3,800 6,564
62,618 38,86315. DEPOSITS AND SHORT TERM PREPAYMENTS
Deposits
Trade:- considered good 2,422 2,265- considered doubtful 184 184
2,606 2,449Less: Provision for impairment - trade 184 184
2,422 2,265Others:- considered good 4,253 3,040- considered doubtful 185 185
4,438 3,225Less: Provision for impairment - others 185 185
4,253 3,040PrepaymentsPrepaid transaction cost 25.1 18,502 -Other prepayments 2,902 1,827
21,404 1,82728,079 7,132
16. OTHER RECEIVABLES
Rent receivable- considered good 6,184 4,161- considered doubtfu 4,600 4,359
10,784 8,520 Less: Provision for impairment of rent receivable 16.2 4,600 4,359
6,184 4,161 Derivative cross currency interest rate swap 16.3 87,960 -
Others- considered good 146,238 68,431- considered doubtful 12,659 8,851
158,897 77,282Less: Provision for impairment of other receivable 16.4 12,659 8,851
146,238 68,431240,382 72,592
Annual Report 2011 67

16.1 The ageing analysis of rent receivables past due but not impaired is as follows:
2011 2010(Rupees in ‘000)
Upto 1 month 3,407 1,0851 to 6 months 2,277 1,136More than 6 months 500 1,940
6,184 4,161
16.2 Provision for impairment - Rent receivable
Balance at the beginning of the year 4,359 7,306Provision made during the year 241 33Amounts written off / adjusted during the year - (2,980)Balance at the end of the year 4,600 4,359
As at June 30, 2011, rent receivables of Rs 4.600 million (2010: Rs 4.359 million) wereimpaired and provided for. These receivables are outstanding for more than threeyears.
16.3 The holding company has entered into a cross currency interest rate swap of Rs8,513.300 million for its borrowing (note 25). Under the terms of the cross currency swaparrangement, the holding company is required to pay LIBOR plus 3.75% to thearranging bank on the borrowing denominated in USD (USD notional) for the purposeof cross currency swap, and receive KIBOR plus 2.20% from the arranging bank. Further,the holding company shall pay / receive any exchange loss / gain on the USD notionaloutstanding at each quarter end. The net fair value of this cross currency interest rateswap as determined by the bank was Rs 6.130 million (favourable) to the holdingcompany as of the balance sheet date which has been increased by the net interestreceivable and exchange loss amounting to Rs 81.830 million as at June 30, 2011.
16.4 Provision for impairment of other receivablesNote 2011 2010
(Rupees in ‘000)
Balance at the beginning of the year 8,851 461Provision made during the year 3,808 8,390Balance at the end of the year 12,659 8,851
17. INCOMPLETE VOYAGES
Port, light and canal and custom dues 214 -Salaries and allowances 12,389 14,733Diesel, fuel and lubricants 72,996 88,542 Stores and spares consumed 5,744 3,952Insurance 17,486 22,190Charter hire and related expenses 18,532 25,353 Depreciation 4.8 14,833 25,204 Victualling 1,147 -Other fleet expenses - direct and indirect 191 12,644
143,532 192,618Less: Net freight 50,540 112,002
92,992 80,61618. INSURANCE CLAIMS
- considered good 36,672 46,651 - considered doubtful - -
36,672 46,651Less: Provision for impairment of insurance claims 18.1 - -
36,672 46,651
Paki
stan
Nat
iona
l Shi
ppin
g C
orpo
ratio
n
Annual Report 2011 68

Paki
stan
Nat
iona
l Shi
ppin
g C
orpo
ratio
n
2011 2010(Rupees in ‘000)
18.1 Provision for impairment of insurance claims
Balance at the beginning of the year - 2,492Amounts written off - (2,492)Balance at the end of the year - -
18.2 In addition to these, amounts aggregating Rs 42.3 million (2010: Rs 42.3 million) inresepect of general average claims are receivable from cargo owners and charterers.These amounts are determined on the basis of adjustment book received byindependent adjuster. The group has not recognised the claims as receivable pendingacceptance from the counter parties or underwriter.
Note 2011 2010(Rupees in ‘000)
19. SHORT-TERM INVESTMENTS
Loans and receivablesTerm deposits with banks having maturity of:
- six to twelve months 5,400 -- three to six months - -- three months or less 41 471,900 1,207,224
477,300 1,207,224
19.1 The mark-up on term deposits ranges from 9% to 13.80% (2010: 11.65% to 12.25%) perannum.
20. CASH AND BANK BALANCES Note 2011 2010
(Rupees in ‘000)Cash at bank:- in current accounts
- local currency 528,427 137,260- foreign currency 151,647 396,080
680,074 533,340- in saving accounts 20.1 & 20.2
- local currency 1,246,108 778,467- foreign currency 173,407 1,205
1,419,515 779,672
Cash in hand 1,208 1,62141 2,100,797 1,314,633
20.1 The mark-up on savings accounts ranges from 5% to 11% (2010: 5% to 11.95%) perannum.
20.2 This includes Rs 2.126 million (2010: Rs 4.461 million) held as security by Habib BankLimited, P.N.S.C. Branch against guarantees issued on behalf of the Corporation.
21. SHARE CAPITAL2011 2010(Rupees in ‘000)
21.1 Authorised Capital
2011 2010(No. of shares)
200,000,000 200,000,000 Ordinary shares of Rs 10 each 2,000,000 2,000,000
Annual Report 2011 69

21.2 Issued, subscribed and paid-up share capital
2011 2010 2011 2010(No. of shares) (Rupees in ‘000)
24,130,789 24,130,789 Ordinary shares of Rs 10 each issued as 241,308 241,308fully paid to shareholders of former NSCand PSC in consideration of their shareholdings in those companies
25,900,000 25,900,000 Ordinary shares of Rs 10 each issued as 259,000 259,000fully paid to the Government of Pakistan(GoP) for cash received in 1985
64,309,800 64,309,800 Ordinary shares of Rs 10 each issued as 643,098 643,098fully paid to the GoP on financialrestructuring of the holding company inthe year 1989-90
17,722,791 17,722,791 Ordinary shares of Rs 10 each issued as 177,228 177,228 fully paid bonus shares
132,063,380 132,063,380 1,320,634 1,320,634
21.3 As at June 30, 2011 GoP held 106,139,647 (2010: 103,581,917) ordinary shares of theholding company.
22. RESERVES Note 2011 2010
(Rupees in ‘000)
Capital reserves 22.1 131,344 131,344Revenue reserves (including unappropriated profit) 16,654,393 15,318,084
16,785,737 15,449,428
22.1 This includes amount transferred from shareholders' equity at the time of merger offormer National Shipping Corporation (NSC) and Pakistan Shipping Corporation (PSC).
23. NON-CONTROLLING INTEREST2011 2010
(Rupees in ‘000)Share of non-controlling interest in:- share capital 59 99- general reserve 10 19- unappropriated profit 1,271 1,777- profit for the year 220 340
1,560 2,235
On March 31, 2011, the holding company has further acquired 18% of the share capitalin Pakistan Co-operative Ship Stores (Private) Limited from the non controllingshareholder to increase its shareholding to 73% for a cash consideration of Rs 0.748million.
(Rupees in thousand)
Carrying value of non - controlling interest acquired 997Less: Cash consideration paid to non controlling shareholder 748 Excess of net asset acquired over fair value paid 249
Paki
stan
Nat
iona
l Shi
ppin
g C
orpo
ratio
n
Annual Report 2011 70

Paki
stan
Nat
iona
l Shi
ppin
g C
orpo
ratio
n
24. SURPLUS ON REVALUATION OF FIXED ASSETS - NET OF TAX
Note 2011 2010(Rupees in ‘000)
As at July 1 1,213,622 624,532Surplus arising on revaluation of fixed assets
during the year 697,429 912,6291,911,051 1,537,161
Less: Transferred to unappropriated profit:Surplus relating to incremental depreciation charged
during the year on related assets - net of tax 93,653 29,793Related deferred tax liability 3,058 3,339
96,711 33,132
Less: Surplus realised on disposal of vessels 569,340 290,4071,245,000 1,213,622
Less: Related deferred tax liability on :- Revaluation as at July 1 20,424 25,712- Incremental depreciation charged during the year on
related assets transferred to profit and loss account (3,058) (3,339)- Effect of allocation ratio of revenue under FTR (945) (1,949)
6,421 20,424 As at June 30 1,228,579 1,193,198
Less: Surplus on revaluation of fixed assets attributable to non controlling interest 1,287 2,144
1,227,292 1,191,054
25. LONG TERM FINANCING
Financing under syndicate term finance agreement 25.1 7,009,039 -
Less: Current portion 943,482 -6,065,557 -
Term Finance Certificates 25.1 1,012,416 -Less: Current portion 136,281 -
876,136 -6,941,693 -
25.1 During the year, the holding company has obtained financing facility of Rs 10,300million (June 30, 2010: nil). The financing was obtained in the form of a syndicated termfinance loan of Rs 9,000 million and the remaining amount of Rs 1,300 million in the formof Term Finance Certificates (TFCs) with a face value of Rs 5,000 each by way of privateplacement.
The holding company can draw down the amount till February 1, 2012. The financingcarries mark-up of KIBOR+2.20%. The loan along with the mark-up is repayable onquaterly basis and the last repayment date is November 23, 2018. The facility is securedby a first mortgage charge over certain vessels owned by its subsidiary companies, allpresent and future receivables of the holding company from three major customersand its investment properties.
As at June 30, 2011, the holding company has drawn Rs 7,438.806 million (June 30, 2010:nil) and Rs 1,074.494 million (June 30, 2010: nil) from syndicated term finance and TFCs'respectively. The holding company has also paid loan arrangement fee amounting toRs 106.662 million out of which Rs 88.160 million (June 30, 2010: nil) was included in theamortised cost of the long term financing whereas the unamortised portion amountingto Rs 18.502 million (2010: nil) has been included in deposits and short-termprepayments (note 15).
Annual Report 2011 71

Note 2011 2010(Rupees in ‘000)
26. DEFERRED LIABILITIES
Employees' gratuity- funded 26.1.3 23,579 56,156- unfunded 26.1.3 26,507 15,328
50,086 71,484Post retirement medical benefits 26.1.3 111,009 93,937Employees' compensated absences 26.2.4 159,300 125,867
320,395 291,28826.1 Retirement benefit schemes
26.1.1 As stated in notes 2.15.2 and 2.15.3 of these consolidated financial statements, theGroup operates a funded retirement gratuity scheme for permanent employees otherthan those who joined the holding company after October 16, 1984, an unfundedretirement gratuity scheme for contractual employees and an unfunded postretirement medical benefit scheme for permanent employees. Liability is maintainedagainst these schemes based on the actuarial recommendations. Actuarial valuationof these benefits are carried out at least once in every two years and the latestvaluations were carried out as at June 30, 2011 using the Projected Unit Credit Method.The following significant assumptions were used for the actuarial valuation of thedefined benefit obligation schemes:
2011 2010Employees’ Post Employees’ Post
gratuity retirement gratuity retirement(funded and medical (funded and medicalunfunded) benefits unfunded) benefits
Discount rate 14.5% 14.5% 13% 13%Increase in salary 12.5% N/A 11% N/ARate of return on plan assets 14.5% N/A 13% N/AMedical escalation rate N/A 11.5% N/A 10%Death rates based on LIC (1975-79) Ultimate mortality tables.
26.1.2 The disclosures made in note 26.1.3 to 26.1.12 are based on the information includedin the actuarial valuation report as of June 30, 2011.
2011 2010Employees’ gratuity Post Employees’ gratuity Post
retirement retirementfunded Unfunded medical Funded Unfunded medical
benefits benefits-------------------------- (Rupees in ‘000) ---------------------------
26.1.3 Balance sheet reconciliation
Present value of defined benefit obligation 312,663 28,300 143,944 261,670 21,845 103,452Fair value of plan assets (note 26.1.5) (210,767) - - (221,806) - -
101,896 28,300 143,944 39,864 21,845 103,452Unrecognised net actuarial (loss) / gain (78,317) (1,793) (16,238) 16,292 (6,517) (9,515)Unrecognised prior service cost - - (16,697) - - -Recognised liability 23,579 26,507 111,009 56,156 15,328 93,937
26.1.4 Movement in present value of defined benefit obligation
As at July 1 261,670 21,845 103,452 288,787 12,176 95,987Current service cost 9,750 4,428 2,597 8,936 2,750 2,403Interest cost 38,698 2,687 12,590 32,014 1,521 10,825Actuarial loss / (gain) 74,065 1,793 16,238 (16,279) 6,517 9,515Un-recognised prior service cost - - 23,280 - - -Benefits paid (71,520) (2,453) (14,213) (51,788) (1,119) (15,278)As at June 30 312,663 28,300 143,944 261,670 21,845 103,452
Paki
stan
Nat
iona
l Shi
ppin
g C
orpo
ratio
n
Annual Report 2011 72

Paki
stan
Nat
iona
l Shi
ppin
g C
orpo
ratio
n
2011 2010Employees’ gratuity Post Employees’ gratuity Post
retirement retirementfunded Unfunded medical Funded Unfunded medical
benefits benefits-------------------------- (Rupees in ‘000) ---------------------------
26.1.5 Movement in fair value of plan assets
As at July 1 221,806 - - 219,846 - -Expected return on plan assets 24,733 - - 23,735 - -Contribution 40,000 - - 30,000 - -Actuarial gain (4,252) - - 13 - -Benefits paid (71,520) - - (51,788) - -As at June 30 210,767 - - 221,806 - -
26.1.6 Expenses
Current service cost 9,750 4,428 2,597 8,936 2,750 2,403Interest cost 38,698 2,687 12,590 32,014 1,521 10,825Expected return on plan assets (24,733) - - (23,735) - -Prior service cost - vested - - 3,243 - - -Amortisation of unrecognised
prior service cost - non vested - - 3,340 - - -Recognition of actuarial loss / (gain) (16,292) 6,517 9,515 60,420 1,030 15,942
7,423 13,632 31,285 77,635 5,301 29,170
26.1.7 Actual return on plan assets
Expected return on plan assets 24,733 - - 23,735 - -Actuarial gain on plan assets (4,252) - - 13 - -Actual return on plan assets 20,481 - - 23,748 - -
26.1.8 Plan assets comprise of investment and cash at bank aggregating to Rs 210.767 million(2010: Rs 221.806 million).
26.1.9 The expected return on plan assets is based on the market expectations and dependsupon the asset portfolio of the Fund.
26.1.10 Principal actuarial assumptions used are disclosed in note 26.1.1 to these consolidatedfinancial statements.
26.1.11 Amounts for the current period and previous four annual periods of the present value ofdefined benefit obligation and fair value of plan assets are as follows:
Employee gratuity 2011 2010 2009 2008 2007
-------------------- (Rupees in '000) --------------------
Present value of defined benefit obligation 340,963 283,515 300,963 242,517 246,776Fair value of plan assets (210,767) (221,806) (219,846) (235,159) - Deficit 130,196 61,709 81,117 7,358 246,776
Experience (gain) / loss on defined benefit obligation 75,858 (9,762) 66,553 (11,067) 41,022Experience gain / (loss) on plan assets (4,252) 13 5,103 (2,352) -
Post retirement medical benefits
Present value of defined benefit obligation 143,944 103,452 95,987 87,407 84,594
Experience adjustment on defined benefit obligation (16,238) 9,515 15,942 654 1,981
Annual Report 2011 73

26.1.12 Assumed medical cost escalation rate have a significant effect on the amounts recognisedin profit or loss. A one percentage point change in assumed medical cost escalation ratewould have the following effects:
One percentage One percentage point increase point decrease
---------(Rupees in ‘000)---------
Effect on aggregate of service cost and interest cost 441 (418)Effect on defined benefit obligation 4,027 (3,823)
26.2 Employees' compensated absences
26.2.1As stated in note 2.16, the Group operates an employees' compensated absencesscheme. Provision is maintained against this scheme based on the actuarialrecommendations. Actuarial valuation is carried out at least once in every two yearsand the latest valuation was carried out as at June 30, 2011 using the Projected UnitCredit Method. The following significant assumptions were used for the actuarialvaluation of the scheme:
2011 2010
Discount rate 14.5% 13%Increase in salary 12.5% 11%
26.2.2 The disclosures made in notes 26.2.3 to 26.2.7 are based on the information includedin the actuarial valuation as of June 30, 2011.
2011 2010(Rupees in ‘000)
26.2.3 Balance sheet reconciliation
Present value of defined benefit obligation 159,300 125,867(recognised)
26.2.4 Movement in present value of defined benefit obligation
As at July 1 125,867 120,182Current service cost 42,835 30,758Interest cost 21,306 14,838Actuarial loss / (gain) 25,730 (175)Benefits paid (56,438) (39,736)As at June 30 159,300 125,867
26.2.5 Expenses
Current service cost 42,835 30,758Interest cost 21,306 14,838Recognition of actuarial loss / (gain) 25,730 (175)
89,871 45,421
26.2.6 Amounts for the current period and previous four annual periods of the present valueof defined benefit obligation are as follows:
2011 2010 2009 2008 2007---------------- (Rupees in ‘000) ----------------
Present value of defined benefit obligation 159,300 125,867 120,182 105,957 108,710
Experience (gain) / loss on defined benefitobligation 25,730 (175) 16,107 (9,567) 12,650
Paki
stan
Nat
iona
l Shi
ppin
g C
orpo
ratio
n
Annual Report 2011 74

Paki
stan
Nat
iona
l Shi
ppin
g C
orpo
ratio
n
26.2.7 Principal actuarial assumptions used are disclosed in note 26.2.1 to these consolidatedfinancial statements.
26.3 Expected retirement benefits costs for the next year are as follows:
(Rupees in ‘000)
Gratuity 115,440Post retirement medical benefits 21,470Compensated absences 60,635
26.4 During the year the Group contributed Rs 10.684 million (2010: 9.334 million) to theprovident fund.
27. TRADE AND OTHER PAYABLESNote 2011 2010
(Rupees in ‘000)
Creditors 300,195 128,748Agents’ and owners’ balances 148,878 114,232Accrued liabilities 667,512 646,553Deposits 27.1 30,907 23,257Workers’ Profits Participation Fund 27.2 11,503 50,194Unclaimed dividends 25,032 22,380Advance from customers 136,813 31,317Other liabilities- amounts retained from contractors 25,740 28,022- others 67,703 45,882
93,443 73,9041,414,283 1,090,585
27.1 These deposits are interest free and are repayable on demand or on completion ofspecific contracts.
27.2 Workers’ Profits Participation Fund
As at July 1 50,194 58,252Allocation for the year 11,503 50,194Interest on fund utilised during the year 143 3,466
61,840 111,912Less: Payments made during the year 50,337 61,718As at June 30 11,503 50,194
28. PROVISION AGAINST DAMAGE CLAIMS
As at July 1 39,403 99,810Charge during the year 9,218 8,838Reversed during the year (19,551) (69,245)Utilised during the year (743) -As at June 30 28,327 39,403
29. CONTINGENCIES AND COMMITMENTS
Contingencies
29.1 Amount in respect of claims not admitted by the Group as at June 30, 2011 aggregateto Rs 152.815 million (2010: Rs 196.921 million). These claims mainly relate to deficienciesin shipping documentation, delay in delivery of cargo and damages to cargo. These
Annual Report 2011 75

include Rs 6.695 million (2010: Rs 13.685 million) approximately in respect of insuranceclaims which, if accepted, will be borne by the Group as the P&I Club, Oceanus MutualUnderwriting Association (Bermuda) Limited has gone into liquidation. Out of theremaining claims, a sum of Rs 68.062 million (2010: Rs 112.901 million) approximatelywould be recoverable from the P&I Club, Steamship Mutual Underwriting Association(Bermuda) Limited, in the event these claims are accepted by the Group. As a matterof prudence, the management has made a total provision of Rs 28.327 million (2010:Rs 39.403 million) against the aforementioned claims in these consolidated financialstatements.
29.2 The holding company has not accepted liability in respect of customs dutyapproximating Rs 2.500 million (2010: Rs 2.500 million) relating to the sale of the vesselM.V. Bhambore during the year ended June 30, 1978. The duty was claimed from theholding company and the matter has been taken up with the appropriateGovernment agencies.
29.3 The former owners of East & West Steamship Company, Chittagong SteamshipCorporation Limited and Trans Oceanic Steamship Company Limited had initiatedlitigation that involved the Government of Pakistan and the holding company.
Following the Supreme Court's adjudication of the East & West Steamship Company'smatter in favour of the former owners, the Government provisionally assessedadditional compensation due to the former owners at approximately Rs 97.012 million(2010: Rs 97.012 million). Although a major portion of this amount has been settled bythe Government, the Government holds the holding company liable for this amountby virtue of the net assets of the East & West Steamship Company having becomevested in the holding company.
In case of Chittagong Steamship Corporation Limited and Trans Oceanic SteamshipCompany Limited, the litigations relating to compensation to the former owners andthe legal suits are pending in the High Court of Sindh. The amounts claimed areapproximately Rs 1.300 million and Rs 66.800 million (2010: Rs 1.300 million and Rs 66.800million) respectively.
The Group disclaims any liability in respect of the abovementioned amounts and anyaccretions to it upto final determination and settlement of the matters.
29.4 Certain other claims have been filed against the holding company in respect ofemployees’ matters for an aggregate amount of approximately Rs 102.987 million(2010: Rs 31.261 million). These cases are pending and the management is confidentthat the outcome of these cases will be in the holding company’s favour andaccordingly no provision for above claims has been made in these consolidatedfinancial statements.
29.5 While framing the tax assessment for the income year ended June 30, 1990, theassessing officer had made an addition to income of Rs 3,974.455 million, being theremission of liabilities due to the Federal government under the scheme of financialrestructuring of the holding company. The resultant tax liability including additionaltaxes for late payment of tax amounted to Rs 1,293.694 million, part of which was paidby the Group and the remaining amount of Rs 1,233.694 million was directly dischargedat source by the Federal Government. The assessing officer while framing the order ofincome year ended June 30, 1996 has treated the aforementioned payment of taxliability by the Government as the income of holding company. The ITAT has given thedecision in favour of the Group on the appeals filed against the above orders.However, the department filed an appeal with the honourable High Court against theaforementioned orders of ITAT. The Honourable High Court has decided the saidappeal against the holding company. The leave to appeal filed by the holdingcompany has been accepted by the Honourable Supreme Court and suspended thedecision of High Court. The Honourable Supreme Court will hear the appeal in duecourse.
Paki
stan
Nat
iona
l Shi
ppin
g C
orpo
ratio
n
Annual Report 2011 76

Paki
stan
Nat
iona
l Shi
ppin
g C
orpo
ratio
n
29.6 During the year, the Officer Inland Revenue (OIR) has issued assessment orders undersection 122 (5A) of the Income Tax Ordinance, 2001 in respect of tax years 2008, 2009and 2010. According to the orders, the OIR has made certain additions anddetermined additional tax demand of Rs 293.431 million. Such addition have beenmade mainly as the OIR has disallowed a portion of administrative expenses byattributing the same to the subsidiary companies and further disallowed a portion ofcontribution made to approved gratuity fund (only in respect of tax year 2008) on thecontention that the same is attributable to the subsidiary companies. The holdingcompany has paid Rs 100 million under protest and has filed an appeal with theCommissioner of Income Tax (Appeals) and at present the matter is pending forhearing. The management of the holding company is confident that the subjectmatter in respect of tax years 2008, 2009 and 2010 will eventually be decided in favourof the holding company. However, as a matter of prudence, the management hadmade aggregate provision of Rs 100.00 million against the aforementioned demandsin the consolidated financial statements for the year ended June 30, 2011.
29.7 While framing tax assessment for the income year ended June 30, 2005, the TaxationOfficer (TO) has issued order against Lalazar Shipping (Private) Limited (LSPL) undersection 122 (5A) of the Income Tax Ordinance, 2001 (The Ordinance) wherebydemand of Rs 139.118 million was raised by the tax department. According to theorder, the TO is of the view that the income appearing under the head ‘other income’in the annual audited financial statements for the said year is taxable under Normal TaxRegime with reference to section 39 of the Ordinance. LSPL had filed appeals with theCommissioner of Income Tax (Appeals) and Income Tax Appellate Tribunal, however,the appeals were decided in favour of the Tax Department.
During the year, the Honourable High Court has heard the appeal filed by LSPL andreduced the tax demand raised by TO to Rs 68.284 million. LSPL has paid the reducedtax demand under protest and filed an appeal with the Honourable Supreme Court forwhich leave to appeal was granted to the LSPL. Further, the tax department has alsofiled an appeal with the Honourable Supreme Court against the order and the matteris at present pending for hearing. The management is confident that the matter shalleventually be decided in favour of LSPL. However, the management, without prejudiceto its contention in respect of the subject matter, as a matter of prudence, has decidedto provide an aggregate amount of Rs 68.284 million in these consolidated financialstatements in respect of prior years' taxation.
29.8 The Taxation Officer (TO) issued an amended assessment order under section 122(5A)of the Income Tax Ordinance, 2001 in respect of tax year 2003 against Karachi Shipping(Private) Limited (KSPL). According to the amended order, TO made additions totaxable income of the company aggregating to Rs. 163.523 million mainly on accountof interest income and gain on sale of fixed assets, which have been taxed separately.KSPL made payment of Rs. 70.315 million under protest, being the additional taxdemand raised by the TO in his order and filed an appeal against the subject order withCommissioner of Income Tax (Appeals) – CIT(A). Consequently, KSPL filed a petition toAlternate Dispute Resolution Committee (ADRC) with respect to the said matter. Duringthe year ended June 30, 2009 the ADRC upheld the decision of TO and decided thematter against KSPL. As the management was not satisfied with the order, KSPLcontinued to pursue its remedy against CIT(A) which is at present pending for hearing.
The management is confident that the matter in the appeal shall eventually bedecided in its favour. Accordingly, no provision has been made for these consolidatedfinancial statements for the above demand.
Commitments
29.10 Commitments in respect of capital expenditure amount to Rs 165.029 million (2010:171.730 million).
Annual Report 2011 77

29.11 Outstanding letters of guarantee amount to Rs 2.126 (2010: Rs 4.461 million).
29.12 Commitments in respect of loan arrangement fee amount to Rs Nil (2010: Rs 115.362million).
30. INCOME FROM SHIPPING BUSINESSNote 2011 2010
(Rupees in ‘000)
Owned vesselsCombi vessels 1,467,403 1,835,033Bulk carrier 1,007,233 494,046Oil tanker 4,445,327 3,723,021
6,919,963 6,052,100Chartered vessels
Slot charter 1,308,690 1,222,470Oil tanker 964,593 533,530
2,273,283 1,756,0009,193,246 7,808,100
31. FLEET EXPENSES - DIRECT
Stevedoring and transhipment expenses 32,165 89,351Diesel, fuel and lubricants consumed 2,425,797 2,181,256Ocean loss 137,126 39,965Port, light, canal and customs dues 610,614 644,808Salaries and allowances 550,570 523,145Charter hire and related expenses 31.1 1,317,694 937,105Fleet communication expenses 20,413 11,515Agency commission and brokerage 166,806 117,173Victualling expenses 54,278 55,206Insurance 305,714 252,633Claim charges 21,864 13,535Stores and spares consumed 190,852 125,787Repairs, maintenance and special surveys 260,959 162,374Overage premium 49,307 174,766Depreciation
Incomplete voyage as at July 1 17 25,204 16,835Fleet expenses - direct 4.8 964,630 939,265
989,834 956,100Exchange loss 12,266 13,050Sundry expenses 51,883 57,156
7,198,142 6,354,925
31.1 Charter hire and related expenses
- Slot charter 517,661 502,346- Oil tanker 800,033 434,759
1,317,694 937,105
32. FLEET EXPENSES - INDIRECT
Conference establishment expenses 277 309Salaries and allowances – regional offices 32.1 5,534 5,033Agents' and other general expenses 32.2 10,036 13,235Depreciation 4.8 466 592General establishment expenses – regional offices 725 630
17,038 19,799
Paki
stan
Nat
iona
l Shi
ppin
g C
orpo
ratio
n
Annual Report 2011 78

Paki
stan
Nat
iona
l Shi
ppin
g C
orpo
ratio
n
32.1 This includes Rs 0.107 million (2010: Rs 0.221 million) in respect of provident fundcontribution.
Note 2011 2010(Rupees in ‘000)
32.2 Agents' and other general expenses
Legal fees and charges - 2,632Printing and stationery 18 116Advertisement and publicity 2,844 4,243Telephone, telex and postage 6,634 4,880Bank charges and commission 500 639Other miscellaneous expenses 40 725
10,036 13,235
33. REAL ESTATE EXPENSES
Salaries and allowances 33.1 9,807 7,836General establishment expenses 33.2 25,527 25,364Rent, rates and taxes 9,180 7,368Insurance 344 1,143Depreciation 4.8 43,062 15,263Legal and professional charges 140 137
88,060 57,111
33.1 This includes Rs 0.321 million (2010: Rs 0.182 million) in respect of provident fundcontribution.
Note 2011 2010(Rupees in ‘000)
33.2 General establishment expenses
Repairs and maintenance 5,975 8,282Medical expenses 46 19Security charges 3,485 3,934Entertainment and canteen subsidy 26 150Books, periodicals and subscriptions 16 38Telephone, telex and postage 47 12,907Light, power and water 15,912 34Vehicle running, repairs and maintenance 20 -
25,527 25,364
34. ADMINISTRATIVE AND GENERAL EXPENSES
Workshop management expense 49,131 -Salaries and allowances 34.1 374,279 339,486General establishment expenses 34.2 126,053 113,713Rent, rates and taxes 6,635 6,763Scholarship and training expenses 1,238 514Insurance 6,924 4,003Depreciation 4.8 48,217 22,817Directors' fee 390 690Legal and professional charges 14,319 20,590Provision for doubtful debts against:
- trade 12 30 101,897- others 4,273 12,876
Others 157 4631,646 623,353
Annual Report 2011 79

34.1 This includes Rs 9.935 million (2010: Rs 8.931 million) in respect of provident fundcontribution.
Note 2011 2010(Rupees in ‘000)
34.2 General establishment expenses
Repairs and maintenance 2,754 6,733Medical cost 41,150 14,587Medical insurance - 19,371Contribution to employees welfare fund 8 9Contribution to group term insurance 1,805 1,723Security charges 1,483 390Travelling and conveyance 20,797 15,450Entertainment and canteen subsidy 2,275 2,196Books, periodicals and subscription 4,482 4,114Uniform and liveries 644 731Hajj expenses 1,050 925Printing and stationery 4,128 4,028Telephone, telex and postage 8,424 (5,526)Light, power and water 1,540 11,512Computer expenses 7,803 6,992Advertisement and publicity 3,992 4,510Vehicle running and repairs 11,811 11,400Ship inspection expenses 4,410 6,094Sundries 7,497 8,474
126,053 113,713
35. OTHER OPERATING EXPENSES
Workers' Profits Participation Fund 27.2 11,503 50,194 Donations 35.1 2,000 3,000 Auditors' remuneration 35.2 11,860 8,860 Employees' gratuity
- funded 26.1.6 7,423 77,635 - unfunded 26.1.6 13,632 5,301
21,055 82,936Post retirement medical benefits 26.1.6 31,285 29,170 Employees' compensated absences 26.2.5 89,871 45,421 Fixed assets written off - 259Loss on disposal of fixed assets - 24,528 Loss on fixed assets due to fire - net 35.3 2,554 - Provision in respect of damage claims 9,218 8,838
179,346 253,206
35.1 Donations were not made to any donee in which the Group or a director or his spousehad any interest.
Paki
stan
Nat
iona
l Shi
ppin
g C
orpo
ratio
n
Annual Report 2011 80

Paki
stan
Nat
iona
l Shi
ppin
g C
orpo
ratio
n
35.2 Auditors' remuneration2011 2010
A. F. Ernst & Total A. F. Ernst & TotalFerguson Young Ford Ferguson Young Ford
& Co. Rhodes & Co. RhodesSidat Hyder Sidat Hyder
----------------------- (Rupees in ‘000) -----------------------
Audit fee - the holding company 703 703 1,406 633 633 1,266Audit fee - subsidiaries 1,345 1,345 2,690 1,200 1,200 2,400Review of half yearly
financial statements 295 295 590 265 265 530Review of compliance with
the best practices of the codeof Corporate Governance 72 72 144 66 66 132
Fee for audit of the consolidatedfinancial statements 89 89 178 80 80 160
Tax advisory services 5,438 - 5,438 3,672 - 3,672Fee for special review 650 - 650 - - -Out of pocket expenses 352 412 764 419 281 700
8,944 2,916 11,860 6,335 2,525 8,860
35.3 The amount represents amount of fixed assets destroyed due to fire net of insuranceclaims received for those items.
Note 2011 2010(Rupees in ‘000)
36. FINANCE COSTS
Interest on long-term financing 570,741 - Gain on cross currency interest rate swap
derivative 36.1 (310,734) - Interest on Workers' Profits Participation Fund 143 3,466 Bank charges and commission 4,285 4,628 Loan arrangement fee - 12,818
264,435 20,912
36.1 This relates to the amount received during the year on account of interim exchangesunder the swap arrangement as explained in note 16.3 amounting to Rs 310.734 million.
37. OTHER OPERATING INCOMENote 2011 2010
(Rupees in ‘000)Income from financial assets / liabilities
Interest/mark-up on loans and advances to employees 150 104
Income from saving and term deposits 197,295 616,623 Dividend income 1,363 842 Agency fee 6,155 - Gain on insurance claims - destroyed items - 21,054 Gain on revaluation of swap derivative 6,130 - Insurance claims 37.1 1,740 4,374 Liabilities no longer payable written back 46 59,175 Gain on revaluation of long-term investments 629 3,539 Gain on revaluation of investment properties 6 25,712 - Exchange gain 37.2 14,432 36,616
Income from non-financial assets
Profit on disposal of fixed assets 165,252 37,941 Provisions no longer required written back 19,551 85,290 Sundries 47,483 23,337
485,938 888,895
Annual Report 2011 81

37.1 This represents recoveries from hull, cargo and other claims according to:
2011 2010(Rupees in ‘000)
- the insurance policies 1,740 4,284 - others - 90
1,740 4,374
37.2 This represents exchange gain on foreign currency bank deposits maintained outsidePakistan.
38. TAXATION2011 2010
(Rupees in ‘000)Tax charge for:
- current year 200,784 447,577 - prior years 168,387 41,615
369,171 489,192 Deferred 18,129 (13,470)
387,300 475,722 Taxes paid abroad relating to current year 5,868 5,985
393,168 481,707
38.1 Relationship between tax expense and accounting profit
Accounting profit before tax 1,400,440 1,449,531
Tax rate 35% 35%
Tax on accounting profit 490,154 507,336
Tax effect in respect of income / expenses not admissible for calculation of taxable profit 2,429 (189)
Tax effect of lower tax rates on certain incomes:
- Tax saving due to lower tax rates (42,605) (44,371)- Tax saving due to lower tax rates - subsidiaries profit (327,256) (108,699)- Tax on dividend income 43,179 -- Tax liability under final tax regime 46,717 33,469
(279,965) (119,601)
Effect of charging deferred tax on different ratiothan current tax 945 3,634
Tax effect of flood surcharge 8,399 -
Others (including the impact arising as a consequence of change in allocation ratio of revenue chargeable under FTR and non-FTR tax regime) (3,049) 42,927
(271,241) (73,229)218,913 434,107
Taxes paid abroad 5,868 5,98Prior years taxation 168,387 41,615Tax expense for the year 393,168 481,707
Paki
stan
Nat
iona
l Shi
ppin
g C
orpo
ratio
n
Annual Report 2011 82

Paki
stan
Nat
iona
l Shi
ppin
g C
orpo
ratio
n
39. EARNINGS PER SHARE2011 2010
(Rupees in ‘000)Profit after taxation attributable to equity holders of
the Group 1,006,950 967,484
(Number of shares)Weighted average number of ordinary shares in issue during the year 132,063,380 132,063,380
(Rupees)
Earnings per share - basic 7.62 7.33
There are no dilutive potential ordinary shares outstanding as at June 30, 2011 and2010.
40. CASH GENERATED FROM OPERATIONSNote 2011 2010
(Rupees in ‘000)
Profit before taxation 1,400,440 1,449,531
Adjustments for non-cash charges and other items:Depreciation 1,081,579 994,772 Profit on disposal of property, plant and equipment (165,252) (37,941)Property, plant and equipment written off - 259 Loss on sale of property, plant and equipment - 24,528 Loss on fixed assets due to fire - net 2,554 - Provision in respect of damage claims 9,218 8,838 Provision for employees' gratuity 21,055 82,936 Provision for employees' compensated absences 89,871 45,421 Provision for post retirement medical benefits 31,285 29,170 Dividend income (1,363) (842)Liabilities no longer required written back (46) (59,175)Provision no longer required written back (19,551) (85,290)Interest / mark-up income (197,445) (616,727)Interest / mark-up expense 575,169 - Loan arrangement fee - 12,818 (Gain) / loss on revaluation of investments (629) (3,539)Gain on revaluation of investment properties (25,712) - Gain on cross currency interest rate swap derivative (316,864) - Working capital changes 40.1 (1,586) 4,103,918
2,482,723 5,948,677 40.1 Working capital changes
(Increase) / decrease in current assets:Stores and spares (799) (91,767)Trade debts - net (192,308) 335,751 Agents' and owners' balances - net (5,373) 19,350 Loans and advances (23,755) 37,989 Deposits and short term prepayments (2,445) 14,128 Other receivables (79,830) 63,460 Incomplete voyages (22,747) 11,340 Insurance claims 9,979 (13,588)Short term investment (5,400) 3,900,000
(322,678) 4,276,663 Increase / (decrease) in current liabilities:Trade and other payables 321,092 (172,745)
(1,586) 4,103,918
Annual Report 2011 83

41. CASH AND CASH EQUIVALENTSNote 2011 2010
(Rupees in ‘000)
Short-term investments 19 471,900 1,207,224 Cash and bank balances 20 2,100,797 1,314,633
2,572,697 2,521,857
42. REMUNERATION OF CHAIRMAN, EXECUTIVE DIRECTORS / DIRECTORS ANDOTHER EXECUTIVES
The aggregate amount of remuneration including all benefits payable to theChairman, Executive Directors and Executives of the Group were as follows:
Chairman & Chief Executive Other executivesExecutive Directors
2011 2010 2011 2010 2011 2010-----------------------(Rupees in '000)-----------------------
Managerial remuneration andallowances 1,885 2,220 13,168 9,765 165,973 129,838
Retirement benefits - - 167 294 5,403 1,577 House rent 333 472 1,953 1,414 53,317 30,990 Conveyance - - - - 3,744 864 Entertainment 142 10 216 233 1,237 149 Medical 435 - 1,043 721 4,381 1,039 Utilities 163 129 1,264 1,038 23,727 21,237 Personal staff subsidy 7 - 9 18 172 132 Club membership fee and expenses 33 8 103 104 - - Bonus - 420 1,502 1,680 17,184 19,334 Other allowances 285 - 898 1,179 68,577 89,900
3,283 3,259 20,323 16,446 343,715 295,060
Number of persons 2 2 5 5 185 117
42.1 Retirement benefits represent amount contributed towards various retirement benefitplans. The executives of the Group are entitled to retirement benefits as outlined innote 2.15 and 2.16 to these consolidated financial statements. The Chairman and ChiefExecutive, Executive Directors and certain Executives are provided with Group ownedand maintained cars.
42.2 The aggregate amount charged in the consolidated financial statements for fee tonon-executive directors was Rs 0.390 million (2010: Rs 0.690 million).
42.3 During the year the former chairman left the holding company on March 21, 2011 andthe incoming chairman joined office on March 27, 2011.
Paki
stan
Nat
iona
l Shi
ppin
g C
orpo
ratio
n
Annual Report 2011 84

Paki
stan
Nat
iona
l Shi
ppin
g C
orpo
ratio
n
43. FINANCIAL INSTRUMENTS BY CATEGORY2011 2010
(Rupees in ‘000)
FINANCIAL ASSETSFinancial assets at fair value through profit or lossLong-term investments - listed companies 26,783 26,154 Derivative cross currency interest rate swap 87,960 -
Loans and receivables
Long-term loans - employees 214 1,003 Trade debts 654,580 462,272 Agents’ and owners’ balances 6,443 1,070 Deposits 4,253 5,305 Interest / mark-up accrued 2,582 1,786 Other receivables 152,422 68,785 Insurance claims 36,672 46,651 Short-term investments 477,300 1,207,224 Cash and bank balances 2,100,797 1,314,633
3,435,263 3,108,729 Available-for-sale financial assetsLong-term investments - other entity 100 100
3,550,106 3,134,983FINANCIAL LIABILITIES
Financial liabilities at amortised costLong term financing 8,021,456 - Trade and other payables 1,265,967 1,009,074 Accrued mark up on long term financing 134,898 -
9,422,321 1,009,074
44. FINANCIAL RISK MANAGEMENT
44.1 Financial risk factors
The Group’s activities expose it to a variety of financial risks: credit risk, market risk(including foreign exchange risk, cash flow and fair value interest rate risk and price risk)and liquidity risk. The Group’s overall risk management programme focuses on theunpredictability of financial markets and seeks to minimise potential adverse effects onthe financial performance.
44.1.1 Concentration of credit risk
Credit risk represents the accounting loss that would be recognised at the reportingdate if counter-parties failed completely to perform as contracted. Credit risk arisesfrom cash and cash equivalents, derivative financial instruments and deposits withbanks and financial institutions, as well as credit exposures to customers, includingtrade debts and committed transactions. Out of the total financial assets, the financialassets that are subject to credit risk amounted to Rs 3,548.898 million (2010: Rs 3,133.362million).
For banks and financial institutions, only independently rated parties with a minimumcredit rating of A are accepted.
A significant component of the receivable balances of the Group relates to amountsdue from the private sector organisations. Due to the Group’s long standing businessrelationships with these counterparties and after giving due consideration to theirstrong financial standing, management does not expect non–performance by these
Annual Report 2011 85

counter parties on their obligations to the Group. The management continuouslymonitors the credit exposure towards the customers and makes provision against thosebalances considered doubtful of recovery.
44.1.2 Market Risk
Foreign exchange risk
Foreign exchange risk is the risk that the fair value or future cash flows of a financialinstrument will fluctuate because of changes in foreign exchange rates. The Groupfaces foreign currency risk on receivable, payable transactions at foreign ports andthe derivative cross currency interest rate swap. Foreign currency risk is covered as aconsidered management decision, since the income from the derivative crosscurrency interest rate swap fluctuates widely due to change in exchange rate.
As at June 30, 2011, if the currency had weakened by 5% against the US dollar with allother variables held constant, pre-tax profit for the year would have been Rs 386.541million (2010: Rs 11.507 million) lower, mainly as a result of foreign exchange gains /losses on translation of US dollar denominated assets and liabilities.
If at the same date the currency had strengthened by 5% against US dollar with allother variables held constant, pre-tax profit for the year would have been Rs 427.044million (2010: Rs 11.507 million) higher, mainly as a result of foreign exchange gains /losses on translation of US dollar denominated assets and liabilities.
As at June 30, 2011, the affect of fluctuations in other foreign currency denominatedassets or liabilities balances would not be material, therefore, not disclosed.
Cash flow and fair value interest rate risk
Interest rate risk is the risk that the value of a financial instrument will fluctuate due tochanges in the market interest rates. The Group has a high exposure to interest rate riskdue to the financing obtained during the year (note 25). In order to manage itsexposure to such risks the management of the holding company has entered into aderivative cross currency interest rate swap (note 16) under which the holdingcompany receives KIBOR on the PKR notional in exchange for payment of LIBOR on theUSD notional.
The Group has interest bearing liabilities and have floating interest rates. At June 30,2011, if interest rates on borrowings had been 250 basis points higher/lower with allother variables held constant, profit after taxation for the year would have beenlower/higher by Rs 21.981 million (2010: Rs Nil).
Price risk
Price risk represents the risk that the fair value or future cash flows of a financialinstrument will fluctuate because of changes in market prices (other than those arisingfrom interest rate risk or foreign exchange risk), whether those changes are caused byfactors specific to the individual financial instrument or its issuer, or factors affecting allsimilar financial instruments traded in the market.
The Group believes it is not exposed to any significant price risk.
44.1.3 Liquidity risk
Liquidity risk is the risk that the Group will encounter difficulties in raising funds to meetcommitments associated with financial instruments. The Group believes that it is notexposed to any significant level of liquidity risk.
The management forecasts the liquidity of the Group on basis of expected cash flowconsidering the level of liquid assets necessary to meet such risk. This involves monitoringbalance sheet liquidity ratios and maintaining debt financing plans.
Paki
stan
Nat
iona
l Shi
ppin
g C
orpo
ratio
n
Annual Report 2011 86
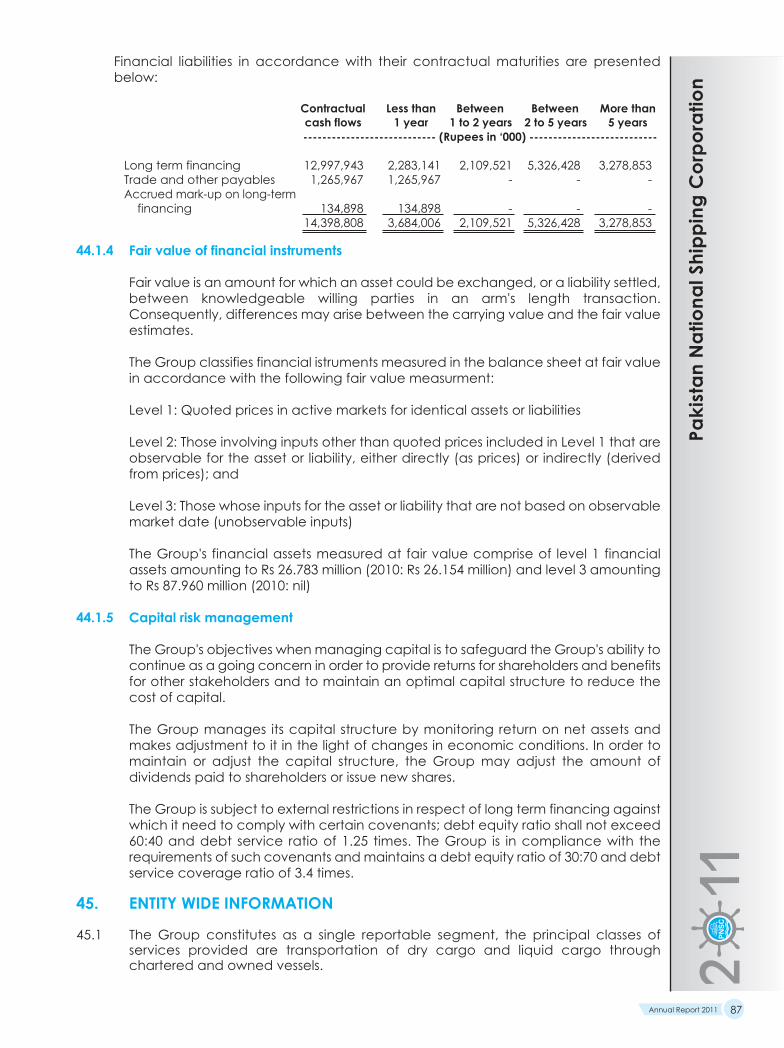
Paki
stan
Nat
iona
l Shi
ppin
g C
orpo
ratio
n
Financial liabilities in accordance with their contractual maturities are presentedbelow:
Contractual Less than Between Between More than cash flows 1 year 1 to 2 years 2 to 5 years 5 years---------------------------- (Rupees in ‘000) ---------------------------
Long term financing 12,997,943 2,283,141 2,109,521 5,326,428 3,278,853 Trade and other payables 1,265,967 1,265,967 - - -Accrued mark-up on long-term
financing 134,898 134,898 - - - 14,398,808 3,684,006 2,109,521 5,326,428 3,278,853
44.1.4 Fair value of financial instruments
Fair value is an amount for which an asset could be exchanged, or a liability settled,between knowledgeable willing parties in an arm's length transaction.Consequently, differences may arise between the carrying value and the fair valueestimates.
The Group classifies financial istruments measured in the balance sheet at fair valuein accordance with the following fair value measurment:
Level 1: Quoted prices in active markets for identical assets or liabilities
Level 2: Those involving inputs other than quoted prices included in Level 1 that areobservable for the asset or liability, either directly (as prices) or indirectly (derivedfrom prices); and
Level 3: Those whose inputs for the asset or liability that are not based on observablemarket date (unobservable inputs)
The Group's financial assets measured at fair value comprise of level 1 financialassets amounting to Rs 26.783 million (2010: Rs 26.154 million) and level 3 amountingto Rs 87.960 million (2010: nil)
44.1.5 Capital risk management
The Group's objectives when managing capital is to safeguard the Group's ability tocontinue as a going concern in order to provide returns for shareholders and benefitsfor other stakeholders and to maintain an optimal capital structure to reduce thecost of capital.
The Group manages its capital structure by monitoring return on net assets andmakes adjustment to it in the light of changes in economic conditions. In order tomaintain or adjust the capital structure, the Group may adjust the amount ofdividends paid to shareholders or issue new shares.
The Group is subject to external restrictions in respect of long term financing againstwhich it need to comply with certain covenants; debt equity ratio shall not exceed60:40 and debt service ratio of 1.25 times. The Group is in compliance with therequirements of such covenants and maintains a debt equity ratio of 30:70 and debtservice coverage ratio of 3.4 times.
45. ENTITY WIDE INFORMATION
45.1 The Group constitutes as a single reportable segment, the principal classes ofservices provided are transportation of dry cargo and liquid cargo throughchartered and owned vessels.
Annual Report 2011 87

45.2 Information about services
The Group's principal classes of services accounted for as disclosed in note 30 ofthese consolidated financial statements.
45.3 Information about geographical areas
The Group does not hold non-current assets in any foreign country.
45.4 Information about major customers
The Group has the following exposure to concentration of credit risk with clientsrepresenting greater than 10 % of the total revenue balances:
---------- 2011 ---------Revenue
Amount (Rupees % of Totalin '000)
Client 1 2,055,533 23 Client 2 1,119,273 12
3,174,806 35
---------- 2010 ---------Revenue
Amount (Rupees % of Totalin '000)
Client 1 1,943,862 25Client 2 964,094 12
2,907,956 37
46. RELATED PARTY DISCLOSURES
Related parties comprise of companies affiliated to the holding company and thedirectors, chief executives of the holding company and employee funds maintainedby the holding company. Transactions with related parties essentially entail dividendincome received from related investee companies. Particulars of remuneration to keypersonnel are disclosed in note 42 of these consolidated financial statements.
The significant transactions carried out by the Group with related parties during theyear are given below:
Note 2011 2010(Rupees in ‘000)
Contribution to Provident Fund 10,684 9,334 Key management personnel compensation 42 23,606 19,705Directors' fee 390 690
47. NON-ADJUSTING EVENTS AFTER THE BALANCE SHEET DATE
47.1 The Board of Directors at the meeting held on September 28, 2011 have proposed cashdividend of Re 1.00 per share (2010: Rs 3.00 per share) for the year ended June 30,2011, amounting to Rs 132.063 million (2010: Rs 396.190 million) subject to the approval
Paki
stan
Nat
iona
l Shi
ppin
g C
orpo
ratio
n
Annual Report 2011 88

Paki
stan
Nat
iona
l Shi
ppin
g C
orpo
ratio
n
of the members at the annual general meeting to be held on October 29, 2011. Theconsolidated financial statements for the year ended June 30, 2011 do not include theeffect of this appropriation which will be accounted for subsequent to the year end.
48. CORRESPONDING FIGURES
Significant corresponding figures have been rearranged and reclassified, wherevernecessary for the purposes of comparison.
Note From To Note (Rupees in '000)
30 Revenue Ocean loss 31 39,965 27 Other liabilities - freight Advance from customer 27 31,317
The following Administrative and general expenses have been rearranged andreclassified for the purpose of better presentation and comparison.
Description Transferred to Real Estate Expenses(Rupees in '000)
Salaries and allowances 7,836 General establishment expenses:
- Repairs and maintenance 8,282 - Medical expenses 19- Security charges 3,934- Entertainment and canteen subsidy 150- Books, periodicals and subscriptions 38- Telephone, telex and postage 12,907- Light, power and water 34
Rent, rates and taxes 7,368Insurance 1,143Depreciation 15,263Legal and professional charges 137
57,111
49. GENERAL
Figures have been rounded off to the nearest thousand of rupees unless otherwisestated.
50. DATE OF AUTHORISATION
These consolidated financial statements were authorised for issue on September 28,2011 by the Board of Directors of the holding company.
Annual Report 2011 89
Vice Admiral (R) Saleem Ahmed Meenai Khowaja Obaid Imran IlyasChairman & Chief Executive Director

BLANK
Paki
stan
Nat
iona
l Shi
ppin
g C
orpo
ratio
n
Annual Report 2011 90
REPORT AND ACCOUNTS
OF
PAKISTAN NATIONAL
SHIPPING CORPORATION
(HOLDING COMPANY)

BLANK
Pakistan
Nat
iona
lShipp
ing
Cor
pora
tion
Annual Report 201192

Pakistan
Nat
iona
lShipp
ing
Cor
pora
tion
AUDITORS’ REPORT TO THE MEMBERS
We have audited the annexed balance sheet of Pakistan National Shipping Corporation as atJune 30, 2011 and the related profit and loss account, statement of changes in equity and cashflow statement together with the notes forming part thereof, for the year then ended and westate that we have obtained all the information and explanations which, to the best of ourknowledge and belief, were necessary for the purposes of our audit.
It is the responsibility of the Corporation’s management to establish and maintain a system ofinternal control, and prepare and present the above said statements in conformity with theapproved accounting standards as applicable in Pakistan and the requirements of theCompanies Ordinance, 1984. Our responsibility is to express an opinion on these statements basedon our audit.
We conducted our audit in accordance with the auditing standards as applicable in Pakistan.These standards require that we plan and perform the audit to obtain reasonable assuranceabout whether the above said statements are free of any material misstatement. An auditincludes examining, on a test basis, evidence supporting the amounts and disclosures in theabove said statements. An audit also includes assessing the accounting policies and significantestimates made by management, as well as, evaluating the overall presentation of the abovesaid statements. We believe that our audit provides a reasonable basis for our opinion and, afterdue verification, we report that-
(a) in our opinion, proper books of account have been kept by the Corporation as required bythe Companies Ordinance, 1984;
(b) in our opinion-
(i) the balance sheet and profit and loss account together with the notes thereon havebeen drawn up in conformity with the Companies Ordinance, 1984, and are inagreement with the books of account and are further in accordance with accountingpolicies consistently applied;
(ii) the expenditure incurred during the year was for the purpose of the Corporation’sbusiness; and
(iii) the business conducted, investments made and the expenditure incurred during theyear were in accordance with the objects of the Corporation;
(c) in our opinion and to the best of our information and according to the explanations givento us, the balance sheet, profit and loss account, statement of changes in equity and cashflow statement together with the notes forming part thereof conform with approvedaccounting standards as applicable in Pakistan, and, give the information required by theCompanies Ordinance, 1984, in the manner so required and, respectively give a true andfair view of the state of the Corporation’s affairs as at June 30, 2011 and of the profit, itschanges in equity and cash flows for the year then ended; and
(d) in our opinion zakat deductible at source under the Zakat and Ushr Ordinance, 1980 wasdeducted by the Corporation and deposited in the Central Zakat Fund established undersection 7 of that Ordinance.
A. F. FERGUSON & CO. ERNST & YOUNG FORD RHODES SIDAT HYDERChartered Accountants Chartered AccountantsAudit Engagement Partner : Saad Kaliya Audit Engagement Partner : Riaz A. Rehman ChamdiaKarachi, September 28, 2011 Karachi, September 28, 2011
A. F. FERGUSON & CO.CHARTERED ACCOUNTANTS(a member firm of PwC network)STATE LIFE BUILDING 1-CI. I. CHUNDRIGAR ROADKARACHI
ERNST & YOUNG FORD RHODES SIDAT HYDERCHARTERED ACCOUNTANTSPROGRESSIVE PLAZABEAUMONT ROADKARACHI
Annual Report 2011 93

Note 2011 2010(Rupees in ‘000)
ASSETSNON-CURRENT ASSETSProperty, plant and equipment 4 1,408,252 1,436,371Intangible asset 5 - -Investment properties 6 996,638 970,926Long-term investments in:
- Related parties (subsidiaries and an associate) 7 19,197,791 1,558,416- Listed companies and an other entity 8 26,883 26,254
19,224,674 1,584,670
Long-term loans and advances 9- Related parties (subsidiaries) 4,655,158 11,665,738- Others 214 668
4,655,372 11,666,406Deferred tax-net 10 18,890 36,074
26,303,826 15,694,447CURRENT ASSETS
Stores and spares 11 20,499 22,788Trade debts 12 272,125 193,195Agents’ and owners’ balances 13 6,443 1,070Loans and advances 14 62,384 38,863Deposits and short-term prepayments 15 27,550 7,085Interest / mark-up accrued 2,505 1,780Other receivables 16 328,364 22,315Incomplete voyages 17 18,532 24,019Insurance claims 18 30 572Short-term investments 19 471,900 1,207,224Cash and bank balances 20 2,098,976 1,307,961
3,309,308 2,826,872TOTAL ASSETS 29,613,134 18,521,319
EQUITY AND LIABILITIES
Share capital 21 1,320,634 1,320,634Reserves 22 5,565,343 5,140,981
6,885,977 6,461,615SURPLUS ON REVALUATION OF FIXEDASSETS - NET OF TAX 23 662,817 671,928
NON-CURRENT LIABILITIES
Long-term financing 24 6,941,694 -Deferred liabilities 25 320,395 291,288
7,262,089 291,288CURRENT LIABILITIES
Trade and other payables 26 13,531,891 10,904,729Provision against damage claims 27 28,327 39,403Current portion of long-term financing 24 1,079,763 -Accrued markup on long-term financing 134,898 -Taxation-net 27,372 152,356
14,802,251 11,096,488TOTAL EQUITY AND LIABILITIES 29,613,134 18,521,319
CONTINGENCIES AND COMMITMENTS 28
The annexed notes 1 to 51 form an integral part of these financial statements.
Pakistan
Nat
iona
lShipp
ing
Cor
pora
tion
Annual Report 201194
PAKISTAN NATIONAL SHIPPING CORPORATIONBALANCE SHEETAS AT JUNE 30, 2011
Vice Admiral (R) Saleem Ahmed Meenai Khowaja Obaid Imran IlyasChairman & Chief Executive Director

Pakistan
Nat
iona
lShipp
ing
Cor
pora
tion
Note 2011 2010(Rupees in ‘000)
REVENUESChartering revenues 29 2,273,283 1,756,000Services fee 30 276,470 240,837Rental income 99,468 81,110Dividend income from subsidiaries 435,140 -
3,084,361 2,077,947EXPENDITUREFleet expenses - direct 31 1,359,511 960,492Fleet expenses - indirect 32 14,434 14,733Vessel management expenses 33 483,827 320,605Real estate expenses 34 88,062 55,750
1,945,834 1,351,580GROSS PROFIT 1,138,527 726,367
Administrative and general expenses 35 126,118 186,338Other operating expenses 36 166,967 216,283Finance costs 37 261,994 19,161
555,079 421,782
Other operating income 38 317,110 834,377PROFIT BEFORE TAXATION 900,558 1,138,962Taxation 39 288,157 427,429PROFIT AFTER TAXATION 612,401 711,533
(Rupees)EARNINGS PER SHARE 40 4.64 5.39
Note: The appropriations from profits are set out in the statement of changes in equity.
The annexed notes 1 to 51 form an integral part of these financial statements.
Annual Report 2011 95
PAKISTAN NATIONAL SHIPPING CORPORATIONPROFIT AND LOSS ACCOUNTFOR THE YEAR ENDED JUNE 30, 2011
Vice Admiral (R) Saleem Ahmed Meenai Khowaja Obaid Imran IlyasChairman & Chief Executive Director

Issued, Capital Unappropriated Totalsubscribed and reserve profitpaid-up share
capital-------------------------- (Rupees in ‘000) --------------------------
Balance as at July 1, 2009 1,320,634 126,843 4,687,747 6,135,224
Final cash dividend for the yearended June 30, 2009(Rs 3 per ordinary share) - - (396,190) (396,190)
Total comprehensive income forthe year ended June 30, 2010 - - 711,533 711,533
Surplus on revaluation of fixedassets realised throughincremental depreciationcharged on related assetsduring the year, recogniseddirectly in equity - net of tax (note 23) - - 11,048 11,048
Balance as at June 30, 2010 1,320,634 126,843 5,014,138 6,461,615
Final cash dividend for the yearended June 30, 2010(Rs 1.5 per ordinary share) - - (198,095) (198,095)
Total comprehensive income forthe year ended June 30, 2011 - - 612,401 612,401
Surplus on revaluation of fixed assetsrealised through incrementaldepreciation charged on relatedassets during the year, recogniseddirectly in equity - net of tax (note 23) - - 10,056 10,056
Balance as at June 30, 2011 1,320,634 126,843 5,438,500 6,885,977
The annexed notes 1 to 51 form an integral part of these financial statements.
Pakistan
Nat
iona
lShipp
ing
Cor
pora
tion
Annual Report 201196
PAKISTAN NATIONAL SHIPPING CORPORATIONSTATEMENT OF CHANGES IN EQUITYFOR THE YEAR ENDED JUNE 30, 2011
Vice Admiral (R) Saleem Ahmed Meenai Khowaja Obaid Imran IlyasChairman & Chief Executive Director

Pakistan
Nat
iona
lShipp
ing
Cor
pora
tion
Note 2011 2010(Rupees in ‘000)
Cash flows from operating activities
Cash generated from operations 41 3,254,959 6,350,607Employees’ gratuity paid (42,453) (31,119)Employees’ compensated absences paid (56,438) (39,736)Post retirement medical benefits paid (14,213) (15,278)Long-term loans and advances 230 344Finance costs paid (426,431) -Receipts under cross currency interest rate swap 228,904 -Arrangement fee paid (106,662) -Provision against damage claims paid (743)Taxes paid (395,012) (565,209)Net cash generated from operating activities 2,442,141 5,699,609
Cash flows from investing activities
Fixed capital expenditure (104,822) (328,692)Expenditure on ‘Investment Properties’ - (1,630)Proceeds from disposal of property, plant and equipment 41,168 4,711Long-term loans and advances - related parties 7,010,580 (6,657,351)Long-term investments in - related parties (17,639,375) -Interest / mark-up received 196,073 762,154Dividends received form others 1,363 842Dividends received from subsidiary companies 205,788 -Net cash used in investing activities (10,289,225) (6,219,966)
Cash flows from financing activities
Long-term financing obtained - net 8,098,218 -Dividend paid (195,443) (390,752)Net cash generated from / (used in) financing activities 7,902,775 (390,752)
Net increase / (decrease) in cash and cash equivalents 55,691 (911,109)Cash and cash equivalents at the beginning of the year 2,515,185 3,426,294
Cash and cash equivalents at the end of the year 42 2,570,876 2,515,185
The annexed notes 1 to 51 form an integral part of these financial statements.
Annual Report 2011 97
PAKISTAN NATIONAL SHIPPING CORPORATIONCASH FLOW STATEMENTFOR THE YEAR ENDED JUNE 30, 2011
Vice Admiral (R) Saleem Ahmed Meenai Khowaja Obaid Imran IlyasChairman & Chief Executive Director
1. THE CORPORATION AND ITS OPERATIONS
1.1 Pakistan National Shipping Corporation (the Corporation) was established under theprovisions of the Pakistan National Shipping Corporation Ordinance, 1979 and isprincipally engaged in the business of shipping, including charter of vessels,transportation of cargo and other related services and providing commercial,technical, administrative, financial and other services to third parties in relation to thebusiness of shipping. The Corporation is also engaged in renting out its properties totenants under lease arrangements. The Corporation is listed on the Karachi andLahore Stock Exchanges. The Corporation’s registered office is situated in PNSCBuilding, Moulvi Tamizuddin Khan Road, Karachi.
The Corporation had applied for delisting from the Lahore Stock Exchange (LSE) inthe year 2002. However, at present the matter of delisting from LSE is pending subjectto a final decision by the Supreme Court.
1.2 These financial statements are separate financial statements of the Corporation inwhich investments in subsidiaries and associates are accounted for on the basis ofdirect equity interest and are not consolidated.
2. SUMMARY OF SIGNIFICANT ACCOUNTING POLICIES
The significant accounting policies adopted in the preparation of these financialstatements have been consistently applied to all years presented, unless otherwisestated, as set out below.
2.1 Statement of compliance
These financial statements have been prepared in accordance with therequirements of the Companies Ordinance, 1984 (the Ordinance) and theapproved accounting standards as applicable in Pakistan. Approved accountingstandards comprise of such International Financial Reporting Standards (IFRSs) issuedby the International Accounting Standards Board as are notified under theOrdinance and the requirements of and directives issued under that Ordinance.However, the requirements of and the directives issued under that Ordinance havebeen followed where those requirements are not consistent with the requirements ofthe IFRSs, as notified under the Ordinance.
2.1.1 Standards, amendments to published approved accounting standards andinterpretations becoming effective for the year ended June 30, 2011:
The following standard, interpretations and amendments to existing standards havebeen published that are mandatory and relevant for the Corporation’s accountingperiod beginning on July 1, 2010:
On August 14, 2009, the Government of Pakistan (GoP) launched Benazir Employees’Stock Option Scheme (the “Schemes”) for employees of certain State OwnedEnterprises (SOEs) and non-State Owned Enterprises where GoP holds significantinvestments (non-SOEs). The scheme is applicable to permanent and contractualemployees who were in employment of these entities on the date of launch of theScheme, subject to completion of five years vesting period by all contractualemployees and by permanent employees in certain instances.
Pakistan
Nat
iona
lShipp
ing
Cor
pora
tion
Annual Report 201198
PAKISTAN NATIONAL SHIPPING CORPORATIONNOTES TO AND FORMING PART OF THE FINANCIAL STATEMENTSFOR THE YEAR ENDED JUNE 30, 2011

Pakistan
Nat
iona
lShipp
ing
Cor
pora
tion
The Scheme provides for a cash payment to employees on retirement or terminationbased on the price of shares of respective entities. To administer this scheme, GoPshall transfer 12% of its investment in such SOEs and non-SOEs to a trust fund to becreated for the purpose of such entities. The eligible employees would be allottedunits by each Trust Fund in proportion to their respective length of service and onretirement or termination of such employees would be entitled to receive suchamounts from Trust Funds in exchange for the surrendered units as would bedetermined based on market price of listed entities or breakup value of non-listedentities. The shares related to the surrendered units would be transferred back toGoP.
The scheme also provides that 50% of dividend related to shares transferred to therespective Trust Fund would be distributed amongst the unit-holder employees. Thebalance 50% dividend would be transferred by the respective Trust Fund to theCentral Revolving Fund managed by the Privatisation Commission of Pakistan forpayment to employees against surrendered units. The deficits, if any, in Trust Fundsto meet the re-purchase commitment would be met by GoP.
The Scheme, developed in compliance with the stated GoP policy of theempowerment of employees of State Owned Enterprises need to be accounted forby the covered entities, including the Corporation, under the provisions of amendedInternational Financial Reporting Standard-2 ‘Share Based Payments’ (IFRS 2).However, keeping in view the difficulties that may be faced by the entities coveredunder the Scheme, the Securities & Exchange Commission of Pakistan on receivingthe representation from some of the entities covered under the Scheme and afterhaving consulted the Institute of Chartered Accountants of Pakistan, has grantedexemption vide SRO 587(I)/2011 dated June 7, 2011 to such entities from applicationof IFRS 2 to the Scheme.
Had the exemption not been granted, the impact based on the independentactuarial valuations conducted as on June 30, 2011, for the years ended June 30,2010 and 2011 would have been as follows:
Year ended Year endedJune 30, June 30,2011 2010(Rupees in ‘000)
Staff costs of the Corporation for the year would havebeen higher by 162,588 173,279
Profit after taxation would have been lower by 162,588 173,279
(Rupees)Earnings per share would have been lower by 1.23 1.31
Year ended Year endedJune 30, June 30,2011 2010(Rupees in ‘000)
Retained earnings would have been lower by 162,588 173,279Reserves would have been higher by 162,588 173,279
Standards, amendments to published approved accounting standards andinterpretations becoming effective for the year ended June 30, 2011 but not relevant:
There are certain new approved accounting standards, amendments to approvedaccounting standards and interpretations that are mandatory for accounting
Annual Report 2011 99
periods beginning on July 1, 2010 but are considered not to be relevant or to haveany significant effect on the Corporation’s operations and are, therefore notdisclosed in these financial statements.
Standards, amendments to published approved accounting standards andinterpretations as adopted in Pakistan, that are not yet effective:
There are certain amendments to the approved accounting standards andinterpretations that are mandatory for accounting periods beginning on or after July1, 2011 but are considered not to be relevant or do not have any significant effectto the Corporation’s operations and are therefore not mentioned in these financialstatements.
2.2 Basis of preparation
These financial statements have been prepared under the historical cost conventionexcept as follows:
- Certain property, plant and equipment as referred to in note 2.3.1 have beenstated at revalued amounts;
- certain investment properties and financial instruments as referred to in notes 2.5and 2.6.4 respectively have been carried at fair value to comply with therequirements of IAS-40 ‘Investment Property’ and IAS-39 ‘Financial Instruments:Recognition and Measurement’ respectively; and
- accounting for staff benefits as referred to in notes 2.14 and 2.15.
2.3 Fixed assets
2.3.1 Property, plant and equipment
Property, plant and equipment are stated at cost less accumulated depreciationand accumulated impairment losses except for leasehold land and buildingsthereon, beach huts and workshopmachinery and equipment. Leasehold land andbuildings thereon, beach huts and workshop machinery and equipment are statedat revalued amounts less any subsequent accumulated depreciation andsubsequent accumulated impairment losses. The revaluation of related assets iscarried out with sufficient regularity to ensure that the carrying amounts do not differmaterially from those which would have been determined using fair values at thebalance sheet date.
The value assigned to leasehold land is not depreciated as the leases are expectedto be renewed for further periods on payment of relevant rentals. Annual leaserentals are charged to income and premium paid at the time of renewal, if any, isamortised over the remaining period of the lease.
Depreciation is charged to income applying the straight line method whereby thedepreciable amount of an asset is depreciated over its estimated useful life.
Consistent with prior years, depreciation on additions is charged from the month inwhich the asset is available for use and continued to be depreciated until it isderecognised, that is, upto the month of disposal. An item of property, plant andequipment is derecognised upon disposal or when no future economic benefits areexpected from its use or disposal.
No depreciation is charged if the asset’s residual value exceeds its carrying amount.
Pakistan
Nat
iona
lShipp
ing
Cor
pora
tion
Annual Report 2011100

Pakistan
Nat
iona
lShipp
ing
Cor
pora
tion
Residual values, useful lives and methods of depreciation are reviewed at eachbalance sheet date and adjusted if expectations differ significantly from previousestimates.
Useful lives are determined by the management based on expected usage of theasset, expected physical wear and tear, technical and commercial obsolescence,legal and similar limits on the use of the assets and other similar factors.
A revaluation deficit is recognised in profit or loss, except that a deficit directlyoffsetting a previous surplus on any asset, in which case the deficit is taken to surpluson revaluation of fixed assets account. Surplus on revaluation cannot be distributedto shareholders until it is transferred to retained earnings. An annual transfer from thesurplus on revaluation of fixed assets account to retained earnings is made for thedifference between depreciation based on the revalued carrying amount of theassets and the depreciation based on the assets’ original cost. Additionally,accumulated depreciation as at the revaluation date is eliminated against the grosscarrying amount of the assets and the net amount is restated to the revaluedamount of the assets. Upon disposal, any revaluation reserve relating to theparticular assets being sold is transferred to retained earnings.
The surplus held on revaluation of fixed assets can be applied by the Corporation insetting off or in diminution of any deficit arising from the revaluation of any otherfixed asset of the Corporation.
Major renewals, replacements and improvements that meet the recognition criteriain IAS 16 are capitalised and the assets so replaced, if any, are retired. Normal repairsand maintenance are charged to income as and when incurred. Gains and losseson disposals of the assets are included in income currently.
2.3.2 Capital work-in-progress
These are stated at cost less accumlated impairment losses, if any. All expenditureconnected with specific assets incurred during installation and construction periodare carried uder this head. These are transferred to specific assets as and when theseassets are available for use.
2.3.3 Intangible assets
An intangible asset is an identifiable nonmonetary asset without physical substance.Intangible assets are stated at cost less accumulated amortisation andaccumulated impairment losses, if any. Cost in relation to intangible assets presentlyheld by the Corporation includes cost of computer software and other expensesincidental to the purchase of computer software.
Costs associated with maintaining computer software are recognised as an expenseas and when incurred.
Intangible assets are amortised from the month when these assets are available foruse using the straight line method whereby the cost of intangible asset is amortisedover the period which takes into account the economic benefits that will beavailable to the Corporation.
2.4 Impairment of assets
The Corporation assesses at each balance sheet date whether there is anyindication that the assets may be impaired. If such indications exist, the carryingamounts of such assets are reviewed to assess whether they are recorded in excessof their recoverable amounts. Where carrying values exceed the respective
Annual Report 2011 101

recoverable amount, assets are written down to their recoverable amounts and theresulting impairment charge is recognised in income except for impairment loss onrevalued assets, which is recognised directly against revaluation surplus of any otherasset to the extent that the impairment loss does not exceed the amount held in therevaluation surplus.
2.5 Investment properties
Properties held for long-term rental yields which are significantly rented out by theCorporation are classified as investment properties.
Investment properties are carried at fair value which is based on active marketprices, adjusted, if necessary, for any difference in the nature, location or conditionof the specific asset. The valuation of these properties is carried out with sufficientregularity.
Gains and losses arising from a change in the fair value of investment properties areincluded in income currently.
2.6 Financial instruments
2.6.1 Financial assets
The Corporation classifies its financial assets in the following categories: at fair valuethrough profit or loss, loans and receivables, available-for-sale and held to maturity.The classification depends on the purpose for which the financial assets wereacquired. Management determines the classification of its financial assets at thetime of initial recognition.
a) Financial assets at fair value through profit or lossFinancial assets at fair value through profit or loss are financial assets held for tradingand financial assets designated upon initial recognition as at fair value through profitand loss. A financial asset is classified as held for trading if acquired principally for thepurpose of selling in the short term (note 44).
b) Loans and receivablesLoans and receivables are non-derivative financial assets with fixed or determinablepayments that are not quoted in an active market. Various financial assets classifiedunder this category are disclosed in note 44.
c) Available-for-sale financial assetsAvailable-for-sale financial assets are non-derivatives that are either designated inthis category or not classified in any of the other categories (note 44).
d) Held to maturityFinancial assets with fixed or determinable payments and fixed maturity, wheremanagement has the intention and ability to hold till maturity are carried atamortised cost (note 44).
All financial assets are recognised at the time when the Corporation becomes aparty to the contractual provisions of the instrument. Regular purchases and sales ofinvestments are recognised at trade-date i.e., the date on which the Corporationcommits to purchase or sell the asset.
Financial assets are initially recognised at fair value plus transaction costs for allfinancial assets not carried at fair value through profit and loss. Financial assetscarried at fair value through profit and loss are initially recognised at fair value andtransactions costs are expensed in the profit and loss account.
Pakistan
Nat
iona
lShipp
ing
Cor
pora
tion
Annual Report 2011102

Pakistan
Nat
iona
lShipp
ing
Cor
pora
tion
The fair values of quoted investments are based on current prices. If the market fora financial asset is not active (and for unlisted securities), the Corporation measuresthe investments at cost less impairment in value, if any.
Available-for-sale financial assets and financial assets at fair value through profit andloss are subsequently carried at fair value. Loans and receivables and held tomaturity investments are carried at amortised cost using effective interest ratemethod.
Financial assets are derecognised when the rights to receive cash flows from theassets have expired or have been transferred and the Corporation has transferredsubstantially all risks and rewards of ownership.
2.6.2 Impairment
The Corporation assesses at each balance sheet date whether there is objectiveevidence that a financial asset or group of financial assets is impaired.
2.6.3 Financial liabilities
All financial liabilities are recognised at the time when the Corporation becomes aparty to the contractual provisions of the instrument.
A financial liability is derecognised when the obligation under the liability isdischarged or cancelled or expired. Where an existing financial liability is replacedby another from the same lender on substantially different terms, or the terms of anexisting liability are substantially modified, such an exchange and modification istreated as a derecognition of the original liability and the recognition of a newliability, and the difference in respective carrying amounts is recognised in the profitand loss account.
2.6.4 Derivative financial instruments
The Corporation uses derivative financial instruments such as interest rate and crosscurrency swaps to manage its risks associated with interest and exchange ratefluctuations. Such derivative financial instruments are initially recognised at fair valueon the date on which a derivative contract is entered into and are subsequently re-measured at fair value. Derivatives with positive market values (unrealised gains) areincluded in other assets and derivatives with negative market values (unrealisedlosses) are included in trade and other payables in the balance sheet. Any gains orlosses arising from changes in fair value of derivatives that do not qualify for hedgeaccounting are taken directly to the profit and loss account.
2.6.5 Interest - bearing loans and borrowings
Interest bearing loans and borrowings (borrowings) are recognised initially at fairvalue, net of transaction cost incurred. Borrowings are subsequently carried atamortised cost; any difference between the proceeds (net of transaction costs) andthe redemption value is recognised in the income statement over the period of theborrowings using the effective interest rate method.
Fees paid on the establishment of loan facilities (arrangement fees) are recognisedas transaction costs of the loan to the extent that it is probable that some or all ofthe facility will be drawn down in which case the fee is deferred until the draw downoccurs.
Annual Report 2011 103

2.6.6 Off-setting of financial assets and financial liabilities
A financial asset and a financial liability is offset and the net amount is reported inthe financial statements if the Corporation has a legally enforceable right to set-offthe transaction and also intends either to settle on a net basis or to realise the assetand settle the liability simultaneously.
2.7 Stores and spares
Stores are valued at weighted average cost while spares are valued at costdetermined on first-in first-out basis. Stores and spares in transit are valued at costincurred upto the balance sheet date.
Certain spares having low value and high consumption levels are charged toincome at the time of purchase.
The Corporation reviews the carrying amount of stores and spares on a regular basisand provision is made for obsolescence if there is any change in usage pattern andphysical form.
2.8 Trade debts and other receivables
Trade debts and other receivables (other than the derivatives) are carried at invoicevalue less provision for impairment. A provision for impairment of trade debts andother receivables is established when there is an objective evidence that theCorporation will not be able to collect all amounts due according to the originalterms of the receivable. Significant financial difficulties of the debtor, probability thatthe debtor will enter bankruptcy or financial reorganisation, and default ordelinquency in payments are considered indicators that the trade receivable isimpaired. Debts, considered irrecoverable, are written off, as and when identified.
2.9 Taxation
2.9.1 Current
Provision for current taxation is based on taxable income for the year at the currentrates of taxation after taking into account tax credits and tax rebates available, ifany, and tax paid on final tax basis or minimum tax on turnover, whichever is higher.
2.9.2 Deferred
Deferred tax is recognised using the balance sheet liability method, on all temporarydifferences arising at the balance sheet date between the tax base of assets andliabilities and their carrying amounts for financial reporting purposes.
Deferred tax liabilities are recognised for all taxable temporary differences. Deferredtax assets are recognised for all deductible temporary differences to the extent thatit is probable that the future taxable profits will be available against which the assetsmay be utilised. Deferred tax assets are reduced to the extent that it is no longerprobable that the related tax benefit will be realised.
The carrying amount of deferred tax asset is reviewed at each balance sheet dateand reduced to the extent that it is no longer probable that sufficient taxable profitswill be available to allow all or part of the deferred tax asset to be recognised.Unrecognised deferred tax assets are reassessed at each balance sheet date andare recognised to the extent that it has become probable that future taxable profitwill allow deferred tax asset to be recovered.
Pakistan
Nat
iona
lShipp
ing
Cor
pora
tion
Annual Report 2011104

Pakistan
Nat
iona
lShipp
ing
Cor
pora
tion
Deferred tax assets and liabilities are measured at the tax rates that are expectedto apply to the period when the asset is realised or the liability is settled, based onthe tax rates (and tax laws) that have been enacted or substantively enacted at thebalance sheet date.
2.10 Insurance claims
Consistent with prior years, hull claims and other claimable expenses relating to hullare charged to income currently and claims filed there against are taken to incomewhen such claims are accepted by the underwriters.
Afloat medical expenses, cargo claims and other relevant amounts recoverablefrom underwriters are taken to insurance claims receivable.
2.11 Trade and other payables
Liabilities for trade and other amounts payable are carried at cost which is the fairvalue of the consideration to be paid in future for goods and services whether billedor not.
2.12 Provisions
Provisions are recognised when the Corporation has a present legal or constructiveobligation as a result of past events, it is probable that an outflow of resourcesembodying economic benefits will be required to settle the obligation and a reliableestimate of the obligation can be made. Provisions are reviewed at each balancesheet date and adjusted to reflect the current best estimate.
2.13 Dividend and appropriations
Dividends declared and transfers between reserves made subsequent to thebalance sheet date are considered as non-adjusting events and are recognised inthe financial statements in the period in which such dividends are declared /transfers are made.
2.14 Staff retirement benefits
2.14.1 The Corporation operates an approved provident fund scheme for all its permanentemployees. Equal monthly contributions are made, both by the Corporation and itsemployees, to the fund at the rate of 10 percent of the basic salaries of employees.
2.14.2 Defined benefit gratuity scheme
The Corporation operates a funded retirement gratuity scheme for its permanentemployees other than those who joined the Corporation after October 16, 1984.Further, the Corporation also operates an unfunded retirement gratuity scheme forcontractual employees. Annual provisions to cover the obligations under thescheme are based on actuarial estimates and are charged to income currently.Actuarial valuations are carried out using the Projected Unit Credit Method.
The Corporation’s crewmembers are also entitled to gratuity in accordance with thePakistan Maritime Board Regulations. However, these employee benefits arerecognised upon payment as the amounts involved are not material.
The unrecognised actuarial gains or losses arising at each valuation date arerecognised as income or expense in the following year.
The benefit is payable on completion of prescribed qualifying period of serviceunder these schemes.
Annual Report 2011 105
2.14.3 Post-retirement medical benefits
The Corporation provides lump sum medical allowance to its retired permanentemployees in accordance with the service regulations.
The unrecognised actuarial gains or losses arising at each valuation date arerecognised as income or expense in the following year.
The benefit is payable on completion of prescribed qualifying period of serviceunder these schemes.
2.15 Employees’ compensated absences
The Corporation accounts for the liability in respect of employees’ compensatedabsences in the year in which these are earned. Annual provisions to cover theobligations under the scheme are based on actuarial estimates and are charged toincome currently. The unrecognised actuarial gains or losses at each valuation dateare recognised immediately.
2.16 Cash and cash equivalents
Cash and cash equivalents are carried in the balance sheet at cost. Cash and cashequivalents include cash in hand, cheques in hand, deposits held with banks andother short term highly liquid investments with maturities of three months or less.
2.17 Foreign currency translation
These financial statements are presented in Pakistan Rupees (functional andpresentation currency). Transactions in foreign currencies are recorded in PakistanRupees at the exchange rates approximating those prevailing on the date oftransaction. Monetary assets and liabilities in foreign currencies are reported inPakistan Rupees at the exchange rates approximating those prevalent at thebalance sheet date. Non-monetary items that are measured in terms of historicalcost in a foreign currency are translated using the exchange rates as at the datesof the initial transactions. Non-monetary items measured at fair value in foreigncurrencies are translated using the exchange rates at the date when the fair valuewas determined.
2.18 Revenue recognition
- Consistent with prior years, earnings in respect of voyages other than time chartervoyages are accounted for on the basis of completed voyages. Voyages aretaken as complete when a vessel arrives at the last port of discharge on or beforethe balance sheet date. Freight revenue, direct and indirect operating expensesassociated with the incomplete voyages are deferred until completion of voyageand are classified in the balance sheet as ‘Incomplete voyages’. With respect totime charter voyages, chartering revenue is accounted for on the basis of numberof days to the balance sheet date.
- Fee for technical, commercial, administrative and financial services arerecognised as revenue when the services are rendered.
- Rental income is recognised as revenue on a straight line basis over the term of therespective lease arrangements.
- Dividend income is recognised when the Corporation’s right to receive thedividend is established.
- Profit from bank accounts and return on investments is recognised on a timeproportion basis.
2.19 Borrowing costs
Consistent with prior years, borrowing costs that are directly attributable to the
Pakistan
Nat
iona
lShipp
ing
Cor
pora
tion
Annual Report 2011106

Pakistan
Nat
iona
lShipp
ing
Cor
pora
tion
acquisition and construction of assets and incurred during the period in connectionwith the activities necessary to prepare the asset for its intended use are capitalisedas a part of the cost of related asset.
All other borrowing costs are recognised as an expense in the period in which theyare incurred.
2.20 Contingent liabilities
A contingent liability is disclosed when:
- there is a possible obligation that arises from past events and whose existence willbe confirmed only by the occurrence or non occurrence of one or more uncertainfuture events not wholly within the control of the Corporation; or
- there is present obligation that arises from past events but it is not probable thatan outflow of resources embodying economic benefits will be required to settlethe obligation or the amount of the obligation cannot bemeasured with sufficientreliability.
3. CRITICAL ACCOUNTING ESTIMATES, JUDGEMENTS AND ASSUMPTIONS
The preparation of the Corporation’s financial statements requires management tomake judgments, estimates and assumptions that affect the reported amounts ofrevenues, expenses, assets and liabilities, and the disclosure of contingent liabilities,at the end of the reporting period. However, uncertainty about these assumptionsand estimates could result in outcomes that require a material adjustment to thecarrying amount of the asset or liability affected in future periods.
In the process of applying the accounting policies, management has made thefollowing estimates and judgements which are significant to the financialstatements.
(a) Valuation of property, plant and equipment and investment properties (notes4 and 6);
(b) Determination of the residual values and useful lives of property, plant andequipment (note 4);
(c) Recognition of taxation and deferred tax (notes 39 and 10);
(d) Accounting for provision for impairment against loans and advances, tradedebts, agents and owners balances, deposits and other receivables (notes 9,12, 13, 15 and 16);
(e) Accounting for provision against damage claims (note 27);
(f) Accounting for defined benefit plans (note 25);
(g) Measuring fair value of cross currency interest rate swap (note 16.3);
(h) Recoverable amount of investment in related parties (note 7); and
(i) Measuring the value of contingent assets and liabilities (note 28).
Estimates and judgements are continually evaluated and are based on historicalexperience and other factors, including expectation of future events that arebelieved to be reasonable under the circumstances.
Note 2011 2010(Rupees in ‘000)
4. PROPERTY, PLANT AND EQUIPMENT
- Operating fixed assets 4.1 1,150,549 767,609- Capital work-in-progress 4.7 257,703 668,762
1,408,252 1,436,371
Annual Report 2011 107

4.1 The following is a statement of operating fixed assets:Leasehold Building on Vessel Vehicles Office Furniture Motor Equip- Container Beach Workshop Computer Totalland (notes leasehold (note 4.4) equipment and launch ment on fittings huts machinery equipment4.2 &4.3) land (notes fittings and board (notes and
4.2 & 4.3) jetty 4.2 & equipment4.3) (notes 4.2
& 4.3)-------------------------------------------------------------------------------------------------------- (Rupees in ‘000) --------------------------------------------------------------------------------------------------------
As at June 30, 2009
Cost or revaluedamount 607,325 171,624 1,440 64,846 11,978 11,600 18 787 3,468 13,152 14,392 11,815 912,445
Less: accumulateddepreciation - 40,675 1,440 39,546 5,288 4,396 18 671 3,468 - 8,443 6,942 110,887
Net book value 607,325 130,949 - 25,300 6,690 7,204 - 116 - 13,152 5,949 4,873 801,558
Year ended June 30, 2010
Opening net bookvalue 607,325 130,949 - 25,300 6,690 7,204 - 116 - 13,152 5,949 4,873 801,558
Additions - 2,243 - - 1,832 709 - - - - 111 2,634 7,529
DisposalsCost - (3,213) - - - - - - - - - - (3,213)Accumulated depreciation - 362 - - - - - - - - - - 362
- (2,851) - - - - - - - - - - (2,851)Write offCost - - - - - - - - - - 1 - 1Accumulated depreciation - - - - - - - - - - (1) - (1)
- - - - - - - - - - - - -Depreciation chargefor the year - (21,477) - (8,754) (1,585) (1,274) - (116) - (1,315) (592) (3,514) (38,627)
Closing net bookvalue 607,325 108,864 - 16,546 6,937 6,639 - - - 11,837 5,468 3,993 767,609
As at June 30, 2010
Cost or revaluedamount 607,325 170,654 1,440 64,846 13,810 12,309 18 787 3,468 13,152 14,504 14,449 916,762
Less: accumulateddepreciation - 61,790 1,440 48,300 6,873 5,670 18 787 3,468 1,315 9,036 10,456 149,153
Net book value 607,325 108,864 - 16,546 6,937 6,639 - - - 11,837 5,468 3,993 767,609
Year ended June 30, 2011
Opening net bookvalue 607,325 108,864 - 16,546 6,937 6,639 - - - 11,837 5,468 3,993 767,609
Additions - 442,275 - - 31,753 19,284 - 4,145 - - 248 18,176 515,881
DisposalsCost - (609) - (495) - - - - - - - - (1,104)Accumulated depreciation - 162 - 495 - - - - - - - - 657
- (447) - - - - - - - - - - (447)
Write offCost - (94,464) - - - - - - - - - - (94,464)Accumulated depreciation - 53,673 - - - - - - - - - - 53,673
- (40,791) - - - - - - - - - - (40,791)
Depreciation chargefor the year - (70,418) - (7,686) (3,254) (3,535) - (700) - (1,974) (467) (3,669) (91,703)
Closing net bookvalue 607,325 439,483 - 8,860 35,436 22,388 - 3,445 - 9,863 5,249 18,500 1,150,549
As at June 30, 2011
Cost or revaluedamount 607,325 517,856 1,440 64,351 45,563 31,593 18 4,932 3,468 13,152 14,752 32,625 1,337,075
Less: accumulateddepreciation - 78,373 1,440 55,491 10,127 9,205 18 1,487 3,468 3,289 9,503 14,125 186,526
Net book value 607,325 439,483 - 8,860 35,436 22,388 - 3,445 - 9,863 5,249 18,500 1,150,549
Annual rate ofdepreciation (%) 3 to 20 4 20 15 10 to 15. 10 to 15 10 to 15 15 10 5 to 10 33
Pakistan
Nat
iona
lShipp
ing
Cor
pora
tion
Annual Report 2011108
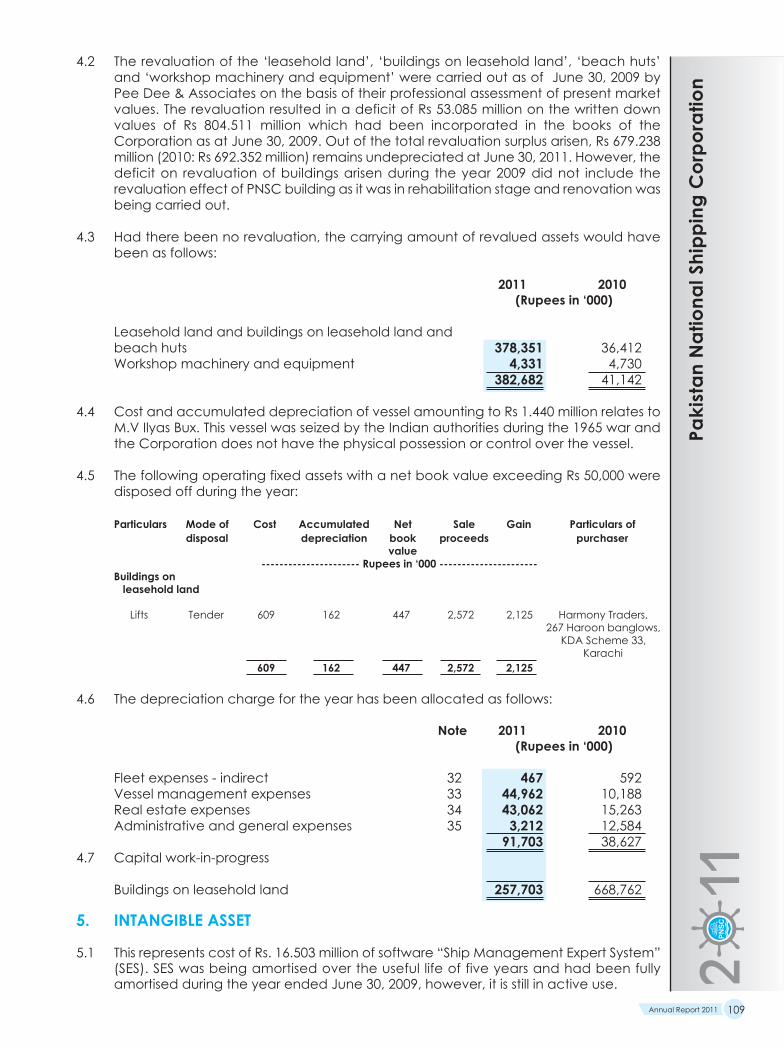
Pakistan
Nat
iona
lShipp
ing
Cor
pora
tion
4.2 The revaluation of the ‘leasehold land’, ‘buildings on leasehold land’, ‘beach huts’and ‘workshop machinery and equipment’ were carried out as of June 30, 2009 byPee Dee & Associates on the basis of their professional assessment of present marketvalues. The revaluation resulted in a deficit of Rs 53.085 million on the written downvalues of Rs 804.511 million which had been incorporated in the books of theCorporation as at June 30, 2009. Out of the total revaluation surplus arisen, Rs 679.238million (2010: Rs 692.352 million) remains undepreciated at June 30, 2011. However, thedeficit on revaluation of buildings arisen during the year 2009 did not include therevaluation effect of PNSC building as it was in rehabilitation stage and renovation wasbeing carried out.
4.3 Had there been no revaluation, the carrying amount of revalued assets would havebeen as follows:
2011 2010(Rupees in ‘000)
Leasehold land and buildings on leasehold land andbeach huts 378,351 36,412Workshop machinery and equipment 4,331 4,730
382,682 41,142
4.4 Cost and accumulated depreciation of vessel amounting to Rs 1.440 million relates toM.V Ilyas Bux. This vessel was seized by the Indian authorities during the 1965 war andthe Corporation does not have the physical possession or control over the vessel.
4.5 The following operating fixed assets with a net book value exceeding Rs 50,000 weredisposed off during the year:
Particulars Mode of Cost Accumulated Net Sale Gain Particulars ofdisposal depreciation book proceeds purchaser
value---------------------- Rupees in ‘000 ----------------------
Buildings onleasehold land
Lifts Tender 609 162 447 2,572 2,125 Harmony Traders,267 Haroon banglows,
KDA Scheme 33,Karachi
609 162 447 2,572 2,125
4.6 The depreciation charge for the year has been allocated as follows:
Note 2011 2010(Rupees in ‘000)
Fleet expenses - indirect 32 467 592Vessel management expenses 33 44,962 10,188Real estate expenses 34 43,062 15,263Administrative and general expenses 35 3,212 12,584
91,703 38,6274.7 Capital work-in-progress
Buildings on leasehold land 257,703 668,762
5. INTANGIBLE ASSET
5.1 This represents cost of Rs. 16.503 million of software “Ship Management Expert System”(SES). SES was being amortised over the useful life of five years and had been fullyamortised during the year ended June 30, 2009, however, it is still in active use.
Annual Report 2011 109

Pakistan
Nat
iona
lShipp
ing
Cor
pora
tion
6. INVESTMENT PROPERTIES
Note Leasehold Buildings Totalland on
leaseholdland
--------- (Rupees in ‘000) ---------
Balance as at July 1, 2009 910,700 58,596 969,296Additions during the year - 1,630 1,630Balance as at June 30, 2010 910,700 60,226 970,926
Balance as at July 1, 2010 910,700 60,226 970,926Surplus / (deficit) on revaluation 6.1 41,800 (16,088) 25,712Balance as at June 30, 2011 952,500 44,138 996,638
6.1 During the year, revaluation of the Corporation’s investment properties was carriedout by Pee Dee & Associates as of October 31, 2010 on the basis of their professionalassessment of present market values. As a result, a revaluation gain of Rs 41.800 millionwas assessed in respect of leasehold land whereas a revaluation loss was assessed onbuildings on leasehold land amounting to Rs 16.088 million. The management of theCorporation believes that the current market values of the investment propertiesapproximate their fair values.
7. LONG-TERM INVESTMENTS IN RELATED PARTIES(SUBSIDIARIES AND AN ASSOCIATE)
No. of shares - ordinary Name of the company Country of Latest Percentage Face value 2011 20102011 2010 incorporation available holding per share
audited 2011 2010financial
statementsfor the year
ended
(i) Subsidiary companies - unlisted (Rs) (Rupees in ‘000)
10,000,000 10,000,000 Bolan Shipping (Private) Limited Pakistan June 30, 2011 100 100 10 100,000 100,000
275,344,100 9,436,000 Chitral Shipping (Private) Limited Pakistan June 30, 2011 100 100 10 2,753,442 94,360
5,686,000 5,686,000 Hyderabad Shipping (Pvt) Ltd. Pakistan June 30, 2011 100 100 10 56,860 56,860
15,686,000 15,686,000 Islamabad Shipping (Pvt) Ltd. Pakistan June 30, 2011 100 100 10 156,860 156,860
36,000 36,000 Johar Shipping (Private) Limited Pakistan June 30, 2011 100 100 10 360 360
7,286,000 7,286,000 Kaghan Shipping (Private) Limited Pakistan June 30, 2011 100 100 10 72,860 72,860
330,000,000 3,354,166 Karachi Shipping (Private) Limited Pakistan June 30, 2011 100 100 10 3,451,994 185,536
16,736,000 16,736,000 Khairpur Shipping (Private) Limited Pakistan June 30, 2011 100 100 10 167,360 167,360
340,000,000 36,000 Lahore Shipping (Private) Limited Pakistan June 30, 2011 100 100 10 3,400,000 360
14,686,000 14,686,000 Lalazar Shipping (Private) Limited Pakistan June 30, 2011 100 100 10 146,860 146,860
9,486,000 9,486,000 Makran Shipping (Private) Limited Pakistan June 30, 2011 100 100 10 94,860 94,860
336,016,700 4,636,000 Malakand Shipping (Private) Limited Pakistan June 30, 2011 100 100 10 3,360,167 46,360
6,936,000 6,936,000 Multan Shipping (Private) Limited Pakistan June 30, 2011 100 100 10 69,360 69,360
1,600 1,200 Pakistan Co-operative Ship Stores (Pvt) Ltd. Pakistan June 30, 2011 73 55 100 868 120
500,000,000 36,000 Quetta Shipping (Private) Limited Pakistan June 30, 2011 100 100 10 5,000,000 360
6,936,000 6,936,000 Sargodha Shipping (Private) Limited Pakistan June 30, 2011 100 100 10 69,360 69,360
6,786,000 6,786,000 Shalamar Shipping (Private) Limited Pakistan June 30, 2011 100 100 10 67,860 67,860
9,636,000 9,636,000 Sibi Shipping (Private) Limited Pakistan June 30, 2011 100 100 10 96,360 96,360
13,236,000 13,236,000 Swat Shipping (Private) Limited Pakistan June 30, 2011 100 100 10 132,360 132,360
19,197,791 1,558,416
(ii) Associate - unlisted
12,250 12,250 Muhammadi Engineering Works Ltd. Pakistan Dec. 31, 1982 49 49 100 1,600 1,600
Less: Accumulated impairment losses (unaudited) 1,600 1,600
- -
19,197,791 1,558,416
Annual Report 2011110

Pakistan
Nat
iona
lShipp
ing
Cor
pora
tion
Note 2011 2010(Rupees in ‘000)
8. LONG-TERM INVESTMENTS IN LISTEDCOMPANIES AND AN OTHER ENTITY
Financial assets designated as ‘at fair value through profit or loss’
Listed companies6,930 (2010: 6,930) ordinary shares of Rs 10 eachfully paid of Siemens (Pakistan)EngineeringLimited. Market value per share Rs 1,084.21(2010: Rs 1,039.56 per share) 7,514 7,204
72,828 (2010: 72,828) ordinary shares of Rs 10each fully paid of Pakistan State Oil CompanyLimited. Market value per share Rs 264.58(2010: Rs 260.20) 19,269 18,950
26,783 26,154
Available for sale financial asset
Other entity - carried at cost10,000 (2010: 10,000) ordinary shares of Rs 10each of Pakistan Tourism DevelopmentCorporation Limited 100 100
26,883 26,254
9. LONG-TERM LOANS AND ADVANCES
Related parties (subsidiaries) 9.1 4,655,158 11,665,738
Others - due from employeesConsidered good 9.2 423 1,003Considered doubtful 224 -
647 1,003Less: Provision for impairment 9.6 224 -
423 1,003Less: Recoverable within one year 14 209 335
214 668
9.1 These represent amounts granted by the Corporation as an advance against futureissue of share capital to its wholly owned subsidiaries for purchase of vessels.
2011 2010(Rupees in ‘000)
Quetta Shipping (Private) Limited - 4,999,640Lahore Shipping (Private) Limited - 3,399,640Karachi Shipping (Private) Limited - 3,266,458Hyderabad Shipping (Private) Limited 2,211,395 -Sibi Shipping (Private) Limited 2,443,763 -
4,655,158 11,665,738
9.2 It comprises of house building and vehicle loans amounting to Rs 0.342 million (2010: Rs0.817 million) and Rs 0.081 million (2010: Rs 0.186 million) respectively.
9.3 Vehicle loans represent loans to employees for purchase of vehicles and are securedagainst employees’ personal guarantees and charge on vehicles. Such loans arerecoverable over 36 or 48 monthly installments on which interest is being charged atthe rate of 11% (2010: 11%) per annum.
Annual Report 2011 111

9.4 House building loans represent loans to employees for purchase of land, residentialaccommodation and construction and renovation of houses. These loans arerecoverable over 180 monthly installments. An amount of Rs 0.316 million (2010: Rs 0.792million) is secured against mortgages of the employees’ properties. Interest on suchloans to officers is charged at various rates while no interest is being charged on loansgiven to other employees.
9.5 Long-term loans are being carried at cost because the effect of carrying thesebalances at amortised cost would not have been material.
Note 2011 2010(Rupees in ‘000)
9.6 Provision for impairment
Balance at the beginning of the year - -Provision made during the year 224 -Balance at the end of the year 224 -
10. DEFERRED TAX - NET
Deductible temporary differences arising inrespect of:- accelerated depreciation - 1,508- short-term provisions and deferred liabilities 65,211 54,990
65,211 56,498Taxable temporary differences arising inrespect of:- surplus on revaluation of fixed assets 23 16,421 20,424- unamortised transaction cost 23,119- accelerated depreciation 6,781 -
46,321 20,42418,890 36,074
10.1 The management is confident that sufficient future taxable profits will be availableagainst which deferred tax asset will be adjusted.
Note 2011 2010(Rupees in ‘000)
11. STORES AND SPARES
Stores- at depot 17,074 21,507- at buildings 1,630 266
18,704 21,773Spares- at buildings 1,795 1,015
20,499 22,78812. TRADE DEBTS
Unsecured- considered good 12.1 272,125 193,195- considered doubtful 17,625 17,596
289,750 210,791Less: Provision for impairment 12.2 17,625 17,596
272,125 193,195
Pakistan
Nat
iona
lShipp
ing
Cor
pora
tion
Annual Report 2011112

Pakistan
Nat
iona
lShipp
ing
Cor
pora
tion
12.1 The ageing analysis of these trade debts that are past due but not impaired is asfollows:
2011 2010(Rupees in ‘000)
Upto 1 month 172,099 122,0701 to 6 months 45,141 56,449More than 6 months 54,885 14,676
272,125 193,19512.2 Provision for impairment
Balance at the beginning of the year 17,596 17,738Provision made during the year 29 -Amounts reversed - (142)Balance at the end of the year 17,625 17,596
As at June 30, 2011, trade receivables of Rs 17.625 million (2010: Rs 17.596 million) wereimpaired and provided for. These receivable balances are outstanding for more thanthree years.
Note 2011 2010(Rupees in ‘000)
13. AGENTS’ AND OWNERS’ BALANCES - unsecured
Considered good 13.1 6,443 1,070Considered doubtful 4,453 4,453
10,896 5,523Less: provision for impairment 13.2 4,453 4,453
6,443 1,070
13.1 The ageing analysis of these agents’ and owners’ balances that are past due but notimpaired is as follows:
2011 2010(Rupees in ‘000)
Upto 1 month - -1 to 6 months 5,373 1,070More than 6 months 1,070 -
6,443 1,07013.2 Provision for impairment
Balance at the beginning of the year 4,453 18,971Provision made during the year - 4,453Amounts written off - (18,971)Balance at the end of the year 4,453 4,453
As at June 30, 2011, agents’ and owners’ balances of Rs 4.453 million (2010: Rs 4.453million) were impaired and provided for. These receivable balances are outstandingfor more than three years.
Note 2011 2010(Rupees in ‘000)
14. LOANS AND ADVANCES
Considered good
Loans:Due from employees 9 209 335
Advances to:- employees 25,638 17,108- contractors and suppliers 32,737 14,856- others 3,800 6,564
62,384 38,863
Annual Report 2011 113

15. DEPOSITS AND SHORT TERM PREPAYMENTSNote 2011 2010
(Rupees in ‘000)Deposits
Trade:- considered good 2,375 2,218- considered doubtful 184 184
2,559 2,402Less: Provision for impairment - trade 184 184
2,375 2,218Others:
- considered good 4,252 3,040- considered doubtful 185 185
4,437 3,225Less: Provision for impairment - others 185 185
4,252 3,040Prepayments
- Prepaid transaction cost 24.1 18,502 -- Other prepayments 2,421 1,827
20,923 1,82727,550 7,085
16. OTHER RECEIVABLES
Rent receivable:- considered good 16.1 6,184 4,161- considered doubtful 4,600 4,359
10,784 8,520Less: Provision for impairment of rent receivable 16.2 4,600 4,359
6,184 4,161
Derivative cross currency interest rate swap 16.3 87,960 -
Others:- considered good 16.4 234,220 18,154- considered doubtful 12,659 8,851
246,879 27,005Less: Provision for impairment of other receivables 16.5 12,659 8,851
234,220 18,154328,364 22,315
16.1 The ageing analysis of rent receivables that are past due but not impaired is as follows:
2011 2010(Rupees in ‘000)
Upto 1 month 3,407 1,0851 to 6 months 2,277 1,136More than 6 months 500 1,940
6,184 4,161
16.2 Provision for impairment of rent receivables
Balance at the beginning of the year 4,359 7,306Provision made during the year 241 33Amounts written off / adjusted - (2,980)Balance at the end of the year 4,600 4,359
Pakistan
Nat
iona
lShipp
ing
Cor
pora
tion
Annual Report 2011114

Pakistan
Nat
iona
lShipp
ing
Cor
pora
tion
As at June 30, 2011, rent receivables of Rs 4.600 million (2010: Rs 4.359 million) wereimpaired and provided for. These receivables are outstanding for more than threeyears.
16.3 The Corporation has entered into a cross currency interest rate swap of Rs 8,513.300million for its borrowing (note 24). Under the terms of the cross currency swaparrangement, the Corporation is required to pay LIBOR plus 3.75% to the arrangingbank on the borrowing denominated in USD (USD notional) for the purpose of crosscurrency swap, and receive KIBOR plus 2.20% from the arranging bank. Further, theCorporation shall pay / receive any exchange loss / gain on the USD notionaloutstanding at each quarter end. The net fair value of this cross currency interest rateswap as determined by the bank was Rs 6.130 million (favourable) to the Corporationas of the balance sheet date which has been increased by the net interest receivableand exchange loss amounting to Rs 81.830 million as at June 30, 2011.
16.4 This includes dividend receivable from subsidiaries, receivable from sundry debtors,General Sales Tax refund claims and insurance claims receivables amounting to Rs229.352 million (June 30, 2010: nil), Rs 4.455 million (2010: Rs 2.526 million), Rs 12.197million (2010: Rs 3.807 million) and Rs nil (2010: Rs 11.167) respectively.
Note 2011 2010(Rupees in ‘000)
16.5 Provision for impairment of other receivables
Balance at the beginning of the year 8,851 461Provision made during the year 3,808 8,390Balance at the end of the year 12,659 8,851
17. INCOMPLETE VOYAGES
Charter hire and related expenses 18,532 24,141Less: Net freight - 122
18,532 24,019
18. INSURANCE CLAIMS
- Considered good 30 572- Considered doubtful - -
30 572
Less: Provision for impairment of insurance claims 18.1 - -30 572
18.1 Provision for impairment of insurance claims
Balance at the beginning of the year - 2,492Amounts written off - (2,492)Balance at the end of the year - -
19. SHORT-TERM INVESTMENTS
Loans and receivables
Term deposits with banks having maturity ofthree months or less 471,900 1,207,224
19.1 The mark-up on term deposits ranges from 9% to 13.80% (2010: 11.65% to 12.25%) perannum.
Annual Report 2011 115
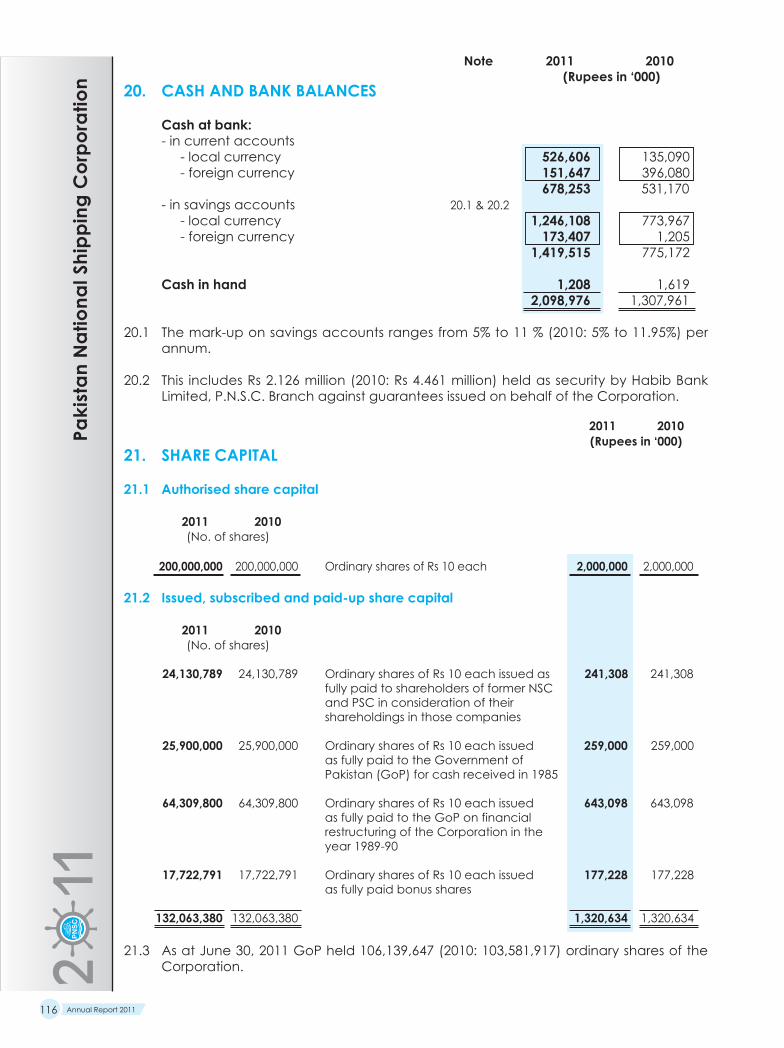
Note 2011 2010(Rupees in ‘000)
20. CASH AND BANK BALANCES
Cash at bank:- in current accounts
- local currency 526,606 135,090- foreign currency 151,647 396,080
678,253 531,170- in savings accounts 20.1 & 20.2
- local currency 1,246,108 773,967- foreign currency 173,407 1,205
1,419,515 775,172
Cash in hand 1,208 1,6192,098,976 1,307,961
20.1 The mark-up on savings accounts ranges from 5% to 11 % (2010: 5% to 11.95%) perannum.
20.2 This includes Rs 2.126 million (2010: Rs 4.461 million) held as security by Habib BankLimited, P.N.S.C. Branch against guarantees issued on behalf of the Corporation.
2011 2010(Rupees in ‘000)
21. SHARE CAPITAL
21.1 Authorised share capital
2011 2010(No. of shares)
200,000,000 200,000,000 Ordinary shares of Rs 10 each 2,000,000 2,000,000
21.2 Issued, subscribed and paid-up share capital
2011 2010(No. of shares)
24,130,789 24,130,789 Ordinary shares of Rs 10 each issued as 241,308 241,308fully paid to shareholders of former NSCand PSC in consideration of theirshareholdings in those companies
25,900,000 25,900,000 Ordinary shares of Rs 10 each issued 259,000 259,000as fully paid to the Government ofPakistan (GoP) for cash received in 1985
64,309,800 64,309,800 Ordinary shares of Rs 10 each issued 643,098 643,098as fully paid to the GoP on financialrestructuring of the Corporation in theyear 1989-90
17,722,791 17,722,791 Ordinary shares of Rs 10 each issued 177,228 177,228as fully paid bonus shares
132,063,380 132,063,380 1,320,634 1,320,634
21.3 As at June 30, 2011 GoP held 106,139,647 (2010: 103,581,917) ordinary shares of theCorporation.
Pakistan
Nat
iona
lShipp
ing
Cor
pora
tion
Annual Report 2011116

Pakistan
Nat
iona
lShipp
ing
Cor
pora
tion
22. RESERVESNote 2011 2010
(Rupees in ‘000)
Capital reserves 22.1 126,843 126,843Revenue reserves - Unappropriated profit 5,438,500 5,014,138
5,565,343 5,140,981
22.1 This includes amount transferred from shareholders’ equity at the time of merger offormer National Shipping Corporation (NSC) and Pakistan Shipping Corporation (PSC).
Note 2011 2010(Rupees in ‘000)
23. SURPLUS ON REVALUATION OFFIXED ASSETS - NET OF TAX
As at July 1 692,352 706,739
Less: Transferred to unappropriated profit:Surplus relating to incremental depreciation chargedduring the year on related assets - net of tax 10,056 11,048
Related deferred tax liability 3,058 3,33913,114 14,387
679,238 692,352Less: Related deferred tax liability on:- Revaluation as at July 1 20,424 25,712- Incremental depreciation charged during the
year on related assets transferred to profit and lossaccount (3,058) (3,339)
- Effect of allocation of revenue between FTR and NTR (945) (1,949)16,421 20,424
As at June 30 662,817 671,928
24. LONG-TERM FINANCING
Financing under syndicate termfinance agreement 24.1 7,009,040 -Less: Current portion 943,482 -
6,065,558 -
Term Finance Certificates 24.1 1,012,417 -Less: Current portion 136,281 -
876,136 -6,941,694 -
24.1 During the year, the Corporation has obtained financing facility of Rs 10,300 million(June 30, 2010: nil). The financing was obtained in the form of a syndicated termfinance loan of Rs 9,000 million and the remaining amount of Rs 1,300 million in the formof Term Finance Certificates (TFCs) with a face value of Rs 5,000 each by way of privateplacement.
The Corporation can draw down the amount till February 1, 2012. The financing carriesmark-up of KIBOR+2.20%. The loan along with the mark-up is repayable on quaterlybasis and the last repayment date is November 23, 2018. The facility is secured by a firstmortgage charge over certain vessels owned by its subsidiary companies, all presentand future receivables of the Corporation from three major customers and itsinvestment properties.
Annual Report 2011 117

As at June 30, 2011, the Corporation has drawn Rs 7,438.806 million (June 30, 2010: nil)and Rs 1,074.494 million (June 30, 2010: nil) from syndicated term finance and TFCs’respectively. The Corporation has also paid loan arrangement fee amounting to Rs106.662 million out of which Rs 88.160 million (June 30, 2010: nil) was included in theamortised cost of the long term financing whereas the unamortised portion amountingto Rs 18.502 million (June 30, 2010: nil) has been included in deposits and short-termprepayments (note 15).
Note 2011 2010(Rupees in ‘000)
25. DEFERRED LIABILITIES
Employees’ gratuity- funded 25.1.3 23,579 56,156- unfunded 25.1.3 26,507 15,328
50,086 71,484Post retirement medical benefits 25.1.3 111,009 93,937Employees’ compensated absences 25.2.3 159,300 125,867
320,395 291,288
25.1 Retirement benefit schemes
25.1.1As stated in notes 2.14.2 and 2.14.3 of these financial statements, the Corporationoperates a funded retirement gratuity scheme for permanent employees other thanthose who joined the Corporation after October 16, 1984, an unfunded retirementgratuity scheme for contractual employees and an unfunded post retirement medicalbenefit scheme for permanent employees. Liability is maintained against theseschemes based on the actuarial recommendations. Actuarial valuation of thesebenefits are carried out at least once in every two years and the latest valuations werecarried out as at June 30, 2011 using the Projected Unit Credit Method. The followingsignificant assumptions were used for the actuarial valuation of the defined benefitobligation schemes:
2011 2010Employees’ Post Employees’ Postgratuity retirement gratuity retirement
(funded and medical (funded and medicalunfunded) benefits unfunded) benefits
Discount rate 14.5% 14.5% 13% 13%Increase in salary 12.5% N/A 11% N/ARate of return on plan assets 14.5% N/A 13% N/AMedical escalation rate N/A 11.5% N/A 10%Death rates based on LIC (1975-79) Ultimate mortality tables.
Pakistan
Nat
iona
lShipp
ing
Cor
pora
tion
Annual Report 2011118

Pakistan
Nat
iona
lShipp
ing
Cor
pora
tion
25.1.2 The disclosures made in notes 25.1.3 to 25.1.12 are based on the informationincluded in the actuarial valuation report as of June 30, 2011.
2011 2010Employees’ gratuity Post Employees’ gratuity Post
retirement retirementfunded Unfunded medical Funded Unfunded medical
benefits benefits-------------------------- (Rupees in ‘000) ---------------------------
25.1.3 Balance sheet reconciliation
Present value of defined benefit obligation 312,663 28,300 143,944 261,670 21,845 103,452Fair value of plan assets (note 25.1.5) (210,767) - - (221,806) - -
101,896 28,300 143,944 39,864 21,845 103,452Unrecognised net actuarial (loss) / gain (78,317) (1,793) (16,238) 16,292 (6,517) (9,515)Unrecognised prior service cost - - (16,697) - - -Recognised liability 23,579 26,507 111,009 56,156 15,328 93,937
25.1.4 Movement in present value of defined benefit obligation
As at July 1 261,670 21,845 103,452 288,787 12,176 95,987Current service cost 9,750 4,428 2,597 8,936 2,750 2,403Interest cost 38,698 2,687 12,590 32,014 1,521 10,825Actuarial loss / (gain) 74,065 1,793 16,238 (16,279) 6,517 9,515Prior service cost - - 23,280 - - -Benefits paid (71,520) (2,453) (14,213) (51,788) (1,119) (15,278)As at June 30 312,663 28,300 143,944 261,670 21,845 103,452
25.1.5 Movement in fair value of plan assets
As at July 1 221,806 - - 219,846 - -Expected return on plan assets 24,733 - - 23,735 - -Contribution 40,000 - - 30,000 - -Actuarial (loss) / gain (4,252) - - 13 - -Benefits paid (71,520) - - (51,788) - -As at June 30 210,767 - - 221,806 - -
25.1.6 Expenses
Current service cost 9,750 4,428 2,597 8,936 2,750 2,403Interest cost 38,698 2,687 12,590 32,014 1,521 10,825Expected return on plan assets (24,733) - - (23,735) - -Prior service cost - vested - - 3,243 - - -Amortisation of unrecognised priorservice cost - non vested - - 3,340 - - -Recognition of actuarial (gain) / loss (16,292) 6,517 9,515 60,420 1,030 15,942
7,423 13,632 31,285 77,635 5,301 29,170Less: charged to subsidiaries 166 1,748 977 3,396 783 946Expenses 7,257 11,884 30,308 74,239 4,518 28,224
25.1.7 Actual return on plan assets
Expected return on plan assets 24,733 - - 23,735 - -Actuarial (loss) / gain on plan assets (4,252) - - 13 - -Actual return on plan assets 20,481 - - 23,748 - -
25.1.8 Plan assets comprise of investment and cash at bank aggregating to Rs 210.767million (2010: Rs 221.806 million).
25.1.9 The expenses in respect of employees’ compensated absences have beencharged on the basis of actuarial recommendations and are in accordance withthe Administrative and Financial Services Agreement with the subsidiary companies.
Annual Report 2011 119

25.1.10 The expected return on plan assets is based on the market expectations anddepends upon the asset portfolio of the company.
25.1.11 Principal actuarial assumptions used are disclosed in note 25.1.1 to these financialstatements.
25.1.12 Amounts for the current period and previous four annual periods of the present valueof defined benefit obligation and fair value of plan assets are as follows:
Employee gratuity 2011 2010 2009 2008 2007-------------------------- (Rupees in ‘000) ---------------------------
Present value of defined benefit obligation 340,963 283,515 300,963 242,517 246,776Fair value of plan assets (210,767) (221,806) (219,846) (235,159) -Deficit 130,196 61,709 81,117 7,358 246,776
Experience loss / (gain) ondefined benefit obligation 75,858 (9,762) 66,553 (11,067) 41,022Experience (loss) / gain on plan assets (4,252) 13 5,103 (2,352) -
Post retirement medical benefits
Present value of defined benefit obligation 143,944 103,452 95,987 87,407 84,594
Experience adjustment on defined benefitobligation (16,238) 9,515 15,942 654 1,981
25.1.13 Assumed medical cost escalation rate have a significant effect on the amountsrecognised in profit or loss. A one percentage point change in assumed medicalcost escalation rate would have the following effects:
One percentage One percentagepoint increase point decrease------------- (Rupees in ‘000) -------------
Effect on aggregate service cost and interest cost 441 (418)Effect on defined benefit obligation 4,027 (3,823)
25.2 Employees’ compensated absences
25.2.1 As stated in note 2.15, the Corporation operates an employees’ compensatedabsences scheme. Provision is maintained against this scheme based on theactuarial recommendations. Actuarial valuation is carried out at least once in everytwo years and the latest valuation was carried out as at June 30, 2011 using theProjected Unit Credit Method. The following significant assumptions were used forthe actuarial valuation of the scheme:
2011 2010
Discount rate 14.5% 13.0%Increase in salary 12.5% 11.0%
25.2.2 The disclosures made in notes 25.2.3 to 25.2.7 are based on the information includedin the actuarial valuation as of June 30, 2011.
2011 2010(Rupees in ‘000)
25.2.3 Balance sheet reconciliation
Present value of defined benefit obligation(recognised) 159,300 125,867
Pakistan
Nat
iona
lShipp
ing
Cor
pora
tion
Annual Report 2011120

Pakistan
Nat
iona
lShipp
ing
Cor
pora
tion
25.2.4 Movement in present value of defined benefit obligation2011 2010
(Rupees in ‘000)
As at July 1 125,867 120,182Current service cost 42,835 30,758Interest cost 21,306 14,838Actuarial loss / (gain) 25,730 (175)Benefits paid (56,438) (39,736)As at June 30 159,300 125,867
25.2.5 Expenses
Current service cost 42,835 30,758Interest cost 21,306 14,838Recognition of actuarial loss / (gain) 25,730 (175)
89,871 45,421Less: Charged to subsidiaries 2,074 1,445Expense 87,797 43,976
25.2.6 Amounts for the current period and previous four annual periods of the present valueof defined benefit obligation are as follows:
2011 2010 2009 2008 2007---------------- (Rupees in ‘000) ----------------
Present value of defined benefitobligation 159,300 125,867 120,182 105,957 108,710Experience loss / (gain) on definedbenefit obligation 25,730 (175) 16,107 (9,567) 12,650
25.2.7 The expenses in respect of employees’ compensated absences have beencharged on the basis of actuarial recommendations and are in accordance withthe Administrative and Financial Services Agreement with the subsidiary companies.
25.2.8 Principal actuarial assumptions used are disclosed in note 25.2.1 to these financialstatements.
25.3 Expected retirement benefits costs for the next year are as follows:
(Rupees in ‘000)
Gratuity 115,440Post retirement medical benefits 21,470Compensated absences 60,635
25.4 During the year the Corporation contributed Rs 10.684 million (2010: 9.334 million) tothe provident fund.
Annual Report 2011 121
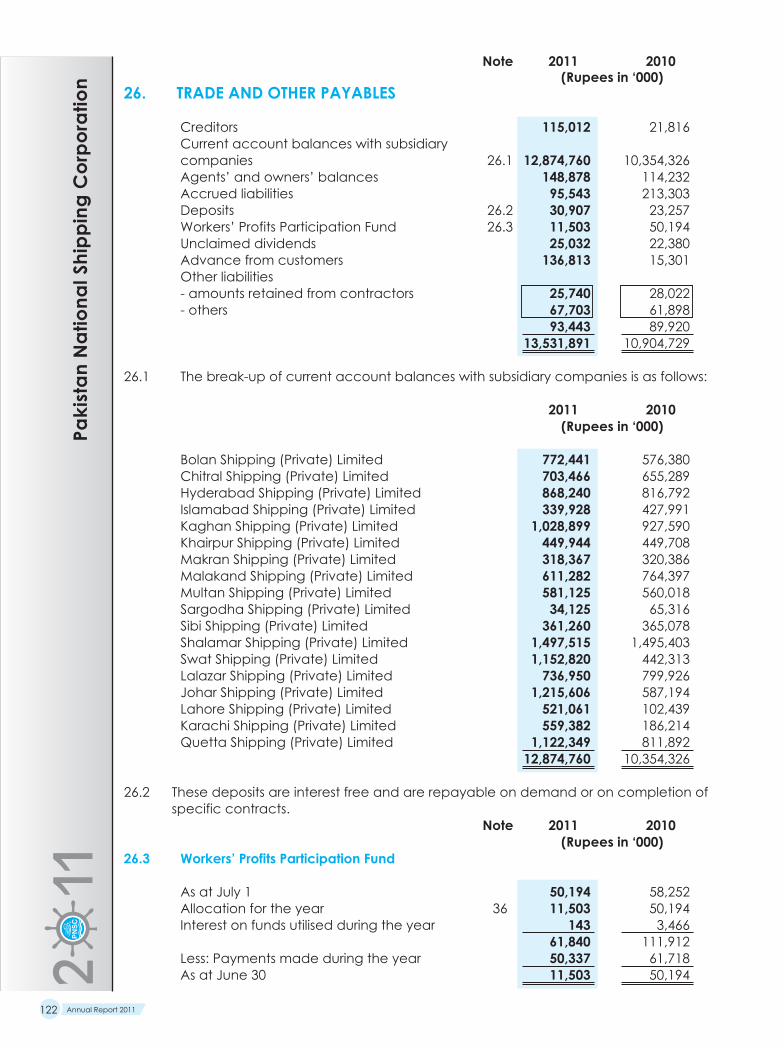
Note 2011 2010(Rupees in ‘000)
26. TRADE AND OTHER PAYABLES
Creditors 115,012 21,816Current account balances with subsidiarycompanies 26.1 12,874,760 10,354,326Agents’ and owners’ balances 148,878 114,232Accrued liabilities 95,543 213,303Deposits 26.2 30,907 23,257Workers’ Profits Participation Fund 26.3 11,503 50,194Unclaimed dividends 25,032 22,380Advance from customers 136,813 15,301Other liabilities- amounts retained from contractors 25,740 28,022- others 67,703 61,898
93,443 89,92013,531,891 10,904,729
26.1 The break-up of current account balances with subsidiary companies is as follows:
2011 2010(Rupees in ‘000)
Bolan Shipping (Private) Limited 772,441 576,380Chitral Shipping (Private) Limited 703,466 655,289Hyderabad Shipping (Private) Limited 868,240 816,792Islamabad Shipping (Private) Limited 339,928 427,991Kaghan Shipping (Private) Limited 1,028,899 927,590Khairpur Shipping (Private) Limited 449,944 449,708Makran Shipping (Private) Limited 318,367 320,386Malakand Shipping (Private) Limited 611,282 764,397Multan Shipping (Private) Limited 581,125 560,018Sargodha Shipping (Private) Limited 34,125 65,316Sibi Shipping (Private) Limited 361,260 365,078Shalamar Shipping (Private) Limited 1,497,515 1,495,403Swat Shipping (Private) Limited 1,152,820 442,313Lalazar Shipping (Private) Limited 736,950 799,926Johar Shipping (Private) Limited 1,215,606 587,194Lahore Shipping (Private) Limited 521,061 102,439Karachi Shipping (Private) Limited 559,382 186,214Quetta Shipping (Private) Limited 1,122,349 811,892
12,874,760 10,354,326
26.2 These deposits are interest free and are repayable on demand or on completion ofspecific contracts.
Note 2011 2010(Rupees in ‘000)
26.3 Workers’ Profits Participation Fund
As at July 1 50,194 58,252Allocation for the year 36 11,503 50,194Interest on funds utilised during the year 143 3,466
61,840 111,912Less: Payments made during the year 50,337 61,718As at June 30 11,503 50,194
Pakistan
Nat
iona
lShipp
ing
Cor
pora
tion
Annual Report 2011122

Pakistan
Nat
iona
lShipp
ing
Cor
pora
tion
Note 2011 2010(Rupees in ‘000)
27. PROVISION AGAINST DAMAGE CLAIMS
As at July 1 39,403 99,810Charge during the year 36 9,218 8,838Utilised during the year (743) -Reversed during the year (19,551) (69,245)As at June 30 28,327 39,403
28. CONTINGENCIES AND COMMITMENTS
Contingencies
28.1 Amount in respect of claims not admitted by the Corporation as at June 30, 2011aggregate to Rs 152.815 million (2010: Rs 196.921 million). These claims mainly relateto deficiencies in shipping documentation, delay in delivery of cargo and damagesto cargo. These include Rs 6.695 million (2010: Rs 13.685 million) approximately inrespect of insurance claims which, if accepted, will be borne by the Corporation asthe P&I Club, Oceanus Mutual Underwriting Association (Bermuda) Limited has goneinto liquidation. Out of the remaining claims, a sum of Rs 68.062 million (2010: Rs112.901 million) approximately would be recoverable from the P&I Club, SteamshipMutual Underwriting Association (Bermuda) Limited, in the event these claims areaccepted by the Corporation. As a matter of prudence, the management hasmade a total provision of Rs 28.327 million (2010: Rs 39.403 million) against theaforementioned claims in these financial statements.
28.2 The Corporation has not accepted liability in respect of customs duty approximatingRs 2.500 million (2010: Rs 2.500 million) relating to the sale of the vessel M.V. Bhamboreduring the year ended June 30, 1978. The duty was claimed from the Corporationand the matter has been taken up with the appropriate Government agencies.
28.3 The former owners of East & West Steamship Company, Chittagong SteamshipCorporation Limited and Trans Oceanic Steamship Company Limited had initiatedlitigation that involved the Government of Pakistan and the Corporation.
Following the Supreme Court’s adjudication of the East & West SteamshipCompany’s matter in favour of the former owners, the Government provisionallyassessed additional compensation due to the former owners at approximately Rs97.012 million (2010: Rs 97.012 million). Although a major portion of this amount hasbeen settled by the Government, the Government holds the Corporation liable forthis amount by virtue of the net assets of the East &West Steamship Company havingbecome vested in the Corporation.
In case of Chittagong Steamship Corporation Limited and Trans Oceanic SteamshipCompany Limited, the litigations relating to compensation to the former owners andthe legal suits are pending in the High Court of Sindh. The amounts claimed areapproximately Rs 1.300 million and Rs 66.800 million (2010: Rs 1.300 million and Rs66.800 million) respectively.
The Corporation disclaims any liability in respect of the above mentioned amountsand any accretions to it upto final determination and settlement of the matters.
28.4 Certain other claims have been filed against the Corporation in respect ofemployees’ matters for an aggregate amount of approximately Rs 102.987 million(2010: Rs 31.261 million). These cases are pending and themanagement is confidentthat the outcome of these cases will be in the Corporation’s favour and accordinglyno provision for above claims has been made in these financial statements.
Annual Report 2011 123

28.5 While framing the tax assessment for the income year ended June 30, 1990, theassessing officer had made an addition to income of Rs 3,974.455 million, being theremission of liabilities due to the Federal government under the scheme of financialrestructuring of the Coproration. The resultant tax liability including additional taxesfor late payment of tax amounted to Rs 1,293.694 million, part of which was paid bythe Corporation and the remaining amount of Rs 1,233.694 million was directlydischarged at source by the Federal Government. The assessing officer while framingthe order of income year ended June 30, 1996 has treated the aforementionedpayment of tax liability by the Government as the income of Corporation. The ITAThas given the decision in favour of the Corporation on the appeals filed against theabove orders. However, the department has filed an appeal with the honourableHigh Court against the aforementioned orders of ITAT. The Honourable High Courthas decided the appeal against the Corporation. The leave to appeal filed by theCorporation has been accepted by the Honourable Supreme Court and thedecision of the High Court has been suspended. Hearing of the appeal is pendingin the Honourable Supreme Court.
28.6 During the year, the Officer Inland Revenue (OIR) has issued assessment orders undersection 122 (5A) of the Income Tax Ordinance, 2001 in respect of tax years 2008,2009 and 2010. According to the orders, the OIR has made certain additions anddetermined additional tax demand of Rs 293.431 million. Such addition have beenmade mainly as the OIR has disallowed a portion of administrative expenses byattributing the same to the subsidiary companies and further disallowed a portion ofcontribution made to approved gratuity fund (only in respect of tax year 2008) onthe contention that the same is attributable to the subsidiary companies. TheCorporation has paid Rs 100 million under protest and has filed an appeal with theCommissioner of Income Tax (Appeals) and at present the matter is pending forhearing. The management of the Corporation is confident that the subject matterin respect of tax years 2008, 2009 and 2010 will eventually be decided in favour ofthe Corporation. However, as a matter of prudence, the management had madeaggregate provision of Rs 100.00 million against the aforementioned demands in thefinancial statements for the year ended June 30, 2011.
28.7 Commitments in respect of capital expenditure amount to Rs 165.029 million (2010:Rs 171.730 million).
28.8 Outstanding letters of guarantee amount to Rs 2.126 million (2010: Rs 4.461 million).
28.9 Commitments in respect of loan arrangement fee amount to Rs Nil (2010: Rs 115.362million).
Note 2011 2010(Rupees in ‘000)
29. CHARTERING REVENUES
Foreign flag vessels:Voyage charter revenue 964,593 533,530Slot charter revenue 1,308,690 1,222,470
2,273,283 1,756,00030. SERVICES FEE
Technical and commercial services fee 207,351 180,628Administrative and financial services fee 69,119 60,209
276,470 240,83731. FLEET EXPENSES - DIRECT
Charter hire and related expenses 31.1 1,317,694 937,105Claims 350 1,669Ocean loss 34,827 9,325Exchange loss 6,640 12,393
1,359,511 960,492
Pakistan
Nat
iona
lShipp
ing
Cor
pora
tion
Annual Report 2011124
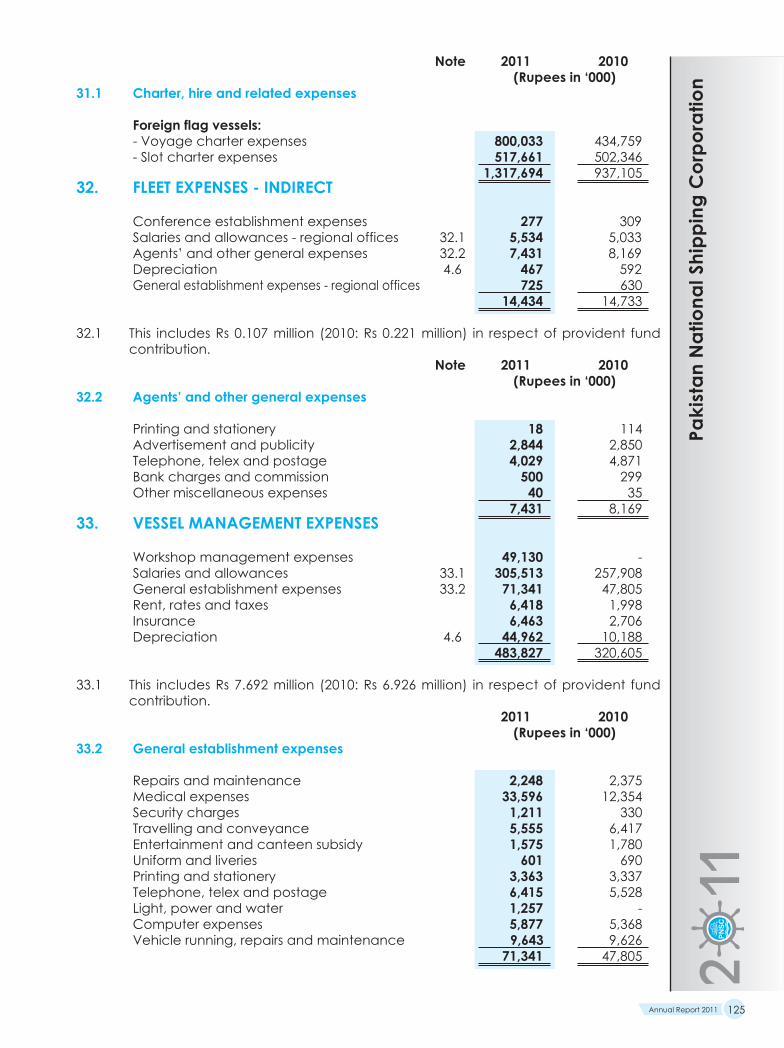
Pakistan
Nat
iona
lShipp
ing
Cor
pora
tion
Note 2011 2010(Rupees in ‘000)
31.1 Charter, hire and related expenses
Foreign flag vessels:- Voyage charter expenses 800,033 434,759- Slot charter expenses 517,661 502,346
1,317,694 937,10532. FLEET EXPENSES - INDIRECT
Conference establishment expenses 277 309Salaries and allowances - regional offices 32.1 5,534 5,033Agents’ and other general expenses 32.2 7,431 8,169Depreciation 4.6 467 592General establishment expenses - regional offices 725 630
14,434 14,733
32.1 This includes Rs 0.107 million (2010: Rs 0.221 million) in respect of provident fundcontribution.
Note 2011 2010(Rupees in ‘000)
32.2 Agents’ and other general expenses
Printing and stationery 18 114Advertisement and publicity 2,844 2,850Telephone, telex and postage 4,029 4,871Bank charges and commission 500 299Other miscellaneous expenses 40 35
7,431 8,16933. VESSEL MANAGEMENT EXPENSES
Workshop management expenses 49,130 -Salaries and allowances 33.1 305,513 257,908General establishment expenses 33.2 71,341 47,805Rent, rates and taxes 6,418 1,998Insurance 6,463 2,706Depreciation 4.6 44,962 10,188
483,827 320,605
33.1 This includes Rs 7.692 million (2010: Rs 6.926 million) in respect of provident fundcontribution.
2011 2010(Rupees in ‘000)
33.2 General establishment expenses
Repairs and maintenance 2,248 2,375Medical expenses 33,596 12,354Security charges 1,211 330Travelling and conveyance 5,555 6,417Entertainment and canteen subsidy 1,575 1,780Uniform and liveries 601 690Printing and stationery 3,363 3,337Telephone, telex and postage 6,415 5,528Light, power and water 1,257 -Computer expenses 5,877 5,368Vehicle running, repairs and maintenance 9,643 9,626
71,341 47,805
Annual Report 2011 125

Note 2011 2010(Rupees in ‘000)
34. REAL ESTATE EXPENSESSalaries and allowances 34.1 9,807 7,836General establishment expenses 34.2 25,528 24,003Rent, rates and taxes 9,180 7,368Insurance 345 1,143Depreciation 4.6 43,062 15,263Legal and professional charges 140 137
88,062 55,750
34.1 This includes Rs 0.321 million (2010: Rs 0.183 million) in respect of provident fundcontribution.
Note 2011 2010(Rupees in ‘000)
34.2 General establishment expenses
Repairs and maintenance 5,975 8,282Medical expenses 47 19Security charges 3,485 3,934Entertainment and canteen subsidy 26 150Books, periodicals and subscriptions 16 38Telephone, telex and postage 47 34Light, power and water 15,912 11,546Vehicle running, repairs and maintenance 20 -
25,528 24,00335. ADMINISTRATIVE AND GENERAL EXPENSES
Salaries and allowances 35.1 68,698 81,510General establishment expenses 35.2 35,879 54,395Rent, rates and taxes 458 4,751Scholarship and training expenses 1,238 514Insurance 461 1,297Depreciation 4.6 3,212 12,584Directors’ fee 390 690Legal and professional charges 11,480 17,721Provision for doubtful debts 4,302 12,876
126,118 186,338
35.1 This includes Rs 2.564 million (2010: Rs 2.004 million) in respect of provident fundcontribution.
2011 2010(Rupees in ‘000)
35.2 General establishment expenses
Repairs and maintenance 506 4,358Medical expenses 7,554 2,233Medical insurance - 19,371Contribution to employees welfare fund 8 9Contribution to group term insurance 1,805 1,723Hajj expenses 1,050 925Security charges 272 60Travelling and conveyance 1,249 1,160Entertainment and canteen subsidy 354 416Books, periodicals and subscription 4,379 3,446Uniform and liveries 43 41Printing and stationery 756 603Telephone, telex and postage 1,443 1,070Light, power and water 283 -Computer expenses 1,321 970Advertisement and publicity 3,984 4,510Vehicle running, repairs and maintenance 2,168 1,774Ship inspection expenses 4,410 6,094Sundries 4,294 5,632
35,879 54,395
Pakistan
Nat
iona
lShipp
ing
Cor
pora
tion
Annual Report 2011126

Pakistan
Nat
iona
lShipp
ing
Cor
pora
tion
Note 2011 2010(Rupees in ‘000)
36. OTHER OPERATING EXPENSES
Workers’ Profits Participation Fund 26.3 11,503 50,194Donations 36.1 2,000 3,000Auditors’ remuneration 36.2 4,446 3,294Employees’ gratuity- funded 25.1.6 7,257 74,239- unfunded 25.1.6 11,884 4,518
19,141 78,757Post retirement medical benefits 25.1.6 30,308 28,224Employees’ compensated absences 25.2.5 87,797 43,976Loss on fixed assets due to fire - net 36.3 2,554 -Provision in respect of damage claims 27 9,218 8,838
166,967 216,283
36.1 Donations were not made to any donee in which the Corporation or a director orhis spouse had any interest.
36.2 Auditors’ remuneration
2011 2010A. F. Ernst & Total A. F. Ernst & Total
Ferguson Young Ford Ferguson Young Ford& Co. Rhodes & Co. Rhodes
Sidat Hyder Sidat Hyder----------------------- (Rupees in ‘000) -----------------------
Audit fee 703 703 1,406 633 633 1,266Fee for review of half yearlyfinancial statements 295 295 590 265 265 530Fee for review of statement ofcompliance with best practices ofthe code of corporate governance 72 72 144 66 66 132Fee for audit of consolidatedfinancial statements 89 89 178 80 80 160Tax advisory services fee 1,003 - 1,003 810 - 810Fee for special review 650 - 650 - - -Out of pocket expenses 222 253 475 218 178 396
3,034 1,412 4,446 2,072 1,222 3,294
36.3 The amount represents amount of fixed assets destroyed due to fire net of insuranceclaim received for those items.
Note 2011 2010(Rupees in ‘000)
37. FINANCE COSTS
Interest on long-term financing 570,741 -Gain on cross currency interest rate swapderivative 37.1 (310,734) -Interest on Workers’ Profits Participation Fund 143 3,466Bank charges 1,844 2,877Loan arrangement fee - 12,818
261,994 19,161
Annual Report 2011 127

37.1 This relates to the amount received during the year on account of interimexchanges under the swap arrangement as explained in note 16.3 amounting to Rs310.734 million.
Note 2011 2010(Rupees in ‘000)
38. OTHER OPERATING INCOME
Income from financial assets / liabilities
Interest / mark-up on loans and advancesto employees 150 104Income from saving and term deposits 196,798 616,623Agency fee 6,155 -Gain on insurance claims - destroyed items - 21,054Dividend income 1,363 842Insurance claims 38.1 1,574 1,282Exchange gain 38.2 14,432 36,572Gain on revaluation of long-term investments 629 3,539Gain on revaluation of investment properties 6 25,712 -Gain on revaluation of swap derivative 6,130 -Liabilities no longer payable written back 46 59,175
Income from non-financial assets
Profit on disposal of fixed assets 2,484 1,860Provisions no longer required written back 19,551 71,052Sundries 42,086 22,274
317,110 834,377
38.1 This represents recoveries from hull, cargo and other claims according to theinsurance policies.
38.2 This represents exchange gain on foreign currency bank deposits maintained outsidePakistan.
2011 2010(Rupees in ‘000)
39. TAXATION
Tax charge for:- current year 169,921 422,073- prior years 100,103 18,723
270,024 440,796Deferred 18,129 (13,470)
288,153 427,326Taxes paid abroad relating to current year 4 103
288,157 427,429
Pakistan
Nat
iona
lShipp
ing
Cor
pora
tion
Annual Report 2011128
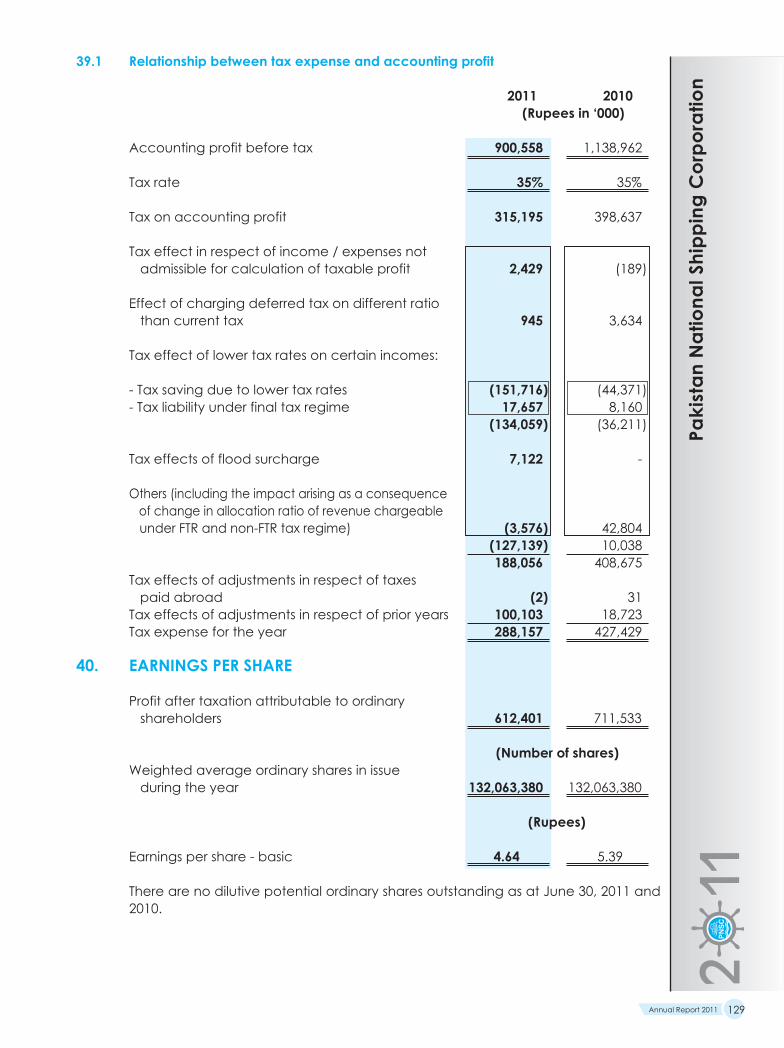
Pakistan
Nat
iona
lShipp
ing
Cor
pora
tion
39.1 Relationship between tax expense and accounting profit
2011 2010(Rupees in ‘000)
Accounting profit before tax 900,558 1,138,962
Tax rate 35% 35%
Tax on accounting profit 315,195 398,637
Tax effect in respect of income / expenses notadmissible for calculation of taxable profit 2,429 (189)
Effect of charging deferred tax on different ratiothan current tax 945 3,634
Tax effect of lower tax rates on certain incomes:
- Tax saving due to lower tax rates (151,716) (44,371)- Tax liability under final tax regime 17,657 8,160
(134,059) (36,211)
Tax effects of flood surcharge 7,122 -
Others (including the impact arising as a consequenceof change in allocation ratio of revenue chargeableunder FTR and non-FTR tax regime) (3,576) 42,804
(127,139) 10,038188,056 408,675
Tax effects of adjustments in respect of taxespaid abroad (2) 31
Tax effects of adjustments in respect of prior years 100,103 18,723Tax expense for the year 288,157 427,429
40. EARNINGS PER SHARE
Profit after taxation attributable to ordinaryshareholders 612,401 711,533
(Number of shares)Weighted average ordinary shares in issueduring the year 132,063,380 132,063,380
(Rupees)
Earnings per share - basic 4.64 5.39
There are no dilutive potential ordinary shares outstanding as at June 30, 2011 and2010.
Annual Report 2011 129

Note 2011 2010(Rupees in ‘000)
41. CASH GENERATED FROM OPERATIONS
Profit before taxation 900,558 1,138,962
Adjustments for non-cash charges and other items:Depreciation 4.6 91,703 38,627Profit on disposal of fixed assets (2,484) (1,860)Loss on fixed assets due to fire 2,554 -Provision in respect of damage claims 9,218 8,838Provision for employees’ gratuity 25.1.6 19,141 78,757Provision for post retirement medical benefits 25.1.6 30,308 28,224Provision for employees’ compensatedabsences 25.2.5 87,797 43,976
Dividend income (436,503) (842)Provision for impairment on doubtful receivables 4,302 12,876Provision reversed in respect of trade debts - (142)Provisions no longer required written back (19,551) (71,052)Liabilities no longer payable written back (46) (59,175)Interest / mark-up income (196,798) (616,727)Interest / mark-up expense 572,728 -Loan arrangement fee - 12,818Gain on revaluation of long-term investments (629) (3,539)Gain on cross currency interest rate swap derivative (316,864) -Gain on revaluation of investment properties (25,712) -Working capital changes 41.1 2,535,237 5,740,866
3,254,959 6,350,607
41.1 Working capital changes
(Increase) / decrease in current assetsStores and spares 2,289 (166)Trade debts (78,959) 176,223Agents’ and owners’ balances (5,373) 14,897Loans and advances (23,521) 37,989Deposits and short-term prepayments (1,963) 13,816Other receivables 7,214 42,550Incomplete voyages 5,487 (13,397)Insurance claims 542 2,287Short term investments - 3,900,000
(94,284) 4,174,199Increase in current liabilitiesTrade and other payables 2,629,521 1,566,667
2,535,237 5,740,866
42. CASH AND CASH EQUIVALENTS
Short-term investments 19 471,900 1,207,224Cash and bank balances 20 2,098,976 1,307,961
2,570,876 2,515,185
Pakistan
Nat
iona
lShipp
ing
Cor
pora
tion
Annual Report 2011130

Pakistan
Nat
iona
lShipp
ing
Cor
pora
tion
43. REMUNERATION OF CHAIRMAN, EXECUTIVE DIRECTORS / DIRECTORS AND OTHEREXECUTIVES
The aggregate amount of remuneration including all benefits payable to theChairman, Executive Directors and Executives of the Corporation were as follows:
Chairman & Chief Executive Other executivesExecutive Directors
2011 2010 2011 2010 2011 2010------------------------ (Rupees in ‘000) -----------------------
Managerial remuneration andallowances 1,885 2,220 13,168 9,765 165,973 129,838Retirement benefits - - 167 294 5,403 1,577House rent 333 472 1,953 1,414 53,317 30,990Conveyance - - - - 3,744 864Entertainment 142 10 216 233 1,237 149Medical 435 - 1,043 721 4,381 1,039Utilities 163 129 1,264 1,038 23,727 21,237Personal staff subsidy 7 - 9 18 172 132Club membership fee andexpenses 33 8 103 104 - -Bonus - 420 1,502 1,680 17,184 19,334Other allowances 285 - 898 1,179 68,577 89,900
3,283 3,259 20,323 16,446 343,715 295,060
Number of persons 2 2 5 5 185 117
43.1 Retirement benefits represent amount contributed towards various retirementbenefit plans. The executives of the Corporation are entitled to retirement benefitsas outlined in note 2.14 and 2.15 to these financial statements. The Chairman andChief Executive, Executive Directors and certain Executives are provided withCorporation owned and maintained cars.
43.2 The aggregate amount charged in the financial statements for fee to non-executivedirectors was Rs 0.390 million (2010: Rs 0.690 million).
43.3 During the year the former chairman left the Corporation on March 21, 2011 andthe incoming chairman joined office on March 21, 2011
Annual Report 2011 131

2011 2010(Rupees in ‘000)
44. FINANCIAL INSTRUMENTS BY CATEGORY
FINANCIAL ASSETS
Financial assets at fair value through profit or lossLong term investments - listed companies 26,783 26,154Derivative cross currency interest rate swap 87,960 -
Loans and receivables
Loans - employees 423 1,003Trade debts 272,125 193,195Agents’ and owners’ balances 6,443 1,070Deposits 6,627 5,258Interest / mark-up accrued 2,505 1,780Other receivables 240,404 18,508Insurance claims 18 572Short-term investments 471,900 1,207,224Cash and bank balances 2,098,976 1,307,961
3,099,421 2,736,571
Available-for-sale financial assetsLong-term investments - other entity 100 100
3,214,264 2,762,825FINANCIAL LIABILITIES
Financial liabilities at amortised costTrade and other payables 13,383,575 10,839,234Long-term financing 8,021,457 -Accrued markup on long-term financing 134,898 -
21,539,930 10,839,234
45. FINANCIAL RISK MANAGEMENT
45.1 Financial risk factors
The Corporation’s activities are exposed to a variety of financial risks namely creditrisk, market risk (including currency risk, cash flow and fair value interest rate risk andprice risk) and liquidity risk. The Corporation is not exposed to any significant price riskas it does not hold any major investments exposed to price risk. The Corporation hasestablished adequate procedures to manage each of these risks as explainedbelow.
45.1.1 Concentration of credit risk
Credit risk arises from cash and cash equivalents, derivative financial instrumentsand deposits with banks and financial institutions, as well as credit exposures tocustomers, including trade receivables and committed transactions. Credit riskrepresents the accounting loss that would be recognised at the reporting date ifcounter parties fail completely to perform as contracted.
As at June 30, 2011, out of the total financial assets of Rs 3,214.264 million (2010: Rs2,762.825 million) the financial assets which are subject to credit risk amounted to Rs3,213.056 million (2010: Rs 2,761.206 million). The management of the Corporationbelieves that it is not exposed to major concentration of credit risk.
Pakistan
Nat
iona
lShipp
ing
Cor
pora
tion
Annual Report 2011132

Pakistan
Nat
iona
lShipp
ing
Cor
pora
tion
For banks and financial institutions, only independently rated parties with a minimumcredit rating of A are accepted.
A significant component of the receivable balances of the Corporation relates toamounts due from the Public Sector organisations. Due to the Corporation’s longstanding business relationships with these counterparties and after giving dueconsideration to their strong financial standing, management does not expect non–performance by those counter parties on their obligations to the Corporation. Themanagement continuously monitors the credit exposure towards the customers andmakes provision against those balances considered doubtful of recovery.
The sector wise analysis of receivables, comprising trade debts, agents’ and owners’balances, deposits and other receivables is given below:
2011 2010(Rupees in ‘000)
Public Sector 286,034 112,148Private Sector 37,709 145,318
323,743 257,466
Out of Rs 323.743 million (2010: 257.466 million), the Corporation has providedRs 22.447 million (2010: 22.418 million) as the amounts being doubtful to be recoveredfrom them.
45.1.2 Market risk
Foreign exchange risk
Foreign exchange risk is the risk that the fair value or future cash flows of a financialinstrument will fluctuate because of changes in foreign exchange rates. Thecorporation faces foreign currency risk on receivable, payable transactions atforeign ports and the derivative cross currency interest rate swap. Foreign currencyrisk is covered as a considered management decision, since the income from thederivative cross currency interest rate swap fluctuates widely due to change inexchange rate.
As at June 30, 2011, if the currency had weakened by 5% against the US dollar withall other variables held constant, pre-tax profit for the year would have been Rs362.242 million (2010: Rs 11.507 million) lower, mainly as a result of foreign exchangegains / losses on translation of US dollar denominated assets and liabilities.
If at the same date the currency had strengthened by 5% against US dollar with allother variables held constant, pre-tax profit for the year would have been Rs 454.341million (2010: Rs 11.507 million) higher, mainly as a result of foreign exchange gains /losses on translation of US dollar denominated assets and liabilities.
As at June 30, 2011, the affect of fluctuations in other foreign currency denominatedassets or liabilities balances would not be material, therefore, not disclosed.
Cash flow and fair value interest rate risk
Interest rate risk is the risk that the value of a financial instrument will fluctuate dueto changes in the market interest rates. The Corporation has a high exposure tointerest rate risk due to the financing obtained during the year (note 24). In order tomanage its exposure to such risks the management of the Corporation has enteredinto a derivative cross currency interest rate swap (note 16) under which theCorporation receives KIBOR on the PKR notional in exchange for payment of LIBORon the USD notional.
Annual Report 2011 133

The Corporation has interest bearing liabilities and have floating interest rates. AtJune 30, 2011, if interest rates on borrowings had been 250 basis points higher / lowerwith all other variables held constant, profit after taxation for the year would havebeen lower / higher by Rs 21.981 million (2010: Rs Nil).
Price risk
Price risk represents the risk that the fair value or future cash flows of a financialinstrument will fluctuate because of changes in market prices (other than thosearising from interest rate risk or foreign exchange risk), whether those changes arecaused by factors specific to the individual financial instrument or its issuer, or factorsaffecting all similar financial instruments traded in the market.
The Corporation believes it is not exposed to any significant price risk.
45.1.3 Liquidity risk
Liquidity risk is the risk that the Corporation will encounter difficulties in raising fundsto meet commitments associated with financial instruments. The Corporationbelieves that it is not exposed to any significant level of liquidity risk.
The management forecasts the liquidity of the Corporation on basis of expectedcashflow considering the level of liquid assets necessary to meet such risk. Thisinvolves monitoring balance sheet liquidity ratios and maintaining debt financingplans.
Financial liabilities in accordance with their contractual maturities are presentedbelow:
Contractual Less than Between Between More thancash flows 1 year 1 to 2 years 2 to 5 years 5 years----------------------- (Rupees in thousand) -----------------------
Long term financing 12,997,943 2,283,141 2,109,521 5,326,428 3,278,853Trade and other payables 13,383,575 13,383,575 - - -Accrued mark-up onlong-term financing 134,898 134,898 - - -
26,516,416 15,801,614 2,109,521 5,326,428 3,278,853
45.1.4 Fair value of financial instruments
Fair value is an amount for which an asset could be exchanged, or a liability settled,between knowledgeable willing parties in an arm’s length transaction.Consequently, differences may arise between the carrying value and the fair valueestimates.
The corporation classifies financial instruments measured in the balance sheet at fairvalue in accordance with the following fair value measurement:
Level 1: Quoted prices in active markets for identical assets or liabilities;
Level 2: Those involving inputs other than quoted prices included in Level 1 that areobservable for the asset or liability, either directly (as prices) or indirectly (derivedfrom prices); and
Level 3: Those whose inputs for the asset or liability that are not based on observablemarket date (unobservable inputs).
Pakistan
Nat
iona
lShipp
ing
Cor
pora
tion
Annual Report 2011134
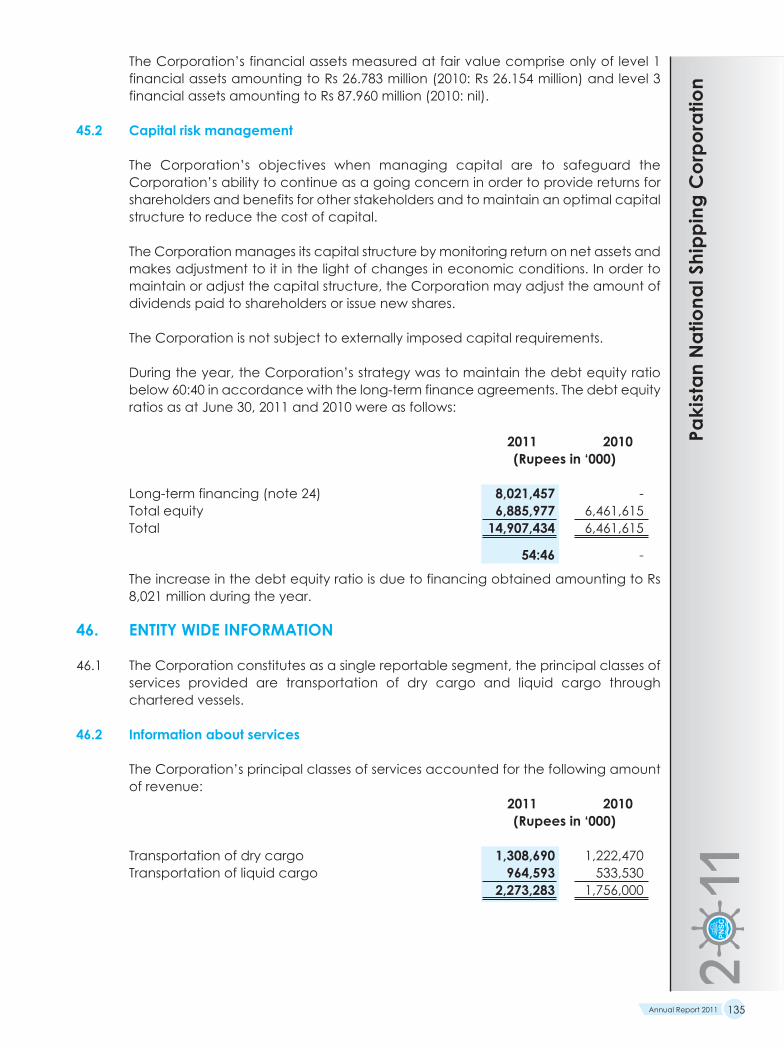
Pakistan
Nat
iona
lShipp
ing
Cor
pora
tion
The Corporation’s financial assets measured at fair value comprise only of level 1financial assets amounting to Rs 26.783 million (2010: Rs 26.154 million) and level 3financial assets amounting to Rs 87.960 million (2010: nil).
45.2 Capital risk management
The Corporation’s objectives when managing capital are to safeguard theCorporation’s ability to continue as a going concern in order to provide returns forshareholders and benefits for other stakeholders and to maintain an optimal capitalstructure to reduce the cost of capital.
The Corporation manages its capital structure by monitoring return on net assets andmakes adjustment to it in the light of changes in economic conditions. In order tomaintain or adjust the capital structure, the Corporation may adjust the amount ofdividends paid to shareholders or issue new shares.
The Corporation is not subject to externally imposed capital requirements.
During the year, the Corporation’s strategy was to maintain the debt equity ratiobelow 60:40 in accordance with the long-term finance agreements. The debt equityratios as at June 30, 2011 and 2010 were as follows:
2011 2010(Rupees in ‘000)
Long-term financing (note 24) 8,021,457 -Total equity 6,885,977 6,461,615Total 14,907,434 6,461,615
54:46 -
The increase in the debt equity ratio is due to financing obtained amounting to Rs8,021 million during the year.
46. ENTITY WIDE INFORMATION
46.1 The Corporation constitutes as a single reportable segment, the principal classes ofservices provided are transportation of dry cargo and liquid cargo throughchartered vessels.
46.2 Information about services
The Corporation’s principal classes of services accounted for the following amountof revenue:
2011 2010(Rupees in ‘000)
Transportation of dry cargo 1,308,690 1,222,470Transportation of liquid cargo 964,593 533,530
2,273,283 1,756,000
Annual Report 2011 135

46.3 Information about geographical areas
The Corporation does not hold non-current assets in any foreign country.
46.4 Information about major customers
The corporation has the following exposure to concentration of credit risk with clientsrepresenting greater than 10 % of the total revenue balances:
---------- 2011 ---------Revenue
Amount(Rupees % of Totalin ‘000)
Client 1 612,216 27%Client 2 415,481 19%Client 3 277,596 12%
1,305,293 58%
---------- 2010 ---------Revenue
Amount(Rupees % of Totalin ‘000)
Client 1 227,682 10%Client 2 38,356 2%Client 3 154,428 7%
420,466 19%
47. RELATED PARTY DISCLOSURES
The Corporation has related party relationships with its subsidiaries, associate,employee benefit plans and its directors and executive officers (including theirassociates). Transactions with related parties essentially entail investments made insubsidiary companies, dividend income received from related investee companies,freight income and chartering revenue recovered, services fee charged on accountof rendering of technical, commercial, administrative and financial services,expenses charged to subsidiary companies on actual cost basis etc. Service feecharges on account of rendering of technical, commercial, administrative andfinancial services is charged to subsidiary companies and related parties on the basisof mutually agreed terms. Balances with related parties have been disclosed in note26.1 to these financial statements. Particulars of remuneration to key managementpersonnel are disclosed in note 43 of these financial statements. Investments inrelated parties and long-term loans and advances to related parties are disclosedin note 7 and 9 of these financial statements.
Pakistan
Nat
iona
lShipp
ing
Cor
pora
tion
Annual Report 2011136

Pakistan
Nat
iona
lShipp
ing
Cor
pora
tion
Related party Relationship 2011 2010with the (Rupees in ‘000)
Corporation
Service fee charged
Bolan Shipping (Private) Limited Subsidiary 7,406 19,885Chitral Shipping (Private) Limited Subsidiary 12,814 2,540Hyderabad Shipping (Private) Limited Subsidiary 3,451 -Islamabad Shipping (Private) Limited Subsidiary 20,053 15,265Johar Shipping (Private) Limited Subsidiary 9,085 31,865Kaghan Shipping (Private) Limited Subsidiary 16,335 19,762Karachi Shipping (Private) Limited Subsidiary 51,434 10,299Khairpur Shipping (Private) Limited Subsidiary - 11,192Lahore Shipping (Private) Limited Subsidiary 52,998 17,306Makran Shipping (Private) Limited Subsidiary - 6,410Malakand Shipping (Private) Limited Subsidiary 5,957 -Multan Shipping (Private) Limited Subsidiary 10,328 11,516Quetta Shipping (Private) Limited Subsidiary 48,111 46,338Sargodha Shipping (Private) Limited Subsidiary 20,910 6,633Sibi Shipping (Private) Limited Subsidiary 1,732 -Swat Shipping (Private) Limited Subsidiary 15,856 41,826
276,470 240,837Rental expense
Pakistan Co-operative Ship Stores(Private) Limited Subsidiary 488 547
Transfer of stores and spares
Bolan Shipping (Private) Limited Subsidiary 1,313 1,124Chitral Shipping (Private) Limited Subsidiary 220 41Hyderabad Shipping (Private) Limited Subsidiary 93 -Islamabad Shipping (Private) Limited Subsidiary 2,381 1,991Johar Shipping (Private) Limited Subsidiary 516 2,803Kaghan Shipping (Private) Limited Subsidiary 124 66Karachi Shipping (Private) Limited Subsidiary 2,017 420Khairpur Shipping (Private) Limited Subsidiary 1,509 951Lahore Shipping (Private) Limited Subsidiary 2,378 1,671Makran Shipping (Private) Limited Subsidiary - 152Malakand Shipping (Private) Limited Subsidiary 119 -Multan Shipping (Private) Limited Subsidiary 1,494 2,127Quetta Shipping (Private) Limited Subsidiary 2,675 3,146Sargodha Shipping (Private) Limited Subsidiary 1,520 3,228Sibi Shipping (Private) Limited Subsidiary 108 -Swat Shipping (Private) Limited Subsidiary 677 2,366
17,144 20,086
Annual Report 2011 137

Related party Relationship Note 2011 2010with the (Rupees in ‘000)
Corporation
Retirement benefit costs charged
Bolan Shipping (Private) Limited Subsidiary 313 1,163Chitral Shipping (Private) Limited Subsidiary - 960Islamabad Shipping (Private) Limited Subsidiary 895 572Johar Shipping (Private) Limited Subsidiary 205 115Kaghan Shipping (Private) Limited Subsidiary 659 41Khairpur Shipping (Private) Limited Subsidiary - 1,061Karachi Shipping (Private) Limited Subsidiary 78 -Lahore Shipping (Private) Limited Subsidiary 66 -Makran Shipping (Private) Limited Subsidiary - 369Malakand Shipping (Private) Limited Subsidiary - -Multan Shipping (Private) Limited Subsidiary 873 1,312Quetta Shipping (Private) Limited Subsidiary 561 64Sargodha Shipping (Private) Limited Subsidiary 1,108 839Swat Shipping (Private) Limited Subsidiary 207 74
4,965 6,570
Dividend incomeSibi Shipping (Private) Limited Subsidiary 115,632 -Malakand Shipping (Private) Limited Subsidiary 101,992 -Hyderabad Shipping (Private) Limited Subsidiary 113,720 -Chitral Shipping (Private) Limited Subsidiary 103,796 -
435,140 -
Contribution to provident fund 10,684 9,334
Key management personnel compensation 23,606 19,705
Investment in subsidiary companies Subsidiary 11,665,738 -
Advance extended against purchaseof vessel to related parties Subsidiary 9.1 4,655,158 11,665,738
47.1 Outstanding balance due from / due to related parties have been disclosed in therespective notes to these financial statements.
47.2 In addition the Corporation is also engaged in making certain payments / collectionson behalf of the subsidiary companies in accordance with the ‘Technical andCommercial Services’ and ‘Administrative and Financial Services Agreement’ whichare settled through a current account with each of the subsidiary.
Pakistan
Nat
iona
lShipp
ing
Cor
pora
tion
Annual Report 2011138

Pakistan
Nat
iona
lShipp
ing
Cor
pora
tion
48. NON-ADJUSTING EVENTS AFTER THE BALANCE SHEET DATE
The Board of Directors at their meeting held on September 28, 2011 have proposedfor the year ended June 30, 2011 cash dividend of Re 1.00 per share (2010: Rs 1.5 pershare), amounting to Rs 132.063 million (2010: Rs 198.085 million) subject to theapproval of the members at the annual general meeting to be held on October 29,2011. The financial statements for the year ended June 30, 2011 do not include theeffect of this appropriation which will be accounted for subsequent to the year end.
49. CORRESPONDING FIGURES
Following corresponding figures have been reclassified for the purposes of betterpresentation and comparison.
Note From To Note (Rupees in ‘000)
26 Other liabilities - freight Advance from customers 26 15,301
29 Chartering revenue Fleet expenses - direct 31 9,325
The following administrative and general expenses have been reclassified for thepurpose of better presentation and comparison.
Description Transferred to Transferredvessel to real estate
management expensesexpenses
----------- (Rupees in ‘000) -----------
Salaries and allowances 257,908 7,836General establishment expenses:- Repairs and maintenance 2,375 8,282- Medical expenses 12,354 19- Security charges 330 3,934- Travelling and conveyance 6,417 -- Entertainment and canteen subsidy 1,780 150- Books, periodicals and subscriptions - 38- Uniform and liveries 690 -- Printing and stationery 3,337 -- Telephone, telex and postage 5,528 34- Light, power and water - 11,546- Computer expenses 5,368 -- Vehicle running, repairs and maintenance 9,626 -
Rent, rates and taxes 1,998 7,368Insurance 2,706 1,143Depreciation 10,188 15,263Legal and professional charges - 137
50. GENERAL
Figures have been rounded off to the nearest thousand of rupees unless otherwisestated.
51. DATE OF AUTHORISATION
These financial statements were authorised for issue on September 28, 2011 by theBoard of Directors of the Corporation.
Annual Report 2011 139
Vice Admiral (R) Saleem Ahmed Meenai Khowaja Obaid Imran IlyasChairman & Chief Executive Director

PATTERN OF SHAREHOLDING
No. of Total Shareholders ShareholdingsShares Held
11147 1 To 100 369,1333154 101 To 500 721,921851 501 To 1000 611,939676 1001 To 5000 1,414,85683 5001 To 10000 582,50019 10001 To 15000 229,14915 15001 To 20000 271,73010 20001 To 25000 228,7427 25001 To 30000 201,5413 30001 To 35000 101,9683 35001 To 40000 117,3277 40001 To 45000 296,2182 45001 To 50000 100,0002 50001 To 55000 106,6002 55001 To 60000 119,8651 65001 To 70000 69,3872 70001 To 75000 146,0713 75001 To 80000 234,5201 90001 To 95000 93,4152 95001 To 100000 200,0002 100001 To 105000 207,0951 105001 To 110000 105,4881 135001 To 140000 137,0262 150001 To 155000 305,3352 155001 To 160000 317,6421 185001 To 190000 185,1391 190001 To 195000 194,6231 235001 To 240000 235,9162 240001 To 245000 484,4931 295001 To 300000 298,8081 435001 To 440000 436,5641 605001 To 610000 608,7071 660001 To 665000 661,7751 745001 To 750000 746,6031 935001 To 940000 938,0001 1045001 To 1050000 1,046,3861 1230001 To 1235000 1,230,1731 11565001 To 11570000 11,567,0771 105135001 To 105140000 106,139,647
16,013 132,063,379
Pakistan
Nat
iona
lShipp
ing
Cor
pora
tion
Annual Report 2011140

Pakistan
Nat
iona
lShipp
ing
Cor
pora
tionCATEGORIES OF SHAREHOLDERS
as at June 30, 2011
CATEGORIES OF SHAREHOLDERS NO. SHARES HELD %
Associated Companies, Undertakings and Related Parties
M/s PNSC Employess Empowerment Trust 1 11,567,077 8.76
Mohammadi Engg. Works Ltd. 1 4,766 0.00
NIT & ICP 15 527,731 0.40
Directors, CEO, their spouses and minor children
Mr. Khowaja Obaid Imran Ilyas 1 2,299 0.00Mr. Anwar Shah 1 100 0.00Mr. Khowaja Obaid Imran Ilyas 1 115
Executives - - -
Banks, Development Finance Institutions,Non-Banking Finance Institutions 76 2,146,498 1.63
Insurance Companies 14 1,270,638 0.96
Modarabas and Mutual Funds 11 698,548 0.53
Shareholders holding 10% or more voting interest
Federal Government 1 106,139,647 80.37
Individual* 15,793 7,776,263 5.89
Foreign/Non-resident Investors 10 693,284 0.52
Others 88 1,236,413 0.94
16,013 132,063,379 100
*(including 3656 shareholders whose current domicile is not known)N.B. ;- The above two statements including 1566 shareholders holding11,463,305 shares through Central Depository Company of Pakistan Limited.
Annual Report 2011 141

NOTICE OF ANNUAL GENERAL MEETINGNotice is hereby given that the 33rd Annual General Meeting of the shareholders of PakistanNational Shipping Corporation will be held at the Navy Welfare Centre (Pakistan Navy FleetClub), near Lucky Star Hotel, Saddar, Karachi, on Saturday, the 29th October 2011 at 07:00p.m. to transact the following business:
ORDINARY BUSINESS
1. To confirm the Minutes of 32nd Annual General Meeting of the shareholders held on14th October 2010.
2. To consider and adopt the Audited Accounts of the Corporation and theConsolidated Accounts of the PNSCGroup together with the Reports of Auditors andDirectors for the year ended 30th June 2011.
3. To consider and approve Board's recommendation to pay 10% Cash Dividend (i.e.Re.1 per share of Re. 10 each ) to the shareholders.
4. To consider Board's recommendation to re-appoint the retiring auditors A.F. Ferguson& Co., Chartered Accountants, and Ernst & Young Ford Rhodes SidatHyder,Chartered Accountants, as joint auditors of the Corporation for the year 2011-2012and to fix their remuneration.
5. To transact any other business that may be placed before the meeting with thepermission of the chair.
By Order of the BoardZAINAB SULEMAN
COMPANY SECRETARYDated: October 7th, 2011
Note:
1. The Share Transfer Books of the Corporation will remain closed from 22nd October2011 to 29th October 2011 (both days inclusive).
2. A shareholder entitled to attend and vote at this meeting is also entitled to appointhis/her proxy to attend the meeting. Proxies must be received at the Head Office ofthe Corporation not less than 48 hours before the time of holding the meeting.
3. CDC Account Holders are advised to bring their original Identity Cards toauthenticate their Identity along with CDC account numbers at the meeting.However, if any proxies are granted by such shareholders, the same shall also haveto be accompanied with attested copies of the computerized National IdentityCards of the grantors, and the signature on the proxy form has to be the same asappearing on the National Identity Card.
4. The shareholders are requested to immediately notify change, if any, in their mailingaddresses.
5. The Shareholders who have not yet submitted photocopies of their validComputerized National Identity Cards (CNIC) to the Corporation are requested tosend the same at the earliest to the Corporation’s Share Registrar, Technology Trade(PVT.) LTD, Dagia House 241-C, Block-2, P.E.C.H.S Off: Shahrah-E-Quaideen, Karachi.
Pakistan
Nat
iona
lShipp
ing
Cor
pora
tion
Annual Report 2011142

Pakistan
Nat
iona
lShipp
ing
Cor
pora
tion
PAKISTAN NATIONAL SHIPPING CORPORATION
Proxy form
I/We __________________________________________________________________________________
of _____________________________________________________________________________________
being shareholder of Pakistan National Shipping Corporation holding ____________________
share (s) hereby appoint Mr./Miss/Mrs. __________________________________________________
S/o. D/o. W/o. _________________________________________________________________________
of _____________________________________________________________________________________
or failing him/her Mr./Miss./Mrs. _________________________________________________________
S/o. D/o. W/o. _________________________________________________________________________
of _____________________________________________________________________________________
as my/ our proxy to vote for me/ us and onmy/ our behalf at the meeting of the shareholdersof the Corporation to be held at Karachi on the 29th day of October 2011 at 07:00 p.m. andat any adjournment thereof.
Dated this ___________________________ day of ___________________________ 2011.
Signature of the Shareholder _________________________
Address ____________________________________________
____________________________________________________
Folio No./CDC Account No. _________________________
Transfer Receipt No. _________________________________
Annual Report 2011 143
Please quote your
Folio No./ CDC Account No.
Revenue Stamp
of
Rs 5

BLANK
Pakistan
Nat
iona
lShipp
ing
Cor
pora
tion
Annual Report 2011144

P.N.S.C Building Molvi Tamizuddin Khan Raod,P.O.Box No. 5350,Karachi-Pakistan.Phone : (92-21) 99203980-99 (20 Lines) Fax: (92-21) 99203974, 35636658Email: [email protected] URL: http://www.pnsc.com.pk