Annual report 2011 Elecster Oyj report 2011 Elecster Oyj Safe Milk for millions... by Elecster...
8
Annual report 2011 Elecster Oyj Safe Milk for millions... by Elecster technology
Transcript of Annual report 2011 Elecster Oyj report 2011 Elecster Oyj Safe Milk for millions... by Elecster...
A n n u a l r e p o r t 2 0 1 1
Elecster Oyj
Safe Milk for millions... by Elecster technology

Elecster Oyj 20112
M a n a g i n g D i r e c t o r ’s R e v i e w
During year 2011, the market position of Elecster Oyj was further strengthened. Our persistent and long term work to switch pasteurised milk for UHT milk in countries lacking suf-ficient cold chain has contributed in the progress. The aseptic pouch package we offer solves the problems regarding to shelf-life of milk in the distribution chain.
In our target countries, more and more people recognise the great benefits relating to the safety and economy entailed in Elecster system. Those dairies who introduce our system first in their countries play the key role; their message to their own colleagues is the most important marketing message. And this message has already been sent out in dozens of coun-tries.
The concept Elecster offers to its customer is a total solution including a safe and functional system for milk processing and distribution in an efficient and economical way.
In the aseptic pouch packaging sector, Elecster has already reached the position “number one in pouch” in the world. Now we aim to retain and even strengthen the reached posi-tion.
Based on customer feedback, reliability is one of the fun-damental reasons why customers opt for Elecster concept.
Our equipment work as promised, even after ceasing of the guarantee period, as we also provide after sales services, in cooperation with our local representatives. Further essential assessments received from our customers are: efficiency, easy operation and serviceability of the equipment. In addi-tion to these, also such features as durability and long useful life of our equipment are highly valued among our customers. We are able to promote our concept as one of the best overall economic solution for the customers.
A happy customer is the world’s best ‘salesman’. This is the cornerstone of the position we have reached. While aiming to conquer the world in our sector, we have to take good care of this fact also in future. This is not a sprint race, it is a marathon, and we are in the right route.
I wish to express my best thanks to the personnel of Elecster group for the good work done. I trust we all desire to make progress in the selected way. I also thank our customers, shareholders and other partners for the good cooperation in 2011.
In Akaa, on March 6th 2012 Jarmo Halonen
Elecster Oyj 20113
E L E C S T E R - G RO U P
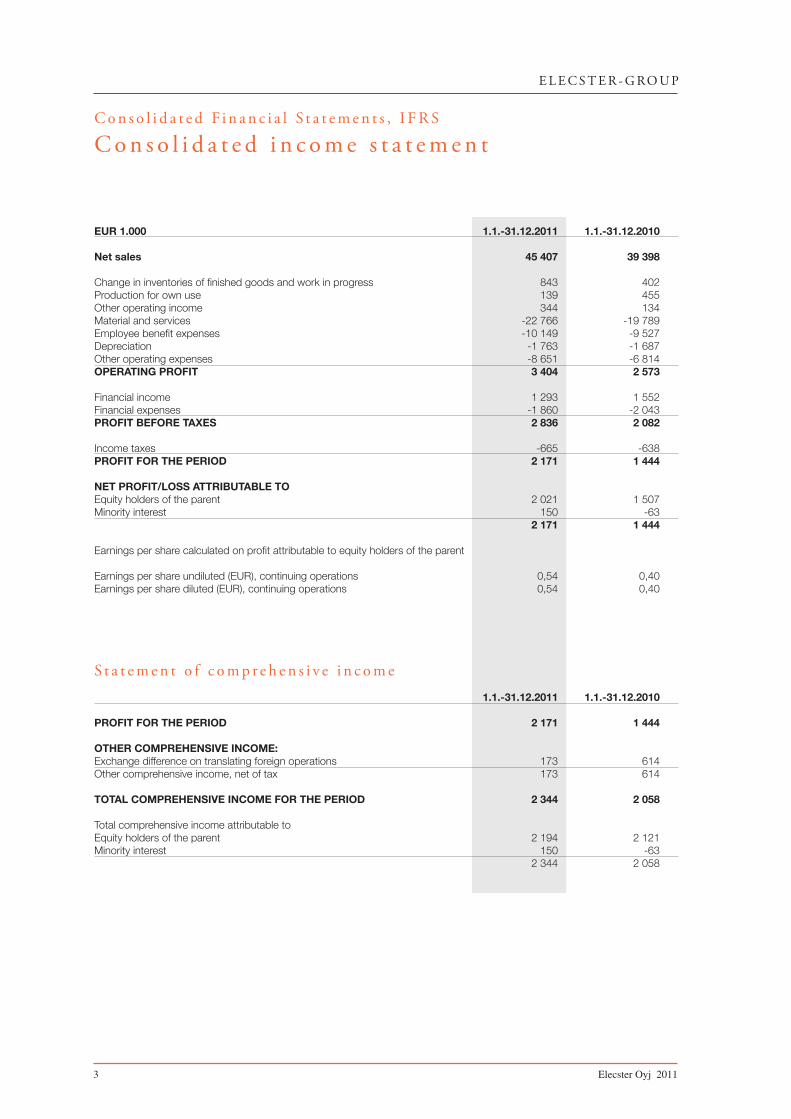
C o n s o l i d a t e d F i n a n c i a l S t a t e m e n t s , I F R S
C o n s o l i d a t e d i n c o m e s t a t e m e n t
EUR 1.000 1.1.-31.12.2011 1.1.-31.12.2010 Net sales 45 407 39 398 Change in inventories of finished goods and work in progress 843 402Production for own use 139 455Other operating income 344 134Material and services -22 766 -19 789Employee benefit expenses -10 149 -9 527Depreciation -1 763 -1 687Other operating expenses -8 651 -6 814OPERATING PROFIT 3 404 2 573 Financial income 1 293 1 552Financial expenses -1 860 -2 043PROFIT BEFORE TAXES 2 836 2 082 Income taxes -665 -638PROFIT FOR THE PERIOD 2 171 1 444 NET PROFIT/LOSS ATTRIBUTABLE TO Equity holders of the parent 2 021 1 507Minority interest 150 -63 2 171 1 444 Earnings per share calculated on profit attributable to equity holders of the parent Earnings per share undiluted (EUR), continuing operations 0,54 0,40Earnings per share diluted (EUR), continuing operations 0,54 0,40
S t a t e m e n t o f c o m p r e h e n s i v e i n c o m e
1.1.-31.12.2011 1.1.-31.12.2010 PROFIT FOR THE PERIOD 2 171 1 444 OTHER COMPREHENSIVE INCOME: Exchange difference on translating foreign operations 173 614Other comprehensive income, net of tax 173 614 TOTAL COMPREHENSIVE INCOME FOR THE PERIOD 2 344 2 058 Total comprehensive income attributable to Equity holders of the parent 2 194 2 121Minority interest 150 -63 2 344 2 058
Elecster Oyj 20114
E L E C S T E R - G RO U P
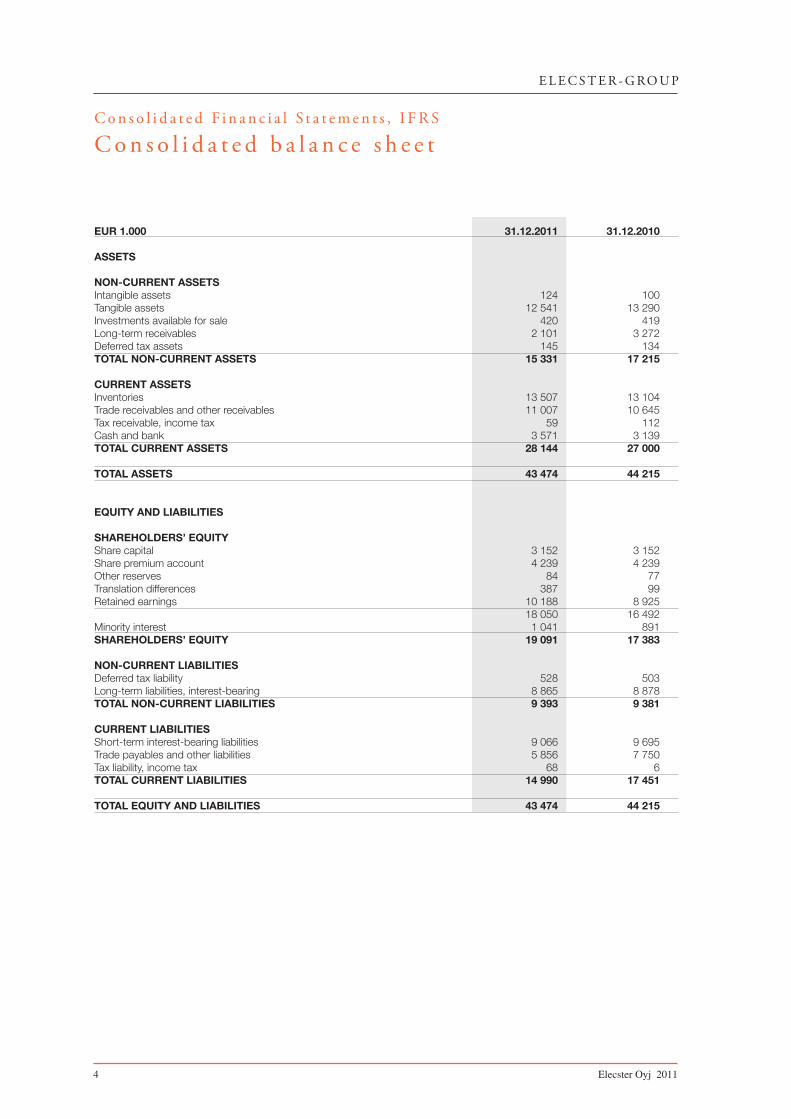
C o n s o l i d a t e d F i n a n c i a l S t a t e m e n t s , I F R S
C o n s o l i d a t e d b a l a n c e s h e e t
EUR 1.000 31.12.2011 31.12.2010 ASSETS NON-CURRENT ASSETS Intangible assets 124 100Tangible assets 12 541 13 290Investments available for sale 420 419Long-term receivables 2 101 3 272Deferred tax assets 145 134TOTAL NON-CURRENT ASSETS 15 331 17 215 CURRENT ASSETS Inventories 13 507 13 104Trade receivables and other receivables 11 007 10 645Tax receivable, income tax 59 112Cash and bank 3 571 3 139TOTAL CURRENT ASSETS 28 144 27 000 TOTAL ASSETS 43 474 44 215
EQUITY AND LIABILITIES SHAREHOLDERS’ EQUITY Share capital 3 152 3 152Share premium account 4 239 4 239Other reserves 84 77Translation differences 387 99Retained earnings 10 188 8 925 18 050 16 492Minority interest 1 041 891SHAREHOLDERS’ EQUITY 19 091 17 383 NON-CURRENT LIABILITIES Deferred tax liability 528 503Long-term liabilities, interest-bearing 8 865 8 878TOTAL NON-CURRENT LIABILITIES 9 393 9 381 CURRENT LIABILITIES Short-term interest-bearing liabilities 9 066 9 695Trade payables and other liabilities 5 856 7 750Tax liability, income tax 68 6TOTAL CURRENT LIABILITIES 14 990 17 451 TOTAL EQUITY AND LIABILITIES 43 474 44 215
Elecster Oyj 20115
E L E C S T E R - G RO U P
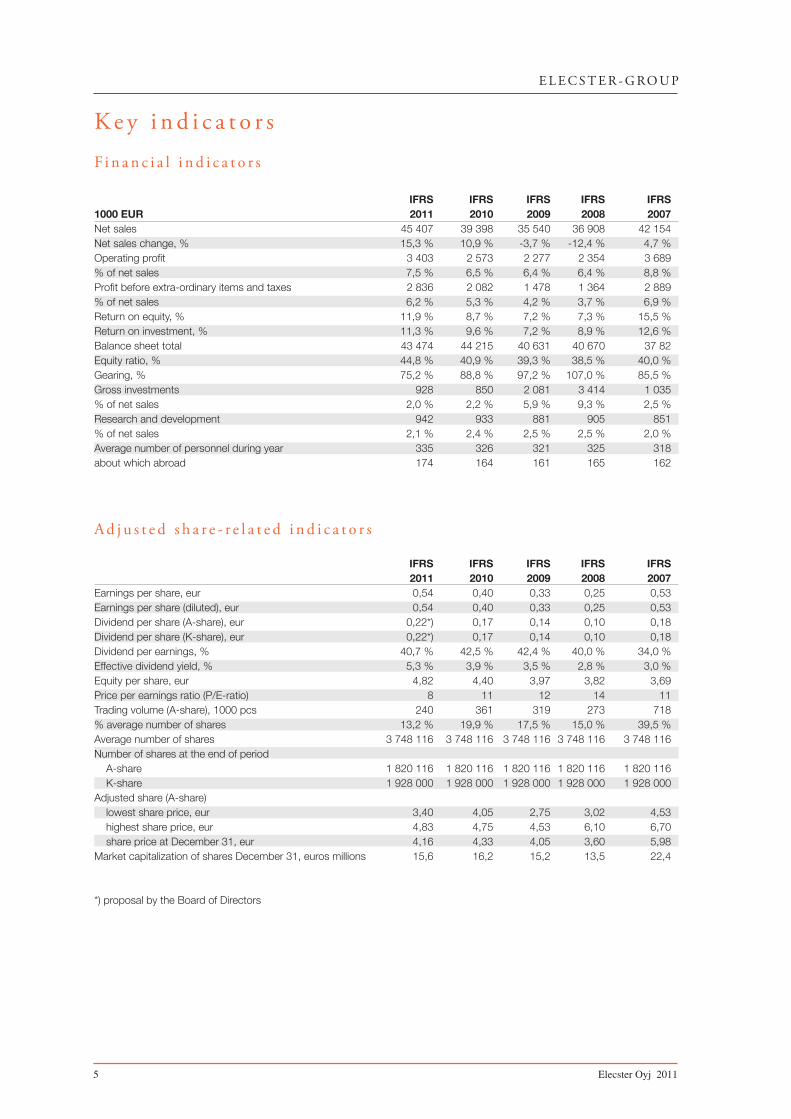
K e y i n d i c a t o r s
Fi n a n c i a l i n d i c a t o r s
IFRS IFRS IFRS IFRS IFRS1000 EUR 2011 2010 2009 2008 2007Net sales 45 407 39 398 35 540 36 908 42 154Net sales change, % 15,3 % 10,9 % -3,7 % -12,4 % 4,7 %Operating profit 3 403 2 573 2 277 2 354 3 689% of net sales 7,5 % 6,5 % 6,4 % 6,4 % 8,8 %Profit before extra-ordinary items and taxes 2 836 2 082 1 478 1 364 2 889% of net sales 6,2 % 5,3 % 4,2 % 3,7 % 6,9 %Return on equity, % 11,9 % 8,7 % 7,2 % 7,3 % 15,5 %Return on investment, % 11,3 % 9,6 % 7,2 % 8,9 % 12,6 %Balance sheet total 43 474 44 215 40 631 40 670 37 82Equity ratio, % 44,8 % 40,9 % 39,3 % 38,5 % 40,0 %Gearing, % 75,2 % 88,8 % 97,2 % 107,0 % 85,5 %Gross investments 928 850 2 081 3 414 1 035% of net sales 2,0 % 2,2 % 5,9 % 9,3 % 2,5 %Research and development 942 933 881 905 851% of net sales 2,1 % 2,4 % 2,5 % 2,5 % 2,0 %Average number of personnel during year 335 326 321 325 318about which abroad 174 164 161 165 162
A d j u s t e d s h a r e - r e l a t e d i n d i c a t o r s
IFRS IFRS IFRS IFRS IFRS 2011 2010 2009 2008 2007Earnings per share, eur 0,54 0,40 0,33 0,25 0,53Earnings per share (diluted), eur 0,54 0,40 0,33 0,25 0,53Dividend per share (A-share), eur 0,22*) 0,17 0,14 0,10 0,18Dividend per share (K-share), eur 0,22*) 0,17 0,14 0,10 0,18Dividend per earnings, % 40,7 % 42,5 % 42,4 % 40,0 % 34,0 %Effective dividend yield, % 5,3 % 3,9 % 3,5 % 2,8 % 3,0 %Equity per share, eur 4,82 4,40 3,97 3,82 3,69Price per earnings ratio (P/E-ratio) 8 11 12 14 11Trading volume (A-share), 1000 pcs 240 361 319 273 718% average number of shares 13,2 % 19,9 % 17,5 % 15,0 % 39,5 %Average number of shares 3 748 116 3 748 116 3 748 116 3 748 116 3 748 116Number of shares at the end of period A-share 1 820 116 1 820 116 1 820 116 1 820 116 1 820 116 K-share 1 928 000 1 928 000 1 928 000 1 928 000 1 928 000Adjusted share (A-share) lowest share price, eur 3,40 4,05 2,75 3,02 4,53 highest share price, eur 4,83 4,75 4,53 6,10 6,70 share price at December 31, eur 4,16 4,33 4,05 3,60 5,98Market capitalization of shares December 31, euros millions 15,6 16,2 15,2 13,5 22,4 *) proposal by the Board of Directors

Elecster Oyj 20116
E L E C S T E R - G RO U P
* 100
* 100
* 100
* 100
* 100
Exchange of shares and average rate 1/2007 - 12/2011
Mo
nthl
y ex
chan
ge,
Eur
Mo
nthl
y av
erag
e ra
te, E
ur
E x c h a n g e o f s h a r e s a n d t u r n o v e r
C a l c u l a t i o n o f k e y f i g u r e s
Return on equity, % Profit before extra-ordinary items and taxes - direct taxes Total equity (average) Return on investments, % Profit before extra-ordinary items and taxes + interest expances and other financial expenses Total assets - non-interest-bearing liabilities (average) Equity ratio, % Total equity Total assets - advance payments received Gearing, % Interest-bearing liabilities - cash and cash equivalents Total equity Earnings/share Profit before extra-ordinary items - taxes - +/- minority interest Adjusted number of shares (average) Shareholders’ equity/share Equity attributable to shareholders of parent company Adjusted numbers of shares at 31 December Price/earnings ratio (P/E) Adjusted share price at 31 December Earnings/share Effective dividend yield, % Dividend per share Adjusted share price at 31 December
Share Share price 31 Dec 2011 Lowest price Highest price Trading volume %-of A-share A-share 4,16 3,40 4,83 240.134 13,2
Elecster Oyj 20117
E L E C S T E R - G RO U P
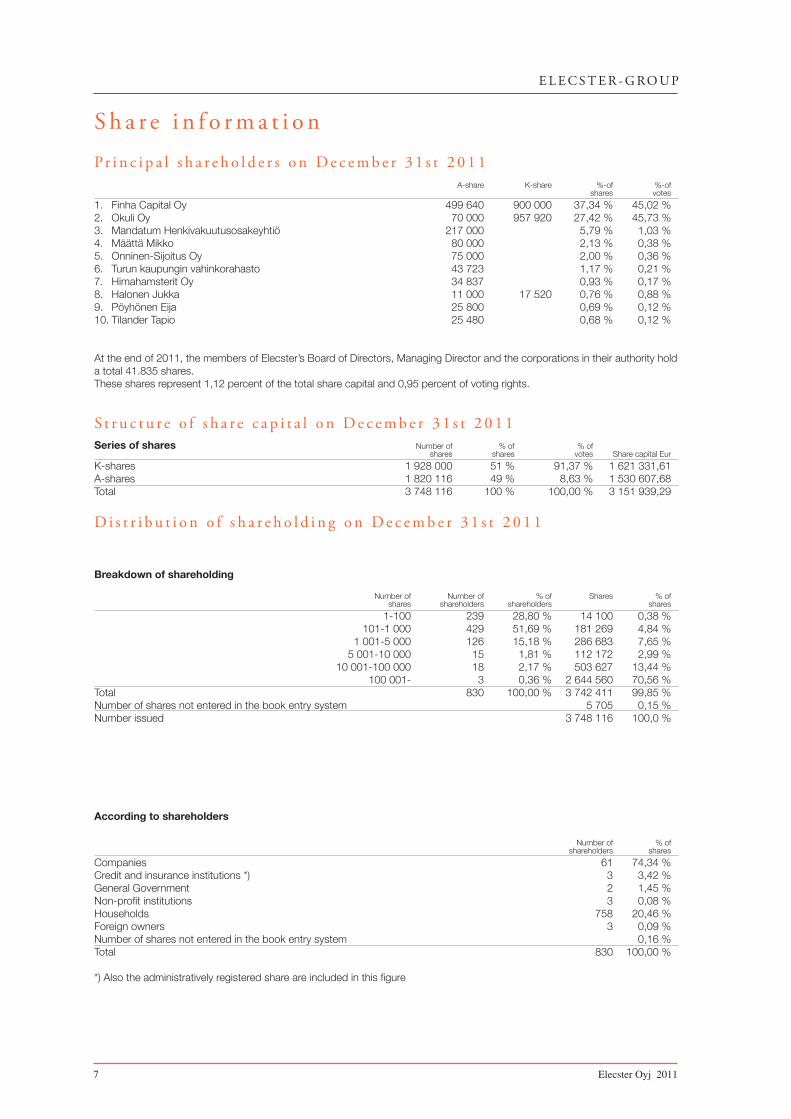
According to shareholders Number of % of shareholders shares
Companies 61 74,34 %Credit and insurance institutions *) 3 3,42 %General Government 2 1,45 %Non-profit institutions 3 0,08 %Households 758 20,46 %Foreign owners 3 0,09 %Number of shares not entered in the book entry system 0,16 %Total 830 100,00 % *) Also the administratively registered share are included in this figure
S t r u c t u r e o f s h a r e c a p i t a l o n D e c e m b e r 3 1 s t 2 0 1 1 Series of shares Number of % of % of shares shares votes Share capital Eur
K-shares 1 928 000 51 % 91,37 % 1 621 331,61A-shares 1 820 116 49 % 8,63 % 1 530 607,68Total 3 748 116 100 % 100,00 % 3 151 939,29
D i s t r i b u t i o n o f s h a r e h o l d i n g o n D e c e m b e r 3 1 s t 2 0 1 1
Breakdown of shareholding Number of Number of % of Shares % of shares shareholders shareholders shares
1-100 239 28,80 % 14 100 0,38 % 101-1 000 429 51,69 % 181 269 4,84 % 1 001-5 000 126 15,18 % 286 683 7,65 % 5 001-10 000 15 1,81 % 112 172 2,99 % 10 001-100 000 18 2,17 % 503 627 13,44 % 100 001- 3 0,36 % 2 644 560 70,56 %Total 830 100,00 % 3 742 411 99,85 %Number of shares not entered in the book entry system 5 705 0,15 %Number issued 3 748 116 100,0 %
S h a r e i n f o r m a t i o n P r i n c i p a l s h a r e h o l d e r s o n D e c e m b e r 3 1 s t 2 0 1 1 A-share K-share %-of %-of shares votes
1. Finha Capital Oy 499 640 900 000 37,34 % 45,02 %2. Okuli Oy 70 000 957 920 27,42 % 45,73 %3. Mandatum Henkivakuutusosakeyhtiö 217 000 5,79 % 1,03 %4. Määttä Mikko 80 000 2,13 % 0,38 %5. Onninen-Sijoitus Oy 75 000 2,00 % 0,36 %6. Turun kaupungin vahinkorahasto 43 723 1,17 % 0,21 %7. Himahamsterit Oy 34 837 0,93 % 0,17 %8. Halonen Jukka 11 000 17 520 0,76 % 0,88 %9. Pöyhönen Eija 25 800 0,69 % 0,12 %10. Tilander Tapio 25 480 0,68 % 0,12 %
At the end of 2011, the members of Elecster’s Board of Directors, Managing Director and the corporations in their authority hold a total 41.835 shares. These shares represent 1,12 percent of the total share capital and 0,95 percent of voting rights.
Elecster Oyj 20118
Elecster OyjSontulantie 382PL 3937801 ToijalaPuh. 020 154 1211Fax 020 154 1400E-mail: [email protected]
Elecster OyjHalosentie 185900 ReisjärviPuh. 020 154 1500Fax (08) 776 054
Sandudd OyKurvolantie 5 CPL 3037801 ToijalaPuh. 020 154 1444Fax (03) 542 4324www.sandudd.fi
A/S Eesti ElecsterLaki 16EE 10621 Tallinn, EstoniaPuh. +372 6 129 900Fax +372 6 129 999E-mail: [email protected]
Elecster Baltic OüLaki 16EE 10621 Tallinn, EstoniaPuh. +372 6 129 900Fax +372 6 129 999
Elecster (Tianjin) Dairy Machinery Ltd.No.7, Dongting Third StreetTEDA Tianjin 300457P.R. ChinaPuh. +86 22 2532 0566Fax +86 22 6629 7926E-mail: [email protected]
Elecster (Tianjin) Aseptic Packaging Co. Ltd.No.7, Dongting Third StreetTEDA Tianjin 300457P.R. ChinaPuh. +86 22 2529 3276Fax +86 22 2529 3277E-mail: [email protected]
OOO FinnpackRussia197198 Saint Petersburgul. Krasnogo Kursanta, d. 25 lit NPuh. +7 812 240 06 75Fax +7 812 240 06 71E-mail: [email protected]
OOO Finnpack SystemsRussia197198 Saint Petersburgul. Krasnogo Kursanta, d. 25 lit NPuh. +7 812 240 06 75Fax +7 812 240 06 71E-mail: [email protected]
OOO Finnpack UpakovkaRussia614031 PermDoukuchaeva 50 APuh./Fax +7 342 215 23 55Puh. +7 342 215 24 55E-mail: [email protected]
Elecster Oyj East and Central African regional OfficeP.O. Box 22624NairobiKenyaPuh. +254 20 272 6075Fax +254 20 272 6075Mobile: +254 722 741 153E-mail: [email protected]
www.elecster.fi